ReportNo. 16506-IN India 1997 EconomicUpdate: Sustaining RapidGrowth May 30, 1997 Country Operations, Industry & Finance Division Country Department II South Asia Region U Document Of the wormd Bank Public Disclosure Authorized Public Disclosure Authorized Public Disclosure Authorized Public Disclosure Authorized Public Disclosure Authorized Public Disclosure Authorized Public Disclosure Authorized Public Disclosure Authorized

Welcome message from author
This document is posted to help you gain knowledge. Please leave a comment to let me know what you think about it! Share it to your friends and learn new things together.
Transcript
Report No. 16506-IN
India1997 Economic Update:Sustaining Rapid GrowthMay 30, 1997
Country Operations, Industry & Finance DivisionCountry Department IISouth Asia Region
U
Document Of the wormd Bank
Pub
lic D
iscl
osur
e A
utho
rized
Pub
lic D
iscl
osur
e A
utho
rized
Pub
lic D
iscl
osur
e A
utho
rized
Pub
lic D
iscl
osur
e A
utho
rized
Pub
lic D
iscl
osur
e A
utho
rized
Pub
lic D
iscl
osur
e A
utho
rized
Pub
lic D
iscl
osur
e A
utho
rized
Pub
lic D
iscl
osur
e A
utho
rized
CURRENCY
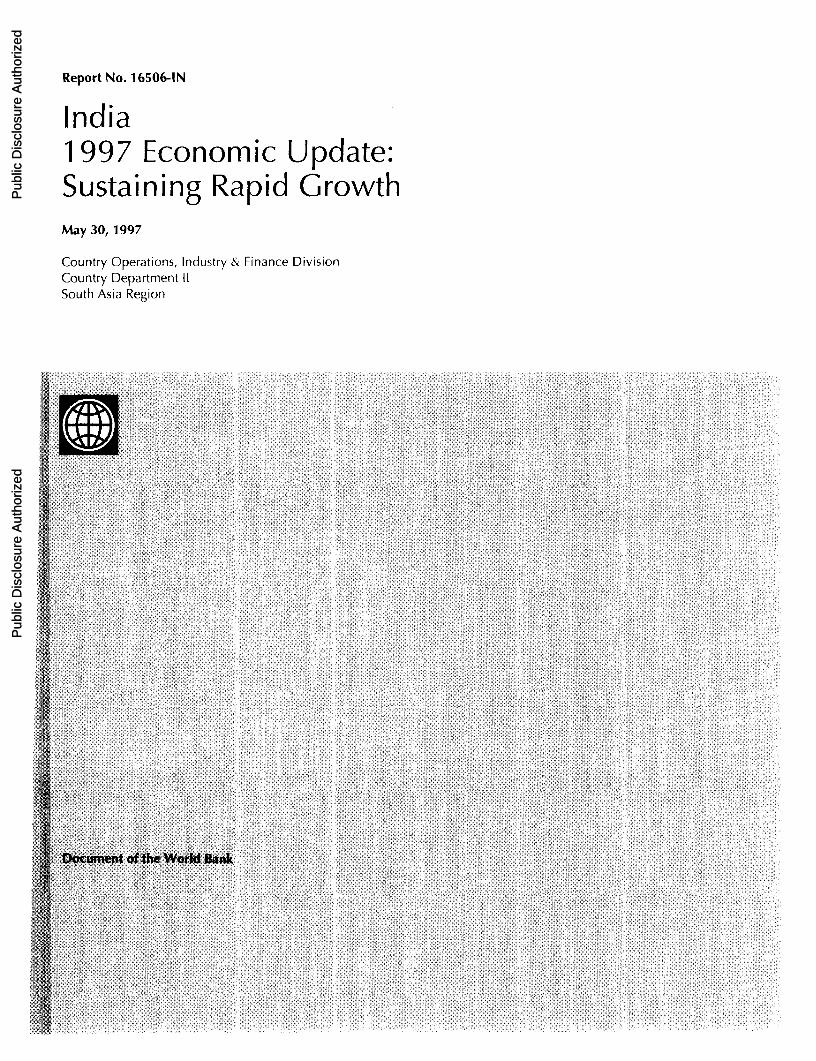
Rs/ US$Currency Official Unified Market a
Prior to June 1966 4.76June 6, 1966 to mid-December 1971 7.50Mid-December 1971 to end-June 1972 7.28
1971-72 7.441972-73 7.711973-74 7.791974-75 7.981975-76 8.651976-77 8.941977-78 8.561978-79 8.211979-80 8.081980-81 7.891981-82 8.931982-83 9.631983-84 10.311984-85 11.891985-86 12.241986-87 12.791987-88 12.971988-89 14.481989-90 16.661990-91 17.951991-92 24.521992-93 26.41 30.651993-94 31.361994-95 31.401995-96 33.461996-97 35.50
Note: The Indian fiscal year runs from April 1 through March 31.Source: IMF, International Finance Statistics (IFS), line "rf"; Reserve Bank of India.
A dual exchange rate system was created in March 1992, with a free market for about 60 percent of foreign exchangetransactions. The exchange rate was reunified at the beginning of March 1993 at the free market rate.
Vice President Mieko NishimizuDirectors Robert S. Drysdale, Edwin LimDivision Chief Luis E. DerbezStaff Member Zoubida Allaoua, Senior Economist
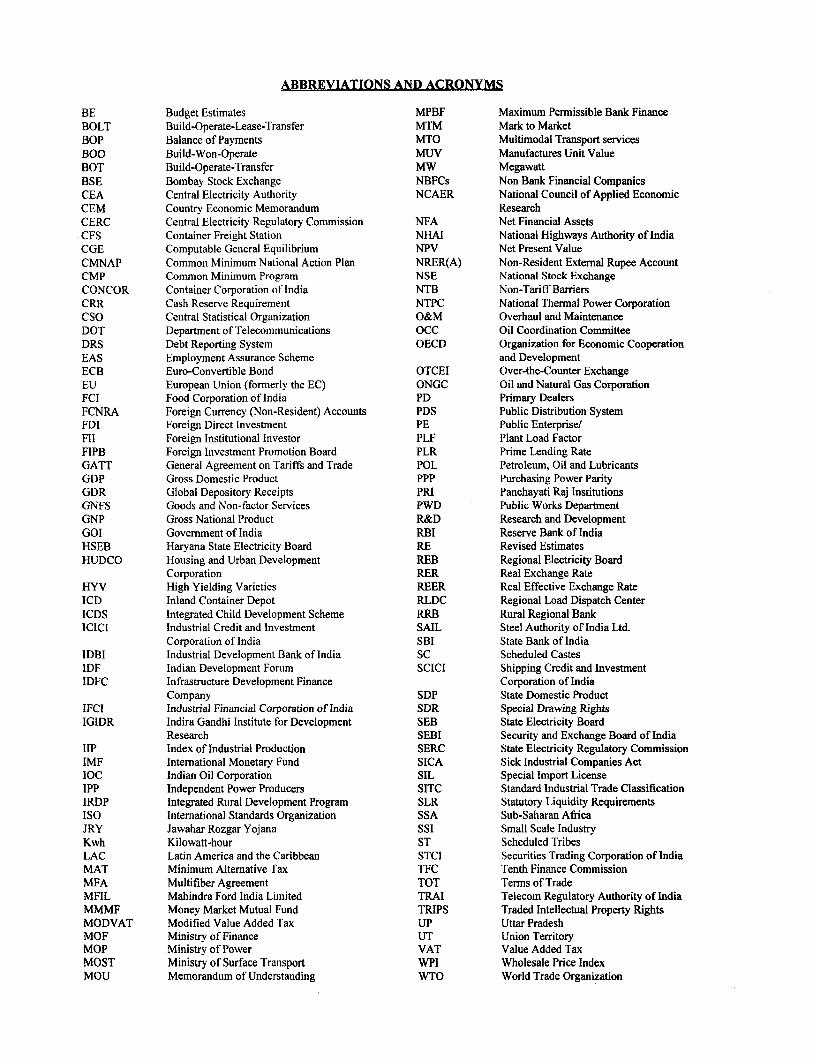
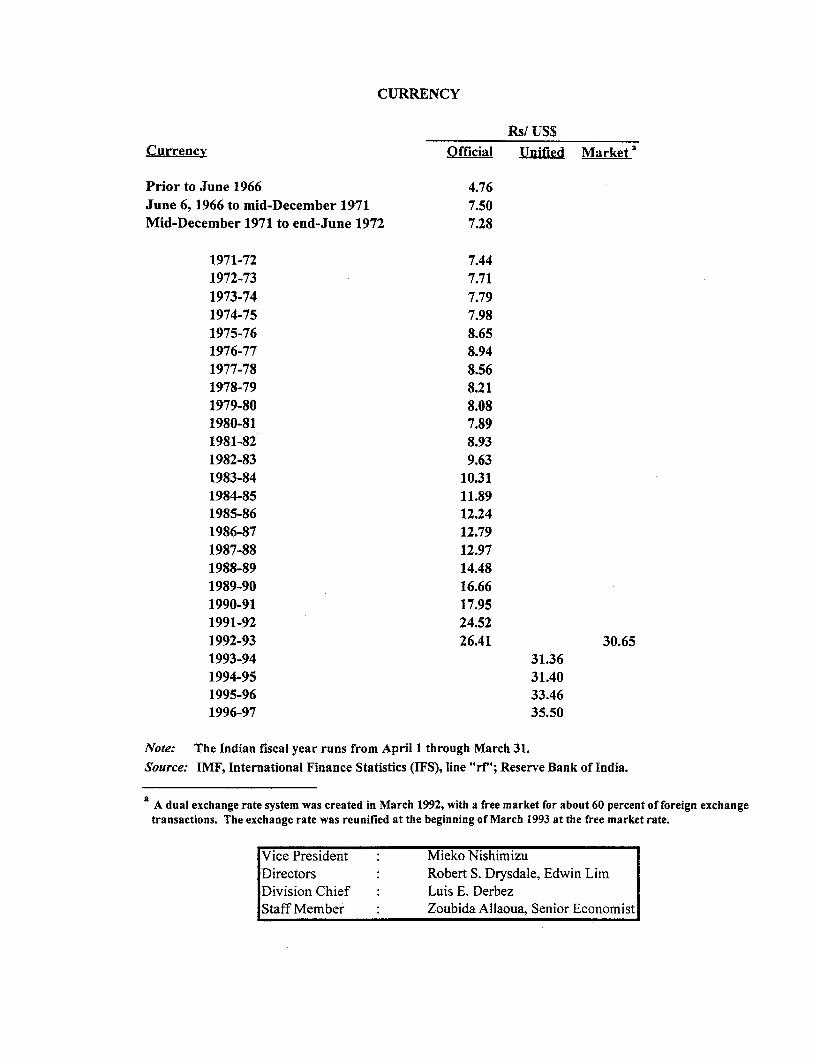
ABBREVIATIONS AND ACRONYMS
BE Budget Estimates MPBF Maximum Permissible Bank FinanceBOLT Build-Operate-Lease-Transfer MTM Mark to MarketBOP Balance of Payments MTO Multimodal Transport servicesBOO Build-Won-Operate MUV Manufactures Unit ValueBOT Build-Operate-Transfer MW MegawattBSE Bombay Stock Exchange NBFCs Non Bank Financial CompaniesCEA Central Electricity Authority NCAER National Council of Applied EconomicCEM Country Economic Memorandum ResearchCERC Central Electricity Regulatory Commission NFA Net Financial AssetsCFS Container Freight Station NHAI National Highways Authority of IndiaCGE Computable General Equilibrium NPV Net Present ValueCMNAP Common Minimum National Action Plan NRER(A) Non-Resident External Rupee AccountCMP Common Minimum Program NSE National Stock ExchangeCONCOR Container Corporation of India NTB Non-Tariff BarriersCRR Cash Reserve Requirement NTPC National Thermal Power CorporationCSO Central Statistical Organization O&M Overhaul and MaintenanceDOT Department of Telecommunications OCC Oil Coordination CommitteeDRS Debt Reporting System OECD Organization for Economic CooperationEAS Employment Assurance Scheme and DevelopmentECB Euro-Convertible Bond OTCEI Over-the-Counter ExchangeEU European Union (formerly the EC) ONGC Oil and Natural Gas CorporationFCI Food Corporation of India PD Primary DealersFCNRA Foreign Currency (Non-Resident) Accounts PDS Public Distribution SystemFDI Foreign Direct Investment PE Public Enterprise/Fll Foreign Institutional Investor PLF Plant Load FactorFIPB Foreign Investment Promotion Board PLR Prime Lending RateGATT General Agreement on Tariffs and Trade POL Petroleum, Oil and LubricantsGDP Gross Domestic Product PPP Purchasing Power ParityGDR Global Depository Receipts PRI Panchayati Raj InstitutionsGNFS Goods and Non-factor Services PWD Public Works DepartmentGNP Gross National Product R&D Research and DevelopmentGOI Government of India RBI Reserve Bank of IndiaHSEB Haryana State Electricity Board RE Revised EstimatesHUDCO Housing and Urban Development REB Regional Electricity Board
Corporation RER Real Exchange RateHYV High Yielding Varieties REER Real Effective Exchange RateICD Inland Container Depot RLDC Regional Load Dispatch CenterICDS Integrated Child Development Scheme RRB Rural Regional BankICICI Industrial Credit and Investment SAIL Steel Authority of India Ltd.
Corporation of India SBI State Bank of IndiaIDBI Industrial Development Bank of India SC Scheduled CastesIDF Indian Development Forum SCICI Shipping Credit and InvestmentIDFC Infrastructure Development Finance Corporation of India
Company SDP State Domestic ProductIFCl Industrial Financial Corporation of India SDR Special Drawing RightsIGIDR Indira Gandhi Institute for Development SEB State Electricity Board
Research SEBI Security and Exchange Board of IndialIP Index of Industrial Production SERC State Electricity Regulatory CommissionIMF International Monetary Fund SICA Sick Industrial Companies ActIOC Indian Oil Corporation SIL Special Import LicenseIPP Independent Power Producers SITC Standard Industrial Trade ClassificationIRDP Integrated Rural Development Program SLR Statutory Liquidity RequirementsISO International Standards Organization SSA Sub-Saharan AfricaJRY Jawahar Rozgar Yojana SSI Small Scale IndustryKwh Kilowatt-hour ST Scheduled TribesLAC Latin America and the Caribbean STCI Securities Trading Corporation of IndiaMAT Minimum Alternative Tax TFC Tenth Finance CommissionMFA Multifiber Agreement TOT Terms of TradeMFIL Mahindra Ford India Limited TRAI Telecom Regulatory Authority of IndiaMMMF Money Market Mutual Fund TRIPS Traded Intellectual Property RightsMODVAT Modified Value Added Tax UP Uttar PradeshMOF Ministry of Finance UT Union TerritoryMOP Ministry of Power VAT Value Added TaxMOST Ministry of Surface Transport WPI Wholesale Price IndexMOU Memorandum of Understanding WTO World Trade Organization

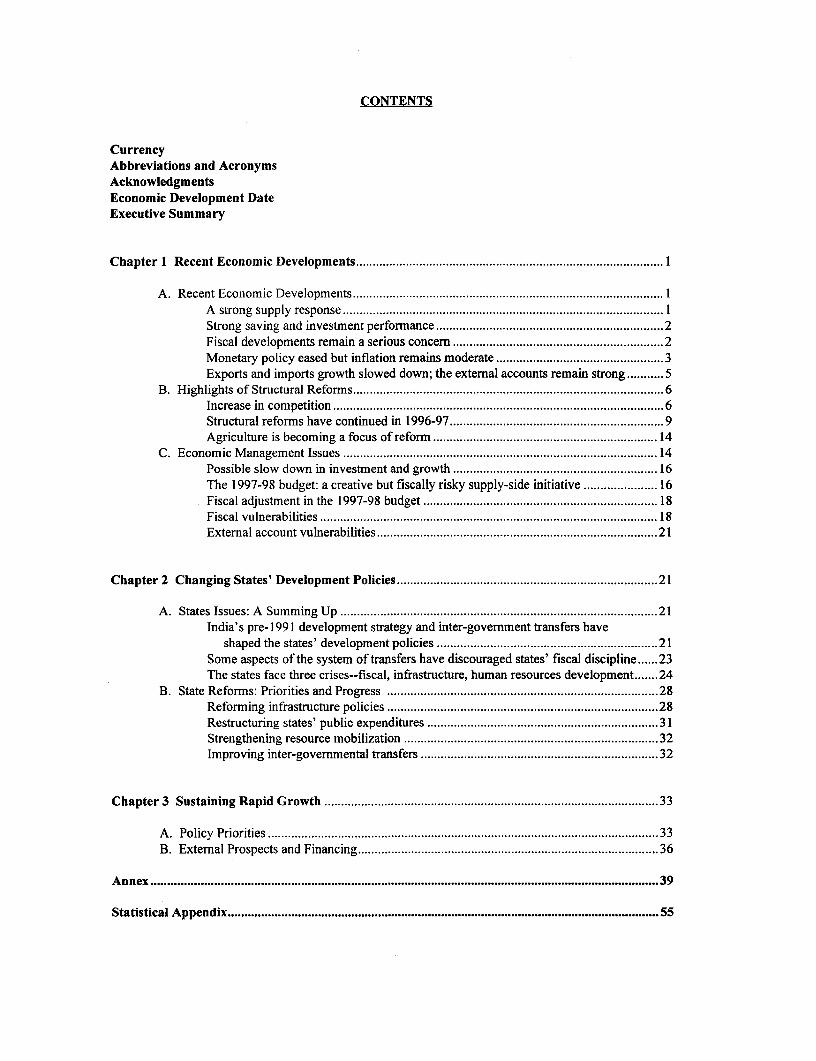
CONTENTS
CurrencyAbbreviations and AcronymsAcknowledgmentsEconomic Development DateExecutive Summary
Chapter 1 Recent Economic Developments ........................................................................ I
A. Recent Economic Developments ...................................................................... 1IA strong supply response ...................................................................... 1IStrong saving and investment performance .................................................................... 2Fiscal developments remain a serious concern ............................................................... 2Monetary policy eased but inflation remains moderate ...................... ............................3Exports and imports growth slowed down; the external accounts remain strong ...........5
B. Highlights of Structural Reformns ....................................................................... 6Increase in competition ....................................................................... 6Structural reforms have continued in 1996-97 ................................................................ 9Agriculture is becoming a focus of reform ................................................................... 14
C. Economic Management Issues ...................................................................... 14Possible slow down in investment and growth ............................................................. 16The 1997-98 budget: a creative but fiscally risky supply-side initiative ...................... 16Fiscal adjustment in the 1997-98 budget ...................................................................... 18Fiscal vulnerabilities ...................................................................... 18External account vulnerabilities ....................................................................... 21
Chapter 2 Changing States' Development Policies ....................................................................... 21
A. States Issues: A Summing Up ...................... ................................................. 21India's pre- 1991 development strategy and inter-government transfers have
shaped the states' development policies .................................................................. 21Some aspects of the system of transfers have discouraged states' fiscal discipline ...... 23The states face three crises--fiscal, infrastructure, human resources development ....... 24
B. State Reforms: Priorities and Progress ...................................................................... 28Reforming infrastructure policies ....................................................................... 28Restructuring states' public expenditures ..................................................................... 31Strengthening resource mobilization ...................................................................... 32Improving inter-governmental transfers ...................................................................... 32
Chapter 3 Sustaining Rapid Growth ...................................................................... 33
A. Policy Priorities ....................................................................... 33B. External Prospects and Financing ...................................................................... 36
Annex ....................................................................... 39
Statistical Appendix ...................................................................... 55
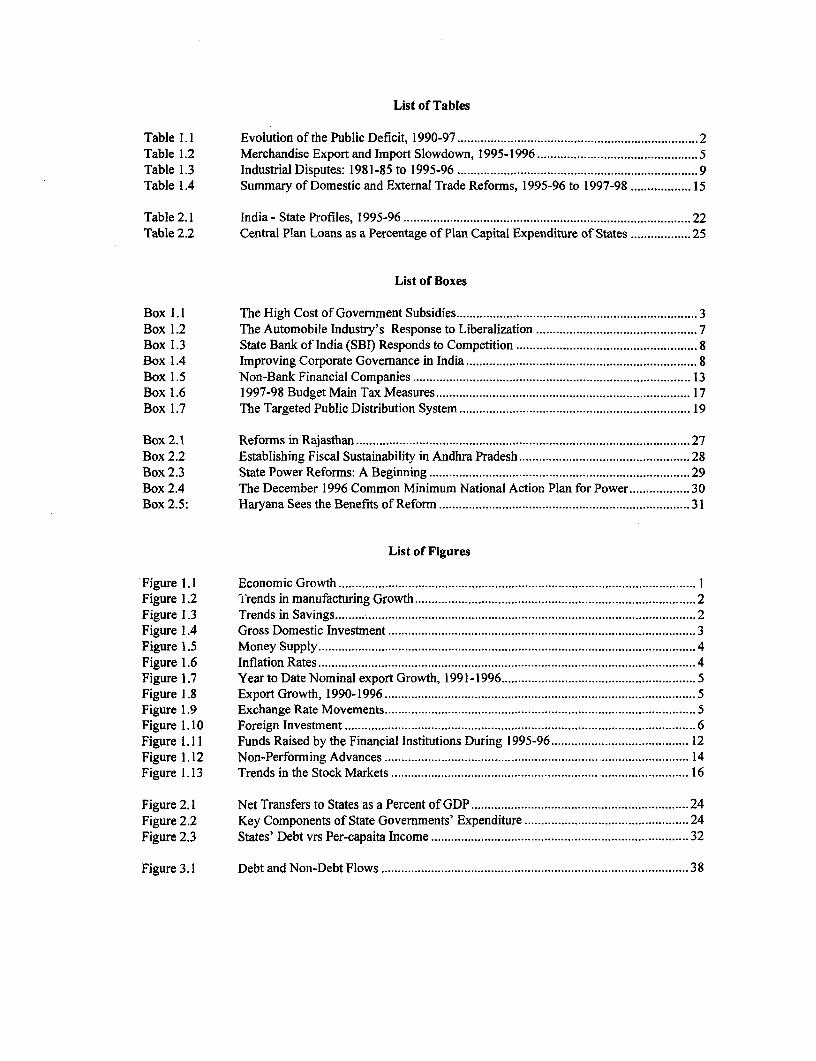
List of Tables
Table 1.1 Evolution of the Public Deficit, 1990-97 .................................................... 2Table 1.2 Merchandise Export and Import Slowdown, 1995-1996 ................................................ 5Table 1.3 Industrial Disputes: 1981-85 to 1995-96 ..................................................... 9Table 1.4 Summary of Domestic and External Trade Reforms, 1995-96 to IS197-98 .................. 15
Table 2.1 India - State Profiles, 1995-96 .................................................... 22Table 2.2 Central Plan Loans as a Percentage of Plan Capital Expenditure of States .................. 25
List of Boxes
Box 1.1 The High Cost of Government Subsidies ..................................................... 3Box 1.2 The Automobile Industry's Response to Liberalization ................................................ 7Box 1.3 State Bank of India (SBI) Responds to Competition ..................................................... 8Box 1.4 Improving Corporate Governance in India ..................................................... 8Box 1.5 Non-Bank Financial Companies .................................................... 13Box 1.6 1997-98 Budget Main Tax Measures .................................................... 17Box 1.7 The Targeted Public Distribution System .................................................... 19
Box 2.1 Reforms in Rajasthan .................................................... 27Box 2.2 Establishing Fiscal Sustainability in Andhra Pradesh ................................................... 28Box 2.3 State Power Reforms: A Beginning .................................................... 29Box 2.4 The December 1996 Common Minimum National Action Plan for ]?ower .................. 30Box 2.5: Haryana Sees the Benefits of Reform .................................................... 31
List of Figures
Figure 1.1 Economic Growth .................................................... IFigure 1.2 Trends in manufacturing Growth ..................................................... 2Figure 1.3 Trends in Savings ..................................................... 2Figure 1.4 Gross Domestic Investment ..................................................... 3Figure 1.5 Money Supply ..................................................... 4Figure 1.6 Inflation Rates ......... . . . . ... . . 4Figure 1.7 Year to Date Nominal export Growth, 1991-1996 .......................................... 5Figure 1.8 Export Growth, 1990-1996 .......................................... 5Figure 1.9 Exchange Rate Movements .......................................... 5Figure 1.10 Foreign Investment .......................................... 6Figure 1.11 Funds Raised by the Financial Institutions During 1995-96 ......................................... 12Figure 1.12 Non-Perforrming Advances ......................................... 14Figure 1.13 Trends in the Stock Markets ..................................... 16
Figure 2.1 Net Transfers to States as a Percent of GDP ..................................... 24Figure 2.2 Key Components of State Governments' Expenditure ..................................... 24Figure 2.3 States' Debt vrs Per-capaita Income ..................................... 32
Figure 3.1 Debt and Non-Debt Flows ..................................... 38
ACKNOWLEDGMENTS
This report was prepared by a team led by Tzanninis and Martin Muhleisen (IMF).Zoubida Allaoua. It draws on contributions Primary statistical and computationalfrom Mona Haddad, William Mccarten, V.J. assistance was received from Bhaskar NaiduRavishankar (state issues, fiscal), Miria and Rajni Khanna. The report benefitted fromPigato and Uri Dadush (external sectors), Luis Ernesto Derbez (Division Chief)Dina Umali-Deininger (agriculture), Joelle continuous support.Chassard, Kari Nyman, Djamal Mostefai(power), Harald Hansen (transport). Roberto The report benefitted from and reflectsZagha (Lead Economist) contributed to the discussions held with the Indian authorities inreport and provided guidance. Rui Coutinho May 1997. We gratefully acknowledge thewho participated in the discussions with the cooperation of government officials, the RBI,government also provided invaluable and members of the business community forassistance. The report benefited from their valuable time and assistance.comments from John Williamson (ChiefEconomist), Luis Serven (reviewer), Colin Arrangements for mission to India were madeBruce, Sanjay Kathuria, Benoit Blarel, Keith by Padma Gopalan and Sheni Rana. TheHinchliff, James Hanson, and Dimitri report was desktoped by Lin Chin.

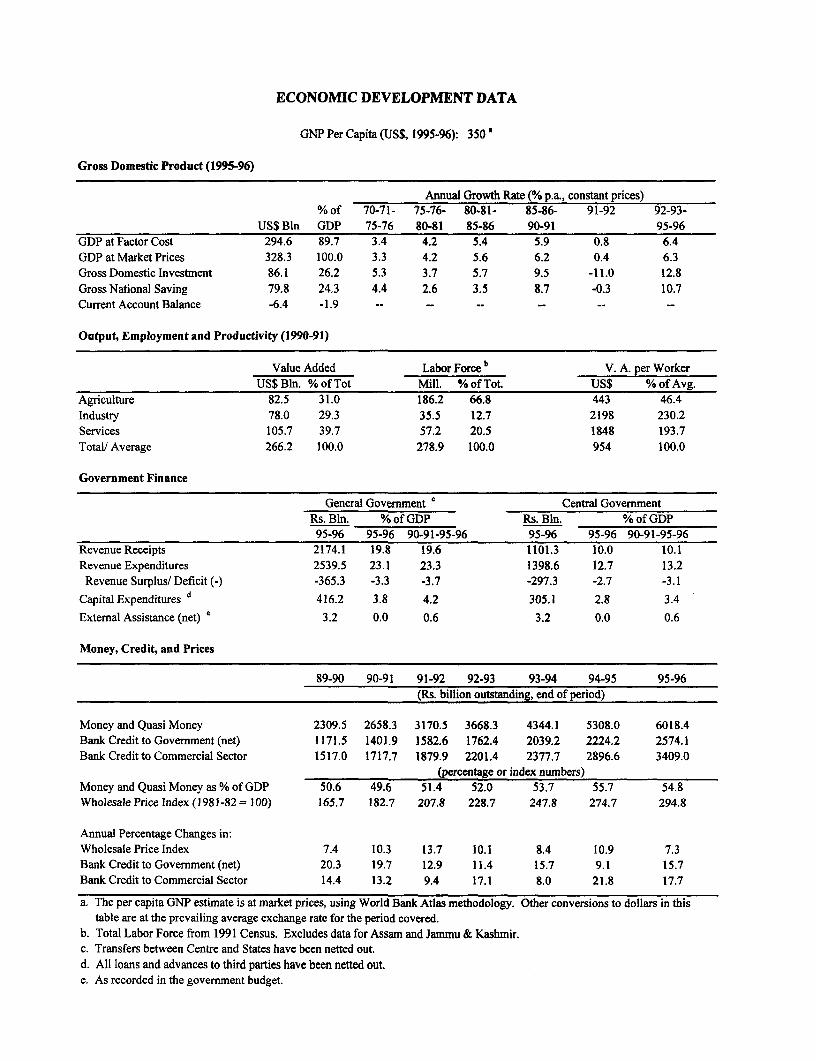
ECONOMIC DEVELOPMENT DATA
GNP Per Capita (US$, 1995-96): 350'
Gross Domestic Product (1995-96)
Annual Growth Rate (% p.a, constant prices)% of 70-71- 75-76- 80-81- 85-86- 91-92 92-93-
US$ Bln GDP 75-76 80-81 85-86 90-91 95-96GDP at Factor Cost 294.6 89.7 3.4 4.2 5.4 5.9 0.8 6.4GDP at Market Prices 328.3 100.0 3.3 4.2 5.6 6.2 0.4 6.3GrossDomesticlnvestment 86.1 26.2 5.3 3.7 5.7 9.5 -11.0 12.8Gross National Saving 79.8 24.3 4.4 2.6 3.5 8.7 -0.3 10.7Current Account Balance -6.4 -1.9 -- - -- -- -- --
Output, Employment and Productivity (1990-91)
Value Added Labor Force b V. A. per WorkerUS$ Bln. % of Tot Mill. % of Tot. US$ % of Avg.
Agriculture 82.5 31.0 186.2 66.8 443 46.4Industry 78.0 29.3 35.5 12.7 2198 230.2Services 105.7 39.7 57.2 20.5 1848 193.7Total/ Average 266.2 100.0 278.9 100.0 954 100.0
Government Finance
General Government Central GovernmentRs. Bin. % of GDP Rs. Bln. % of GDP95-96 95-96 90-91-95-96 95-96 95-96 90-91-95-96
RevenueReceipts 2174.1 19.8 19.6 1101.3 10.0 10.1Revenue Expenditures 2539.5 23.1 23.3 1398.6 12.7 13.2Revenue Surplus/ Deficit (-) -365.3 -3.3 -3.7 -297.3 -2.7 -3.1
Capital Expenditures d 416.2 3.8 4.2 305.1 2.8 3.4
External Assistance (net) e 3.2 0.0 0.6 3.2 0.0 0.6
Money, Credit, and Prices
89-90 90-91 91-92 92-93 93-94 94-95 95-96(Rs. billion outstanding, end of period)
Money and Quasi Money 2309.5 2658.3 3170.5 3668.3 4344.1 5308.0 6018.4Bank Credit to Govermnent (net) 1171.5 1401.9 1582.6 1762.4 2039.2 2224.2 2574.1Bank Credit to Commercial Sector 1517.0 1717.7 1879.9 2201.4 2377.7 2896.6 3409.0
(percentage or index numbers)Money and Quasi Money as % of GDP 50.6 49.6 51.4 52.0 53.7 55.7 54.8Wholesale Price Index (1981-82 = 100) 165.7 182.7 207.8 228.7 247.8 274.7 294.8
Annual Percentage Changes in:Wholesale Price Index 7.4 10.3 13.7 10.1 8.4 10.9 7.3Bank Credit to Government (net) 20.3 19.7 12.9 11.4 15.7 9.1 15.7Bank Credit to Commercial Sector 14.4 13.2 9.4 17.1 8.0 21.8 17.7
a The per capita GNP estimate is at market prices, using World Bank Atlas methodology. Other conversions to dollars in thistable are at the prevailing average exchange rate for the period covered.
b. Total Labor Force from 1991 Census. Excludes data for Assam and Jammu & Kashmir.c. Transfers between Centre and States have been netted out.d. All loans and advances to third parties have been netted out.e. As recorded in the government budget.
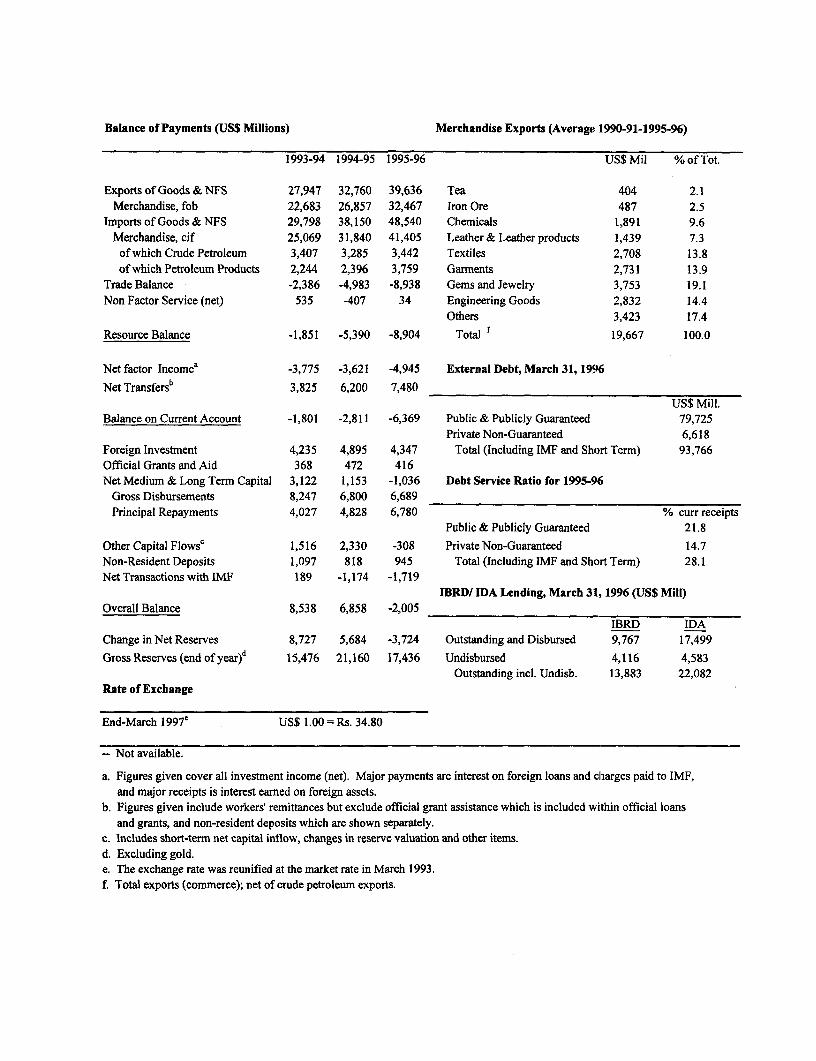
Balance of Payments (US$ Millions) Merchandise Exports (Average 1990-91-1995-96)
1993-94 1994-95 1995-96 US$ Mil % of Tot.
Exports of Goods & NFS 27,947 32,760 39,636 Tea 404 2.1Merchandise, fob 22,683 26,857 32,467 Iron Ore 487 2.5
Imports of Goods & NFS 29,798 38,150 48,540 Chemicals 1,891 9.6Merchandise, cif 25,069 31,840 41,405 Leather & Leather products 1,439 7.3
of which Crude Petroleum 3,407 3,285 3,442 Textiles 2,708 13.8of which Petroleum Products 2,244 2,396 3,759 Garments 2,731 13.9
Trade Balance -2,386 -4,983 -8,938 Gems and Jewelry 3,753 19.1Non Factor Service (net) 535 -407 34 Engineering Goods 2,832 14.4
Others 3,423 17.4
Resource Balance -1,851 -5,390 -8,904 Total 19,667 100.0
Net factor Incomea -3,775 -3,621 -4,945 External Debt, March 31, 1996
Net Transfersb 3,825 6,200 7,480US$ Mill.
Balance on Current Account -1,801 -2,811 -6,369 Public & Publicly Guaranteed 79,725Private Non-Guaranteed 6,618
Foreign Investment 4,235 4,895 4,347 Total (Including IMF and Short Term) 93,766Official Grants and Aid 368 472 416Net Medium & Long Term Capital 3,122 1,153 -1,036 Debt Service Ratio for 1995-96
Gross Disbursements 8,247 6,800 6,689Principal Repayments 4,027 4,828 6,780 % curr receipts
Public & Publicly Guaranteed 21.8
Other Capital Flowsc 1,516 2,330 -308 Private Non-Guaranteed 14.7Non-Resident Deposits 1,097 818 945 Total (Including IMF and Short Term) 28.1Net Transactions with IMF 189 -1,174 -1,719
IBRD/ IDA Lending, March 31, 1996 (US$ Mill)Overall Balance 8,538 6,858 -2,005
IBRD IDAChange in Net Reserves 8,727 5,684 -3,724 Outstanding and Disbursed 9,767 17,499
Gross Reserves (end of yeard 15,476 21,160 17,436 Undisbursed 4,116 4,583Outstanding incl. Undisb. 13,883 22,082
Rate of Exchange
End-March 1997e US$ 1.00 = Rs. 34.80
- Not available.
a. Figures given cover all investment income (net). Major payments are interest on foreign loans and charges paid to IMF,and major receipts is interest earned on foreign assets.
b. Figures given include workers' remittances but exclude official grant assistance which is included within official loansand grants, and non-resident deposits which are shown separately.
c. Includes short-term net capital inflow, changes in reserve valuation and other items.d. Excluding gold.e. The exchange rate was reunified at the market rate in March 1993.f Total exports (commerce); net of crude petroleum exports.
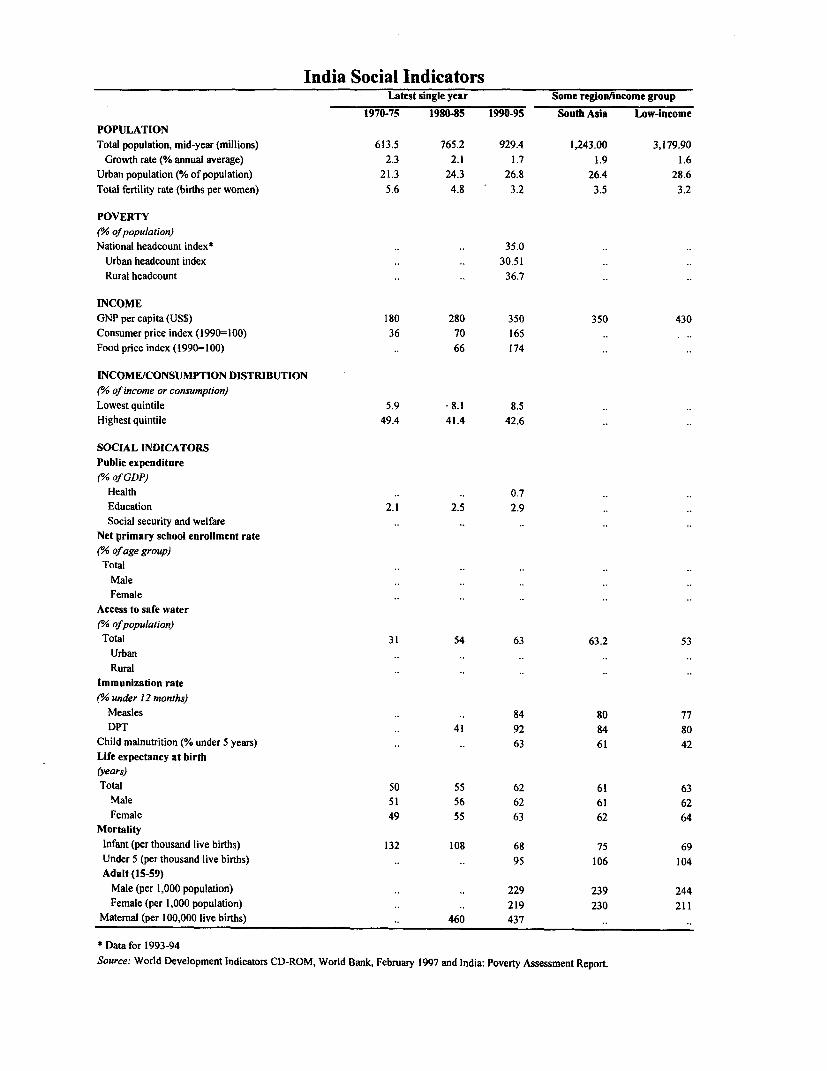
India Social IndicatorsLatest single year Some region/income group
1970-75 198045 1990-95 South Asia Low-income
POPULATIONTotal population, mid-year (millions) 613.5 765.2 929.4 1,243.00 3,179.90
Growth rate (% annual average) 2.3 2.1 1.7 1.9 1.6
Urban population (% of population) 21.3 24.3 26.8 26.4 28.6
Total fertility rate (births per women) 5.6 4.8 3.2 3.5 3.2
POVERTY('% of population)
National headcount index* .. .. 35.0
Urban headcount index .. .. 30.51
Rural headcount .. .. 36.7
INCOMEGNP per capita (US$) 180 280 350 350 430
Consumer price index (1990=100) 36 70 165
Food price index (1990=100) .. 66 174
INCOME/CONSUMPTION DISTRIBUTION
(% of income or consumption)Lowest quintile 5.9 -8.1 8.5
Highest quintile 49.4 41.4 42.6
SOCIAL INDICATORSPublic expenditure
(l% of GDP)Health .. .. 0.7
Education 2.1 2.5 2.9
Social security and welfare
Net primary school enrollment rate(3/ of age group)Total
MaleFemale
Access to safe water('/o of population)Total 31 54 63 63.2 53
UrbanRural
Immunization rate
(% under 12 months)Measles .. .. 84 80 77
DPT .. 41 92 84 80
Child malnutrition (% under 5 years) .. .. 63 61 42
Life expectancy at birth(years)
Total 50 55 62 61 63
Male 51 56 62 61 62
Female 49 55 63 62 64
MortalityInfant (per thousand live births) 132 108 68 75 69
Under 5 (per thousand live births) .. .. 95 106 104
Adult (15-59)Male (per 1,000 population) , 229 239 244
Female (per 1,000 population) .. .. 219 230 211
Maternal (per 100,000 live births) .. 460 437
* Data for 1993-94
Source: World Development Indicators CD-ROM, World Bank, February 1997 and India: Poverty Assessment Report.

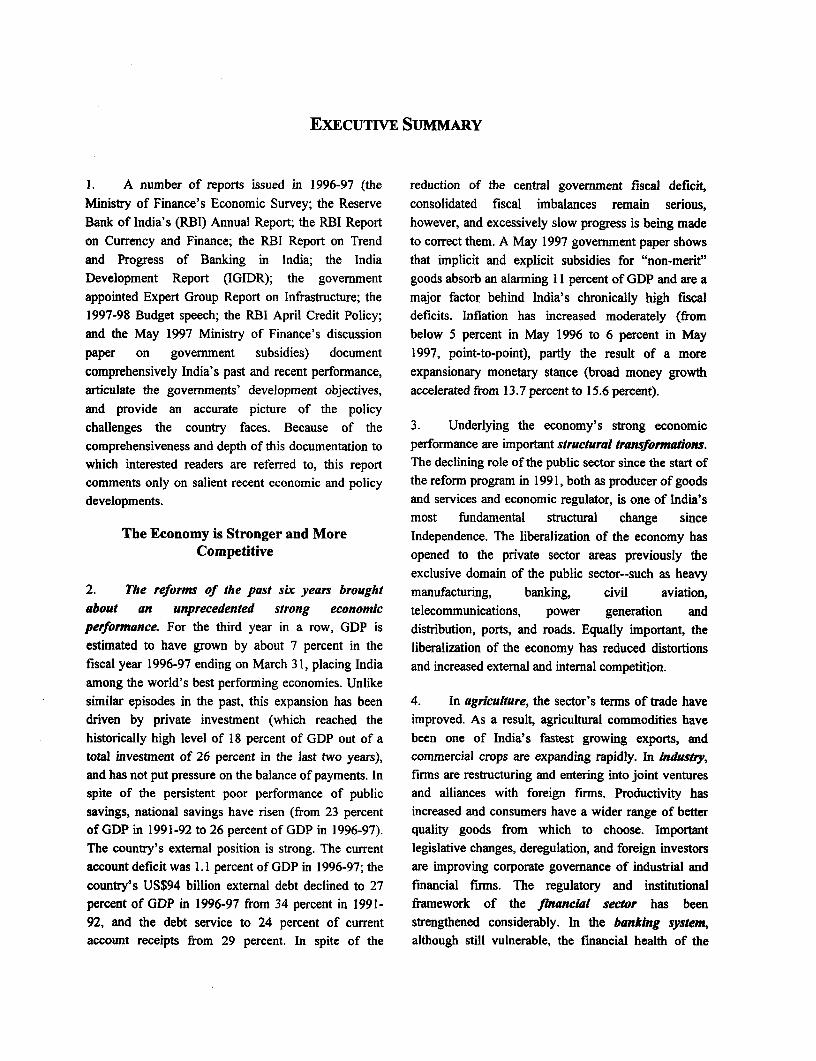
EXECUTIVE SUMMARY
1. A number of reports issued in 1996-97 (the reduction of the central government fiscal deficit,Ministry of Finance's Economic Survey; the Reserve consolidated fiscal imbalances remain serious,Bank of India's (RBI) Annual Report; the RBI Report however, and excessively slow progress is being madeon Currency and Finance; the RBI Report on Trend to correct them. A May 1997 government paper showsand Progress of Banking in India; the India that implicit and explicit subsidies for "non-merit"Development Report (IGIDR); the government goods absorb an alarming 11 percent of GDP and are aappointed Expert Group Report on Infrastructure; the major factor behind India's chronically high fiscal1997-98 Budget speech; the RBI April Credit Policy; deficits. Inflation has increased moderately (fromand the May 1997 Ministry of Finance's discussion below 5 percent in May 1996 to 6 percent in Maypaper on government subsidies) document 1997, point-to-point), partly the result of a morecomprehensively India's past and recent performance, expansionary monetary stance (broad money growtharticulate the governments' development objectives, accelerated from 13.7 percent to 15.6 percent).and provide an accurate picture of the policychallenges the country faces. Because of the 3. Underlying the economy's strong economiccomprehensiveness and depth of this documentation to performance are important structural transformations.which interested readers are referred to, this report The declining role of the public sector since the start ofcomments only on salient recent economic and policy the reform program in 1991, both as producer of goodsdevelopments. and services and economic regulator, is one of India's
most fundamental structural change sinceThe Economy is Stronger and More Independence. The liberalization of the economy has
Competitive opened to the private sector areas previously the
exclusive domain of the public sector--such as heavy2. The reforms of the past six years brought manufacturing, banking, civil aviation,about an unprecedented strong economic telecommunications, power generation andperformance. For the third year in a row, GDP is distribution, ports, and roads. Equally important, theestimated to have grown by about 7 percent in the liberalization of the economy has reduced distortionsfiscal year 1996-97 ending on March 31, placing India and increased external and internal competition.among the world's best performing economies. Unlikesimilar episodes in the past, this expansion has been 4. In agriculture, the sector's terms of trade havedriven by private investment (which reached the improved. As a result, agricultural commodities havehistorically high level of 18 percent of GDP out of a been one of India's fastest growing exports, andtotal investment of 26 percent in the last two years), commercial crops are expanding rapidly. In Industy,and has not put pressure on the balance of payments. In firms are restructuring and entering into joint venturesspite of the persistent poor performance of public and alliances with foreign firms. Productivity hassavings, national savings have risen (from 23 percent increased and consumers have a wider range of betterof GDP in 1991-92 to 26 percent of GDP in 1996-97). quality goods from which to choose. ImportantThe country's external position is strong. The current legislative changes, deregulation, and foreign investorsaccount deficit was 1.1 percent of GDP in 1996-97; the are improving corporate governance of industrial andcountry's US$94 billion external debt declined to 27 financial firms. The regulatory and institutionalpercent of GDP in 1996-97 from 34 percent in 1991- framework of the ftnancial sector has been92, and the debt service to 24 percent of current strengthened considerably. In the banking system,account receipts from 29 percent. In spite of the although still vulnerable, the financial health of the
ii Executive Summary
public banks has improved and 19 out of the 27 public with some degree of success, particularly in bridges.sector banks reached the capital adequacy ratio of 8 Also, legislative changes have been announced topercent in 1995-96. The entry of new private banks and facilitate land acquisition--an irnportant impediment tothe mainstreaming of Non-Bank Finance Companies private investment in roads. In power, where the need(NBFCs) in a financial sector still dominated by public is the greatest, private sector interest to invest thebanks (which control 85 percent of the system's assets) strongest, and action by state governments essential tohave increased competition and forced the latter to transform this interest into concrete investments, areduce costs, and improve quality of service. Similar conference of state Chief Ministers reached agreementdevelopments have taken place in civil aviation. In on a Common Minimum National Action Plan for
infrastructure, while much too slowly to address Power (CMNAP) reforms, issued by the Ministry ofIndia's infrastructure crisis, private investrnent is Power in December 1996. Much of the CMNAP hastaking place in ports, power, and toll bridges. A new been inspired by the pioneering reforms Orissa startedfinancial institution (IDFC) has been established to a few years ago. The CMNAP envisages changes infacilitate the development of a long-term rupee bond legislation to enable the states to have their ownmarket for infrastructure financing. Last but not least, independent power regulatory agencies, with authorityincreased competition in product markets has led to an to grant licenses including for distribution, and fiximprovement in industrial relations with a consequent tariffs. This would remove the main impediments to
decline in labor disputes. large scale private investment in a sector that needs iturgently. Some states are giving the CMNAP's
5. Reforms have continued during 1996-97 in recommendations serious consiideration and taken stepsspite of political uncertainty. The positive effects of towards their implementation. In coal, major reformsthe reforms have demonstrated the extent to which have freed imports from licensing restrictions, reducedIndia stands to gain from deregulation and better fiscal tariffs to 5-10 percent, pursued the liberalization ofmanagement, and have helped create some consensus private investment in the sector, lifted price controls onon the need to continue liberalizing the economy and high grade coal and will lift the remaining restrictionscorrecting fiscal imbalances. This may explain why, over the next 2-3 years. Also, a decision was taken tonotwithstanding three changes of government of very divest shares in Coal India's subsidiaries.diverse political backgrounds, reforms have continuedin 1996-97 and expanded into some new areas, albeit at 7. This progress notwithstanding, it is evident thata rate that can be seen as excessively gradual. the induction of private capital in areas which for
decades have been under publjic sector monopoly has6. The investment regime has been liberalized been slower than anticipated, and so have its results.further, with particular emphasis on foreign Unless investment in infrastructure expandsinvestment--approval procedures have been simplified significantly, India's emerging infrastructure crisis mayand restrictions on end-use relaxed. Announced a few prevent the country from sustaining the high levels ofyears ago, the independent Telecom Regulatory growth that the last few years have shown to be withinAuthority of India has started its operations. In the reach. In particular, remarkably little progress has beencase of major ports (regulated by the central made in addressing the fundamental policy andgovernment), an independent Tariff Authority was institutional changes (most of which under theestablished, guidelines have been issued for private exclusive purview of state authorities) needed toinvestment through BOT-type contracts. Several expand urban infrastructure and alleviate theprivate investments in minor ports (under the states' tremendous problems of India's fast growing cities.jurisdiction) have already taken place. In roads, while Water supply systems--rural and urban--continue to bethere is awareness in India that this is an area where the poorly managed by state-government institutions at apublic sector will retain a major role, attempts have high cost to the economy (the subsidy for irrigationbeen made nonetheless to facilitate private sector entry
Executive Summary iii
alone is close to 2 percent of GDP) and insufficient has promoted the National Securities Depositoryefforts are being made to attract private investment. Limited (NSDL) to facilitate scripless trading and the
National Clearing Corporation Limited (NCCL) to8. The liberalization of the *rade regime has guarantee all trade done on the NSE. Screen-basedcontinued. Tariff reductions announced in the 1997-98 trading has now been generalized to other exchanges.Budget presented to Parliament in February 1997 All transactions in debt securities, previously handledbrought the maximum rate down to 40 percent and the by brokers in an unregulated telephone market, areaverage import-weighted rate to 20 percent. The now done solely through the NSE which has emergedFinance Minister announced its intention to reduce it as the premier exchange for scripless trading in debt asfurther to East Asian levels. The new Exim Policy well as stock instruments. Finally, SEBI, the securitieseliminated licensing requirements for about one-sixth and exchange board of India, is strengthening itsof consumer goods (essentially, the only imports still oversight capacity and the transparency of capitalrestricted) and India has indicated its readiness to markets. It has introduced inter alia new and moreeliminate gradually the remaining licensing effective guidelines for public issues and takeovers.restrictions.
11. A key objective of the tax reform pursued by9. Several measures were taken also to the Center since 1991 has been to simplify and broadenstrengthen the banking system, increase banks' the base of the tax system by lowering rates,operational autonomy, and improve the functioning streamlining the rate structure, and improving taxof financial markets. Of particular importance, banks administration. Some of the most severe distortions ofare now required to mark to market 60 percent of their the tax system have been corrected. The 1997-98portfolios. Virtually all interest rates are now market Budget maintains the overall direction of tax reforms.determined with the exception of interest rates on In particular, it simplified India's tax system further,lending for amounts below Rs. 200,000, and on reduced import tariffs, and brought corporate anddeposits of below one year. Cash reserve requirements personal rates in line with those of East Asia. In thewere reduced from 14 percent of deposits in April process, the budget also seeks to improve the rules1996 to 10 percent in January 1997; reserve governing tax sharing between the central governmentrequirements on inter-bank liabilities have been and the states and strengthen compliance.abolished; regulations governing loan syndication andamounts of credit for working capital purposes have 12. There was also some progress in deregulatingbeen eliminated; and prudential regulations were agriculture. The strong response of agriculture totightened further. The elimination of CRR on inter- reforms created favorable conditions for thebank liabilities coupled with the RBI's rationalization government to re-introduce--after a 31-year hiatus--of its refinance rates into a single rate is expected to futures trading in cotton lint, jute and jute goods andhelp establish a reference interest rate which would partially lift restrictions on commodity trading such ashelp develop a yield curve and improve RBI's ability those on storage, credit and movement controls,to manage monetary and exchange rate policies. particularly for cotton and oUlseeds. Export quotas on
cotton and cotton yam were raised and the number of10. Regarding capital markets, the Depositories yam quota exemptions expanded. Sugar exportsAct was passed to provide the legal framework for the (subject to quotas) were decanalized in January 1997.dematerialization of securities and their secure transfer To boost rice exports, the government removed thethrough electronic book entry. The establishment of the minimum export price but declining government stocksmodem electronic securities exchange system, the led to the reimposition of the levy on rice millsNational Stock Exchange (NSE), transformed the exporting non-basmati rice. Recent liberalizationfunctioning of the stock markets in India by increasing measures notwithstanding, agriculture continues to betheir transparency through scripless trading. The NSE
iv Executive Summary
highly regulated by both central and state governments 15. The authorities responded to this situationat a high cost to the economy and the poor. through a number of measures taken at different points
in time. First, there was a relaxation of monetary13. There was less progress in reforming public policies which led to a decline in short-term realenterprise (PEs), however. While public enterprises interest rates. Second, a number of measures wereare now more exposed to competition, their autonomy introduced to encourage private investment--remains limited and this has reduced the ability of their particularly FDI. These were the removal of entrymanagers to introduce essential restructuring. Thus, barriers (reservation policy) to a number of industries--with a few exceptions, the financial performance of mostly selected agro-industries--and relaxation of scalePEs has failed to improve. A Disinvestment limitations. Third, important regulatory changes wereCommission which was established in 1996 to examnine introduced to facilitate private investment inoptions for reducing central government equity in infrastructure. Finally, a pro-reform budget aimed atcentral public enterprises has since submitted an boosting confidence was presented to Parliament onapproach paper and two reports articulating a strategy-- February 28, 1997.which was amply debated by the public at large andexperts in the privatization field--for reforming PEs on 16. The 1997-98 budget: a creative but fiscallythe basis of which the Commission recommended the risky supply-side initiative. The main objective of thefull or partial privatization of nine public enterprises. 1997-98 Budget is to reactivate private investment.While these are positive steps, there are no signs yet Towards this objective, several measures were taken tothat its recommendations will be adopted by the revive the stock market. Corporate taxation wasgovermnent and that a rapid process of disinvestment sharply reduced (from 43 percent to 35 percent) and iswill take place. now in line with that in East Asia. Dividend taxation at
the individual income tax level was repealed andEconomic Management Issues replaced by a 10 percent final withholding on corporate
distributions. Other measures (such as allowing share14. Possible slowdown in investment and growth. buy-backs, announcing the reform of the Company'sDuring 1996-97, a number of developments raised Act, and increasing the cap on ownership by foreignapprehension on the future course of the economy and institutional investors in Indian companies from 24on its capacity to sustain the rates of growth of the last percent of paid-up capital to 30 percent) were intendedthree years. In particular, declines in the rates of to improve the business climate, increase privategrowth of imports of capital goods (which declined by investment, and sustain growth. Combined with7 percent), of corporate profits (5 percent), of lending improvements in tax administration, the reactivationcommitments by specialized long-term financial of private investment is critical to achieve the 1997-98institutions (30 percent), and of primary equity issues fiscal deficit target of 4.5 percent of GDP and(22 percent) gave rise to the perception that investment represents the main downside risks of an otherwiseand growth might have declined. The reasons were credible budget forecast. The 'budget also reduced thebelieved to be a tepid stock market which led maximum marginal personal income tax rate to 30corporations to delay security issues; high real interest percent from 40 percent and the lowest rate to 10rates; and commercial banks' heightened aversion to percent from 15 percent; further simplified the exciserisk (largely a result of tighter enforcement of tax structure; and introduced measures to strengthenprudential regulations and the Indian Bank debacle), all compliance. Also, tariff reductions for capital goodsof which made it difficult to reach financial closure on were more pronounced than for the rest.investment projects, leading many firms to postponeinvestment decisions. Political uncertainty was an 17. Fiscal adjustment in the 1996-97 and 1997-98obvious additional factor. budgets. Deferred pay adjustments associated with the
Fifth Pay Commission's recommendations (for which
Executive Summary v
0.3 percent of GDP had been budgeted) into 1997-98 amounts of central government grants to each stateand other minor expenditure adjustment offset the and, until the 1996 Tenth Finance Commission whichimpact of a shortfall in privatization (0.4 percent of discontinued this practice, on unconditional debtGDP) proceeds, allowing the government to meet its forgiveness for highly indebted states. Driven mostlyfiscal deficit target of 5 percent of GDP in 1996-97 by the objective of mobilizing finance for the(from 5.5 percent of GDP in 1995-96). The 1997-98 investment plans of the states, the Planningbudget projects a 0.5 percent fiscal correction to 4.5 Commission makes recommendations on centralpercent of GDP in 1997-98 to be achieved mainly by government loans and grants to the states, and on themaintaining tax revenue at its current share of GDP, amounts of states' borrowings from captive sources:and modestly accelerating privatization. However, this "'market borrowings" from commercial banks,fiscal deficit target may be difficult to achieve without insurance companies and pension funds, all of whichadditional measures. In particular, the budget relies must invest a share of their resources in "designatedupon improved compliance to offset the impact of the securities", such as state bonds.sharp cuts in taxation and maintain tax revenue at itscurrent share of GDP. 20. Starting in the early 1970s, both the Finance
and the Planning Commissions recommendedChanging States' Development Policies gradually but persistently increasing transfers to the
states. These developments built expectations that the18. India's pre-1991 development strategy and states needed not be overly concerned with mobilizing
inter-governmental transfers have shaped the states' resources since ever-expanding and politically moredevelopment and fiscal policies. The Indian expedient financing would be forthcoming. As a result,Constitution gives the states considerable autonomy to throughout the 1970s and 1980s, the states rapidlydefine their development policies. The states are expanded investments in physical infrastructureresponsible for the provision and regulation of key (power, irrigation, ports, roads), and provision of socialinfrastructure and social services, including primary services, without establishing mechanisms for costeducation and basic health. They defined their recovery and for maintaining these assets and programsdevelopment policies at a time when national policies in the long run. Prices charged for power, water,excluded private investment from key sectors of the irrigation and other services declined to levelseconomy. Where permitted, central licensing equivalent to a small fraction--in some cases zero--ofauthorities, not the enabling environment, determined production costs.the volume and composition of private investment.Consequently, across India, states' development 21. The states face three crises-fiscal,
policies focused on expanding public investment, often infrastructure, and human resource development Byin areas which are not the public sector's comparative the second half of the 1980s, it became evident that theadvantage. For this expansion, they relied on transfers states were experiencing considerable fiscalrecommended by the Finance and Planning difficulties. Implicit and explicit subsidies for goodsCommissions, two institutions which command and services which are not of a public nature rose toconsiderable respect in India, and whose reach about 7 percent of GDP. They also expandedrecommendations are generally accepted by the central public employment to the point that in most statesgovernment. wages and pensions absorb between 4-5 percent of the
state GDP, and 9-10 percent is not infrequent. They19. Driven mainly by the objective of equalizing contracted debt without establishing the financial basethe availability of infrastructure and social services for its servicing. As a result, fiscal stress becameacross India, Finance Commissions make evident. In particular, there was a deterioration in therecommendations: on how to share with each state quality of spending. While the states' fiscal deficittaxes collected by the central government, on the remained relatively stable at around 3 percent of GDP,
vi Executive Summary
capital, education, health and operations and on employment, and reduction of consumptionmaintenance expenditure started to decline from the subsidies) to eliminate wasiteful spending and makemid-1980s, and interest expenditure to increase. room for priority programs in public infrastructure,Resources for operations and maintenance became health and education; and (iv) tax reforms to provideinsufficient and infrastructure begun to exhibit signs of stable sources of revenue at a low efficiency cost.decay. These trends were exacerbated by the reformsstarted in 1991 when growth of central government 24. In many states, policy, pricing and institutionaltransfers declined and eventually became negative, and reforms of key sectors would bring about the neededinterest payments increased. Most states found fiscal restructuring. For example, power and irrigationthemselves unable to play their central role in India's sector reforms--particularly increases in power anddevelopment: to provide key infrastructure, health, and water tariffs--would generate large fiscal gains ineducation. virtually all of India's 25 states. In some states, such
reforms, alone, would be sufficient to restore fiscalState Reforms: Priorities and Progress sustainability. In others, putting the states' public
finances on a sustainable path would require more22. The reforms underway since 1991 have comprehensive reforms of public expenditures, such asradically changed the framework within which states' public enterprise reform, freeze on public employment,development policies are implemented. States can reduction in consumption subsidies and aattract private capital in such sectors as power, rationalization and retargeting of the states' welfareirrigation, ports, roads, and all areas of manufacturing-- programs. Finally, in highly indebted states, sectoraland it is its ability to attract private capital which now reforms and public expenditure restructuring may needdetermines a state's growth performance. Development to be complemented by debt refinancing.spending therefore needs to be more narrowly focusedon the state's areas of comparative advantage, where it 25. Several states have already started to implementcomplements rather than substitutes for the private sector reforms, particularly in power-where about fivesector. This is a radical departure from the pre-1991 states have taken the first steps towards increasingperiod, when the volume of public development tariffs, establishing an independent regulatory agency,spending was a key determinant of a state's growth and privatizing generation and distribution in a processperformance. of reform that will take several years to be brought to
its logical conclusion--ports, roads, and, to a lesser23. Attracting private capital requires states to extent, water and irrigation, although a few states haveprovide an enabling and investor-friendly environment. already begun moderately adjusting water tariffs, andThat is, good quality and abundant infrastructure, an devolving maintenance to farmers' associations. Albeiteducated labor force, a business-friendly public extremely modest, some progress has also been madeadministration, and moderate levels of taxation. in restructuring public expenditure with a view toSignificant reforms are needed to bring this about in reducing unproductive expenditure. In particular, thereIndia's states. In particular, it requires: (i) policy, is growing recognition of the need to controlpricing, institutional, and regulatory reforms to recruitment to reduce the wage bill, eliminate poorlytranslate private sector interest to invest in targeted welfare programs, and privatize publicinfrastructure into commercially viable ventures--and enterprises. On the revenuefront, reforms are neededimprovements in the states' capacity to manage to increase cost recovery (as an essential part of sectorcommercially enforceable contracts; (ii) an reform), broaden the base, improve the efficiency ofenvironment conducive to efficient public investment taxation, and ensure tax harmronization across states.in areas where the public sector will remain important Some states have already taken significant steps in thissuch as roads and urban services; (iii) public direction, but much remains to be done.expenditure restructuring (such as privatization, freeze
Executive Summary vii
Policy Priorities percent of GDP for the past few years, of which
consolidated central and state governments deficit26. India's overarching development objective amounts to 6.8 percent of GDP at present. Yet, it isduring its Ninth Plan period (1997-02) is achieving and only with a more rapid decline in fiscal imbalances thatsustaining high annual rates of growth of 7-8 percent the high real interest rates that have prevailed in theand ensuring that this growth benefits the poor. A recent past will decline. A target of 4 percent of GDPbroad consensus has emerged across India's political for the consolidated central and state governmentsspectrum for this objective and for continuing the deficit may be a realistic goal to achieve in the next 3-4liberalization of the economy. At what speed this will years. Reducing central and state governmentsbe done remains however an unresolved--yet critical-- subsidies on "non-merit goods" which absorb 11issue because it will determnine the country's growth percent of GDP at present could provide the resourcesperformance. needed to reach, and perhaps exceed, this target. A
more rapid privatization of public enterprises would27. The rapid growth of the last few years has enable the government to retire public debt and reduceshown how much India stands to gain from interest costs. The benefits of a more rapid correctionderegulation and fiscal adjustment. It has also shown of fiscal imbalances go well beyond just lower interestthat the economy is facing capacity constraints, most rates and higher investment. Lower fiscal deficits andnotably in infrastructure. High real interest rates are interest rates would provide favorable conditions for ananother indication of stress on domestic resources acceleration of banking reform, would help improvewhich has been at the origin of pressures put on the the health of the financial system, would provide moreauthorities to accelerate, perhaps prematurely, the flexibility to the RBI in the conduct of monetaryopening of the capital account--a development that in policy, would reduce pressure for opening the capitalall circumstances would need to be carefully account ahead of the structural reforms needed to makesynchronized with India's progress in structural it a success, and would make it easier to manage surgesreforms. Resources are also being strained in in capital inflows, and possible external shocks.
agriculture which has grown dependent on extremely International experience shows that a strong fiscallarge subsidies (power, water, fertilizer, to name just position has a central role in managing effectively thethe main ones). These subsidies put an unsustainably capital and current accounts of the balance oflarge burden on central and state government budgets, payments.and also are at the origin of microeconomic distortions
and misuse of resources (of which overexploitation of 29. Also, as highlighted in the May 1997groundwater resources and poor energy conservation government paper on subsidies, central and statepolicies are two important examples) which reduce government deficits are linked to significantproductivity growth. microeconomic distortions whose cost they bear. Again
in this case, the benefits of fiscal corrections go beyond28. The centrality of fiscal adjustment. As it has improve, the maeroeeon o beyond
forthepas sverl yar, rducng nda'sfisal improvements in the macroeconomic framework--for the past several years, reducing India's fiscal because they are tantamount to correcting severe priceimbalances remains of central importance for the distortions and misguided sector policies which areachievement of the country's development goals. preventing private investment and hamperingWhile gains have been made in reducing the central development. Power is one well known case where thegovernment fiscal deficit, those have been offset in the correction of price distortions would not only reducerecent past by a deterioration in the financial position state governments fiscal imbalances (by 2 percent ofof public enterprises, mostly because of the large cost GDP), but would also lead to a more efficient use of
(0.8 percent of GDP in 1996-97) of subsidizing oil resources, and provide the basis for private capital inproducts. As a result, the consolidated public sector power and the much needed capacity expansion.deficit has remained at the relatively high level of 9 Similar situations exist in other sectors.
viii Executive Summary
30. In addition to the macro-and micro-economic 33. At the same time, to support agriculturaldimensions of fiscal adjustment, a third, and at least as reforms, it would be essential to bring rural creditimportant one, is that of expenditure composition, reform to its logical conclusion. A coherent strategy forparticularly at the level of the states. In most states, the increasing flows to agriculture and other ruralcost of subsidies, of an excessively large labor force, economic -activities must address issues of access toand of government activities which are not of a financial services by the rural population in general, asdevelopment nature absorb a large share of state well as the financial sustainability of the rural financialgovernments budgets. To a large extent, the institutions themselves. Further measures are neededdeterioration of India's infrastructure, and the to encourage and facilitate an orderly re-orientation ofdifficulties the country is experiencing to mobilize India's rural financial system from the supply-ledresources to accelerate the development of its human approach of concessional, targeted agriculture credit, toresources are the result of states' pricing and sectoral the systematic development of demand-oriented ruralpolicies and the associated implied subsidies--and it is financial markets.also with the states that lies their resolution. Recentdeclines in central government financial support to the 34. Deregulating agriculture. Deregulation wouldstates have provided some--but as yet insufficient-- enable agriculture to achieve potentially largeimpetus to the states to start taking corrective actions. efficiency gains and provide a basis for the removal of
subsidies. The 1997-98 Budget contains the first steps31. Addressing the challenge of infrastructure. of a promising beginning of reforms at the level of theMuch has been said and written on India's central government, which could provide impetus--infrastructure problems. The recently completed report although it has not thus far--for similar reforms at theof an Expert Group on infrastructure provides a level of the states. Intimately related to thesobering review of India's tremendous infrastructure liberalization of agriculture is the deregulation of agro-problems and makes three recommendations to address industry where important segments are still regulatedthem. Thefirst is fiscal reforms to strengthen state and by industrial licenses or scale limitations that imposelocal governments capacity to mobilize resources to large costs to an industry characterized by economiesinvest in infrastructure. This is particularly important of scale. Because the incomes of the poor are sofor infrastructure of a public nature where benefits are closely associated with the fortunes of the agriculturalbest captured through taxation. The second is sector, a liberalization of agriculture would not onlyregulatory and pricing reforms to translate India's have positive growth effects, it would also helpimmense infrastructure needs into viable commercial increase the incomes of the pooir.ventures, capable of attracting private capital. Thethird is financial sector reforms to enable the large 35. Completing the liberalization of the trade andpool of India's financial savings to flow to high returns investment regimes remains an important policyinfrastructure investments. objective. India's import-weighted tariff has been
reduced from 87 percent in 1991-92 to around 2032. Banking reforms. Further banking and financial percent at present. The 1997-98 budget indicates thatderegulation (reducing government equity in the the process will continue, until India reaches the tariffcapital of public banks and further reductions in the levels of its East Asian neighbors. There are alsoSLR) would reduce the influence of government on indications that the government intends to eliminatecommercial banks' basic business decisions (such as restrictions on consumer goods in a phased manner.on hiring, on pay scales, branch expansion or closure), Implementation of this agenda would improveand permit more vigorous competition from private considerably the competitiveness of India'sbanks. The RBI is gradually strengthening its oversight manufacturing, as would a further deregulation of thecapabilities, and this provides the basis for a further investment regime. The radical liberalization of the lastderegulation of the banking system. six years notwithstanding, extremely costly regulations
Executive Summary ix
continue to restrict investment in areas reserved for private sector shows strong interest in investing in asmall scale and agro-industries. number of infrastructure areas, particularly power and
telecommunications, an important role remains for36. A prudent management of tlhe capital account public sector investment in some key areas--such asremains appropriate until fiscal consolidation has been roads, rural infrastructure and social services--whichachieved, the instruments and markets for indirect would need to be substantially increased. Suchmonetary control are more fully developed, the investments are crucial for sustaining rapid growth andcommercial banking system is strengthened, trade ensuring that the poor participate in the growthliberalization is complete and exports sufficiently process.diversified. Consistent with this objective, the pace of
liberalization of restrictions on debt-related capital and 38. The Bank therefore recommends that theshort-term capital would need to be gradual, tailored to members of the IDF should aim for officialthe pace of fiscal consolidation, progress in development assistance that directly supports prioritystrengthening the domestic financial system, and public investments in physical infrastructure andexport performance. Priority would be given to human capital development. This investment wouldmeeting the needs of long-term infrastructure financing also help crowd-in the necessary complementaryas the government has indicated in its 1997-98 private investment particularly in physicalExternal Commercial Borrowing guidelines. infrastructure. In addition to the financial flows,Otherwise, there would be a danger of prompting official development assistance is also crucial to buildvolatile financial conditions and sharp cross-border institutional capacity particularly at the level of thesurges in short-term funds that would be difficult to state and local governments. Therefore, as had lastmanage and could put serious stress on the domestic year's CEM, this report makes a case for India'sbanking system. continued access to long-termn assistance, including a
substantial concessional component. In view of its stillExternalfinancing requirements current high debt burden, India would need to continue
to prudently manage its external debt. With an37. India will continue to need to rely on official topuelymngisexmadb.Wth n37.elopIndiaswilotinue, notoithaneedigtorel goffica expected modest current account deficit of 2 percent ofdevelopment assistance, notwithstanding the growing GPoe h etfwyasadtencsaybidrole of private inflows. Besides India's low level of per uP oferve ndia would til reqetoalygross
capia GP (U$35), ofical evelpmet asistnce up of reserves, India would still require total grosscapita GDP (US$350), official development assistance fiacnoflsetUS1ilonn1979,ndnis also critically necessary for India to meet its
average of about US$17 billion in each of theenormous needs for infrastructure and human resource foloig four yS. bilatera an multilatedevelopment. As indicated in the Poverty Assessment particint atls years IiaDelopmentFramReport, distributed to members of India Development patcanstlstyr'IdiDelomtFruReport,IF dIsibut toversy ofmn widiDevpmeaant pledged about US$6.7 billion in official assistance to
Fou ID) ndaspoet rmis iepra n India's development efforts as a recognition of India'sthe lives of many of India's more than 300 million commioment tofreforms n neto aceeatepoor are burdened by poor health, illiteracy, and social
' ' ~~~~growth and reduce poverty and a similar amount isinequalities. Prospects for improving their standards of expeted rethis yert and non-debt commeria
living depend on India's ability to promote growth andsources are expected to account for the country's
invest in human resources development. While the remaining financing needs.

I
Chapter RECENT ECONOMIC DEVELOPMENTS
1.1 A number of reports issued in 1996-97 (the A. Recent Economic Developments
Ministry of Finance's Economic Survey; the Reserve
Bank of India's (RBI) Annual Report; the RBI Report A strong supply response
on Currency and Finance; the RBI Report on Trend
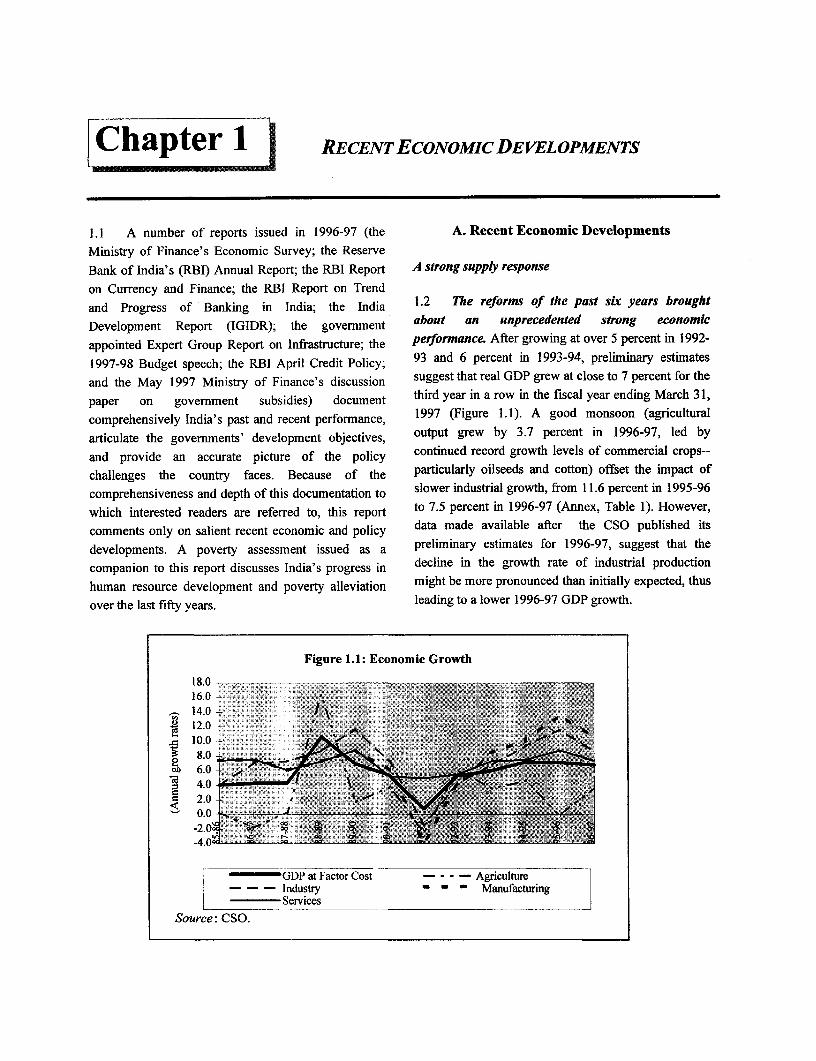
and Progress of Banking in India; the India 1.2 The reforms of the past six years brought
Development Report (IGIDR); the government about an unprecedented strong economic
appointed Expert Group Report on Infrastructure; the performance. After growing at over 5 percent in 1992-
1997-98 Budget speech; the RBI April Credit Policy; 93 and 6 percent in 1993-94, preliminary estimates
and the May 1997 Ministry of Finance's discussion suggest that real GDP grew at close to 7 percent for the
paper on government subsidies) document third year in a row in the fiscal year ending March 31,
comprehensively India's past and recent performance, 1997 (Figure 1.1). A good monsoon (agricultural
articulate the governments' development objectives, output grew by 3.7 percent in 1996-97, led by
and provide an accurate picture of the policy continued record growth levels of commercial crops--
challenges the country faces. Because of the particularly oilseeds and cotton) offset the impact of
comprehensiveness and depth of this documentation to slower industrial growth, from 11.6 percent in 1995-96
which interested readers are referred to, this report to 7.5 percent in 1996-97 (Annex, Table 1). However,
comments only on salient recent economic and policy data made available after the CSO published its
developments. A poverty assessment issued as a preliminary estimates for 1996-97, suggest that the
companion to this report discusses India's progress in decline in the growth rate of industrial production
human resource development and poverty alleviation might be more pronounced than initially expected, thus
over the last fifty years. leading to a lower 1996-97 GDP growth.
Figure 1.1: Economic Growth
16 0-;-.
1 4.012.0 -
10.0
50 8.0 i i
-4.0 - i
I ' ~~GDP at Factor Cost --- Agriculture
- - Industiy - - - ManufacturingL_______ Services
Source: CS0.
2 Chapter 1. Recent Economic Developments
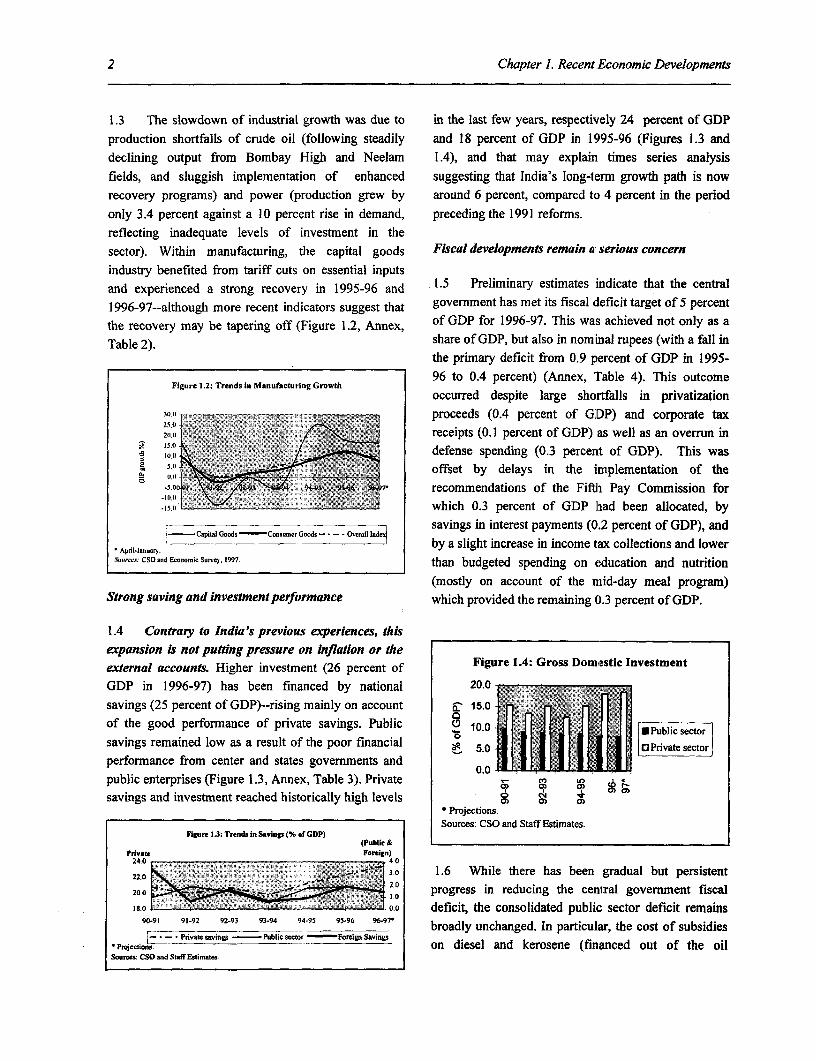
1.3 The slowdown of industrial growth was due to in the last few years, respectively 24 percent of GDPproduction shortfalls of crude oil (following steadily and 18 percent of GDP in 1995-96 (Figures 1.3 anddeclining output from Bombay High and Neelam 1.4), and that may explain times series analysisfields, and sluggish implementation of enhanced suggesting that India's long-term growth path is nowrecovery programs) and power (production grew by around 6 percent, compared to 4 percent in the periodonly 3.4 percent against a 10 percent rise in demand, preceding the 1991 reforms.reflecting inadequate levels of investment in thesector). Within manufacturing, the capital goods Fiscal developments remain a serious concernindustry benefited from tariff cuts on essential inputsand experienced a strong recovery in 1995-96 and 1.5 Preliminary estimates indicate that the central1996-97--although more recent indicators suggest that government has met its fiscal deficit target of 5 percentthe recovery may be tapering off (Figure 1.2, Annex, of GDP for 1996-97. This was achieved not only as aTable 2). share of GDP, but also in nominal rupees (with a fall in
the primary deficit from 0.9 percent of GDP in 1995-96 to 0.4 percent) (Annex, Table 4). This outcome
Figure 1.2: Trends in Manufacturing Growthoccurred despite large shortfalls in privatization
30.11 L proceeds (0.4 percent of GIDP) and corporate tax20A ~~~~~~~~~~receipts (0.1 percent of GDP) as well as an overrun in
MO ,,,,, 15defense spending (0.3 percent of GDP). This was(0 ~~~~~~~~~offset by delays in the implementation of the
;,,,, iM, X e iii ,7- recommendations of the Fifth Pay Commission for-150 =l S Swhich 0.3 percent of GDP had been allocated, by--Capital (loads Consomcr (loads - . - .savings in interest payments (0.2 percent of GDP), ande-CopitalGoods-ConnuncrOood--Ocalde
* ApdI-Ioooc by a slight increase in income tax collections and lowerC,os CSOand Econotic Sun 1997 than budgeted spending on education and nutrition
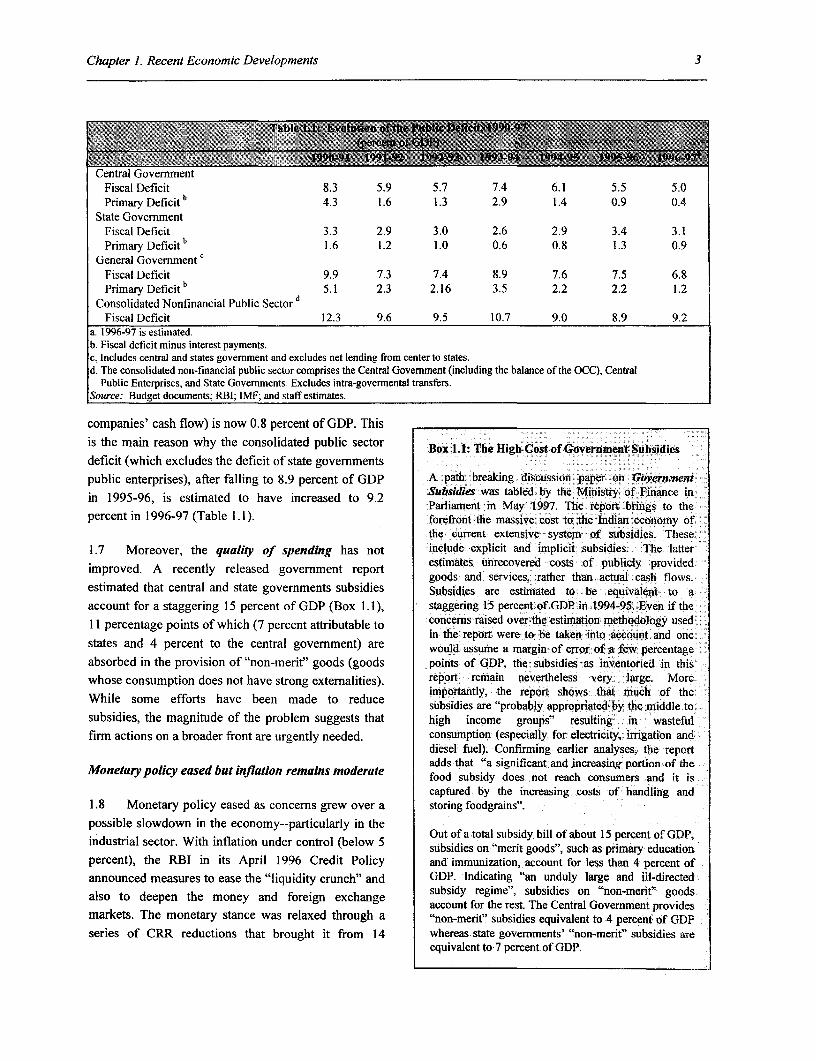
(mostly on account of the nlid-day meal program)Strong saving and investment performance which provided the remaining 0.3 percent of GDP.
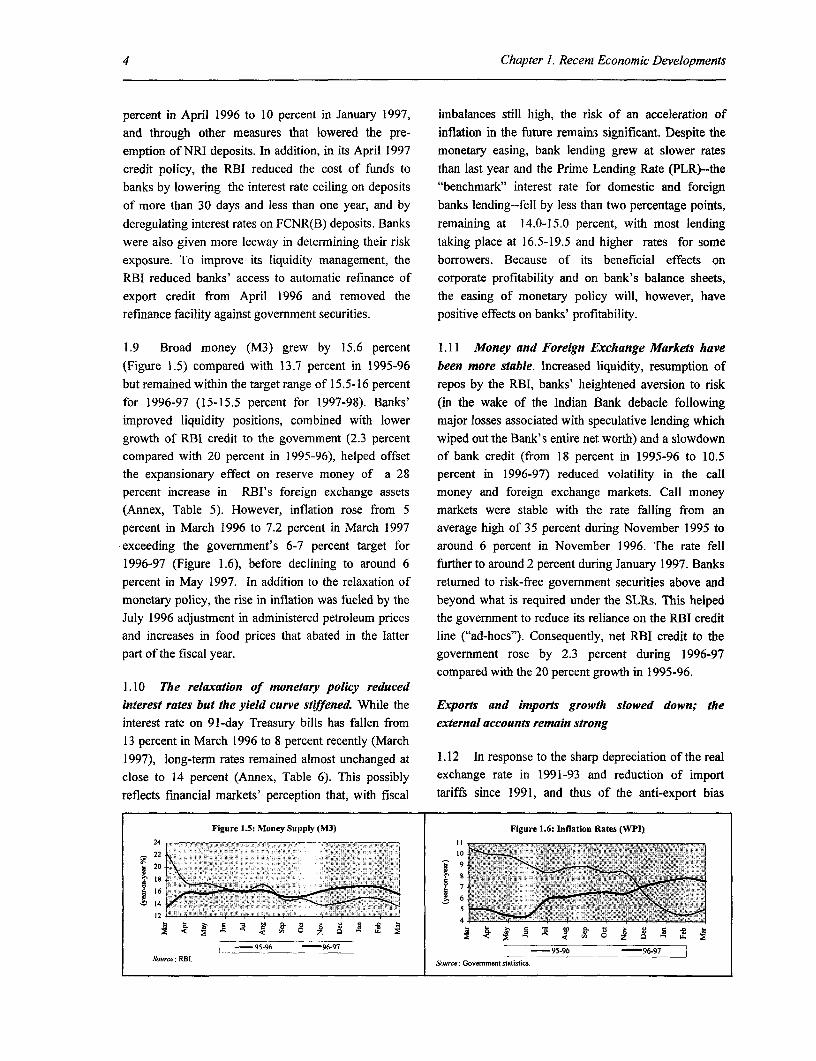
1.4 Contrary to India's previous experiences, thisexpansion is not putting pressure on inflation or theexternal accounts. Higher investment (26 percent of Figure 1.4: Gross Domiestic InvestmentGDP in 1996-97) has been financed by national 20.0savings (25 percent of GDP)--rising mainly on account a 2 o 7 7 7fl0of the good performance of private savings. Public % 10.0 l U Public sector
savings remained low as a result of the poor financial a 50 III 1I I 0 Privatesector
performance from center and states governments and o.0 :Privat e seoL0.0
public enterprises (Figure 1.3, Annex, Table 3). Private . °> savings and investment reached historically high levels C co
* Projections.Sources: CSO and Staff Estimates.
Figure 1.3: Trends in Savings (% of GDP) lI ~~~~~~~~~~~~~~~~~~(Public &I
Prvate Foren)24.0 4.022.0 3.0 1.6 While there has been gradual but persistent
2.020.0 2 0 progress in reducing the central government fiscal18.- - . .0 deficit, the consolidated public sector deficit remains
90l91 91.92 92-93 93-94 94-95 95-96 broadly unchanged. In particular, the cost of subsidies; = *- Private savings - Public sector Foreip Savings
Projections.- on diesel and kerosene (financed out of the oilSources: CSO and StaffEstimates.
Chapter 1. Recent Economic Developments 3
Central GovernmentFiscal Deficit 8.3 5.9 5.7 7.4 6.1 5.5 5.0Primary Deficitb 4.3 1.6 1.3 2.9 1.4 0.9 0.4
State GoveNnmentFiscal Deficit 3.3 2.9 3.0 2.6 2.9 3.4 3.1Primary Deficit b 1.6 1.2 1.0 0.6 0.8 1.3 0.9
General Government'cFiscal Deficit 9.9 7.3 7.4 8.9 7.6 7.5 6.8Primary Deficit b d . 2.3 2.16 3.5 2.2 2.2 1.2
Consolidated Nonfinancial Public SectordFiscal Deficit 12.3 9.6 9.5 10.7 9.0 8.9 9.2
a. 1996-97 is estimated.b. Fiscal deficit minus interest payments.c. Includes central and states govemment and excludes net lending from center to states.d. The consolidated non-financial public sector comprises the Central Govemment (including the balance of the OCC), Central
Public Enterprises, and State Govemments. Excludes intra-govermental transfers.Source: Budget documents; RBI; IMF; and staff estimates.
companies' cash flow) is now 0.8 percent of GDP. This
is the main reason why the consolidated public sector Box 1.1: The High Cost of Government Subsidiesdeficit (which excludes the deficit of state governmentspublic enterprises), after falling to 8.9 percent of GDP A path breaking discussion paper on Governmentin 1995-96, is estimated to have increased to 9.2 Subsities was tabled by the Ministry of Finance inParliament in May 1997. The report brings to thepercent in 1996-97 (Table 1.1). forefront the massive cost to the Indian economy of
the current extensive system of subsidies. These1.7 Moreover, the quality of spending has not include explicit and implicit subsidies. The latter
improveyreleased goverunment report estimates unrecovered costs of publicly providedgoods and services, rather than actual cash flows.
estimated that central and state governments subsidies Subsidies are estimated to be equivalent to aaccount for a staggering 15 percent of GDP (Box 1.1), staggering 15 percent of GDP in 1994-95. Even if the11 percentage points of which (7 percent attributable to concerns raised over the estimation methodology used
in the report were to be taken into account and onestates and 4 percent to the central government) are would assume a margin of error of a few percentageabsorbed in the provision of "non-merit" goods (goods points of GDP. the subsidies as inventoried in thiswhose consumption does not have strong externalities). report remain nevertheless very large. More
importantly, the report shows that much of theWhile some efforts have been made to reduce subsidies are "probably appropriated by the middle tosubsidies, the magnitude of the problem suggests that high income groups" resulting in wastefulfirm actions on a broader front are urgently needed. consumption (especially for electricity, irrigation and
diesel fuel). Confirming earlier analyses, the reportadds that "a significant and increasing portion of the
Monetary policy eased but inflation remains moderate food subsidy does not reach consumers and it iscaptured by the increasing costs of handling and
1.8 Monetary policy eased as concerns grew over a storing foodgrains".possible slowdown in the economy--particularly in the
Out of a total subsidy bill of about 15 percent of GDP,industrial sector. With inflation under control (below 5 subsidies on "merit goods", such as primary educationpercent), the RBI in its April 1996 Credit Policy and immunization, account for less than 4 percent ofannounced measures to ease the "liquidity crunch" and GDP. Indicating "an unduly large and ill-directed
subsidy regime", subsidies on "non-merit" goodsalso to deepen the money and foreign exchange account for the rest. The Central Government providesmarkets. The monetary stance was relaxed through a "non-merif' subsidies equivalent to 4 percent of GDPseries of CRR reductions that brought it from 14 whereas state governments' "non-merit" subsidies are
equivalent to 7 percent of GDP.
4 Chapter 1. Recent Economic Developments
percent in April 1996 to 10 percent in January 1997, imbalances still high, the risk of an acceleration ofand through other measures that lowered the pre- inflation in the future remains significant. Despite theemption of NRI deposits. In addition, in its April 1997 monetary easing, bank lending grew at slower ratescredit policy, the RBI reduced the cost of funds to than last year and the Prime ]Lending Rate (PLR)--thebanks by lowering the interest rate ceiling on deposits "benchmark" interest rate for domestic and foreignof more than 30 days and less than one year, and by banks lending--fell by less than two percentage points,deregulating interest rates on FCNR(B) deposits. Banks remaining at 14.0-15.0 percent, with most lendingwere also given more leeway in determining their risk taking place at 16.5-19.5 and higher rates for someexposure. To improve its liquidity management, the borrowers. Because of its beneficial effects onRBI reduced banks' access to automatic refinance of corporate profitability and on bank's balance sheets,export credit from April 1996 and removed the the easing of monetary policy will, however, haverefinance facility against government securities. positive effects on banks' profitability.
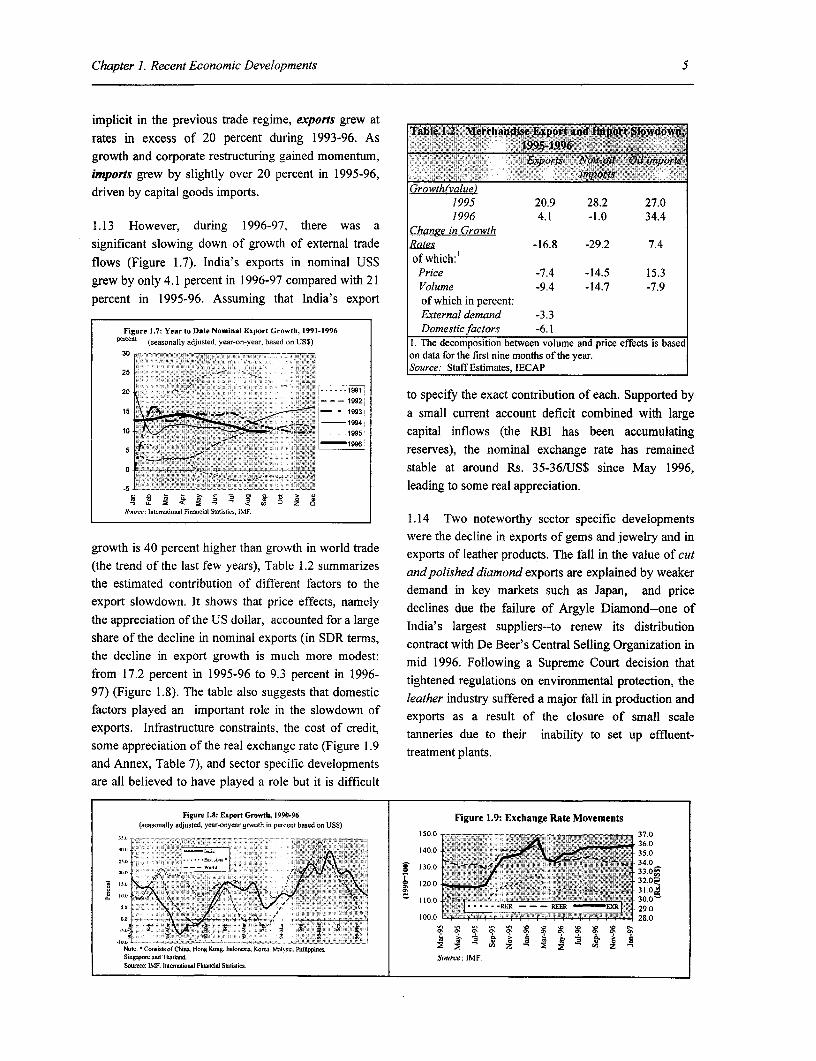
1.9 Broad money (M3) grew by 15.6 percent 1.11 Money and Foreign Exchange Markets have
(Figure 1.5) compared with 13.7 percent in 1995-96 been more stable. Increased liquidity, resumption ofbut remained within the target range of 15.5-16 percent repos by the RBI, banks' heiglhtened aversion to riskfor 1996-97 (15-15.5 percent for 1997-98). Banks' (in the wake of the Indian B3ank debacle followingimproved liquidity positions, combined with lower major losses associated with speculative lending whichgrowth of RBI credit to the government (2.3 percent wiped out the Bank's entire net worth) and a slowdowncompared with 20 percent in 1995-96), helped offset of bank credit (from 18 percent in 1995-96 to 10.5the expansionary effect on reserve money of a 28 percent in 1996-97) reduced' volatility in the callpercent increase in RBI's foreign exchange assets money and foreign exchange markets. Call money(Annex, Table 5). However, inflation rose from 5 markets were stable with the rate falling from anpercent in March 1996 to 7.2 percent in March 1997 average high of 35 percent during November 1995 toexceeding the government's 6-7 percent target for around 6 percent in November 1996. The rate fell1996-97 (Figure 1.6), before declining to around 6 further to around 2 percent during January 1997. Bankspercent in May 1997. In addition to the relaxation of returned to risk-free government securities above andmonetary policy, the rise in inflation was fueled by the beyond what is required under the SLRs. This helpedJuly 1996 adjustment in administered petroleum prices the government to reduce its reliance on the RBI creditand increases in food prices that abated in the latter line ("ad-hocs"). Consequently, net RBI credit to thepart of the fiscal year. government rose by 2.3 percent during 1996-97
compared with the 20 percent growth in 1995-96.1.10 The relaxation of monetary policy reducedinterest rates but the yield curve stiffened. While the Exports and imports growth slowed down; theinterest rate on 91-day Treasury bills has fallen from external accounts remain strong13 percent in March 1996 to 8 percent recently (March1997), long-term rates remained almost unchanged at 1.12 In response to the sharp depreciation of the realclose to 14 percent (Annex, Table 6). This possibly exchange rate in 1991-93 and reduction of importreflects financial markets' perception that, with fiscal tariffs since 1991, and thus of the anti-export bias
Figure 1.5: Money Supply (M3) Figure 1.6: Inflation Rates (WPI)
24 ' ^22 14
14 Z)~~~~~~~~~~~~~~~~~~
@ = 5 s X g~~z O 5 a . 86 = t; >f
[ -9S 96 -96-97 1 < -95-96 -96-97.S-: RBI. &,ursc: Govemment statistics.
Chapter 1. Recent Economic Developments 5
implicit in the previous trade regime, exports grew atTable 1.2- Merchandise Export and fIporf Sowdowpvrates in excess of 20 percent during 1993-96. As i9954996
growth and corporate restructuring gained momentum, Exports on_-oi-l ;;ail mportsimports grew by slightly over 20 percent in 1995-96, importsdriven by capital goods imports. Growth(value)
1995 20.9 28.2 27.01996 4.1 -1.0 34.4
1.13 However, during 1996-97, there was a Change in Growthsignificant slowing down of growth of external trade Rates -16.8 -29.2 7.4
flows (Figure 1.7). India's exports in nominal US$ of which:'grew by only 4.1 percent in 1996-97 compared with 21 Volume -9.4 -14.7 -7.9percent in 1995-96. Assuming that India's export of which in percent:
External demand -3.3Figure 1.7: Year to Date Nominal Export Growth, 1991-1996 Domestic factors -6.1
Pereet (seasonally adjusted, year-on-year. based on USS) 1. The decomposition between volume and price effects is based30 . . I on data for the first nine months of the year.25 1 Source: Staff Estimates, IECAP
20 - {* ; - i -- 1992 to specify the exact contribution of each. Supported by
1 5 -:- .' ~ - 1993 a small current account deficit combined with large
- 1995 capital inflows (the RBI has been accumulatings ,t-% . >,- ; lreserves), the nominal exchange rate has remained
c _ - ;, stable at around Rs. 35-36/US$ since May 1996,.5 ..: ....... ... .: .. : l leading to some real appreciation.
-L; tio n ' 'F 0 z aS5airte Itmatenoinoal Financial Statistics. IMF.____Fin____ i___ 1___St___i _____i-___IMF.____ 1.14 Two noteworthy sector specific developments
were the decline in exports of gems and jewelry and ingrowth is 40 percent higher than growth in world trade exports of leather products. The fall in the value of cut(the trend of the last few years), Table 1.2 summarizes and polished diamond exports are explained by weakerthe estimated contribution of different factors to the demand in key markets such as Japan, and priceexport slowdown. It shows that price effects, namely declines due the failure of Argyle Diamond--one ofthe appreciation of the US dollar, accounted for a large India's largest suppliers--to renew its distributionshare of the decline in nominal exports (in SDR terms, contract with De Beer's Central Selling Organization inthe decline in export growth is much more modest: mid 1996. Following a Supreme Court decision thatfrom 17.2 percent in 1995-96 to 9.3 percent in 1996- tightened regulations on environmental protection, the97) (Figure 1.8). The table also suggests that domestic leather industry suffered a major fall in production andfactors played an important role in the slowdown of exports as a result of the closure of small scaleexports. Infrastructure constraints, the cost of credit, tanneries due to their inability to set up effluent-some appreciation of the real exchange rate (Figure 1.9 treatment plants.and Annex, Table 7), and sector specific developmentsare all believed to have played a role but it is difficult
Figure 1.8: Export Growth, 1990-96 Figure 1.9: Exchange Rate Movements(seaon.ally adjusted, year-onyear grwoth in percent based on US$)
150.0 37.036.0
140.0 35.0
130.0 ~~~~~~~~~~~~~34.033.Oa
25.U >t __vEw-,,wa1 < S-1300- < -6- < ---- i -32.04% ~~~~~~~~~~~~s31.0~
ffi 1>0 ts, M \ ,s, 5 f s4\ >*t, e } _ ] l0 0 >30.0_s.o \.5 * ' :\ . t -- RER - - -REER EXR |29.0
100.0 28.0
Note: * Cosr iros of Cl Hons KooH . onoKn sig . Kart. M-. IsM . Pth,i`pFI es Z A ZS.ir".nw onsd Ttoai. Sotarce: IMF.So-rece IMF. teteiatiosil Fbraciial Sato. s1s.
6 Chapter 1. Recent Economic Developments
1.15 The growth of the dollar value of imports and services and economic regulator, is one of India'sduring 1995-1996 reflected the fluctuations of the US most fundamental structural changes sincedollar. After growing by 30 percent in 1995-96, Independence. The liberalization of the economy hasimports rose by only 7.4 percent in dollar terms over opened to the private sector areas previously theApril to December 1996-97, in spite of a 34 percent exclusive domain of the public sector--such as heavyincrease in oil imports. Non-oil imports actually manufacturing, banking., civil aviation,declined by I percent due to a fall in capital goods telecommunications, power generation andimports. distribution, ports, and roads. Equally important, the
liberalization of the economy has reduced distortions1.16 In 1996-97, increased private transfers helped and increased external and internal competition.offset a rise in the trade deficit (by US$500 million) Agriculture's terms of trade have improved. Led byand kept the current account deficit at 1.1 percent of commercial crops, agricultural commodities are one ofGDP in 1996-97, from 1.8 percent in 1995-96--well India's fastest growing exports. In manufacturing,below what the government considers sustainable (2 Indian firms have restructured and upgraded theirpercent). industrial basis, often throug;h alliances with foreign
firms. There is growing presence of multi-nationals.1.17 The capital account remains strong. As in Indicative of improved product quality, the number of
previous years, foreign direct investment and portfolio Indian firms receiving IS09000 certifications hasinvestment flows contributed to a large surplus in the witnessed a ten-fold increase.capital account. During 1996-97, India received privateinflows of US$5.4 billion, about 22 percent higher than 1.19 The restructuring of thie automobile industry is
their corresponding level in 1995-96 (Figure 1I.10, an example of how large Indian firms have respondedAnnex, Table 8). These positive developments in the to liberalization. To face international competition,external accounts translated into foreign currency they had to bring their distribution and manufacturingreserves of US$22.4 billion at the end of March 1997-- up to world standards. To do so, firms in the sectorthat is six months of imports (Annex, Table 9). undertook joint ventures with foreign firms and began
a process of internal re-engineering to improve
Figure 1.10: Foreign Investment productivity, for example by moving from asequential/functional mass production processes to
6t)n(( -; r;C7;0;K;7 0 0 ;- team-based structure. In a particular case, a new laborS 4000 agreement was signed, workers were reassigned and
'2 000)j generous voluntary separation schemes offered to2nn; _ ; ? 1 s reduce staff. Labor productivity more than doubled.
Yo-91 91-92 92-93 93-94 94-95 95-96 9697 1.20 Similar developments have taken place in thebanking system, where the entry of private banks andBFDI *FII DEur-issuesIGDR nJ ,
; rce:Min0istn of FiRome. Non Bank Financial Companies (NBFCs) in a sectorstill dominated by public banks (which control 85
B. Highlights of Structural Reforms percent of the sector's assets) forced the latter tosignificantly improve their seruices. Most public banks
Increase in competition have retained the services of management consulting
firms to restructure operations, cut costs, expand the1.18 Underlying positive developments in the real menu of services and improve: profitability (Box 1.2).economy are important structural transformations. Moreover, the opening up of bank capital to privateThe declining role of the public sector since the start of shareholders and their participation in the banks boards
the reform program in 1991, both as producer of goods have contributed to improve governance (Box 1.3).
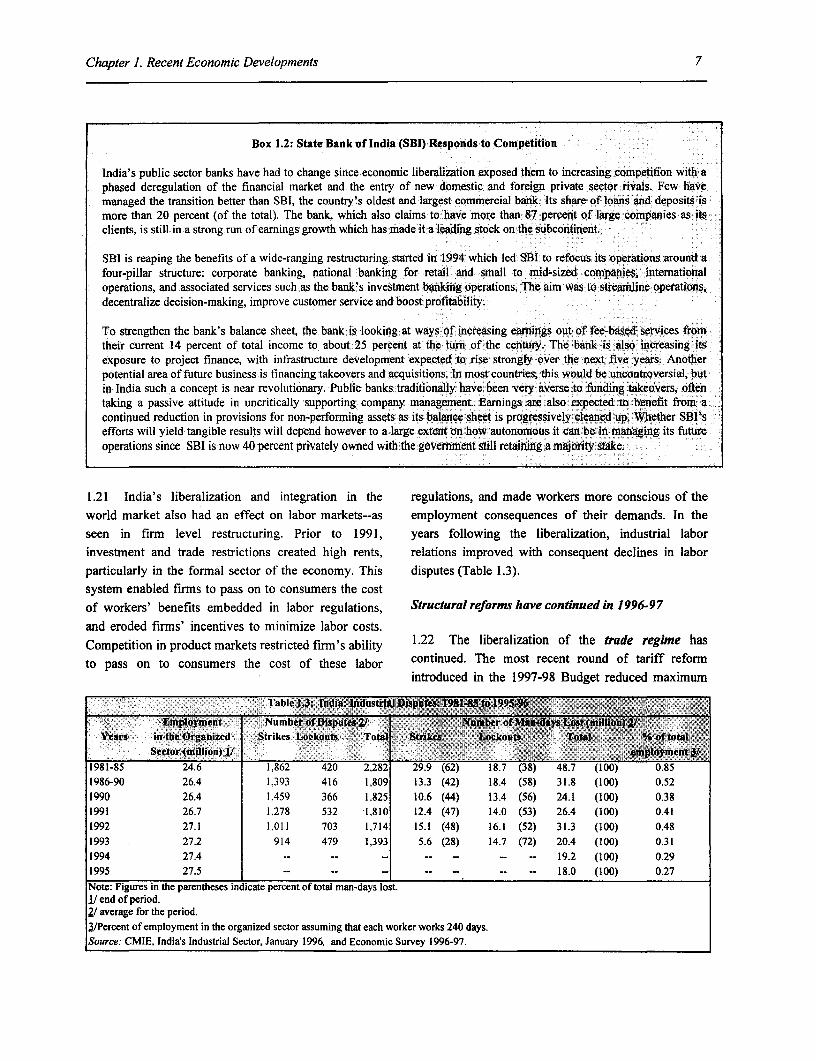
Chapter 1. Recent Economic Developments 7
Box 1.2: State Bank of India (SBI) Responds to Competition
India's public sector banks have had to change since economic liberalization exposed them to increasing competition with aphased deregulation of the financial market and the entry of new domestic and foreign private sector rivals. Few havemanaged the transition better than SBI, the country's oldest and largest commercial bank. Its share of loans and deposits ismore than 20 percent (of the total). The bank, which also claims to have more than 87 percent of large companies as itsclients, is still in a strong run of earnings growth which has made it a leading stock on the subcontinent.
SBI is reaping the benefits of a wide-ranging restructuring started in 1994 which led SBI to refocus its operations around afour-pillar structure: corporate banking, national banking for retail and small to mid-sized companies, internationaloperations, and associated services such as the bank's investment banking operations. The aim was to streamline operations,decentralize decision-making, improve customer service and boost profitability.
To strengthen the bank's balance sheet, the bank is looking at ways of increasing earnings out of fee-based services fromtheir current 14 percent of total income to about 25 percent at the turn of the century. The bank is also increasing itsexposure to project finance, with infrastructure development expected to rise strongly over the next five years. Anotherpotential area of future business is financing takeovers and acquisitions. In most countries, this would be uncontroversial, butin India such a concept is near revolutionary. Public banks traditionally have been very averse to funding takeovers, oftentaking a passive attitude in uncritically supporting company management. Earnings are also expected to benefit from acontinued reduction in provisions for non-performing assets as its balance sheet is progressively cleaned up. Whether SBI'sefforts will yield tangible results will depend however to a large extent on how autonomous it can be in managing its futureoperations since SBI is now 40 percent privately owned with the govermment still retaining a majority stake.
1.21 India's liberalization and integration in the regulations, and made workers more conscious of the
world market also had an effect on labor markets--as employment consequences of their demands. In the
seen in firm level restructuring. Prior to 1991, years following the liberalization, industrial labor
investment and trade restrictions created high rents, relations improved with consequent declines in labor
particularly in the formal sector of the economy. This disputes (Table 1.3).
system enabled firms to pass on to consumers the costof workers' benefits embedded in labor regulations, Structural reforms have continued in 1996-97and eroded firms' incentives to minimize labor costs.Competition in product markets restricted firm's ability 1.22 The liberalization of the trade regine hasto pass on to consumers the cost of these labor continued. The most recent round of tariff reform
introduced in the 1997-98 Budget reduced maximum
Table 1.3: India.: ldustrllDisputes.t98 45tEl995$6
-Employment Number of DisputesZ/ ? un0berof1i4iySt(million) i1Years inthe.Organized Strikes Lockouts Total Strikes L]ckouts Total tof total
Sector (million) 1/ em$oynentt1981-85 24.6 1,862 420 2,282 29.9 (62) 18.7 (38) 48.7 (100) 0.85
1986-90 26.4 1,393 416 1,809 13.3 (42) 18.4 (58) 31.8 (100) 0.521990 26.4 1,459 366 1.825 10.6 (44) 13.4 (56) 24.1 (100) 0.381991 26.7 1,278 532 1.810 12.4 (47) 14.0 (53) 26.4 (100) 0.41
1992 27.1 1,011 703 1,714 15.1 (48) 16.1 (52) 31.3 (100) 0.48
1993 27.2 914 479 1,393 5.6 (28) 14.7 (72) 20.4 (100) 0.311994 27.4 -- -- - -- 19.2 (100) 0.29
1995 27.5 -- 18.0 (100) 0.27
Note: Figures in the parentheses indicate percent of total man-days lost.1/ end of period._/ average for the period.3/Percent of employment in the organized sector assuming that each worker works 240 days.Source: CMIE. India's Industrial Sector, January 1996, and Economic Survey 1996-97.
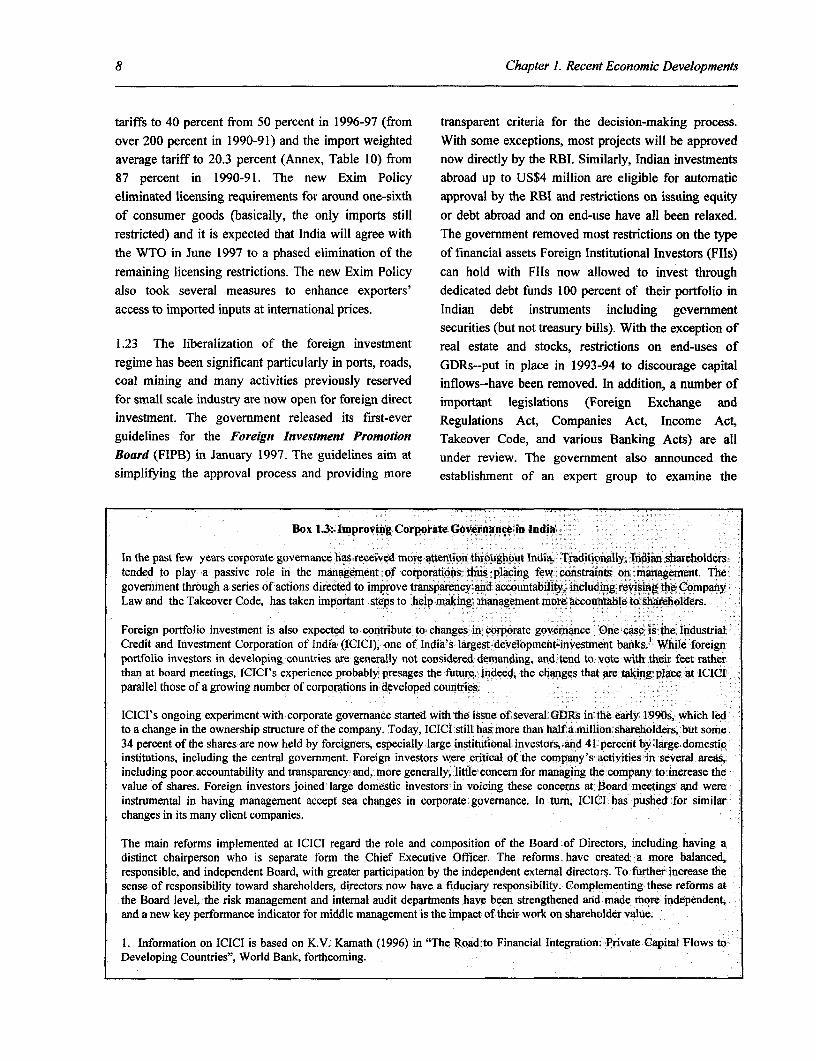
8 Chapter 1. Recent Economic Developments
tariffs to 40 percent from 50 percent in 1996-97 (from transparent criteria for the decision-making process.
over 200 percent in 1990-91) and the import weighted With some exceptions, most projects will be approvedaverage tariff to 20.3 percent (Annex, Table 10) from now directly by the RBI. Similarly, Indian investments
87 percent in 1990-91. The new Exim Policy abroad up to US$4 million are eligible for automatic
eliminated licensing requirements for around one-sixth approval by the RBI and restrictions on issuing equity
of consumer goods (basically, the only imports still or debt abroad and on end-use have all been relaxed.restricted) and it is expected that India will agree with The government removed most restrictions on the type
the WTO in June 1997 to a phased elimination of the of financial assets Foreign Institutional Investors (Flls)
remaining licensing restrictions. The new Exim Policy can hold with FIls now allowed to invest throughalso took several measures to enhance exporters' dedicated debt funds 100 percent of their portfolio in
access to imported inputs at international prices. Indian debt instruments including government
securities (but not treasury bills). With the exception of1.23 The liberalization of the foreign investment real estate and stocks, restrictions on end-uses of
regime has been significant particularly in ports, roads, GDRs--put in place in 1993-94 to discourage capitalcoal mining and many activities previously reserved inflows--have been removed. In addition, a number offor small scale industry are now open for foreign direct important legislations (Foreign Exchange andinvestment. The government released its first-ever Regulations Act, Companies Act, Income Act,guidelines for the Foreign Investment Promotion Takeover Code, and various Banking Acts) are allBoard (FIPB) in January 1997. The guidelines aim at under review. The government also announced thesimplifying the approval process and providing more establishment of an expert group to examine the
Box 1.3: lmproving Corporate Governance. in India..
In the past few years corporate governance has received moreattenionthroughout India. TraditionallyW, Indian shareholders. tended to play a passive role in the management of corporations t placing few' constraints on imanagement. Thet'government through a series of actions directed to improve transparencpyand accountabiity, including revising the CompanyLaw and the Takeover Code, has taken important steps to help making management more accouintableto shareholders.i
Foreign portfolio investment is also expected to contribute to changesjin corporate governance Onetcase 'is the IndustrialCredit and Investment Corporation of India (ICICI), one of India's largest development-investmernt banks.' While foreignportfolio investors in developing countries are generally not considered demanding, and tend to vote with their feet ratherthan at board meetings, ICICI's experience probably presages the future. Indeed, the changes that are taking place at ICICIparallel those of a growing number of corporations in developed countries.
ICICI's ongoing experiment with corporate governance started with the issue of several GDRs inf the early .1990s, which ledto a change in the ownership structure of the company. Today, ICICI still has more than halfa million shareholders but some.34 percent of the shares are now held by foreigners, especially large institutional investors, and 41 percent by large domesticinstitutions, including the central govemment. Foreign investors were critical of the company's activities tin several areas,including poor accountability and transparency and, more generally, little concern for managing the company to-inerease thevalue of shares. Foreign investors joined large domestic investors in voicing these concerns at Board meetings and wereinstrumental in having management accept sea changes in corporate governance. In tum, ICIC'I has pushed for similar,changes in its many client companies.
The main reforms implemented at ICICI regard the role and composition of the Board of Directors, including having adistinct chairperson who is separate form the Chief Executive Officer. The reforms have created a more balanced,responsible, and independent Board, with greater participation by the independent external directors. To further increase thesense of responsibility toward shareholders, directors now have a fiduciary responsibility. Complementing these reforms atthe Board level, the risk management and internal audit departments. have been strengthened and made more independent,and a new key performance indicator for middle management is the impact of their work on shareholder value.
1. Information on ICICI is based on K.V. Kamath (1996) in "The Road-to Financial Integration: Private Capital Flows toDeveloping Countries", World Bank, forthcoming.
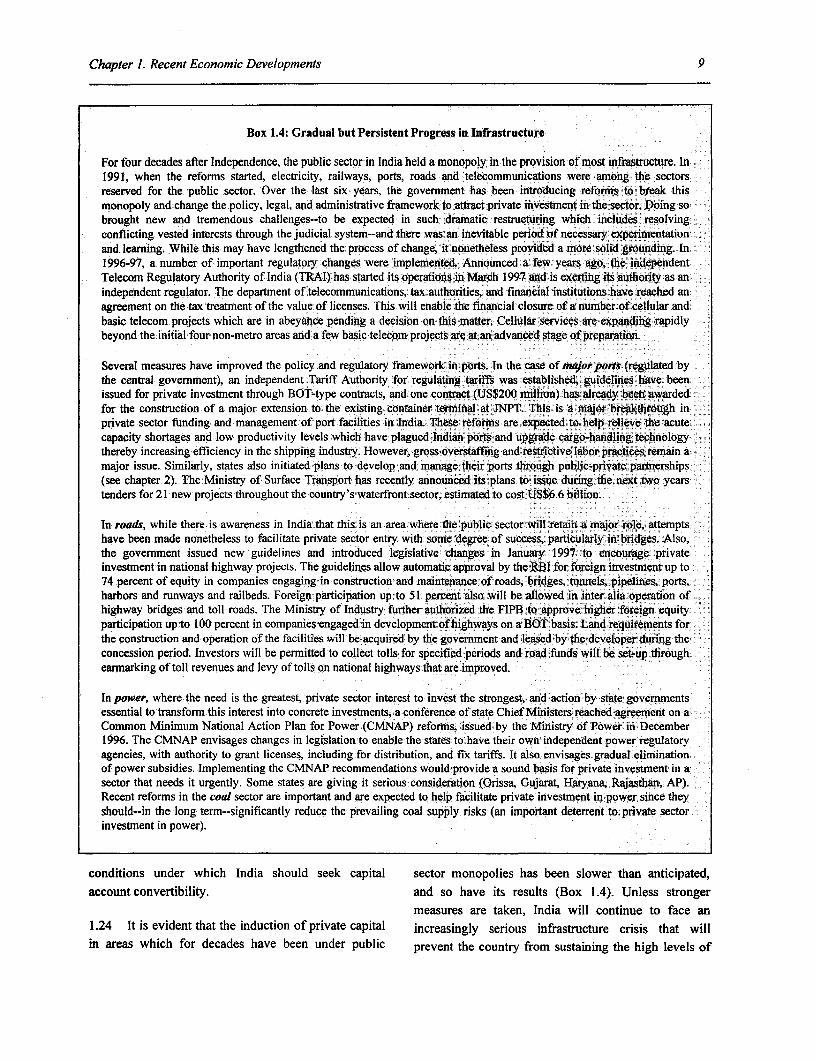
Chapter 1. Recent Economic Developments 9
Box 1.4: Gradual but Persistent Progress in Infrastructure
For four decades after Independence, the public sector in India held a monopoly in the provision of most infrastructure. In1991, when the reforms started, electricity, railways, ports, roads and telecommunications were among the sectorsreserved for the public sector. Over the last six years, the government has been introducing reforms to: break thismonopoly and change the policy, legal, and administrative framework to attract private investment in the sector. Doing sobrought new and tremendous challenges--to be expected in such dramatic restructuring which includes resolvingconflicting vested interests through the judicial system--and there was an inevitable period of necessary experimentationand learning. While this may have lengthened the process of change, it nonetheless provided a more solid grounding. In1996-97, a number of important regulatory changes were implemented. Announced a few years ago, the independentTelecom Regulatory Authority of India (TRAI) has started its operations in March 1997 and is exerting its authority as anindependent regulator. The department of telecommunications, tax authorities, and financial institutions have reached anagreement on the tax treatment of the value of licenses. This will enable the financial closure of a number.of cellular andbasic telecom projects which are in abeyance pending a decision on this matter. Cellular services are expanding rapidlybeyond the initial four non-metro areas and a few basic telecom projects are at.an advanced stage of preparation.
Several measures have improved the policy and regulatory framework in ports. In the case of major ports (regulated bythe central government), an independent Tariff Authority for regulating tariffs was established, guidelines have beenissued for private investment through BOT-type contracts, and one contract (US$200 million) has already been.awardedfor the construction of a major extension to the existing container terminal at JNPT. This is a-major breakthrough inprivate sector funding and management of port facilities in India. These reforms are expected to help relieve the acutecapacity shortages and low productivity levels which have plagued Indian ports and upgrade cargo-handling, technologythereby increasing efficiency in the shipping industry. However, gross overstaffing and restnctive labor practices remain amajor issue. Similarly, states also initiated plans to develop and manage their ports through public-private partnerships(see chapter 2). The Ministry of Surface Transport has recently announced its plans to issue during the next two yearstenders for 21 new projects throughout the country's waterfront sector, estimated-to cost US$6.6 billion.
In roads, while there is awareness in India that this is an area where-the public sector will retain a major role, attemptshave been made nonetheless to facilitate private sector entry with some degree of success, particularly in bridges. Also,the government issued new guidelines and introduced legislative changes in January 1997 to encourage privateinvestment in national highway projects. The guidelines allow automatic approval by the RBI for foreign investment up to74 percent of equity in companies engaging in construction and maintenance of roads, bridges, tunnels, pipelines, ports,harbors and runways and railbeds. Foreign participation up. to 51 percent also will be allowed in inter alia operation ofhighway bridges and toll roads. The Ministry of Industry further authorized the FIPB to approve higher foreign equityparticipation up to 100 percent in companies engaged in development of highways on a BOT basis. Land requirements forthe construction and operation of the facilities will be acquired by the government and leased by the-developer during theconcession period. Investors will be permitted to collect tolls for specified periods and road funds will be set-up throughearmarking of toll revenues and levy of tolls on national highways-that are improved.
In power, where the need is the greatest, private sector interest to invest the strongest, and action by state governmentsessential to transform this interest into concrete investments, a conference of state Chief Ministers reached agreement on aCommon Minimum National Action Plan for Power (CMNAP) reforms, issued by the Ministry of Power in December1996. The CMNAP envisages changes in legislation to enable the states to: have their own independent power regulatoryagencies, with authority to grant licenses, including for distribution, and fix tariffs. It also envisages gradual eliminationof power subsidies. Implementing the CMNAP recommendations would provide a sound basis for private investment in asector that needs it urgently. Some states are giving it serious consideration (Orissa, Gujarat, Haryana, Rajasthan, AP).Recent reforms in the coal sector are important and are expected to help facilitate private investment in power since theyshould--in the long term--significantly reduce the prevailing coal supply risks (an important deterrent to private sectorinvestment in power).
conditions under which India should seek capital sector monopolies has been slower than anticipated,account convertibility. and so have its results (Box 1.4). Unless stronger
measures are taken, India will continue to face an1.24 It is evident that the induction of private capital increasingly serious infrastructure crisis that willin areas which for decades have been under public prevent the country from sustaining the high levels of
10 Chapter 1. Recent Economic Developments
Box 1.4: Gradual but Persistent Progress in Infrastructure (contd...)
In coal, private entry was extended in February 1997 to captive mines and ancillary activities while a decision wastaken to divest shares in Coal India's subsidiaries. The government also deregulated the prices and' distribution ofhigh-grade coal with the result that about 40 percent of prices remain administered; they are expectedto beo freed bythe year 2000. In the hydrocarbons subsector, reforms remain i insufficient and have not. succeeded in impr ovingthefinancial performance of public enterprises or generating any significant demand or investment; response. Privateinvestors remain concerned about distorted . pricing system, inadequate operational flexibility, potentialiunfaircompetition from public sector enterprises, lengthy delays in evaluating bids and lack oftransparencies in. the decisionmaking process, and the quality of acreage offered-which is of small size and poor quality; and for which.geologicalinformation is either inadequate or obsolete. -
The dramatic improvements witnessed in civil aviation since thereforms began could be erodedJ by the new; aviationpolicy which may lead to restrictions of :competition to protect. theidomestic government-owned airline. The newpolicy limits the capacity expansion of a: privateiiairline to 20 percentl of total additional capacity, does not allowequity participation by foreign airlines inmIndia'sidomestic private airines, although it perts.. 1upto: 40 ipercent iiforeign equity participation by non-airline equity investors. Thesecosts are expected to be further compounded bythenew airport policy which, while allowing foreign Investors. majorty 0quity in airports. construction-projects, limitsthem to a BOT rather than a BOO model. This change is. expecteda toseriously reduce the prospects for airportcapacity expansion to meet the growing demand of around. 12 percentper year over the next five tyears.
growth that the last few years have shown to be within 1.25 Finally, remarkably little progress has beenreach. For example, addressing the labor-related issues made in addressing the findamental policy andin ports would help ensure that the current strong institutional changes (most of which under the purviewprivate interest in investing there materializes. The of state authorities) needed to expand urbanstrong response to the JNPT tender was largely induced infrastructure and alleviate the tremendous problems
by the importance of this port for India's containerized of India's fast growing cities. iWater supply systems, an
trade, and the bidders were willing to accept unusual area of potentially considerable interest to the private
conditions--existing labor rules, and to charge for their sector, continue to be poorly managed by state-
services in local currency--and risks--even initial govermment institutions at a high cost to the economy.losses--because of JNPT's strategic position and the Similarly, progress in restructuring public enterprises
prospect, of potential gains in the long-run. It is has been slow. A report prepared by the Disinvestmentconceivable that participation in future tenders for new Commission has offered a menu of options for reform
port facilities elsewhere may be weak because of the of public enterprises including privatization but todate
inhibiting conditions set by government. Also, despite no concrete action has been taken..the attractiveness of such investments to the privatesector, it will be a complement to, but not a full 1.26 To liberalize the financial sector, thesubstitute for, investments by the Port Trusts or other governnent has pursued a very gradual two-pronged
public funding. In this context, corporatizing the Major strategy consisting of: (i) gradually relaxing controlsPort Trusts would help increase efficiency of existing that repress the market's ability to price risk and; (ii)
assets as well as raise public investment. International developing institutional infrastructure to manage a de-experience with port systems reform has repeatedly regulated financial market. In terms of reducing thisdemonstrated that divesting regulatory and institutional risk (the market's perception of macroeconomicresponsibility over ports to the local (state or instability due to the large fiscal deficit and banks'municipal) level leads to major productivity weak balance sheets), some progress was achieved thisimprovements due to induced competition. year with the RBI's move to indirect instruments for
monetary policy management and the reduction of thecentral government fiscal deficit by 0.5 percent of
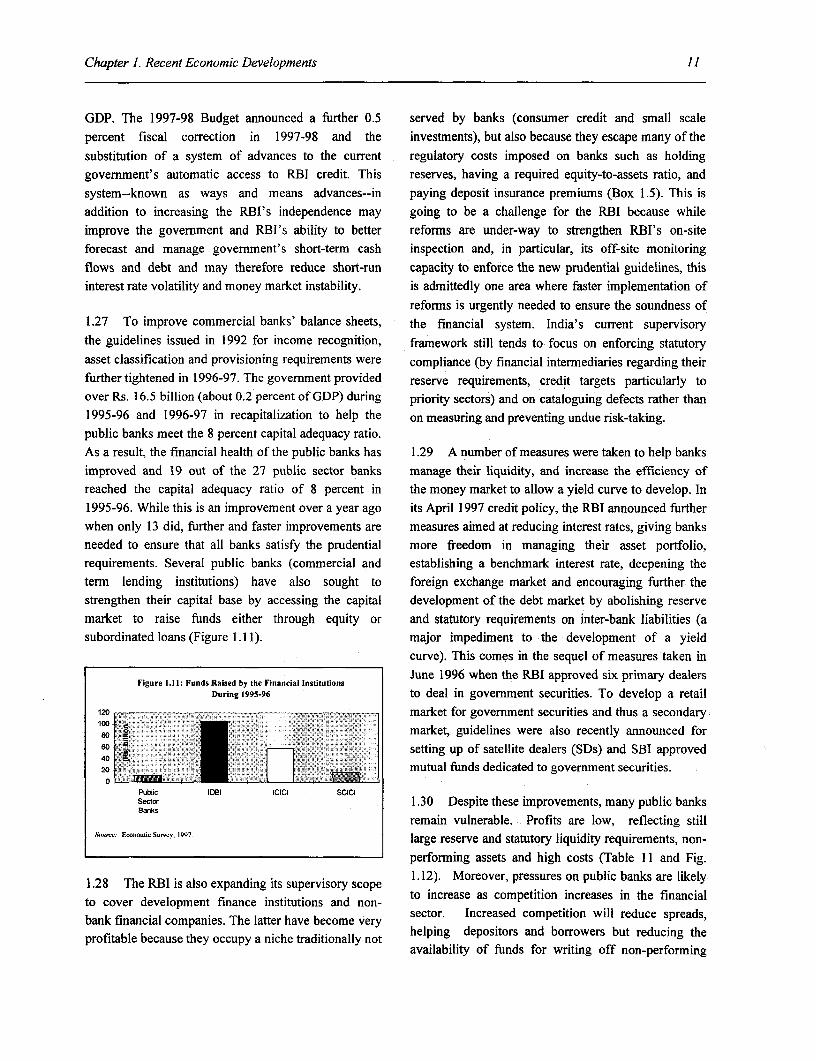
Chapter 1. Recent Economic Developments 11
GDP. The 1997-98 Budget announced a further 0.5 served by banks (consumer credit and small scalepercent fiscal correction in 1997-98 and the investments), but also because they escape many of the
substitution of a system of advances to the current regulatory costs imposed on banks such as holdinggovernment's automatic access to RBI credit. This reserves, having a required equity-to-assets ratio, andsystem--known as ways and means advances--in paying deposit insurance premiums (Box 1.5). This isaddition to increasing the RBI's independence may going to be a challenge for the RBI because while
improve the government and RBI's ability to better reforms are under-way to strengthen RBI's on-siteforecast and manage government's short-term cash inspection and, in particular, its off-site monitoring
flows and debt and may therefore reduce short-run capacity to enforce the new prudential guidelines, thisinterest rate volatility and money market instability. is admittedly one area where faster implementation of
reforms is urgently needed to ensure the soundness of1.27 To improve commercial banks' balance sheets, the financial system. India's current supervisorythe guidelines issued in 1992 for income recognition, framework still tends to focus on enforcing statutoryasset classification and provisioning requirements were compliance (by financial intermediaries regarding theirfurther tightened in 1996-97. The government provided reserve requirements, credit targets particularly toover Rs. 16.5 billion (about 0.2 percent of GDP) during priority sectors) and on cataloguing defects rather than1995-96 and 1996-97 in recapitalization to help the on measuring and preventing undue risk-taking.public banks meet the 8 percent capital adequacy ratio.As a result, the financial health of the public banks has 1.29 A number of measures were taken to help banks
improved and 19 out of the 27 public sector banks manage their liquidity, and increase the efficiency ofreached the capital adequacy ratio of 8 percent in the money market to allow a yield curve to develop. In1995-96. While this is an improvement over a year ago its April 1997 credit policy, the RBI announced furtherwhen only 13 did, further and faster improvements are measures aimed at reducing interest rates, giving banksneeded to ensure that all banks satisfy the prudential more freedom in managing their asset portfolio,requirements. Several public banks (commercial and establishing a benchmark interest rate, deepening theterm lending institutions) have also sought to foreign exchange market and encouraging further thestrengthen their capital base by accessing the capital development of the debt market by abolishing reservemarket to raise funds either through equity or and statutory requirements on inter-bank liabilities (asubordinated loans (Figure 1.11). major impediment to the development of a yield
curve). This comes in the sequel of measures taken inJune 1996 when the RBI approved six primary dealersFigure 1.1 1: Funds Raised by the Financial Institutions
During 1995-96 to deal in government securities. To develop a retail120 market for government securities and thus a secondary
100 market, guidelines were also recently announced for
e0 t : . - -- r | setting up of satellite dealers (SDs) and SBI approved20 mutual funds dedicated to government securities.
Public IDBI ICICI SCICISector 1.30 Despite these improvements, many public banksBanks
remain vulnerable. Profits are low, reflecting still.c,,.,,.: Eoononmio Surn> ls9- large reserve and statutory liquidity requirements, non-
performing assets and high costs (Table 11 and Fig.1.12). Moreover, pressures on public banks are likely1.28 The RB! is also expanding itS supervisory scope
to cover development finance institutions and non- to increase as competition increases in the financialsector. Increased competition will reduce spreads,
bank financial companies. The latter have become veryprofitable because they occupy a niche traditionally not helping depositors and borrowers but reducing the
availability of funds for writing off non-performing
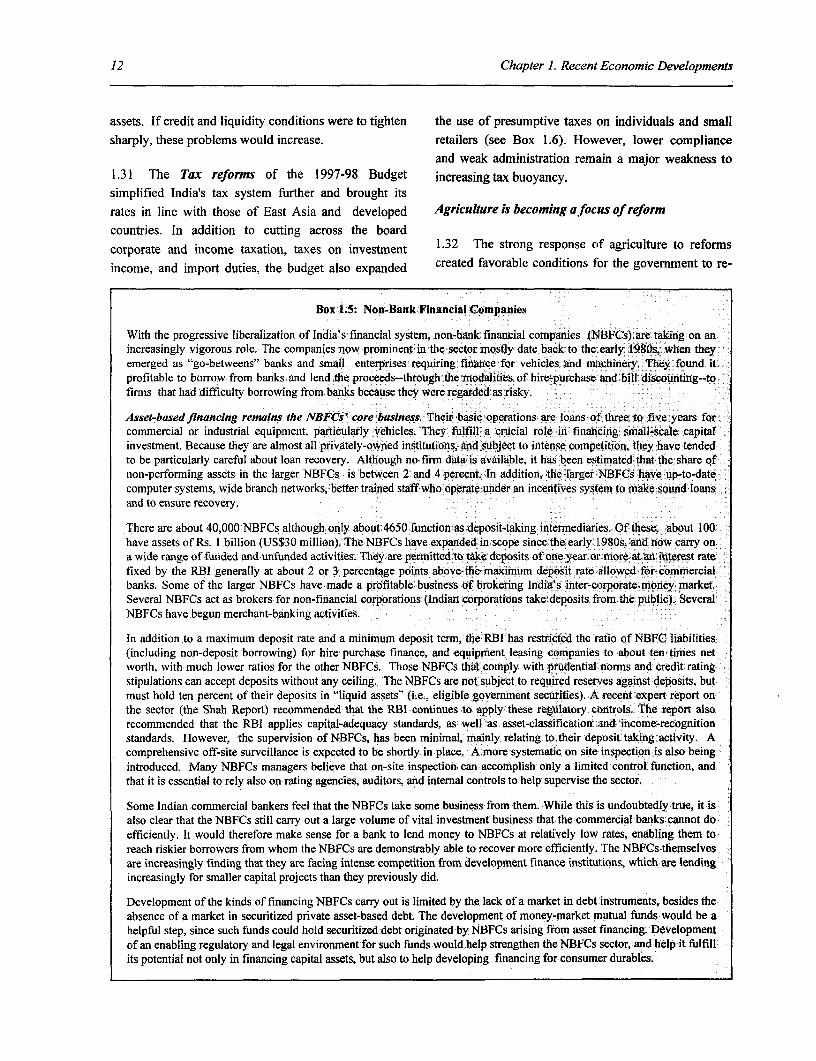
12 Chapter 1. Recent Economic Developments
assets. If credit and liquidity conditions were to tighten the use of presumptive taxes on individuals and small
sharply, these problems would increase. retailers (see Box 1.6). However, lower compliance
and weak administration remain a major weakness to1.31 The Tax reforms of the 1997-98 Budget increasing tax buoyancy.simplified India's tax system further and brought itsrates in line with those of East Asia and developed Agriculture is becoming afocus of reformcountries. In addition to cutting across the boardcorporate and income taxation, taxes on investment 1.32 The strong response of agriculture to reformns
income, and import duties, the budget also expanded created favorable conditions for the government to re-
Box 1.5: Non-Bank Financial Companies
With the progressive liberalization of India's financial system, non-bank financial companies (1BFCs);areitaking on anincreasingly vigorous role. The. companies now prominent in the sector mostly date back Ito the early .1980s, when theyemerged as "go-betweens" banks and small enterprises requiring finance! for vehicles ;and machinery. They found itprofitable to borrow from banks and lend the proceeds--through the modalities of hiretpurchase and billNdiscounting--tofirms that had difficulty borrowing from banks because they swere iregarded as risky.
Asset-based financing remains the NBFCs' core business. Their basic operations are loans of three to five years forcommercial or industrial equipment, particularly vehicles.: They fulfilt ai crucial rolei in financing, small-scale capitalDinvestment. Because they are almost all privately-owned institutions, and subject to intense competition, they have tended to be particularly careful about loan recovery. Although no firm Edata is available, it has been estimated that the share ofnon-performing assets in the larger NBFCs is between 2 and 4 percent. In addition,. the larger NBFCs have up-to-datecomputer systems, wide branch networks, better trained staff who operate under an incentives system to make sound loansiand to ensure recovery.
There are about 40,000 NBFCs although. only about: 4650 function as deposit-taking intermediaries.-Of these, about 100have assets of Rs. I billion (US$30 million). The NBFCs haye expanded-in scope since the early 11 980s, and now carry on:a wide range of funded and unfunded activities. Theyjare permitted to take deposits of one year or more at an interest ratefixed by the RBI generally at about 2 or 3 percentage points above thfe maximum deposit rate allowed for commercial.banks. Some of the larger NBFCs have made a profitable business of brokering India's inter-corporate.moneyt market.Several NBFCs act as brokers for non-financial corporations, (Indian corporations take depositsfiomn the public). SeveralNBFCs have begun merchant-banking activities.
In addition to a maximum deposit rate and a minimum deposit term, the RBI has restricted the ratio of NBFC, liabilities(including non-deposit borrowing) for hire purchase finance, and equipment leasing companies to about ten times networth, with much lower ratios for the other NBFCs. Those NBFCs that comply with prudential norms and credit ratingstipulations can accept deposits without any ceiling. The NBFCs are not subject to required reserves against deposits, butmust hold ten percent of their deposits in "liquid assets" (i.e., eligible government securities). A recent expert report onthe sector (the Shah Report) recommended that the RBI continues to apply these regulatory controls. The report alsorecommended that the RBI applies capital-adequacy standards, as well as asset-classification and income-recognitionstandards. However, the supervision of NBFCs, has been minimal, mainly relating to their deposit taking activity. Acomprehensive off-site surveillance is expected to be shortly in place. A more systematic on site inspection is also beingintroduced. Many NBFCs managers believe that on-site inspection can accomplish only a limited control function, and,that it is essential to rely also on rating agencies, auditors, and internal controls to help supervise the sector.
Some Indian commercial bankers feel that the NBFCs take some business from them. While this is undoubtedly true, it is!also clear that the NBFCs still carry out a large volume of vital investment business that the comrnercial banks cannot do:efficiently. It would therefore make sense for a bank to lend money to NBFCs at relatively low rates, enabling them toreach riskier borrowers from whom the NBFCs are demonstrably able to recover more efficiently. The NBFCs themselvesare increasingly finding that they are facing intense competition from development finance institutions, which are lendingincreasingly for smaller capital projects than they previously did.
Development of the kinds of financing NBFCs carry out is limited by the lack of a market in debt instruments, besides theabsence of a market in securitized private asset-based debt. The development of money-market mutual fundsvwould be ahelpful step, since such funds could hold securitized debt originated by NBFCs arising from asset financing. Developmentof an enabling regulatory and legal environment for such funds would help strengthen the NBFCs sector, and1help it fulfillits potential not only in financing capital assets, but also to help developing financing for consumer durables.
Chapter 1. Recent Economic Developments 13
1.33 In deregulating--although partially--investmentFigure 1.12: Non-Performing Assets and domestic trade in agriculture, the government aims
(percent of total assets) at encouraging private investment in agro-industry,
25 modem storage facilities, and improving access to20 - modem risk management instruments. In Table 1.4, the
15- \ . _ _:.- cells which remain shaded indicate areas where
Isn - * --- *<-; *-regulations persist. To date, the most far-reaching-U_ , _ _ reforms have been in cotton and coffee. Cotton and
SBI Group Nationliazed Total Public coffee marketing are completely deregulated, except in
01994-95 1995-96 SectorBanks Maharashtra where the state cotton monopoly01994l95 51995-96 procurement scheme remains imposing a fiscal burden
.Source: Ministry of Finance.Source________Ministry______ofFinance________ of Rs. 5 billion in each of the last two years. In
addition, investment in the production of fourteenintroduce--after a 31-year hiatus--futures trading in important agro-industrial items (such as rice milling)
cotton lint, jute and jute goods and partially lift until now reserved to small scale industries has been
restrictions on commodity trading such as those on deregulated. Together, these measures should
storage, credit and movement controls, particularly for encourage private sector investments in high-value
cotton and oilseeds.. Export quotas on cotton and agriculture and related marketing activities.cotton yarn were raised and the number of yam quota
exemptions expanded. Sugar exports (subject to 1.34 Public enterprise (PEs) reform has been one of
quotas) were decanalized in January 1997. To boost the weakest elements in the reform process. While
rice exports, the government removed the minimum public enterprises are now more exposed to
export price but declining government stocks led to the competition, their autonomy remains limited and has
reimposition of the levy on rice mills exporting non- reduced the ability of their managers to introduce
basmati rice. Similarly, a shortfall in domestic wheat essential restructuring reforms such as large scaleproduction in 1996 led to the re-imposition of export retrenchment, corporate reorganization, closure or
ceilings on wheat and wheat products and, to contain selling of units-even those declared terminally sick--orprice rises, public and eventually private wheat imports joint ventures with private partners. In addition, central
were temporarily allowed following the re-imposition government equity remains high (over 90 percent in
of storage and credit controls. However, even this most cases) even in those enterprises operating in thepartial liberalization of exports exposes the tradable sector (Annex, Table 12). Thus, with a few
shortcomings of the current food policy. The uneven exceptions, the financial performance of PEs has failedliberalization of agriculture (across commodities and to improve. A Disinvestment Commission which was
between domestic and external trade) has led to shifts established in 1996 to examine options for reducingin cropping patterns towards more commercial crops central goverrunent equity in central public enterprises(hence less subject to trade restrictions) resulting in an submitted an approach paper in December 1996
excess demand for cereals. Because imports of cereals articulating a strategy for reforming PEs. The strategy
were restricted, external trade could not be used to was discussed in public forums with Indian and foreign
smooth out price fluctuations. A recent study (S. Jha experts including those from major foreign consultancy
and P.V. Srinivasan, 1996) which explored the relative firms dealing with privatization issues. On the basis of
cost effectiveness of a variety of instruments--such as these consultations, the Commission issued two
buffer stocks, canalized trade, variable levies--in reports, in February and April 1997 outlining an
stabilizing rice and wheat prices found that, of all approach to privatization and restructuring of publicpossible options, current public sector buffer stocking enterprises. Among the 40 central PEs being examinedoperations are the costliest. for full or partial privatization are such blue-chips as
ONGC, SAIL, and IOC. In all, nine public enterprises
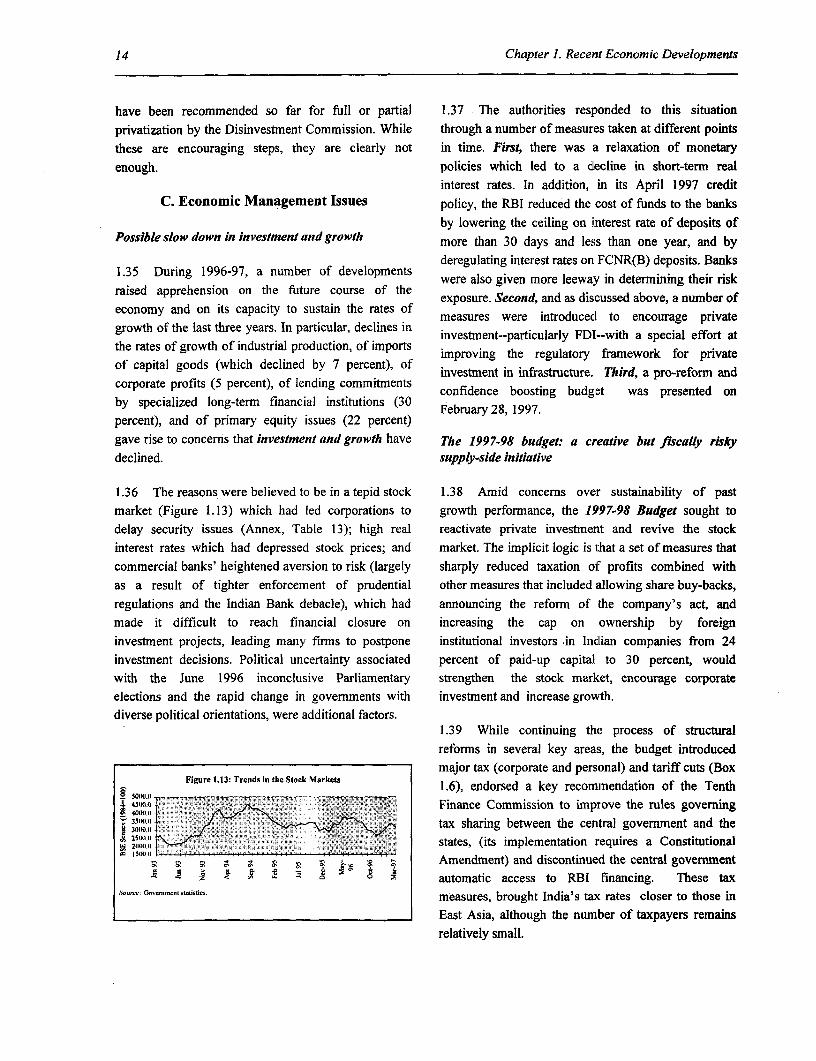
14 Chapter 1. Recent Economic Developments
have been recommended so far for full or partial 1.37 The authorities responded to this situationprivatization by the Disinvestment Commission. While through a number of measures taken at different pointsthese are encouraging steps, they are clearly not in time. First, there was a relaxation of monetaryenough. policies which led to a decline in short-term real
interest rates. In addition, in its April 1997 creditC. Economic Management Issues policy, the RBI reduced the cost of funds to the banks
by lowering the ceiling on interest rate of deposits ofPossible slow down in investment and growth more than 30 days and less than one year, and by
deregulating interest rates on FCNR(B) deposits. Banks1.35 During 1996-97, a numnber of developments were also given more leeway in determinting their riskraised apprehension on the future course of theeconomy and on its capacity to sustain the rates of exposure. Second, and as discussed above, a number of
measures were introducecd to encourage privategrowth of the last three years. In particular, declines In investment--particularly FDI--with a special effort atthe rates of growth of industrial production, of imports improving the regulatory framework for privateof capital goods (which declined by 7 percent), of . in infrastructure. Third, a pro-reform andcorporate profits (5 percent), of lending commitnents confidence boosting budget was presented onby specialized long-term financial institutions (30 February 28, 1997.percent), and of primary equity issues (22 percent)gave rise to concerns that investment and growth have The 1997-98 budget: a creative but fiscally riskydeclined. supply-side initiative
1.36 The reasons were believed to be in a tepid stock 1.38 Amid concerns over sustainability of pastmarket (Figure 1.13) which had led corporations to growth performance, the 15'97-98 Budget sought todelay security issues (Annex, Table 13); high real reactivate private investmernt and revive the stockinterest rates which had depressed stock prices; and market. The implicit logic is that a set of measures thatcommercial banks' heightened aversion to risk (largely sharply reduced taxation of profits combined withas a result of tighter enforcement of prudential other measures that included allowing share buy-backs,regulations and the Indian Bank debacle), which had announcing the reform of the company's act, andmade it difficult to reach financial closure on increasing the cap on ownership by foreigninvestment projects, leading many firms to postpone institutional investors in Indian companies from 24investment decisions. Political uncertainty associated percent of paid-up capital to 30 percent, wouldwith the June 1996 inconclusive Parliamentary strengthen the stock market, encourage corporateelections and the rapid change in governments with investment and increase growth.diverse political orientations, were additional factors.
1.39 While continuing the process of structuralreforms in several key areas, the budget introducedmajor tax (corporate and personal) and tariff cuts (Box
Figure 1.13: Trends in the Stock Markets 1.6), endorsed a key recommendation of the Tenth
45M).0 Finance Commission to improve the rules governing35 H() tax sharing between the central government and the
211505 .: states, (its implementation requires a Constitutionalm 15 51.11
Amendment) and discontinued the central governmentz automatic access to RBI financing. These tax
measures, brought India's tax rates closer to those inEast Asia, although the number of taxpayers remains
relatively small.
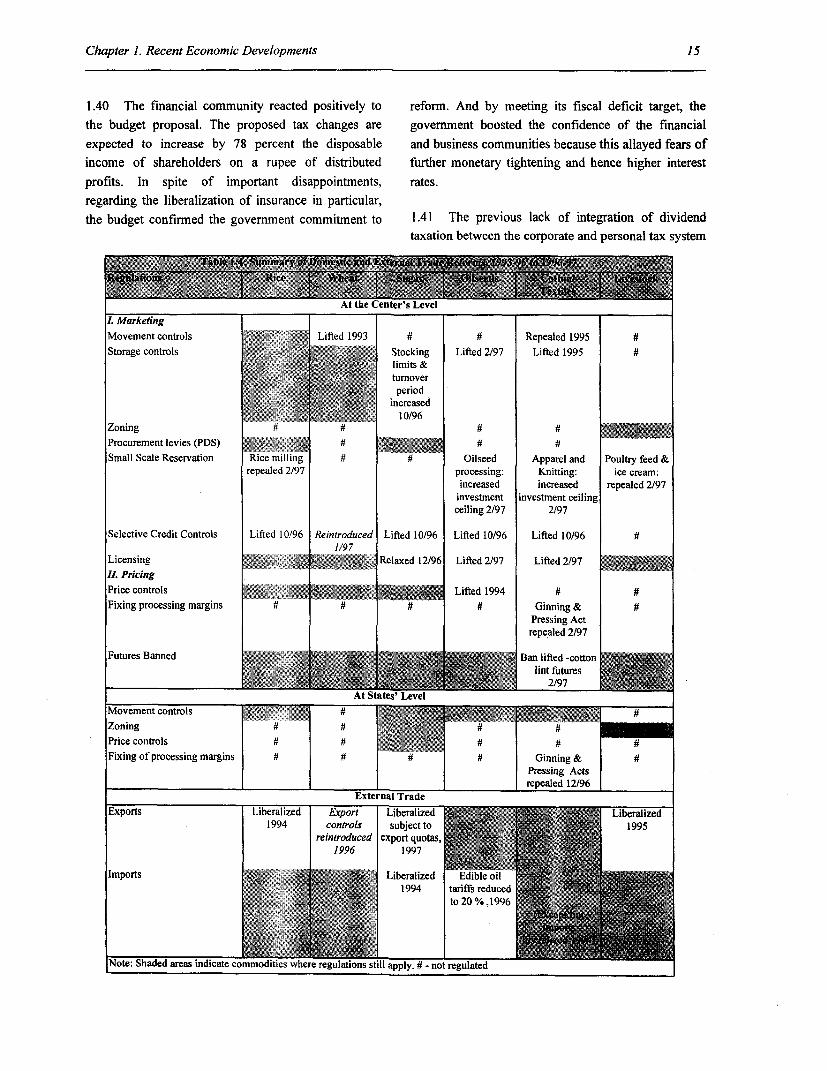
Chapter 1. Recent Economic Developments 15
1.40 The financial community reacted positively to reform. And by meeting its fiscal deficit target, the
the budget proposal. The proposed tax changes are government boosted the confidence of the financial
expected to increase by 78 percent the disposable and business communities because this allayed fears of
income of shareholders on a rupee of distributed further monetary tightening and hence higher interest
profits. In spite of important disappointments, rates.regarding the liberalization of insurance in particular,the budget confirmed the government commitment to 1.41 The previous lack of integration of dividend
taxation between the corporate and personal tax system
At the Center's Level
L ~ ~ ~ ~ ~rpae 2/97tin prcsig_nttn: iecem
Sevement controls Lifted 1 993 0 Repealed 19956
Storage contros 2Stocking Lifted 2/97 Lifted 1995
W ' -- '.d j ''0 turmosver
Ii. Pricing ~ ~ ~ ~ ~ ~ ~ ~~~~ero
Price contrs Ld 14increased
Zoning p m i &
Procurement levies (PDS) g -- Small Scale Reservation Rice milling # Oilseed Apparel and Poultry feed &
repealed 2/97 processing: KnitPing: ice cream:increased increased repealed 2/97investment invNstment ceilingceiling 2/97 2/97
Selective Credit Controls Lifted 10/96 Reintroduced Lifted 10/96 Lifted 10/96 Lifted 10/96#1197
Licensing 5xi - -@ >,--J EW_Relaxed 12/96 Lifted 2/97 Lifted 2/97IL PricingPrice controls .0X i 1Lifted 1994##Fixing processing margins ####Ginning &#
Pressing Actrepealed 2/97
Futures Banned o alil2eut7 °to°n
At States' Level
Zoning 'i. _.....1 .......... ##Price controls ## X
Fixing of processing margins ####Ginning &#Pressing Actsrepealed 12/96
Extcrnatl TradeExports Liberalized Exortrl Libberealizted i Liberalized
tj~ ~ ~ ~~~~~~~~ritoue exor quo *tas,
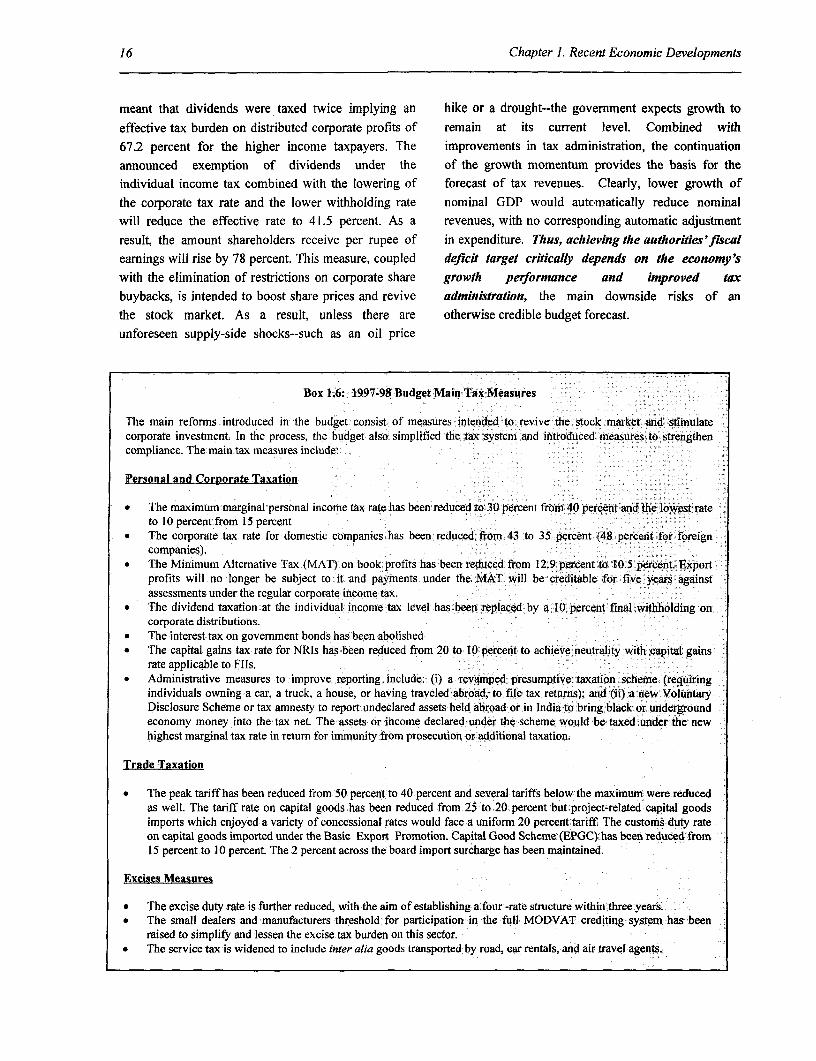
16 Chapter 1. Recent Economic Developments
meant that dividends were taxed twice implying an hike or a drought--the government expects growth to
effective tax burden on distributed corporate profits of remain at its current level. Combined with67.2 percent for the higher income taxpayers. The improvements in tax administration, the continuationannounced exemption of dividends under the of the growth momentum provides the basis for the
individual income tax combined with the lowering of forecast of tax revenues. Clearly, lower growth ofthe corporate tax rate and the lower withholding rate nominal GDP would automatically reduce nominalwill reduce the effective rate to 41.5 percent. As a revenues, with no corresponding automatic adjustmentresult, the amount shareholders receive per rupee of in expenditure. Thus, achieving the authorities'fiscalearnings will rise by 78 percent. This measure, coupled deficit target critically depends on the economy'swith the elimination of restrictions on corporate share growth performance and improved taxbuybacks, is intended to boost share prices and revive administration, the main downside risks of an
the stock market. As a result, unless there are otherwise credible budget forecast.
unforeseen supply-side shocks--such as an oil price
Box 1.6: 1997-98 Budget MainTaOx Measures
The main reforms introduced in the budget consist of measures intended to revive the stoclki market anid stimulatecorporate investment. In the process, the budget also simplified the taxisystem and iritroduced).measuresi.to strengthencompliance. The main tax measures include:
Personal and Corporate Taxation
* The maximum marginal personal income tax rate has been reduced to;30 percent from 40 percent and the lowest rateto 10 percent from 15 percent
* The corporate tax rate for domestic companies has been reduced from 43 to 35 percent l(48 percent for foreignicompanies).
* The Minimum Alternative Tax (MAT) on book profits has been reduced from 12.9 percent to 10.5 percent. Exportprofits will no longer be subject to it and payments under the.MAT will be' creditable -for five years againstassessments under the regular corporate income tax.
* The dividend taxation at the individual income tax level has been replaced by a; 10perceent final wiffitholding oncorporate distributions.
* The interest tax on government bonds has been abolished* The capital gains tax rate for NRIs has Lbeen reduced from 20 to 10 percent to achieve neutrality with capital' gains
rate applicable to FIls.* Administrative measures to improve reporting include: (i) a revamped presumptive taxation scheme (requiring
individuals owning a car, a truck, a house, or having traveled iabroad, to file tax returns); and, (ii)i a intew VoluntaryDisclosure Scheme or tax amnesty to report undeclared assets held abroad or in India to bring black or undergroundeconomy money into the tax net. The assets or income declared under the scheme would be taxed under the newhighest marginal tax rate in return for immunity from prosecution or additional taxation.
Trade Taxation
* The peak tariff has been reduced from 50 percent to 40 percent and several tariffs below the nmaximum were reducedas well. The tariff rate on capital goods has been reduced from 25 to 20 percent but project-related capital goodsimports which enjoyed a variety of concessional rates would face a uniform 20 percent tariff. The customs duty rateon capital goods imported under the Basic Export Promotion. Capital Good Scheme'(EPGC)':has been reduced"from15 percent to I 0 percent. The 2 percent across the board import surcharge has been maintained.
Excises Measures
* The excise duty rate is further reduced, with the aim of establishing a four -rate structure within three years.* The small dealers and manufacturers threshold for participation in the full MODVAT crediting system has been
raised to simplify and lessen the excise tax burden on this sector.* The service tax is widened to include inter alia goods transported by road, car rentals, and air travel agents..
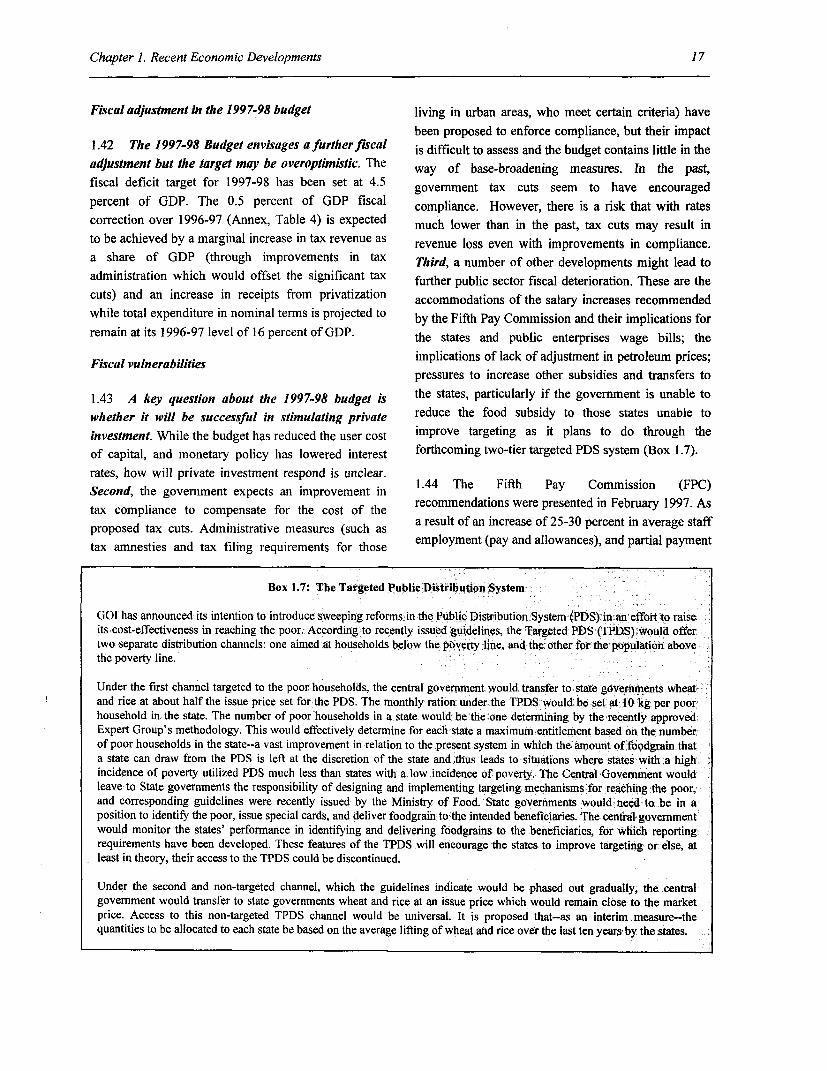
Chapter 1. Recent Economic Developments 17
Fiscal adjustment in the 1997-98 budget living in urban areas, who meet certain criteria) have
been proposed to enforce compliance, but their impact1.42 The 1997-98 Budget envisages a further fiscal is difficult to assess and the budget contains little in the
adjuslment but the target may be overoptimistic. The way of base-broadening measures. In the past,
fiscal deficit target for 1997-98 has been set at 4.5 government tax cuts seem to have encouraged
percent of GDP. The 0.5 percent of GDP fiscal compliance. However, there is a risk that with rates
correction over 1996-97 (Annex, Table 4) is expected much lower than in the past, tax cuts may result in
to be achieved by a marginal increase in tax revenue as revenue loss even with improvements in compliance.
a share of GDP (through improvements in tax Third, a number of other developments might lead to
administration which would offset the significant tax further public sector fiscal deterioration. These are the
cuts) and an increase in receipts from privatization accommodations of the salary increases recommended
while total expenditure in nominal terms is projected to by the Fifth Pay Commission and their implications for
remain at its 1996-97 level of 16 percent of GDP. the states and public enterprises wage bills; the
Fiscal vulnerabilities implications of lack of adjustment in petroleum prices;pressures to increase other subsidies and transfers to
1.43 A key question about the 1997-98 budget is the states, particularly if the govermnent is unable towhether it will be successful in stimulating private reduce the food subsidy to those states unable to
investment. While the budget has reduced the user cost improve targeting as it plans to do through the
of capital, and monetary policy has lowered interest forthcoming two-tier targeted PDS system (Box 1.7).
rates, how will private investment respond is unclear.;Second, the government expects an improvement in 14mh it ay Cmiso FCtaxecompliane tovemmentexpentsate nfor t vemsto te recommendations were presented in February 1997. As
tax compliance to compensateforthecoa result of an increase of 25-30 percent in average staffproposed tax cuts. Administrative measures (such astax amnesties and tax filing requirements for those
Box 1.7: The Targeted Public Distribution System
GOI has announced its intention to introduce sweeping reforms in the Public Distribution System (PDS) in an effort to raiseits cost-effectiveness in reaching the poor. According to recently issued guidelines, the Targeted PDS (TPDS) would offertwo separate distribution channels: one aimed at households below the poverty line, and the other for the population abovethe poverty line.
Under the first channel targeted to the poor households, the central government would transfer to state govermnents wheatand rice at about half the issue price set for the PDS. The monthly ration under the TPDS would be set at 10 kg per poorhousehold in the state. The number of poor households in a state would be the one determining by the recently approvedExpert Group's methodology. This would effectively determine for each state a maximum entitlement based on the numberof poor households in the state--a vast improvement in relation to the present system in which the amount of foodgrain thata state can draw from the PDS is left at the discretion of the state and thus leads to situations where states with a highincidence of poverty utilized PDS much less than states with a low incidence of poverty. The Central Government wouldleave to State governments the responsibility of designing and implementing targeting mechanisms for reaching the poor,and corresponding guidelines were recently issued by the Ministry of Food. State governments would need to be in aposition to identify the poor, issue special cards, and deliver foodgrain to the intended beneficiaries. The central governmentwould monitor the states' performance in identifying and delivering foodgrains to the beneficiaries, for which reportingrequirements have been developed. These features of the TPDS will encourage the states to improve targeting or else, atleast in theory, their access to the TPDS could be discontinued.
Under the second and non-targeted channel, which the guidelines indicate would be phased out gradually, the centralgovernment would transfer to state governments wheat and rice at an issue price which would remain close to the marketprice. Access to this non-targeted TPDS channel would be universal. It is proposed that--as an interim measure-thequantities to be allocated to each state be based on the average lifting of wheat and rice over the last ten years by the states.
18 Chapter 1. Recent Economic Developments
of arrears for the period January 1996 to March 1997, submit their lists of eligible beneficiaries, there will bethe central government's salary bill is expected to an expenditure overrun. A second risk of expenditureincrease in 1997-98 by Rs. 112 billion (0.8 percent of overrun is if the government fails to reduce the foodGDP). Inclusive of civilian staff, military personnel subsidy to states unable to improve targeting.and railways staff, the salary bill will rise to 2.8 percentof GDP in 1997-98, after having declined from 2.7 to 1.47 In summary, given th[ese risks, in the course of2.2 percent of GDP over the past six years (and to an the current fiscal year, additional resource mobilizationestimated 2.0 percent in 1997-98 without the FPC measures (such as acceleration of privatization,award). While Central Government expenditure on reduction in central government subsidies or furtherwages is relatively small, states' expenditure on wages expenditure cuts) may become necessary to ensure thatis significantly higher at around 5 to 8 percent of state the 1997-98 fiscal deficit target is met and inflationaryGDP. Significant wage increase by state governments expectations dampened. Analyses of the sustainability(in the past, states have followed the center in wage of India's fiscal stance indicate that a swift fiscaladjustments) would considerably further erode their contraction is essential to stabilize interest payments onfinances. In addition, salaries in public enterprises are the large central government domestic debt (Annex,based on pay levels in the civil service. While essential Tables 14 and 15); allow trade and financialto restore the competitiveness of pay in the civil liberalization to proceed with little macroeconomicservice, in the absence of offsetting measures, a risk; raise investors' confidence in the reform process;significant pay increase would also weaken the reduce the excessively large public debt stock to lowerfinances of public enterprises. real interest rates, and free up financial resources for
the rapid expansion of private investment. Reduction1.45 Also, an important contingent liability for the of consolidated fiscal imbalances requires lower centralCentral Government is the sizable deficit of the Oil and state governments deficits, as well as a betterCoordination Committee (OCC) Account--originally financial performance by public enterprises. A target ofestablished as a self-financing buffer account to around 4 percent of GDP (which is close to the targetstabilize rather than subsidize domestic petroleum set at the beginning of the reform program) for theprices. Partly because of the subsidies, and partly due consolidated central and state governments deficit mayto rising costs of oil imports, the Oil Pool Account be a realistic goal to be achieved in the next 3-4 years.deficit in 1996-97 reached Rs. 98 billion. In the Subsidy cuts could provide the resources needed toabsence of price adjustment, this might imply a achieve this fiscal deficit target.monthly accrual of Rs. 8 billion in subsidies, the rate atwhich the oil pool account has been accumulating External account vulnerabilitfieslosses since march 1997.
1.48 While the outlook for the external environment1.46 Another potential source of fiscal pressure for facing India over the next decade remains positive,the center is expected from the central government there are some important downside risks. First,proposed retargeting of the food subsidy to families dependency on oil imports continues to rise at fasterbelow the poverty line with effect from June 1997 rates than GDP growth. In particular, petroleum(Box 1.7). The cost of this new program has been subsidies have fueled consumption leading to anbudgeted at Rs. 77 billion in 1997-98 (0.5 percent of acceleration of oil imports (increasing the vulnerabilityGDP) compared with Rs. 62 billion (0.4 percent of of the balance of payments to unforeseen oil priceGDP) under the existing program. There is a major risk shocks) as a result of the inability of the public sectorof cost overruns on account of this new PDS. The oil companies to increase oil production. Domesticbudget projection for the food subsidy implicitly production is leveling off and, current trends persisting,assumes that not all states will be able to implement the India's oil imports will reach US$12 billion in the nextnew scheme in 1997-98. If more states than expected three years from US$7.2 billion in 1995-96. Potential
Chapter 1. Recent Economic Developments 19
production is thought to be significantly higher than safely sustainable limit. Third, the maintenance of a
present levels but foreign investment in the upstream competitive exchange rate is essential. Given the
sector--critical to achieving major output supply--has fiscal vulnerabilities, this task will become even more
not been forthcoming. Second, in the event that any of complex because recent liberalization measures are
the fiscal pressures discussed above materializes, it likely to encourage further capital inflows.
could increase the current account deficit beyond the

Chapter 2 CHANGING STATES' DEVELOPMENT POLICIES
2.1 India is a union of 25 states, the largest 15 of public investment in agriculture (extension services,which are nation-like--with populations between 20 agro-industry, storage), infrastructure (power, ports,million people (Haryana) and 160 million (Uttar roads, irrigation, transport services, water), andPradesh)--and account for over 90 percent of the manufacturing (most states own a large and diversifiedcountry's population. The Constitution gives the states set of public enterprises producing everything fromconsiderable autonomy to define their development coal and cement to fertilizer and toys). For this, statespolicies. In particular, they are responsible (sometimes relied mostly on resources transferred from the centralin conjunction with the central government) for government.ensuring the provision and regulation of education,health, power, agriculture, irrigation, water, road 2.3 India's system of intergovernmental transferstransport, and urban services. State and local has three basic resource transfer mechanisms. Theflrstgovernments--which are subordinated to the states--are consists of transfers recommended by the Financeresponsible for 60 percent of all government spending, Commission, a body created by the Constitution whichand a much higher proportion (90 percent) of public requires the President of India to appoint suchspending on health, education, and roads. They also Commission every five years. The Financehave a major role regulating labor and agricultural Commission provides recommendations to the centralmarkets. Per-capita income levels and indicators of government for a five-year period on how it shouldhuman resource development vary considerably across share with the states its tax collections (personalstates (Table 2.1). There is growing awareness that income taxes, excluding income from agricultureimprovement in the states' economic management is which only the states can tax, and excises) and on theessential for India to sustain high rates of economic desired level of other forms of financial assistance togrowth. the states. There have been 10 Finance Commissions
thus far, the last one completed its work in late 1994.
A. State Issues: A Summing Up Finance Commissions command considerable respect,and their recommendations have been generally
India's pre-1991 development strategy and inter- adopted by the central government.governmental transfers have shaped the states'development policies 2.4 A major objective of successive Finance
2.2 Before reforms started in 1991, India's states Commissions has been to achieve a better matchcould not depend on private capital for their between the responsibilities the Constitution assigns todevelopment. National policies excluded it from the states, and the revenues they rely on (mostly salesimportant sectors and, where permitted, central tax, state excises, and other taxes on transactions andlicensing authorities, not the enabling environment, property) which vary considerably from state to statedetermined the volume and composition of private depending on their level of development,investment. Consequently, a state's pace of administrative capabilities, and strength of governance.development was determined by its ability to expand Until the early 1990s, successive Finance Commissions
recommended levels of financial support for each state
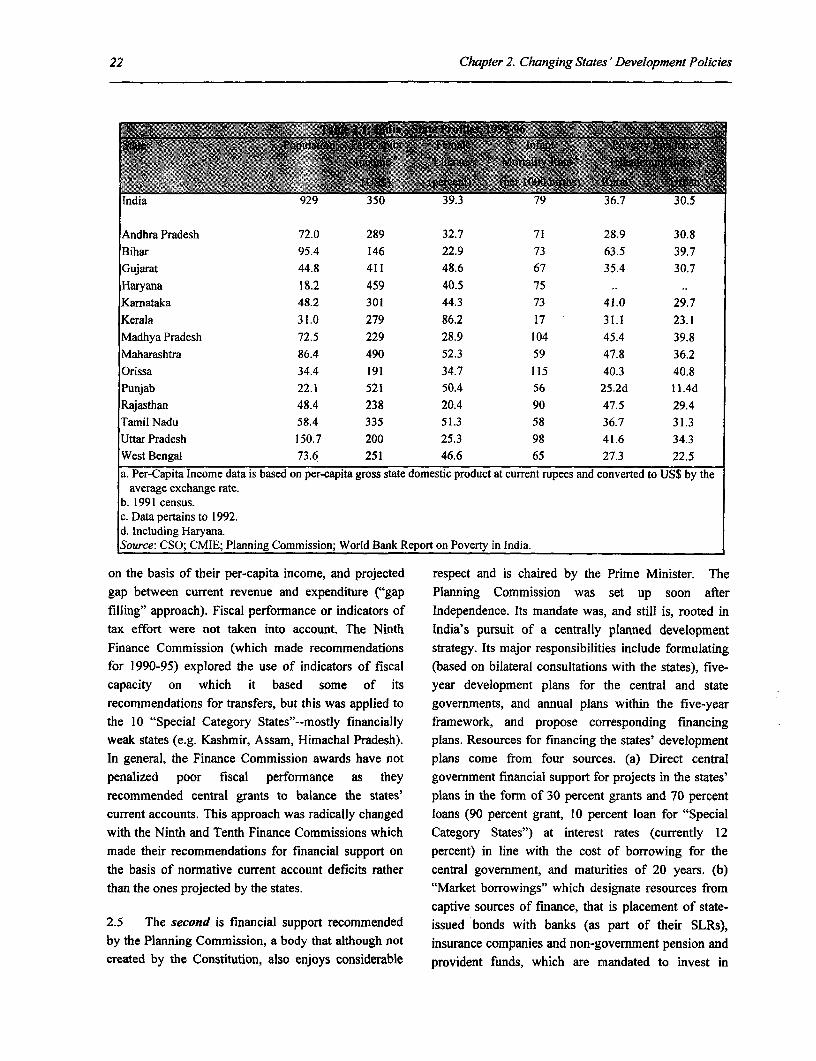
22 Chapter 2. Changing States' Development Policies
India 929 350 39.3 79 36.7 30.5
Andhra Pradesh 72.0 289 32.7 71 28.9 30.8Bihar 95.4 146 22.9 73 63.5 39.7Gujarat 44.8 411 48.6 67 35.4 30.7Haryana 18.2 459 40.5 75Karnataka 48.2 301 44.3 73 41.0 29.7Kerala 31.0 279 86.2 17 31.1 23.1Madhya Pradesh 72.5 229 28.9 104 45.4 39.8Maharashtra 86.4 490 52.3 59 47.8 36.2Orissa 34.4 191 34.7 115 40.3 40.8Punjab 22.1 521 50.4 56 25.2d 11.4dRajasthan 48.4 238 20.4 90 47.5 29.4Tamil Nadu 58.4 335 51.3 58 36.7 31.3UttarPradesh 150.7 200 25.3 98 41.6 34.3West Bengal 73.6 251 46.6 65 27.3 22.5a. Per-Capita Income data is based on per-capita gross state domestic product at current rupees and converted to US$ by the
average exchange rate.b. 1991 census.c. Data pertains to 1992.d. including Haryana.Source: CSO; CMIE; Planning Commission; World Bank Report on Poverty in India.
on the basis of their per-capita income, and projected respect and is chaired by the Prime Minister. Thegap between current revenue and expenditure ("gap Planning Commission was set up soon after
filling" approach). Fiscal performance or indicators of Independence. Its mandate was, and still is, rooted intax effort were not taken into account. The Ninth India's pursuit of a centrally planned development
Finance Commission (which made recommendations strategy. Its major responsibilities include formulatingfor 1990-95) explored the use of indicators of fiscal (based on bilateral consultations with the states), five-capacity on which it based some of its year development plans for the central and staterecommendations for transfers, but this was applied to governments, and annual plans within the five-yearthe 10 "Special Category States"--mostly financially framework, and propose corresponding financingweak states (e.g. Kashmir, Assam, Himachal Pradesh). plans. Resources for financing the states' developmentIn general, the Finance Commission awards have not plans come from four sources. (a) Direct centralpenalized poor fiscal performance as they government financial support for projects in the states'recommended central grants to balance the states' plans in the form of 30 percent grants and 70 percentcurrent accounts. This approach was radically changed loans (90 percent grant, 10 percent loan for "Specialwith the Ninth and Tenth Finance Commissions which Category States") at interest rates (currently 12made their recommendations for financial support on percent) in line with the cost of borrowing for thethe basis of normative current account deficits rather central government, and maturities of 20 years. (b)than the ones projected by the states. "Market borrowings" which designate resources from
captive sources of finance, that is placement of state-2.5 The second is financial support recommended issued bonds with banks (as part of their SLRs),by the Planning Commission, a body that although not insurance companies and non-government pension andcreated by the Constitution, also enjoys considerable provident funds, which are mandated to invest in
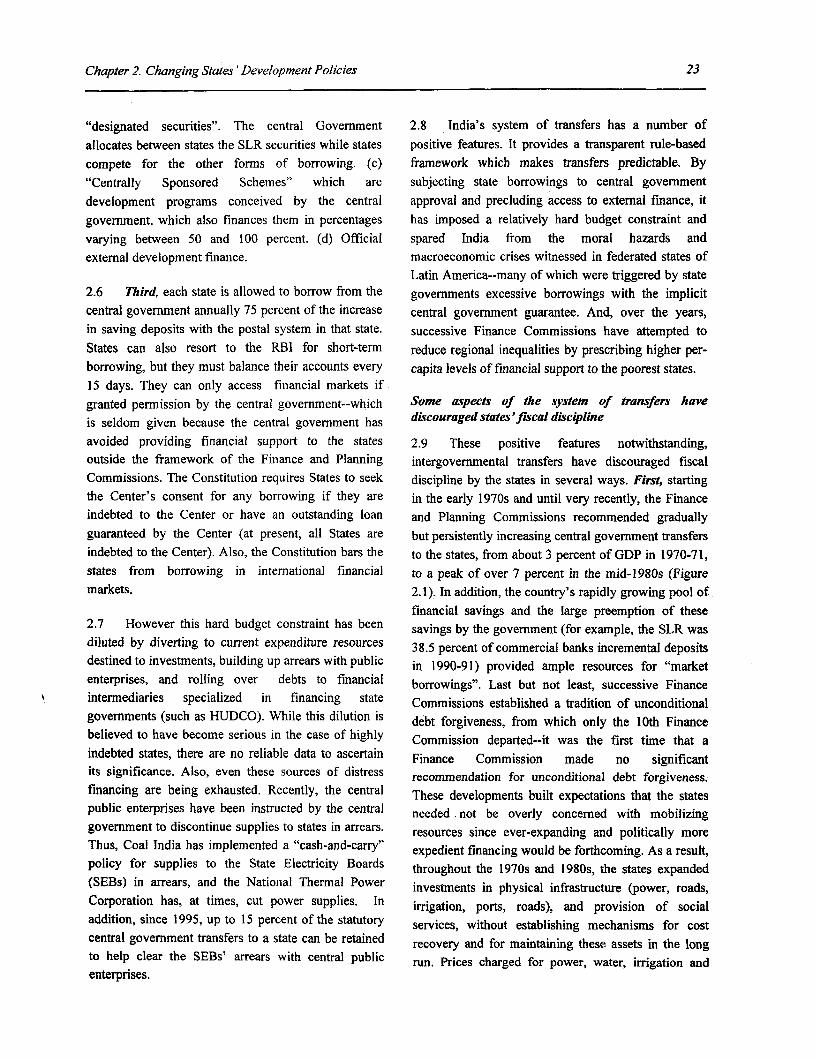
Chapter 2. Changing States' Development Policies 23
"designated securities". The central Government 2.8 India's system of transfers has a number ofallocates between states the SLR securities while states positive features. It provides a transparent rule-basedcompete for the other forms of borrowing. (c) framework which makes transfers predictable. By"Centrally Sponsored Schemes" which are subjecting state borrowings to central governmentdevelopment programs conceived by the central approval and precluding access to external finance, itgovernment, which also finances them in percentages has imposed a relatively hard budget constraint andvarying between 50 and 100 percent. (d) Official spared India from the moral hazards andexternal development finance. macroeconomic crises witnessed in federated states of
Latin America--many of which were triggered by state2.6 Third, each state is allowed to borrow from the governments excessive borrowings with the implicitcentral government annually 75 percent of the increase central government guarantee. And, over the years,in saving deposits with the postal system in that state. successive Finance Commissions have attempted toStates can also resort to the RBI for short-term reduce regional inequalities by prescribing higher per-borrowing, but they must balance their accounts every capita levels of financial support to the poorest states.15 days. They can only access financial markets ifgranted permission by the central government--which Some aspects of the system of transfers haveis seldom given because the central government has discouraged states 'fiscal discipline
avoided providing financial support to the states 2.9 These positive features notwithstanding,outside the framework of the Finance and Planning intergovernmental transfers have discouraged fiscalCommissions. The Constitution requires States to seek discipline by the states in several ways. First, startingthe Center's consent for any borrowing if they are in the early 1970s and until very recently, the Financeindebted to the Center or have an outstanding loan and Planning Commissions recommended graduallyguaranteed by the Center (at present, all States are but persistently increasing central government transfersindebted to the Center). Also, the Constitution bars the to the states, from about 3 percent of GDP in 1970-71,states from borrowing in international financial to a peak of over 7 percent in the mid-1980s (Figuremarkets. 2.1). In addition, the country's rapidly growing pool of
financial savings and the large preemption of these2.7 However this hard budget constraint has been savings by the government (for example, the SLR wasdiluted by diverting to current expenditure resources 38.5 percent of commercial banks incremental depositsdestined to investments, building up arrears with public in 1990-91) provided ample resources for "marketenterprises, and rolling over debts to financial borrowings". Last but not least, successive Financeintermediaries specialized in financing state Commissions established a tradition of unconditionalgovernments (such as HUDCO). While this dilution is debt forgiveness, from which only the 10th Financebelieved to have become serious in the case of highly Commission departed--it was the first time that aindebted states, there are no reliable data to ascertain Finance Commission made no significantits significance. Also, even these sources of distress recommendation for unconditional debt forgiveness.financing are being exhausted. Recently, the central These developments built expectations that the statespublic enterprises have been instructed by the central needed not be overly concerned with mobilizinggovernment to discontinue supplies to states in arrears. resources since ever-expanding and politically moreThus, Coal India has implemented a "cash-and-carry" expedient financing would be forthcoming. As a result,policy for supplies to the State Electricity Boards throughout the 1970s and 1980s, the states expanded(SEBs) in arrears, and the National Thermal Power investments in physical infrastructure (power, roads,Corporation has, at times, cut power supplies. In irrigation, ports, roads), and provision of socialaddition, since 1995, up to 15 percent of the statutory services, without establishing mechanisms for costcentral government transfers to a state can be retained recovery and for maintaining these assets in the longto help clear the SEBs' arrears with central public run. Prices charged for power, water, irrigation andenterprises.
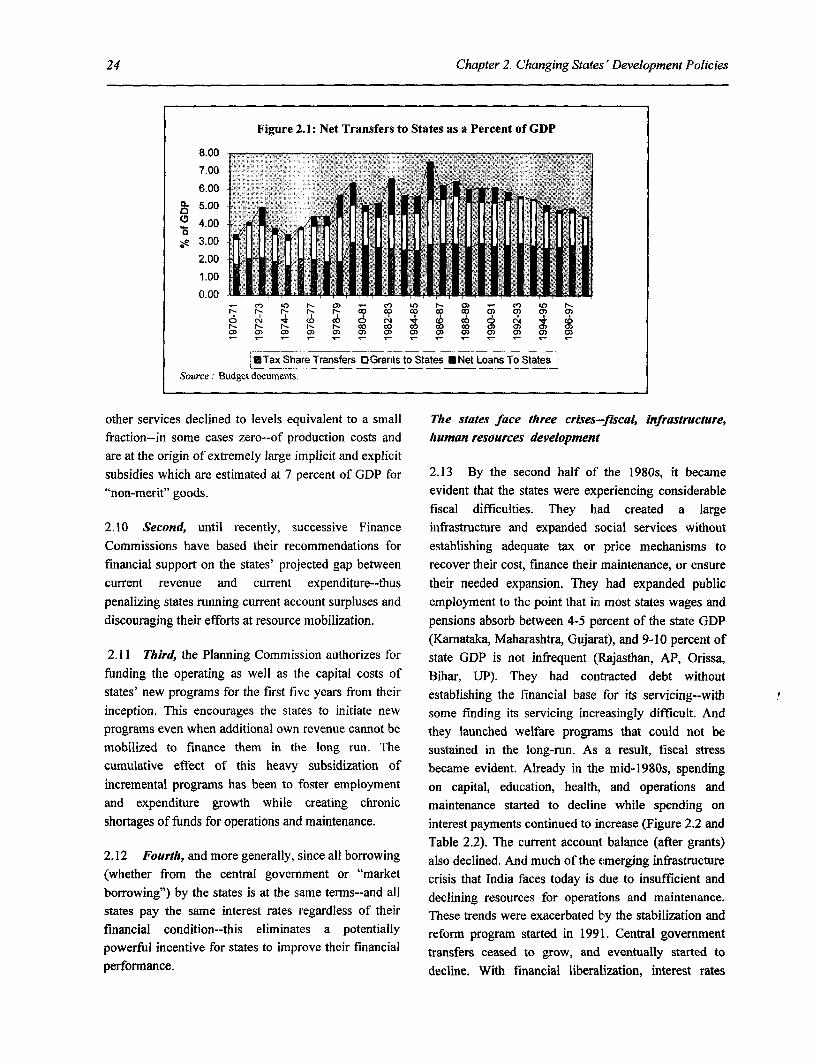
24 Chapter 2. Changing States' Development Policies
Figure 2.1: Net Transfers to States as a Percent of GDP
8.00
7.006.00 A
._- .00
.~4.00
3.002.00
1.00
0.00- n C') tC)m Or-mV)
oL 04 -T co 0) ~ 4 ~ 0 co 0 (4 4~ co0) 0) 0) 0)rl co co 0 o c) co 0) 0) 0) 0)
Tax Share Transfers OGrants to States UNet Loans_ToStatesSource: Budget documents.
other services declined to levels equivalent to a small The states face three crises-fiscal, infrastructure,fraction--in some cases zero--of production costs and human resources development
are at the origin of extremely large implicit and explicitsubsidies which are estimated at 7 percent of GDP for 2.13 By the second half of the 1980s, it became"non-merit" goods. evident that the states were experiencing considerable
fiscal difficulties. They had created a large2.10 Second, until recently, successive Finance infrastructure and expanded social services withoutCommissions have based their recommendations for establishing adequate tax or price mechanisms to
financial support on the states' projected gap between recover their cost, finance their maintenance, or ensurecurrent revenue and current expenditure--thus their needed expansion. They had expanded public
penalizing states running current account surpluses and employment to the point that in most states wages and
discouraging their efforts at resource mobilization. pensions absorb between 4-5 percent of the state GDP
(Kamataka, Maharashtra, Gujarat), and 9-10 percent of2.11 Third, the Planning Commission authorizes for state GDP is not infrequent (Rajasthan, AP, Orissa,
funding the operating as well as the capital costs of Bihar, UP). They had contracted debt withoutstates' new programs for the first five years from their establishing the financial base for its servicing--withinception. This encourages the states to initiate new some fnding its servicing increasingly difficult. Andprograms even when additional own revenue cannot be they launched welfare programs that could not bemobilized to finance them in the long run. The sustained in the long-run. As a result, fiscal stresscumulative effect of this heavy subsidization of became evident. Already in the mid-1980s, spendingincremental programs has been to foster employment on capital, education, health, and operations andand expenditure growth while creating chronic maintenance started to decline while spending onshortages of funds for operations and maintenance. interest payments continued to increase (Figure 2.2 and
Table 2.2). The current account balance (after grants)2.12 Fourth, and more generally, since all borrowing also declined. And much of the emerging infrastructure(whether from the central government or "market crisis that India faces today is due to insufficient andborrowing") by the states is at the same terms--and all declining resources for operations and maintenance.states pay the same interest rates regardless of their These trends were exacerbated by the stabilization andfinancial condition--this eliminates a potentially reform program started in 1991. Central governmentpowerful incentive for states to improve their financial transfers ceased to grow, and eventually started toperformance. decline. With financial liberalization, interest rates
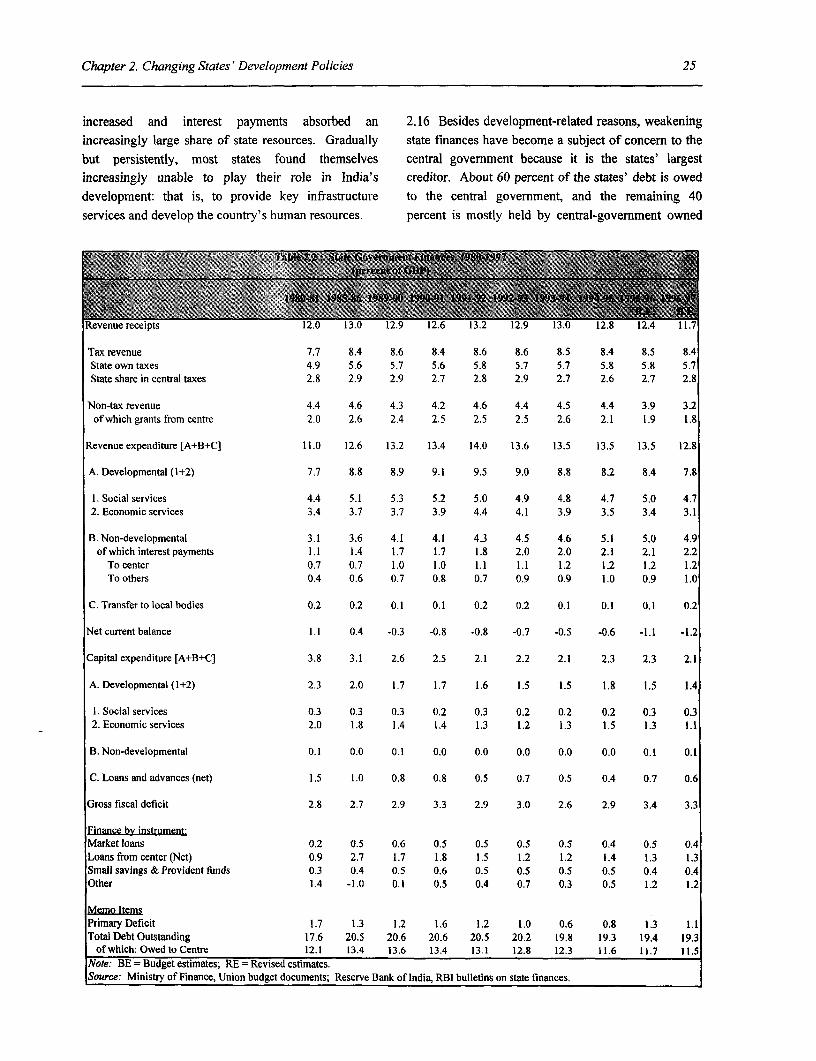
Chapter 2. Changing States' Development Policies 25
increased and interest payments absorbed an 2.16 Besides development-related reasons, weakeningincreasingly large share of state resources. Gradually state finances have become a subject of concern to thebut persistently, most states found themselves central government because it is the states' largestincreasingly unable to play their role in India's creditor. About 60 percent of the states' debt is oweddevelopment: that is, to provide key infrastructure to the central government, and the remaining 40services and develop the country's human resources. percent is mostly held by central-government owned
Rvnercipts 12.0 13.0 12.9 12.6 13.2 12.9 1.0 12.8 12.4 II.7Tax revenue 7.7 8.4 8.6 8.4 8.6 8.6 8.5 8.4 8.5 8.4State own taxes 4.9 5.6 5.7 5.6 5.8 5.7 5.7 5.8 5.8 5.7State share in central taxes 2.8 2.9 2.9 2.7 2.8 2.9 2.7 2.6 2.7 2.8
Non-tax revenue 4.4 4.6 4.3 4.2 4.6 4.4 4.5 4.4 3.9 3.2of which grants from centre 2.0 2.6 2.4 2.5 2.5 2.5 2.6 2.1 1.9 1.8
Revenue expenditure [A+B+C] 11.0 12.6 13.2 13.4 14.0 13.6 13.5 13.5 13.5 12.8
A. Developmental (1+2) 7.7 8.8 8.9 9.1 9.5 9.0 8.8 8.2 8.4 7.8
1. Social services 4.4 5.1 5.3 5.2 5.0 4.9 4.8 4.7 5.0 4.72. Economic services 3.4 3.7 3.7 3.9 4.4 4.1 3.9 3.5 3.4 3.1
B. Non-developmental 3.1 3.6 4.1 4.1 4.3 4.5 4.6 5.1 5.0 4.9ofwhich interest payments 1.1 1.4 1.7 1.7 1.8 2.0 2.0 2.1 2.1 2.2
To center 0.7 0.7 1.0 1.0 1.1 1.1 1.2 1.2 1.2 1.2To others 0.4 0.6 0.7 0.8 0.7 0.9 0.9 1.0 0.9 1.0
C. Transfertolocal bodies 0.2 0.2 0.1 0.1 0.2 0.2 0.1 0.1 0.1 0.2
Net current balance 1.1 0.4 -0.3 -0.8 -0.8 -0.7 -0.5 -0.6 -1.1 -1.2
Capital expenditure [A+B+C] 3.8 3.1 2.6 2.5 2.1 2.2 2.1 2.3 2.3 2.1
A. Developmental (1+2) 2.3 2.0 1.7 1.7 1.6 1.5 1.5 1.8 1.5 1.4
1. Social services 0.3 0.3 0.3 0.2 0.3 0.2 0.2 0.2 0.3 0.32. Economic services 2.0 1.8 1.4 1.4 1.3 1.2 1.3 1.5 1.3 1.1
B. Non-developmental 0.1 0.0 0.1 0.0 0.0 0.0 0.0 0.0 0.1 0.1
C. Loans and advances (net) 1.5 1.0 0.8 0.8 0.5 0.7 0.5 0.4 0.7 0.6
Gross fiscal deficit 2.8 2.7 2.9 3.3 2.9 3.0 2.6 2.9 3.4 3.3
Finance by instrument:Market loans 0.2 0.5 0.6 0.5 0.5 0.5 0.5 0.4 0.5 0.4Loans from center (Net) 0.9 2.7 1.7 1.8 1.5 1.2 1.2 1.4 1.3 1.3Small savings & Provident funds 0.3 0.4 0.5 0.6 0.5 0.5 0.5 0.5 0.4 0.4Other 1.4 -1.0 0.1 0.5 0.4 0.7 0.3 0.5 1.2 1.2
Memo ItemsPrimary Deficit 1.7 1.3 1.2 1.6 1.2 1.0 0.6 0.8 1.3 1.1Total Debt Outstanding 17.6 20.5 20.6 20.6 20.5 20.2 19.8 19.3 19.4 19.3
of which: Owed to Centre 12.1 13.4 13.6 13.4 13.1 12.8 12.3 11.6 11.7 11.5Note: BE = Budget estimates; RE = Revised estimates.Source: Ministry of Finance, Union budget documents; Reserve Bank of India, RBI bulletins on state finances.
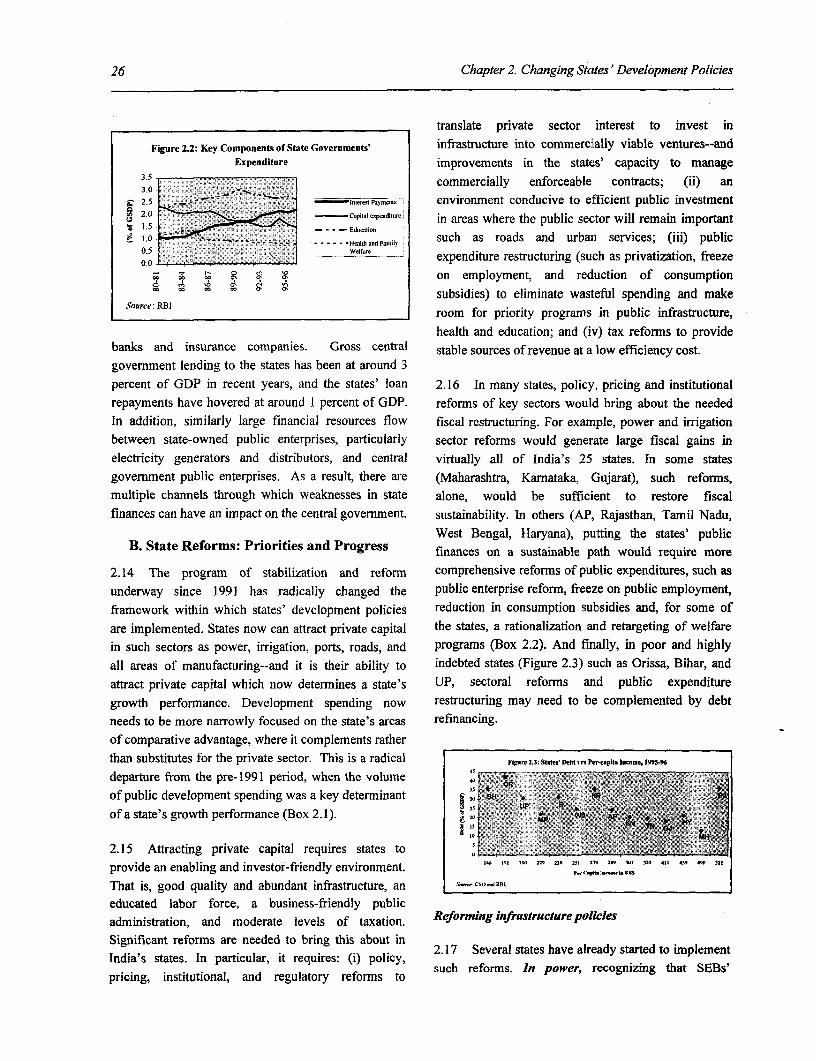
26 Chapter 2. Changing States' Development Policies
translate private sector interest to invest in
Figure 2.2: Key Components of State Govermments' infrastructure into commercially viable ventures--andExpenditure improvements in the states' capacity to manage
3.5 commercially enforceable contracts; (ii) an2.5 - Pynm environment conducive to e;fficient public investment
in 2.0 -CaPitl exp-dlure
v 2 0 - .- * - -lO. isdoc31iin areas where the public sector will remain importantS -- 0 2''~ .g"^*6.Sg 7S -Had ParlndFamilyl such as roads and urban services; (iii) public
expenditure restructuring (such as privatization, freezeon employment, and reduction of consumption
eg2 o2 cc co , Ce Cssubsidies) to eliminate wasteful spending and makeSou.rce: ROI.Source______________________RB______________ room for priority programs in public infrastructure,
health and education; and (iv) tax reforms to providebanks and insurance companies. Gross central stable sources of revenue at a low efficiency cost.government lending to the states has been at around 3
percent of GDP in recent years, and the states' loan 2.16 In many states, policy, pricing and institutionalrepayments have hovered at around I percent of GDP. reforms of key sectors would bring about the needed
In addition, similarly large financial resources flow fiscal restructuring. For example, power and irrigation
between state-owned public enterprises, particularly sector reforms would generate large fiscal gains in
electricity generators and distributors, and central virtually all of India's 25 states. In some states
government public enterprises. As a result, there are (Maharashtra, Kamataka, Gujarat), such reforms,multiple channels through which weaknesses in state alone, would be sufficient to restore fiscal
finances can have an impact on the central government. sustainability. In others (AP, Rajasthan, Tamil Nadu,
West Bengal, Haryana), putting the states' publicB. State Reforms: Priorities and Progress finances on a sustainable path would require more
2.14 The program of stabilization and reform comprehensive reforms of public expenditures, such asunderway since 1991 has radically changed the public enterprise reform, freeze on public employment,framework within which states' development policies reduction in consumption subisidies and, for some of
are implemented. States now can attract private capital the states, a rationalization and retargeting of welfarein such sectors as power, irrigation, ports, roads, and programs (Box 2.2). And finally, in poor and highlyall areas of manufacturing--and it is their ability to indebted states (Figure 2.3) such as Orissa, Bihar, and
attract private capital which now determines a state's UP, sectoral reforms and public expenditure
growth performance. Development spending now restructuring may need to be complemented by debt
needs to be more narrowly focused on the state's areas refinancing.
of comparative advantage, where it complements rather
than substitutes for the private sector. This is a radical Figm2J: State Debtsr.Per-"pit lomo.e,19959
departure from the pre- 1991 period, when the volume 435
of public development spending was a key determinant
of a state's growth performance (Box 2. 1). ~ 020
2.15 Attracting private capital requires states to 3provide an enabling and investor-friendly environment. P0(3... 459 4) 523
That is, good quality and abundant infrastructure, an Iteducated labor force, a business-friendly publicadministration, and moderate levels of taxation. Reforming infrastructure policies
Significant reforms are needed to bring this about inIndia's states. In particular, it requires: (i) policy, 2.17 Several states have already started to implementpricig instite. Inparl,an regulator rfm to such reforms. In power, recognizing that SEBs'pricing, institutional, and regulatory reforms to
Chapter 2. Changing States' Development Policies 27
Box 2.1: Reforms in Rajasthan
With a growth rate of 6 percent over the past 15 years, Rajasthan has emerged as one of India's fastest growing state.This is a significant achievement given initial natural and social resource endowments--three-fifths of the state isdesert and, before its constitution in 1962, Rajasthan consisted of several principalities and chieftancies where wealthwas concentrated and economic and social development limited. Over the last 15 years, growth was achievedthrough rapidly increasing public spending on power, irrigation, potable water, roads, manufacturing, tourism,health, and education. However, this development strategy has led the public sector to provide a wide range ofgoods and services (power, irrigation, water, manufacturing goods) at prices well below cost. This has created largeclaims on the budget and diverted resources away from essential spending on operations, maintenance and socialsectors. Public infrastructure has deteriorated, while the development of the state's human resources continues to lagbehind that of the country. In particular, at 20 percent, female literacy is India's lowest. Private investment hasdeclined, from over 10 percent of the state GDP (GSDP) in the late 1980s to less than 8 percent in recent years. Thestate's fiscal deficit has increased from 3.5 percent of GSDP in 1990-93 to 5.5 percent in 1994-97. Interest paymentshave risen from 14 percent to 20 percent of total revenue. Salaries, pensions and interest absorb two-thirds ofrevenue.
Cognizant of the changed developmental context after 1991, and its unsustainable fiscal position, the Government ofRajasthan has decided to redefine its development strategy, focusing the role of the public sector on its areas ofcomparative advantage and providing an enabling environment for private capital. Consequently, the key objectivesof the Ninth Five-Year Plan (1997-2002) include (a) exit strategies for the government from sectors such as power,where the private sector could be relied upon for needed investments; (b) strategies for improved pricing andmanagement in other sectors, particularly water; and (c) accelerating progress towards universalization, of pritnaryeducation.
Regarding power sector reform, the state's Council of Ministers approved a draft of the Rajasthan Power SectorReforms Bill in 1997, which aims at recasting the role of government away from ownership-and commercialoperations to policy formulation and regulation; eliminating of power subsidy with the exception of cross-subsidization of agriculture; and facilitating private investment in power generation. and distribution. Ina situationof excess demand and long waiting periods for rural power connections, an innovative method of tariffrationalization has been implemented, called the "Nursery Schemne", where agricultural consumers can jump thequeue by paying higher rates (Rs. 1.20 per Kwh compared with Rs. 0.50 charged for ordinary metered connections).
A draft water policy is under consideration, to ensure judicious and economic utilization of this scarce resource(Rajasthan accounts for 10 percent of India's area and for about 5 percent of population but only one-percent of thecountry's water resources). The proposed policy includes rationalization of water rates to reflect its scarcity and tocover annual maintenance costs plus part of the fixed costs, as well as the promotion of users' participation inirrigation management.
Fiscal reforms implemented by GOR include ambitious and comprehensive reforms of sales taxes and sales taxadministration, which may set a model for other Indian states to follow. They include the abolition of internal andexternal checkpoints, adoption of self-assessment for all dealersi reduction in the number of rates and modernizationof administrative procedures. Other reforms being prepared or implemented include (a) review and restructuring ofthe entire public expenditure program including zero-base review of personnel and subsidies; (b) rationalization ofthe size of the civil service; (c) reducing the role of the government in public enterprises reform through institutionalreforms, divestment, privatization or closure; and (d) strict annual ceilings on net borrowing by the state to reducethe fiscal deficit to below 3.5 percent of GSDP by 2001-02, from its current average level of 5.5 percent in 1994-97.
creditworthiness must be restored to attract private restructuring and privatization of the distribution
independent power producers, some states (Orissa, functions of the SEBs (Box 2.3).
Gujarat, UP, Rajasthan, Haryana) have recentlyadopted a new power sector policy that endorses: (i) 2.18 This approach was laid out in a Common
creation of an independent regulatory agency, (ii) Minimum National Action Plan for Power (CMNAP),
tariffs reflecting costs, (iii) competition among issued by the Ministry of Power in December 1996, on
independent power producers, (iv) divestiture of shares the basis of agreements reached in two Chief
in the power generating public companies, and (v) Ministers' meetings (Box 2.4). Steps have been taken
28 Chapter 2. Changing States' Development Policies
Box 2.2: Establishing Fiscal Sustainability in Andhra Pradesh
Ample mineral resources, abundant water, and fertile land make of Andhra Pradesh (AP) one of India's richest statesin terms of resources. In addition, at the time of Independence, AP had one of the country's largest area underirrigation. Its potential and good initial conditions notwithstanding, at 4.6 percent per year in the last 15 years, thestate has grown at lower rates than the country's average, and considerably lower than India's six fastest growingstates (5.7 percent)--and the divergence has been increasing in the recent past. At the heart of AP's performance is thestate's inability to provide essential infrastructure and social services. Over the last several decades, implicit andexplicit subsidies and rapidly growing public employment have absorbed an increasingly large share of the state'sbudget, and diverted resources away from essential investments in infrastructure, operations and maintenance,, and -social services. Total explicit and implicit subsidies now amount to 6 percent of GSDP. Power and food subsidiesalone absorb two-thirds of total subsidies. About 90 percent of state'sf own revenue is spent on salaries. At the sametime, education and health spending fell from 5 percent of GSDP in 1986-87 to 4 percernt in 1995-96. Publicinvestment and O&M declined from 6 percent of GSDP to 4 percent in the same period.
Since July 1996, the state government has taken important measures to improve public finances and sectorvpolicies.In particular, it has increased the cost of subsidized rice; from Rs.; 2 to Rs. 3.5 per kg, an&d reduced 0p0-filyallocations by 25 percent. It has also raised power tariffs by 20-60 pereent to non-agricultural: consumers, and byV 10-25 times in the case of agricultural tariffs. Facing to strong opposition to these measures, i the government ilaterreduced these increases by about 40 percent. While this is a significant increase, the. reviSed average tariffs forfarmers still cover only 9 percent of production costs. Other measures included tax increases; the first steps towardsthe reform of the power sector along the lines established in theCivQINAP and significant increases in irrigationcharges alongside with important institutional reforms, such as the creation of Water. User i Associations and thedevolution of operation and maintenance to them. Additional measures being contemplated iaclude containment ofthe wage bill, further reduction of food subsidies, partial' relaxation; of prohibition, privatization, fuirther4adjustmentsof water and power rates, and other revenue enhancement efforts., The key fiscal objective is to achieve fiscalsustainability through a change in the composition of public expenditure. That is, a. significant reduction .4in:ricesubsidies and employment in the state government and a correspoondingAincreaseAin expenditure in sociail&andinfrastructure sectors particularly in primary education and heallth nutrition, irrigation,i and road isectors. i Fiscalreforms will be accompanied by significant changes in sector policies--restructuring of the power sector; improvementin service delivery of primary education, primary health, and nutrition; strengthening of O&M management in roads;and irrigation sectors, and acceleration of users' participation in the management of public canal irrigation network. Ifsuccessfully implemented the reform program would put AP, on. a path of faster economic growth andf&socialdevelopment.
to implement it. The objectives and content of the service delivery in canal irrigation. Rehabilitation andprogram have been inspired by the pioneering reforms modernization of irrigation schemes would restore thein Orissa several years ago when the state started reliability of water delivery without which farmers willimplementing a comprehensive power sector reform be reluctant to pay higher water charges. It will alsoprogram that goes well beyond the CMNAP's permit the introduction of volume-based pricing ofrecommendations (Box 2.3). Other states are interested water and improved water management practices asin arresting the rapid deterioration of power supply in recommended by the 1992 Report of the Committee on
their respective areas (Box 2.5) and are considering Pricing of Irrigation Water. Institutional reforms, suchimplementing the program. At the same time, however, as the creation of Water Users' Associations, would
Punjab, Bihar and Kerala, have already backtracked provide the basis and necessary financial incentives forfrom the CMNAP's objectives by offering free improved cost recovery as well as improved
electricity for farmers. accountability in the delivery of water services tofarmers. Tamil Nadu, AP, and Orissa recently initiated
2.19 In water, investment for rehabilitation and reforms that would lead to i:mproved cost recovery,modernization, combined with volume-based pricing quality of service delivery to farmers, and systemsand institutional changes would provide the basis for turnover to water users. Karnataka, in its 1995efficient water use, cost recovery, and improved Agricultural Policy Resolution, proposed radically to
Chapter 2. Changing States' Development Policies 29
Box 2.3: State Power Reforms: A Beginning
At the state level, Orissa--which has led the reforms--has enacted an amendment to India's national electricity acts of1910 and 1948: the Orissa Electricity Reform Act which became effective on April 1, 1996. Orissa subsequentlyestablished the Orissa Electricity Regulatory Commission, India's first state-level regulatory commission in the powersector. The Commission announced its first tariff decision and issued its licenses to the transmission and distributioncompany (GRIDCO) in March 1997. The Commission's Tariff Order inter alia authorizes GRIDCO to adjust its tariffseffective from April 1, 1997. The Commission restructured residential and agricultural tariffs so as to contain cross-subsidization. This Order is bound to influence sinmlar tariffproceedings and orders offuture regulatory comnissionsin other states in India..
The Common Minimum National Action Plan for Power (Box 2.2), requires the Government to present to the Parliamentin the course of 1997 a new bill (central act) to create inter alia the Central Electricity Regulatory Commission (CERC)and require the states to establish their own state electricity regulatory commissions (SERCs).
Without waiting for the new central act, a few states are preparing their power reform programs, including the creation ofregulatory commissions along the lines of the Orissa Electricity Regulatory Commission. Two states, Haryana, andRajasthan, have already submitted their reform legislations for central government clearance, ahead of formal submissionto their respective State Assemblies.
At the center, under the proposed new central act, the new CERC would take some of the functions of the CentralElectricity Regulatory Authority (CEA), in particular the setting of tariffs for central sector utilities (such as NTPC) andtariff issues currently handled by CEA (such as IPP tariff issues). The exact division of work between CERC and CEAremains to be worked out in detail. More importantly, unlike CEA today, CERC is expected to have the authority tonotify the tariffs of central utilities, instead of MOP. This should help avoid, for example, the current long delays insetting tariffs for new NTPC and POWERGRID projects. The remaining CEA would become MOP's technical adviser..
At the state level, the impact of the proposed new central act is more difficult to foresee. If enacted, the new central actwould facilitate state power reforms. by allowing reform-minded states to proceed with their reform legislation withoutcentral clearances. That state-center consultation and clearance process took some time in the case of the Orissa project,but may take much less in subsequent projects, particularly after the processing of some of the current cases (Haryana,Rajasthan and Uttar Pradesh) is completed. It is also possible, depending on the exact scope of the central law, that statesmight still have to seek central clearances on other aspects of their reform legislation. For example, the Orissa ElectricityReform Act goes beyond the currently expected scope of the central law. If another state wishes to enact a similar act,notwithstanding the possible enactment of the central act, it would still need further central clearances. Finally, somestates might simply ignore the new act, just like most states today are ignoring some of the financial requirements of theElectricity (Supply) Act, 1948. Because of these considerations, it is of course possible, that the proposed central act in itsfinal form will only enable and promote, but not require, the establishment of SERCs and related retail tariff adjustments.
Ahead of the proposed new central act, the Government promulgated an Ordinance in January 1997 to: (a) facilitate theestablishment of transmission licensees; and (b) open power transmission to private investment. The Parliament did notimmediately convert the Ordinance into an act as had been proposed by the Government and the Ordinance has thereforelapsed. However, it is expected that the matter be considered by the Parliament again in the forthcoming session. Ifapproved, this new act would enable the implementation of private sector transmission projects.
transform institutional incentives in the irrigation 2.20 Reforming the Public Work Departments
sector, but has been slow in implementing reforms. In (PWDs) will remove a major impediment to efficientthe case of urban water, where there is considerable road construction. To overcome the capacityprivate sector interest to invest, but only marginal constraints of PWDs, private professional engineering
efforts to develop the necessary policy and institutional firms need to be contracted to investigate and designframework, some reform-minded municipalities large costly sections of road suitable for construction(Cochin, Tirippur, Devas) have nonetheless been by machine-intensive methods alone. Downsizing andsuccessful at attracting private capital and expertise. retraining of in-house PWD engineering staff will be
30 Chapter 2. Changing States' Development Policies
Box 2.4: The December 1996 Common Minimum National ActionPl:an for Power?
The Central Government will set up an independent Central Electricity-Regulatory Commission (,CERC), which will interalia set the bulk tariffs for all Central generating and transmission utilities. The Central Government.4would make a:comprehensive review of the role of the Central Electricity Authority (CEA). Techno-economic approval of competitivelybid power projects will be simplified and CEA shall not be concerned with capital cost, tariff and other commercialtaspects of the project. However, CEA appraisal will continue for planning and other related matters. The Central.Government will develop a national policyon hydropowerdevelopment.
The role of the Foreign Investment Promotion Board will be minimized by-putting as many projects on*the automatic.clearance route as feasible.
Each State/Union Territory shall set up an independent State Electricity Regulatory Commission (SERC). These SERCswill, initially, fix tariffs only with possible cross-subsidization between categories of consumers. No. sector shall,however, pay less than 50 per cent of the average cost of supply (cost of generation, transmission and distibutin). Tariffsfor agricultural sector will not be less than paise 50/Wh, to be brought-to 50 per cent of the average cost in not more thanthree years. States will have to provide for the financial implications ;ofideviations from tariffs recommended by a SERC.To enable setting up of CERC and SERCs, the Central Government will amend idian Electricity t, 1910, andElectricity (Supply) Act, 1948 and amend accordingly the relevant Acts::and: Rules to allow. private pticipation intransmission. State governments will allow maximum possiblef autono myto the State Electricity Boards (SEBs) and agreeq;to a gradual program of private sector participation in the distribuion of electricity. Finally, States will encurage.cogeneration/captive power plants. To facilitate the "wheeling" of power or through the gid, States shall fo ul clearAfland transparent policies for purchase of power and "wheeling" charges which lprovide fair returns to theCogeneration/Captive power plant owners.
required, especially those involved in the construction investment to ports. Maritime state governments haveof main roads. This new approach would be consistent also initiated similar reforms to develop their ports and
with a smaller but very important role for state PWDs relieve major ports. Some states have already identifiedas planner, administrator, and maintainer of roads. The projects worth US$1 billion to develop their medium
private sector would investigate and design roads, ports. However, despite the attractiveness of such
supervise construction and maintenance, and supply investments to the private sector, they will be
material and equipment. Such a division of considered a complement to, but not a full substitute
responsibilities is common to developed countries and for, investments by the states or individual Port Trusts.is generally efficient. There have been severalinitiatives to develop toll roads with private sector 2.22 India's cities and towns are facing a crisis of
involvement and this is a further reason for the PWDs serious proportions stemming from chronic
to focus on strengthening their planning and regulatory underinvestment in urban areas and consequentcapacity. These reforms are urgently needed because as shortages of key urban services. At the heart of the
much as inadequate resources for maintenance, the problem are the cities' weak fiscal base--eroded by
state of decay of India's roads is also the result of the state legislation imposing rent controls, limits on the
PWDs' operational approach. amount of land an individual can hold, restrictions onland markets, and unrealistically low water charges. In
2.21 Indian ports face acute capacity shortages and some of the main cities, revenues are excessivelylow productivity levels, largely as a result of past dependent on inefficient taxes which need to be
constraining institutional framework with government eliminated--such as octroi. Thus, any program of urbancontrols over the Port Trusts, control over traffic, and reform would need to include measures to: (a) improvelack of inter-port competition. During the past year, the urban areas' use of the existing resource base (such asCentral Government has initiated several measures to a better cost recovery and enforcement of existing
improve the institutional framework and attract private taxes); (b) strengthen the resource base and make it
Chapter 2. Changing States' Development Policies 31
more efficient (such as lifting rent controls in the major
cities, eliminating octroi, establishing efficient land Box 2.5: Haryana Sees the Benefits of Reformmarkets with an effective system of land titling); and(c) establish a rule-based, efficient system of capital Over the last 5 years, the total.net transfers from thegrants to replace the present system. Such measures state to HSEB was conservatively estimated at Rs. 20.5
billion (US$680 million), equivalent to the cost ofwould provide the basis for the restoration of the constructing a 500-MW plant. Also, it was estimatedfinances of the country's cities and towns--and thus that if Haryana were to reform its power sector, the netrestore their capacity to invest in critically needed present value of the economic benefits-ofthe reform
would amount to some Rs. 72 billion (about US$2infrastructure. Over time, they would help billion).municipalities become creditworthy borrowers, able toaccess capital markets and mobilize financing for Since then, Haryana has decided to restrumture and
substantially privatize its . power sector. Thecritically needed investments. Albeit on a small scale, ggvernment's ultimate objective is to withdraw fromthere are already several promising initiatives the power sector as .an operator-and regulator ofunderway (such as the Tamil Nadu Urban Fund) utilities and to have competing, commercially operated.
which, by providing access to capital markets, have utilities functioning in an appropriately-regulatedpower market. Haryana's power sector reformi program
created incentives for municipalities to improve their involves: (i) the unbundling and structural separationfinancial management. of generation, transmission, and . distribution into
separate services to be provided by separate-i2estructuring states ' public expenditures companies; .(ii) the incorporation of-the new companies
under the Companies Act; (iii) privatization of theentire distribution: system;- (iv) private sector
2.23 The key challengefacing tihe states today is to participation in generation and transmission utilities;improve cost recovery by eliminating explicit and (v) competitive biddimig for new generation; (vi) the
implicit subsidies, and reduce unproductive development of an autonomous power sectorregulatory agency; (Vii) supply and end-usefficiency
expenditures. Drastic measures need to be taken to improvements and enhanced environmental protection;increase cost recovery for publicly supplied goods and and, (viii) reforming of electricity tariffs at the bulkservices where there are no externalities or "merit power, transmission, and retail levels. The. Haryana
Electricity Reform Act, which the Government expectsconsiderations involved. On the employment front, to propose to the-next session of the State Assemblyrecruitment needs to be controlled in order to reduce (July-August 1997), will provide 4he legal basis for the:the wage bill, especially in light of the likely implementation of these reforms.
implementation of the Fifth Pay Commission The World. Bank is assisting Haryana in preparing thisrecommendations. Welfare programs need to be reform program and has started to process an operationconsolidated into a limited number of well-defined and to finance part of the large investment .program that
Haryana will need to implement to rehabilitate and..targeted schemes. States may also need to resistexpand-its transmission and distribution systems. Such
implementing centrally-sponsored schemes--which financial support will be in the order of US$350-400they view as additional source of revenue--without million. Other bilateral institutions are also expected toexamnining their financial implications and their contribute.
relevance to state priorities. In order to limit theinterest burden, a more careful selection of projects 2.24 Such measures would enable the states tobased on their rate of return needs to be established. mobilize resources for critical spending on ruralPublic enterprises need to be subjected to a hard budget infrastructure and human resources thus arrestingconstraint by discontinuing the practice of converting recent declines. State subsidies account for 7 percent ofdebt to equity. Privatization of enterprises engaged in GDP, almost twice India's total spending on health andactivities that could be provided more efficiently by the education. Expenditures on health and education areprivate sector, could provide considerable efficiency not only a small share of total state GDP but this shareand fiscal gains. has been declining (Figure 2.2). There is room to
enhance efficiency of service delivery, costeffectiveness, and allocations of expenditure. But
32 Chapter 2. Changing States' Development Policies
spending needs to increase as well. To achieve the states--to whom the constitution delegates thisuniversal enrollment and higher quality education by taxation--chose not to tax.2007, for instance, states such as Andhra Pradesh,Uttar Pradesh, Bihar, Rajasthan, Madhya Pradesh, and Improving the design of inter-governmental transfers
West Bengal would have to increase their real outlaysfor primary education at a rate of 13 percent per year 2.26 Recognizing negative incentive effects implicit(World Bank, 1997). A similar dilemma confronts the in its transfer mechanism, the Tenth Financestates with the lowest levels of health care and--to Commission (TFC) has recommended a number ofvarying degrees--all of India, where per capita innovative and bold measures to enhance states' fiscalgovernment spending of US$2-3 a year is too low to discipline. In particular, the TFC's recommendationmeet the 50-year-old promise of insuring universal (which the central government has accepted but whichaccess to care in Primary Health Centers (for requires a constitutional amendment for itspreventive and basic services). Increasing public implementation) to shift the base for revenue sharingexpenditures for health by roughly half needs to be from a high share of two taxes (personal income taxkept as a goal, but in the fiscally straitened and excises) to a lower share of total tax revenue (thecircumstances of many states, it may be more realistic proposed ratio is 71:29 between the center and thein the short term to aim for a phased reorientation of states), would provide states with a stable source ofoutlays so that three fourths of them go to the primary revenue while improving incentives for enhanced taxand secondary sectors with priority given to the collection by the center. The TFC's secondprovision of medicines and essential supplies. recommendation that central debt forgiveness be tied to
states' own initiatives to retire their debt also wouldStrengthening resource mobilization strengthen fiscal discipline at the state level. Finally,
the phasing out by the year 2000 of grants to states on2.25 On the revenue front, besides increased cost the basis of the gapfill approach would removerecovery, reforms need to focus on improving the incentives for states to run current account deficits andefficiency of taxation, and ensuring tax harmonization encourage fiscal correction. However, less progress hasacross states. Major states need to take the lead in been made regarding the financing of state plans.ensuring that states collectively adhere to the Efforts are needed to ensure that borrowed resourcesrecommendations of the December 1995 Committee of are utilized only for such investment expenditures thatState Finance Ministers to eliminate industrial yield a return adequate to meet the cost of borrowing,incentives and harmonize their sales tax policies. The which should reflect a state's creditworthiness. Theacceleration of states' sales tax reformn could help the latter would provide strong incentives to improve theirestablishment of a VAT. The tax base could be fiscal management.broadened further by taxing agricultural income which
Chapter 3 | SUSTAINING RAPID GROWTH
3.1 India's overarching development objective poor energy conservation practices are two importantduring its Ninth Plan period (1997-02) is "accelerated examples) which reduce productivity growth. Thesegrowth with equity", that is achieving and sustaining 7- and other priority areas for reform are discussed below.8 percent annual rates of growth, compared to about 5percent during the 1980s, and about 6 percent during 3.3 The centrality of fiscal adjustment. As in thethe Eighth Plan period (1992-97), and ensuring that past several years, reducing India's consolidated publicthis growth benefits the poor. A broad consensus has sector deficit remains of central importance for theemerged across India's political spectrum for this achievement of the country's development goals.objective and for continuing the liberalization of the While gains have been made in reducing the centraleconomy. At what speed this will be done remains government deficit, those have been offset by the largehowever an unresolved--yet critical--issue because it cost (0.8 percent of GDP in 1996-97) of subsidizing oilwill determine the country's growth performance. products. As a result, the consolidated public sector
deficit has remained at the relatively high level of 9A. Policy Priorities percent of GDP for the past few years. Yet, it is only
with a more rapid and more significant decline in fiscal3.2 The rapid growth of the last few years has imbalances that the high real interest rates that haveshown how much India stands to gain from prevailed in the recent past will decline. A target of 4deregulation and fiscal adjustment. It has also shown percent of GDP for the consolidated central and statethat the economy is facing capacity constraints, most governments deficit (from 6.8 percent of GDP atnotably in infrastructure. High interest rates are an present) may be a realistic goal to achieve in the nextindication of stress on domestic resources which has 3-4 years while privatization of public enterprisesbeen at the origin of pressures put on the authorities to would enable the government to retire public debt andaccelerate, perhaps prematurely, the opening of the reduce interest costs. The benefits of a more rapidcapital account--a development that in all correction of fiscal imbalances go well beyond justcircumstances would need to be carefully synchronized lower interest rates and higher investment. Lower fiscalwith India's progress in reducing fiscal imbalances, in deficits and interest rates would provide the favorablerestoring the health of its banking system, in opening conditions for an acceleration of banking reform,its trade account, and in diversifying its exports. would help improve the health of the financial system,Resources are also being strained in agriculture. Over would provide more flexibility to the RIBI in thethe last few decades, India's agriculture has grown conduct of monetary policy, would reduce pressure fordependent on extremely large subsidies (on power, opening the capital account ahead of the structuralwater, fertilizer, to name just the main ones) which reforms needed to make it a success, and would makemay initially have contributed to the spread of it easier to manage the balance of payments, surges intechnological advances, but which now put an capital inflows, and possible external shocks.unsustainably large burden on central and state International experience shows that a strong fiscalgovernment budgets, and also are at the origin of position has a central role in managing effectively themicroeconomic distortions and misuse of resources (of capital and current accounts of the balance ofwhich overexploitation of groundwater resources and payments.
34 Chapter 3. Sustaining Rapid Growth
3.4 Also, as highlighted in the May 1997 their resolution. Recent declines in central governmentgovernment paper on subsidies, central and state financial support to the states have provided some--butgovernment deficits are linked to significant as yet insufficient--impetus to the states to start takingmicroeconomic distortions whose cost they bear. Again corrective actions.in this case, the benefits of fiscal corrections go beyondimprovements in the macroeconomic framework-- 3.6 Addressing the challenge of infrastructure.
because they are tantamount to correcting severe price Much has been said and written on India'sdistortions and misguided sector policies which are extraordinarily large infrastructure problems. Thehampering development. Power is one well known recently completed report of an Expert Group oncase where the correction of price distortions would infrastructure provides a sobering review of India'snot only reduce state governments fiscal imbalances tremendous infrastructure problems and makes three(by close to 2 percent of GDP), but would also lead to recommendations to address ihem. The first is fiscala more efficient use of resources, and provide the basis reforms to strengthen state and local governmentsfor private capital in power and the much needed capacity to mobilize resources to invest incapacity expansion. Similarly, correction of oil price infrastructure. This is particularly important fordistortions through elimination of administrative infrastructure of a public nature where benefits are bestcontrols would not only reduce the consolidated public captured through taxation. The second is regulatorysector deficit but also reduce the overuse of subsidized and pricing reforms to translate India's inmmensefuels such as diesel and kerosene, and eliminate an infrastructure needs into viable commercial ventures,important deterrent to private sector entry in oil capable of attracting private capital. The third isexploration and refining. The deregulation of oil prices financial sector reforms to eniable the large pool ofmay need to be accompanied with some temporary India's financial savings to flow to high returnsexplicit budget subsidy to cushion the impact of price infrastructure investments.increases on low-income groups, but it would enablethe government to make explicit the cost of current oil 3.7 Progress has been achieved at the level of theprice policies, and remove uncertainties related to the central government in the recent past on issues relatedpolicy regime. Similar situations exist in a number of to fiscal and regulatory reform. At the level of theother sectors such as irrigation and urban water supply states, however, while there have been initiatives ofwhere the fiscal cost is just a fraction of the costs that reform in some of the most progressive states, thesedistortions put on the economy--by encouraging the have not been commensurate with the severity of themisuse of resources and deterring private investment. situation and circumscribed to a few states. In the
financial sector, the last four years have seen a3.5 In addition to the macro-and micro-economic transformation of the banking system and capitaldimensions of fiscal adjustment, a third, and at least as markets. Yet, a large segment of the fmancial system-important one, is that of expenditure composition, insurance companies and pension funds-remains underparticularly at the level of the states. In most states, government ownership and control. Unless theunproductive expenditure to finance the cost of financial resources mobilized by contractual savingsubsidies, an excessively large labor force, and institutions are made available to the entire economy,government activities which are not of a development India will not be able to develop long-term debtnature, all absorb a large share of state governments markets on the scale needed to contribute to thebudgets. To a large extent, the deterioration of India's financing of India's large infrastructure needs. It wouldinfrastructure, and the difficulties the country is be important to deregulate the sector, end the stateexperiencing to mobilize resources to accelerate the monopoly on insurance, and open insurance to privatedevelopment of its human resources are the result of sector capital and expertise as has been recommendedstates' pricing and sectoral policies and the associated by the 1995 government appointed Malhotraimplied subsidies--and it is also with the states that lies Committee.
Chapter 3. Sustaining Rapid Growth 35
3.8 Banking reforms. It is also becoming evident production every year because of the poor quality and
that the public banks need more operational autonomy- high cost of storage. Because the incomes of the poor-within a strengthened RBI supervisory framework-- are so closely associated to the fortunes of the
and a change in the incentives framework to respond to agricultural sector, a liberalization of agriculture wouldthe growing competition from new private banks and not only have positive growth effects, it would also
NBFCs. Further banking and financial deregulation help increase the incomes of the poor.(reducing government equity in the capital of publicbanks and further reductions in the SLR) would reduce 3.10 Completing the liberalization of the trade and
the influence of government on commercial banks' investment regimes remains an important policy
basic business decisions (such as on hiring, on pay objective. Since reforms started in 1991, India'sscales, branch expansion or closure). It would also import-weighted tariff has been reduced from 87eliminate the current restrictions to entry and thus percent to around 20 percent at present. The 1997-98permit more vigorous competition from private banks. budget indicates that the process will continue, untilThe RBI is gradually strengthening its oversight India reaches the tariff levels of its East Asian
capabilities, and this provides the basis for a further neighbors--that is around 10-15 percent at present.deregulation of the banking system. At the same time, There are also indications that the government intendsto ensure adequate provision of credit to agriculture, it to eliminate restrictions on consumer goods in a phasedwould be essential to bring rural credit reform to its manner. Implementation of this agenda would improvelogical conclusion. A coherent strategy for increasing considerably the competitiveness of India'sflows to agriculture and other rural economic activities manufacturing, as would a further deregulation of themust address issues of access to financial services by investment regime. The radical liberalization of the lastthe rural population in general, as well as the financial six years notwithstanding, important regulations
sustainability of the rural financial institutions continue to restrict investment in small scale industriesthemselves. Further measures are needed to encourage and agro-industries. There is ample evidence, includingand facilitate an orderly re-orientation of India's rural the recent Abid Hussain Report and other studies infinancial system from the supply-led approach of India and elsewhere to show that small scale industries
concessional, targeted agriculture credit, to the benefit more from adequate access to infrastructure,systematic development of demand-oriented rural finance, and imported inputs, than protection fromfinancial markets. competition. The economic costs of size limitation in
agro-industry and manufacturing are significant,3.9 Deregulating agriculture. Deregulation would particularly because these industries are usually export-
enable agriculture to achieve potentially large oriented and labor-intensive. While some liberalization
efficiency gains (estimated at several percentage points measures were taken recently, the remaining
of GDP) and provide a basis for the removal of constraints are severe. As trade liberalization proceeds,
subsidies. The 1997-98 Budget contains the first steps small industry domestic producers will be at a
of a promising beginning of reforms at the level of the disadvantage compared with foreign competitors
central government, which could provide impetus-- whose costs bear the gains of large-scale productions
although it has not thus far--for similar reforms at the systems.
level of the states. Deregulation of agro-industry is alsocrucial. Important segments of the agro-industrial 3.11 Managing the capital account. Historically,sector are still regulated by industrial licenses or scale India had a highly restrictive capital account regime.limitations which impose large costs on an industry Foreign direct investment (FDI) was strictly limited;characterized by economies of scale. Similarly, the external commercial borrowing was tightly controlled;
development of the storage industry has been and capital outflows were prohibited. Substantialhampered by a complex system of controls--which may inflows from non-resident Indians (NRls) were,
be responsible for the significant losses of grain however, channeled through the banking system. After
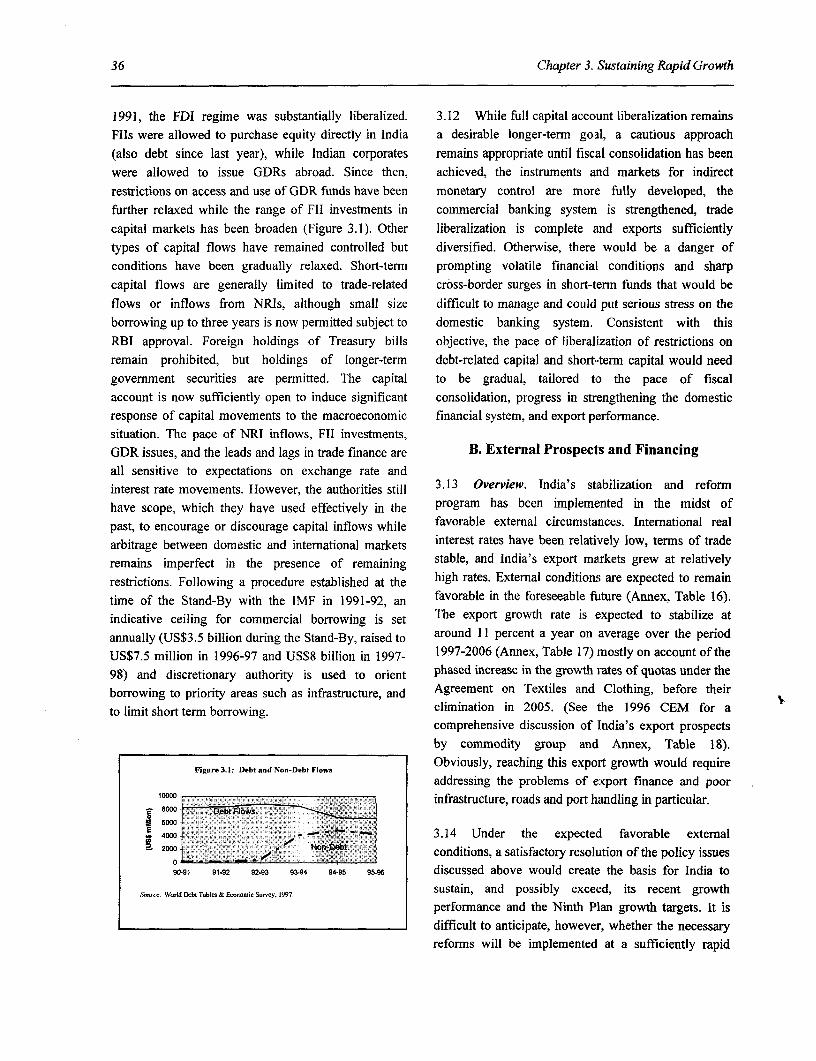
36 Chapter 3. Sustaining Rapid Growth
1991, the FDI regime was substantially liberalized. 3.12 While full capital account liberalization remainsFlls were allowed to purchase equity directly in India a desirable longer-termn goal, a cautious approach(also debt since last year), while Indian corporates remains appropriate until fiscal consolidation has beenwere allowed to issue GDRs abroad. Since then, achieved, the instruments and markets for indirectrestrictions on access and use of GDR funds have been monetary control are more fully developed, thefurther relaxed while the range of FII investments in commercial banking system is strengthened, tradecapital markets has been broaden (Figure 3.1). Other liberalization is complete and exports sufficientlytypes of capital flows have remained controlled but diversified. Otherwise, there would be a danger ofconditions have been gradually relaxed. Short-term prompting volatile financial conditions and sharpcapital flows are generally limited to trade-related cross-border surges in short-term funds that would beflows or inflows from NRIs, although small size difficult to manage and could put serious stress on theborrowing up to three years is now permitted subject to domestic banking system. Consistent with thisRBI approval. Foreign holdings of Treasury bills objective, the pace of liberalization of restrictions on
remain prohibited, but holdings of longer-term debt-related capital and short-tern capital would needgovernment securities are permitted. The capital to be gradual, tailored to the pace of fiscalaccount is now sufficiently open to induce significant consolidation, progress in strengthening the domesticresponse of capital movements to the macroeconomic financial system, and export performance.situation. The pace of NRI inflows, FII investments,GDR issues, and the leads and lags in trade finance are B. External Prospects and Financingall sensitive to expectations on exchange rate andinterest rate movements. However, the authorities still 3.13 Overview. India's stabilization and reformhave scope, which they have used effectively in the program has been implemented in the midst ofpast, to encourage or discourage capital inflows while favorable external circumstances. International realarbitrage between domestic and international markets interest rates have been relatively low, terms of traderemains imperfect in the presence of remaining stable, and India's export markets grew at relativelyrestrictions. Following a procedure established at the high rates. External conditions are expected to remaintime of the Stand-By with the IMF in 1991-92, an favorable in the foreseeable future (Annex, Table 16).indicative ceiling for commercial borrowing is set The export growth rate is expected to stabilize atannually (US$3.5 billion during the Stand-By, raised to around 11 percent a year on average over the periodUS$7.5 million in 1996-97 and US$8 billion in 1997- 1997-2006 (Annex, Table 17) mostly on account of the98) and discretionary authority is used to orient phased increase in the growth rates of quotas under theborrowing to priority areas such as infrastructure, and Agreement on Textiles and Clothing, before theirto limit short term borrowing. elimination in 2005. (See the 1996 CEM for a
comprehensive discussion of I'ndia's export prospectsby commodity group and Annex, Table 18).
Figure 3.1: Debt and Non-Debt Flows Obviously, reaching this export growth would requireaddressing the problems of export finance and poor
P*btow& _ infrastructure, roads and port handling in particular.c 6000
.. 0004000 - 3.14 Under the expected. favorable external> 2000 f ii t; <>;i<=RKj conditions, a satisfactory resolution of the policy issues
90-91 91-92 92S93 93-94 94-95 95-96 discussed above would create the basis for India to
.9,' Wo-1d Debt Tbls & Eonooi. Suncy. 1997. sustain, and possibly exceed, its recent growthperfornance and the Ninth Plan growth targets. It is
difficult to anticipate, however, whether the necessaryreforms will be implemented at a sufficiently rapid
Chapter 3. Sustaining Rapid Growth 37
pace. Contrary to the initial phase of reform when investor base of institutional investors and pension
initiatives by a few ministries (Finance, Commerce and funds expands, more of the private capital flows are
Industry) and the RBI were sufficient to transform likely to take the form of portfolio--especially equity-
India's policy regime, the reforms that are necessary in flows. While the large inflows of portfolio capital to
this phase require determined action by a much wider India has been part of the broader flow to emerging
range of central ministries (of which markets in the first half of the 1990s in general, there
Telecommunication, Power, Petroleum, Surface are clearly country-specific factors at play. These
Transport, Agriculture, Food Supplies are a few include the existence of well-known corporate names
examples) and the states--with whom lie the initiative with established track records in India; rule-based and
for the most critical reforms. Therefore, underlying the reasonably well developed stock markets; familiar
projections in Table 9 (Annex) is the assumption that accounting and legal systems; and the potential for
the reforms will be implemented at a somehow slower growth in a large domestic market.
pace than what would be required to sustain growth inthe 7-9 percent range, and that growth will be in the 6- 3.16 India will continue to need to rely on official
6.5 percent range. In this scenario, the current account development assistance, notwithstanding the growing
deficit is projected to remain at a comfortable level, role of private inflows. Besides India's low level of perbelow 2 percent of GDP, during the forecast period. capita GDP (US$350), official development assistance
India's external debt of US$94 billion would decline as is also critically necessary for India to meet its
a share of GDP from the present 27 percent to 22 enormous needs for infrastructure and human resource
percent by the end of the decade, and 17 percent by the development. As indicated in the Poverty Assessmentyear 2006. As a share of current account receipts, the Report, distributed to members of India Development
debt service ratio is expected to decline from around 24 Forum (IDF), India's poverty remains widespread and
percent in 1996-97 to 13 percent by the end of the the lives of many of India's more than 300 million
decade and 11 percent by 2006. At the same time, poor are burdened by poor health, illiteracy, and social
profits and other remittances flows on account of non- inequalities. Prospects for improving their standards of
debt capital inflows would increase. living depend on India's ability to promote growth andinvest in human resources development. While the
3.15 Private and official capital flows. In 1996, private sector shows strong interest in investing in a
private net capital flows to all developing countries number of infrastructure areas, particularly power and
grew by 32 percent reaching a record level of US$244 telecommunications, ari important role remains for
billion. A broader range of investors and lenders public sector investment in some key areas--such as
participated in the private financing of developing roads, rural infrastructure and social services--which
countries needs; maturities shortened and yield premia would need to be substantially increased. Such
narrowed for most developing countries. The long- investments are crucial for sustaining rapid growth and
termn outlook for sustained net inflows of private ensuring that the poor participate in the growth
capital to developing countries remains favorable. Such process. The Bank therefore recommends that the
factors as moderate world real interest rates, continued members of the IDF should aim for official
liberalization in developing countries (which will development assistance that directly supports priority
continue to reduce the perceived risk and raise the public investments in physical infrastructure and
expected rate of return from investing in emerging human capital development. This investment would
markets), portfolio diversification in industrial also help crowd-in the necessary complementary
countries are likely to support further significant private investment particularly in physical
growth in private flows over the coming decade and infrastructure. In addition to the financial flows,
India stands to attract a significant share of these official development assistance is also crucial to build
private flows with the shift to private financing institutional capacity particularly at the level of the
especially of infrastructure investment. As the new state and local governments. Therefore, as had last
38 Chapter 3. Sustaining Rapid Growth
year's CEM, this report makes a case for India's following four years. Bilateral and multilateral
continued access to long-term assistance, including a participants at last year's India Development Forum
substantial concessional component. In view of its still pledged about US$6.7 billion in official assistance to
current high debt burden, India would need to continue India's development efforts as a recognition of India's
to prudently manage its external debt. With an strong commitment to reforrn and need to accelerate
expected modest current account deficit of 2 percent of growth and reduce poverty and a similar amount isGDP over the next few years and the necessary build- expected for this year. Debt and non-debt commercialup of reserves, India would still require total gross sources are expected to account for the country's
financing of close to US$14 billion in 1997-98, and an remaining financing needs.
average of about US$17 billion in each of the

X- 3MM
40 Annex
Table 1 Growth performance, 1981-97
Table 2 Index of industrial production, 1981-97
Table 3 Domestic demand, 1981-96
Table 4 Central government finances, 1990-98
Table 5 Selected monetary indicators, 1990-97
Table 6 Key interest rates, 1990-97
Table 7 Real exchange rate of India's main trading partners and competitors 1981-96
Table 8 Foreign direct and portfolio investment
Table 9 Balance of payments, 1991-97
Table 10 Sectorwise import tariffs
Table 11 Performance of the Indian public sector banks, 1995-96
Table 12 Year-wisefPSU-wise details of shares disinvested since 1991-92
Table 13 Details of mobilisation in the primary market
Table 14 Evolution of the public debt stock, 1990-96
Table 15 Interest rates and payments on public debt
Table 16 External environment for India
Table 17 Sources and growth of India's foreign exchange earnings
Table 18 Performance of key export sectors
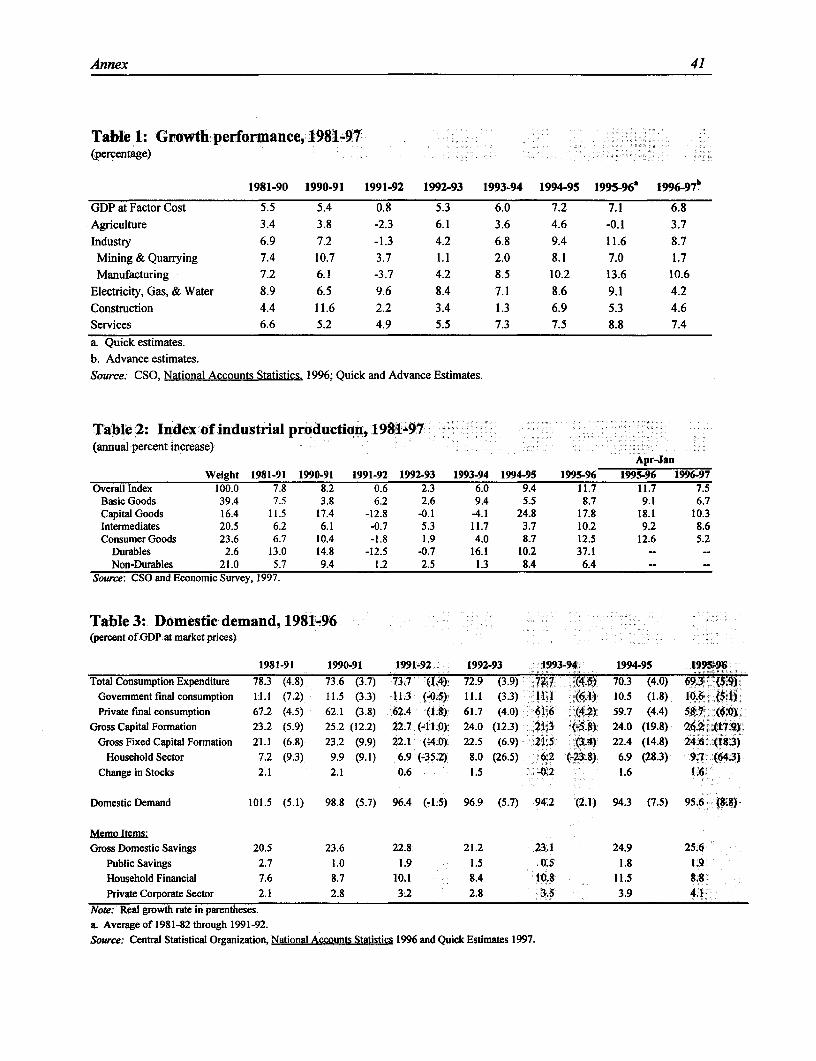
Annex 41
Table 1: Growth performance, 1981-97(percentage)
1981-90 1990-91 1991-92 1992-93 1993-94 1994-95 1995-96 1 9 9 69 7 .
GDP at Factor Cost 5.5 5.4 0.8 5.3 6.0 7.2 7.1 6.8
Agriculture 3.4 3.8 -2.3 6.1 3.6 4.6 -0.1 3.7
Industry 6.9 7.2 -1.3 4.2 6.8 9.4 11.6 8.7Mining & Quarrying 7.4 10.7 3.7 1.1 2.0 8.1 7.0 1.7
Manufacturing 7.2 6.1 -3.7 4.2 8.5 10.2 13.6 10.6
Electricity, Gas, & Water 8.9 6.5 9.6 8.4 7.1 8.6 9.1 4.2
Construction 4.4 11.6 2.2 3.4 1.3 6.9 5.3 4.6Services 6.6 5.2 4.9 5.5 7.3 7.5 8.8 7.4
a. Quick estimates.b. Advance estimates.Source: CSO, National Accounts Statistics. 1996; Quick and Advance Estimates.
Table 2: Index of industrial production, 1981-97(annual percent increase)
Apr-JanWeight 1981-91 1990-91 1991-92 1992-93 1993-94 1994-95 1995-96 1995-96 1996-97
Overall Index 100.0 7.8 8.2 0.6 2.3 6.0 9.4 11.7 11.7 7.5Basic Goods 39.4 7.5 3.8 6.2 2.6 9.4 5.5 8.7 9.1 6.7Capital Goods 16.4 11.5 17.4 -12.8 -0.1 -4.1 24.8 17.8 18.1 10.3Intermediates 20.5 6.2 6.1 -0.7 5.3 11.7 3.7 10.2 9.2 8.6Consumer Goods 23.6 6.7 10.4 -1.8 1.9 4.0 8.7 12.5 12.6 5.2
Durables 2.6 13.0 14.8 -12.5 -0.7 16.1 10.2 37.1 - -Non-Durables 21.0 5.7 9.4 1.2 2.5 1.3 8.4 6.4 - -
Source: CSO and Economic Survey, 1997.
Table 3: Domestic demand, 1981-96(percent of GDP at market prices)
1981-91 1990-91 1991-92 1992-93 1993-94 1994-95 1995-96Total Consumption Expenditure 78.3 (4.8) 73.6 (3.7) 73.7 (1.4) 72.9 (3.9) 72.7 (4-5) 70.3 (4.0) 69.3 ::(5,9)
Government final consumption 11.1 (7.2) 11.5 (3.3) 11.3 (-0.5) 11.1 (3.3) 11J1 (6.1) 10.5 (1.8) 10.6 .1)Private final consumption 67.2 (4.5) 62.1 (3.8) 62.4 (1.8) 61.7 (4.0) 61,6 (42) 59.7 (4.4) 58.7 (6.0)
Gross Capital Formation 23.2 (5.9) 25.2 (12.2) 22.7 (-11.0). 24.0 (12.3) 21.3 (-5.8) 24.0 (19.8) 26.2 (17.91Gross Fixed Capital Formation 21.1 (6.8) 23.2 (9.9) 22.1 (-4.0) 22.5 (6.9) 21,5 (3.4) 22.4 (14.8) 24.6 (18.3)
Household Sector 7.2 (9.3) 9.9 (9.1) 6.9 (-35.2) 8.0 (26.5) 6,2 (-23.8) 6.9 (28.3) 9.7 (64.3)Change in Stocks 2.1 2.1 0.6 1.5 -0.2 1.6 1.6
Domestic Demand 101.5 (5.1) 98.8 (5.7) 96.4 (-1.5) 96.9 (5.7) 94.2 (2.1) 94.3 (7.5) 95.6 (8.8)
Memo Itcms:Gross Domestic Savings 20.5 23.6 22.8 21.2 23.1 24.9 25.6
Public Savings 2.7 1.0 1.9 1.5 0.5 1.8 1.9Household Financial 7.6 8.7 10.1 8.4 10.8 11.5 8.8Private Corporate Sector 2.1 2.8 3.2 2.8 3.5 3.9 4-1
Note: Real growth rate in parentheses.a. Average of 1981-82 through 1991-92.Source: Central Statistical Organization, National Accounts Statistics 1996 and Quick Estimates 1997.
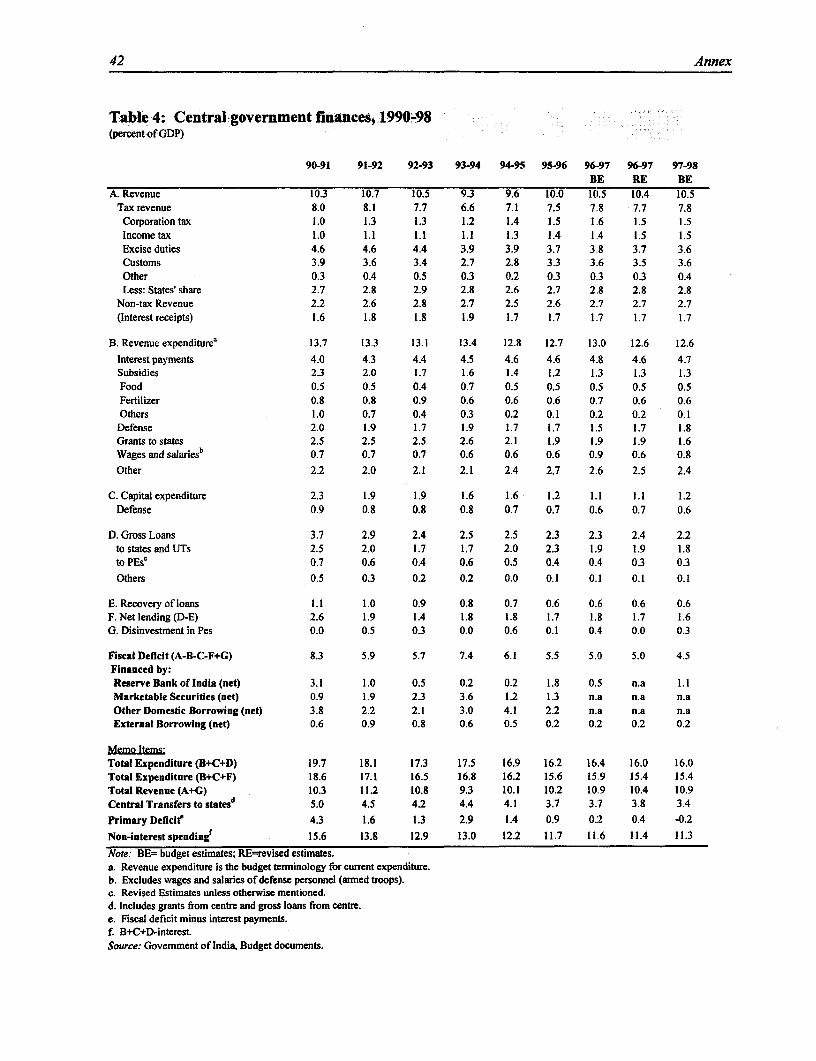
42 Annex
Table 4: Central government finances, 1990-98(percent of GDP)
90-91 91-92 92-93 93-94 94-95 95-96 96-97 96-97 97-98BE RE BE
A. Revenue 10.3 10.7 10.5 9.3 9.6 10.0 10.5 10.4 10.5Tax revenue 8.0 8.1 7.7 6.6 7.1 7.5 7.8 7.7 7.8Corporation tax 1.0 1.3 1.3 1.2 1.4 1.5 1.6 1.5 1.5Income tax 1.0 1.1 1.1 1.1 1.3 1.4 1.4 1.5 1.5Excise duties 4.6 4.6 4.4 3.9 3.9 3.7 3.8 3.7 3.6Customs 3.9 3.6 3.4 2.7 2.8 3.3 3.6 3.5 3.6Other 0.3 0.4 0.5 0.3 0.2 0.3 0.3 0.3 0.4Less: States' share 2.7 2.8 2.9 2.8 2.6 2.7 2..8 2.8 2.8
Non-tax Revenue 2.2 2.6 2.8 2.7 2.5 2.6 2 7 2.7 2.7(Interestreceipts) 1.6 1.8 1.8 1.9 1.7 1.7 1.7 1.7 1.7
B. Revenue expenditure' 13.7 13.3 13.1 13.4 12.8 12.7 13.0 12.6 12.6
Interest payments 4.0 4.3 4.4 4.5 4.6 4.6 4.8 4.6 4.7Subsidies 2.3 2.0 1.7 1.6 1.4 1.2 1.3 1.3 1.3Food 0.5 0.5 0.4 0.7 0.5 0.5 0.5 0.5 0.5Fertilizer 0.8 0.8 0.9 0.6 0.6 0.6 0.7 0.6 0.6Others 1.0 0.7 0.4 0.3 0.2 0.1 0.2 0.2 0.1Defense 2.0 1.9 1.7 1.9 1.7 1.7 1.5 1.7 1.8Grants to states 2.5 2.5 2.5 2.6 2.1 1.9 1.9 1.9 1.6Wages and salariesb 0.7 0.7 0.7 0.6 0.6 0.6 0.9 0.6 0.8
Other 2.2 2.0 2.1 2.1 2.4 2.7 2.6 2.5 2.4
C. Capital expenditure 2.3 1.9 1.9 1.6 1.6 1.2 1.1 1.1 1.2Defense 0.9 0.8 0.8 0.8 0.7 0.7 0.6 0.7 0.6
D. Gross Loans 3.7 2.9 2.4 2.5 .2.5 2.3 2.3 2.4 2.2to states and UTs 2.5 2.0 1.7 1.7 2.0 2.3 1.9 1.9 1.8to PEse 0.7 0.6 0.4 0.6 0.5 0.4 0.4 0.3 0.3
Others 0.5 0.3 0.2 0.2 0.0 0.1 0.1 0.1 0.1
E. Recovery of loans 1.1 1.0 0.9 0.8 0.7 0.6 0.6 0.6 0.6F. Net lending (D-E) 2.6 1.9 1.4 1.8 1.8 1.7 1.8 1.7 1.6G. Disinvestment in Pes 0.0 0.5 0.3 0.0 0.6 0.1 0.4 0.0 0.3
Fiscal Deficit (A-B-C-F+G) 8.3 5.9 5.7 7.4 6.1 5.5 5.0 5.0 4.5Financed by:Reserve Bank of India (net) 3.1 1.0 0.5 0.2 0.2 1.8 0.5 n.a 1.1Marketable Securities (net) 0.9 1.9 2.3 3.6 1.2 1.3 n.a n.a n.aOther Domestic Borrowing (net) 3.8 2.2 2.1 3.0 4.1 2.2 n.a n.a n.aExternal Borrowing (net) 0.6 0.9 0.8 0.6 0.5 0.2 0.2 0.2 0.2
Memo Items,Total Expenditure (B+C+D) 19.7 18.1 17.3 17.5 16.9 16.2 16.4 16.0 16.0Total Expenditure (B+C+F) 18.6 17.1 16.5 16.8 16.2 15.6 15.9 15.4 15.4Total Revenue (A+G) 10.3 11.2 10.8 9.3 10.1 10.2 10.9 10.4 10.9Central Transfers to statesd 5.0 4.5 4.2 4.4 4.1 3.7 3.7 3.8 3.4
Primary Deficite 4.3 1.6 1.3 2.9 1.4 0.9 0.2 0.4 -0.2Non-interestspendingf 15.6 13.8 12.9 13.0 12.2 11.7 11.6 11.4 11.3
Note: BE= budget estimates; RE-revised estimates.a. Revenue expenditure is the budget terminology for current expenditure.b. Excludes wages and salaries of defense personnel (armed troops).c. Revised Estimates unless otherwise mentioned.d. Includes grants from centre and gross loans from centre.e. Fiscal deficit minus interest payments.f. B+C+D-interest.Source: Government of India, Budget documents.
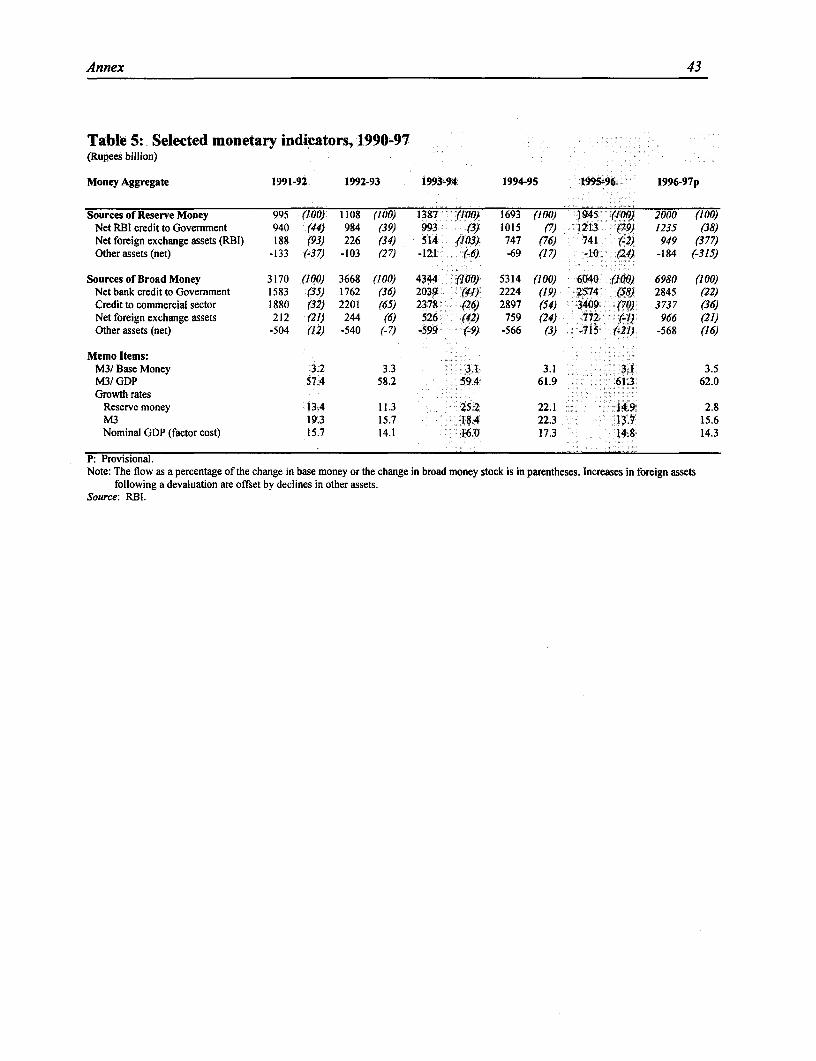
Annex 43
Table 5: Selected monetary indicators, 1990-97(Rupees billion)
Money Aggregate 1991-92 1992-93 1993-94 1994-95 1995-96 1996-9 7 p
Sources of Reserve Money 995 (100) 1108 (100) 1387 (100) 1693 (100) 1945 (100) 2000 (100)Net RBI credit to Govemment 940 (44) 984 (39) 993 (3) 1015 (7) 1213 (79) 1235 (38)Net foreign exchange assets (RBI) 188 (93) 226 (34) 514 (103) 747 (76) 741 (-2) 949 (377)Otherassets (net) -133 (-37) -103 (27) -121 -(-6) -69 (17) -10 24) -184 (-315)
Sources of Broad Money 3170 (100) 3668 (100) 4344 (100) 5314 (100) 6040 (100) 6980 (100)Net bank credit to Government 1583 (35) 1762 (36) 2039 (41) 2224 (19) 2574 (58) 2845 (22)Credit to commercial sector 1880 (32) 2201 (65) 2378 (26) 2897 (54) 3409 (70) 3737 (36)Net foreign exchange assets 212 (21) 244 (6) 526 (42) 759 (24) 772 (-1) 966 (21)Other assets (net) -504 (12) -540 (-7) -599 (-9) -566 (3) -715 (-21) -568 (16)
Memo Items:M3/Base Money 3.2 3.3 3.1 3.1 3.1 3.5M31 GDP 57.4 58.2 59.4 61.9 61.3 62.0Growth rates
Reserve money 13.4 11.3 25.2 22.1 14.9 2.8M3 19.3 15.7 18.4 22.3 13.7 15.6Nominal GDP (factor cost) 15.7 14.1 16.0 17.3 14.8 14.3
P: Provisional.Note: The flow as a percentage of the change in base money or the change in broad money stock is in parentheses. Increases in foreign assets
following a devaluation are offset by declines in other assets.Source: RBI.
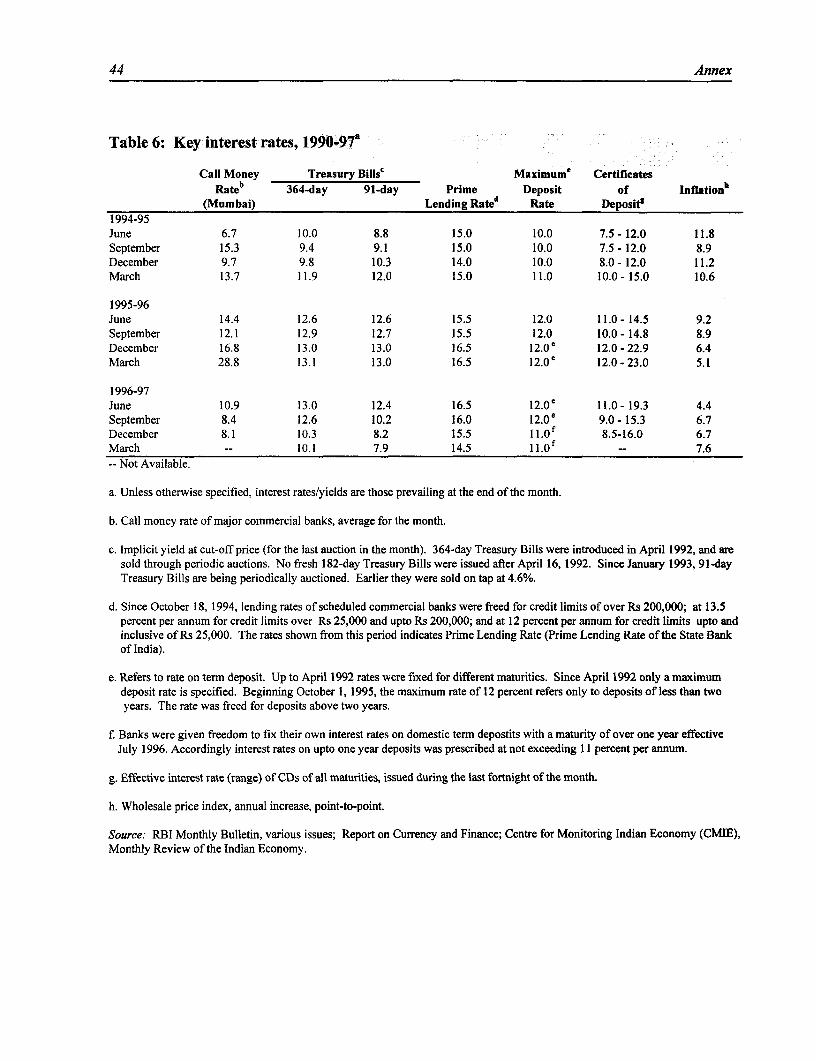
44 Annex
Table 6: Key interest rates, 1990497:
Call Money Treasury Bills' Maximume CertificatesRateb 364-day 91-day Prime Deposit of Inflationb
(Mumbai) Lending Rated Rate Deposit'1994-95June 6.7 10.0 8.8 15.0 10.0 7.5- 12.0 11.8September 15.3 9.4 9.1 15.0 10.0 7.5- 12.0 8.9December 9.7 9.8 10.3 14.0 10.0 8.0 - 12.0 11.2March 13.7 11.9 12.0 15.0 11.0 10.0- 15.0 10.6
1995-96June 14.4 12.6 12.6 15.5 12.0 11.0 - 14.5 9.2September 12.1 12.9 12.7 15.5 12.0 10.0- 14.8 8.9December 16.8 13.0 13.0 16.5 12.0e 12.0 - 22.9 6.4March 28.8 13.1 13.0 16.5 12.0' 12.0-23.0 5.1
1996-97June 10.9 13.0 12.4 16.5 12.0' 11.0- 19.3 4.4September 8.4 12.6 10.2 16.0 12.0e 9.0- 15.3 6.7December 8.1 10.3 8.2 15.5 11.0f 8.5-16.0 6.7March -- 10.1 7.9 14.5 11.0 -- 7.6-- Not Available.
a. Unless otherwise specified, interest rates/yields are those prevailing at the end of the month.
b. Call money rate of major commercial banks, average for the month.
c. Implicit yield at cut-off price (for the last auction in the month). 364-day Treasury Bills were introduced in April 1992, and aresold through periodic auctions. No fresh 182-day Treasury Bills were issued after April 16, 1992. Since January 1993, 91-dayTreasury Bills are being periodically auctioned. Earlier they were sold on tap at 4.6%.
d. Since October 18, 1994, lending rates of scheduled commercial banks were freed for credit limits of over Rs 200,000; at 13.5percent per annum for credit limits over Rs 25,000 and upto Rs 200,000; and at 12 percent per annum for credit limits upto andinclusive of Rs 25,000. The rates shown from this period indicates Prime Lending Rate (Prime Lending Rate of the State Bankof India).
e. Refers to rate on term deposit. Up to April 1992 rates were fixed for different maturities. Since April 1992 only a maximumdeposit rate is specified. Beginning October 1, 1995, the maximum rate of 12 percent refers only to, deposits of less than twoyears. The rate was freed for deposits above two years.
f. Banks were given freedom to fix their own interest rates on domestic term depostits with a maturity of over one year effectiveJuly 1996. Accordingly interest rates on upto one year deposits was prescribed at not exceeding 11 percent per annum.
g. Effective interest rate (range) of CDs of all maturities, issued during the last fortnight of the month.
h. Wholesale price index, annual increase, point-to-point.
Source: RBI Monthly Bulletin, various issues; Report on Currency and Finance; Centre for Monitoring Indian Economy (CMIE),Monthly Review of the Indian Economy.
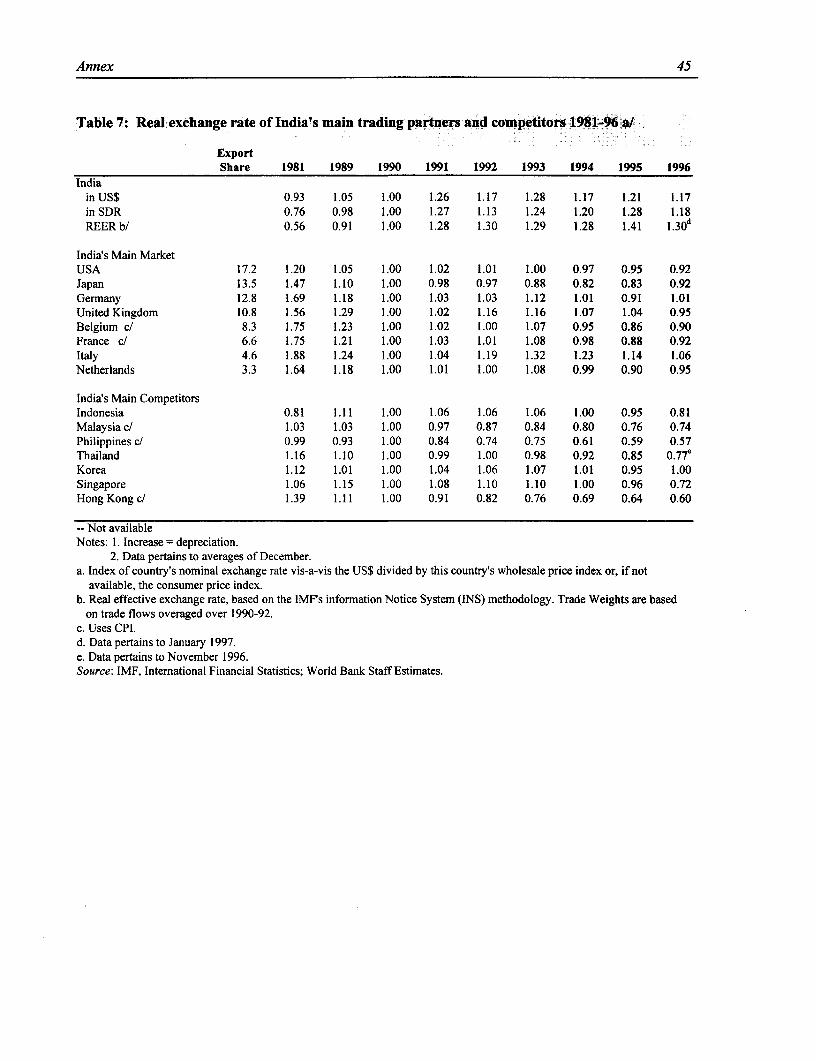
Annex 45
Table 7: Real exchange rate of India's main trading partners and competitors 1981-96 a/
ExportShare 1981 1989 1990 1991 1992 1993 1994 1995 1996
Indiain US$ 0.93 1.05 1.00 1.26 1.17 1.28 1.17 1.21 1.17in SDR 0.76 0.98 1.00 1.27 1.13 1.24 1.20 1.28 1.18REERb/ 0.56 0.91 1.00 1.28 1.30 1.29 1.28 1.41 1 3 0 d
India's Main MarketUSA 17.2 1.20 1.05 1.00 1.02 1.01 1.00 0.97 0.95 0.92Japan 13.5 1.47 1.10 1.00 0.98 0.97 0.88 0.82 0.83 0.92Germany 12.8 1.69 1.18 1.00 1.03 1.03 1.12 1.01 0.91 1.01United Kingdom 10.8 1.56 1.29 1.00 1.02 1.16 1.16 1.07 1.04 0.95Belgium c/ 8.3 1.75 1.23 1.00 1.02 1.00 1.07 0.95 0.86 0.90France c/ 6.6 1.75 1.21 1.00 1.03 1.01 1.08 0.98 0.88 0.92Italy 4.6 1.88 1.24 1.00 1.04 1.19 1.32 1.23 1.14 1.06Netherlands 3.3 1.64 1.18 1.00 1.01 1.00 1.08 0.99 0.90 0.95
India's Main CompetitorsIndonesia 0.81 1.11 1.00 1.06 1.06 1.06 1.00 0.95 0.81Malaysia c/ 1.03 1.03 1.00 0.97 0.87 0.84 0.80 0.76 0.74Philippines cl 0.99 0.93 1.00 0.84 0.74 0.75 0.61 0.59 0.57Thailand 1.16 1.10 1.00 0.99 1.00 0.98 0.92 0.85 0.77eKorea 1.12 1.01 1.00 1.04 1.06 1.07 1.01 0.95 1.00Singapore 1.06 1.15 1.00 1.08 1.10 1.10 1.00 0.96 0.72Hong Kong c/ 1.39 1.11 1.00 0.91 0.82 0.76 0.69 0.64 0.60
-- Not availableNotes: 1. Increase = depreciation.
2. Data pertains to averages of December.a. Index of country's nominal exchange rate vis-a-vis the US$ divided by this country's wholesale price index or, if not
available, the consumer price index.b. Real effective exchange rate, based on the IMF's information Notice System (INS) methodology. Trade Weights are based
on trade flows overaged over 1990-92.c. Uses CPI.d. Data pertains to January 1997.e. Data pertains to November 1996.Source: IMF, International Financial Statistics; World Bank Staff Estimates.
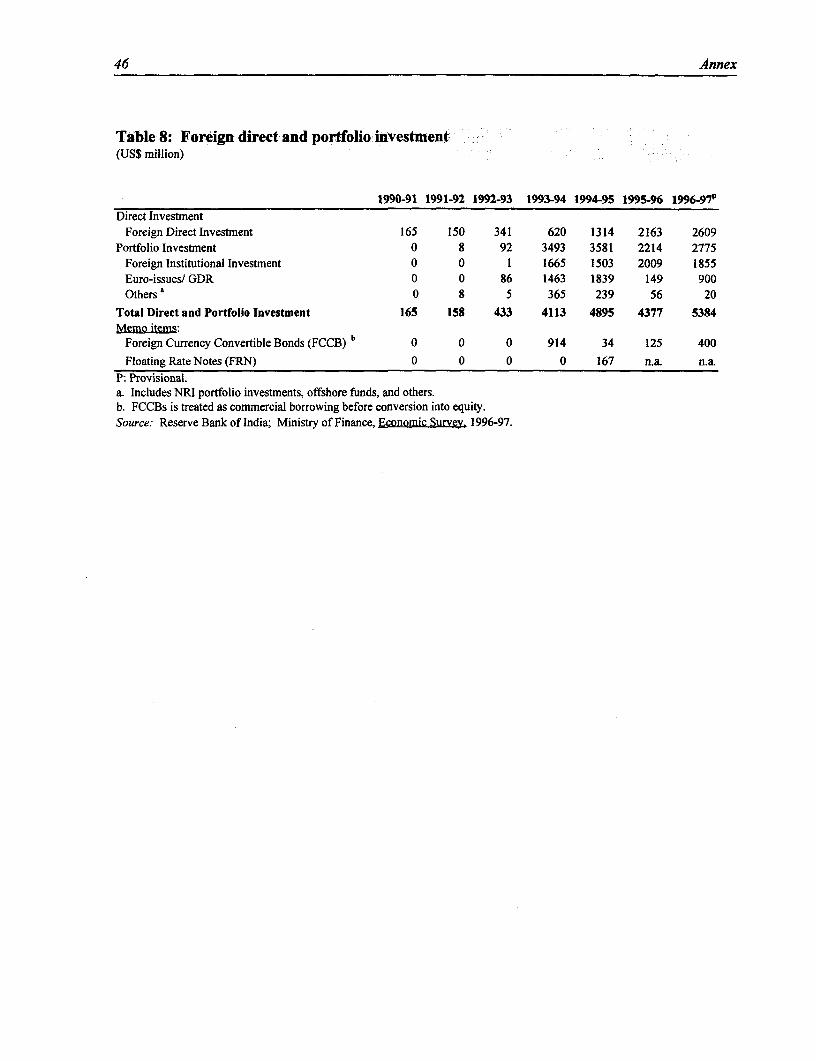
46 Annex
Table 8: Foreign direct and portfolio investment(US$ million)
1990-91 1991-92 1992-93 1993-94 1994-95 1995-96 1996-97"Direct Investment
Foreign Direct Investment 165 150 341 620 1314 2163 2609Portfolio Investment 0 8 92 3493 3581 2214 2775
Foreign Institutional Investment 0 0 1 1665 1503 2009 1855Euro-issues/ GDR 0 0 86 1463 1839 149 900Others 0 8 5 365 239 56 20
Total Direct and Portfolio Investment 165 158 433 4113 4895 4377 5384Memo items:
Foreign Currency Convertible Bonds (FCCB) b 0 0 0 914 34 125 400
Floating Rate Notes (FRN) 0 0 0 0 167 n.a. n.a.
P: Provisional.a. Includes NRI portfolio investments, offshore funds, and others.b. FCCBs is treated as commercial borrowing before conversion into equity.Source: Reserve Bank of India; Ministry of Finance, Economic Surve. 1996-97.
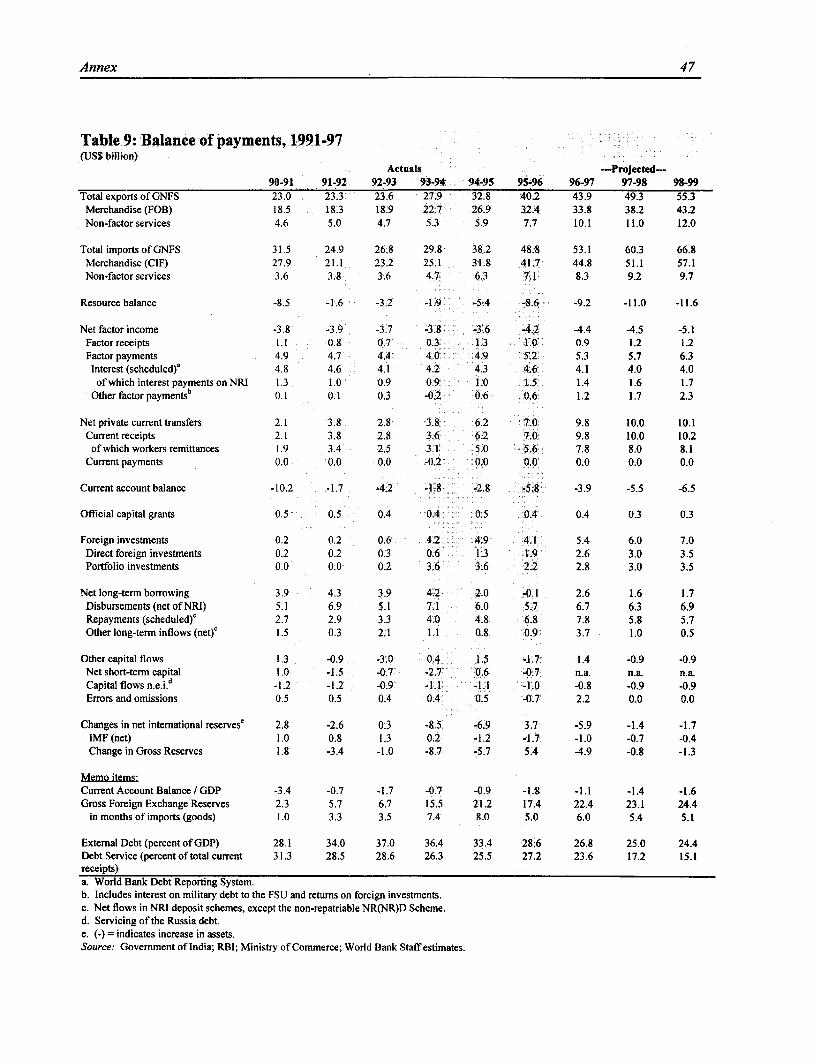
Annex 47
Table 9: Balance of payments, 1991-97(US$ billion)
Actuals -Projected-90-91 91-92 92-93 93-94 94-95 95-96 96-97 97-98 98-99
Total exports of GNFS 23.0 23.3 23.6 27.9 32.8 40.2 43.9 49.3 55.3Merchandise (FOB) 18.5 18.3 18.9 22.7 26.9 32.4 33.8 38.2 43.2Non-factorservices 4.6 5.0 4.7 5.3 5.9 7.7 10.1 11.0 12.0
Total imports of GNFS 31.5 24.9 26.8 29.8 38.2 48.8 53.1 60.3 66.8Merchandise (CIF) 27.9 21.1 23.2 25.1 31.8 41.7 44.8 51.1 57.1Non-factor services 3.6 3.8 3.6 4.7 6.3 7.1 8.3 9.2 9.7
Resource balance -8.5 -1.6 -3.2 -1.9 -5.4 -8.6 -9.2 -11.0 -11.6
Net factor income -3.8 -3.9 -3.7 -3.8 -3.6 4.2 -4.4 4.5 -5.1Factor receipts 1.1 0.8 0.7 0.3 1.3 1.0 0.9 1.2 1.2Factor payments 4.9 4.7 4.4 4.0 4.9 5.2 5.3 5.7 6.3Interest (scheduled)' 4.8 4.6 4.1 4.2 4.3 4.6 4.1 4.0 4.0of which interest payments on NRI 1.3 1.0 0.9 0.9 1.0 1.5 1.4 1.6 1.7
Other factor paymentsb 0.1 0.1 0.3 -0.2 0.6 0.6 1.2 1.7 2.3
Net private current transfers 2.1 3.8 2.8 3.8 6.2 7.0 9.8 10.0 10.1Current receipts 2.1 3.8 2.8 3.6 6.2 7.0 9.8 10.0 10.2of which workers remittances 1.9 3.4 2.5 3.1 5.0 5.6 7.8 8.0 8.1
Current payments 0.0 0.0 0.0 -0.2 0.0 0.0 0.0 0.0 0.0
Current account balance -10.2 -1.7 -4.2 -1.8 -2.8 -5.8 -3.9 -5.5 -6.5
Official capital grants 0.5 0.5 0.4 0.4 0.5 0.4 0.4 0.3 0.3
Foreign investments 0.2 0.2 0.6 4.2 4.9 4.1 5.4 6.0 7.0Direct foreign investments 0.2 0.2 0.3 0.6 1.3 1.9 2.6 3.0 3.5Portfolio investments 0.0 0.0 0.2 3.6 3.6 2.2 2.8 3.0 3.5
Net long-term borrowing 3.9 4.3 3.9 4.2 2.0 -0.1 2.6 1.6 1.7Disbursements (net of NRI) 5.1 6.9 5.1 7.1 6.0 5.7 6.7 6.3 6.9Repayments (scheduled)c 2.7 2.9 3.3 4.0 4.8 6.8 7.8 5.8 5.7Other long-term inflows (net)' 1.5 0.3 2.1 1.1 0.8 0.9 3.7 1.0 0.5
Other capital flows 1.3 -0.9 -3.0 0.4 1.5 -1.7 1.4 -0.9 -0.9Net short-term capital 1.0 -1.5 -0.7 -2.7 0.6 -0.7 n.a. n.a. n.a.Capital flows n.e.i.d -1.2 -1.2 -0.9 -1.1 -1.1 -1.0 -0.8 -0.9 -0.9Errors and omissions 0.5 0.5 0.4 0.4 0.5 -0.7 2.2 0.0 0.0
Changes in net international reserves' 2.8 -2.6 0.3 -8.5 -6.9 3.7 -5.9 -1.4 -1.7IMF (net) 1.0 0.8 1.3 0.2 -1.2 -1.7 -1.0 -0.7 -0.4Change in Gross Reserves 1.8 -3.4 -1.0 -8.7 -5.7 5.4 4.9 -0.8 -1.3
Memo items:Current Account Balance / GDP -3.4 -0.7 -1.7 -0.7 -0.9 -1.8 -1.1 -1.4 -1.6Gross Foreign Exchange Reserves 2.3 5.7 6.7 15.5 21.2 17.4 22.4 23.1 24.4
in months of imports (goods) 1.0 3.3 3.5 7.4 8.0 5.0 6.0 5.4 5.1
Extemal Debt (percent of GDP) 28.1 34.0 37.0 36.4 33.4 28.6 26.8 25.0 24.4Debt Service (percentoftotal current 31.3 28.5 28.6 26.3 25.5 27.2 23.6 17.2 15.1receipts)a. World Bank Debt Reporting System.b. Includes interest on military debt to the FSU and retums on foreign investments.c. Net flows in NRI deposit schemes, except the non-repatriable NR(NR)D Scheme.d. Servicing of the Russia debt.e. (-) = indicates increase in assets.Source: Govemment of India; RBI; Ministry of Commerce; World Bank Staff estimates.
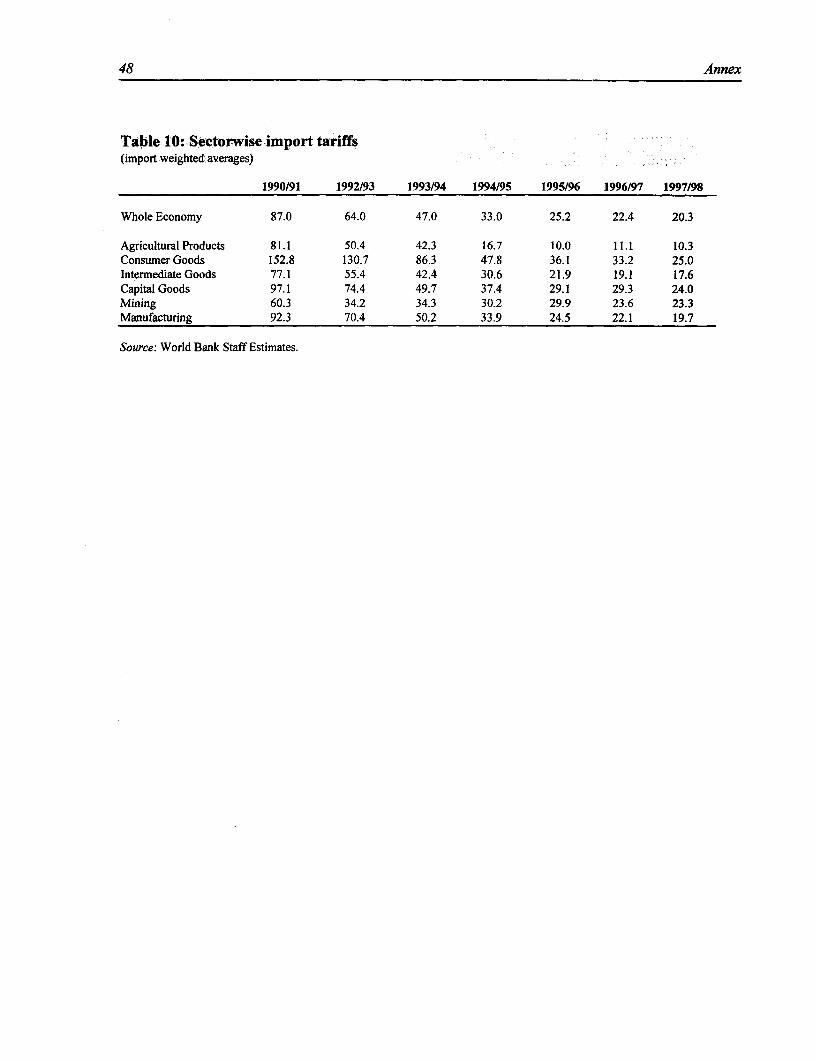
48 Annex
Table 10: Sectorwise import tariffs(import weighted averages)
1990/91 1992/93 1993/94 1994/95 1995/96 1996/97 1997/98
Whole Economy 87.0 64.0 47.0 33.0 25.2 22.4 20.3
Agricultural Products 81.1 50.4 42.3 16.7 10.0 11.1 10.3Consumer Goods 152.8 130.7 86.3 47.8 36.1 33.2 25.0Intermediate Goods 77.1 55.4 42.4 30.6 21.9 19.1 17.6Capital Goods 97.1 74.4 49.7 37.4 29.1 29.3 24.0Mining 60.3 34.2 34.3 30.2 29.9 23.6 23.3Manufacturing 92.3 70.4 50.2 33.9 24.5 22.1 19.7
Source: World Bank Staff Estimates.
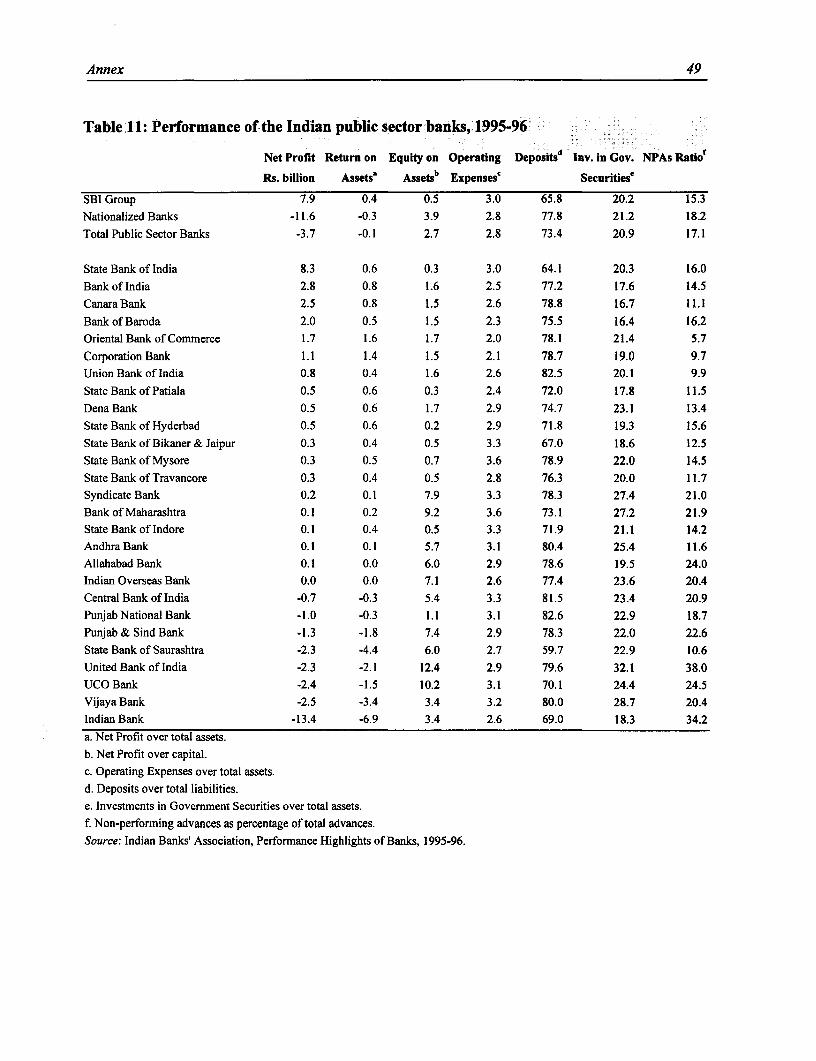
Annex 49
Table 11: Performance of the Indian public sector banks, 1995-96
Net Profit Return on Equity on Operating Depositsd Inv. in Gov. NPAs Ratio
Rs. billion Assets' Assetsb Expensesc Securities'
SBI Group 7.9 0.4 0.5 3.0 65.8 20.2 15.3
Nationalized Banks -11.6 -0.3 3.9 2.8 77.8 21.2 18.2
Total Public Sector Banks -3.7 -0.1 2.7 2.8 73.4 20.9 17.1
State Bank of India 8.3 0.6 0.3 3.0 64.1 20.3 16.0
Bank of India 2.8 0.8 1.6 2.5 77.2 17.6 14.5
CanaraBank 2.5 0.8 1.5 2.6 78.8 16.7 11.1
Bank of Baroda 2.0 0.5 1.5 2.3 75.5 16.4 16.2
Oriental Bank of Commerce 1.7 1.6 1.7 2.0 78.1 21.4 5.7
Corporation Bank 1.1 1.4 1.5 2.1 78.7 19.0 9.7
Union Bank of India 0.8 0.4 1.6 2.6 82.5 20.1 9.9
State Bank of Patiala 0.5 0.6 0.3 2.4 72.0 17.8 11.5
Dena Bank 0.5 0.6 1.7 2.9 74.7 23.1 13.4
State Bank of Hyderbad 0.5 0.6 0.2 2.9 71.8 19.3 15.6
State Bank of Bikaner & Jaipur 0.3 0.4 0.5 3.3 67.0 18.6 12.5
State Bank of Mysore 0.3 0.5 0.7 3.6 78.9 22.0 14.5
State Bank of Travancore 0.3 0.4 0.5 2.8 76.3 20.0 11.7
Syndicate Bank 0.2 0.1 7.9 3.3 78.3 27.4 21.0
Bank of Maharashtra 0.1 0.2 9.2 3.6 73.1 27.2 21.9
State Bank of Indore 0.1 0.4 0.5 3.3 71.9 21.1 14.2
Andhra Bank 0.1 0.1 5.7 3.1 80.4 25.4 11.6
Allahabad Bank 0.1 0.0 6.0 2.9 78.6 19.5 24.0
Indian Overseas Bank 0.0 0.0 7.1 2.6 77.4 23.6 20.4
Central Bank of India -0.7 -0.3 5.4 3.3 81.5 23.4 20.9
Punjab National Bank -1.0 -0.3 1.1 3.1 82.6 22.9 18.7
Punjab & Sind Bank -1.3 -1.8 7.4 2.9 78.3 22.0 22.6
State Bank of Saurashtra -2.3 -4.4 6.0 2.7 59.7 22.9 10.6
United Bank of India -2.3 -2.1 12.4 2.9 79.6 32.1 38.0
UCO Bank -2.4 -1.5 10.2 3.1 70.1 24.4 24.5
Vijaya Bank -2.5 -3.4 3.4 3.2 80.0 28.7 20.4
Indian Bank -13.4 -6.9 3.4 2.6 69.0 18.3 34.2
a. Net Profit over total assets.
b. Net Profit over capital.
c. Operating Expenses over total assets.
d. Deposits over total liabilities.
e. Investments in Government Securities over total assets.
f. Non-performing advances as percentage of total advances.
Source: Indian Banks' Association, Performance Highlights of Banks, 1995-96.
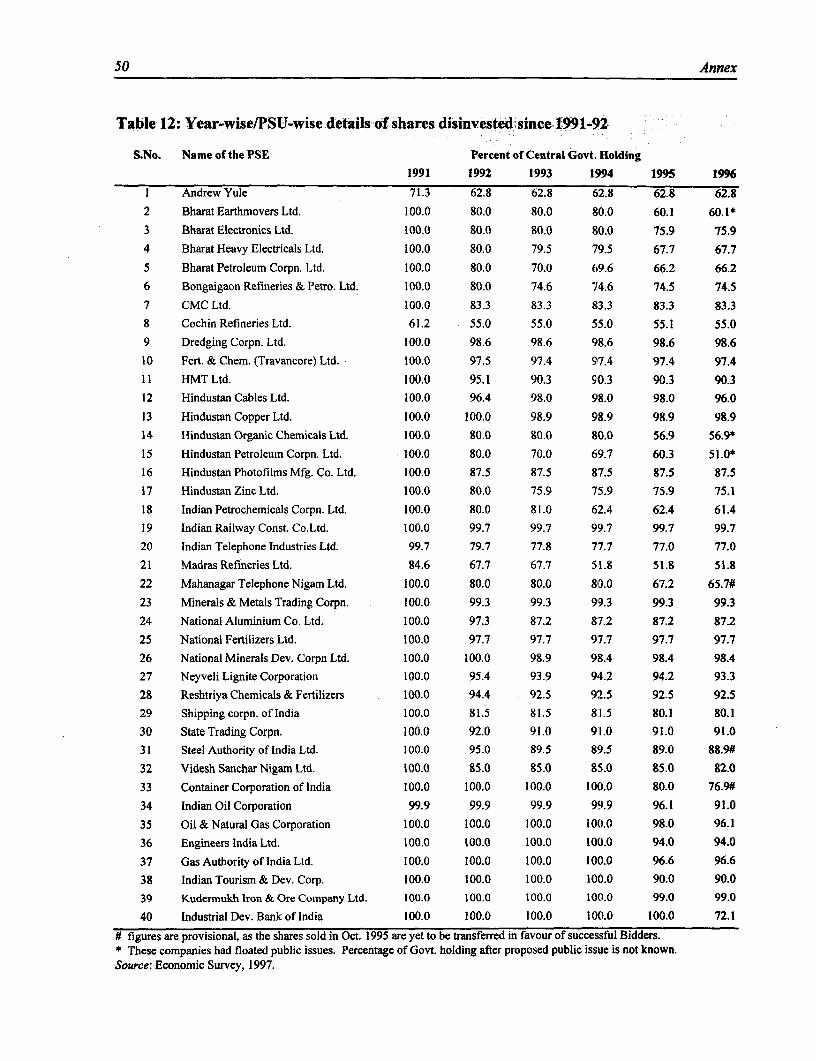
50 Annex
Table 12: Year-wise/PSU-wise details of shares disinvested since: 1991-92
S.No. Name of the PSE Percent of Central Govt. Holding
1991 1992 1993 1994 1995 199
I Andrew Yule 71.3 62.8 62.8 052.8 62.8 62.8
2 Bharat Earthmovers Ltd. 100.0 80.0 80.0 80.0 60.1 60.1*
3 Bharat Electronics Ltd. 100.0 80.0 80.0 80.0 75.9 75.9
4 Bharat Heavy Electricals Ltd. 100.0 80.0 79.5 79.5 67.7 67.7
5 Bharat Petroleum Corpn. Ltd. 100.0 80.0 70.0 69.6 66.2 66.2
6 Bongaigaon Refineries & Petro. Ltd. 100.0 80.0 74.6 74.6 74.5 74.5
7 CMC Ltd. 100.0 83.3 83.3 83.3 83.3 83.3
8 Cochin Refineries Ltd. 61.2 55.0 55.0 55.0 55.1 55.0
9 Dredging Corpn. Ltd. 100.0 98.6 98.6 98.6 98.6 98.6
10 Fert. & Chem. (Travancore) Ltd. 100.0 97.5 97.4 97.4 97.4 97.4
11 HMT Ltd. 100.0 95.1 90.3 90.3 90.3 90.3
12 Hindustan Cables Ltd. 100.0 96.4 98.0 98.0 98.0 96.0
13 Hindustan Copper Ltd. 100.0 100.0 98.9 98.9 98.9 98.9
14 Hindustan Organic Chemicals Ltd. 100.0 80.0 80.0 80.0 56.9 56.9*
15 Hindustan Petroleum Corpn. Ltd. 100.0 80.0 70.0 69.7 60.3 51.0*
16 Hindustan Photofilms Mfg. Co. Ltd. 100.0 87.5 87.5 87.5 87.5 87.5
17 Hindustan Zinc Ltd. 100.0 80.0 75.9 75.9 75.9 75.1
18 Indian Petrochemicals Corpn. Ltd. 100.0 80.0 81.0 62.4 62.4 61.4
19 Indian Railway Const. Co.Ltd. 100.0 99.7 99.7 99.7 99.7 99.7
20 Indian Telephone Industries Ltd. 99.7 79.7 77.8 77.7 77.0 77.0
21 Madras Refineries Ltd. 84.6 67.7 67.7 51.8 51.8 51.8
22 Mahanagar Telephone Nigam Ltd. 100.0 80.0 80.0 80.0 67.2 65.7#
23 Minerals & Metals Trading Corpn. 100.0 99.3 99.3 99.3 99.3 99.3
24 National Aluminium Co. Ltd. 100.0 97.3 87.2 87.2 87.2 87.2
25 National Fertilizers Ltd. 100.0 97.7 97.7 97.7 97.7 97.7
26 National Minerals Dev. Corpn Ltd. 100.0 100.0 98.9 983.4 98.4 98.4
27 Neyveli Lignite Corporation 100.0 95.4 93.9 94.2 94.2 93.3
28 Reshtriya Chemicals & Fertilizers 100.0 94.4 92.5 92.5 92.5 92.5
29 Shippingcorpn.oflndia 100.0 81.5 81.5 81.5 80.1 80.1
30 State Trading Corpn. 100.0 92.0 91.0 91.0 91.0 91.0
31 Steel Authority of India Ltd. 100.0 95.0 89.5 89.5 89.0 88.9#
32 Videsh Sanchar Nigam Ltd. 100.0 85.0 85.0 85.0 85.0 82.0
33 Container Corporation of India 100.0 100.0 100.0 10(.0 80.0 76.9#
34 Indian Oil Corporation 99.9 99.9 99.9 99.9 96.1 91.0
35 Oil & Natural Gas Corporation 100.0 100.0 100.0 100.0 98.0 96.1
36 Engineers India Ltd. 100.0 100.0 100.0 100.0 94.0 94.0
37 Gas Authority of India Ltd. 100.0 100.0 100.0 10(.0 96.6 96.6
38 Indian Tourism & Dev. Corp. 100.0 100.0 100.0 100.0 90.0 90.0
39 Kudermukh Iron & Ore Company Ltd. 100.0 100.0 100.0 100.0 99.0 99.0
40 Industrial Dev. Bank of India 100.0 100.0 100.0 100.0 100.0 72.1
# figures are provisional, as the shares sold in Oct. 1995 are yet to be transferred in favour of successful Bidders.* These companies had floated public issues. Percentage of Govt. holding after proposed public issue is not known.Source: Economic Survey, 1997.
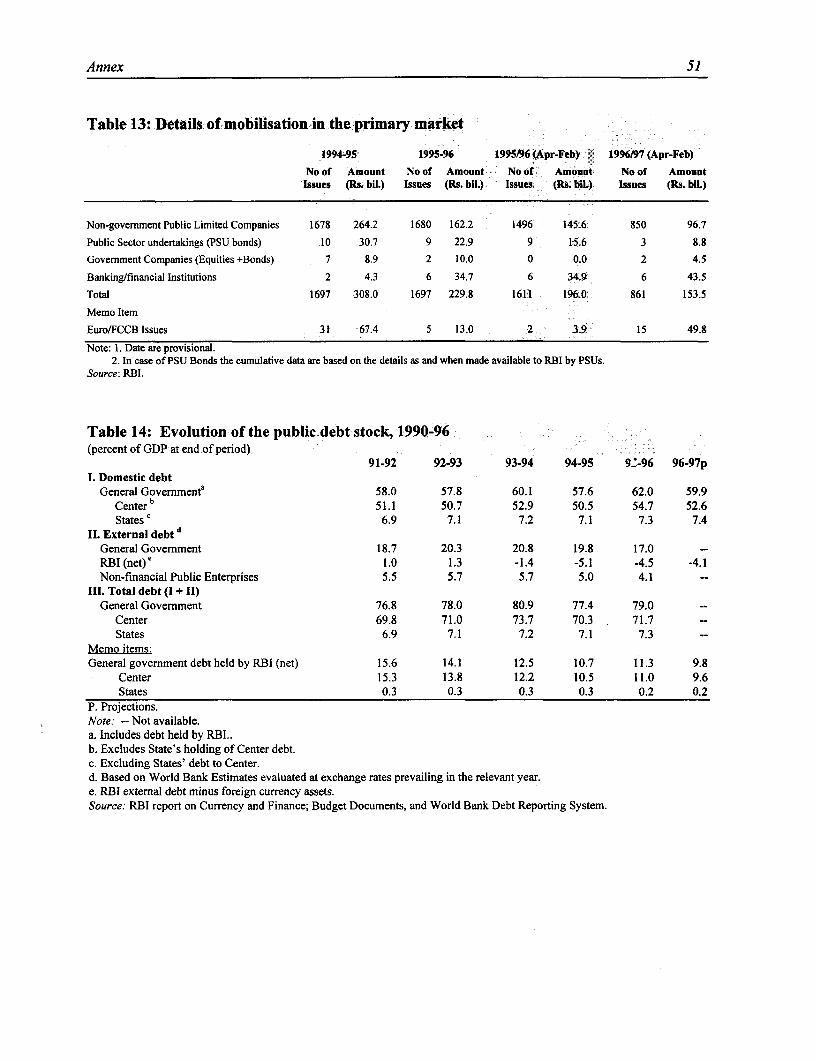
Annex 51
Table 13: Details of mobilisation in the primary market
1994-95 1995-96 1995/96 (Apr-Feb) 1996/97 (Apr-Feb)
No of Amount No of Amount No of Amount No of AmountIsues (Rs. bil.) Issues (Rs. bil.) Issues (Rs. biLt) Isues (Rs. bil.)
Non-government Public Limited Companies 1678 264.2 1680 162.2 1496 145.6 850 96.7
Public Sector undertakings (PSU bonds) 10 30.7 9 22.9 9 15.6 3 8.8
Government Companies (Equities +Bonds) 7 8.9 2 10.0 0 0.0 2 4.5
Banking/financial Institutions 2 4.3 6 34.7 6 34.9 6 43.5
Total 1697 308.0 1697 229.8 1611 196.0 861 153.5
Memo Item
Euro/FCCB Issues 31 67.4 5 13.0 2 3.9 15 49.8
Note: 1. Date are provisional.2. In case of PSU Bonds the cumulative data are based on the details as and when made available to RBI by PSUs.
Source: RBI.
Table 14: Evolution of the public debt stock, 1990-96(percent of GDP at end of period)
91-92 92-93 93-94 94-95 9.-96 9 6 - 9 7 p1. Domestic debt
General Govemmenta 58.0 57.8 60.1 57.6 62.0 59.9Center b 51.1 50.7 52.9 50.5 54.7 52.6States c 6.9 7.1 7.2 7.1 7.3 7.4
II. External debt d
General Government 18.7 20.3 20.8 19.8 17.0
RBI (net)' 1.0 1.3 -1.4 -5.1 -4.5 -4.1Non-financial Public Enterprises 5.5 5.7 5.7 5.0 4.1 --
HII. Total debt (I + II)General Government 76.8 78.0 80.9 77.4 79.0 --
Center 69.8 71.0 73.7 70.3 71.7 --
States 6.9 7.1 7.2 7.1 7.3 --
Memo items:General government debt held by RBI (net) 15.6 14.1 12.5 10.7 11.3 9.8
Center 15.3 13.8 12.2 10.5 11.0 9.6States 0.3 0.3 0.3 0.3 0.2 0.2
P. Projections.Note: -- Not available.a. Includes debt held by RBIb. Excludes State's holding of Center debt.c. Excluding States' debt to Center.d. Based on World Bank Estimates evaluated at exchange rates prevailing in the relevant year.e. RBI external debt minus foreign currency assets.Source: RBI report on Currency and Finance; Budget Documents, and World Bank Debt Reporting System.
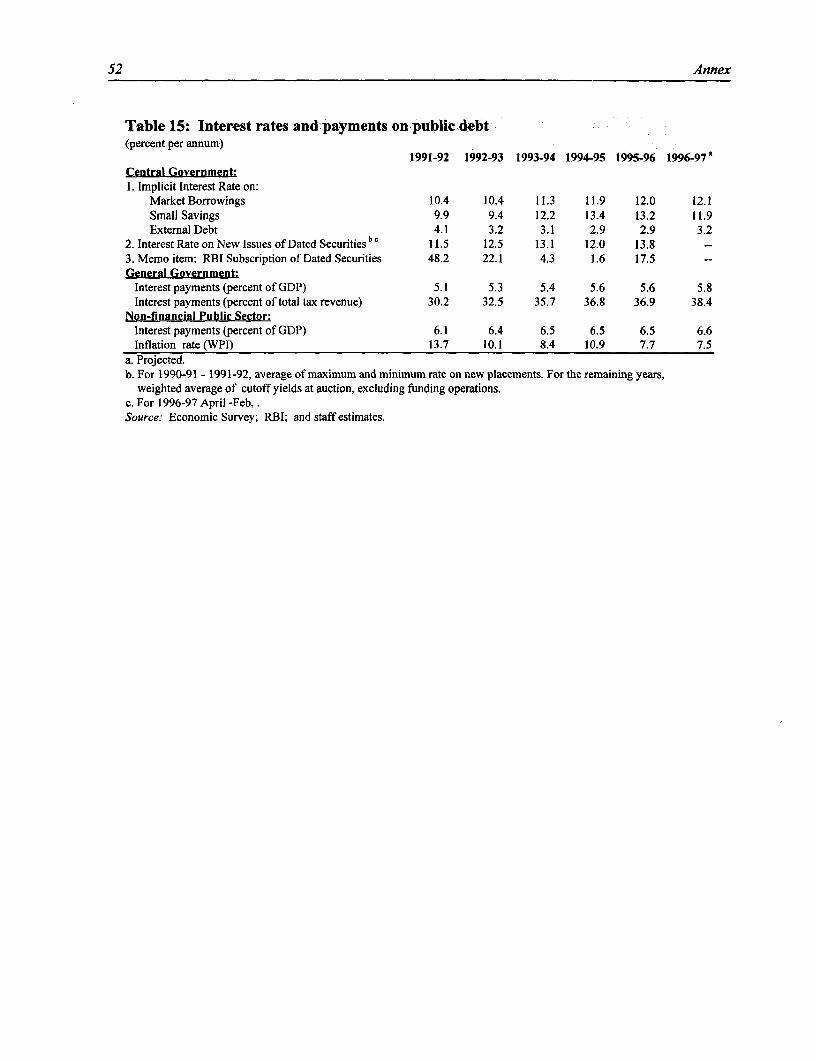
52 Annex
Table 15: Interest rates and payments on public debt(percent per annum)
1991-92 1992-93 1993-94 1994-95 1995-96 1996-97 aCentral Government:1. Implicit Interest Rate on:
Market Borrowings 10.4 10.4 11.3 11.9 12.0 12.1Small Savings 9.9 9.4 12.2 13.4 13.2 11.9External Debt 4.1 3.2 3.1 2.9 2.9 3.2
2. Interest Rate on New Issues of Dated Securities bC 11.5 12.5 13.1 12.0 13.83. Memo item: RBI Subscription of Dated Securities 48.2 22.1 4.3 1.6 17.5 -
General Government:Interest payments (percent of GDP) 5.1 5.3 5.4 5.6 5.6 5.8Interest payments (percent of total tax revenue) 30.2 32.5 35.7 36.8 36.9 38.4
Non-financial Public Sector:Interest payments (percent of GDP) 6.1 6.4 6.5 6.5 6.5 6.6Inflation rate (WPI) 13.7 10.1 8.4 10.9 7.7 7.5
a. Projected.b. For 1990-91 - 1991-92, average of maximum and minimum rate on new placements. For the remaining years,
weighted average of cutoff yields at auction, excluding funding operations.c. For 1996-97 April -Feb, .Source: Economic Survey; RBI; and staff estimates.
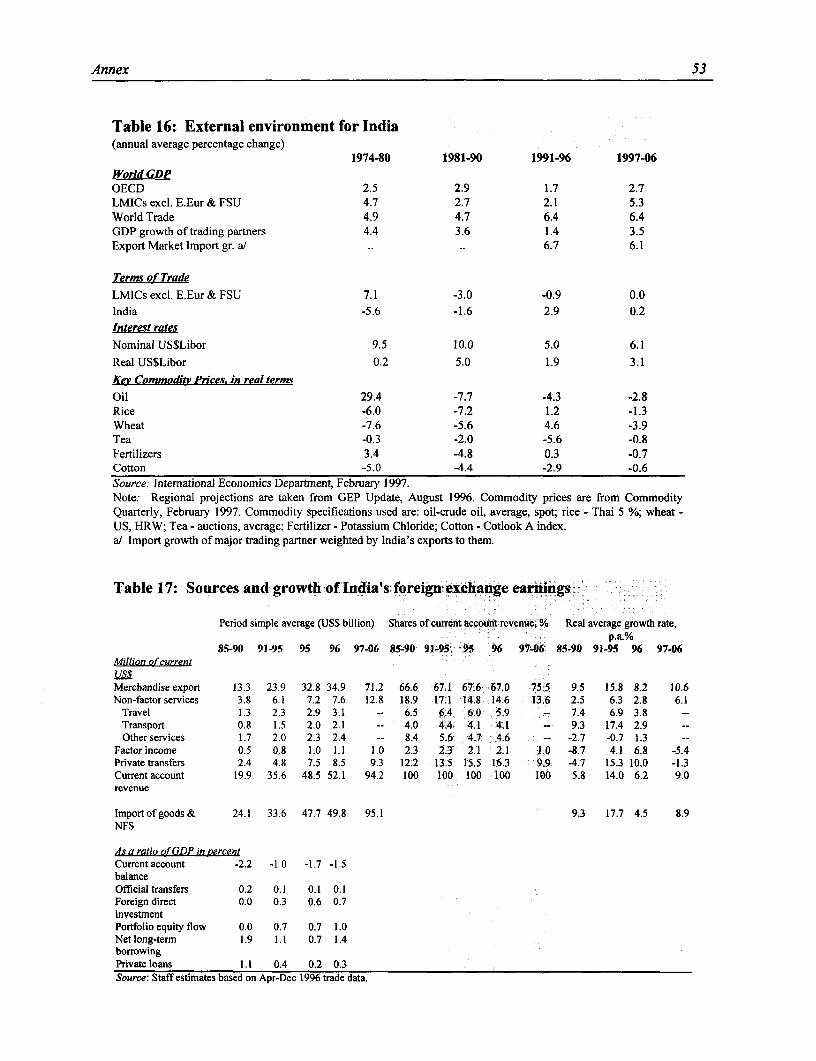
Annex 53
Table 16: External environment for India(annual average percentage change)
1974-80 1981-90 1991-96 199746World GDPOECD 2.5 2.9 1.7 2.7LMICs excl. E.Eur & FSU 4.7 2.7 2.1 5.3World Trade 4.9 4.7 6.4 6.4GDP growth of trading partners 4.4 3.6 1.4 3.5Export Market Import gr. al .. .. 6.7 6.1
Terms of Trade
LMICs excl. E.Eur & FSU 7.1 -3.0 -0.9 0.0India -5.6 -1.6 2.9 0.2Interest rates
Nominal US$Libor 9.5 10.0 5.0 6.1
Real US$Libor 0.2 5.0 1.9 3.1
Kea Commodty Prices, in real terms
Oil 29.4 -7.7 -4.3 -2.8Rice -6.0 -7.2 1.2 -1.3Wheat -7.6 -5.6 4.6 -3.9Tea -0.3 -2.0 -5.6 -0.8Fertilizers 3.4 -4.8 0.3 -0.7Cotton -5.0 -4.4 -2.9 -0.6Source: International Economics Department, February 1997.Note: Regional projections are taken from GEP Update, August 1996. Commodity prices are from CommodityQuarterly, February 1997. Commodity specifications used are: oil-crude oil, average, spot; rice - Thai 5 %; wheat -US, HRW; Tea - auctions, average; Fertilizer - Potassium Chloride; Cotton - Cotlook A index.a/ Import growth of major trading partner weighted by India's exports to them.
Table 17: Sources and growth of India's foreign exchange earnings
Period simple average (US$ billion) Shares of current account revenueo, % Real average growth rate,p.a.%
85-90 91-95 95 96 97-06 85-90 91-95 95 96 97-06 85-90 91-95 96 97-06Million of current
Merchandise export 13.3 23.9 32.8 34.9 71.2 66.6 67.1 67.6 67.0 75.5 9.5 15.8 8.2 10.6Non-factor services 3.8 6.1 7.2 7.6 12.8 18.9 17.1 14.8 14.6 13.6 2.5 6.3 2.8 6.1
Travel 1.3 2.3 2.9 3.1 -- 6.5 6,4 6.0 5.9 - 7.4 6.9 3.8 -Transport 0.8 1.5 2.0 2.1 -- 4.0 4.4 4.1 4.1 - 9.3 17.4 2.9Other services 1.7 2.0 2.3 2.4 -- 8.4 5.6 4.7 4.6 -- -2.7 -0.7 1.3
Factorincome 0.5 0.8 1.0 1.1 1.0 2.3 2.3 2.1 2.1 1.0 -8.7 4.1 6.8 -5.4Private transfers 2.4 4.8 7.5 8.5 9.3 12.2 13.5 15.5 16.3 9,9 4.7 15.3 10.0 -1.3Current account 19.9 35.6 48.5 52.1 94.2 100 100 100 100 100 5.8 14.0 6.2 9.0revenue
Import ofgoods& 24.1 33.6 47.7 49.8 95.1 9.3 17.7 4.5 8.9NFS
As a ratio of GDP in percentCurrent account -2.2 -1.0 -1.7 -1.5balanceOfficial transfers 0.2 0.1 0.1 0.1Foreign direct 0.0 0.3 0.6 0.7investmentPortfolio equity flow 0.0 0.7 0.7 1.0Net long-term 1.9 1.1 0.7 1.4borrowingPrivate loans 1.1 0.4 0.2 0.3Source: Staff estimates based on Apr-Dec 1996 trade data.
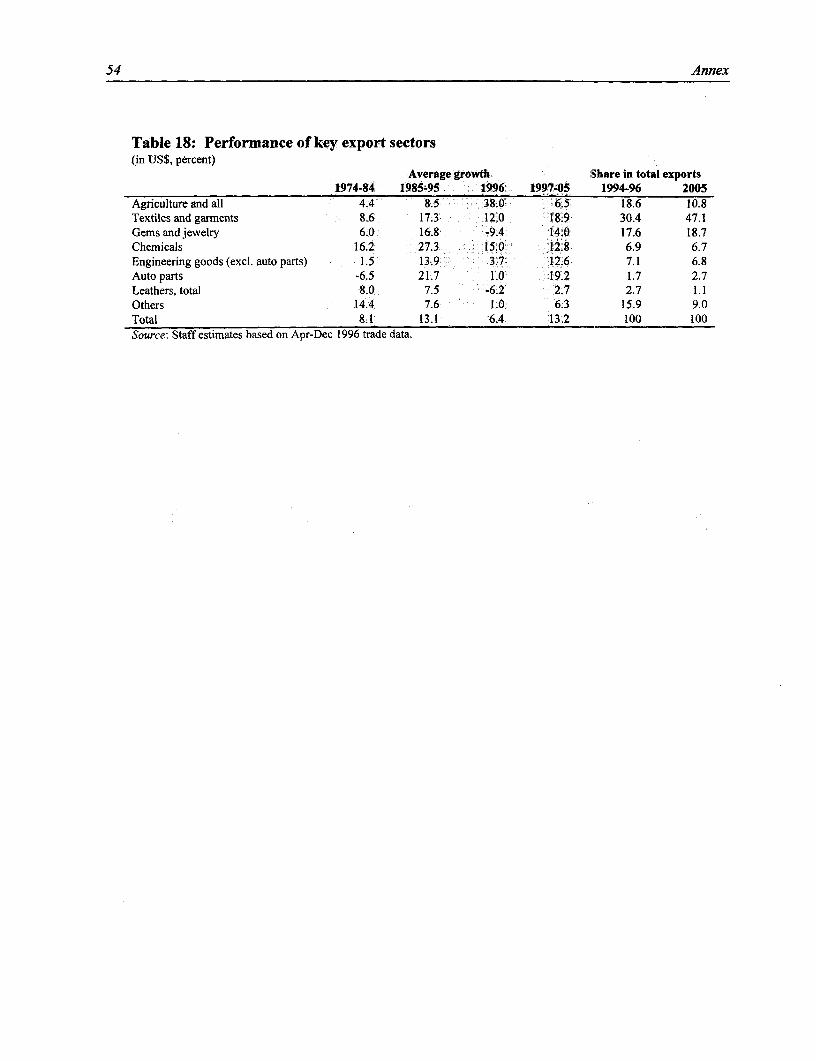
54 Annex
Table 18: Performance of key export sectors(in US$, percent)
Average growth Share in total exports1974-84 1985-95 1996 1997-05 1994-96 2005
Agriculture and all 4.4 8.5 :38.01 6.5 18.6 10.8Textiles and garments 8.6 17.3 12.0 18.9 30.4 47.1Gems and jewelry 6.0 16.8 -9.4 14.0 17.6 18.7Chemicals 16.2 27.3 . 15.0 12.8 6.9 6.7Engineering goods (excl. auto parts) 1.5 13,9 3.7 12.6 7.1 6.8Auto parts -6.5 21.7 1.0 19.2 1.7 2.7Leathers, total 8.0 7.5 -6.2 2.7 2.7 1.1Others 14.4 7.6 1.0 6.3 15.9 9.0Total 8.1 13.1 6.4 13.2 100 100Source: Staff estimates based on Apr-Dec 1996 trade data.
STATISTICAL APPENDIX

56 Statistical Appendix
I
Statistical Appendix 57
CONTENTS
I. National Accounts
Al.l(a) National Accounts Summary, (Rs billion at current prices)Al.l(b) National Accounts Summary, (Rs billion at 1980-81 prices)A1.2(a) Gross Domestic Product at Factor Cost - By Industry of Origin, (Rs billion at current
prices)A1.2(b) Gross Domestic Product at Factor Cost - By Industry of Origin, (Rs billion at 1980-81
prices)A 1.2(c) Implicit Price Deflators for GDP at Factor Cost, (1980-81 = 100)Al.3 Gross Savings and Investment, (Rs billion)Al.4 Disposable Income and Its Use, (Rs billion at current prices)A1.5(a) Gross Domestic Investment by Industry of Origin, (Rs billion at current prices)A 1.5(b) Gross Domestic Investment by Industry of Origin, (Rs billion at 1980-81 prices)A1.5(c) Investment Deflators by Industry of Use, (1980-81 = 100)A1.6(a) Gross Domestic Investment in Public Sector, (Rs billion at current prices)Al.6(b) Gross Domestic Investment in Public Sector, (Rs billion at 1980-81 prices)
IH. Balance of Payments - Current Accounts
A2.1 Balance of Payments, (US$ million at current prices)A2.2(a) Merchandise Exports, (US$ million at current prices)A2.2(b) Merchandise Exports, (US$ million at 1980-81 prices)A2.2(c) Export Unit Value Indices, (US$ terms, 1980-81 = 100)A2.3(a) Merchandise Imports, (US$ million at current prices)A2.3(b) Merchandise Imports, (US$ million at 1980-81 prices)A2.3(c) Import Unit Value Indices, (US$ terms, 1980-81 = 100)A2.4 Invisibles on Current Account, (US$ million)A2.5 Decomposition of Recent Export Growth, (US$ million at current prices - annual
averages)
Im. Balance of Payments - Capital Accounts
A3.1(a) External Debt Summary: Debt Outstanding and Disbursed, (US$ million at currentprices)
A3.1(b) External Debt Summary: Disbursements, (US$ million at current prices)A3.1(c) External Debt Summary: Principal Repayments, (US$ million at current prices)A3.1(d) External Debt Summary: Net Flows, (US$ million at current prices)A3.1(e) External Debt Summary: Interest Payments, (US$ million at current prices)A3.2 External Reserves (US$ million at current prices)
58 Statistical Appendix
IV. Public Finance
A4.1 Central Government Finances Summary, (Rs billion at current prices)A4.2 Budgetary Classification of Central Government Finances, (Rs billion at current prices)A4.3 Budgetary Classification of State Government Finances, (Rs billion at current prices)A4.4 Budgetary Classification of General Government Finances, (Rs billion at current prices)A4.5 Tax Revenue - Center and States, (Rs billion at current prices)A4.6 Non-Tax Revenue - Center and States, (Rs billion at current prices)A4.7 Revenue Expenditure of the Central Government, (Rs billion at current prices)A4.8 Revenue Expenditure of State Government, (Rs billion at current lprices)A4.9 Capital Expenditure - Center and States, (Rs billion at current prices)A4. 10 Transfers between Center and States, (Rs billion at current prices)A4. 1 1 Explicit Subsidies in the Central Government Budget, (Rs billion at current prices)A4.12 Outstanding Debt of Central Government, (Rs billion at current prices)A4. 13 Outstanding Debt of State Government, (Rs billion at current prices)A4. 14 Outstanding Debt of Central and State Governments, (Rs billion at current prices)A4.15(a) Projected and Actual Plan Outlays by Sectors, (Rs billion at current prices)A4. 15(b) Projected and Actual Plan Outlays by Sectors, (Rs billion, annual averages at 1980-81
prices)A4.15(c) Projected and Actual Plan Outlays by Sectors, (percent distribution and achievementrates)
V, Money and Credit
A5. 1 Money Supply and Sources of Change, (Rs billion)A5.2 Base Money Supply and Sources of Change, (Rs billion)A5.3 Selected Monetary Policy InstrumentsA5.4 Structure of Short-term and Long-term Interest Rates, (percent per annum)A5.5 Sectoral Deployment of Gross Bank Credit, (Rs billion - change during year)
VI. Agriculture, Industry, Transport, Energy and Prices
A6. 1 Production of Major CropsA6.2 Irrigated Area Under Different Crops, (million hectares)A6.3 Yield Per Hectare of Major Crops, (kgs. per hectare)A6.4 Net Availability, Procurement and Public Distribution of Foodgrains, (million tons)A6.5 New Index of Industrial Production, (1980-81 = 100)A6.6 Production, Imports and Consumption of Fertilizers, (000' nutrient tons)A6.7 Indian Railways - Freight and Passenger TrafficA6.8 Petroleum Summary: Commodity Balance of Petroleum and Petroleum Products,
(million tons)A6.9 Generation and Consumption of Electricity, (000' GWH)A6. 10 New Index Numbers of Wholesale Prices - by Years, (Base 1981-82 = 100)A6.11 Contribution of Selected Commodities to Increase in WPI in Calendar Year 1995A6.12 Consumer Price Index Numbers for Industrial Workers, Urban Non-Manual Employees
and Agricultural LaborersA6.13 Evolution of the Wholesale Price Index, 1991-96, (index and twelve months point-to-
point increase)
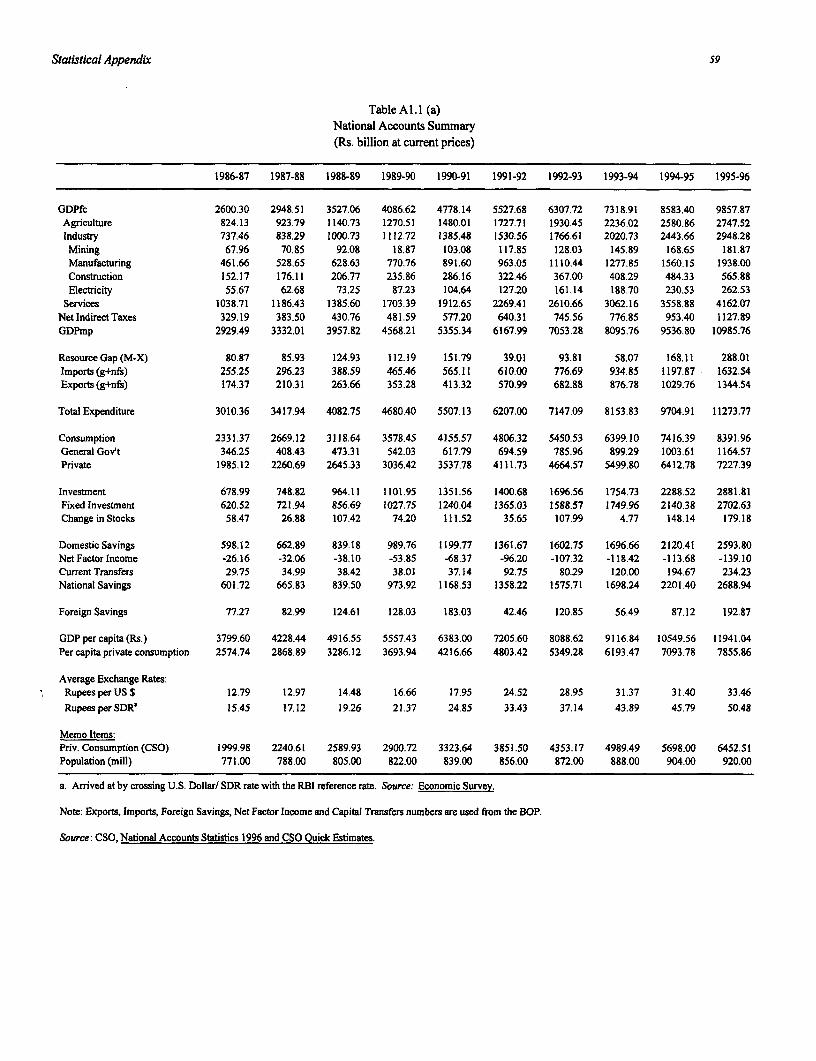
Statistical Appendix 59
Table Al.l (a)National Accounts Summary(Rs. billion at current prices)
1986-87 1987-88 1988-89 1989-90 1990-91 1991-92 1992-93 1993-94 1994-95 1995-96
GDPfc 2600.30 2948.51 3527.06 4086.62 4778.14 5527.68 6307.72 7318.91 8583.40 9857.87Agriculture 824.13 923.79 1140.73 1270.51 1480.01 1727.71 1930.45 2236.02 2580.86 2747.52Industry 737.46 838.29 1000.73 1112.72 1385.48 1530.56 1766.61 2020.73 2443.66 2948.28Mining 67.96 70.85 92.08 18.87 103.08 117.85 128.03 145.89 168.65 181.87Manufacturing 461.66 528.65 628.63 770.76 891.60 963.05 1110.44 1277.85 1560.15 1938.00Construction 152.17 176.11 206.77 235.86 286.16 322.46 367.00 408.29 484.33 565.88Electricity 55.67 62.68 73.25 87.23 104.64 127.20 161.14 188.70 230.53 262.53
Services 1038.71 1186.43 1385.60 1703.39 1912.65 2269.41 2610.66 3062.16 3558.88 4162.07NetlndirectTaxes 329.19 383.50 430.76 481.59 577.20 640.31 745.56 776.85 953.40 1127.89GDPmp 2929.49 3332.01 3957.82 4568.21 5355.34 6167.99 7053.28 8095.76 9536.80 10985.76
ResourceGap(M-X) 80.87 85.93 124.93 112.19 151.79 39.01 93.81 58.07 168.11 288.01Imports (g+nfs) 255.25 296.23 388.59 465.46 565.11 610.00 776.69 934.85 1197.87 1632.54Exports (g+nfs) 174.37 210.31 263.66 353.28 413.32 570.99 682.88 876.78 1029.76 1344.54
Total Expenditure 3010.36 3417.94 4082.75 4680.40 5507.13 6207.00 7147.09 8153.83 9704.91 11273.77
Consumption 2331.37 2669.12 3118.64 3578.45 4155.57 4806.32 5450.53 6399.10 7416.39 8391.96General Gov't 346.25 408.43 473.31 542.03 617.79 694.59 785.96 899.29 1003.61 1164.57Private 1985.12 2260.69 2645.33 3036.42 3537.78 4111.73 4664.57 5499.80 6412.78 7227.39
Investment 678.99 748.82 964.11 1101.95 1351.56 1400.68 1696.56 1754.73 2288.52 2881.81Fixed Investment 620.52 721.94 856.69 1027.75 1240.04 1365.03 1588.57 1749.96 2140.38 2702.63Change in Stocks 58.47 26.88 107.42 74.20 111.52 35.65 107.99 4.77 148.14 179.18
Domestic Savings 598.12 662.89 839.18 989.76 1199.77 1361.67 1602.75 1696.66 2120.41 2593.80Net Factor Income -26.16 -32.06 -38.10 -53.85 -68.37 -96.20 -107.32 -118.42 -113.68 -139.10Current Transfers 29.75 34.99 38.42 38.01 37.14 92.75 80.29 120.00 194.67 234.23National Savings 601.72 665.83 839.50 973.92 1168.53 1358.22 1575.71 1698.24 2201.40 2688.94
Foreign Savings 77.27 82.99 124.61 128.03 183.03 42.46 120.85 56.49 87.12 192.87
GDPpercapita(Rs.) 3799.60 4228.44 4916.55 5557.43 6383.00 7205.60 8088.62 9116.84 10549.56 11941.04Per capita private consumption 2574.74 2868.89 3286.12 3693.94 4216.66 4803.42 5349.28 6193.47 7093.78 7855.86
Average Exchange Rates:RupeesperUSS 12.79 12.97 14.48 16.66 17.95 24.52 28.95 31.37 31.40 33.46
RupeesperSDR 15.45 17.12 19.26 21.37 24.85 33.43 37.14 43.89 45.79 50.48
Memo Items:Priv. Consumption (CSO) 1999.98 2240.61 2589.93 2900.72 3323.64 3851.50 4353.17 4989.49 5698.00 6452.51Population (mill) 771.00 788.00 805.00 822.00 839.00 856.00 872.00 888.00 904.00 920.00
a. Arrived at by crossing U.S. Dollar/ SDR rate with the RBI reference rate. Source: Economic Survey.
Note: Exports, Imports, Foreign Savings, Net Factor Income and Capital Transfers numbers are used from the BOP.
Source: CSO, National Accounts Statistics 1996 and CSO Quick Estimates.
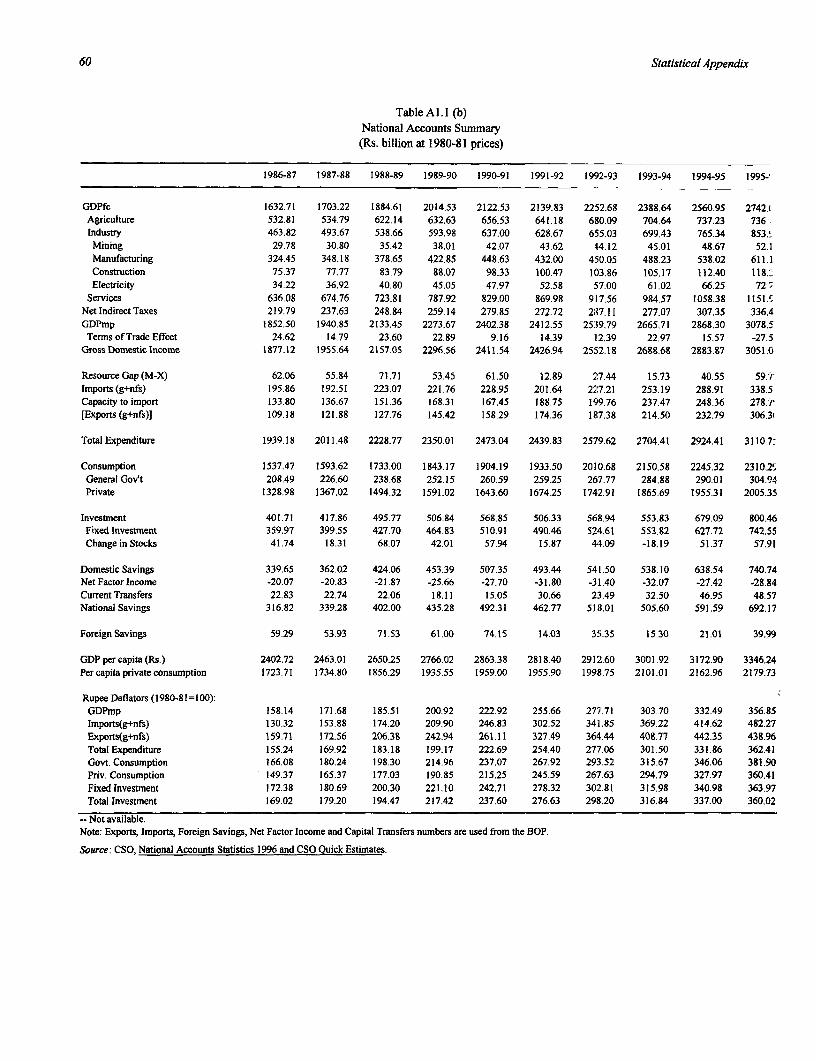
60 Statistical Appendix
Table Al.I (b)National Accounts Summary(Rs. billion at 1980-81 prices)
1986-87 1987-88 1988-89 1989-90 1990-91 1991-92 1992-93 1993-94 1994-95 1995-
GDPfc 1632.71 1703.22 1884.61 2014.53 2122.53 2139.83 2252.68 2388.64 2560.95 2742.iAgriculture 532.81 534.79 622.14 632.63 656.53 641.18 680.09 704.64 737.23 736.Industry 463.82 493.67 538.66 593.98 637.00 628.67 655.03 699.43 765.34 853..Mining 29.78 30.80 35.42 38.01 42.07 43.62 44.12 45.01 48.67 52.1Manufacturing 324.45 348.18 378.65 422.85 448.63 432.00 450.05 488.23 538.02 611.1Construction 75.37 77.77 83.79 88.07 98.33 100.47 103.86 105.17 112.40 118-.Electricity 34.22 36.92 40.80 45.05 47.97 52.58 :57.00 61.02 66.25 72§
Services 636.08 674.76 723.81 787.92 829.00 869.98 917.56 984.57 1058.38 1151.fNetlndirectTaxes 219.79 237.63 248.84 259.14 279.85 272.72 287.11 277.07 307.35 336.4GDPmp 1852.50 1940.85 2133.45 2273.67 2402.38 2412.55 2539.79 2665.71 2868.30 3078.5TermsofTradeEffect 24.62 14.79 23.60 22.89 9.16 14.39 112.39 22.97 15.57 -27.5
GrossDomesticlncome 1877.12 1955.64 2157.05 2296.56 2411.54 2426.94 2552.18 2688.68 2883.87 3051.0
Resource Gap (M-X) 62.06 55.84 71.71 53.45 61.50 12.89 27.44 15.73 40.55 59.7Imports (g+nfs) 195.86 192.51 223.07 221.76 228.95 201.64 227.21 253.19 288.91 338.5Capacity to import 133.80 136.67 151.36 168.31 167.45 188.75 1 99.76 237.47 248.36 278.7[Exports (g+nfs)] 109.18 121.88 127.76 145.42 158.29 174.36 187.38 214.50 232.79 306.3'
Total Expenditure 1939.18 2011.48 2228.77 2350.01 2473.04 2439.83 2579.62 2704.41 2924.41 3110.7-
Consumption 1537.47 1593.62 1733.00 1843.17 1904.19 1933.50 2010.68 2150.58 2245.32 2310.2"-General Gov't 208.49 226.60 238.68 252.15 260.59 259.25 267.77 284.88 290.01 304.9APrivate 1328.98 1367.02 1494.32 1591.02 1643.60 1674.25 1742.91 1865.69 1955.31 2005.35
Investment 401.71 417.86 495.77 506.84 568.85 506.33 568.94 553.83 679.09 800.46Fixed Investment 359.97 399.55 427.70 464.83 510.91 490.46 524.61 553.82 627.72 742.55Change in Stocks 41.74 18.31 68.07 42.01 57.94 15.87 44.09 -18.19 51.37 57.91
Domestic Savings 339.65 362.02 424.06 453.39 507.35 493.44 541.50 538.10 638.54 740.74Net Factor Income -20.07 -20.83 -21.87 -25.66 -27.70 -31.80 -31.40 -32.07 -27.42 -28.84CurrentTransfers 22.83 22.74 22.06 18.11 15.05 30.66 23.49 32.50 46.95 48.57National Savings 316.82 339.28 402.00 435.28 492.31 462.77 518.01 505.60 591.59 692.17
ForeignSavings 59.29 53.93 71.53 61.00 74.15 14.03 35.35 15.30 21.01 39.99
GDPpercapita(Rs.) 2402.72 2463.01 2650.25 2766.02 2863.38 2818.40 2912.60 3001.92 3172.90 3346.24Percapitaprivateconsumnption 1723.71 1734.80 1856.29 1935.55 1959.00 1955.90 1998.75 2101.01 2162.96 2179.73
Rupee Deflators (1980-81=100):GDPmp 158.14 171.68 185.51 200.92 222.92 255.66 277.71 303.70 332.49 356.85Imports(g+nfs) 130.32 153.88 174.20 209.90 246.83 302.52 341.85 369.22 414.62 482.27Exports(g+nfs) 159.71 172.56 206.38 242.94 261.11 327.49 364.44 408.77 442.35 438.96Total Expenditure 155.24 169.92 183.18 199.17 222.69 254.40 277.06 301.50 331.86 362.41Govt. Consumption 166.08 180.24 198.30 214.96 237.07 267.92 293.52 315.67 346.06 381.90Priv. Consumption 149.37 165.37 177.03 190.85 215.25 245.59 267.63 294.79 327.97 360.41Fixed Investment 172.38 180.69 200.30 221.10 242.71 278.32 302.81 315.98 340.98 363.97Total Investment 169.02 179.20 194.47 217.42 237.60 276.63 298.20 316.84 337.00 360.02
-- Not available.Note: Exports, Imports, Foreign Savings, Net Factor Income and Capital Transfers numbers are used from the BOP.
Source: CSO, National Accounts Statistics 1996 and CSO Quick Estimates.
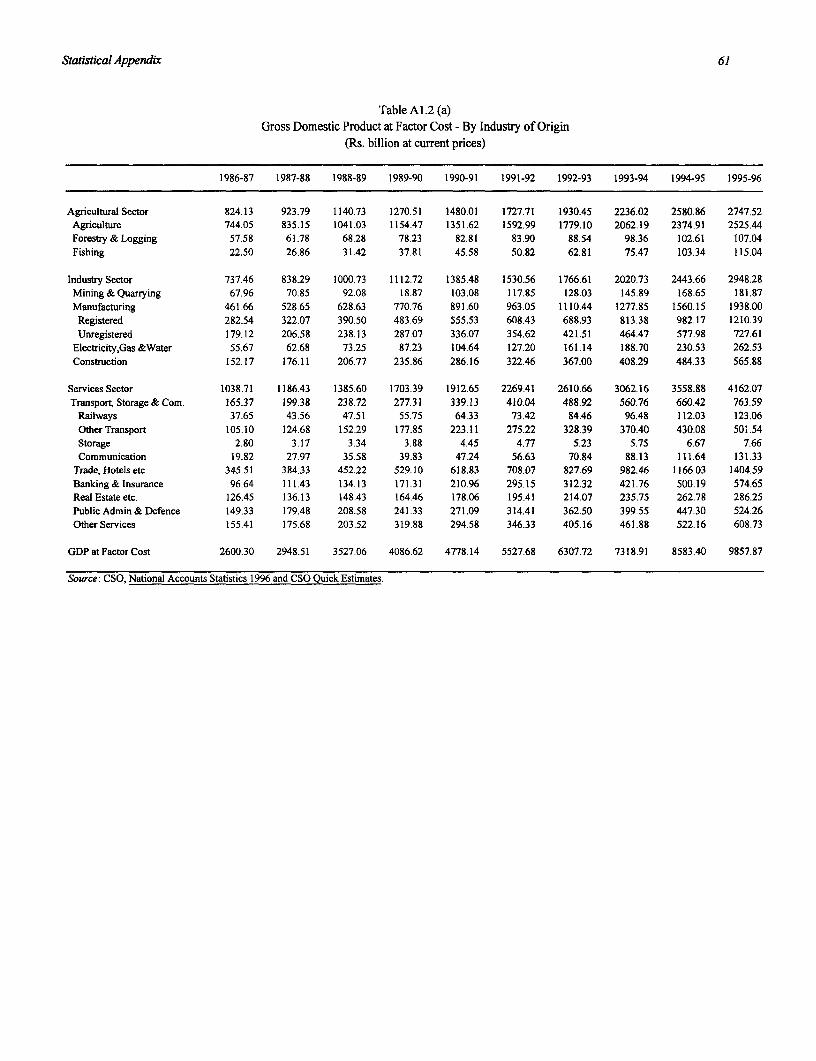
Statistical Appendix 61
Table AI.2 (a)Gross Domestic Product at Factor Cost - By Industry of Origin
(Rs. billion at current prices)
1986-87 1987-88 1988-89 1989-90 1990-91 1991-92 1992-93 1993-94 1994-95 1995-96
Agricultural Sector 824.13 923.79 1140.73 1270.51 1480.01 1727.71 1930.45 2236.02 2580.86 2747.52Agriculture 744.05 835.15 1041.03 1154.47 1351.62 1592.99 1779.10 2062.19 2374.91 2525.44Forestry & Logging 57.58 61.78 68.28 78.23 82.81 83.90 88.54 98.36 102.61 107.04Fishing 22.50 26.86 31.42 37.81 45.58 50.82 62.81 75.47 103.34 115.04
Industry Sector 737.46 838.29 1000.73 1112.72 1385.48 1530.56 1766.61 2020.73 2443.66 2948.28Mining&Quarrying 67.96 70.85 92.08 18.87 103.08 117.85 128.03 145.89 168.65 181.87Manufacturing 461.66 528.65 628.63 770.76 891.60 963.05 1110.44 1277.85 1560.15 1938.00Registered 282.54 322.07 390.50 483.69 555.53 608.43 688.93 813.38 982.17 1210.39Unregistered 179.12 206.58 238.13 287.07 336.07 354.62 421.51 464.47 577.98 727.61
Electricity,Gas &Water 55.67 62.68 73.25 87.23 104.64 127.20 161.14 188.70 230.53 262.53Construction 152.17 176.11 206.77 235.86 286.16 322.46 367.00 408.29 484.33 565.88
Services Sector 1038.71 1186.43 1385.60 1703.39 1912.65 2269.41 2610.66 3062.16 3558.88 4162.07Transpor, Storage & Com. 165.37 199.38 238.72 277.31 339.13 410.04 488.92 560.76 660.42 763.59
Railways 37.65 43.56 47.51 55.75 64.33 73.42 84.46 96.48 112.03 123.06OtherTransport 105.10 124.68 152.29 177.85 223.11 275.22 328.39 370.40 430.08 501.54Storage 2.80 3.17 3.34 3.88 4.45 4.77 5.23 5.75 6.67 7.66Communication 19.82 27.97 35.58 39.83 47.24 56.63 70.84 88.13 111.64 131.33
Trade, Hotels etc. 345.51 384.33 452.22 529.10 618.83 708.07 827.69 982.46 1166.03 1404.59Banking&Insurance 96.64 111.43 134.13 171.31 210.96 295.15 312.32 421.76 500.19 574.65Real Estate etc. 126.45 136.13 148.43 164.46 178.06 195.41 214.07 235.75 262.78 286.25Public Admin & Defence 149.33 179.48 208.58 241.33 271.09 314.41 362.50 399.55 447.30 524.26Other Services 155.41 175.68 203.52 319.88 294.58 346.33 405.16 461.88 522.16 608.73
GDP atFactor Cost 2600.30 2948.51 3527.06 4086.62 4778.14 5527.68 6307.72 7318.91 8583.40 9857.87
Source: CSO, National Accounts Statistics 1996 and CSO Quick Estimates.
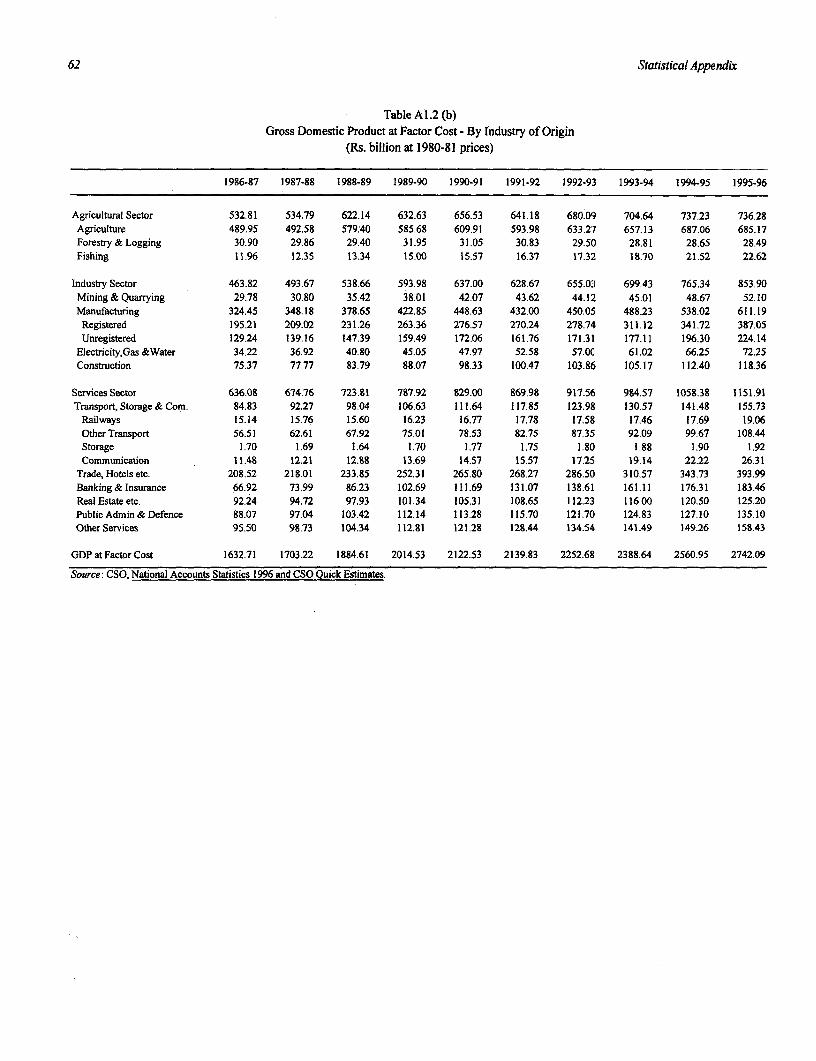
62 Statistical Appendix
Table Al.2 (b)Gross Domestic Product at Factor Cost - By Industry of Origin
(Rs. billion at 1980-81 prices)
1986-87 1987-88 1988-89 1989-90 1990-91 1991-92 1992-93 1993-94 1994-95 1995-96
Agricultural Sector 532.81 534.79 622.14 632.63 656.53 641.18 680.09 704.64 737.23 736.28Agriculture 489.95 492.58 579.40 585.68 609.91 593.98 633.27 657.13 687.06 685.17Forestry&Logging 30.90 29.86 29.40 31.95 31.05 30.83 29.50) 28.81 28.65 28.49Fishing 11.96 12.35 13.34 15.00 15.57 16.37 17.32 18.70 21.52 22.62
Industry Sector 463.82 493.67 538.66 593.98 637.00 628.67 655.03 699.43 765.34 853.90Mining & Quarrying 29.78 30.80 35.42 38.01 42.07 43.62 44.1!2 45.01 48.67 52.10Manufacturing 324.45 348.18 378.65 422.85 448.63 432.00 450.05 488.23 538.02 611.19Registered 195.21 209.02 231.26 263.36 276.57 270.24 278.74 311.12 341.72 387.05Unregistered 129.24 139.16 147.39 159.49 172.06 161.76 171.31 177.11 196.30 224.14
Electricity,Gas &Water 34.22 36.92 40.80 45.05 47.97 52.58 57.0C0 61.02 66.25 72.25Construction 75.37 77.77 83.79 88.07 98.33 100.47 103.86 105.17 112.40 118.36
Services Sector 636.08 674.76 723.81 787.92 829.00 869.98 917.56 984.57 1058.38 1151.91Transport, Storage & Com. 84.83 92.27 98.04 106.63 111.64 117.85 123.98 130.57 141.48 155.73
Railways 15.14 15.76 15.60 16.23 16.77 17.78 17.58 17.46 17.69 19.06Other Transport 56.51 62.61 67.92 75.01 78.53 82.75 87.35 92.09 99.67 108.44Storage 1.70 1.69 1.64 1.70 1.77 1.75 1.80 1.88 1.90 1.92Communication 11.48 12.21 12.88 13.69 14.57 15.57 17.25 19.14 22.22 26.31
Trade,Hotelsetc. 208.52 218.01 233.85 252.31 265.80 268.27 286.50 310.57 343.73 393.99Banking&Insurance 66.92 73.99 86.23 102.69 111.69 131.07 138.61 161.11 176.31 183.46RealEstateetc. 92.24 94.72 97.93 101.34 105.31 108.65 112.23 116.00 120.50 125.20PublicAdmin&Defence 88.07 97.04 103.42 112.14 113.28 115.70 121.70 124.83 127.10 135.10Other Services 95.50 98.73 104.34 112.81 121.28 128.44 134.54 141.49 149.26 158.43
GDP at Factor Cost 1632.71 1703.22 1884.61 2014.53 2122.53 2139.83 2252.68 2388.64 2560.95 2742.09
Source: CSO, National Accounts Statistics 1996 and CSO Quick Estimates.
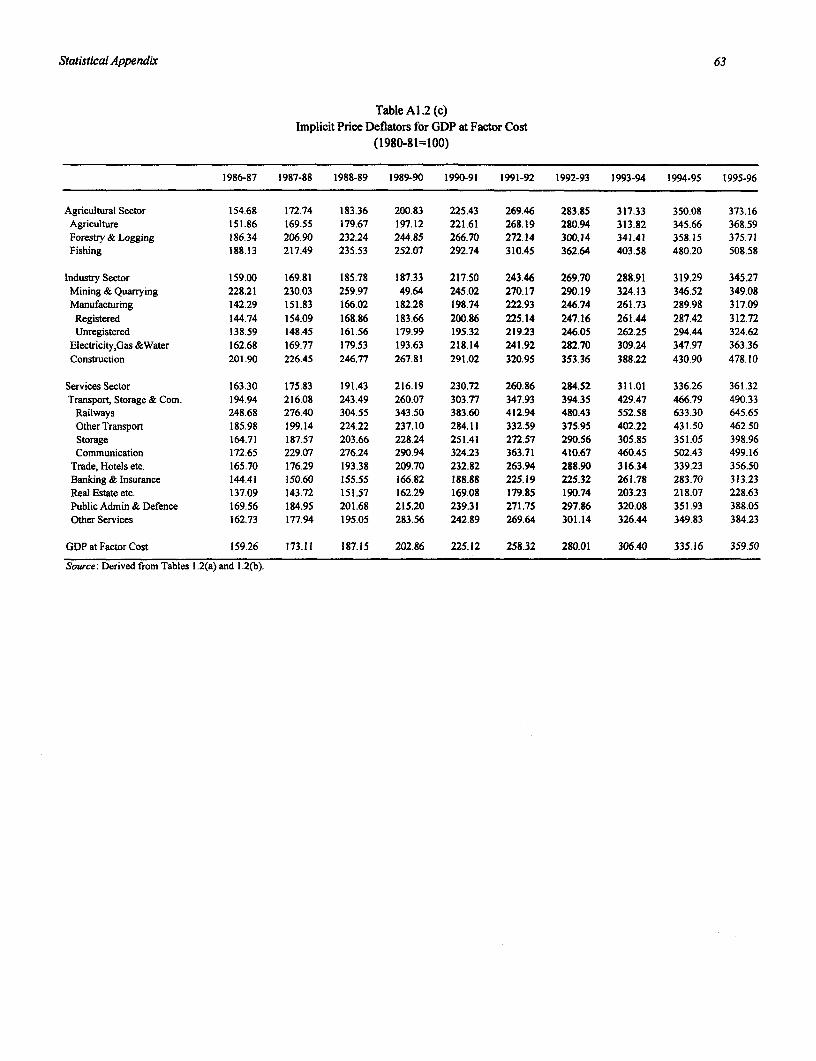
Statistical Appendix 63
Table A1.2 (c)Implicit Price Deflators for GDP at Factor Cost
(1980-81=100)
1986-87 1987-88 1988-89 1989-90 1990-91 1991-92 1992-93 1993-94 1994-95 1995-96
Agricultural Sector 154.68 172.74 183.36 200.83 225.43 269.46 283.85 317.33 350.08 373.16Agriculture 151.86 169.55 179.67 197.12 221.61 268.19 280.94 313.82 345.66 368.59Forestry & Logging 186.34 206.90 232.24 244.85 266.70 272.14 300.14 341.41 358.15 375.71Fishing 188.13 217.49 235.53 252.07 292.74 310.45 362.64 403.58 480.20 508.58
Industry Sector 159.00 169.81 185.78 187.33 217.50 243.46 269.70 288.91 319.29 345.27Mining & Quarrying 228.21 230.03 259.97 49.64 245.02 270.17 290.19 324.13 346.52 349.08Manufacturing 142.29 151.83 166.02 182.28 198.74 222.93 246.74 261.73 289.98 317.09Registered 144.74 154.09 168.86 183.66 200.86 225.14 247.16 261.44 287.42 312.72Unregistered 138.59 148.45 161.56 179.99 195.32 219.23 246.05 262.25 294.44 324.62
Electricity,Gas &Water 162.68 169.77 179.53 193.63 218.14 241.92 282.70 309.24 347.97 363.36Construction 201.90 226.45 246.77 267.81 291.02 320.95 353.36 388.22 430.90 478.10
Services Sector 163.30 175.83 191.43 216.19 230.72 260.86 284.52 311.01 336.26 361.32Transport, Storage & Com. 194.94 216.08 243.49 260.07 303.77 347.93 394.35 429.47 466.79 490.33
Railways 248.68 276.40 304.55 343.50 383.60 412.94 480.43 552.58 633.30 645.65Other Transport 185.98 199.14 224.22 237.10 284.11 332.59 375.95 402.22 431.50 462.50Storage 164.71 187.57 203.66 228.24 251.41 272.57 290.56 305.85 351.05 398.96Communication 172.65 229.07 276.24 290.94 324.23 363.71 410.67 460.45 502.43 499.16
Trade, Hotels etc. 165.70 176.29 193.38 209.70 232.82 263.94 288.90 316.34 339.23 356.50Banking & Insurance 144.41 150.60 155.55 166.82 188.88 225.19 225.32 261.78 283.70 313.23Real Estate etc. 137.09 143.72 151.57 162.29 169.08 179.85 190.74 203.23 218.07 228.63PublicAdmin&Defence 169.56 184.95 201.68 215.20 239.31 271.75 297.86 320.08 351.93 388.05Other Services 162.73 177.94 195.05 283.56 242.89 269.64 301.14 326.44 349.83 384.23
GDPatFactorCost 159.26 173.11 187.15 202.86 225.12 258.32 280.01 306.40 335.16 359.50
Source: Derived from Tables 1.2(a) and 1.2(b).
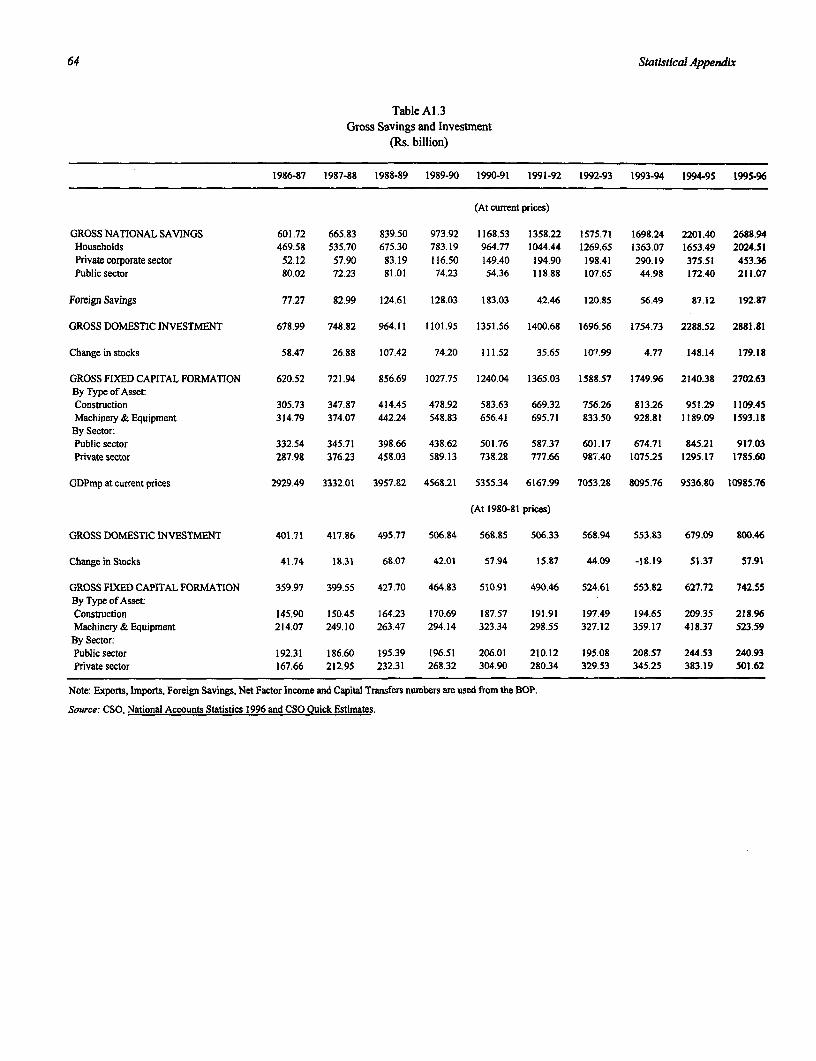
64 Statistical Appendix
Table Al.3Gross Savings and Investment
(Rs. billion)
1986-87 1987-88 1988-89 1989-90 1990-91 1991-92 1992-93 1993-94 1994-95 1995-96
(At current prices)
GROSS NATIONAL SAVINGS 601.72 665.83 839.50 973.92 1168.53 1358.22 1575.71 1698.24 2201.40 2688.94Households 469.58 535.70 675.30 783.19 964.77 1044.44 1269.65 1363.07 1653.49 2024.51Privatecorporatesector 52.12 57.90 83.19 116.50 149.40 194.90 198.41 290.19 375.51 453.36Publicsector 80.02 72.23 81.01 74.23 54.36 118.88 107.65 44.98 172.40 211.07
Foreign Savings 77.27 82.99 124.61 128.03 183.03 42.46 120.85 56.49 87.12 192.87
GROSS DOMESTIC INVESTMENT 678.99 748.82 964.11 1101.95 1351.56 1400.68 1696.56 1754.73 2288.52 2881.81
Change in stocks 58.47 26.88 107.42 74.20 111.52 35.65 107.99 4.77 148.14 179.18
GROSS FIXED CAPITAL FORMATION 620.52 721.94 856.69 1027.75 1240.04 1365.03 1588.57 1749.96 2140.38 2702.63By Type of Asset:Construction 305.73 347.87 414.45 478.92 583.63 669.32 756.26 813.26 951.29 1109.45Machinery&Equipment 314.79 374.07 442.24 548.83 656.41 695.71 833.50 928.81 1189.09 1593.18By Sector:Public sector 332.54 345.71 398.66 438.62 501.76 587.37 601.17 674.71 845.21 917.03Private sector 287.98 376.23 458.03 589.13 738.28 777.66 987A0 1075.25 1295.17 1785.60
GDPmp at current prices 2929.49 3332.01 3957.82 4568.21 5355.34 6167.99 7053.28 8095.76 9536.80 10985.76
(At 1980-81 prices)
GROSS DOMESTIC INVESTMENT 401.71 417.86 495.77 506.84 568.85 506.33 568.94 553.83 679.09 800.46
Change in Stocks 41.74 18.31 68.07 42.01 57.94 15.87 44.09 -18.19 51.37 57.91
GROSS FIXED CAPITAL FORMATION 359.97 399.55 427.70 464.83 510.91 490.46 524.61 553.82 627.72 742.55By Type of Asset:Construction 145.90 150.45 164.23 170.69 187.57 191.91 197.49 194.65 209.35 218.96Machinery & Equipment 214.07 249.10 263.47 294.14 323.34 298.55 327 12 359.17 418.37 523.59By Sector:Public sector 192.31 186.60 195.39 196.51 206.01 210.12 195.08 208.57 244.53 240.93Private sector 167.66 212.95 232.31 268.32 304.90 280.34 329.53 345.25 383.19 501.62
Note: Exports, Imports, Foreign Savings, Net Factor Income and Capital Transfers numbers are used from the BOP.
Source: CSO, National Accounts Statistics 1996 and CSO Quick Estimates.
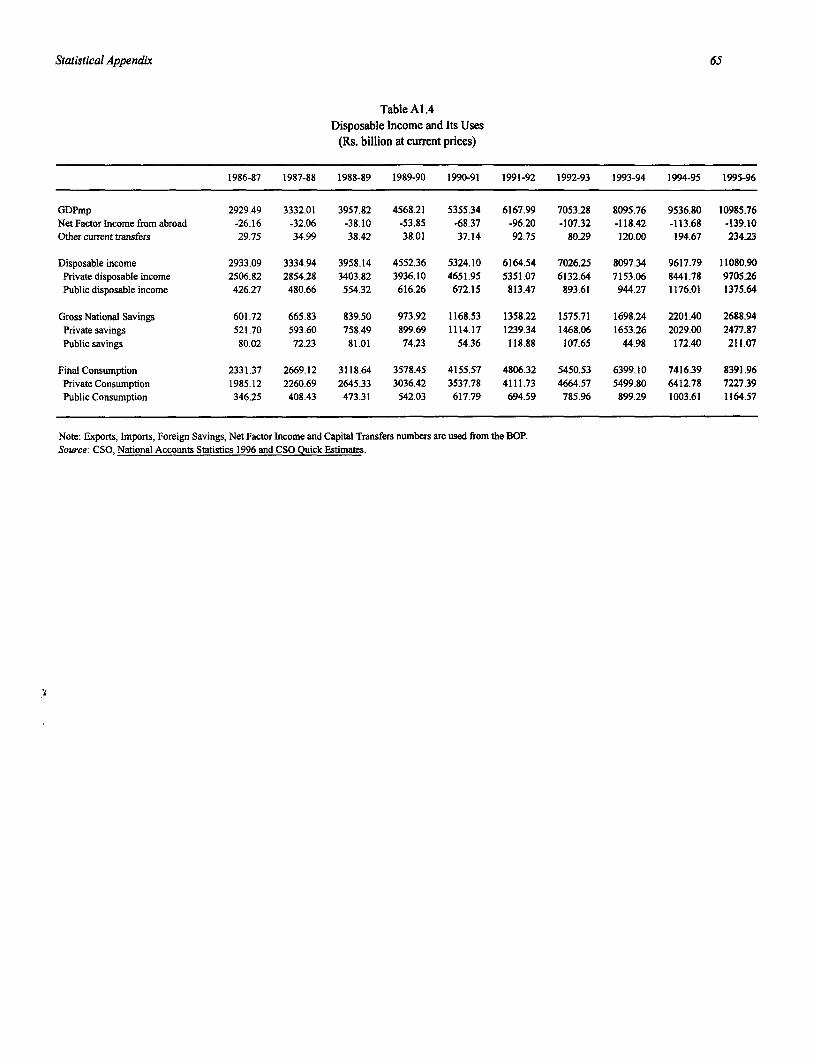
Statistical Appendix 65
Table Al.4Disposable Income and Its Uses
(Rs. billion at current prices)
1986-87 1987-88 1988-89 1989-90 1990-91 1991-92 1992-93 1993-94 1994-95 1995-96
GDPmp 2929.49 3332.01 3957.82 4568.21 5355.34 6167.99 7053.28 8095.76 9536.80 10985.76Net Factor Income from abroad -26.16 -32.06 -38.10 -53.85 -68.37 -96.20 -107.32 -118.42 -113.68 -139.10Other current transfers 29.75 34.99 38.42 38.01 37.14 92.75 80.29 120.00 194.67 234.23
Disposable income 2933.09 3334.94 3958.14 4552.36 5324.10 6164.54 7026.25 809734 9617.79 11080.90Private disposable income 2506.82 2854.28 3403.82 3936.10 4651.95 5351.07 6132.64 7153.06 8441.78 9705.26Public disposable income 426.27 480.66 554.32 616.26 672.15 813.47 893.61 944.27 1176.01 1375.64
Gross National Savings 601.72 665.83 839.50 973.92 1168.53 1358.22 1575.71 1698.24 2201.40 2688.94Private savings 521.70 593.60 758.49 899.69 1114.17 1239.34 1468.06 1653.26 2029.00 2477.87Public savings 80.02 72.23 81.01 74.23 54.36 118.88 107.65 44.98 172.40 211.07
Final Consumption 2331.37 2669.12 3118.64 3578.45 4155.57 4806.32 5450.53 6399.10 7416.39 8391.96Private Consumption 1985.12 2260.69 2645.33 3036.42 3537.78 4111.73 4664.57 5499.80 6412.78 7227.39Public Consumption 346.25 408.43 473.31 542.03 617.79 694.59 785.96 899.29 1003.61 1164.57
Note: Exports, Imports, Foreign Savings, Net Factor Income and Capital Transfers numbers are used from the BOP.Source: CSO, National Accounts Statistics 1996 and CSO Quick Estimates.
.4
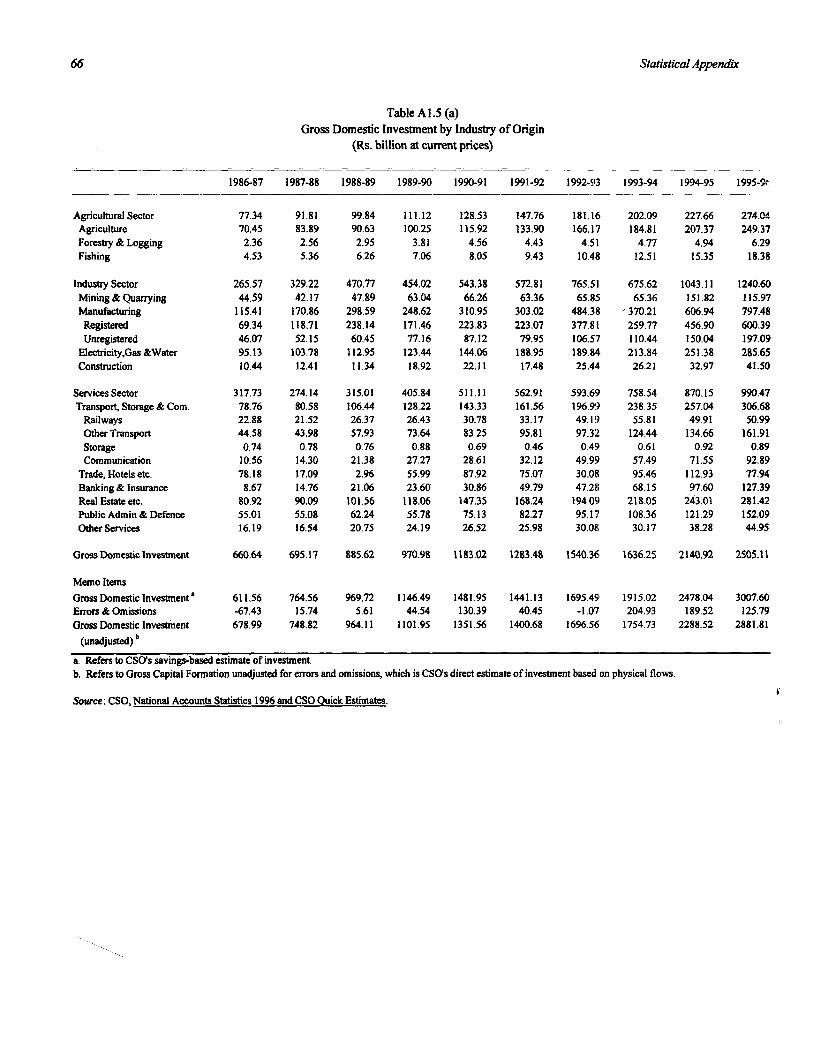
66 Statistical Appendix
Table Al.5 (a)Gross Domestic Investment by Industry of Origin
(Rs. billion at current prices)
1986-87 1987-88 1988-89 1989-90 1990-91 1991-92 1992-93 1993-94 1994-95 1995-9-
Agricultural Sector 77.34 91.81 99.84 111.12 128.53 147.76 181.16 202.09 227.66 274.04Agriculture 70.45 83.89 90.63 100.25 115.92 133.90 166.17 184.81 207.37 249.37Forestry & Logging 2.36 2.56 2.95 3.81 4.56 4.43 4.51 4.77 4.94 6.29Fishing 4.53 5.36 6.26 7.06 8.05 9.43 10.48 12.51 15.35 18.38
Industry Sector 265.57 329.22 470.77 454.02 543.38 572.81 765.51 675.62 1043.11 1240.60Mining & Quarrying 44.59 42.17 47.89 63.04 66.26 63.36 65.85 65.36 151.82 115.97Manufacturing 115.41 170.86 298.59 248.62 310.95 303.02 484.38 '370.21 606.94 797.48Registered 69.34 118.71 238.14 171.46 223.83 223.07 377.81 259.77 456.90 600.39Unregistered 46.07 52.15 60.45 77.16 87.12 79.95 106.57 110.44 150.04 197.09
Electricity,Gas &Water 95.13 103.78 112.95 123.44 144.06 188.95 189.84 213.84 251.38 285.65Construction 10.44 12.41 11.34 18.92 22.11 17.48 25.44 26.21 32.97 41.50
Services Sector 317.73 274.14 315.01 405.84 511.11 562.91 593.69 758.54 870.15 990.47Transport, Storage & Com. 78.76 80.58 106.44 128.22 143.33 161.56 196.91 238.35 257.04 306.68
Railways 22.88 21.52 26.37 26.43 30.78 33.17 49.19 55.81 49.91 50.99OtherTransport 44.58 43.98 57.93 73.64 83.25 95.81 97.32 124.44 134.66 161.91Storage 0.74 0.78 0.76 0.88 0.69 0.46 0.49 0.61 0.92 0.89Communication 10.56 14.30 21.38 27.27 28.61 32.12 49.99 57.49 71.55 92.89
Trade, Hotels etc. 78.18 17.09 2.96 55.99 87.92 75.07 30.08 95.46 112.93 77.94Banking & Insurance 8.67 14.76 21.06 23.60 30.86 49.79 47.28 68.15 97.60 127.39Real Estate etc. 80.92 90.09 101.56 118.06 147.35 168.24 194.09 218.05 243.01 281.42PublicAdmin&Defence 55.01 55.08 62.24 55.78 75.13 82.27 95.17 108.36 121.29 152.09Other Services 16.19 16.54 20.75 24.19 26.52 25.98 30.08 30.17 38.28 44.95
Gross Domestic Investment 660.64 695.17 885.62 970.98 1183.02 1283.48 1540.36 1636.25 2140.92 2505.11
Memo Items
Gross Domestic investment' 611.56 764.56 969.72 1146.49 1481.95 1441.13 1695.49 1915.02 2478.04 3007.60Errors&Omissions -67.43 15.74 5.61 44.54 130.39 40.45 -1.07 204.93 189.52 125.79GrossDomesticInvestment 678.99 748.82 964.11 1101.95 1351.56 1400.68 1696.56 1754.73 2288.52 2881.81
(unadjusted) ;
a. Refers to CSO's savings-based estimate of investment.b. Refers to Gross Capital Formation unadjusted for errors and omissions, which is CSOs direct estimate of investment based on physical flows.
Source: CSO, National Accounts Statistics 1996 and CSO Quick Estimates.
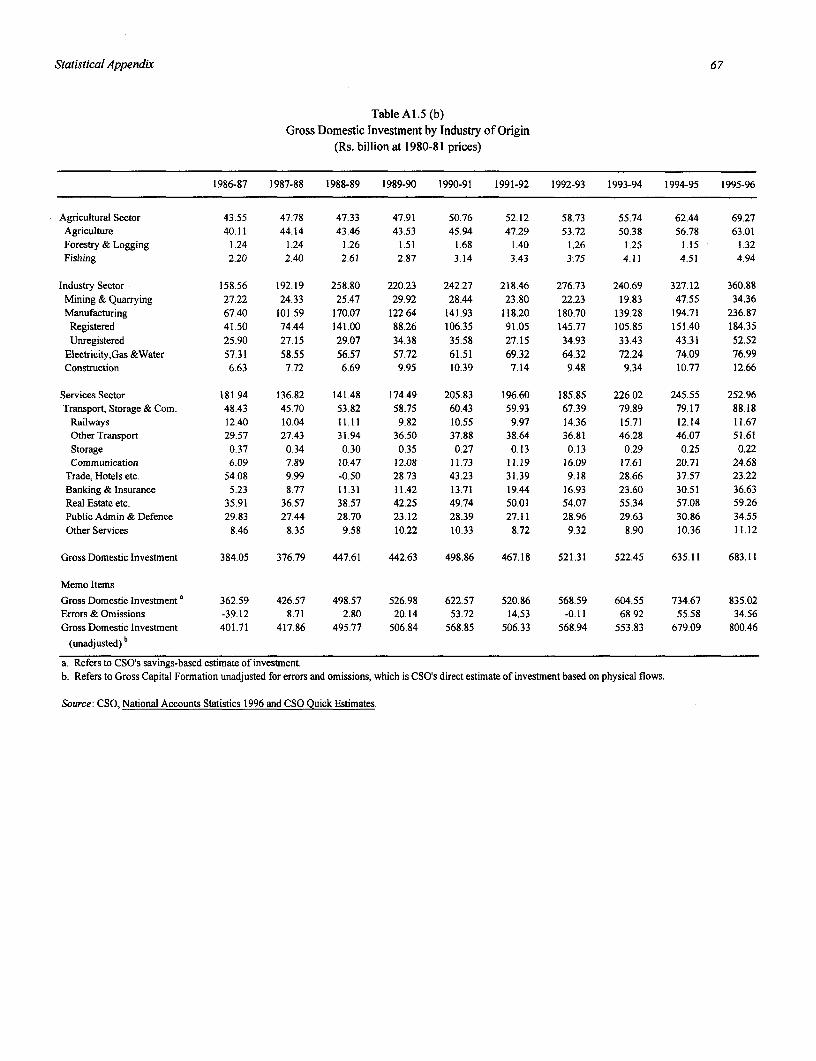
Statistical Appendix 67
Table A1.5 (b)Gross Domestic Investment by Industry of Origin
(Rs. billion at 1980-81 prices)
1986-87 1987-88 1988-89 1989-90 1990-91 1991-92 1992-93 1993-94 1994-95 1995-96
Agricultural Sector 43.55 47.78 47.33 47.91 50.76 52.12 58.73 55.74 62.44 69.27Agriculture 40.11 44.14 43.46 43.53 45.94 47.29 53.72 50.38 56.78 63.01Forestry & Logging 1.24 1.24 1.26 1.51 1.68 1.40 1.26 1.25 1.15 1.32Fishing 2.20 2.40 2.61 2.87 3.14 3.43 3.75 4.11 4.51 4.94
Industry Sector 158.56 192.19 258.80 220.23 242.27 218.46 276.73 240.69 327.12 360.88Mining & Quarrying 27.22 24.33 25.47 29.92 28.44 23.80 22.23 19.83 47.55 34.36Manufacturing 67.40 101.59 170.07 122.64 141.93 118.20 180.70 139.28 194.71 236.87Registered 41.50 74.44 141.00 88.26 106.35 91.05 145.77 105.85 151.40 184.35Unregistered 25.90 27.15 29.07 34.38 35.58 27.15 34.93 33.43 43.31 52.52
Electricity,Gas &Water 57.31 58.55 56.57 57.72 61.51 69.32 64.32 72.24 74.09 76.99Construction 6.63 7.72 6.69 9.95 10.39 7.14 9.48 9.34 10.77 12.66
Services Sector 181.94 136.82 141.48 174.49 205.83 196.60 185.85 226.02 245.55 252.96Transport, Storage & Com. 48.43 45.70 53.82 58.75 60.43 59.93 67.39 79.89 79.17 88.18
Railways 12.40 10.04 11.11 9.82 10.55 9.97 14.36 15.71 12.14 11.67Other Transport 29.57 27.43 31.94 36.50 37.88 38.64 36.81 46.28 46.07 51.61Storage 0.37 0.34 0.30 0.35 0.27 0.13 0.13 0.29 0.25 0.22Communication 6.09 7.89 10.47 12.08 11.73 11.19 16.09 17.61 20.71 24.68
Trade, Hotels etc. 54.08 9.99 -0.50 28.73 43.23 31.39 9.18 28.66 37.57 23.22Banking&Insurance 5.23 8.77 11.31 11.42 13.71 19.44 16.93 23.60 30.51 36.63Real Estate etc. 35.91 36.57 38.57 42.25 49.74 50.01 54.07 55.34 57.08 59.26Public Admin & Defence 29.83 27.44 28.70 23.12 28.39 27.11 28.96 29.63 30.86 34.55Other Services 8.46 8.35 9.58 10.22 10.33 8.72 9.32 8.90 10.36 11.12
Gross Domestic lnvestment 384.05 376.79 447.61 442.63 498.86 467.18 521.31 522.45 635.11 683.11
Memo Items
Gross Domestic Investment a 362.59 426.57 498.57 526.98 622.57 520.86 568.59 604.55 734.67 835.02Errors & Omissions -39.12 8.71 2.80 20.14 53.72 14.53 -0.11 68.92 55.58 34.56Gross Domestic Investment 401.71 417.86 495.77 506.84 568.85 506.33 568.94 553.83 679.09 800.46
(unadjusted) b
a. Refers to CSO's savings-based estimate of investment.b. Refers to Gross Capital Formation unadjusted for errors and omissions, which is CSO's direct estimate of investment based on physical flows.
Source: CSO, National Accounts Statistics 1996 and CSO Quick Estimates.
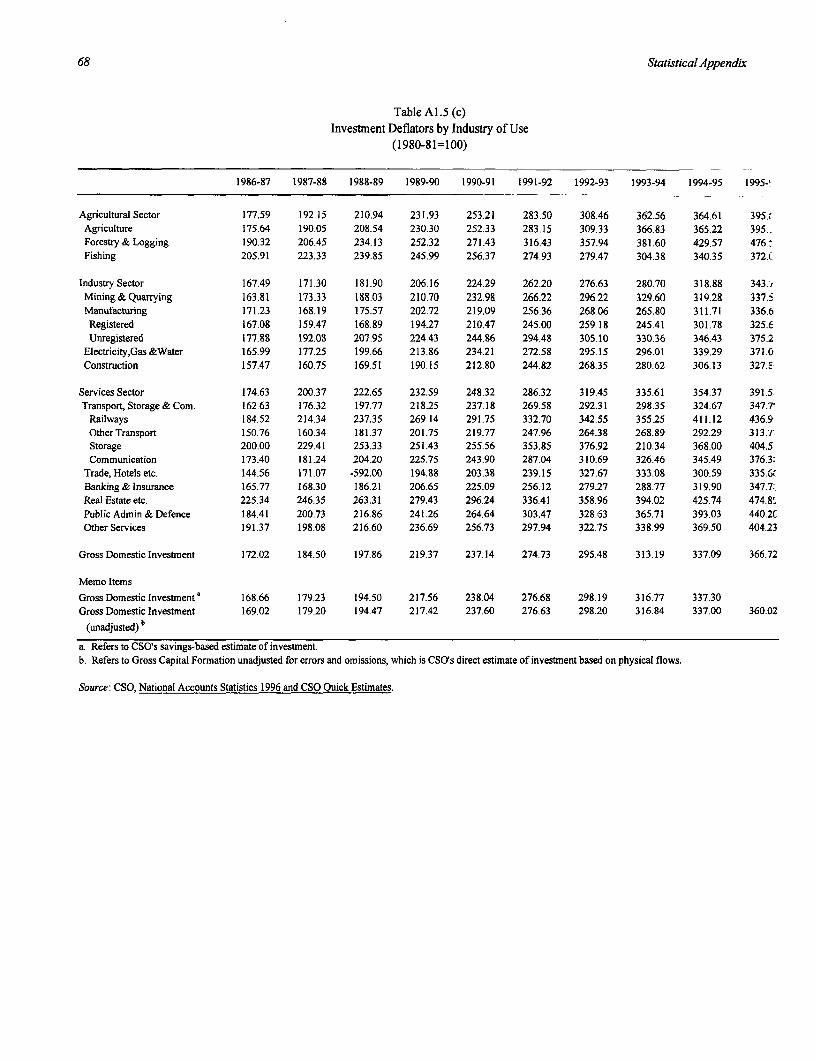
68 Statistical Appendix
Table A1.5 (c)Investment Deflators by Industry of Use
(1980-81=100)
1986-87 1987-88 1988-89 1989-90 1990-91 1991-92 1992-93 1993-94 1994-95 1995-1
Agricultural Sector 177.59 192.15 210.94 231.93 253.21 283.50 308.46 362.56 364.61 395.,Agriculture 175.64 190.05 208.54 230.30 252.33 283.15 309.33 366.83 365.22 395..Forestry&Logging 190.32 206.45 234.13 252.32 271.43 316.43 357.94 381.60 429.57 476-Fishing 205.91 223.33 239.85 245.99 256.37 274.93 279.47 304.38 340.35 372.
Industry Sector 167.49 171.30 181.90 206.16 224.29 262.20 276.63 280.70 318.88 343.,Mining&Quarrying 163.81 173.33 188.03 210.70 232.98 266.22 296.22 329.60 319.28 337.1Manufacturing 171.23 168.19 175.57 202.72 219.09 256.36 268.06 265.80 311.71 336.6Registered 167.08 159.47 168.89 194.27 210.47 245.00 259.18 245.41 301.78 325.6Unregistered 177.88 192.08 207.95 224.43 244.86 294.48 305.10 330.36 346.43 375.2
Electricity,Gas&Water 165.99 177.25 199.66 213.86 234.21 272.58 295.15 296.01 339.29 371.0Construction 157.47 160.75 169.51 190.15 212.80 244.82 268.35 280.62 306.13 327.E-
Services Sector 174.63 200.37 222.65 232.59 248.32 286.32 319.45 335.61 354.37 391.5Transport, Storage & Com. 162.63 176.32 197.77 218.25 237.18 269.58 292.31 298.35 324.67 347.7'
Railways 184.52 214.34 237.35 269.14 291.75 332.70 342.55 355.25 411.12 436.9OtherTransport 150.76 160.34 181.37 201.75 219.77 247.96 264.38 268.89 292.29 313.rStorage 200.00 229.41 253.33 251.43 255.56 353.85 376.92 210.34 368.00 404.5:Communication 173.40 181.24 204.20 225.75 243.90 287.04 310.69 326.46 345.49 376.3:.
Trade, Hotels etc. 144.56 171.07 -592.00 194.88 203.38 239.15 327.67 333.08 300.59 335.6Bsanking& Insurance 165.77 168.30 186.21 206.65 225.09 256.12 279.27 288.77 319.90 347.7.Real Estate etc. 225.34 246.35 263.31 279.43 296.24 336.41 358.96 394.02 425.74 474.8'Public Admin & Defence 184.41 200.73 216.86 241.26 264.64 303.47 328.153 365.71 393.03 440.2COther Services 191.37 198.08 216.60 236.69 256.73 297.94 322.75 338.99 369.50 404.23
Gross Domestic lnvestment 172.02 184.50 197.86 219.37 237.14 274.73 295.48 313.19 337.09 366.72
Memo Items
Gross Domestic Investment' 168.66 179.23 194.50 217.56 238.04 276.68 298.:19 316.77 337.30Gross Domestic Investment 169.02 179.20 194.47 217.42 237.60 276.63 298.20 316.84 337.00 360.02
(unadjusted) b
a. Refers to CSC's savings-based estimate of investment.b. Refers to Gross Capital Formation unadjusted for errors and omissions, which is CSO's direct estimate of investment based on physical flows.
Source: CSO, National Accounts Statistics 1996 and CSO Quick Estimates.
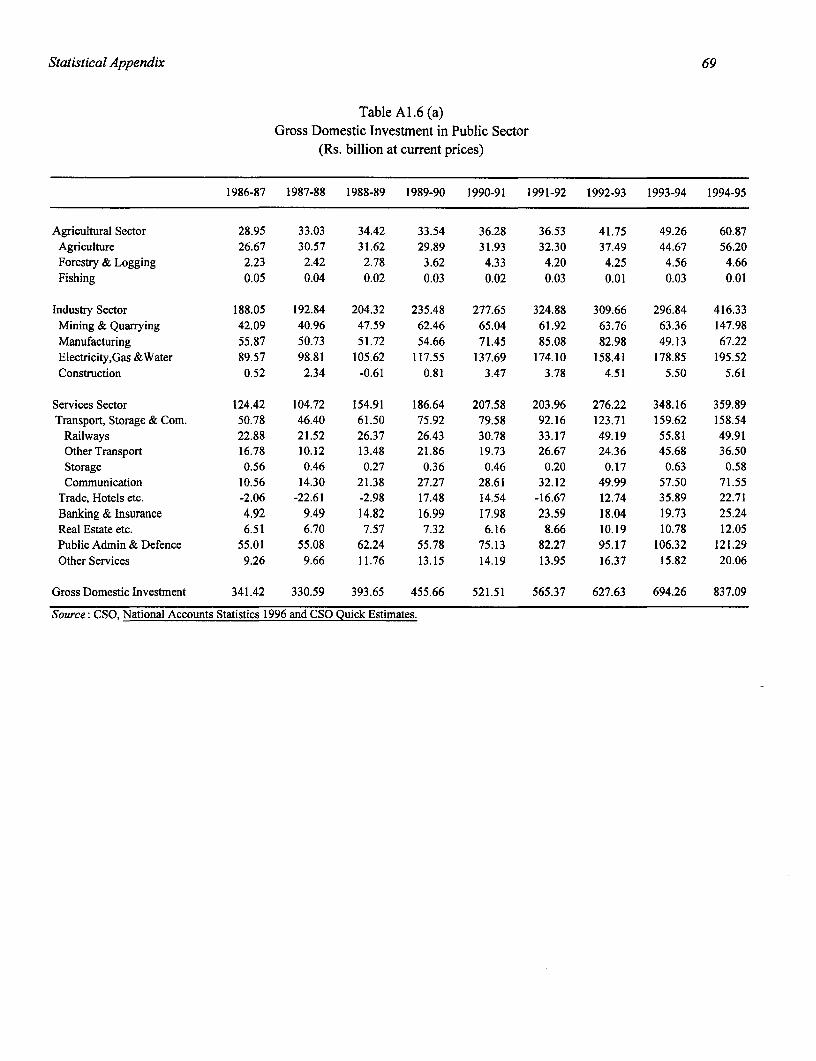
Statistical Appendix 69
Table A1.6 (a)Gross Domestic Investment in Public Sector
(Rs. billion at current prices)
1986-87 1987-88 1988-89 1989-90 1990-91 1991-92 1992-93 1993-94 1994-95
Agricultural Sector 28.95 33.03 34.42 33.54 36.28 36.53 41.75 49.26 60.87Agriculture 26.67 30.57 31.62 29.89 31.93 32.30 37.49 44.67 56.20Forestry & Logging 2.23 2.42 2.78 3.62 4.33 4.20 4.25 4.56 4.66Fishing 0.05 0.04 0.02 0.03 0.02 0.03 0.01 0.03 0.01
Industry Sector 188.05 192.84 204.32 235.48 277.65 324.88 309.66 296.84 416.33Mining & Quarrying 42.09 40.96 47.59 62.46 65.04 61.92 63.76 63.36 147.98Manufacturing 55.87 50.73 51.72 54.66 71.45 85.08 82.98 49.13 67.22Electricity,Gas&Water 89.57 98.81 105.62 117.55 137.69 174.10 158.41 178.85 195.52Construction 0.52 2.34 -0.61 0.81 3.47 3.78 4.51 5.50 5.61
Services Sector 124.42 104.72 154.91 186.64 207.58 203.96 276.22 348.16 359.89Transport, Storage & Com. 50.78 46.40 61.50 75.92 79.58 92.16 123.71 159.62 158.54
Railways 22.88 21.52 26.37 26.43 30.78 33.17 49.19 55.81 49.91Other Transport 16.78 10.12 13.48 21.86 19.73 26.67 24.36 45.68 36.50Storage 0.56 0.46 0.27 0.36 0.46 0.20 0.17 0.63 0.58Communication 10.56 14.30 21.38 27.27 28.61 32.12 49.99 57.50 71.55
Trade, Hotels etc. -2.06 -22.61 -2.98 17.48 14.54 -16.67 12.74 35.89 22.71Banking & Insurance 4.92 9.49 14.82 16.99 17.98 23.59 18.04 19.73 25.24Real Estate etc. 6.51 6.70 7.57 7.32 6.16 8.66 10.19 10.78 12.05Public Admin & Defence 55.01 55.08 62.24 55.78 75.13 82.27 95.17 106.32 121.29Other Services 9.26 9.66 11.76 13.15 14.19 13.95 16.37 15.82 20.06
Gross Domestic Investment 341.42 330.59 393.65 455.66 521.51 565.37 627.63 694.26 837.09
Source: CSO, National Accounts Statistics 1996 and CSO Quick Estimates.
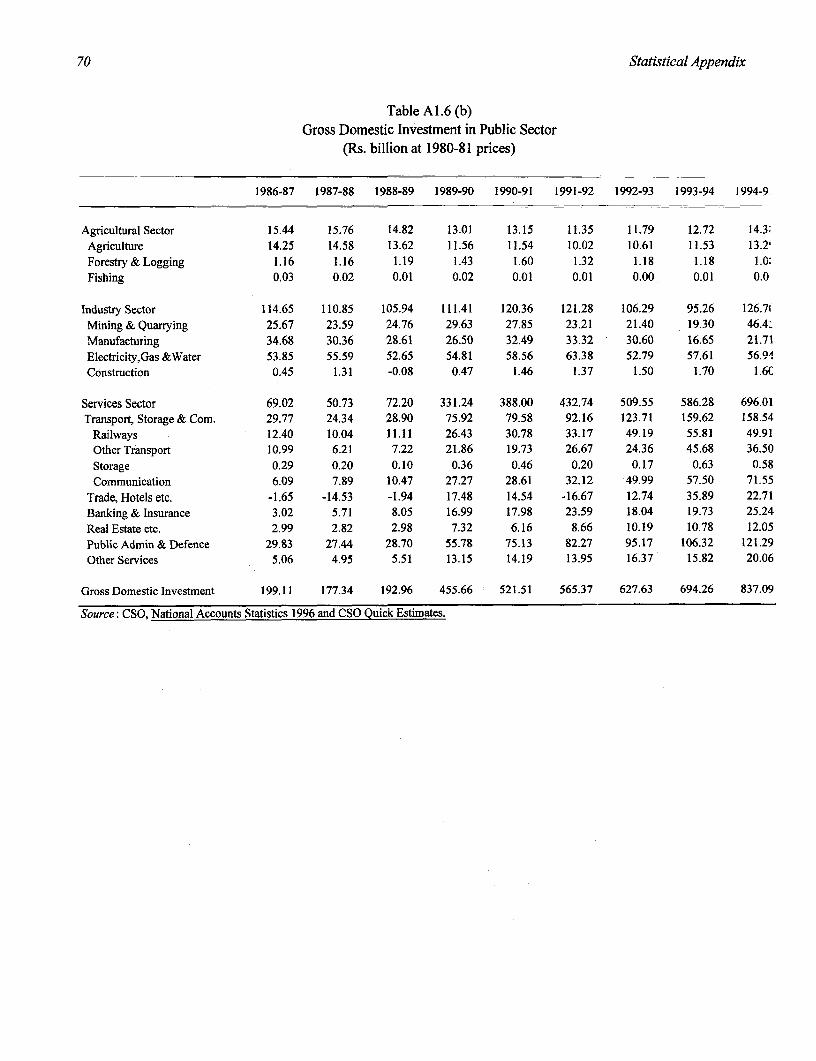
70 Statistical Appendix
Table Al.6 (b)Gross Domestic Investment in Public Sector
(Rs. billion at 1980-81 prices)
1986-87 1987-88 1988-89 1989-90 1990-91 1991-92 1992-93 1993-94 1994-9
Agricultural Sector 15.44 15.76 14.82 13.01 13.15 11.35 11.79 12.72 14.3.
Agriculture 14.25 14.58 13.62 11.56 11.54 10.02 10.61 11.53 13.2'
Forestiy&Logging 1.16 1.16 1.19 1.43 1.60 1.32 1.18 1.18 1.0GFishing 0.03 0.02 0.01 0.02 0.01 0.01 0.00 0.01 0.0
Industry Sector 114.65 110.85 105.94 111.41 120.36 121.28 106.29 95.26 126.7wMining & Quarrying 25.67 23.59 24.76 29.63 27.85 23.21 21.40 19.30 46.4:
Manufacturing 34.68 30.36 28.61 26.50 32.49 33.32 30.60 16.65 21.71
Electricity,Gas &Water 53.85 55.59 52.65 54.81 58.56 63.38 52.79 57.61 56.9A
Construction 0.45 1.31 -0.08 0.47 1.46 1.37 1.50 1.70 1.6C
Services Sector 69.02 50.73 72.20 331.24 388.00 432.74 509.55 586.28 696.01Transport, Storage & Com. 29.77 24.34 28.90 75.92 79.58 92.16 123.71 159.62 158.54
Railways 12.40 10.04 11.11 26.43 30.78 33.17 49.19 55.81 49.91Other Transport 10.99 6.21 7.22 21.86 19.73 26.67 24.36 45.68 36.50
Storage 0.29 0.20 0.10 0.36 0.46 0.20 0.17 0.63 0.58Communication 6.09 7.89 10.47 27.27 28.61 32.12 49.99 57.50 71.55
Trade, Hotels etc. -1.65 -14.53 -1.94 17.48 14.54 -16.67 12.74 35.89 22.71Banking & Insurance 3.02 5.71 8.05 16.99 17.98 23.59 18.04 19.73 25.24
Real Estate etc. 2.99 2.82 2.98 7.32 6.16 8.66 10.19 10.78 12.05
Public Admin & Defence 29.83 27.44 28.70 55.78 75.13 82.27 95.17 106.32 121.29Other Services 5.06 4.95 5.51 13.15 14.19 13.95 16.37 15.82 20.06
Gross Domestic Investment 199.11 177.34 192.96 455.66 521.51 565.37 627.63 694.26 837.09
Source: CSO, National Accounts Statistics 1996 and CSO Quick Estimates.
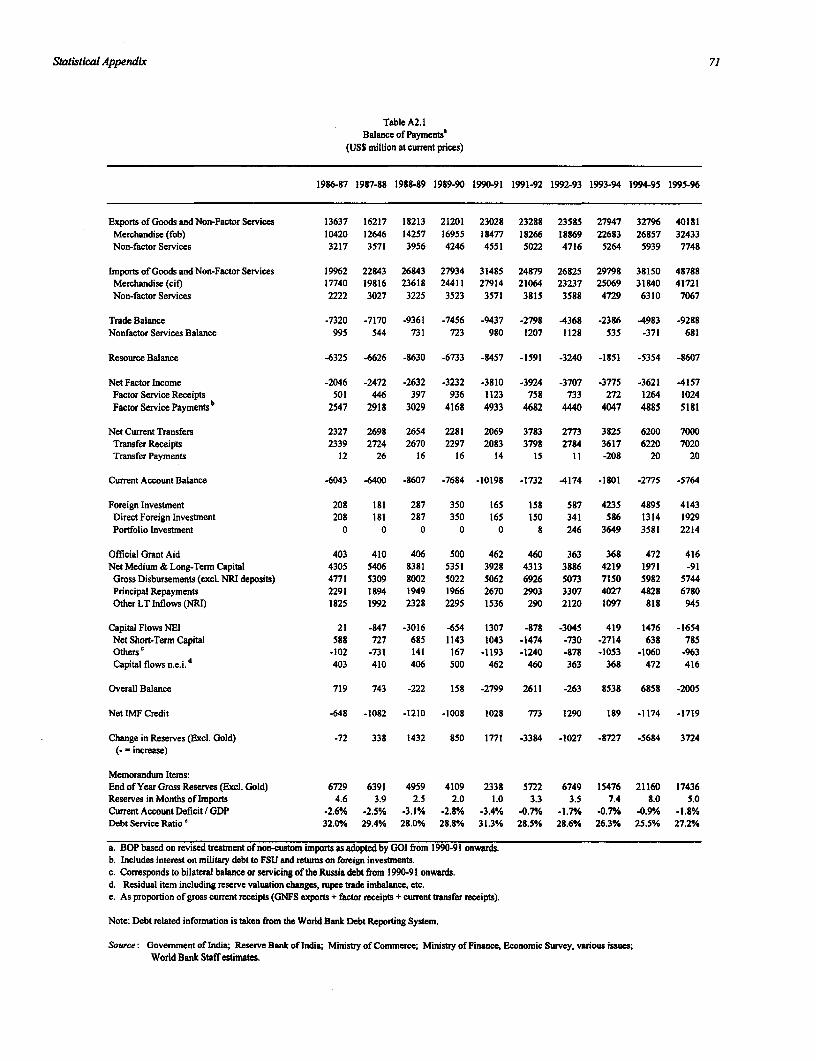
Statistical Appendix 71
Table A2.1Balance of Payments'
(USS million at current prices)
1986-87 1987-88 1988-89 1989-90 1990-91 1991-92 1992-93 1993-94 1994-95 1995-96
ExportsofGoodsandNon-FactorServices 13637 16217 18213 21201 23028 23288 23585 27947 32796 40181Merchandise (fob) 10420 12646 14257 16955 18477 18266 18869 22683 26857 32433Non-factor Services 3217 3571 3956 4246 4551 5022 4716 5264 5939 7748
Imports of Goods and Non-Factor Services 19962 22843 26843 27934 31485 24879 26825 29798 38150 48788Merchandise(cif) 17740 19816 23618 24411 27914 21064 23237 25069 31840 41721Non-factor Services 2222 3027 3225 3523 3571 3815 3588 4729 6310 7067
Trade Balance -7320 -7170 -9361 -7456 -9437 -2798 4368 -2386 -4983 -9288Nonfactor Services Balance 995 544 731 723 980 1207 1128 535 -371 691
Resource Balance -6325 -6626 -8630 -6733 -S457 -1591 -3240 -1851 -5354 -8607
Net Factor Income -2046 -2472 -2632 -3232 -3810 -3924 -3707 -3775 -3621 -4157Factor Service Receipts 501 446 397 936 1123 758 733 272 1264 1024Factor Service Paymentsb 2547 2918 3029 4168 4933 4682 4440 4047 4885 5181
Net Current Transfers 2327 2698 2654 2281 2069 3783 2773 3825 6200 7000Transfer Receipts 2339 2724 2670 2297 2083 3798 2784 3617 6220 7020TransferPayments 12 26 16 16 14 15 11 -208 20 20
Current Account Balance -6043 -6400 -8607 -7684 -10198 -1732 -4174 -1801 -2775 -5764
Foreign Investment 208 181 287 350 165 158 587 4235 4895 4143Direct Foreign Investment 208 181 287 350 165 150 341 586 1314 1929Portfolio Investment 0 0 0 0 0 8 246 3649 3581 2214
Official Grant Aid 403 410 406 500 462 460 363 368 472 416NetMedium&Long-TermCapital 4305 5406 8381 5351 3928 4313 3886 4219 1971 -91Gross Disbursements (excl. NRI deposits) 4771 5309 8002 5022 5062 6926 5073 7150 5982 5744Principal Repayments 2291 1894 1949 1966 2670 2903 3307 4027 4828 6780OtherLTlnflows(NRI) 1825 1992 2328 2295 1536 290 2120 1097 818 945
Capital Flows NEI 21 -847 -3016 -654 1307 -878 -3045 419 1476 -1654Net Short-Term Capital 588 727 685 1143 1043 -1474 -730 -2714 638 785OthersC -102 -731 141 167 -1193 -1240 -878 -1053 -1060 -963Capital flows n.e.i. d 403 410 406 500 462 460 363 368 472 416
Overall Balance 719 743 -222 158 -2799 2611 -263 8538 6858 -2005
Net IMF Credit -648 -1082 -1210 -1008 1028 773 1290 189 -1174 -1719
Change in Reserves (Excl. Gold) -72 338 1432 850 1771 -3384 -1027 -8727 -5684 3724(- = increase)
Memorandum Items:End of Year Gross Reserves (Excl. Gold) 6729 6391 4959 4109 2338 5722 6749 15476 21160 17436Reserves in Months of Imports 4.6 3.9 2.5 2.0 1.0 3.3 3.5 7.4 8.0 5.0Cunrent Account Deficit / GDP -2.6% -2.5% -3.1% -2.8% -3.4% -0.70/ -1.7% -0.7%/ -0.9%Y -1.8%Debt Service Ratio' 32.0/ 29.4% 28.0% 28.8% 31.3% 28.5% 28.6% 26.3% 25.5% 27.2%
a. BOP based on revised treatment of non-custom imports as adopted by GOI from 1990-91 onwards.b. Includes interest on military debt to FSU and retums on foreign investments.c. Corresponds to bilateral balance or servicing of the Russia debt from 1990-91 onwards.d. Residual item including reserve valuation changes, rupee trade imbalance, etc.e. As proportion of gross current receipts (GNFS exports + factor receipts + current transfer receipts).
Note: Debt related information is taken from the World Bank Debt Reporting System.
Source: Govermment of India; Reserve Bank of India; Ministry of Commerce; Ministry of Finance, Economic Survey, various issues;World Bank Staff estimates.
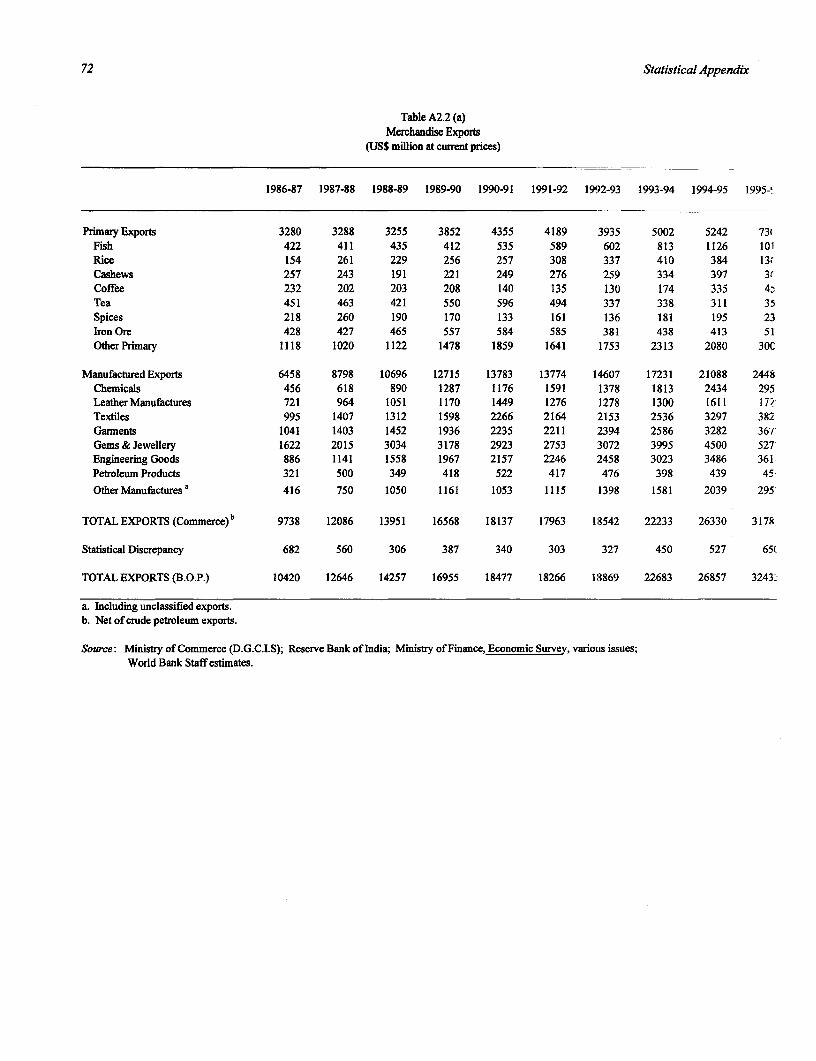
72 Statistical Appendix
Table A2.2 (a)Merchandise Exports
(USS million at current prices)
1986-87 1987-88 1988-89 1989-90 1990-91 1991-92 1992-93 1993-94 1994-95 1995-i
Primary Exports 3280 3288 3255 3852 4355 4189 3935 5002 5242 73'Fish 422 411 435 412 535 589 602 813 1126 101Rice 154 261 229 256 257 308 337 410 384 13.Cashews 257 243 191 221 249 276 259 334 397 3.Coffee 232 202 203 208 140 135 130 174 335 4:Tea 451 463 421 550 596 494 337 338 311 35Spices 218 260 190 170 133 161 136 181 195 23Iron Ore 428 427 465 557 584 585 381 438 413 51OtherPrimary 1118 1020 1122 1478 1859 1641 1753 2313 2080 30C
Manufactured Exports 6458 8798 10696 12715 13783 13774 14607 17231 21088 2448Chemicals 456 618 890 1287 1176 1591 1378 1813 2434 295Leather Manufactures 721 964 1051 1170 1449 1276 1278 1300 1611 17-/Textiles 995 1407 1312 1598 2266 2164 2153 2536 3297 382Garments 1041 1403 1452 1936 2235 2211 :2394 2586 3282 36/Gems & Jewellery 1622 2015 3034 3178 2923 2753 :3072 3995 4500 527Engineering Goods 886 1141 1558 1967 2157 2246 :2458 3023 3486 361-Petroleum Products 321 500 349 418 522 417 476 398 439 45-
OtherManufacturesa 416 750 1050 1161 1053 1115 1398 1581 2039 295-
TOTALEXPORTS (Commerce)b 9738 12086 13951 16568 18137 17963 18542 22233 26330 317S
Statistical Discrepancy 682 560 306 387 340 303 327 450 527 65'
TOTAL EXPORTS (B.O.P.) 10420 12646 14257 16955 18477 18266 13869 22683 26857 32432
a. Including unclassified exports.b. Net of crude petroleum exports.
Source: Ministry of Commerce (D.G.C.I.S); Reserve Bank of India; Ministry of Finance, Economic Survey, various issues;World Bank Staff estimates.
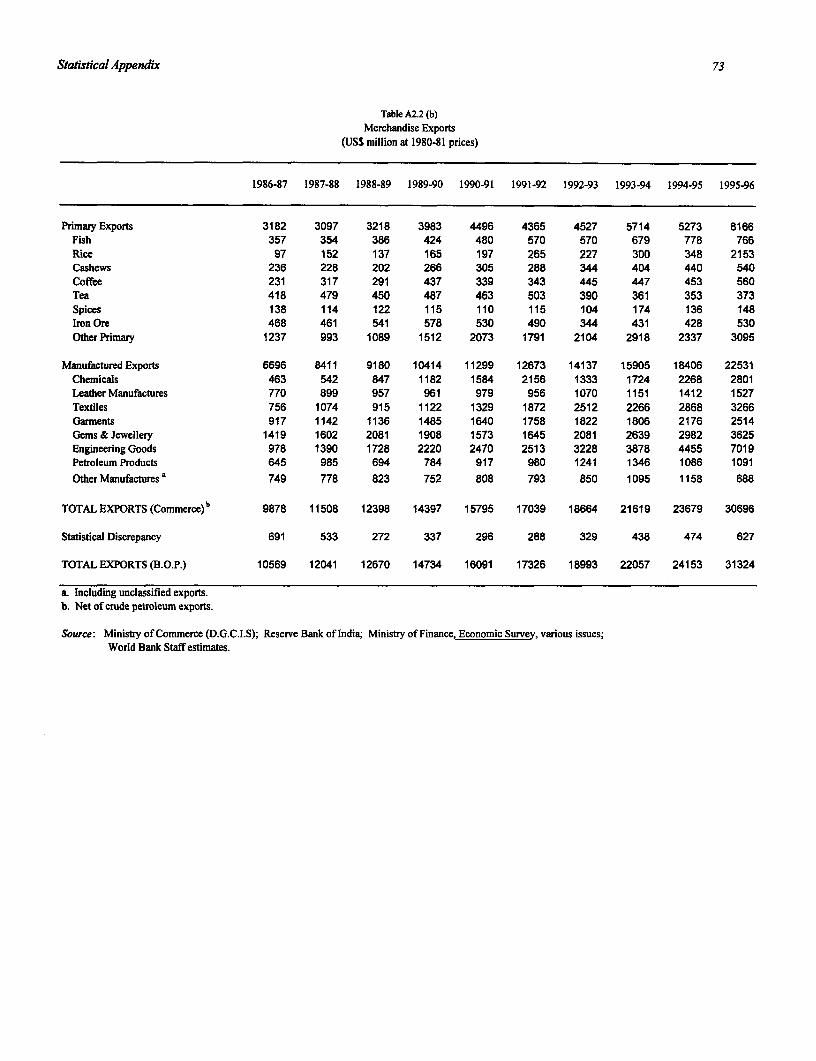
Statistical Appendix 73
Table A2.2 (b)Merchandise Exports
(US$ million at 1980-81 prices)
1986-87 1987-88 1988-89 1989-90 1990-91 1991-92 1992-93 1993-94 1994-95 1995-96
Primary Exports 3182 3097 3218 3983 4496 4365 4527 5714 5273 8166Fish 357 354 386 424 480 570 570 679 778 766Rice 97 152 137 165 197 265 227 300 348 2153Cashews 236 228 202 266 305 288 344 404 440 540Coffee 231 317 291 437 339 343 445 447 453 560Tea 418 479 450 487 463 503 390 361 353 373Spices 138 114 122 115 110 115 104 174 136 148Iron Ore 468 461 541 578 530 490 344 431 428 530Other Primary 1237 993 1089 1512 2073 1791 2104 2918 2337 3095
Manufactured Exports 6696 8411 9180 10414 11299 12673 14137 15905 18406 22531Chemicals 463 542 847 1182 1584 2156 1333 1724 2268 2801Leather Manufactures 770 899 957 961 979 956 1070 1151 1412 1527Textiles 756 1074 915 1122 1329 1872 2512 2266 2868 3266Garments 917 1142 1136 1485 1640 1758 1822 1806 2176 2514Gems & Jewellery 1419 1602 2081 1908 1573 1645 2081 2639 2982 3625Engineering Goods 978 1390 1728 2220 2470 2513 3228 3878 4455 7019Petroleum Products 645 985 694 784 917 980 1241 1346 1086 1091Other Manufactures ' 749 778 823 752 808 793 850 1095 1158 688
TOTAL EXPORTS (Commerce)b 9878 11508 12398 14397 15795 17039 18664 21619 23679 30696
Statistical Discrepancy 691 533 272 337 296 288 329 438 474 627
TOTAL EXPORTS (B.O.P.) 10569 12041 12670 14734 16091 17326 18993 22057 24153 31324
a. Including unclassified exports.b. Net of crude petroleum exports.
Source: Ministry of Commerce (D.G.C.I.S); Reserve Bank of India; Ministry of Finance, Economic Survey, various issues;World Bank Staff estimates.
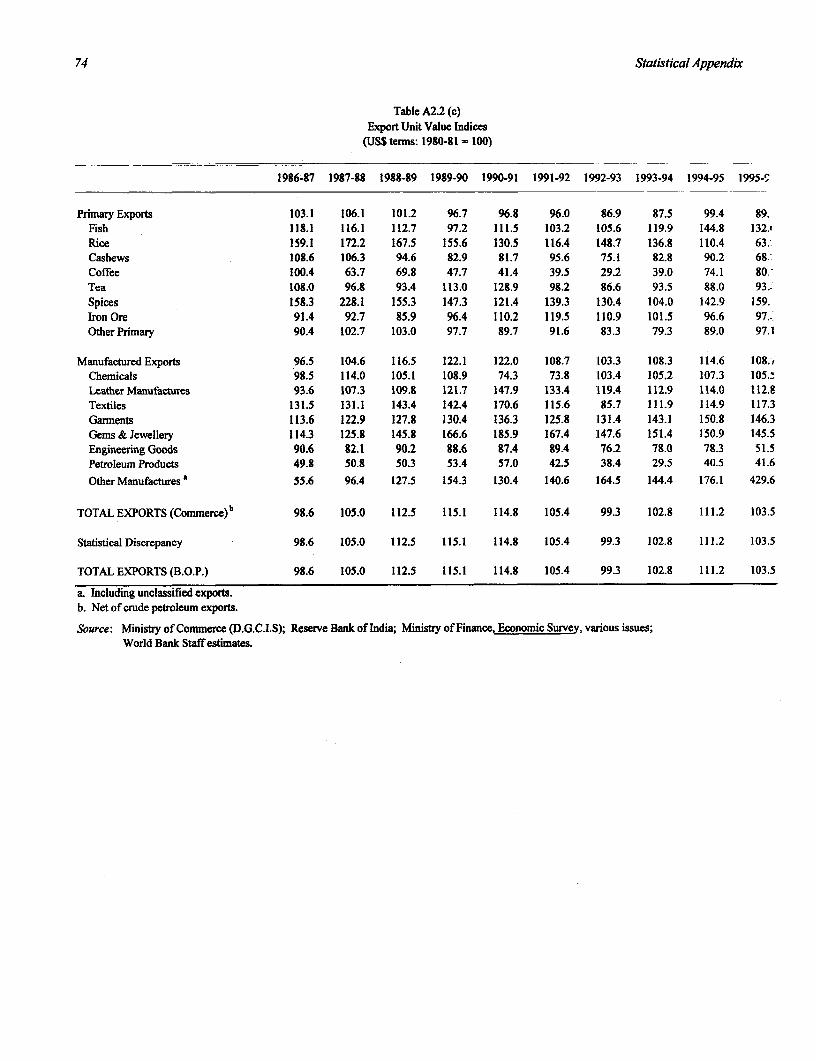
74 Statistical Appendix
Table A2.2 (c)Export Unit Value Indices
(USS terms: 1980-81 = 100)
1986-7 1987-88 1988-89 1989-90 1990-91 1991-92 1992-93 1993-94 1994-95 1995-!
Primary Exports 103.1 106.1 101.2 96.7 96.8 96.0 86.9 87.5 99.4 89.Fish 118.1 116.1 112.7 97.2 111.5 103.2 105.6 119.9 144.8 132.Rice 159.1 172.2 167.5 155.6 130.5 116.4 148.7 136.8 110.4 63:-Cashews 108.6 106.3 94.6 82.9 81.7 95.6 75.1 82.8 90.2 68-:Coffee 100.4 63.7 69.8 47.7 41.4 39.5 29.2 39.0 74.1 80 -Tea 108.0 96.8 93.4 113.0 128.9 98.2 86.6 93.5 88.0 93.Spices 158.3 228.1 155.3 147.3 121.4 139.3 130.4 104.0 142.9 159.Iron Ore 91.4 92.7 85.9 96.4 110.2 119.5 110.9 101.5 96.6 97.-Other Primary 90.4 102.7 103.0 97.7 89.7 91.6 83.3 79.3 89.0 97.1
Manufactured Exports 96.5 104.6 116.5 122.1 122.0 108.7 103.3 108.3 114.6 108.,Chemicals 98.5 114.0 105.1 108.9 74.3 73.8 103.4 105.2 107.3 105.!Leather Manufactures 93.6 107.3 109.8 121.7 147.9 133A 119.4 112.9 114.0 112.8Textiles 131.5 131.1 143.4 142.4 170.6 115.6 85.7 111.9 114.9 117.3Gannents 113.6 122.9 127.8 130.4 136.3 125.8 1131.4 143.1 150.8 146.3Gems & Jewellery 114.3 125.8 145.8 166.6 185.9 167.4 1147.6 151.4 150.9 145.5Engineering Goods 90.6 82.1 90.2 88.6 87.4 89A 76.2 78.0 78.3 51.5Petroleum Products 49.8 50.8 50.3 53.4 57.0 42.5 38.4 29.5 40.5 41.6
Odter Manufactures 55.6 96.4 127.5 154.3 130.4 140.6 1164.5 144.4 176.1 429.6
TOTAL EXPORTS (Commerce)b 98.6 105.0 112.5 115.1 114.8 105.4 99.3 102.8 111.2 103.5
Statistical Discrepancy 98.6 105.0 112.5 115.1 114.8 105.4 99.3 102.8 111.2 103.5
TOTAL EXPORTS (B.O.P.) 98.6 105.0 112.5 115.1 114.8 105.4 99.3 102.8 111.2 103.5
a. Including unclassified exports.b. Net of crude petroleum exports.
Source: Ministry of Commerce (D.G.C.I.S); Reserve Bank of India; Ministry of Finance, Economic Survey, various issues;World Bank Staff estimates.
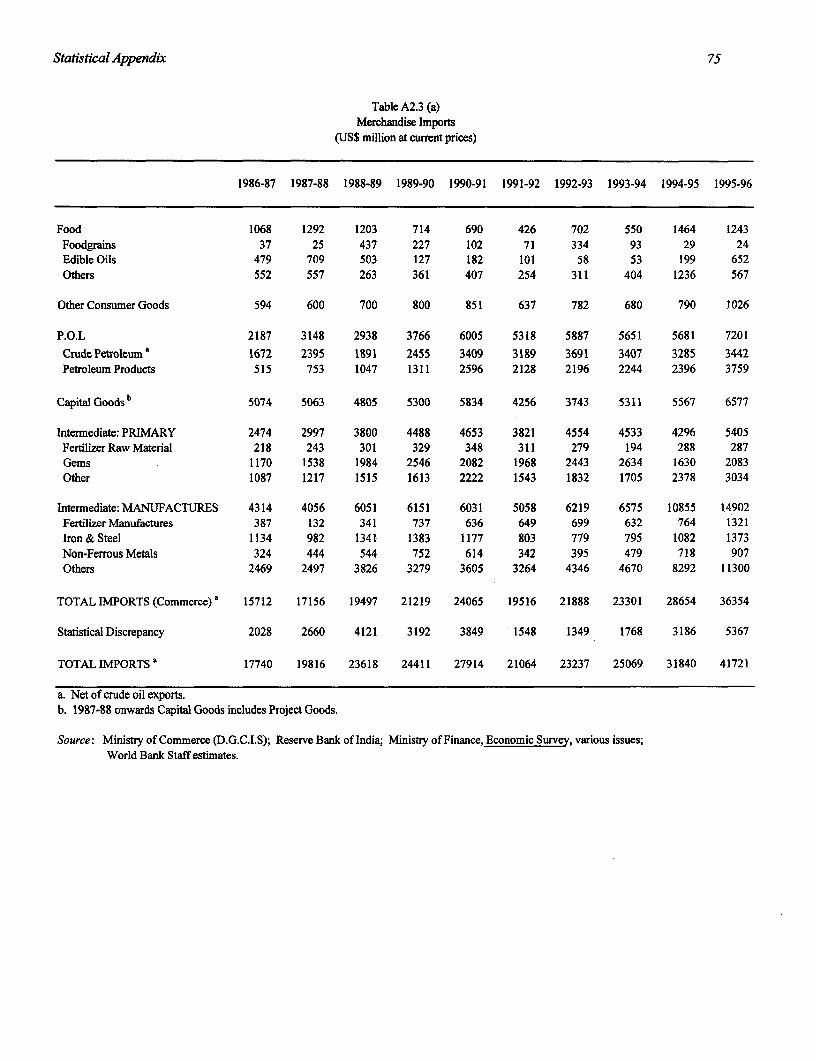
Statistical Appendix 75
Table A2.3 (a)Merchandise Imports
(US$ million at current prices)
1986-87 1987-88 1988-89 1989-90 1990-91 1991-92 1992-93 1993-94 1994-95 1995-96
Food 1068 1292 1203 714 690 426 702 550 1464 1243Foodgrains 37 25 437 227 102 71 334 93 29 24Edible Oils 479 709 503 127 182 101 58 53 199 652Others 552 557 263 361 407 254 311 404 1236 567
Other Consumer Goods 594 600 700 800 851 637 782 680 790 1026
P.O.L 2187 3148 2938 3766 6005 5318 5887 5651 5681 7201CrudePetroleuma 1672 2395 1891 2455 3409 3189 3691 3407 3285 3442Petroleum Products 515 753 1047 1311 2596 2128 2196 2244 2396 3759
Capital Goods b 5074 5063 4805 5300 5834 4256 3743 5311 5567 6577
Intermediate: PRIMARY 2474 2997 3800 4488 4653 3821 4554 4533 4296 5405Fertilizer Raw Material 218 243 301 329 348 311 279 194 288 287Gems 1170 1538 1984 2546 2082 1968 2443 2634 1630 2083Other 1087 1217 1515 1613 2222 1543 1832 1705 2378 3034
Intermediate: MANUFACTURES 4314 4056 6051 6151 6031 5058 6219 6575 10855 14902Fertilizer Manufactures 387 132 341 737 636 649 699 632 764 1321Iron&Steel 1134 982 1341 1383 1177 803 779 795 1082 1373Non-Ferrous Metals 324 444 544 752 614 342 395 479 718 907Others 2469 2497 3826 3279 3605 3264 4346 4670 8292 11300
TOTAL IMPORTS (Commerce) a 15712 17156 19497 21219 24065 19516 21888 23301 28654 36354
Statistical Discrepancy 2028 2660 4121 3192 3849 1548 1349 1768 3186 5367
TOTAL IMPORTS a 17740 19816 23618 24411 27914 21064 23237 25069 31840 41721
a. Net of crude oil exports.b. 1987-88 onwards Capital Goods includes Project Goods.
Source: Ministry of Commerce (D.G.C.I.S); Reserve Bank of India; Ministry of Finance, Economic Survey, various issues;World Bank Staff estimates.
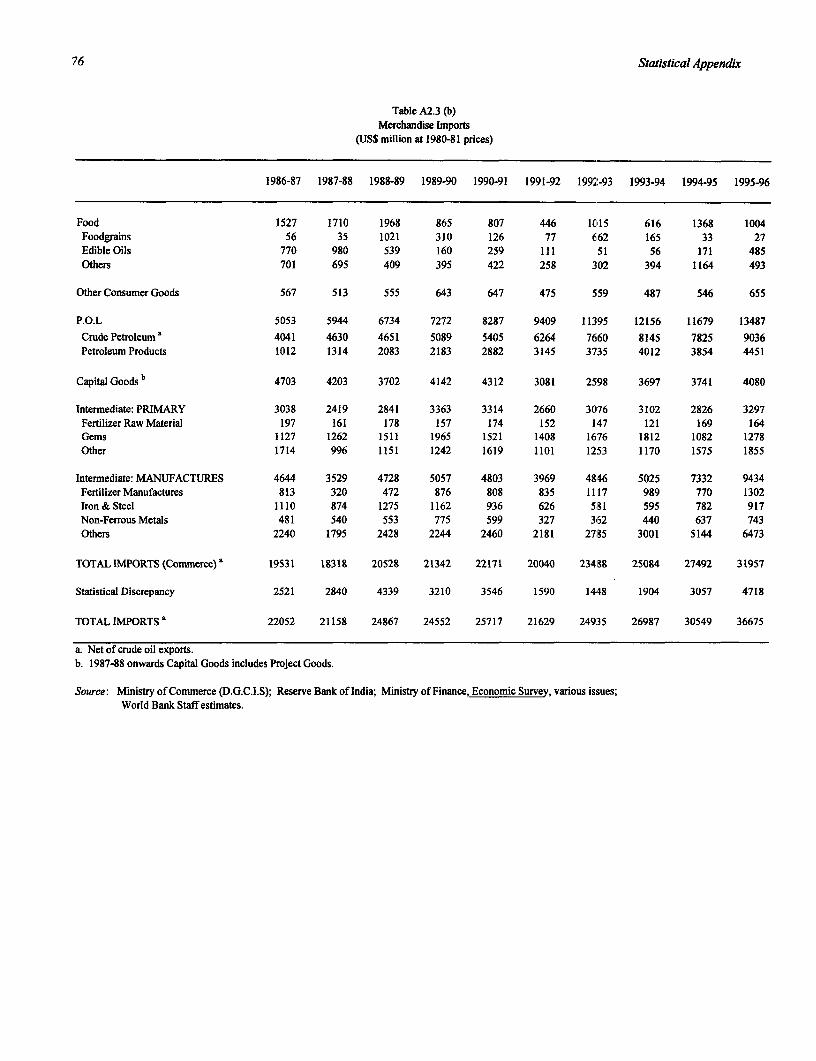
76 Statistical Appendix
Table A2.3 (b)Merchandise Imports
(US$ million at 1980-81 prices)
1986-87 1987-88 1988-89 1989-90 1990-91 1991-92 1992-93 1993-94 1994-95 1995-96
Food 1527 1710 1968 865 807 446 C1015 616 1368 1004Foodgrains 56 35 1021 310 126 77 662 165 33 27EdibleOils 770 980 539 160 259 111 51 56 171 485Others 701 695 409 395 422 258 302 394 1164 493
OtherConsumerGoods 567 513 555 643 647 475 559 487 546 655
P.O.L 5053 5944 6734 7272 8287 9409 11395 12156 11679 13487
CrudePetroleuma 4041 4630 4651 5089 5405 6264 7660 8145 7825 9036Petroleum Products 1012 1314 2083 2183 2882 3145 3735 4012 3854 4451
Capital Goods b 4703 4203 3702 4142 4312 3081 2598 3697 3741 4080
Intermediate: PRIMARY 3038 2419 2841 3363 3314 2660 3076 3102 2826 3297Fertilizer Raw Material 197 161 178 157 174 152 147 121 169 164Gems 1127 1262 1511 1965 1521 1408 1676 1812 1082 1278Other 1714 996 1151 1242 1619 1101 1253 1170 1575 1855
Intermediate: MANUFACTURES 4644 3529 4728 5057 4803 3969 48.46 5025 7332 9434Fertilizer Manufactures 813 320 472 876 808 835 1117 989 770 1302Iron&Steel 1110 874 1275 1162 936 626 581 595 782 917Non-Ferrous Metals 481 540 553 775 599 327 362 440 637 743Others 2240 1795 2428 2244 2460 2181 278B5 3001 5144 6473
TOTAL IMPORTS (Commerce)a 19531 18318 20528 21342 22171 20040 23488 25084 27492 31957
Statistical Discrepancy 2521 2840 4339 3210 3546 1590 1448 1904 3057 4718
TOTALIMPORTSa 22052 21158 24867 24552 25717 21629 249:35 26987 30549 36675
a. Net of crude oil exports.b. 1987-88 onwards Capital Goods includes Project Goods.
Source: Ministry of Commerce (D.G.C.I.S); Reserve Bank of India; Ministry of Finance, Economic Survey, various issues;World Bank Staff estimates.
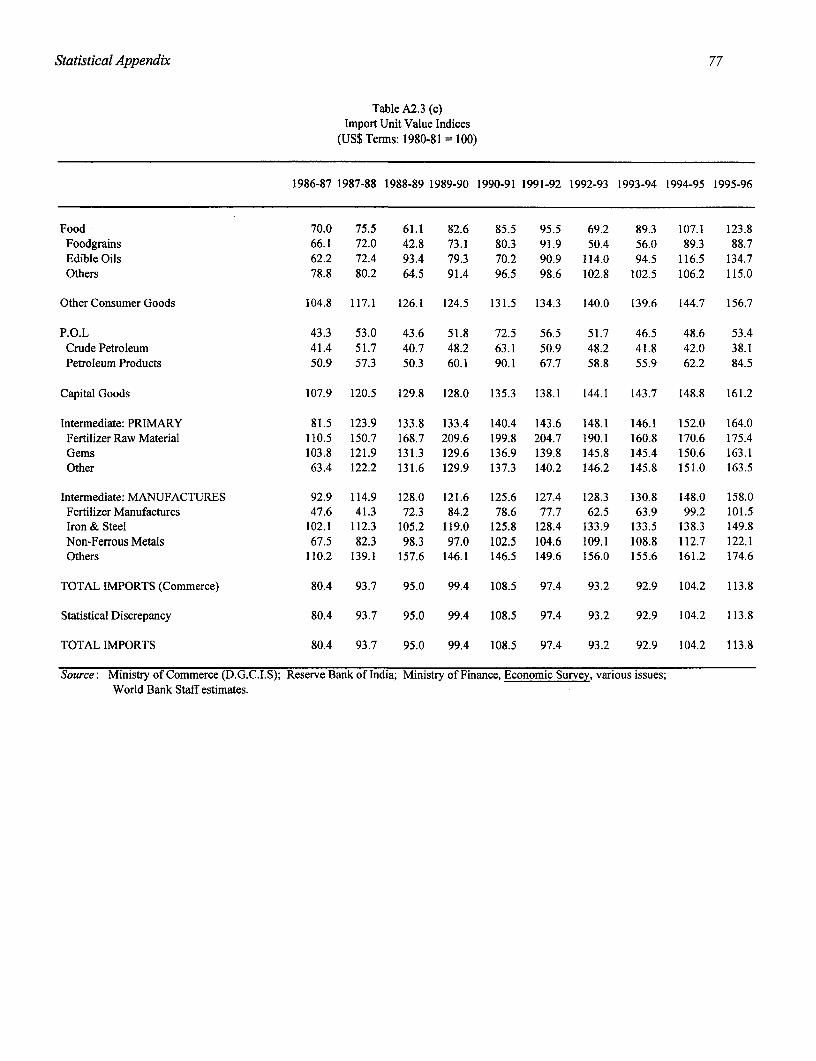
Statistical Appendix 77
Table A2.3 (c)Import Unit Value Indices
(US$ Terms: 1980-81 = 100)
1986-87 1987-88 1988-89 1989-90 1990-91 1991-92 1992-93 1993-94 1994-95 1995-96
Food 70.0 75.5 61.1 82.6 85.5 95.5 69.2 89.3 107.1 123.8Foodgrains 66.1 72.0 42.8 73.1 80.3 91.9 50.4 56.0 89.3 88.7Edible Oils 62.2 72.4 93.4 79.3 70.2 90.9 114.0 94.5 116.5 134.7Others 78.8 80.2 64.5 91.4 96.5 98.6 102.8 102.5 106.2 115.0
Other Consumer Goods 104.8 117.1 126.1 124.5 131.5 134.3 140.0 139.6 144.7 156.7
P.O.L 43.3 53.0 43.6 51.8 72.5 56.5 51.7 46.5 48.6 53.4Crude Petroleum 41.4 51.7 40.7 48.2 63.1 50.9 48.2 41.8 42.0 38.1Petroleum Products 50.9 57.3 50.3 60.1 90.1 67.7 58.8 55.9 62.2 84.5
Capital Goods 107.9 120.5 129.8 128.0 135.3 138.1 144.1 143.7 148.8 161.2
Intermediate: PRIMARY 81.5 123.9 133.8 133.4 140.4 143.6 148.1 146.1 152.0 164.0FertilizerRawMaterial 110.5 150.7 168.7 209.6 199.8 204.7 190.1 160.8 170.6 175.4Gems 103.8 121.9 131.3 129.6 136.9 139.8 145.8 145.4 150.6 163.1Other 63.4 122.2 131.6 129.9 137.3 140.2 146.2 145.8 151.0 163.5
Intermediate: MANUFACTURES 92.9 114.9 128.0 121.6 125.6 127.4 128.3 130.8 148.0 158.0Fertilizer Manufactures 47.6 41.3 72.3 84.2 78.6 77.7 62.5 63.9 99.2 101.5Iron & Steel 102.1 112.3 105.2 119.0 125.8 128.4 133.9 133.5 138.3 149.8Non-Ferrous Metals 67.5 82.3 98.3 97.0 102.5 104.6 109.1 108.8 112.7 122.1Others 110.2 139.1 157.6 146.1 146.5 149.6 156.0 155.6 161.2 174.6
TOTAL IMPORTS (Commerce) 80.4 93.7 95.0 99.4 108.5 97.4 93.2 92.9 104.2 113.8
Statistical Discrepancy 80.4 93.7 95.0 99.4 108.5 97.4 93.2 92.9 104.2 113.8
TOTAL IMPORTS 80.4 93.7 95.0 99.4 108.5 97.4 93.2 92.9 104.2 113.8
Source: Ministry of Commerce (D.G.C.I.S); Reserve Bank of India; Ministry of Finance, Economic Survey, various issues;World Bank Staff estimates.
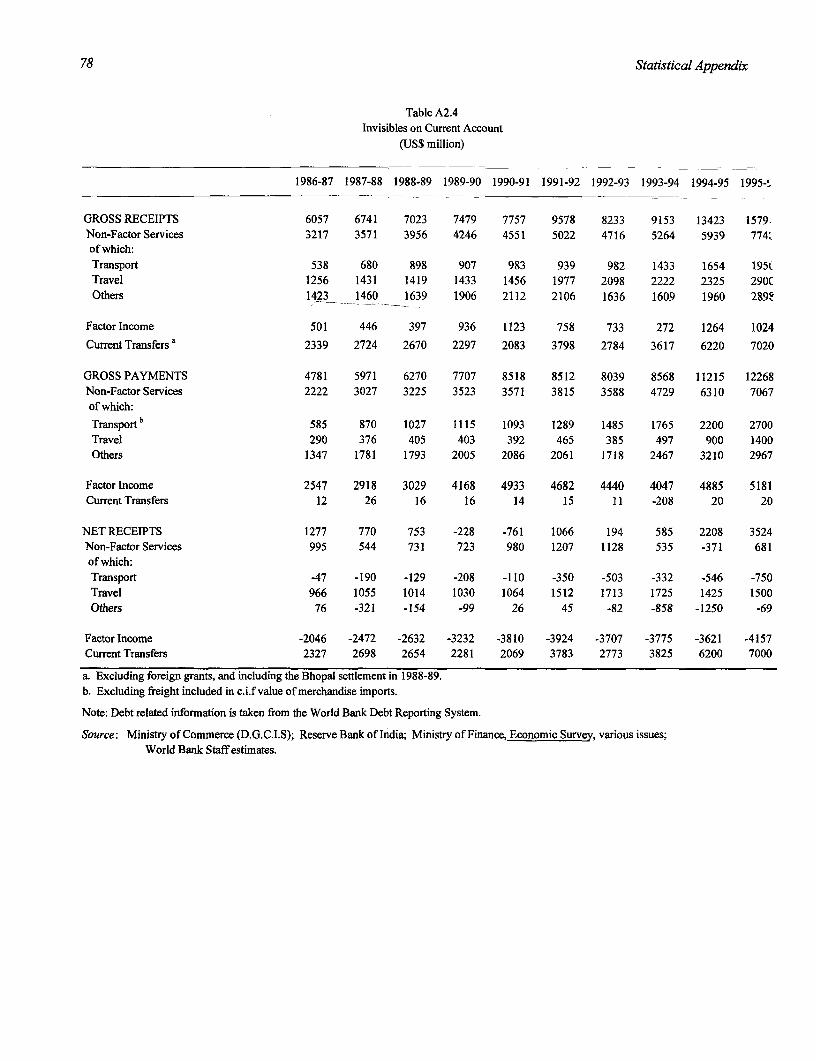
78 Statistical Appendix
Table A2.4Invisibles on Current Account
(US$ million)
1986-87 1987-88 1988-89 1989-90 1990-91 1991-92 1992-93 1993-94 1994-95 1995-',
GROSS RECEIPTS 6057 6741 7023 7479 7757 9578 8233 9153 13423 1579-Non-Factor Services 3217 3571 3956 4246 4551 5022 4716 5264 5939 774:of which:Transport 538 680 898 907 983 939 982 1433 1654 1951Travel 1256 1431 1419 1433 1456 1977 2098 2222 2325 290COthers 1423 1460 1639 1906 2112 2106 1636 1609 1960 289E
Factor Income 501 446 397 936 1123 758 733 272 1264 1024
Current Transfers a 2339 2724 2670 2297 2083 3798 2784 3617 6220 7020
GROSS PAYMENTS 4781 5971 6270 7707 8518 8512 8039 8568 11215 12268Non-Factor Services 2222 3027 3225 3523 3571 3815 3588 4729 6310 7067of which:
Transport b 585 870 1027 1115 1093 1289 1485 1765 2200 2700Travel 290 376 405 403 392 465 385 497 900 1400Others 1347 1781 1793 2005 2086 2061 1718 2467 3210 2967
Factor Income 2547 2918 3029 4168 4933 4682 4440 4047 4885 5181Current Transfers 12 26 16 16 14 15 11 -208 20 20
NET RECEIPTS 1277 770 753 -228 -761 1066 194 585 2208 3524Non-Factor Services 995 544 731 723 980 1207 1128 535 -371 681of which:Transport -47 -190 -129 -208 -110 -350 -503 -332 -546 -750Travel 966 1055 1014 1030 1064 1512 1713 1725 1425 1500Others 76 -321 -154 -99 26 45 -82 -858 -1250 -69
Factor Income -2046 -2472 -2632 -3232 -3810 -3924 -3707 -3775 -3621 -4157Current Transfers 2327 2698 2654 2281 2069 3783 2773 3825 6200 7000
a. Excluding foreign grants, and including the Bhopal settlement in 1988-89.b. Excluding freight included in c.i.f value of merchandise imports.
Note: Debt related information is taken from the World Bank Debt Reporting System.
Source: Ministry of Commerce (D.G.C.I.S); Reserve Bank of India; Ministry of Finance, Economic Survey, various issues;World Bank Staff estimates.
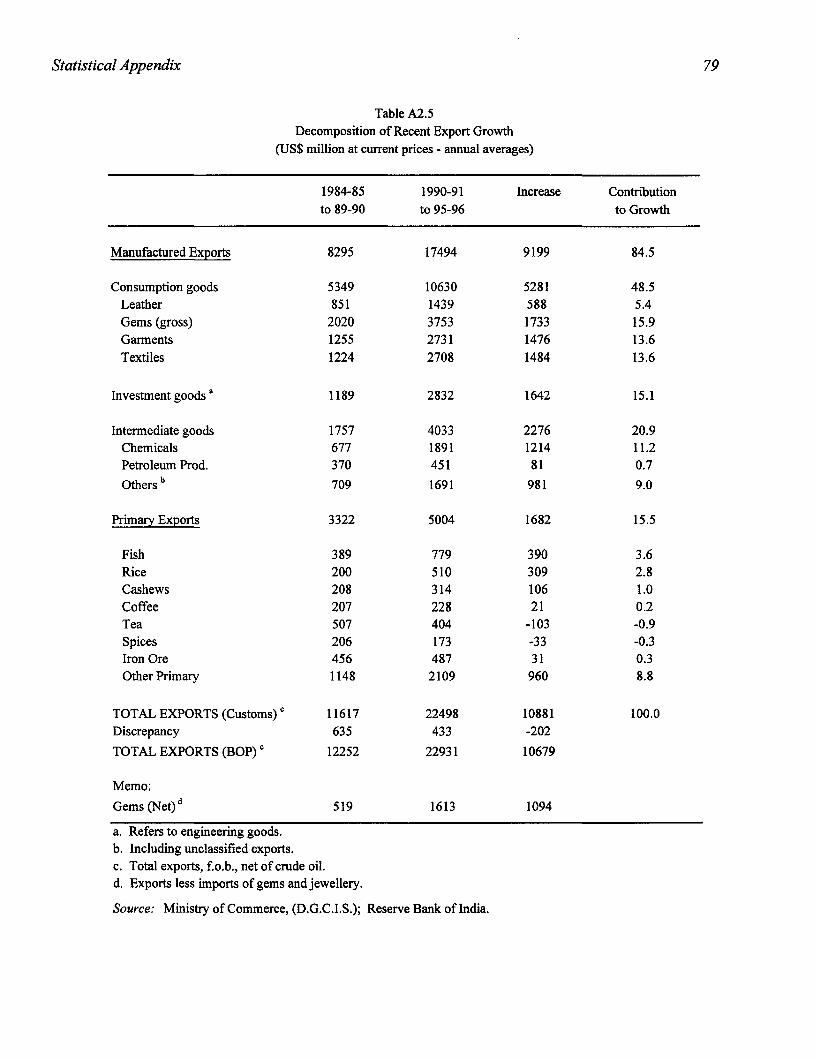
Statistical Appendix 79
Table A2.5Decomposition of Recent Export Growth
(US$ million at current prices - annual averages)
1984-85 1990-91 Increase Contributionto 89-90 to 95-96 to Growth
Manufactured Exports 8295 17494 9199 84.5
Consumption goods 5349 10630 5281 48.5Leather 851 1439 588 5.4Gems (gross) 2020 3753 1733 15.9Garments 1255 2731 1476 13.6Textiles 1224 2708 1484 13.6
Investment goods a 1189 2832 1642 15.1
Intermediate goods 1757 4033 2276 20.9Chemicals 677 1891 1214 11.2Petroleum Prod. 370 451 81 0.7Others b 709 1691 981 9.0
Primary Exports 3322 5004 1682 15.5
Fish 389 779 390 3.6Rice 200 510 309 2.8Cashews 208 314 106 1.0Coffee 207 228 21 0.2Tea 507 404 -103 -0.9Spices 206 173 -33 -0.3Iron Ore 456 487 31 0.3Other Primary 1148 2109 960 8.8
TOTAL EXPORTS (Customs) ' 11617 22498 10881 100.0Discrepancy 635 433 -202TOTAL EXPORTS (BOP)' 12252 22931 10679
Memo:Gems (Net)d 519 1613 1094
a. Refers to engineering goods.b. Including unclassified exports.c. Total exports, f.o.b., net of crude oil.d. Exports less imports of gems and jewellery.
Source: Ministry of Commerce, (D.G.C.I.S.); Reserve Bank of India.
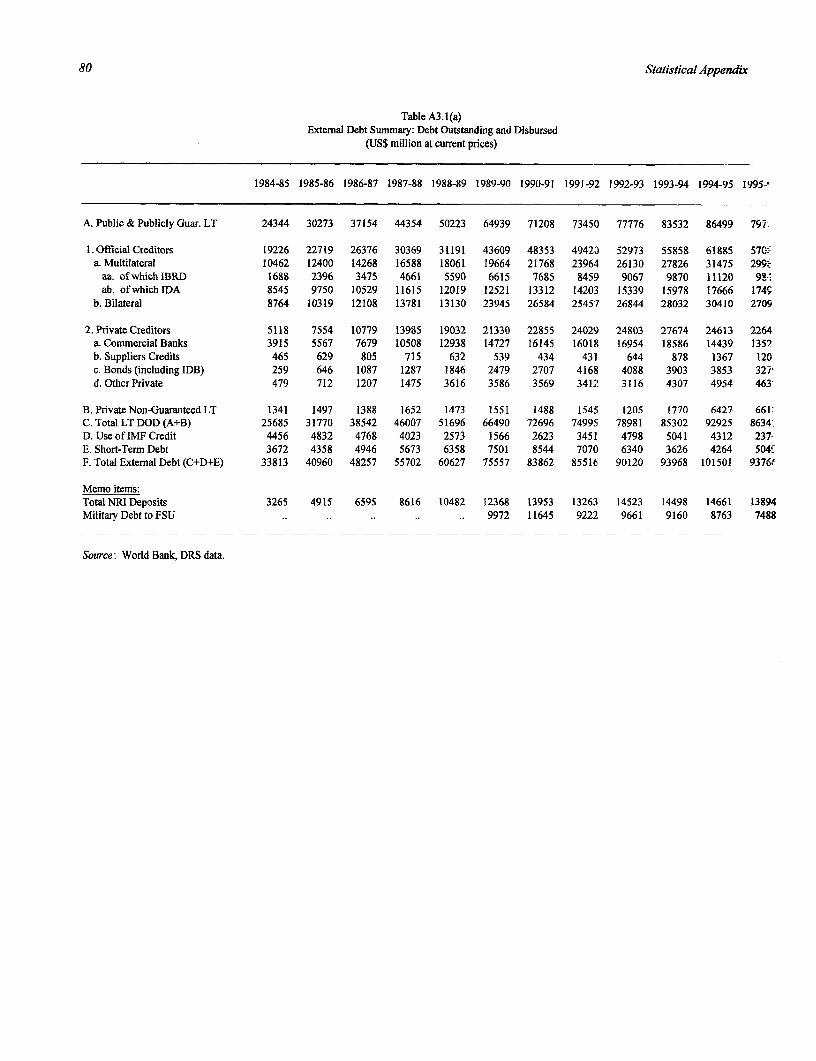
80 Statistical Appendix
Table A3.l(a)External Debt Summary: Debt Outstanding and Disbursed
(US$ million at current prices)
1984-85 1985-86 1986-87 1987-88 1988-89 1989-90 1990-91 1991-92 1992-93 1993-94 1994-95 1995-'
A. Public & Publicly Guar. LT 24344 30273 37154 44354 50223 64939 71208 73450 77776 83532 86499 797:
1.Official Creditors 19226 22719 26376 30369 31191 43609 48353 49420 52973 55858 61885 570-.a. Multilateral 10462 12400 14268 16588 18061 19664 21768 23964 26130 27826 31475 299.-
aa. ofwhichlBRD 1688 2396 3475 4661 5590 6615 7685 8459 9067 9870 11120 92.!ab. of whichlDA 8545 9750 10529 11615 12019 12521 13312 1420:3 15339 15978 17666 174r
b. Bilateral 8764 10319 12108 13781 13130 23945 26584 25457 26844 28032 30410 2709
2. Private Creditors 5118 7554 10779 13985 19032 21330 22855 24029 24803 27674 24613 2264a. Commercial Banks 3915 5567 7679 10508 12938 14727 16145 16018 16954 18586 14439 1352b. Suppliers Credits 465 629 805 715 632 539 434 431 644 878 1367 120c. Bonds (including IDB) 259 646 1087 1287 1846 2479 2707 4168 4088 3903 3853 327d. Other Private 479 712 1207 1475 3616 3586 3569 3412 3116 4307 4954 463-
B. PrivateNon-Guaranteed LT 1341 1497 1388 1652 1473 1551 1488 1545 1205 1770 6427 661:C. Total LT DOD (A+B) 25685 31770 38542 46007 51696 66490 72696 74995 78981 85302 92925 8634D.UseoflMFCredit 4456 4832 4768 4023 2573 1566 2623 3451 4798 5041 4312 237-E. Short-Term Debt 3672 4358 4946 5673 6358 7501 8544 7070 6340 3626 4264 504,F. Total External Debt (C+D+E) 33813 40960 48257 55702 60627 75557 83862 85516 90120 93968 101501 9376t
Memo items:Total NRI Deposits 3265 4915 6595 8616 10482 12368 13953 13263 14523 14498 14661 13894MilitaryDebttoFSU .. .. .. .. .. 9972 11645 9222 9661 9160 8763 7488
Source: World Bank, DRS data.
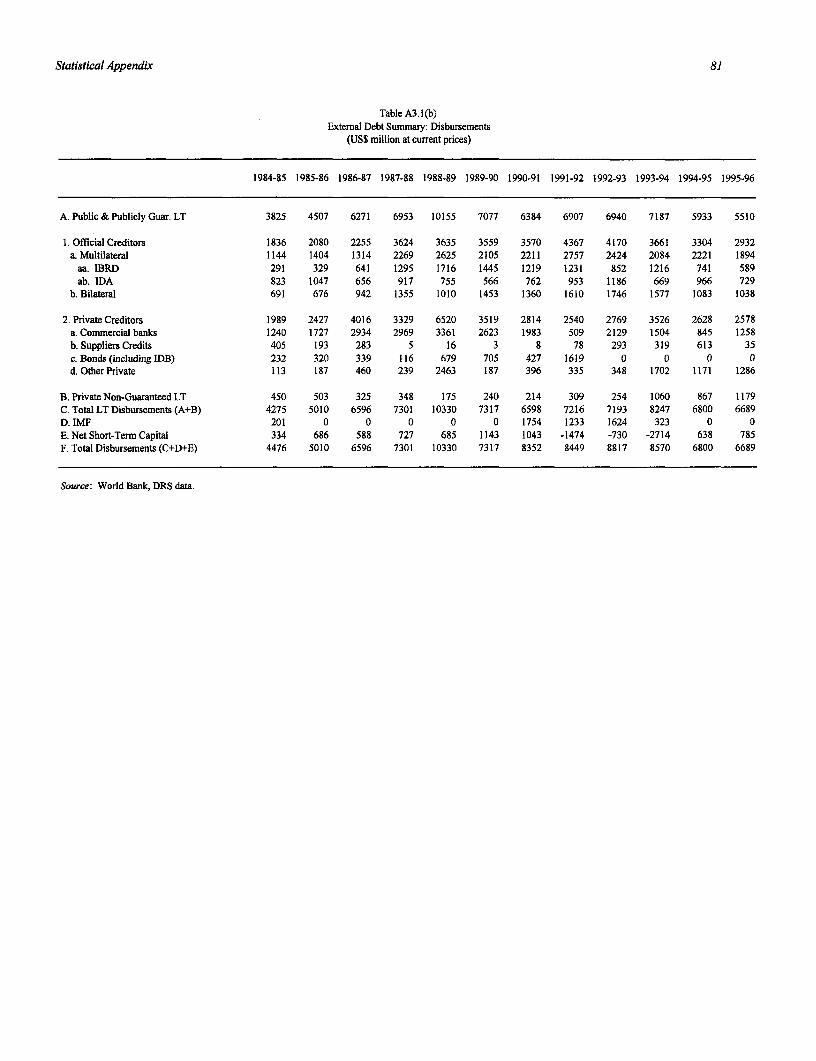
Statistical Appendix 81
Table A3.1 (b)Extemal Debt Summary: Disbursements
(US$ million at current prices)
1984-85 1985-86 1986-87 1987-88 1988-89 1989-90 1990-91 1991-92 1992-93 1993-94 1994-95 1995-96
A. Public & Publicly Guar. LT 3825 4507 6271 6953 10155 7077 6384 6907 6940 7187 5933 5510
1. Official Creditors 1836 2080 2255 3624 3635 3559 3570 4367 4170 3661 3304 2932a. Multilateral 1144 1404 1314 2269 2625 2105 2211 2757 2424 2084 2221 1894aa. IBRD 291 329 641 1295 1716 1445 1219 1231 852 1216 741 589ab. IDA 823 1047 656 917 755 566 762 953 1186 669 966 729
b. Bilateral 691 676 942 1355 1010 1453 1360 1610 1746 1577 1083 1038
2. Private Creditors 1989 2427 4016 3329 6520 3519 2814 2540 2769 3526 2628 2578a. Commercial banks 1240 1727 2934 2969 3361 2623 1983 509 2129 1504 845 1258b. Suppliers Credits 405 193 283 5 16 3 8 78 293 319 613 35c. Bonds (including lDB) 232 320 339 116 679 705 427 1619 0 0 0 0d. OtherPrivate 113 187 460 239 2463 187 396 335 348 1702 1171 1286
B. Private Non-Guaranteed LT 450 503 325 348 175 240 214 309 254 1060 867 1179C. Total LT Disbursements (A+B) 4275 5010 6596 7301 10330 7317 6598 7216 7193 8247 6800 6689D. IMF 201 0 0 0 0 0 1754 1233 1624 323 0 0E. NetShort-Term Capital 334 686 588 727 685 1143 1043 -1474 -730 -2714 638 785F. Total Disbursements (C+D+E) 4476 5010 6596 7301 10330 7317 8352 8449 8817 8570 6800 6689
Source: World Bank, DRS data.
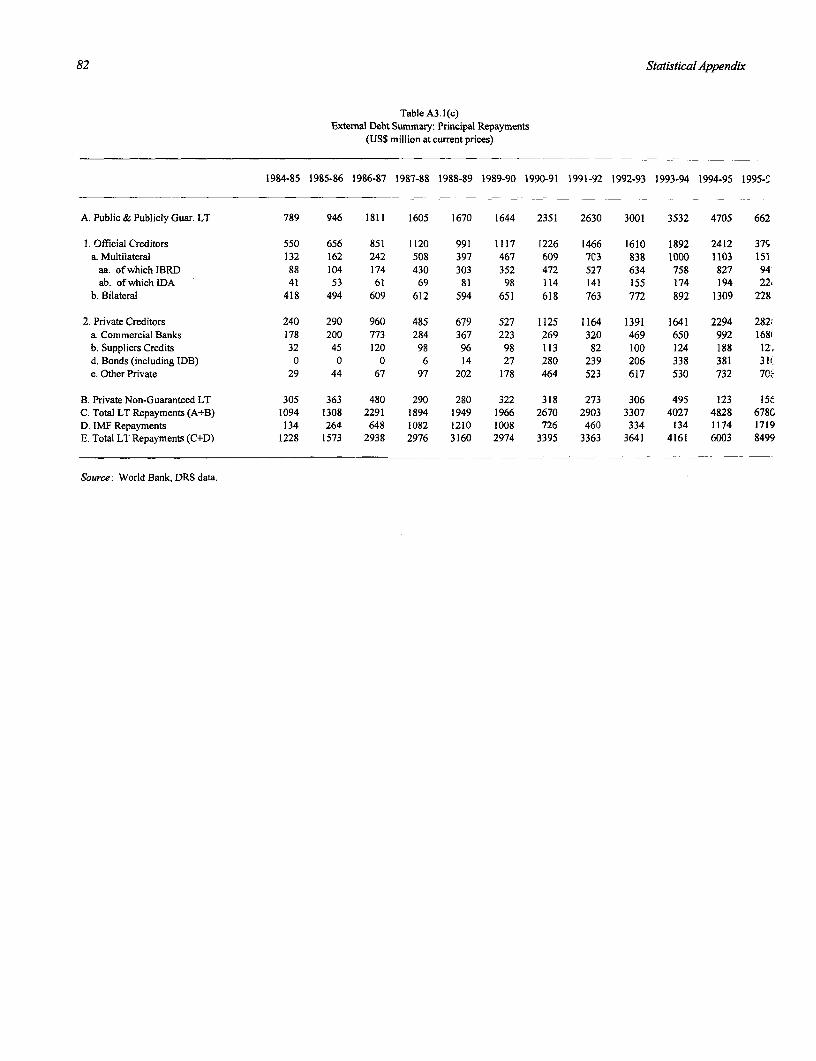
82 Statistical Appendix
Table A3. I (c)External Debt Summary: Principal Repayments
(US$ million at current prices)
1984-85 1985-86 1986-87 1987-88 1988-89 1989-90 1990-91 1991-92 1992-93 1993-94 1994-95 1995-s
A. Public & Publicly Guar. LT 789 946 1811 1605 1670 1644 2351 2630 3001 3532 4705 662
1. Official Creditors 550 656 851 1120 991 1117 1226 1466 1610 1892 2412 379a. Multilateral 132 162 242 508 397 467 609 703 838 1000 1103 151
aa. of which IBRD 88 104 174 430 303 352 472 527 634 758 827 94ab. of whichlDA 41 53 61 69 81 98 114 141 155 174 194 22.
b. Bilateral 418 494 609 612 594 651 618 763 772 892 1309 228
2. Private Creditors 240 290 960 485 679 527 1125 1164 1391 1641 2294 282;a. Commercial Banks 178 200 773 284 367 223 269 320 469 650 992 1681b. Suppliers Credits 32 45 120 98 96 98 113 82 100 124 188 12-.d.Bonds(includinglDB) 0 0 0 6 14 27 280 239 206 338 381 31(e. Other Private 29 44 67 97 202 178 464 523 617 530 732 70.-
B. Private Non-Guaranteed LT 305 363 480 290 280 322 318 273 306 495 123 15,C. Total LTRepayments(A+B) 1094 1308 2291 1894 1949 1966 2670 2903 3307 4027 4828 678CD. IMF Repayments 134 264 648 1082 1210 1008 726 460 334 134 1174 1719E. Total LTRepayments(C+D) 1228 1573 2938 2976 3160 2974 3395 3363 3641 4161 6003 8499
Source: World Bank, DRS data.
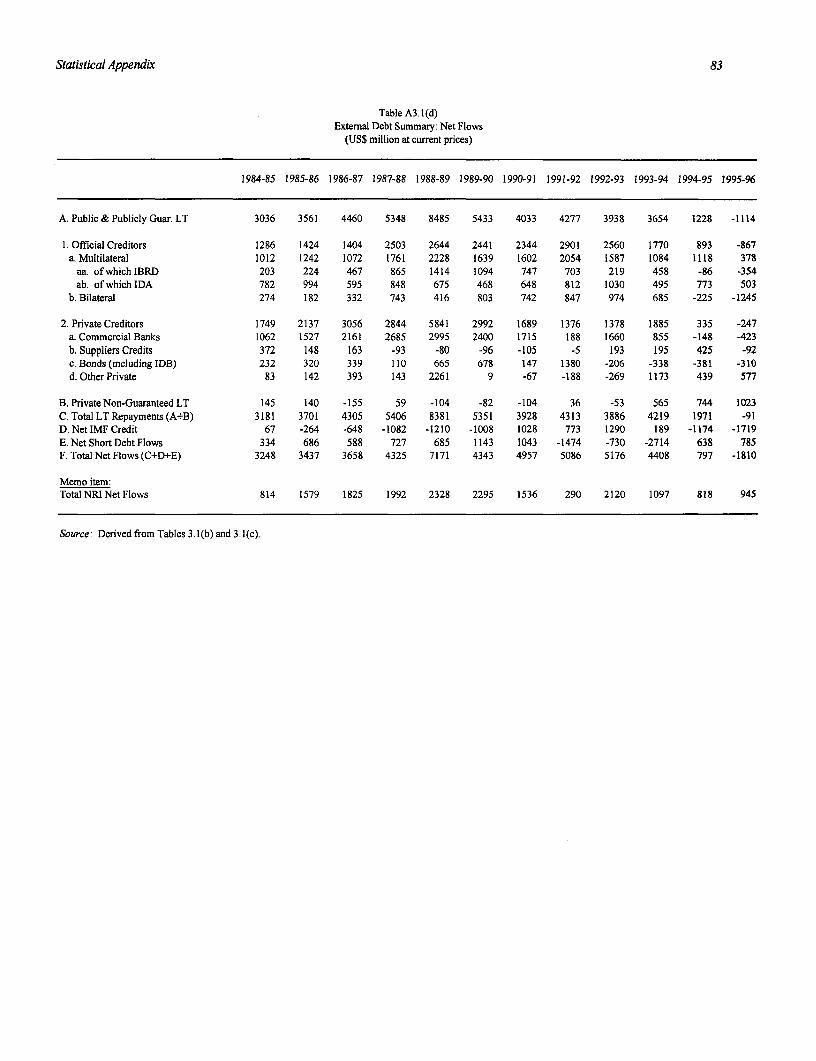
Statistical Appendix 83
Table A3.1(d)External Debt Summary: Net Flows
(US$ million at current prices)
1984-85 1985-86 1986-87 1987-88 1988-89 1989-90 1990-91 1991-92 1992-93 1993-94 1994-95 1995-96
A.Public&PubliclyGuar.LT 3036 3561 4460 5348 8485 5433 4033 4277 3938 3654 1228 -1114
1. Official Creditors 1286 1424 1404 2503 2644 2441 2344 2901 2560 1770 893 -867a. Multilateral 1012 1242 1072 1761 2228 1639 1602 2054 1587 1084 1118 378
aa. of which IBRD 203 224 467 865 1414 1094 747 703 219 458 -86 -354ab. of which IDA 782 994 595 848 675 468 648 812 1030 495 773 503
b. Bilateral 274 182 332 743 416 803 742 847 974 685 -225 -1245
2. Private Creditors 1749 2137 3056 2844 5841 2992 1689 1376 1378 1885 335 -247a. Commercial Banks 1062 1527 2161 2685 2995 2400 1715 188 1660 855 -148 -423b. Suppliers Credits 372 148 163 -93 -80 -96 -105 -5 193 195 425 -92c. Bonds (including IDB) 232 320 339 110 665 678 147 1380 -206 -338 -381 -310d. OtherPrivate 83 142 393 143 2261 9 -67 -188 -269 1173 439 577
B. Private Non-Guaranteed LT 145 140 -155 59 -104 -82 -104 36 -53 565 744 1023C. Total LT Repayments (A+B) 3181 3701 4305 5406 8381 5351 3928 4313 3886 4219 1971 -91D. NetlMF Credit 67 -264 -648 -1082 -1210 -1008 1028 773 1290 189 -1174 -1719E. Net Short Debt Flows 334 686 588 727 685 1143 1043 -1474 -730 -2714 638 785F. TotalNetFlows (C+D+E) 3248 3437 3658 4325 7171 4343 4957 5086 5176 4408 797 -1810
Memo item:TotalNRI Net Flows 814 1579 1825 1992 2328 2295 1536 290 2120 1097 818 945
Source: Derived from Tables 3.1 (b) and 3. 1(c).
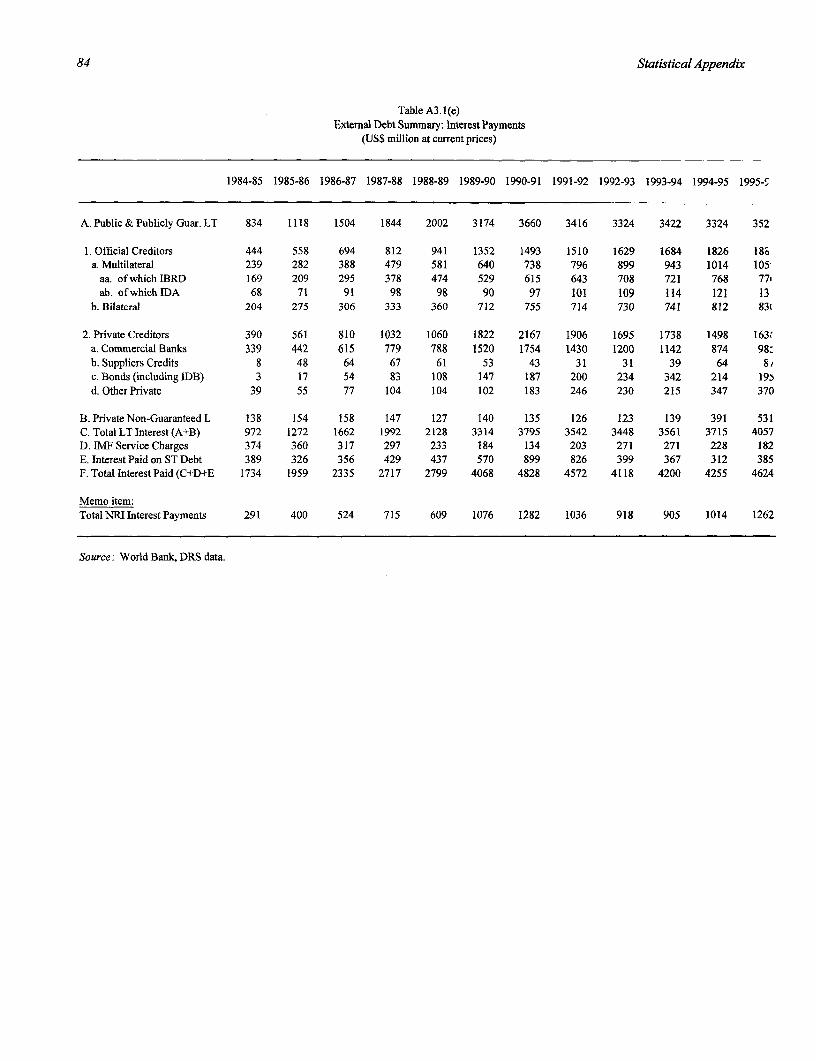
84 Statistical Appendix
Table A3.1 (e)External Debt Summary: Interest Payments
(US$ million at current prices)
1984-85 1985-86 1986-87 1987-88 1988-89 1989-90 1990-91 1991-92 1992-93 1993-94 1994-95 1995-^
A.Public&PubliclyGuar.LT 834 1118 1504 1844 2002 3174 3660 3416 3324 3422 3324 352
1. Official Creditors 444 558 694 812 941 1352 1493 1510 1629 1684 1826 188a. Multilateral 239 282 388 479 581 640 738 796 899 943 1014 105
aa. of which IBRD 169 209 295 378 474 529 615 643 708 721 768 77iab. of which IDA 68 71 91 98 98 90 97 101 109 114 121 13
b. Bilateral 204 275 306 333 360 712 755 714 730 741 812 83(
2. Private Creditors 390 561 810 1032 1060 1822 2167 1906 1695 1738 1498 163.a. CommercialBanks 339 442 615 779 788 1520 1754 1430 1200 1142 874 98-b. Suppliers Credits 8 48 64 67 61 53 43 31 31 39 64 8,c. Bonds (includinglDB) 3 17 54 83 108 147 187 200 234 342 214 195d. OtherPrivate 39 55 77 104 104 102 183 246 230 215 347 370
B. Private Non-Guaranteed L 138 154 158 147 127 140 135 126 123 139 391 531C. Total LT Interest (A+B) 972 1272 1662 1992 2128 3314 3795 3542 3448 3561 3715 4057D. IMF Service Charges 374 360 317 297 233 184 134 203 271 271 228 182E. Interest Paid on ST Debt 389 326 356 429 437 570 899 826 399 367 312 385F. Total InterestPaid (C+D+E 1734 1959 2335 2717 2799 4068 4828 4572 4118 4200 4255 4624
Memo item:Total NRI Interest Payments 291 400 524 715 609 1076 1282 1036 918 905 1014 1262
Source: World Bank, DRS data.
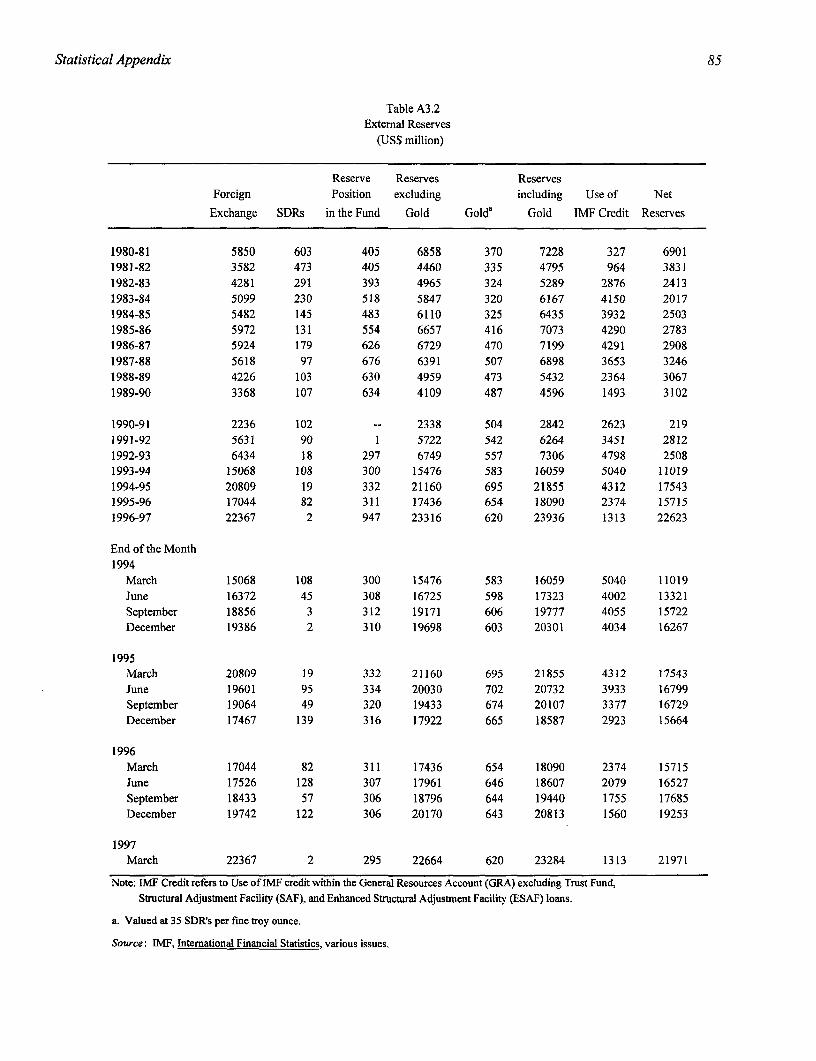
Statistical Appendix 85
Table A3.2External Reserves
(US$ million)
Reserve Reserves ReservesForeign Position excluding including Use of Net
Exchange SDRs in the Fund Gold Golda Gold IMF Credit Reserves
1980-81 5850 603 405 6858 370 7228 327 69011981-82 3582 473 405 4460 335 4795 964 38311982-83 4281 291 393 4965 324 5289 2876 24131983-84 5099 230 518 5847 320 6167 4150 20171984-85 5482 145 483 6110 325 6435 3932 25031985-86 5972 131 554 6657 416 7073 4290 27831986-87 5924 179 626 6729 470 7199 4291 29081987-88 5618 97 676 6391 507 6898 3653 32461988-89 4226 103 630 4959 473 5432 2364 30671989-90 3368 107 634 4109 487 4596 1493 3102
1990-91 2236 102 -- 2338 504 2842 2623 2191991-92 5631 90 1 5722 542 6264 3451 28121992-93 6434 18 297 6749 557 7306 4798 25081993-94 15068 108 300 15476 583 16059 5040 110191994-95 20809 19 332 21160 695 21855 4312 175431995-96 17044 82 311 17436 654 18090 2374 157151996-97 22367 2 947 23316 620 23936 1313 22623
End of the Month1994
March 15068 108 300 15476 583 16059 5040 11019June 16372 45 308 16725 598 17323 4002 13321September 18856 3 312 19171 606 19777 4055 15722December 19386 2 310 19698 603 20301 4034 16267
1995March 20809 19 332 21160 695 21855 4312 17543June 19601 95 334 20030 702 20732 3933 16799September 19064 49 320 19433 674 20107 3377 16729December 17467 139 316 17922 665 18587 2923 15664
1996March 17044 82 311 17436 654 18090 2374 15715June 17526 128 307 17961 646 18607 2079 16527September 18433 57 306 18796 644 19440 1755 17685December 19742 122 306 20170 643 20813 1560 19253
1997March 22367 2 295 22664 620 23284 1313 21971
Note: lMF Credit refers to Use of IMF credit within the General Resources Account (GRA) excluding Trust Fund,Structural Adjustment Facility (SAF), and Enhanced Structural Adjustment Facility (ESAF) loans.
a. Valued at 35 SDR's per fine troy ounce.
Source: IMF, Intemational Financial Statistics, various issues,
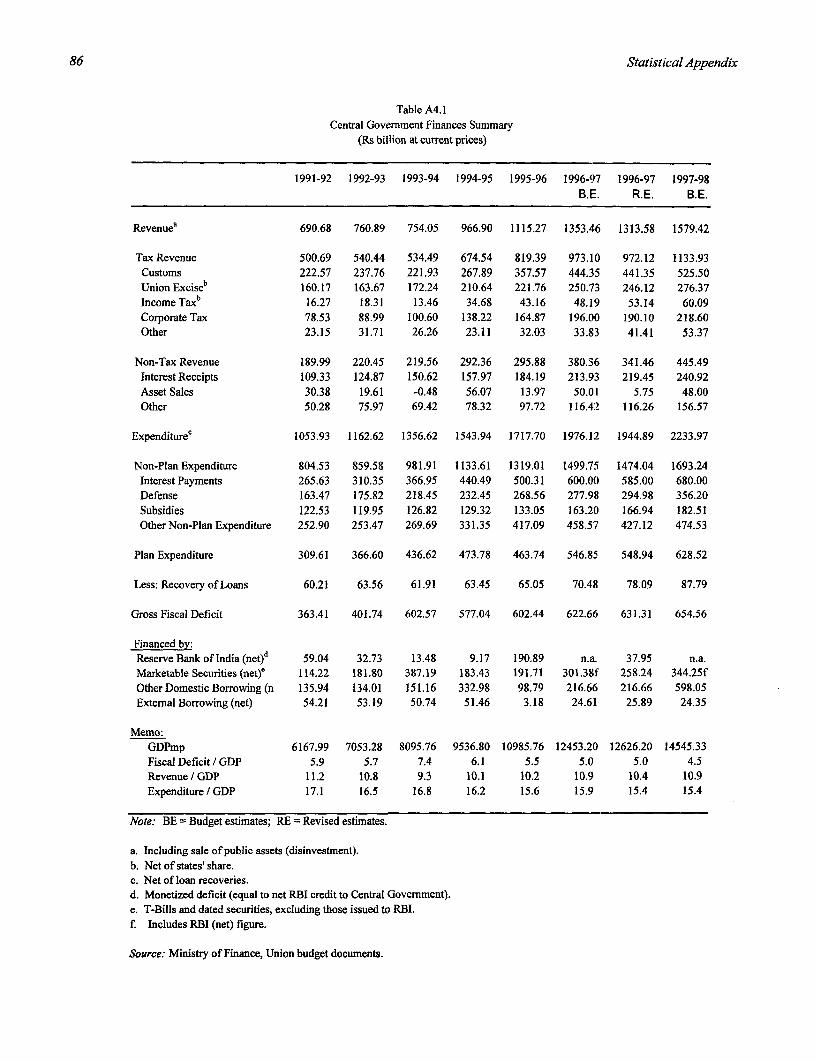
86 Statistical Appendix
Table A4.1Central Govermnent Finances Summary
(Rs billion at current prices)
1991-92 1992-93 1993-94 1994-95 1995-96 1996-97 1996-97 1997-98B.E. R.E. B.E.
Revenuea 690.68 760.89 754.05 966.90 1115.27 1353.46 1313.58 1579.42
Tax Revenue 500.69 540.44 534.49 674.54 819.39 973.10 972.12 1133.93Customs 222.57 237.76 221.93 267.89 357.57 444.35 441.35 525.50Union Exciseb 160.17 163.67 172.24 210.64 221.76 250.73 246.12 276.37Income Taxb 16.27 18.31 13.46 34.68 43.16 48.19 53.14 60.09Corporate Tax 78.53 88.99 100.60 138.22 164.87 196.00 190.10 218.60Other 23.15 31.71 26.26 23.11 32.03 33.83 41.41 53.37
Non-Tax Revenue 189.99 220.45 219.56 292.36 295.88 380.36 341.46 445.49Interest Receipts 109.33 124.87 150.62 157.97 184.19 213.93 219.45 240.92Asset Sales 30.38 19.61 -0.48 56.07 13.97 50.01 5.75 48.00Other 50.28 75.97 69.42 78.32 97.72 116.42 116.26 156.57
Expenditure' 1053.93 1162.62 1356.62 1543.94 1717.70 1976.12 1944.89 2233.97
Non-Plan Expenditure 804.53 859.58 981.91 1133.61 1319.01 1499.75 1474.04 1693.24Interest Payments 265.63 310.35 366.95 440.49 500.31 600.00 585.00 680.00Defense 163.47 175.82 218.45 232.45 268.56 277.98 294.98 356.20Subsidies 122.53 119.95 126.82 129.32 133.05 163.20 166.94 182.51Other Non-Plan Expenditure 252.90 253.47 269.69 331.35 417.09 458.57 427.12 474.53
Plan Expenditure 309.61 366.60 436.62 473.78 463.74 546.85 548.94 628.52
Less: Recovery of Loans 60.21 63.56 61.91 63.45 65.05 70.48 78.09 87.79
Gross Fiscal Deficit 363.41 401.74 602.57 577.04 602.44 622.66 631.31 654.56
Financed by:Reserve Bank of India (net)d 59.04 32.73 13.48 9.17 190.89 n.a. 37.95 n.a.Marketable Securities (net)' 114.22 181.80 387.19 183.43 191.71 301.38f 258.24 344.25fOther Domestic Borrowing (n 135.94 134.01 151.16 332.98 98.79 216.66 216.66 598.05External Borrowing (net) 54.21 53.19 50.74 51.46 3.18 24.61 25.89 24.35
Memo:GDPmp 6167.99 7053.28 8095.76 9536.80 10985.76 12453.20 12626.20 14545.33Fiscal Deficit/GDP 5.9 5.7 7.4 6.1 5.5 5.0 5.0 4.5Revenue / GDP 11.2 10.8 9.3 10.1 10.2 10.9 10.4 10.9Expenditure/GDP 17.1 16.5 16.8 16.2 15.6 15.9 15.4 15.4
Note: BE = Budget estimates; RE = Revised estimates.
a. Including sale of public assets (disinvestment).b. Net of states' share.c. Net of loan recoveries.d. Monetized deficit (equal to net RBI credit to Central Government).e. T-Bills and dated securities, excluding those issued to RBI.f. Includes RBI (net) figure.
Source: Ministry of Finance, Union budget documents.
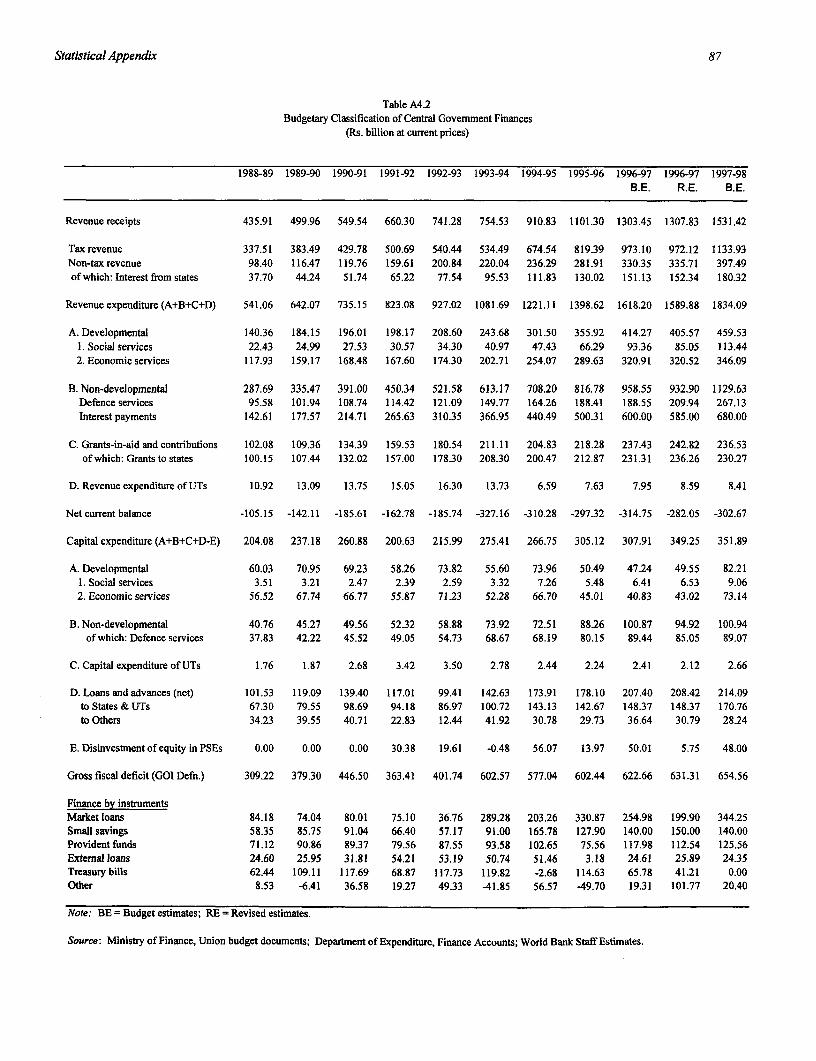
Statistical Appendix 87
Table A4.2Budgetary Classification of Central Govemment Finances
(Rs. billion at current prices)
1988-89 1989-90 1990-91 1991-92 1992-93 1993-94 1994-95 1995-96 1996-97 1996-97 1997-98B.E. R.E. B.E.
Revenue receipts 435.91 499.96 549.54 660.30 741.28 754.53 910.83 1101.30 1303.45 1307.83 1531.42
Taxrevenue 337.51 383.49 429.78 500.69 540.44 534.49 674.54 819.39 973.10 972.12 1133.93Non-tax revenue 98.40 116.47 119.76 159.61 200.84 220.04 236.29 281.91 330.35 335.71 397.49of which: Interest from states 37.70 44.24 51.74 65.22 77.54 95.53 111.83 130.02 151.13 152.34 180.32
Revenue expenditure (A+B+C+D) 541.06 642.07 735.15 823.08 927.02 1081.69 1221.11 1398.62 1618.20 1589.88 1834.09
A. Developmental 140.36 184.15 196.01 198.17 208.60 243.68 301.50 355.92 414.27 405.57 459.531. Social services 22.43 24.99 27.53 30.57 34.30 40.97 47.43 66.29 93.36 85.05 113.442. Economic services 117.93 159.17 168.48 167.60 174.30 202.71 254.07 289.63 320.91 320.52 346.09
B. Non-developmental 287.69 335.47 391.00 450.34 521.58 613.17 708,20 816.78 958.55 932.90 1129.63Defence services 95.58 101.94 108.74 114.42 121.09 149.77 164.26 188.41 188.55 209.94 267.13Interest payments 142.61 177.57 214.71 265.63 310.35 366.95 440.49 500.31 600.00 585.00 680.00
C. Grants-in-aid and contributions 102.08 109.36 134.39 159.53 180.54 211.11 204.83 218.28 237.43 242.82 236.53of which: Grants to states 100.15 107.44 132.02 157.00 178.30 208.30 200.47 212.87 231.31 236.26 230.27
D. Revenue expenditure of UTs 10.92 13.09 13.75 15.05 16.30 13.73 6.59 7.63 7.95 8.59 8.41
Net current balance -105.15 -142.11 -185.61 -162.78 -185.74 -327.16 -310.28 -297.32 -314.75 -282.05 -302.67
Capital expenditure (A+B+C+D-E) 204.08 237.18 260.88 200.63 215.99 275.41 266.75 305.12 307.91 349.25 351.89
A. Developmental 60.03 70.95 69.23 58.26 73.82 55.60 73.96 50.49 47.24 49.55 82.211. Social services 3.51 3.21 2.47 2.39 2.59 3.32 7.26 5.48 6.41 6.53 9.062. Economic services 56.52 67.74 66.77 55.87 71.23 52.28 66.70 45.01 40.83 43.02 73.14
B. Non-developmental 40.76 45.27 49.56 52.32 58.88 73.92 72.51 88.26 100.87 94.92 100.94of which: Defence services 37.83 42.22 45.52 49.05 54.73 68.67 68.19 80.15 89.44 85.05 89.07
C. Capital expenditure of UTs 1.76 1.87 2.68 3.42 3.50 2.78 2.44 2.24 2.41 2.12 2.66
D. Loans and advances (net) 101.53 119.09 139.40 117.01 99.41 142.63 173.91 178.10 207.40 208.42 214.09to States & UTs 67.30 79.55 98.69 94.18 86.97 100.72 143.13 142.67 148.37 148.37 170.76to Others 34.23 39.55 40.71 22.83 12.44 41.92 30.78 29.73 36.64 30.79 28.24
E. Disinvestment of equity in PSEs 0.00 0.00 0.00 30.38 19.61 -0.48 56.07 13.97 50.01 5.75 48.00
Gross fiscal deficit (GOI Defni.) 309.22 379.30 446.50 363.41 401.74 602.57 577.04 602.44 622.66 631.31 654.56
Finance by instrumentsMarket loans 84.18 74.04 80.01 75.10 36.76 289.28 203.26 330.87 254.98 199.90 344.25Small savings 58.35 85.75 91.04 66.40 57.17 91.00 165.78 127.90 140.00 150.00 140.00Provident funds 71.12 90.86 89.37 79.56 87.55 93.58 102.65 75.56 117.98 112.54 125.56External loans 24.60 25.95 31.81 54.21 53.19 50.74 51.46 3.18 24.61 25.89 24.35Treasury bills 62.44 109.11 117.69 68.87 117.73 119.82 -2.68 114.63 65.78 41.21 0.00Other 8.53 -6.41 36.58 19.27 49.33 -41.85 56.57 -49.70 19.31 101.77 20.40
Note: BE = Budget estimates; RE = Revised estimates.
Source: Ministry of Finance, Union budget documents; Department of Expenditure, Finance Accounts; World Bank Staff Estimates.
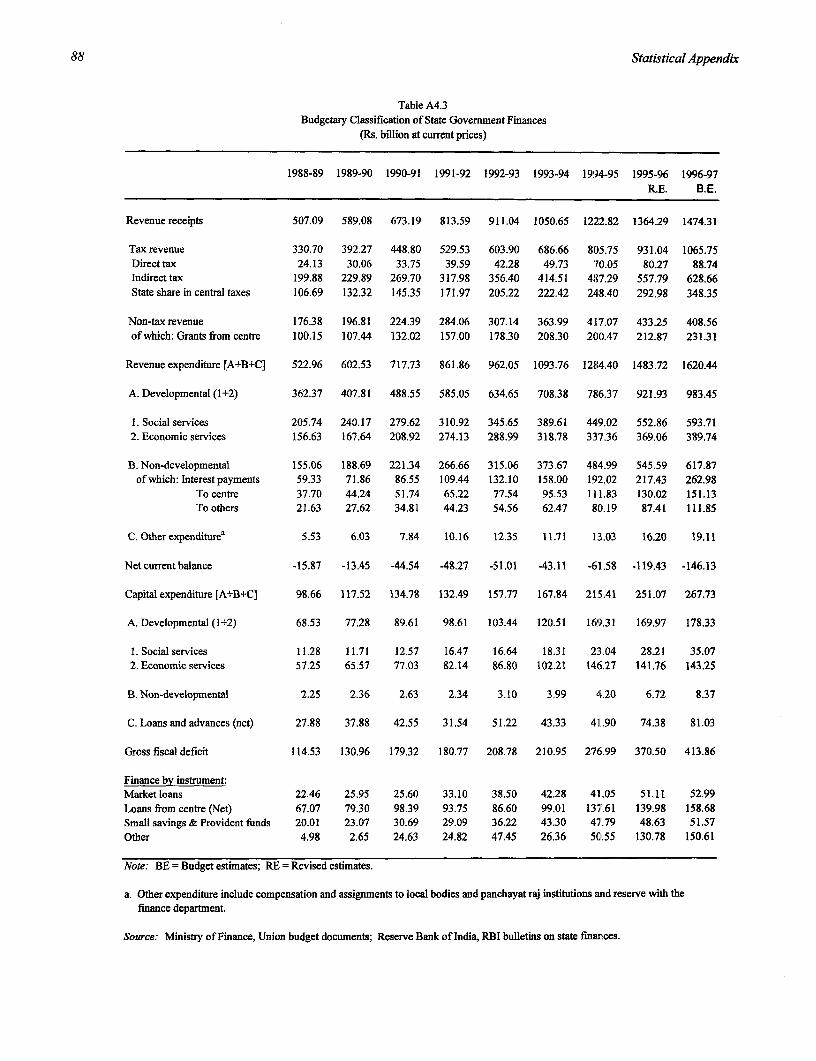
88 Statistical Appendix
Table A4.3Budgetary Classification of State Government Finances
(Rs. billion at current prices)
1988-89 1989-90 1990-91 1991-92 1992-93 1993-94 1994-95 1995-96 1996-97RE. B.E.
Revenue receipts 507.09 589.08 673.19 813.59 911.04 1050.65 12:22.82 1364.29 1474.31
Taxrevenue 330.70 392.27 448.80 529.53 603.90 686.66 805.75 931.04 1065.75Direct tax 24.13 30.06 33.75 39.59 42.28 49.73 '70.05 80.27 88.74Indirect tax 199.88 229.89 269.70 317.98 356.40 414.51 487.29 557.79 628.66State share in central taxes 106.69 132.32 145.35 171.97 205.22 222.42 248.40 292.98 348.35
Non-tax revenue 176.38 196.81 224.39 284.06 307.14 363.99 417.07 433.25 408.56of which: Grants from centre 100.15 107.44 132.02 157.00 178.30 208.30 200.47 212.87 231.31
Revenue expenditure [A+B+C] 522.96 602.53 717.73 861.86 962.05 1093.76 1284.40 1483.72 1620.44
A. Developmental (1+2) 362.37 407.81 488.55 585.05 634.65 708.38 786.37 921.93 983.45
1. Social services 205.74 240.17 279.62 310.92 345.65 389.61 449.02 552.86 593.712. Economic services 156.63 167.64 208.92 274.13 288.99 318.78 337.36 369.06 389.74
B. Non-developmental 155.06 188.69 221.34 266.66 315.06 373.67 484.99 545.59 617.87of which: Interest payments 59.33 71.86 86.55 109.44 132.10 158.00 192.02 217.43 262.98
To centre 37.70 44.24 51.74 65.22 77.54 95.53 111.83 130.02 151.13To others 21.63 27.62 34.81 44.23 54.56 62.47 80.19 87.41 111.85
C. Other expenditurea 5.53 6.03 7.84 10.16 12.35 11.71 13.03 16.20 19.11
Net current balance -15.87 -13.45 -44.54 -48.27 -51.01 -43.11 -61.58 -119.43 -146.13
Capital expenditure IA+B+CI 98.66 117.52 134.78 132.49 157.77 167.84 215.41 251.07 267.73
A. Developmental (1+2) 68.53 77.28 89.61 98.61 103.44 120.51 169.31 169.97 178.33
1.Socialservices 11.28 11.71 12.57 16.47 16.64 18.31 23.04 28.21 35.072. Economic services 57.25 65.57 77.03 82.14 86.80 102.21 146.27 141.76 143.25
B. Non-developmental 2.25 2.36 2.63 2.34 3.10 3.99 4.20 6.72 8.37
C. Loans and advances (net) 27.88 37.88 42.55 31.54 51.22 43.33 41.90 74.38 81.03
Gross fiscal deficit 114.53 130.96 179.32 180.77 208.78 210.95 276.99 370.50 413.86
Finance by instrument:Market loans 22.46 25.95 25.60 33.10 38.50 42.28 41.05 51.11 52.99Loans from centre (Net) 67.07 79.30 98.39 93.75 86.60 99.01 137.61 139.98 158.68Small savings & Provident funds 20.01 23.07 30.69 29.09 36.22 43.30 47.79 48.63 51.57Other 4.98 2.65 24.63 24.82 47.45 26.36 50.55 130.78 150.61
Note: BE = Budget estimates; RE = Revised estimates.
a. Other expenditure include compensation and assignments to local bodies and panchayat raj institutions and reserve with thefinance department.
Sowuce: Ministry of Finance, Union budget documents; Reserve Bank of India, RBI bulletins on state finances.
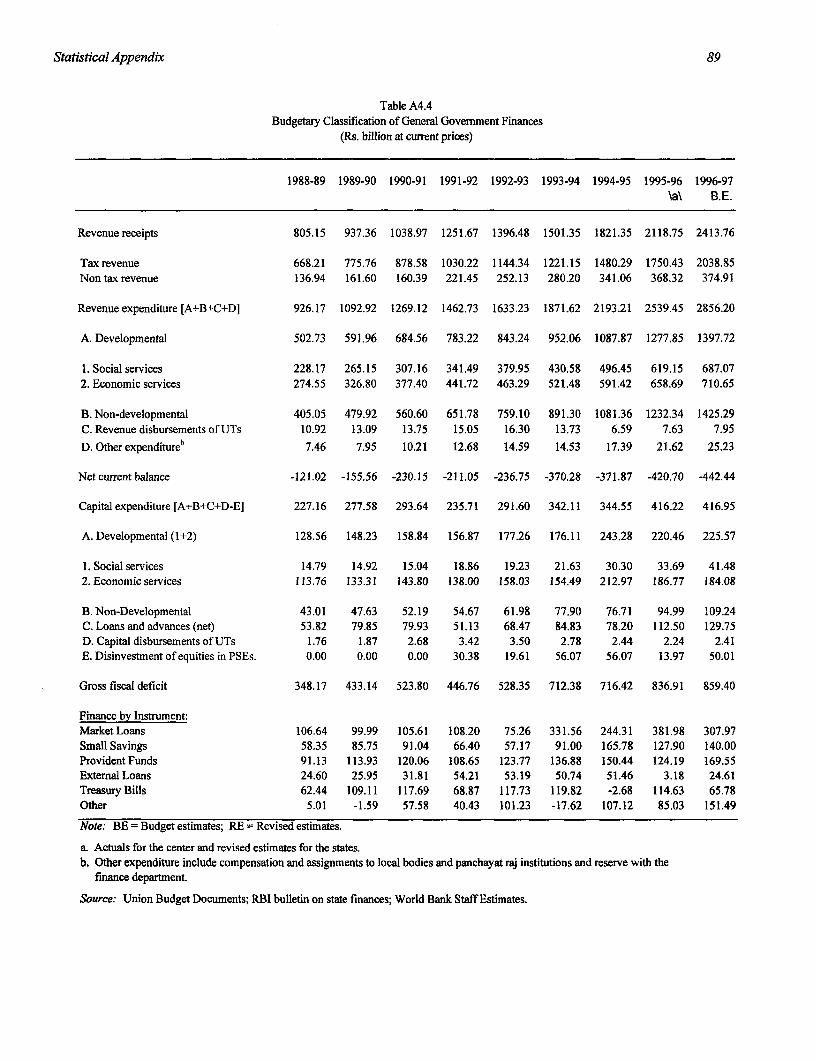
Statistical Appendix 89
Table A4.4Budgetary Classification of General Government Finances
(Rs. billion at current prices)
1988-89 1989-90 1990-91 1991-92 1992-93 1993-94 1994-95 1995-96 1996-97\a\ B.E.
Revenue receipts 805.15 937.36 1038.97 1251.67 1396.48 1501.35 1821.35 2118.75 2413.76
Taxrevenue 668.21 775.76 878.58 1030.22 1144.34 1221.15 1480.29 1750.43 2038.85Non tax revenue 136.94 161.60 160.39 221.45 252.13 280.20 341.06 368.32 374.91
Revenue expenditure [A+B+C+D] 926.17 1092.92 1269.12 1462.73 1633.23 1871.62 2193.21 2539.45 2856.20
A. Developmental 502.73 591.96 684.56 783.22 843.24 952.06 1087.87 1277.85 1397.72
1. Social services 228.17 265.15 307.16 341.49 379.95 430.58 496.45 619.15 687.072. Economic services 274.55 326.80 377.40 441.72 463.29 521.48 591.42 658.69 710.65
B. Non-developmental 405.05 479.92 560.60 651.78 759.10 891.30 1081.36 1232.34 1425.29C. Revenue disbursements of UTs 10.92 13.09 13.75 15.05 16.30 13.73 6.59 7.63 7.95
D. Other expenditureb 7.46 7.95 10.21 12.68 14.59 14.53 17.39 21.62 25.23
Net current balance -121.02 -155.56 -230.15 -211.05 -236.75 -370.28 -371.87 -420.70 -442.44
Capital expenditure [A+B+C+D-E] 227.16 277.58 293.64 235.71 291.60 342.11 344.55 416.22 416.95
A. Developmental (1+2) 128.56 148.23 158.84 156.87 177.26 176.11 243.28 220.46 225.57
1. Social services 14.79 14.92 15.04 18.86 19.23 21.63 30.30 33.69 41.482.Economicservices 113.76 133.31 143.80 138.00 158.03 154.49 212.97 186.77 184.08
B. Non-Developmental 43.01 47.63 52.19 54.67 61.98 77.90 76.71 94.99 109.24C. Loans and advances (net) 53.82 79.85 79.93 51.13 68.47 84.83 78.20 112.50 129.75D. Capital disbursements of UTs 1.76 1.87 2.68 3.42 3.50 2.78 2.44 2.24 2.41E. Disinvestment of equities in PSEs. 0.00 0.00 0.00 30.38 19.61 56.07 56.07 13.97 50.01
Gross fiscal deficit 348.17 433.14 523.80 446.76 528.35 712.38 716.42 836.91 859.40
Finance by Instrument:Market Loans 106.64 99.99 105.61 108.20 75.26 331.56 244.31 381.98 307.97Small Savings 58.35 85.75 91.04 66.40 57.17 91.00 165.78 127.90 140.00Provident Funds 91.13 113.93 120.06 108.65 123.77 136.88 150.44 124.19 169.55External Loans 24.60 25.95 31.81 54.21 53.19 50.74 51.46 3.18 24.61Treasury Bills 62.44 109.11 117.69 68.87 117.73 119.82 -2.68 114.63 65.78Other 5.01 -1.59 57.58 40.43 101.23 -17.62 107.12 85.03 151.49
Note: BE = Budget estimates; RE = Revised estimates.
a. Actuals for the center and revised estimates for the states.b. Other expenditure include compensation and assignments to local bodies and panchayat raj institutions and reserve with the
finance department.
Source: Union Budget Documents; RBI bulletin on state finances; World Bank Staff Estimates.
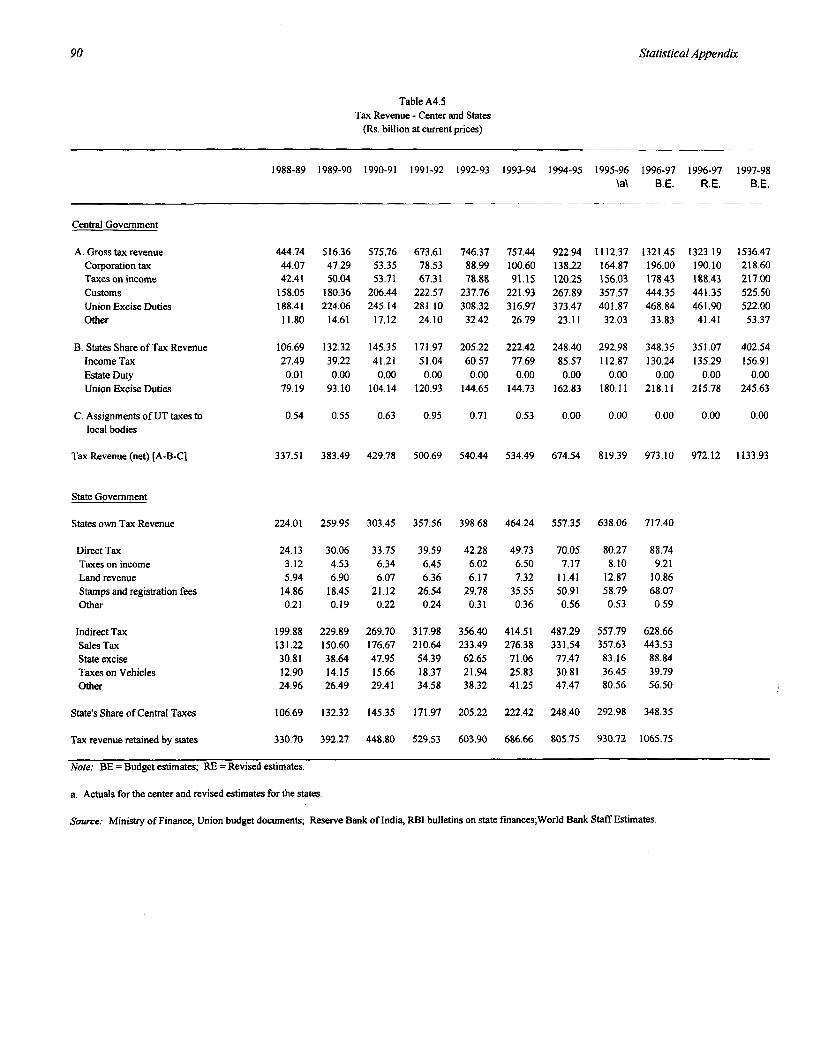
90 Statistical Appendix
Table A4.5Tax Revenue - Center and States
(Rs. billion at current prices)
1988-89 1989-90 1990-91 1991-92 1992-93 1993-94 1994-95 1995-96 1996-97 1996-97 1997-98\aX B.E. R.E. B.E.
Central Government
A. Grosstaxrevenue 444.74 516.36 575.76 673.61 746.37 757.44 922.94 1112.37 1321.45 1323.19 1536.47Corporation tax 44.07 47.29 53.35 78.53 88.99 100.60 138.22 164.87 196.00 190.10 218.60Taxes on income 42.41 50.04 53.71 67.31 78.88 91.15 120.25 156.03 178.43 188.43 217.00Customs 158.05 180.36 206.44 222.57 237.76 221.93 267.89 357.57 444.35 441.35 525.50Union Excise Duties 188.41 224.06 245.14 281.10 308.32 316.97 373.47 401.87 468.84 461.90 522.00Other 11.80 14.61 17.12 24.10 32.42 26.79 23.11 32.03 33.83 41.41 53.37
B. States Share of Tax Revenue 106.69 132.32 145.35 171.97 205.22 222.42 248.40 292.98 348.35 351.07 402.54IncomeTax 27.49 39.22 41.21 51.04 60.57 77.69 85.57 112.87 130.24 135.29 156.91Estate Duty 0.01 0.00 0.00 0.00 0.00 0.00 0.00 0.00 0.00 0.00 0.00UnionExciseDuties 79.19 93.10 104.14 120.93 144.65 144.73 162.83 180.11 218.11 215.78 245.63
C. Assignments of UT taxes to 0.54 0.55 0.63 0.95 0.71 0.53 0.00 0.00 0.00 0.00 0.00local bodies
Tax Revenue (net) [A-B-C] 337.51 383.49 429.78 500.69 540.44 534.49 674.54 819.39 973.10 972.12 1133.93
State Government
StatesownTaxRevenue 224.01 259.95 303.45 357.56 398.68 464.24 557.35 638.06 717.40
DirectTax 24.13 30.06 33.75 39.59 42.28 49.73 70.05 80.27 88.74Taxes on income 3.12 4.53 6.34 6.45 6.02 6.50 7.17 8.10 9.21Land revenue 5.94 6.90 6.07 6.36 6.17 7.32 11.41 12.87 10.86Stamps and registration fees 14.86 18.45 21.12 26.54 29.78 35.55 50.91 58.79 68.07Other 0.21 0.19 0.22 0.24 0.31 0.36 0.56 0.53 0.59
Indirect Tax 199.88 229.89 269.70 317.98 356.40 414.51 487.29 557.79 628.66Sales Tax 131.22 150.60 176.67 210.64 233.49 276.38 331.54 357.63 443.53State excise 30.81 38.64 47.95 54.39 62.65 71.06 77.47 83.16 88.84Taxes on Vehicles 12.90 14.15 15.66 18.37 21.94 25.83 30.81 36.45 39.79Other 24.96 26.49 29.41 34.58 38.32 41.25 47.47 80.56 56.50
State's Share of Central Taxes 106.69 132.32 145.35 171.97 205.22 222.42 248.40 292.98 348.35
Tax revenue retained by states 330.70 392.27 448.80 529.53 603.90 686.66 805.75 930.72 1065.75
Note: BE = Budget estimates; RE = Revised estimates.
a. Actuals for the center and revised estimates for the states.
Source: Ministry of Finance, Union budget documents; Reserve Bank of India, RBI bulletins on state finances;World Bank Staff Estimates.
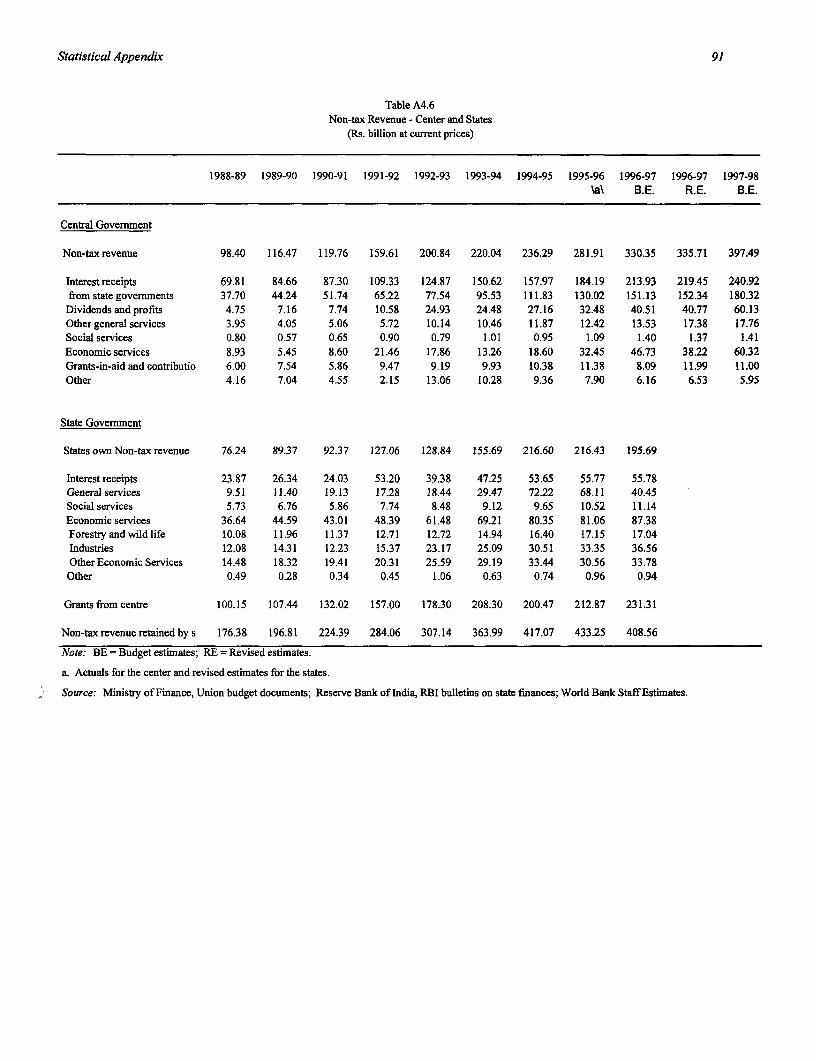
Statistical Appendix 91
Table A4.6Non-tax Revenue -Center and States
(Rs. billion at current prices)
1988-89 1989-90 1990-91 1991-92 1992-93 1993-94 1994-95 1995-96 1996-97 1996-97 1997-98\aX B.E. R.E. B.E.
Central Govermment
Non-taxrevenue 98.40 116.47 119.76 159.61 200.84 220.04 236.29 281.91 330.35 335.71 397.49
Interest receipts 69.81 84.66 87.30 109.33 124.87 150.62 157.97 184.19 213.93 219.45 240.92from state govermnents 37.70 44.24 51.74 65.22 77.54 95.53 111.83 130.02 151.13 152.34 180.32
Dividends and profits 4.75 7.16 7.74 10.58 24.93 24.48 27.16 32.48 40.51 40.77 60.13Other general services 3.95 4.05 5.06 5.72 10.14 10.46 11.87 12.42 13.53 17.38 17.76Social services 0.80 0.57 0.65 0.90 0.79 1.01 0.95 1.09 1.40 1.37 1.41Economic services 8.93 5.45 8.60 21.46 17.86 13.26 18.60 32.45 46.73 38.22 60.32Grants-in-aid and contributio 6.00 7.54 5.86 9.47 9.19 9.93 10.38 11.38 8.09 11.99 11.00Other 4.16 7.04 4.55 2.15 13.06 10.28 9.36 7.90 6.16 6.53 5.95
State Government
States own Non-tax revenue 76.24 89.37 92.37 127.06 128.84 155.69 216.60 216.43 195.69
Interest receipts 23.87 26.34 24.03 53.20 39.38 47.25 53.65 55.77 55.78General services 9.51 11.40 19.13 17.28 18.44 29.47 72.22 68.11 40.45Social services 5.73 6.76 5.86 7.74 8.48 9.12 9.65 10.52 11.14Economic services 36.64 44.59 43.01 48.39 61.48 69.21 80.35 81.06 87.38Forestry and wild life 10.08 11.96 11.37 12.71 12.72 14.94 16.40 17.15 17.04Industries 12.08 14.31 12.23 15.37 23.17 25.09 30.51 33.35 36.56Other Economic Services 14.48 18.32 19.41 20.31 25.59 29.19 33.44 30.56 33.78Other 0.49 0.28 0.34 0.45 1.06 0.63 0.74 0.96 0.94
Grants from centre 100.15 107.44 132.02 157.00 178.30 208.30 200.47 212.87 231.31
Non-tax revenue retained by s 176.38 196.81 224.39 284.06 307.14 363.99 417.07 433.25 408.56
Note: BE = Budget estimates; RE = Revised estimates.
a. Actuals for the center and revised estimates for the states.
Source: Ministry of Finance, Union budget documents; Reserve Bank of India, RBI bulletins on state finances; World Bank Staff Estimates.
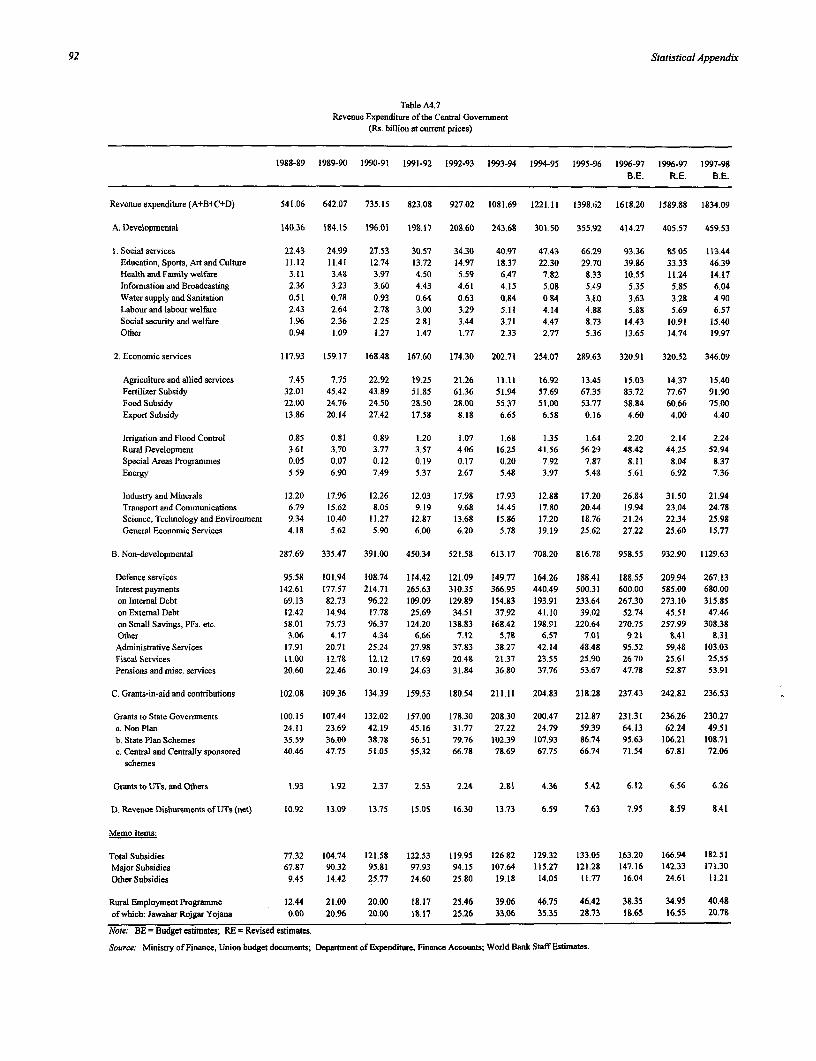
92 StatisticalAppendix
Table A4.7Revenue Expenditure of the Central Goveriment
(Rs. billion at current prices)
1988-89 1989-90 1990-91 1991-92 1992-93 1993-94 1994-95 1995-96 1996-97 1996-97 1997-98B.E. R.E. B.E.
Revenue expenditure (A+B+C+D) 541.06 642.07 735.15 823.08 927.02 1081.69 1221.11 1398.62 1618.20 1589.88 1834.09
A. Developmental 140.36 184.15 196.01 198.17 208.60 243.68 301.50 355.92 414.27 405.57 459.53
1. Social services 22.43 24.99 27.53 30.57 34.30 40.97 47.43 66.'29 93.36 85.05 113.44Education, Sports, Art and Culture 11.12 11.41 12.74 13.72 14.97 18.37 22.30 29.70 39.86 33.33 46.39Health and Family welfare 3.11 3.48 3.97 4.50 5.59 6.47 7.82 8.33 10.55 11.24 14.17Information and Broadcasting 2.36 3.23 3.60 4.43 4.61 4.15 5.08 5.49 5.35 5.85 6.04Water supply and Sanitation 0.51 0.78 0.93 0.64 0.63 0.84 0.84 3.80 3.63 3.28 4.90Labourandlabourwelfhre 2.43 2.64 2.78 3.00 3.29 5.11 4.14 4.88 5.88 5.69 6.57Social security and welfare 1.96 2.36 2.25 2.81 3.44 3.71 4.47 8.73 14.43 10.91 15.40Other 0.94 1.09 1.27 1.47 1.77 2.33 2.77 5.36 13.65 14.74 19.97
2. Economic services 117.93 159.17 168.48 167.60 174.30 202.71 254.07 289.63 320.91 320.52 346.09
Agriculture andallied services 7.45 7.75 22.92 19.25 21.26 11.11 16.92 13.45 15.03 14.37 15.40Fertilizer Subsidy 32.01 45.42 43.89 51.85 61.36 51.94 57.69 67.35 83.72 77.67 91.90Food Subsidy 22.00 24.76 24.50 28.50 28.00 55.37 51.00 53.77 58.84 60.66 75.00Export Subsidy 13.86 20.14 27.42 17.58 8.18 6.65 6.58 0.16 4.60 4.00 4.40
Irrigation and Flood Control 0.85 0.81 0.89 1.20 1.07 1.68 1.35 1.64 2.20 2.14 2.24Rural Development 3.61 3.70 3.77 3.57 4.06 16.25 41.56 56.29 48.42 44.25 52.94Special Areas Programmes 0.05 0.07 0.12 0.19 0.17 0.20 7.92 7.87 8.11 8.04 8.37Energy 5.59 6.90 7.49 5.37 2.67 5.48 3.97 5.413 5.61 6.92 7.36
IndustryandMinerals 12.20 17.96 12.26 12.03 17.98 17.93 12.88 17.2/) 26.84 31.50 21.94Transport and Communications 6.79 15.62 8.05 9.19 9.68 14.45 17.80 20.44 19.94 23.04 24.78Science, Technology and Environment 9.34 10.40 11.27 12.87 13.68 15.86 17.20 18.76 21.24 22.34 25.98General Economic Services 4.18 5.62 5.90 6.00 6.20 5.78 19.19 25.62 27.22 25.60 15.77
B. Non-developmental 287.69 335.47 391.00 450.34 521.58 613.17 708.20 816.718 958.55 932.90 1129.63
Defence services 95.58 101.94 108.74 114.42 121.09 149.77 164.26 188.41 188.55 209.94 267.13Interest payments 142.61 177.57 214.71 265.63 310.35 366.95 440.49 500.31 600.00 585.00 680.00on Internal Debt 69.13 82.73 96.22 109.09 129.89 154.83 193.91 233.64 267.30 273.10 315.85on External Debt 12.42 14.94 17.78 25.69 34.51 37.92 41.10 39.02 52.74 45.51 47.46on Small Savings, PFs. etc. 58.01 75.73 96.37 124.20 138.83 168.42 198.S1 220.64 270.75 257.99 308.38Other 3.06 4.17 4.34 6.66 7.12 5.78 6.57 7.01 9.21 8.41 8.31Administrative Services 17.91 20.71 25.24 27.98 37.83 38.27 42.14 48.48 95.52 59.48 103.03Fiscal Services 11.00 12.78 12.12 17.69 20.48 21.37 23.55 25.90 26.70 25.61 25.55Pensions and misc. services 20.60 22.46 30.19 24.63 31.84 36.80 37.76 53.67 47.78 52.87 53.91
C. Grants-in-aid and contributions 102.08 109.36 134.39 159.53 180.54 211.11 204.83 218.28 237.43 242.82 236.53
Grants to State Govemments 100.15 107.44 132.02 157.00 178.30 208.30 200.47 212.87 231.31 236.26 230.27a. Non Plan 24.11 23.69 42.19 45.16 31.77 27.22 24.79 59.39 64.13 62.24 49.51b. State Plan Schemes 35.59 36.00 38.78 56.51 79.76 102.39 107.93 86.74 95.63 106.21 108.71c. Central and Centrally sponsored 40.46 47.75 51.05 55.32 66.78 78.69 67.75 66.74 71.54 67.81 72.06
schemes
GrantstoUTs.andlhers 1.93 1.92 2.37 2.53 2.24 2.81 4.36 5.42 6.12 6.56 6.26
D.RevenueDisbursmentsofUTs (net) 10.92 13.09 13.75 15.05 16.30 13.73 6.59 7.63 7.95 8.59 8.41
Memo Items:
Total Subsidies 77.32 104.74 121.58 122.53 119.95 126.82 129.32 133.05 163.20 166.94 182.51Major Subsidies 67.87 90.32 95.81 97.93 94.15 107.64 115.27 121.28 147.16 142.33 171.30Other Subsidies 9.45 14.42 25.77 24.60 25.80 19.18 14.05 11.77 16.04 24.61 11.21
Rural Employment Programme 12.44 21.00 20.00 18.17 25.46 39.06 46.75 46.42 38.35 34.95 40.48of which: JawaharRojgarYojana 0.00 20.96 20.00 18.17 25.26 33.06 35.35 28.73 18.65 16.55 20.78
Nole: BE = Budget estimates; RE = Revised estimates.
Source: Ministry of Finance, Union budget documents; Department of Expenditure, Finance Accounts; World Bank Staff Estimates.
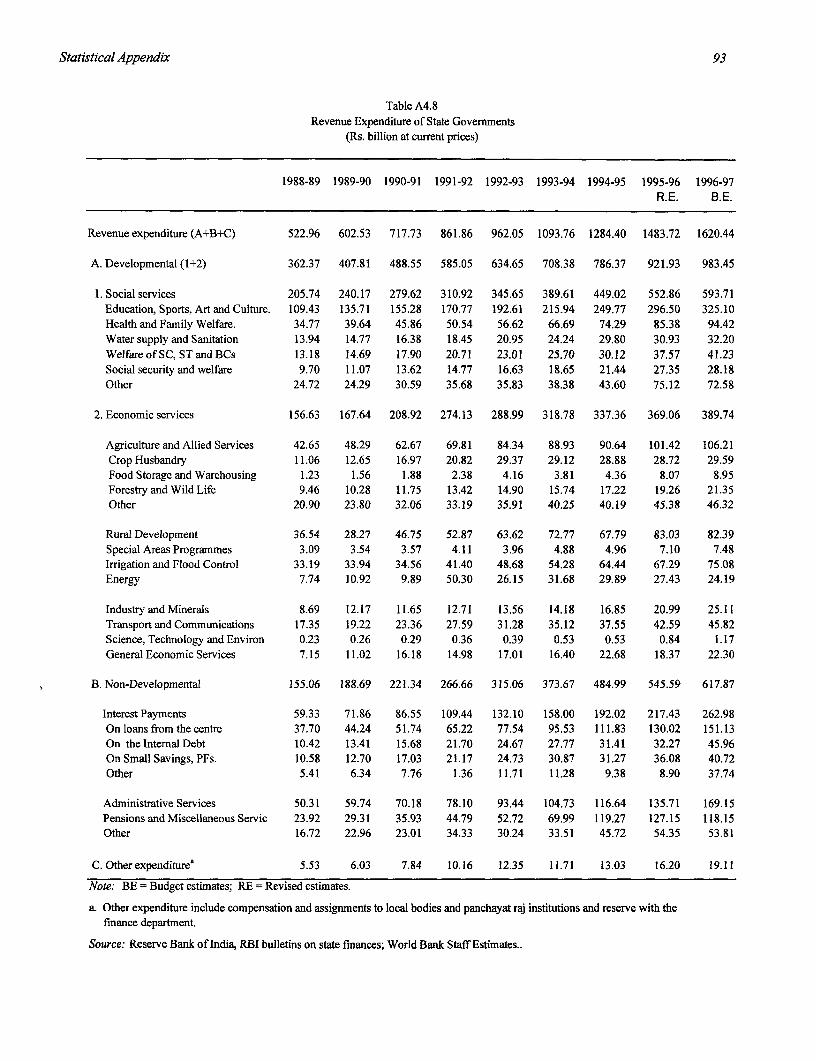
Statistical Appendix 93
Table A4.8Revenue Expenditure of State Governments
(Rs. billion at current prices)
1988-89 1989-90 1990-91 1991-92 1992-93 1993-94 1994-95 1995-96 1996-97R.E. B.E.
Revenue expenditure (A+B+C) 522.96 602.53 717.73 861.86 962.05 1093.76 1284.40 1483.72 1620.44
A. Developmental (1+2) 362.37 407.81 488.55 585.05 634.65 708.38 786.37 921.93 983.45
1. Social services 205.74 240.17 279.62 310.92 345.65 389.61 449.02 552.86 593.71Education, Sports, Art and Culture. 109.43 135.71 155.28 170.77 192.61 215.94 249.77 296.50 325.10Health and Family Welfare. 34.77 39.64 45.86 50.54 56.62 66.69 74.29 85.38 94.42Water supply and Sanitation 13.94 14.77 16.38 18.45 20.95 24.24 29.80 30.93 32.20Welfare of SC, ST and BCs 13.18 14.69 17.90 20.71 23.01 25.70 30.12 37.57 41.23Social security and welfare 9.70 11.07 13.62 14.77 16.63 18.65 21.44 27.35 28.18Other 24.72 24.29 30.59 35.68 35.83 38.38 43.60 75.12 72.58
2. Economic services 156.63 167.64 208.92 274.13 288.99 318.78 337.36 369.06 389.74
Agriculture and Allied Services 42.65 48.29 62.67 69.81 84.34 88.93 90.64 101.42 106.21Crop Husbandry 11.06 12.65 16.97 20.82 29.37 29.12 28.88 28.72 29.59Food Storage and Warehousing 1.23 1.56 1.88 2.38 4.16 3.81 4.36 8.07 8.95Forestry and Wild Life 9.46 10.28 11.75 13.42 14.90 15.74 17.22 19.26 21.35Other 20.90 23.80 32.06 33.19 35.91 40.25 40.19 45.38 46.32
Rural Development 36.54 28.27 46.75 52.87 63.62 72.77 67.79 83.03 82.39Special Areas Programmes 3.09 3.54 3.57 4.11 3.96 4.88 4.96 7.10 7.48Irrigation and Flood Control 33.19 33.94 34.56 41.40 48.68 54.28 64.44 67.29 75.08Energy 7.74 10.92 9.89 50.30 26.15 31.68 29.89 27.43 24.19
IndustryandMinerals 8.69 12.17 11.65 12.71 13.56 14.18 16.85 20.99 25.11Transport and Communications 17.35 19.22 23.36 27.59 31.28 35.12 37.55 42.59 45.82Science, Technology and Environ 0.23 0.26 0.29 0.36 0.39 0.53 0.53 0.84 1.17General Economic Services 7.15 11.02 16.18 14.98 17.01 16.40 22.68 18.37 22.30
B. Non-Developmental 155.06 188.69 221.34 266.66 315.06 373.67 484.99 545.59 617.87
Interest Payments 59.33 71.86 86.55 109.44 132.10 158.00 192.02 217.43 262.98Onloansfromthecentre 37.70 44.24 51.74 65.22 77.54 95.53 111.83 130.02 151.13On the Internal Debt 10.42 13.41 15.68 21.70 24.67 27.77 31.41 32.27 45.96On Small Savings, PFs. 10.58 12.70 17.03 21.17 24.73 30.87 31.27 36.08 40.72Other 5.41 6.34 7.76 1.36 11.71 11.28 9.38 8.90 37.74
Administrative Services 50.31 59.74 70.18 78.10 93.44 104.73 116.64 135.71 169.15Pensions and Miscellaneous Servic 23.92 29.31 35.93 44.79 52.72 69.99 119.27 127.15 118.15Other 16.72 22.96 23.01 34.33 30.24 33.51 45.72 54.35 53.81
C. Otherexpenditurea 5.53 6.03 7.84 10.16 12.35 11.71 13.03 16.20 19.11
Note: BE = Budget estimates; RE = Revised estimates.
a. Other expenditure include compensation and assignments to local bodies and panchayat raj institutions and reserve with thefinance department.
Source: Reserve Bank of India, RBI bulletins on state finances; World Bank Staff Estimates..
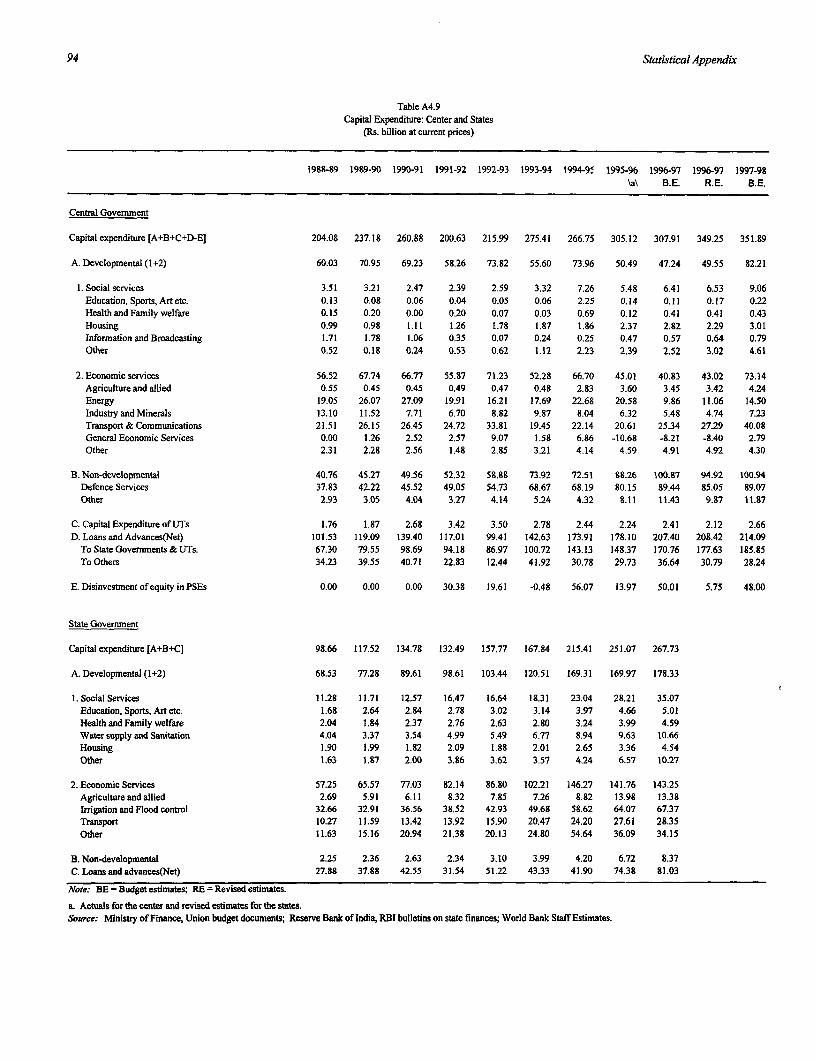
94 Statistical Appendix
Table A4.9Capital Expenditure: Center and States
(Rs. billion at current prices)
1988-89 1989-90 1990-91 1991-92 1992-93 1993-94 1994-95 1995-96 1996-97 1996-97 1997-98
\a\ B.E. R.E. B.E.
Central Government
Capital expenditure [A+B+C+D-E] 204.08 237.18 260.88 200.63 215.99 275.41 266.75 305.12 307.91 349.25 351.89
A. Developmental (1+2) 60.03 70.95 69.23 58.26 73.82 55.60 73.96 50.49 47.24 49.55 82.21
1. Social services 3.51 3.21 2.47 2.39 2.59 3.32 7.26 5.48 6.41 6.53 9.06Education, Sports, Art etc. 0.13 0.08 0.06 0.04 0.05 0.06 2.25 0.14 0.11 0.17 0.22Health and Family welfare 0.15 0.20 0.00 0.20 0.07 0.03 0.69 0.12 0.41 0.41 0.43Housing 0.99 0.98 1.11 1.26 1.78 1.87 1.86 2.37 2.82 2.29 3.01Information and Broadcasting 1.71 1.78 1.06 0.35 0.07 0.24 0.25 0.47 0.57 0.64 0.79Other 0.52 0.18 0.24 0.53 0.62 1.12 2.23 2.39 2.52 3.02 4.61
2. Economic services 56.52 67.74 66.77 55.87 71.23 52.28 66.70 45.01 40.83 43.02 73.14Agriculture and allied 0.55 0.45 0.45 0.49 0.47 0.48 2.83 3.60 3.45 3.42 4.24Energy 19.05 26.07 27.09 19.91 16.21 17.69 22.68 20.58 9.86 11.06 14.50Industry and Minerals 13.10 11.52 7.71 6.70 8.82 9.87 8.04 6.32 5.48 4.74 7.23Transport & Communications 21.51 26.15 26.45 24.72 33.81 19.45 22.14 20.61 25.34 27.29 40.08General Economic Services 0.00 1.26 2.52 2.57 9.07 1.58 6.86 -10.68 -8.21 -8.40 2.79Other 2.31 2.28 2.56 1.48 2.85 3.21 4.14 4.59 4.91 4.92 4.30
B. Non-developmental 40.76 45.27 49.56 52.32 58.88 73.92 72.51 88.26 100.87 94.92 100.94Defence Services 37.83 42.22 45.52 49.05 54.73 68.67 68.19 80.15 89.44 85.05 89.07Other 2.93 3.05 4.04 3.27 4.14 5.24 4.32 8.11 11.43 9.87 11.87
C. Capital Expenditure of UTs 1.76 1.87 2.68 3.42 3.50 2.78 2.44 2.24 2.41 2.12 2.66D.LoansandAdvances(Net) 101.53 119.09 139.40 117.01 99.41 142.63 173.91 178.10 207.40 208.42 214.09
ToStateGovernmentsd&UTs. 67.30 79.55 98.69 94.18 86.97 100.72 143.13 148.37 170.76 177.63 185.85To Others 34.23 39.55 40.71 22.83 12.44 41.92 30.78 29.73 36.64 30.79 28.24
E. Disinvestment of equity in PSEs 0.00 0.00 0.00 30.38 19.61 -0.48 56.07 13.97 50.01 5.75 48.00
State Government
Capital expenditure [A+B+C] 98.66 117.52 134.78 132.49 157.77 167.84 215.41 251.07 267.73
A. Developmental (1+2) 68.53 77.28 89.61 98.61 103.44 120.51 169.31 169.97 178.33
1. Social Services 11.28 11.71 12.57 16.47 16.64 18.31 23.04 28.21 35.07Education, Sports, Art etc. 1.68 2.64 2.84 2.78 3.02 3.14 3.97 4.66 5.01Health and Family welfare 2.04 1.84 2.37 2.76 2.63 2.80 3.24 3.99 4.59Water supply and Sanitation 4.04 3.37 3.54 4.99 5.49 6.77 8.94 9.63 10.66Housing 1.90 1.99 1.82 2.09 1.88 2.01 2.65 3.36 4.54Other 1.63 1.87 2.00 3.86 3.62 3.57 4.24 6.57 10.27
2. Economic Services 57.25 65.57 77.03 82.14 86.80 102.21 146.27 141.76 143.25Agriculture and allied 2.69 5.91 6.11 8.32 7.85 7.26 8.82 13.98 13.38Irrigation and Flood control 32.66 32.91 36.56 38.52 42.93 49.68 58.62 64.07 67.37Transport 10.27 11.59 13.42 13.92 15.90 20.47 24.20 27.61 28.35Other 11.63 15.16 20.94 21.38 20.13 24.80 54.64 36.09 34.15
B. Non-developmental 2.25 2.36 2.63 2.34 3.10 3.99 4.20 6.72 8.37C. Loans and advances(Net) 27.88 37.88 42.55 31.54 51.22 43.33 41.90 74.38 81.03
Note: BE - Budget estimates; RE = Revised estimates.
a. Actuals for the center and revised estimates for the states.Source: Ministry of Finance, Union budget documents; Reserve Bank of India, RBI bulletins on state finances; World Bank Staff Estimates.
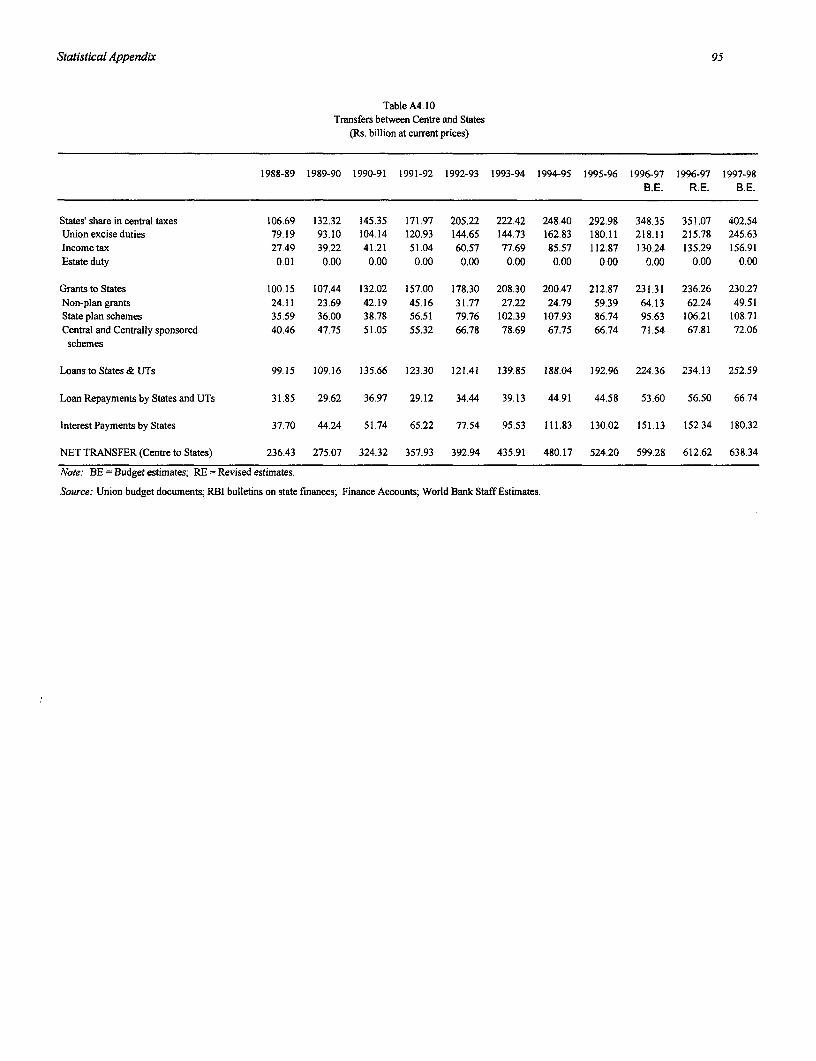
Statistical Appendix 95
Table A4.10Transfers between Centre and States
(Rs. billion at current prices)
1988-89 1989-90 1990-91 1991-92 1992-93 1993-94 1994-95 1995-96 1996-97 1996-97 1997-98B.E. R.E. B.E.
States' share in central taxes 106.69 132.32 145.35 171.97 205.22 222.42 248.40 292.98 348.35 351.07 402.54Unionexciseduties 79.19 93.10 104.14 120.93 144.65 144.73 162.83 180.11 218.11 215.78 245.63Incometax 27.49 39.22 41.21 51.04 60.57 77.69 85.57 112.87 130.24 135.29 156.91Estate duty 0.01 0.00 0.00 0.00 0.00 0.00 0.00 0.00 0.00 0.00 0.00
Grants to States 100.15 107.44 132.02 157.00 178.30 208.30 200.47 212.87 231.31 236.26 230.27Non-plan grants 24.11 23.69 42.19 45.16 31.77 27.22 24.79 59.39 64.13 62.24 49.51State plan schemes 35.59 36.00 38.78 56.51 79.76 102.39 107.93 86.74 95.63 106.21 108.71Central and Centrally sponsored 40.46 47.75 51.05 55.32 66.78 78.69 67.75 66.74 71.54 67.81 72.06schemes
Loansto States& UTs 99.15 109.16 135.66 123.30 121.41 139.85 188.04 192.96 224.36 234.13 252.59
Loan Repayments by States and UTs 31.85 29.62 36.97 29.12 34.44 39.13 44.91 44.58 53.60 56.50 66.74
InterestPayments by States 37.70 44.24 51.74 65.22 77.54 95.53 111.83 130.02 151.13 152.34 180.32
NET TRANSFER (Centre to States) 236.43 275.07 324.32 357.93 392.94 435.91 480.17 524.20 599.28 612.62 638.34
Note: BE = Budget estimates; RE = Revised estimates.
Source: Union budget documents; RBI bulletins on state finances; Finance Accounts; World Bank Staff Estimates.
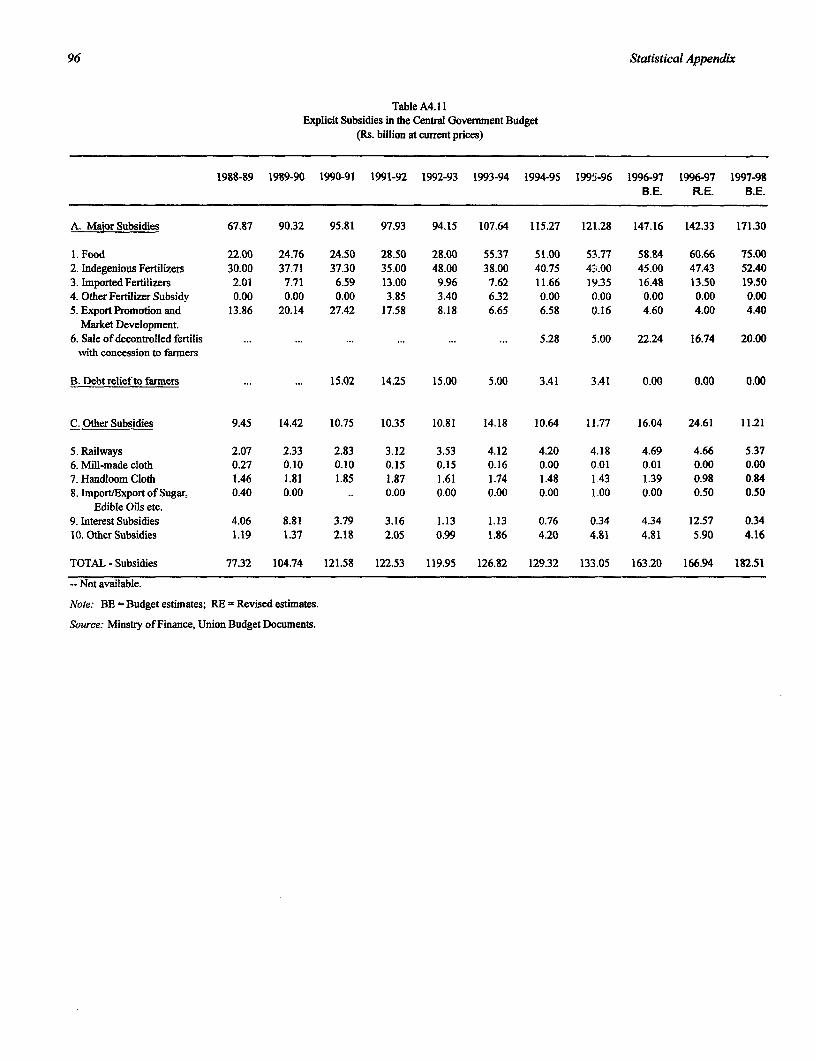
96 Statistical Appendix
Table A4.11Explicit Subsidies in the Central Government Budget
(Rs. billion at current prices)
1988-89 1989-90 1990-91 1991-92 1992-93 1993-94 1994-95 1995-96 1996-97 1996-97 1997-98B.E. R.E. B.E.
A. Major Subsidies 67.87 90.32 95.81 97.93 94.15 107.64 115.27 121.28 147.16 142.33 171.30
1. Food 22.00 24.76 24.50 28.50 28.00 55.37 51.00 53.77 58.84 60.66 75.002. Indegenious Fertilizers 30.00 37.71 37.30 35.00 48.00 38.00 40.75 43.00 45.00 47.43 52.403. Imported Fertilizers 2.01 7.71 6.59 13.00 9.96 7.62 11.66 19.35 16.48 13.50 19.504. OtherFertilizer Subsidy 0.00 0.00 0.00 3.85 3.40 6.32 0.00 0.00 0.00 0.00 0.005. ExportPromotion and 13.86 20.14 27.42 17.58 8.18 6.65 6.58 0.16 4.60 4.00 4.40
Market Development.6. Sale of decontrolled fertilis ... ... ... ... ... ... 5.28 5.00 22.24 16.74 20.00
with concession to farmers
B. Debt relief to farmers ... ... 15.02 14.25 15.00 5.00 3.41 3.41 0.00 0.00 0.00
C. Other Subsidies 9.45 14.42 10.75 10.35 10.81 14.18 10.64 11.77 16.04 24.61 11.21
5. Railways 2.07 2.33 2.83 3.12 3.53 4.12 4.20 4.18 4.69 4.66 5.376. Mill-made cloth 0.27 0.10 0.10 0.15 0.15 0.16 0.00 0.01 0.01 0.00 0.007. Handloom Cloth 1.46 1.81 1.85 1.87 1.61 1.74 1.48 1.43 1.39 0.98 0.848. Import/Export of Sugar, 0.40 0.00 .. 0.00 0.00 0.00 0.00 1.00 0.00 0.50 0.50
Edible Oils etc.9. Interest Subsidies 4.06 8.81 3.79 3.16 1.13 1.13 0.76 0.34 4.34 12.57 0.3410. Other Subsidies 1.19 1.37 2.18 2.05 0.99 1.86 4.20 4.81 4.81 5.90 4.16
TOTAL - Subsidies 77.32 104.74 121.58 122.53 119.95 126.82 129.32 133.05 163.20 166.94 182.51
-- Not available.
Note: BE = Budget estimates; RE = Revised estimates.
Source: Minstry of Finance, Union Budget Documents.
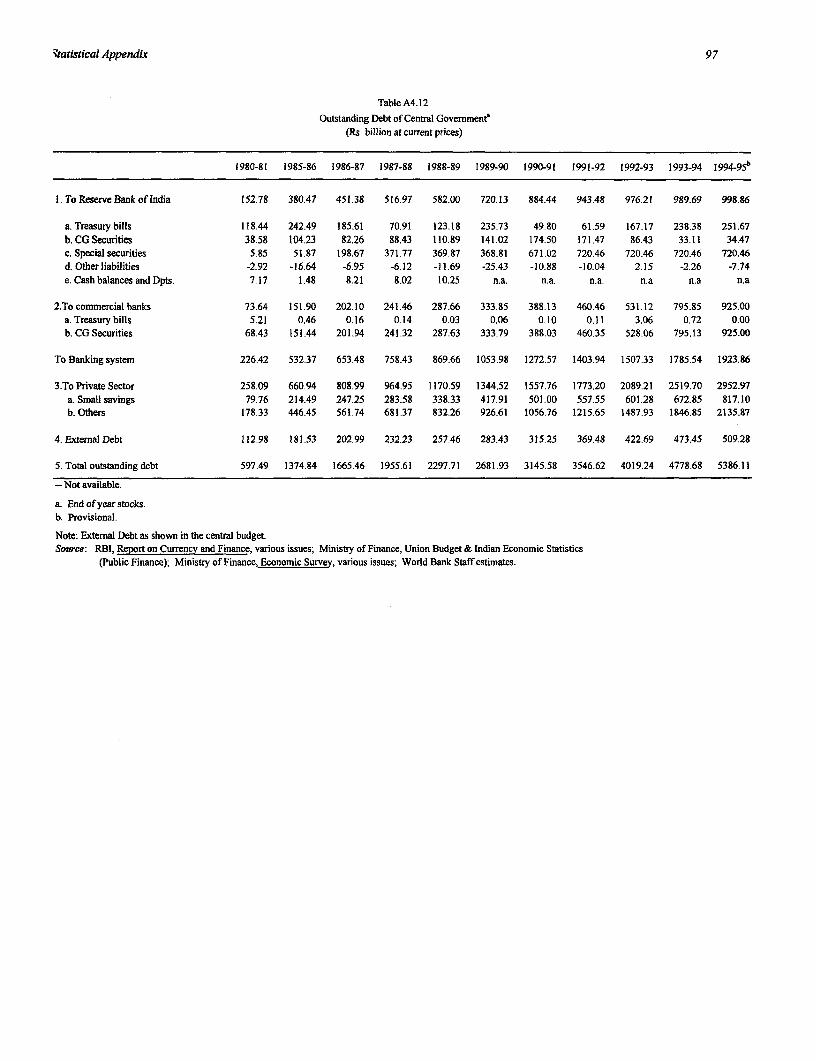
itatistiral Appendix 97
Table A4.12
Outstanding Debt of Central Govemmene(Rs. billion at current prices)
1980-81 1985-86 1986-87 1987-88 1988-89 1989-90 1990-91 1991-92 1992-93 1993-94 19 9 4-95 b
1. To Reserve Bank of India 152.78 380.47 451.38 516.97 582.00 720.13 884.44 943.48 976.21 989.69 998.86
a.Treasurybills 118.44 242.49 185.61 70.91 123.18 235.73 49.80 61.59 167.17 238.38 251.67b. CGSecurities 38.58 104.23 82.26 88.43 110.89 141.02 174.50 171.47 86.43 33.11 34.47c. Special securities 5.85 51.87 198.67 371.77 369.87 368.81 671.02 720.46 720.46 720.46 720.46d. Other liabilities -2.92 -16.64 -6.95 -6.12 -11.69 -25.43 -10.88 -10.04 2.15 -2.26 -7.74e. Cash balances and Dpts. 7.17 1.48 8.21 8.02 10.25 n.a. n.a. n.a. n.a n.a n.a
2.To commercial banks 73.64 151.90 202.10 241.46 287.66 333.85 388.13 460.46 531.12 795.85 925.00a. Treasury bills 5.21 0.46 0.16 0.14 0.03 0.06 0.10 0.11 3.06 0.72 0.00b. CG Securities 68,43 151.44 201.94 241.32 287.63 333.79 388.03 460.35 528.06 795.13 925.00
To Banking system 226.42 532.37 653.48 758.43 869.66 1053.98 1272.57 1403.94 1507.33 1785.54 1923.86
3.To Private Sector 258.09 660.94 808.99 964.95 1170.59 1344.52 1557.76 1773.20 2089.21 2519.70 2952.97a. Small savings 79.76 214.49 247.25 283.58 338.33 417.91 501.00 557.55 601.28 672.85 817.10b. Others 178.33 446.45 561.74 681.37 832.26 926.61 1056.76 1215.65 1487.93 1846.85 2135.87
4. Extemal Debt 112.98 181.53 202.99 232.23 257.46 283.43 315.25 369.48 422.69 473.45 509.28
5. Total outstanding debt 597.49 1374.84 1665.46 1955.61 2297.71 2681.93 3145.58 3546.62 4019.24 4778.68 5386.11
- Not available.
a. End of year stocks.b. Provisional.
Note: Extemal Debt as shown in the central budget.Source: RBI, Report on Currency and Finance, various issues; Ministry of Finance, Union Budget & Indian Economic Statistics
(Public Finance); Ministry of Finance, Economic Survey, various issues; World Bank Staff estimates.
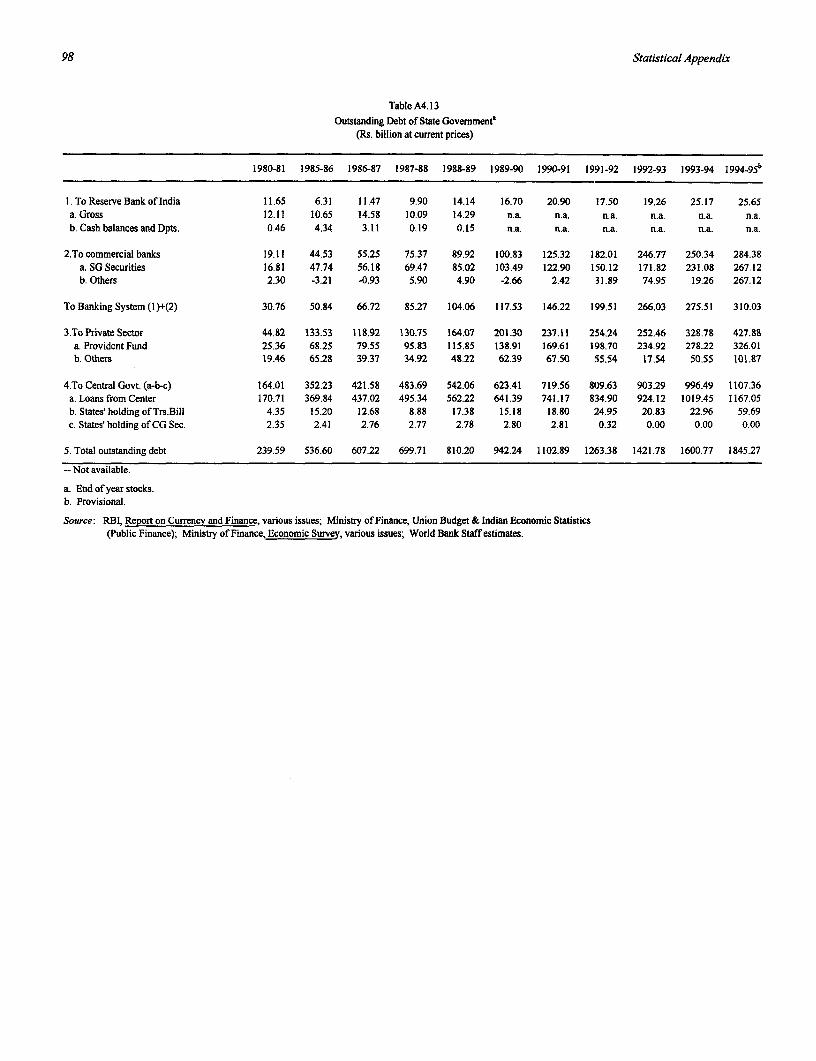
98 Statistical Appendix
Table A4.13
Outstanding Debt of State Govemmene(Rs. billion at current prices)
1980-81 1985-86 1986-87 1987-88 1988-89 1989-90 1990-91 1991-92 1992-93 1993-94 1 9 94 -9 5b
1. To Reserve Bank of India 11.65 6.31 11.47 9.90 14.14 16.70 20.90 17.50 19.26 25.17 25.65a. Gross 12.11 10.65 14.58 10.09 14.29 n.a. n.a. n.a. n.a. n.a. n.a.b. Cash balances and Dpts. 0.46 4.34 3.11 0.19 0.15 n.a. n.a. n.a. n.a. n.a. n.a.
2.To commercial banks 19.11 44.53 55.25 75.37 89.92 100.83 125.32 182.01 246.77 250.34 284.38a. SGSecurities 16.81 47.74 56.18 69.47 85.02 103.49 122.90 150.12 171.82 231.08 267.12b. Others 2.30 -3.21 -0.93 5.90 4.90 -2.66 2.42 :31.89 74.95 19.26 267.12
To Banking System (1)+(2) 30.76 50.84 66.72 85.27 104.06 117.53 146.22 199.51 266.03 275.51 310.03
3.To Private Sector 44.82 133.53 118.92 130.75 164.07 201.30 237.11 254.24 252.46 328.78 427.88a. Provident Fund 25.36 68.25 79.55 95.83 115.85 138.91 169.61 1 98.70 234.92 278.22 326.01b. Others 19.46 65.28 39.37 34.92 48.22 62.39 67.50 55.54 17.54 50.55 101.87
4.To Central Govt. (a-b-c) 164.01 352.23 421.58 483.69 542.06 623.41 719.56 809.63 903.29 996.49 1107.36a. Loans from Center 170.71 369.84 437.02 495.34 562.22 641.39 741.17 834.90 924.12 1019.45 1167.05b. States'holding of Trs.Bill 4.35 15.20 12.68 8.88 17.38 15.18 18.80 24.95 20.83 22.96 59.69c. States' holding of CG Sec. 2.35 2.41 2.76 2.77 2.78 2.80 2.81 0.32 0.00 0.00 0.00
5. Total outstanding debt 239.59 536.60 607.22 699.71 810.20 942.24 1102.89 1263.38 1421.78 1600.77 1845.27
-- Not available.
a. End of year stocks.b. Provisional.
Source: RBI, Report on Currency and Finance, various issues; Ministry of Finance, Union Budget & Indian Economic Statistics(Public Finance); Ministry of Finance, Economic Suve , various issues; World Bank Staff estimates.
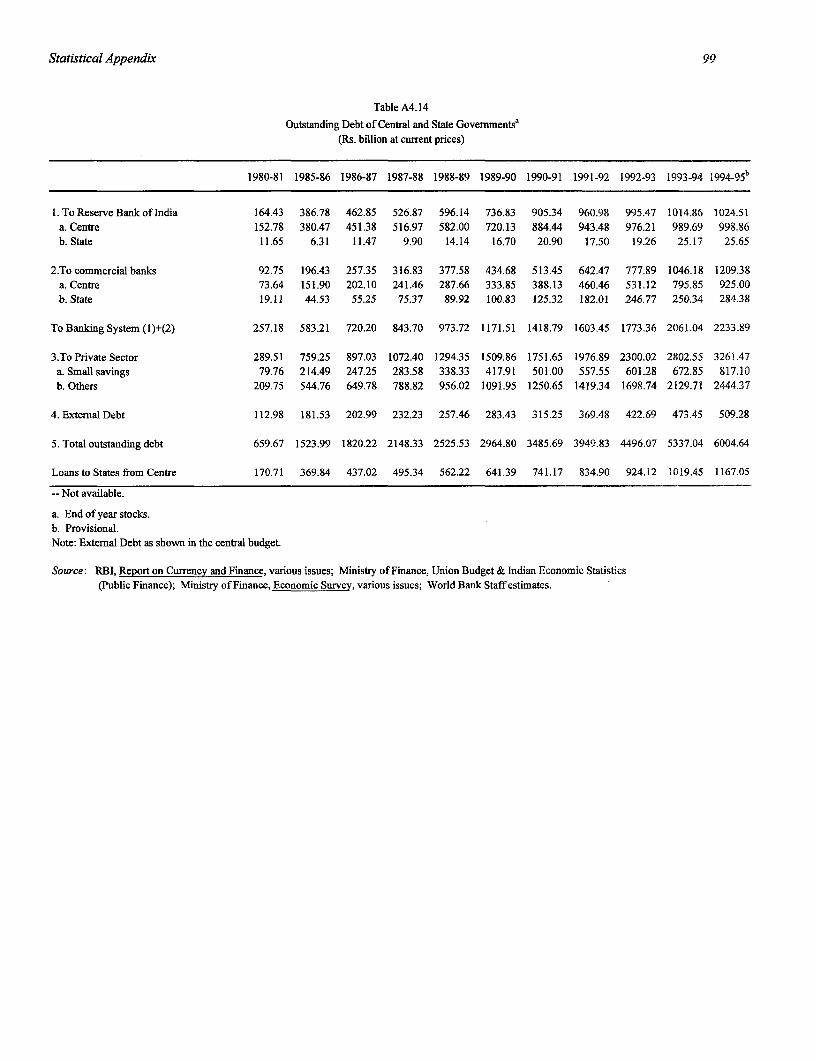
Statistical Appendix 99
Table A4.14
Outstanding Debt of Central and State Governmentsa(Rs. billion at current prices)
1980-81 1985-86 1986-87 1987-88 1988-89 1989-90 1990-91 1991-92 1992-93 1993-94 1994-95b
1. To Reserve Bank of India 164.43 386.78 462.85 526.87 596.14 736.83 905.34 960.98 995.47 1014.86 1024.51a. Centre 152.78 380.47 451.38 516.97 582.00 720.13 884.44 943.48 976.21 989.69 998.86b. State 11.65 6.31 11.47 9.90 14.14 16.70 20.90 17.50 19.26 25.17 25.65
2.To commercial banks 92.75 196.43 257.35 316.83 377.58 434.68 513.45 642.47 777.89 1046.18 1209.38a. Centre 73.64 151.90 202.10 241.46 287.66 333.85 388.13 460.46 531.12 795.85 925.00b. State 19.11 44.53 55.25 75.37 89.92 100.83 125.32 182.01 246.77 250.34 284.38
To Banking System (1)+(2) 257.18 583.21 720.20 843.70 973.72 1171.51 1418.79 1603.45 1773.36 2061.04 2233.89
3.To Private Sector 289.51 759.25 897.03 1072.40 1294.35 1509.86 1751.65 1976.89 2300.02 2802.55 3261.47a. Small savings 79.76 214.49 247.25 283.58 338.33 417.91 501.00 557.55 601.28 672.85 817.10b. Others 209.75 544.76 649.78 788.82 956.02 1091.95 1250.65 1419.34 1698.74 2129.71 2444.37
4. External Debt 112.98 181.53 202.99 232.23 257.46 283.43 315.25 369.48 422.69 473.45 509.28
5. Total outstanding debt 659.67 1523.99 1820.22 2148.33 2525.53 2964.80 3485.69 3949.83 4496.07 5337.04 6004.64
Loans to States from Centre 170.71 369.84 437.02 495.34 562.22 641.39 741.17 834.90 924.12 1019.45 1167.05
-- Not available.
a. End of year stocks.b. Provisional.Note: External Debt as shown in the central budget.
Source: RBI, Report on Currency and Finance, various issues; Ministry of Finance, Union Budget & Indian Economic Statistics(Public Finance); Ministry of Finance, Economic Survey, various issues; World Bank Staff estimates.
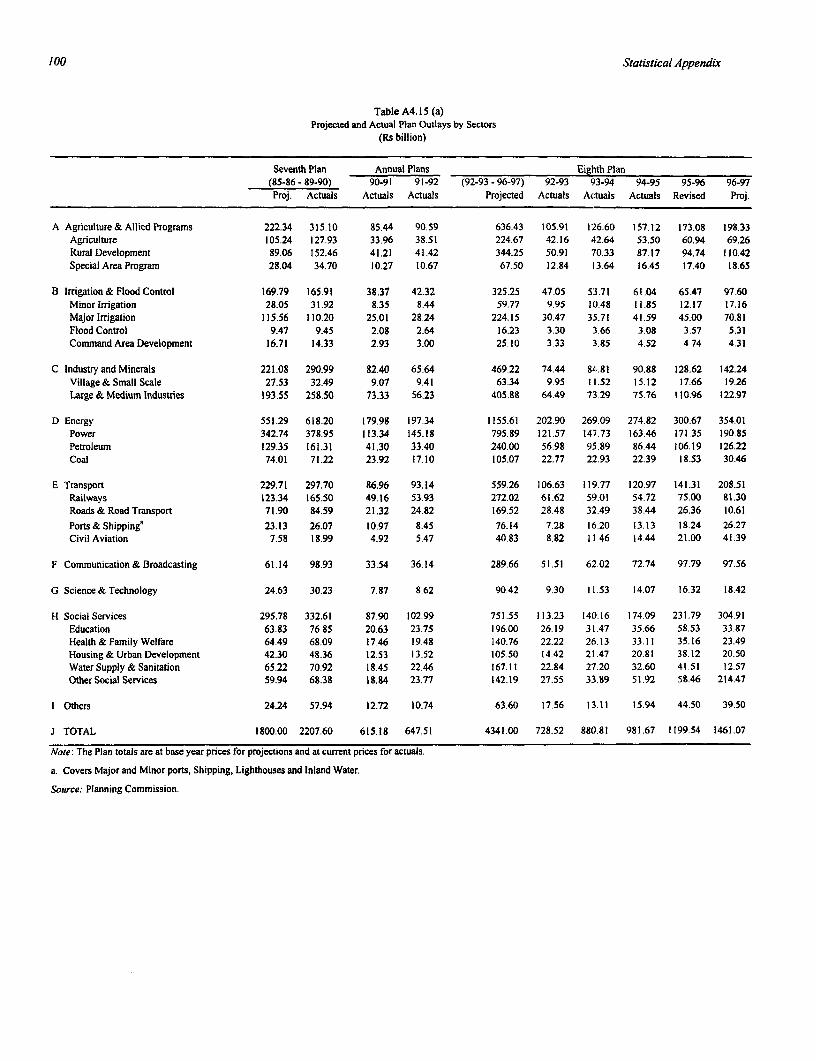
100 Statistical Appendix
Table A4.15 (a)Projected and Actual Plan Outlays by Sectors
(Rs billion)
Seventh Plan Annual Plans Eighth Plan(85-86 - 89-90) 90-91 91-92 (92-93 - 96-97) 92-93 93-94 94-95 95-96 96-97Proj. Actuals Actuals Actuals Projected Actuals Actuals Actuals Revised Proj.
A Agriculture & Allied Programs 222.34 315.10 85.44 90.59 636.43 105.91 126.60 157.12 173.08 198.33Agriculture 105.24 127.93 33.96 38.51 224.67 42.16 42.64 53.50 60.94 69.26Rural Development 89.06 152.46 41.21 41.42 344.25 50.91 70.33 87.17 94.74 110.42Special Area Program 28.04 34.70 10.27 10.67 67.50 12.84 13.64 16.45 17.40 18.65
B Irrigation & Flood Control 169.79 165.91 38.37 42.32 325.25 47.05 53.71 61.04 65.47 97.60MinorIrrigation 28.05 31.92 8.35 8.44 59.77 9.95 10.48 11.85 12.17 17.16MajorIrrigation 115.56 110.20 25.01 28.24 224.15 30.47 35.71 41.59 45.00 70.81Flood Control 9.47 9.45 2.08 2.64 16.23 3.30 3.66 3.08 3.57 5.31Command Area Development 16.71 14.33 2.93 3.00 25.10 3.33 3.85 4.52 4.74 4.31
C Industry and Minerals 221.08 290.99 82.40 65.64 469.22 74.44 84.81 90.88 128.62 142.24Village&Small Scale 27.53 32.49 9.07 9.41 63.34 9.95 11.52 15.12 17.66 19.26Large & Medium Industries 193.55 258.50 73.33 56.23 405.88 64.49 73.29 75.76 110.96 122.97
D Energy 551.29 618.20 179.98 197.34 1155.61 202.90 269.09 274.82 300.67 354.01Power 342.74 378.95 113.34 145.18 795.89 121.57 147.73 163.46 171.35 190.85Petroleum 129.35 161.31 41.30 33.40 240.00 56.98 95.89 86.44 106.19 126.22Coal 74.01 71.22 23.92 17.10 105.07 22.77 22.93 22.39 18.53 30.46
E Transport 229.71 297.70 86.96 93.14 559.26 106.63 119.77 120.97 141.31 208.51Railways 123.34 165.50 49.16 53.93 272.02 61.62 59.01 54.72 75.00 81.30Roads & Road Transport 71.90 84.59 21.32 24.82 169.52 28.48 32.49 38.44 26.36 10.61
Ports&Shippinga 23.13 26.07 10.97 8.45 76.14 7.28 16.20 13.13 18.24 26.27Civil Aviation 7.58 18.99 4.92 5.47 40.83 8.82 11.46 14.44 21.00 41.39
F Communication&Broadcasting 61.14 98.93 33.54 36.14 289.66 51.51 62.02 72.74 97.79 97.56
G Science&Technology 24.63 30.23 7.87 8.62 90.42 9.30 11.53 14.07 16.32 18.42
H Social Services 295.78 332.61 87.90 102.99 751.55 113.23 140.16 174.09 231.79 304.91Education 63.83 76.85 20.63 23.75 196.00 26.19 31.47 35.66 58.53 33.87Health& Family Welfare 64.49 68.09 17.46 19.48 140.76 22.22 26.13 33.11 35.16 23.49Housing& Urban Development 42.30 48.36 12.53 13.52 105.50 14.42 21.47 20.81 38.12 20.50Water Supply & Sanitation 65.22 70.92 18.45 22.46 167.11 22.84 27.20 32.60 41.51 12.57Other Social Services 59.94 68.38 18.84 23.77 142.19 27.55 33.89 51.92 58.46 214.47
I Others 24.24 57.94 12.72 10.74 63.60 17.56 13.11 15.94 44.50 39.50
J TOTAL 1800.00 2207.60 615.18 647.51 4341.00 728.52 880.81 981.67 1199.54 1461.07
Nlote: The Plan totals are at base year prices for projections and at current prices for actuals.
a. Covers Major and Minor ports, Shipping, Lighthouses and Inland Water.
Source: Planning Commission.
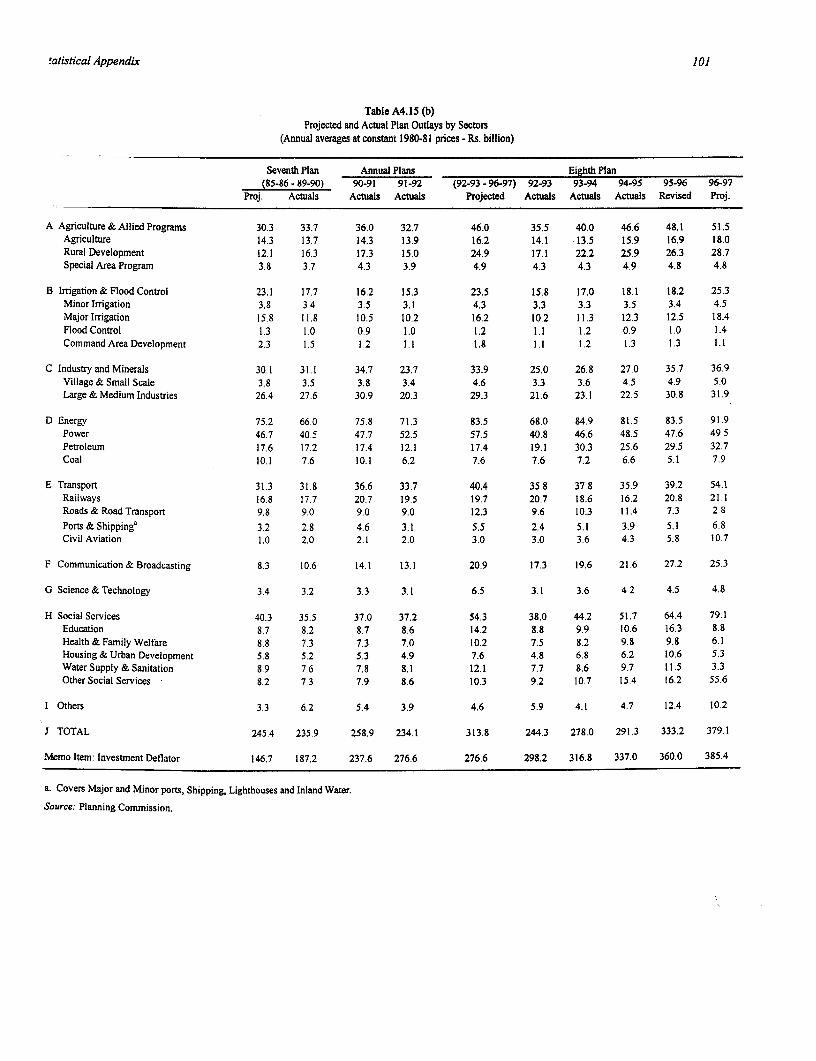
tatistical Appendix 101
Table A4.15 (b)Projected and Actual Plan Outlays by Sectors
(Annual averages at constant 1980-81 prices - Rs. billion)
Seventh Plan Annual Plans Eighth Plan(85-86 - 89-90) 90-91 91-92 (92-93 - 96-97) 92-93 93-94 94-95 95-96 96-97
Proj. Actuals Actuals Actuals Projected Actuals Actuals Actuals Revised Proj.
A Agriculture&AlliedPrograms 30.3 33.7 36.0 32.7 46.0 35.5 40.0 46.6 48.1 51.5Agriculture 14.3 13.7 14.3 13.9 16.2 14.1 .13.5 15.9 16.9 18.0Rural Development 12.1 16.3 17.3 15.0 24.9 17.1 22.2 25.9 26.3 28.7Special Area Program 3.8 3.7 4.3 3.9 4.9 4.3 4.3 4.9 4.8 4.8
B Irrigation & Flood Control 23.1 17.7 16.2 15.3 23.5 15.8 17.0 18.1 18.2 25.3Minor Irrigation 3.8 3.4 3.5 3.1 4.3 3.3 3.3 3.5 3.4 4.5Major Irrigation 15.8 11.8 10.5 10.2 16.2 10.2 11.3 12.3 12.5 18.4Flood Control 1.3 1.0 0.9 1.0 1.2 1.1 1.2 0.9 1.0 1.4CommandAreaDevelopment 2.3 1.5 1.2 1.1 1.8 1.1 1.2 1.3 1.3 1.1
C Industry and Minerals 30.1 31.1 34.7 23.7 33.9 25.0 26.8 27.0 35.7 36.9Village & Small Scale 3.8 3.5 3.8 3.4 4.6 3.3 3.6 4.5 4.9 5.0Large & Medium Industries 26.4 27.6 30.9 20.3 29.3 21.6 23.1 22.5 30.8 31.9
D Energy 75.2 66.0 75.8 71.3 83.5 68.0 84.9 81.5 83.5 91.9Power 46.7 40.5 47.7 52.5 57.5 40.8 46.6 48.5 47.6 49.5Petroleum 17.6 17.2 17.4 12.1 17.4 19.1 30.3 25.6 29.5 32.7Coal 10.1 7.6 10.1 6.2 7.6 7.6 7.2 6.6 5.1 7.9
E Transport 31.3 31.8 36.6 33.7 40.4 35.8 37.8 35.9 39.2 54.1Railways 16.8 17.7 20.7 19.5 19.7 20.7 18.6 16.2 20.8 21.1Roads & Road Transport 9.8 9.0 9.0 9.0 12.3 9.6 10.3 11.4 7.3 2.8Ports&Shippinga 3.2 2.8 4.6 3.1 5.5 2.4 5.1 3.9 5.1 6.8Civil Aviation 1.0 2.0 2.1 2.0 3.0 3.0 3.6 4.3 5.8 10.7
F Communication & Broadcasting 8.3 10.6 14.1 13.1 20.9 17.3 19.6 21.6 27.2 25.3
G Science & Technology 3.4 3.2 3.3 3.1 6.5 3.1 3.6 4.2 4.5 4.8
H Social Services 40.3 35.5 37.0 37.2 54.3 38.0 44.2 51.7 64.4 79.1Education 8.7 8.2 8.7 8.6 14.2 8.8 9.9 10.6 16.3 8.8Health & Family Welfare 8.8 7.3 7.3 7.0 10.2 7.5 8.2 9.8 9.8 6.1Housing & Urban Development 5.8 5.2 5.3 4.9 7.6 4.8 6.8 6.2 10.6 5.3Water Supply & Sanitation 8.9 7.6 7.8 8.1 12.1 7.7 8.6 9.7 11.5 3.3Other Social Services 8.2 7.3 7.9 8.6 10.3 9.2 10.7 15.4 16.2 55.6
I Others 3.3 6.2 5.4 3.9 4.6 5.9 4.1 4.7 12.4 10.2
J TOTAL 245.4 235.9 258.9 234.1 313.8 244.3 278.0 291.3 333.2 379.1
Memo Item: Investment Deflator 146.7 187.2 237.6 276.6 276.6 298.2 316.8 337.0 360.0 385.4
a. Covers Major and Minor ports, Shipping, Lighthouses and Inland Water.
Source: Planning Commission.
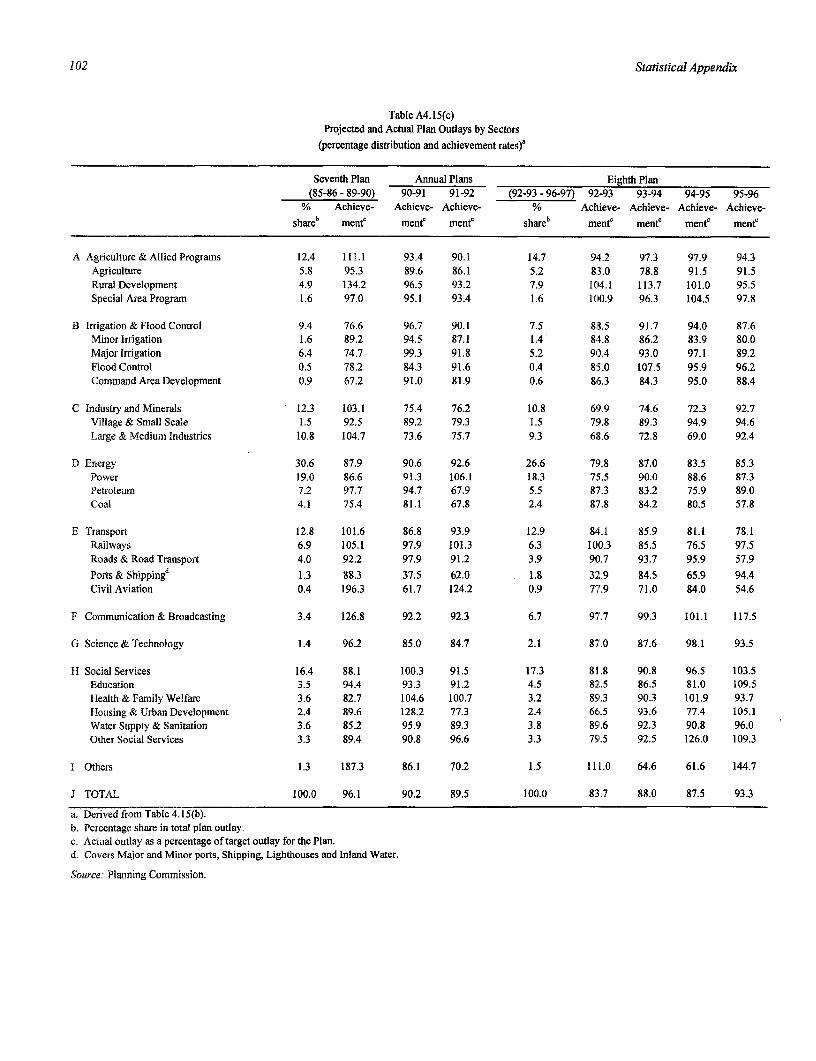
102 Statistical Appendix
Table A4.15(c)Projected and Actual Plan Outlays by Sectors
(percentage distribution and achievement rates)'
Seventh Plan Annual Plans Eighth Plan(85-86 - 89-90) 90-91 91-92 (92-93 - 96-97) 92-93 93-94 94-95 95-96
% Achieve- Achieve- Achieve- % Achieve- Achieve- Achieve- Achieve-
shareb ment' ment ment' shareb mente ment' ment ment
A Agriculture& Allied Programs 12.4 111.1 93.4 90.1 14.7 94.2 97.3 97.9 94.3Agriculture 5.8 95.3 89.6 86.1 5.2 83.0 78.8 91.5 91.5Rural Development 4.9 134.2 96.5 93.2 7.9 104.1 113.7 101.0 95.5Special Area Program 1.6 97.0 95.1 93.4 1.6 100.9 96.3 104.5 97.8
B Irrigation & Flood Control 9.4 76.6 96.7 90.1 7.5 88.5 91.7 94.0 87.6Minor Irrigation 1.6 89.2 94.5 87.1 1.4 84.8 86.2 83.9 80.0Major Irrigation 6.4 74.7 99.3 91.8 5.2 90.4 93.0 97.1 89.2Flood Control 0.5 78.2 84.3 91.6 0.4 85.0 107.5 95.9 96.2Commanid Area Development 0.9 67.2 91.0 81.9 0.6 86.3 84.3 95.0 88.4
C Industry and Minerals 12.3 103.1 75.4 76.2 10.8 69.9 74.6 72.3 92.7Village & Small Scale 1.5 92.5 89.2 79.3 1.5 79.8 89.3 94.9 94.6Large & Medium Industries 10.8 104.7 73.6 75.7 9.3 68.6 72.8 69.0 92.4
D Energy 30.6 87.9 90.6 92.6 26.6 79.8 87.0 83.5 85.3Power 19.0 86.6 91.3 106.1 18.3 75.5 90.0 88.6 87.3Petroleum 7.2 97.7 94.7 67.9 5.5 87.3 83.2 75.9 89.0Coal 4.1 75.4 81.1 67.8 2.4 87.8 84.2 80.5 57.8
E Transport 12.8 101.6 86.8 93.9 12.9 84.1 85.9 81.1 78.1Railways 6.9 105.1 97.9 101.3 6.3 100.3 85.5 76.5 97.5Roads & Road Transport 4.0 92.2 97.9 91.2 3.9 9(1.7 93.7 95.9 57.9
Ports & Shipping, 1.3 88.3 37.5 62.0 1.8 32.9 84.5 65.9 94.4Civil Aviation 0.4 196.3 61.7 124.2 0.9 77.9 71.0 84.0 54.6
F Communication & Broadcasting 3.4 126.8 92.2 92.3 6.7 97.7 99.3 101.1 117.5
G Science & Technology 1.4 96.2 85.0 84.7 2.1 87.0 87.6 98.1 93.5
H Social Services 16.4 88.1 100.3 91.5 17.3 81.8 90.8 96.5 103.5Education 3.5 94.4 93.3 91.2 4.5 82.5 86.5 81.0 109.5Health & Family Welfare 3.6 82.7 104.6 100.7 3.2 89.3 90.3 101.9 93.7Housing & Urban Development 2.4 89.6 128.2 77.3 2.4 66.5 93.6 77.4 105.1Water Supply & Sanitation 3.6 85.2 95.9 89.3 3.8 89.6 92.3 90.8 96.0Other Social Services 3.3 89.4 90.8 96.6 3.3 79.5 92.5 126.0 109.3
I Others 1.3 187.3 86.1 70.2 1.5 111.0 64.6 61.6 144.7
J TOTAL 100.0 96.1 90.2 89.5 100.0 83.7 88.0 87.5 93.3
a. Derived from Table 4.15(b).b. Percentage share in total plan outlay.c. Actual outlay as a percentage of target outlay for the Plan.d. Covers Major and Minor ports, Shipping, Lighthouses and Inland Water.
Source: Planning Commission.
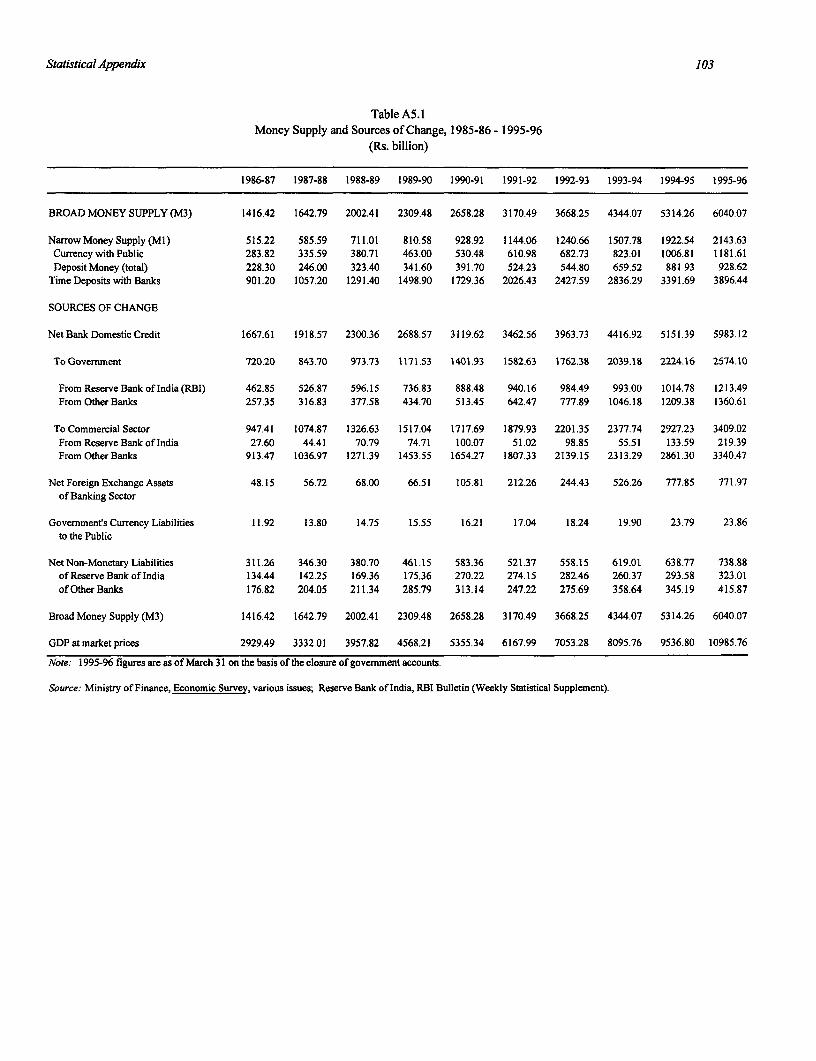
Statistical Appendix 103
Table A5.1Money Supply and Sources of Change, 1985-86 - 1995-96
(Rs. billion)
1986-87 1987-88 1988-89 1989-90 1990-91 1991-92 1992-93 1993-94 1994-95 1995-96
BROAD MONEY SUPPLY (M3) 1416.42 1642.79 2002.41 2309.48 2658.28 3170.49 3668.25 4344.07 5314.26 6040.07
NarrowMoney Supply (MI) 515.22 585.59 711.01 810.58 928.92 1144.06 1240.66 1507.78 1922.54 2143.63Currency with Public 283.82 335.59 380.71 463.00 530.48 610.98 682.73 823.01 1006.81 1181.61DepositMoney(total) 228.30 246.00 323.40 341.60 391.70 524.23 544.80 659.52 881.93 928.62
Time Deposits with Banks 901.20 1057.20 1291.40 1498.90 1729.36 2026.43 2427.59 2836.29 3391.69 3896.44
SOURCES OF CHANGE
NetBank Domestic Credit 1667.61 1918.57 2300.36 2688.57 3119.62 3462.56 3963.73 4416.92 5151.39 5983.12
ToGovermnent 720.20 843.70 973.73 1171.53 1401.93 1582.63 1762.38 2039.18 2224.16 2574.10
From Reserve Bank of India(RBI) 462.85 526.87 596.15 736.83 888.48 940.16 984.49 993.00 1014.78 1213.49From Other Banks 257.35 316.83 377.58 434.70 513.45 642.47 777.89 1046.18 1209.38 1360.61
To Commercial Sector 947.41 1074.87 1326.63 1517.04 1717.69 1879.93 2201.35 2377.74 2927.23 3409.02From Reserve Bank of India 27.60 44.41 70.79 74.71 100.07 51.02 98.85 55.51 133.59 219.39From OtherBanks 913.47 1036.97 1271.39 1453.55 1654.27 1807.33 2139.15 2313.29 2861.30 3340.47
NetForeign Exchange Assets 48.15 56.72 68.00 66.51 105.81 212.26 244.43 526.26 777.85 771.97of Banking Sector
Governmenfs Currency Liabilities 11.92 13.80 14.75 15.55 16.21 17.04 18.24 19.90 23.79 23.86to the Public
NetNon-Monetary Liabilities 311.26 346.30 380.70 461.15 583.36 521.37 558.15 619.01 638.77 738.88of ReserveBankofIndia 134.44 142.25 169.36 175.36 270.22 274.15 282.46 260.37 293.58 323.01of Other Banks 176.82 204.05 211.34 285.79 313.14 247.22 275.69 358.64 345.19 415.87
Broad Money Supply (M3) 1416.42 1642.79 2002.41 2309.48 2658.28 3170.49 3668.25 4344.07 5314.26 6040.07
GDP at market prices 2929.49 3332.01 3957.82 4568.21 5355.34 6167.99 7053.28 8095.76 9536.80 10985.76
Note: 1995-96 figures are as of March 31 on the basis of the closure of govermment accounts.
Source: Ministry of Finance, Economic Survev, various issues; Reserve Bank of India, RBI Bulletin (Weekly Statistical Supplement).
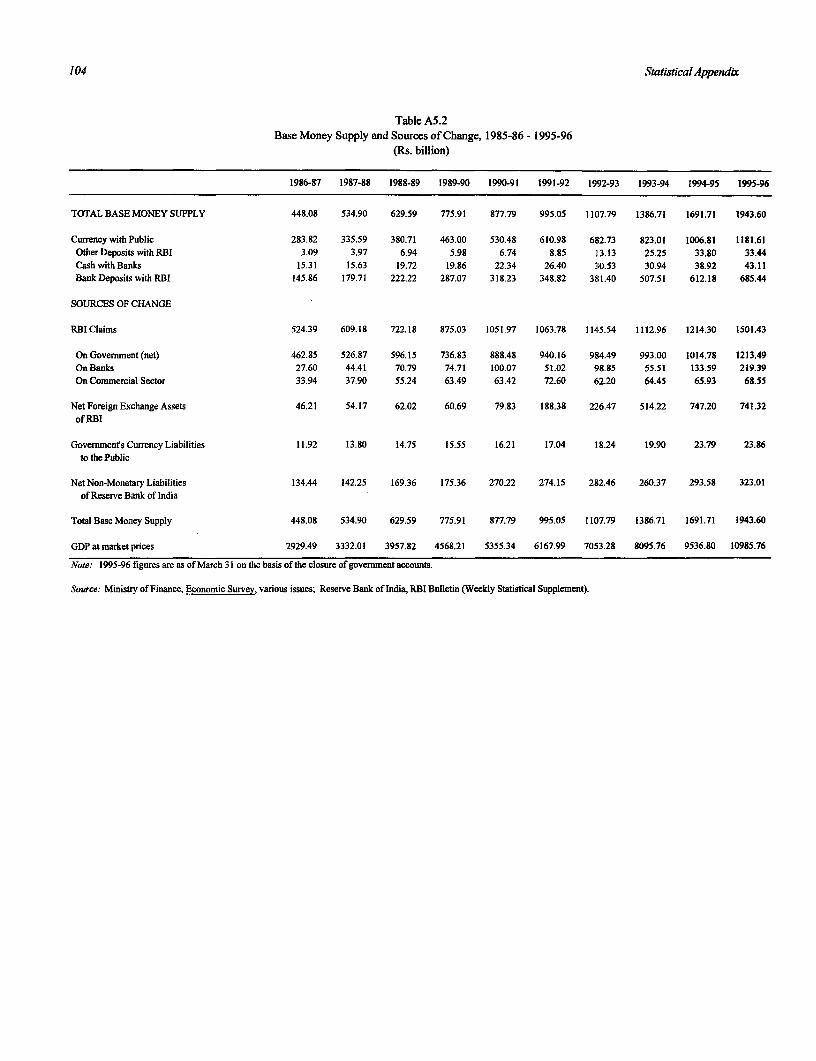
104 Statistical Appendbc
Table A5.2Base Money Supply and Sources of Change, 1985-86 - 1995-96
(Rs. billion)
1986-87 1987-88 1988-89 1989-90 1990-91 1991-92 1992-93 1993-94 1994-95 1995-96
TOTAL BASE MONEY SUPPLY 448.08 534.90 629.59 775.91 877.79 995.05 1107.79 1386.71 1691.71 1943.60
CurrencywithPublic 283.82 335.59 380.71 463.00 530.48 610.98 682.73 823.01 1006.81 1181.61OtherDepositswithRBI 3.09 3.97 6.94 5.98 6.74 8.85 13.13 25.25 33.80 33.44
Cash with Banks 15.31 15.63 19.72 19.86 22.34 26.40 30.53 30.94 38.92 43.11BankDepositswithRBI 145.86 179.71 222.22 287.07 318.23 348.82 381.40 507.51 612.18 685.44
SOURCES OF CHANGE
RBIClaims 524.39 609.18 722.18 875.03 1051.97 1063.78 1145.54 1112.96 1214.30 1501.43
On Govemment (net) 462.85 526.87 596.15 736.83 888.48 940.16 9S4.49 993.00 1014.78 1213.49On Banks 27.60 44.41 70.79 74.71 100.07 51.02 98.85 55.51 133.59 219.39
On Commercial Sector 33.94 37.90 55.24 63.49 63.42 72.60 62.20 64.45 65.93 68.55
Net Foreign Exchange Assets 46.21 54.17 62.02 60.69 79.83 188.38 226.47 514.22 747.20 741.32
of RBI
Govemments Currency Liabilities 11.92 13.80 14.75 15.55 16.21 17.04 18.24 19.90 23.79 23.86
to the Public
Net Non-Monetary Liabilities 134.44 142.25 169.36 175.36 270.22 274.15 282.46 260.37 293.58 323.01of Reserve Bank of India
Total Base Money Supply 448.08 534.90 629.59 775.91 877.79 995.05 1107.79 1386.71 1691.71 1943.60
GDP at market prices 2929.49 3332.01 3957.82 4568.21 5355.34 6167.99 7053.28 8095.76 9536.80 10985.76
Note: 1995-96 figuresareasofMarch31onthebasisofthelosureofgovernentaccounts.
Source: Ministry of Finance, Economic Survey various issues; Reserve Bank of India, RBI Bulletin (Weekly Statistical Supplement).
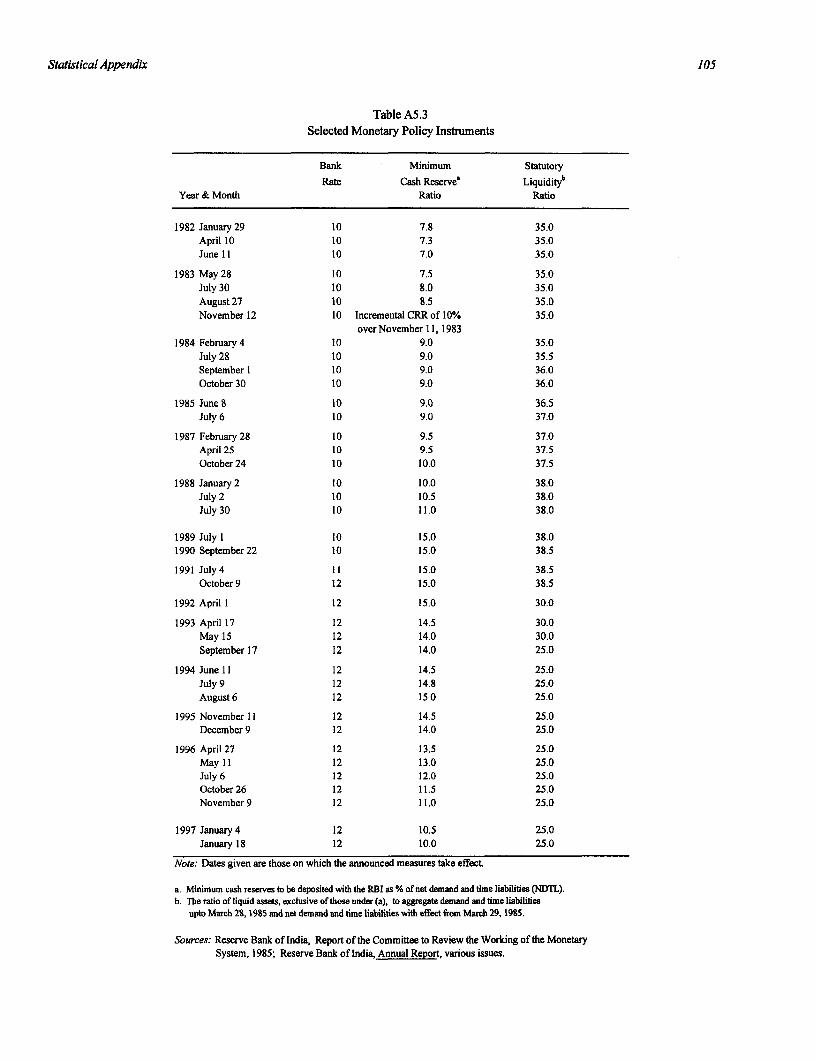
Statistical Appendix 105
Table A5.3Selected Monetary Policy Instruments
Bank Minimum Statutory
Rate Cash Reserved LiquiditybYear & Month Ratio Ratio
1982 January 29 10 7.8 35.0April 10 10 7.3 35.0June 11 10 7.0 35.0
1983 May28 10 7.5 35.0July 30 10 8.0 35.0August 27 10 8.5 35.0November 12 10 Incremental CRR of 1O% 35.0
over November 11, 19831984 February 4 10 9.0 35.0
July 28 10 9.0 35.5September 1 10 9.0 36.0October 30 10 9.0 36.0
1985 June 8 10 9.0 36.5July 6 10 9.0 37.0
1987 February 28 10 9.5 37.0April 25 10 9.5 37.5October24 10 10.0 37.5
1988 January 2 10 10.0 38.0July 2 10 10.5 38.0July 30 10 11.0 38.0
1989 July 1 10 15.0 38.01990 September22 10 15.0 38.5
1991 July4 11 15.0 38.5October 9 12 15.0 38.5
1992 April 1 12 15.0 30.0
1993 April 17 12 14.5 30.0May 15 12 14.0 30.0September 17 12 14.0 25.0
1994 June 11 12 14.5 25.0July 9 12 14.8 25.0August 6 12 15.0 25.0
1995 November 11 12 14.5 25.0December 9 12 14.0 25.0
1996 April27 12 13.5 25.0May 11 12 13.0 25.0July 6 12 12.0 25.0October 26 12 11.5 25.0November 9 12 11.0 25.0
1997 January 4 12 10.5 25.0January 18 12 10.0 25.0
Note: Dates given are those on which the announced measures take effect
a. Minimum cash reserves to be deposited with the RBI as % of net demand and time liabilities (NDTL).b. The ratio of liquid assets, exclusive of those under (a), to aggregate demand and time liabilities
upto March 28, 1985 and net demand and time liabilities with effect fiom March 29, 19S5.
Sources: Reserve Bank of India, Report of the Committee to Review the Working of the MonetarySystem, 1985; Reserve Bank of India, Annual Report, various issues.
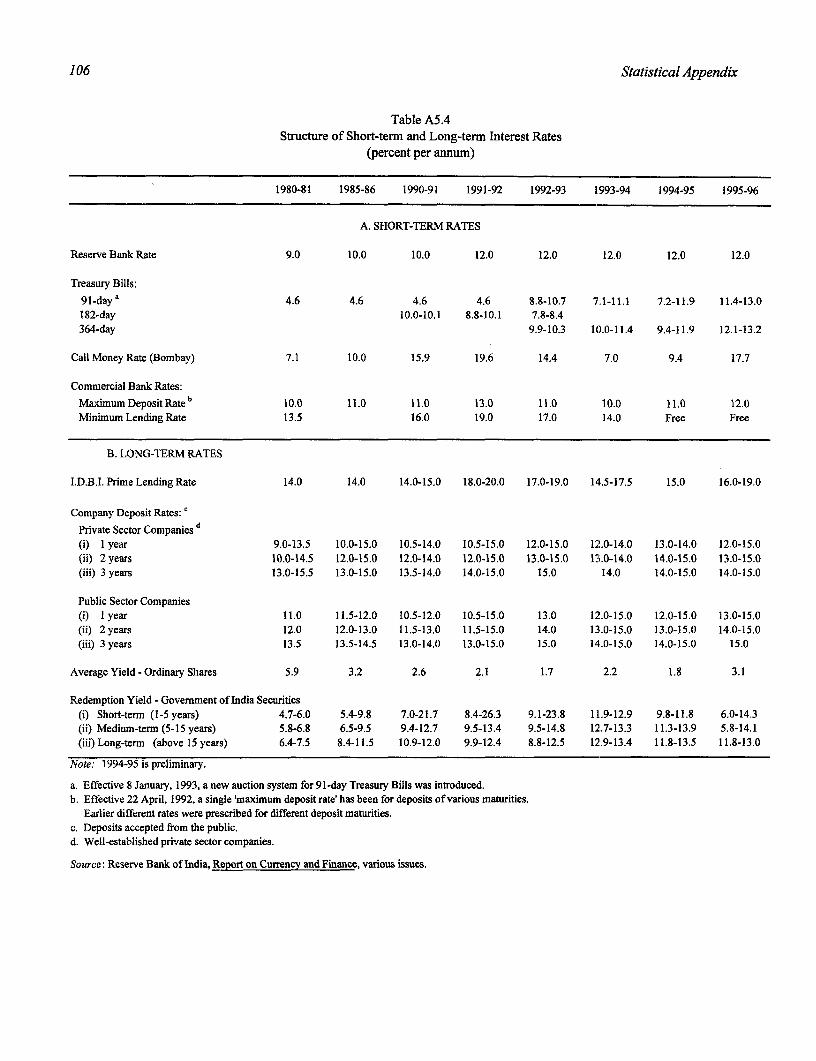
106 Statistical Appendix
Table A5.4Structure of Short-term and Long-term Interest Rates
(percent per annum)
1980-81 1985-86 1990-91 1991-92 1992-93 11993-94 1994-95 1995-96
A. SHORT-TERM RATES
Reserve Bank Rate 9.0 10.0 10.0 12.0 12.0 12.0 12.0 12.0
Treasury Bills:
91-daya 4.6 4.6 4.6 4.6 8.8-10.7 7.1-11.1 7.2-11.9 11.4-13.0182-day 10.0-10.1 8.8-10.1 7.8-8.4364-day 9.9-10.3 10.0-11.4 9.4-11.9 12.1-13.2
Call Money Rate (Bombay) 7.1 10.0 15.9 19.6 14.4 7.0 9.4 17.7
Commercial Bank Rates:MaximumDepositRateb 10.0 11.0 11.0 13.0 11.0 10.0 11.0 12.0Minimum Lending Rate 13.5 16.0 19.0 17.0 14.0 Free Free
B. LONG-TERM RATES
I.D.B.I. Prime Lending Rate 14.0 14.0 14.0-15.0 18.0-20.0 17.0-19.0 14.5-17.5 15.0 16.0-19.0
Company Deposit Rates: c
Private Sector Companies d(i) I year 9.0-13.5 10.0-15.0 10.5-14.0 10.5-15.0 12.0-15.0 12.0-14.0 13.0-14.0 12.0-15.0(ii) 2 years 10.0-14.5 12.0-15.0 12.0-14.0 12.0-15.0 13.0-15.0 13.0-14.0 14.0-15.0 13.0-15.0(iii) 3 years 13.0-15.5 13.0-15.0 13.5-14.0 14.0-15.0 15.0 14.0 14.0-15.0 14.0-15.0
Public Sector Companies(i) I year 11.0 11.5-12.0 10.5-12.0 10.5-15.0 13.0 12.0-15.0 12.0-15.0 13.0-15.0(ii) 2 years 12.0 12.0-13.0 11.5-13.0 11.5-15.0 14.0 13.0-15.0 13.0-15.0 14.0-15.0(iii) 3 years 13.5 13.5-14.5 13.0-14.0 13.0-15.0 15.0 14.0-15.0 14.0-15.0 15.0
Average Yield -Ordinary Shares 5.9 3.2 2.6 2.1 1.7 2.2 1.8 3.1
Redemption Yield - Govemment of India Securities(i) Short-term (1-5 years) 4.7-6.0 5.4-9.8 7.0-21.7 8.4-26.3 9.1-23.8 11.9-12.9 9.8-11.8 6.0-14.3(ii) Medium-term (5-15 years) 5.8-6.8 6.5-9.5 9.4-12.7 9.5-13.4 9.5-14.8 12.7-13.3 11.3-13.9 5.8-14.1(iii) Long-term (above 15 years) 6.4-7.5 8.4-11.5 10.9-12.0 9.9-12.4 8.8-12.5 12.9-13.4 11.8-13.5 11.8-13.0
Note: 1994-95 is preliminary.
a. Effective 8 January, 1993, a new auction system for 91-day Treasury Bills was introduced.b. Effective 22 April, 1992, a single 'maximum deposit rate' has been for deposits of various maturities.
Earlier different rates were prescribed for different deposit maturities.c. Deposits accepted from the public.d. Well-established private sector companies.
Source: Reserve Bank of India, Report on Currency and Finace, various issues.
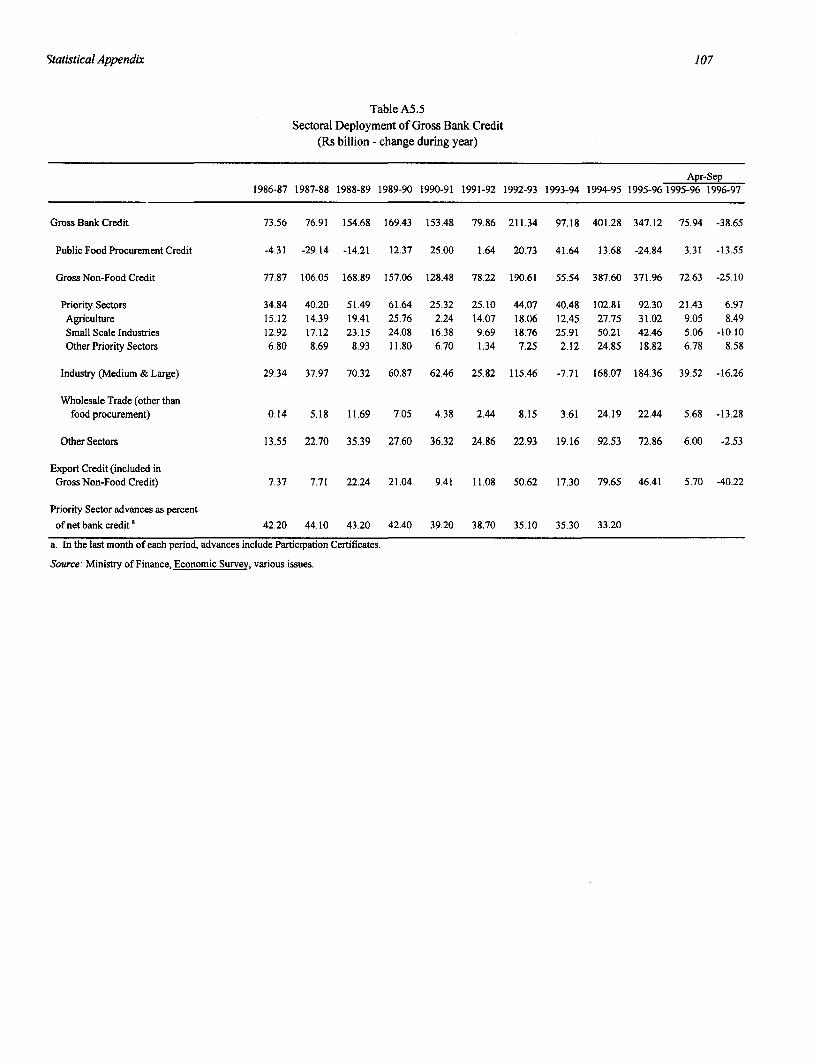
Statistical Appendix 107
Table A5.5Sectoral Deployment of Gross Bank Credit
(Rs billion - change during year)
Apr-Sep1986-87 1987-88 1988-89 1989-90 1990-91 1991-92 1992-93 1993-94 1994-95 1995-96 1995-96 1996-97
GrossBankCredit 73.56 76.91 154.68 169.43 153.48 79.86 211.34 97.18 401.28 347.12 75.94 -38.65
Public Food Procurement Credit -4.31 -29.14 -14.21 12.37 25.00 1.64 20.73 41.64 13.68 -24.84 3.31 -13.55
Gross Non-Food Credit 77.87 106.05 168.89 157.06 128.48 78.22 190.61 55.54 387.60 371.96 72.63 -25.10
Priority Sectors 34.84 40.20 51.49 61.64 25.32 25.10 44.07 40.48 102.81 92.30 21.43 6.97Agriculture 15.12 14.39 19.41 25.76 2.24 14.07 18.06 12.45 27.75 31.02 9.05 8.49Small Scale Industries 12.92 17.12 23.15 24.08 16.38 9.69 18.76 25.91 50.21 42.46 5.06 -10.10Other Priority Sectors 6.80 8.69 8.93 11.80 6.70 1.34 7.25 2.12 24.85 18.82 6.78 8.58
Industry(Medium& Large) 29.34 37.97 70.32 60.87 62.46 25.82 115.46 -7.71 168.07 184.36 39.52 -16.26
Wholesale Trade (other thanfood procurement) 0.14 5.18 11.69 7.05 4.38 2.44 8.15 3.61 24.19 22.44 5.68 -13.28
Other Sectors 13.55 22.70 35.39 27.60 36.32 24.86 22.93 19.16 92.53 72.86 6.00 -2.53
Export Credit (included inGross Non-Food Credit) 7.37 7.71 22.24 21.04 9.41 11.08 50.62 17.30 79.65 46.41 5.70 -40.22
Priority Sector advances as percent
of net bank credita 42.20 44.10 43.20 42.40 39.20 38.70 35.10 35.30 33.20
a. In the last month of each period, advances include Participation Certificates.
Source: Ministry of Finance, Economic Survey, various issues.
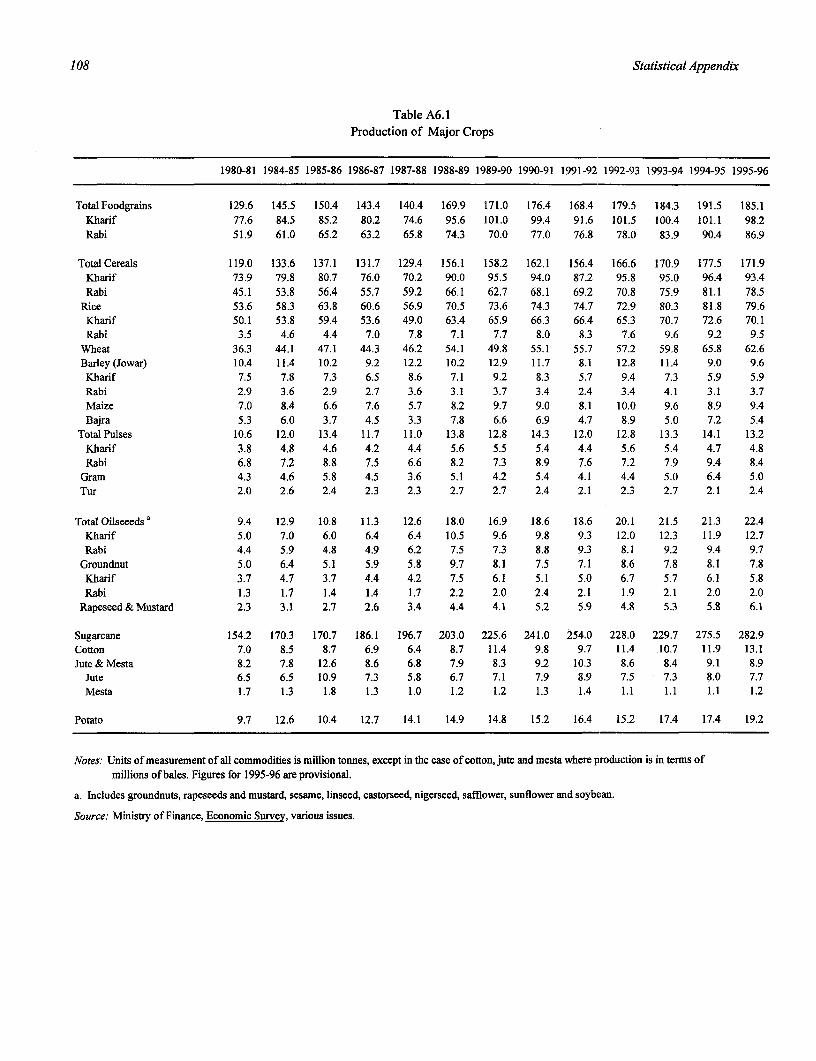
108 Statistical Appendix
Table A6.1
Production of Major Crops
1980-81 1984-85 1985-86 1986-87 1987-88 1988-89 1989-90 1990-91 1991-92 1992-93 1993-94 1994-95 1995-96
Total Foodgrains 129.6 145.5 150.4 143.4 140.4 169.9 171.0 176.4 168.4 179.5 184.3 191.5 185.1Kharif 77.6 84.5 85.2 80.2 74.6 95.6 101.0 99.4 91.6 101.5 100.4 101.1 98.2Rabi 51.9 61.0 65.2 63.2 65.8 74.3 70.0 77.0 76.8 78.0 83.9 90.4 86.9
Total Cereals 119.0 133.6 137.1 131.7 129.4 156.1 158.2 162.1 156.4 166.6 170.9 177.5 171.9Kharif 73.9 79.8 80.7 76.0 70.2 90.0 95.5 94.0 87.2 95.8 95.0 96.4 93.4Rabi 45.1 53.8 56.4 55.7 59.2 66.1 62.7 68.1 69.2 70.8 75.9 81.1 78.5
Rice 53.6 58.3 63.8 60.6 56.9 70.5 73.6 74.3 74.7 72.9 80.3 81.8 79.6Kharif 50.1 53.8 59.4 53.6 49.0 63.4 65.9 66.3 66.4 65.3 70.7 72.6 70.1Rabi 3.5 4.6 4.4 7.0 7.8 7.1 7.7 8.0 8.3 7.6 9.6 9.2 9.5
Wheat 36.3 44.1 47.1 44.3 46.2 54.1 49.8 55.1 55.7 57.2 59.8 65.8 62.6Barley (Jowar) 10.4 11.4 10.2 9.2 12.2 10.2 12.9 11.7 8.1 12.8 11.4 9.0 9.6Kharif 7.5 7.8 7.3 6.5 8.6 7.1 9.2 8.3 5.7 9.4 7.3 5.9 5.9Rabi 2.9 3.6 2.9 2.7 3.6 3.1 3.7 3.4 2.4 3.4 4.1 3.1 3.7Maize 7.0 8.4 6.6 7.6 5.7 8.2 9.7 9.0 8.1 10.0 9.6 8.9 9.4Bajra 5.3 6.0 3.7 4.5 3.3 7.8 6.6 6.9 4.7 8.9 5.0 7.2 5.4
Total Pulses 10.6 12.0 13.4 11.7 11.0 13.8 12.8 14.3 12.0 12.8 13.3 14.1 13.2Kharif 3.8 4.8 4.6 4.2 4.4 5.6 5.5 5.4 4.4 5.6 5.4 4.7 4.8Rabi 6.8 7.2 8.8 7.5 6.6 8.2 7.3 8.9 7.6 7.2 7.9 9.4 8.4
Gram 4.3 4.6 5.8 4.5 3.6 5.1 4.2 5.4 4.1 4.4 5.0 6.4 5.0Tur 2.0 2.6 2.4 2.3 2.3 2.7 2.7 2.4 2.1 2.3 2.7 2.1 2.4
Total Oilseeeds a 9.4 12.9 10.8 11.3 12.6 18.0 16.9 18.6 18.6 20.1 21.5 21.3 22.4Kharif 5.0 7.0 6.0 6.4 6.4 10.5 9.6 9.8 9.3 12.0 12.3 11.9 12.7Rabi 4.4 5.9 4.8 4.9 6.2 7.5 7.3 8.8 9.3 8.1 9.2 9.4 9.7
Groundnut 5.0 6.4 5.1 5.9 5.8 9.7 8.1 7.5 7.1 8.6 7.8 8.1 7.8Kharif 3.7 4.7 3.7 4.4 4.2 7.5 6.1 5.1 5.0 6.7 5.7 6.1 5.8Rabi 1.3 1.7 1.4 1.4 1.7 2.2 2.0 2.4 2.1 1.9 2.1 2.0 2.0
Rapeseed & Mustard 2.3 3.1 2.7 2.6 3.4 4.4 4.1 5.2 5.9 4.8 5.3 5.8 6.1
Sugarcane 154.2 170.3 170.7 186.1 196.7 203.0 225.6 241.0 254.0 228.0 229.7 275.5 282.9Cotton 7.0 8.5 8.7 6.9 6.4 8.7 11.4 9.8 9.7 11.4 10.7 11.9 13.1Jute & Mesta 8.2 7.8 12.6 8.6 6.8 7.9 8.3 9.2 10.3 8.6 8.4 9.1 8.9
Jute 6.5 6.5 10.9 7.3 5.8 6.7 7.1 7.9 8.9 7.5 7.3 8.0 7.7Mesta 1.7 1.3 1.8 1.3 1.0 1.2 1.2 1.3 1.4 1.1 1.1 1.1 1.2
Potato 9.7 12.6 10.4 12.7 14.1 14.9 14.8 15.2 16.4 15.2 17.4 17.4 19.2
Notes: Units of measurement of all commodities is million tonnes, except in the case of cotton, jute and mesta where production is in terms ofmillions of bales. Figures for 1995-96 are provisional.
a. Includes groundnuts, rapeseeds and mustard, sesame, linseed, castorseed, nigerseed, safflower, sunflower and soybean.
Source: Ministry of Finance, Economic Survev, various issues.
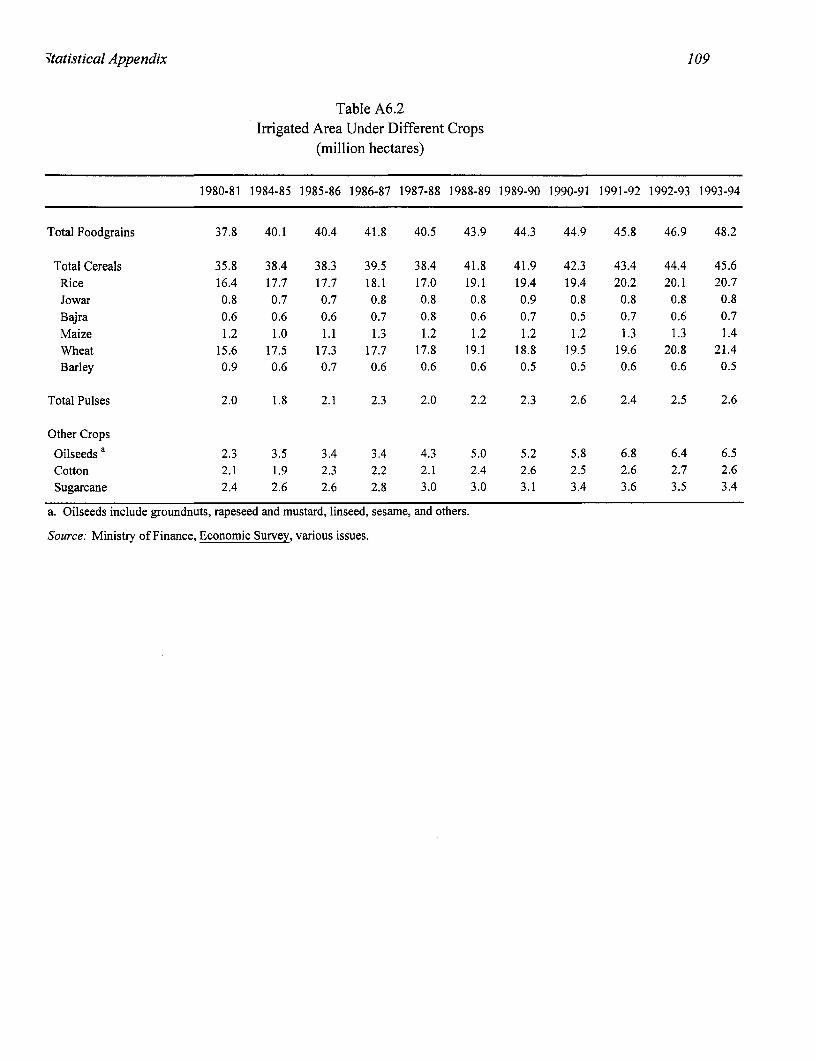
*tatistical Appendix 109
Table A6.2Irrigated Area Under Different Crops
(million hectares)
1980-81 1984-85 1985-86 1986-87 1987-88 1988-89 1989-90 1990-91 1991-92 1992-93 1993-94
Total Foodgrains 37.8 40.1 40.4 41.8 40.5 43.9 44.3 44.9 45.8 46.9 48.2
Total Cereals 35.8 38.4 38.3 39.5 38.4 41.8 41.9 42.3 43.4 44.4 45.6Rice 16.4 17.7 17.7 18.1 17.0 19.1 19.4 19.4 20.2 20.1 20.7Jowar 0.8 0.7 0.7 0.8 0.8 0.8 0.9 0.8 0.8 0.8 0.8Bajra 0.6 0.6 0.6 0.7 0.8 0.6 0.7 0.5 0.7 0.6 0.7Maize 1.2 1.0 1.1 1.3 1.2 1.2 1.2 1.2 1.3 1.3 1.4Wheat 15.6 17.5 17.3 17.7 17.8 19.1 18.8 19.5 19.6 20.8 21.4Barley 0.9 0.6 0.7 0.6 0.6 0.6 0.5 0.5 0.6 0.6 0.5
Total Pulses 2.0 1.8 2.1 2.3 2.0 2.2 2.3 2.6 2.4 2.5 2.6
Other Crops
Oilseeds a 2.3 3.5 3.4 3.4 4.3 5.0 5.2 5.8 6.8 6.4 6.5Cotton 2.1 1.9 2.3 2.2 2.1 2.4 2.6 2.5 2.6 2.7 2.6Sugarcane 2.4 2.6 2.6 2.8 3.0 3.0 3.1 3.4 3.6 3.5 3.4
a. Oilseeds include groundnuts, rapeseed and mustard, linseed, sesame, and others.
Source: Ministry of Finance, Economic Survey, various issues.
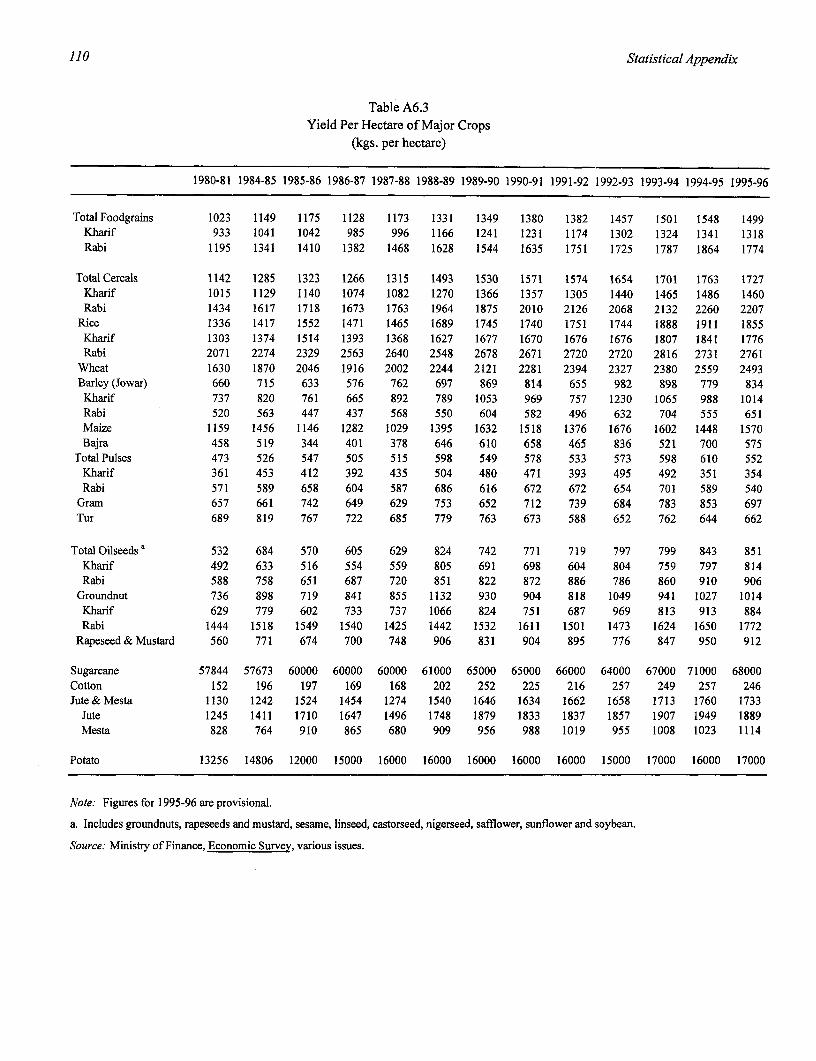
110 Statistical Appendix
Table A6.3Yield Per Hectare of Major Crops
(kgs. per hectare)
1980-81 1984-85 1985-86 1986-87 1987-88 1988-89 1989-90 1990-91 1991-92 1992-93 1993-94 1994-95 1995-96
TotalFoodgrains 1023 1149 1175 1128 1173 1331 1349 1380 1382 1457 1501 1548 1499Kharif 933 1041 1042 985 996 1166 1241 1231 1174 1302 1324 1341 1318Rabi 1195 1341 1410 1382 1468 1628 1544 1635 1751 1725 1787 1864 1774
Total Cereals 1142 1285 1323 1266 1315 1493 1530 1571 1574 1654 1701 1763 1727Kharif 1015 1129 1140 1074 1082 1270 1366 1357 1305 1440 1465 1486 1460Rabi 1434 1617 1718 1673 1763 1964 1875 2010 2126 2068 2132 2260 2207
Rice 1336 1417 1552 1471 1465 1689 1745 1740 1751 1744 1888 1911 1855Kharif 1303 1374 1514 1393 1368 1627 1677 1670 1676 1676 1807 1841 1776Rabi 2071 2274 2329 2563 2640 2548 2678 2671 2720 2720 2816 2731 2761
Wheat 1630 1870 2046 1916 2002 2244 2121 2281 2394 2327 2380 2559 2493Barley (Jowar) 660 715 633 576 762 697 869 814 655 982 898 779 834Kharif 737 820 761 665 892 789 1053 969 757 1230 1065 988 1014Rabi 520 563 447 437 568 550 604 582 496 632 704 555 651Maize 1159 1456 1146 1282 1029 1395 1632 1518 1376 1676 1602 1448 1570Bajra 458 519 344 401 378 646 610 658 465 836 521 700 575
Total Pulses 473 526 547 505 515 598 549 578 533 573 598 610 552Kharif 361 453 412 392 435 504 480 471 393 495 492 351 354Rabi 571 589 658 604 587 686 616 672 672 654 701 589 540
Gram 657 661 742 649 629 753 652 712 739 684 783 853 697Tur 689 819 767 722 685 779 763 673 588 652 762 644 662
Total Oilseedsa 532 684 570 605 629 824 742 771 719 797 799 843 851Kharif 492 633 516 554 559 805 691 698 604 804 759 797 814Rabi 588 758 651 687 720 851 822 872 886 786 860 910 906
Groundnut 736 898 719 841 855 1132 930 904 818 1049 941 1027 1014Kharif 629 779 602 733 737 1066 824 751 687 969 813 913 884Rabi 1444 1518 1549 1540 1425 1442 1532 1611 1501 1473 1624 1650 1772
Rapeseed & Mustard 560 771 674 700 748 906 831 904 895 776 847 950 912
Sugarcane 57844 57673 60000 60000 60000 61000 65000 65000 66000 64000 67000 71000 68000Cotton 152 196 197 169 168 202 252 225 216 257 249 257 246Jute&Mesta 1130 1242 1524 1454 1274 1540 1646 1634 1662 1658 1713 1760 1733
Jute 1245 1411 1710 1647 1496 1748 1879 1833 1837 1857 1907 1949 1889Mesta 828 764 910 865 680 909 956 988 1019 955 1008 1023 1114
Potato 13256 14806 12000 15000 16000 16000 16000 16000 16000 15000 17000 16000 17000
Note: Figures for 1995-96 are provisional.
a Includes groundnuts, rapeseeds and mustard, sesame, linseed, castorseed, nigerseed, safflower, sunflower and soybean.
Source: Ministry of Finance, Economic Survey, various issues.
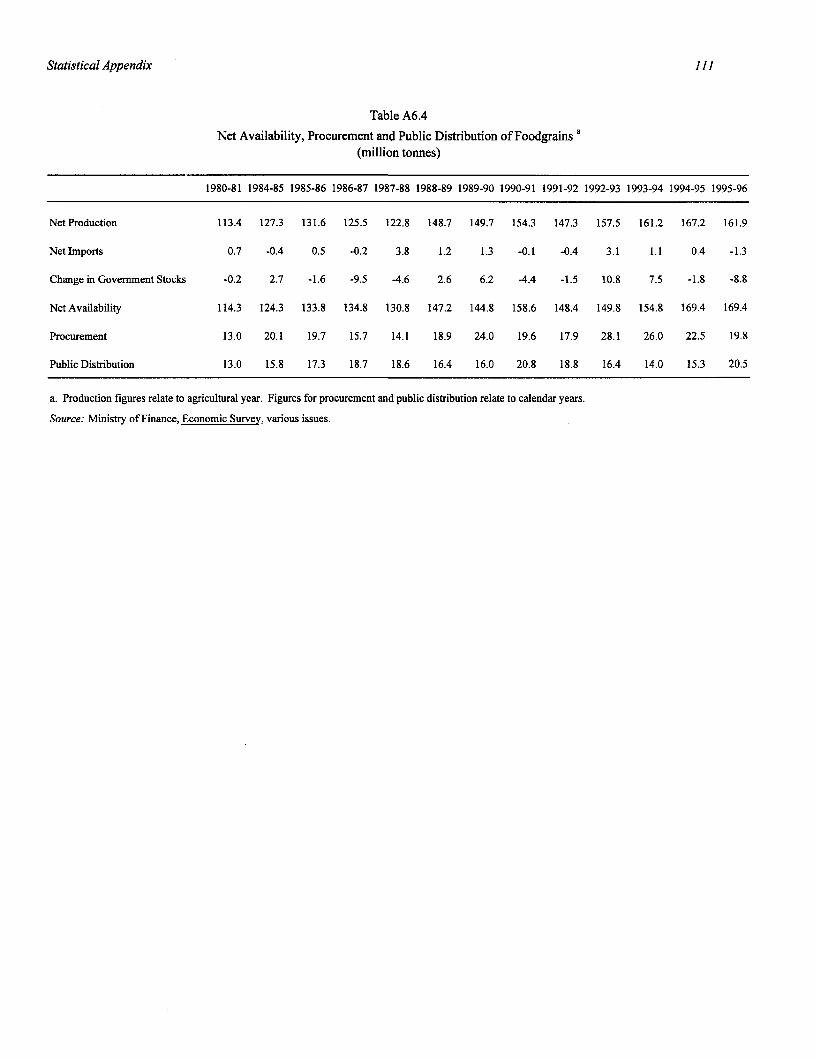
Statistical Appendix 111
Table A6.4
Net Availability, Procurement and Public Distribution of Foodgrains a(million tonnes)
1980-81 1984-85 1985-86 1986-87 1987-88 1988-89 1989-90 1990-91 1991-92 1992-93 1993-94 1994-95 1995-96
Net Production 113.4 127.3 131.6 125.5 122.8 148.7 149.7 154.3 147.3 157.5 161.2 167.2 161.9
NetImports 0.7 -0.4 0.5 -0.2 3.8 1.2 1.3 -0.1 -0.4 3.1 1.1 0.4 -1.3
Change in Government Stocks -0.2 2.7 -1.6 -9.5 -4.6 2.6 6.2 -4.4 -1.5 10.8 7.5 -1.8 -8.8
Net Availability 114.3 124.3 133.8 134.8 130.8 147.2 144.8 158.6 148.4 149.8 154.8 169.4 169.4
Procurement 13.0 20.1 19.7 15.7 14.1 18.9 24.0 19.6 17.9 28.1 26.0 22.5 19.8
Public Distribution 13.0 15.8 17.3 18.7 18.6 16.4 16.0 20.8 18.8 16.4 14.0 15.3 20.5
a. Production figures relate to agricultural year. Figures for procurement and public distribution relate to calendar years.
Source: Ministry of Finance, Economic Survey, various issues.
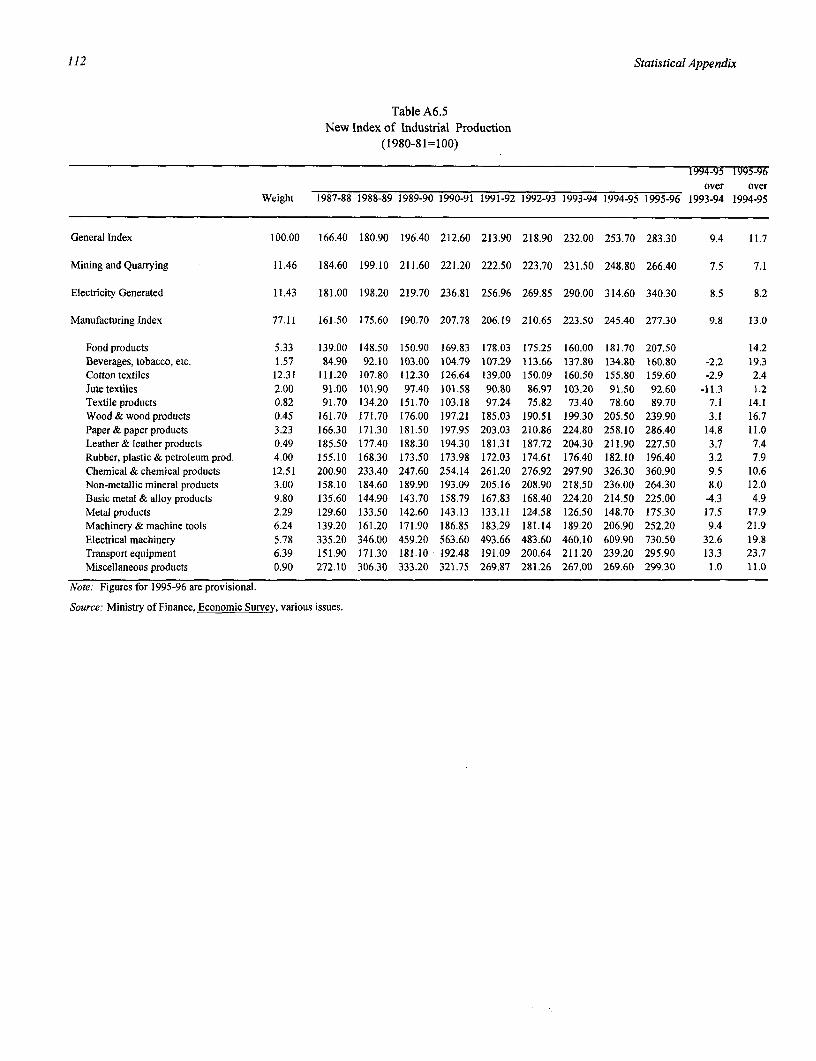
112 Statistical Appendix
Table A6.5New Index of Industrial Production
(1980-81=100)
1994-95 1995-96over over
Weight 1987-88 1988-89 1989-90 1990-91 1991-92 1992-93 1993-94 1994-95 1995-96 1993-94 1994-95
General Index 100.00 166.40 180.90 196.40 212.60 213.90 218.90 232.00 253.70 283.30 9.4 11.7
MiningandQuarrying 11.46 184.60 199.10 211.60 221.20 222.50 223.70 231.50 248.80 266.40 7.5 7.1
Electricity,Generated 11.43 181.00 198.20 219.70 236.81 256.96 269.85 290.00 314.60 340.30 8.5 8.2
Manufacturing Index 77.11 161.50 175.60 190.70 207.78 206.19 210.65 223.50 245.40 277.30 9.8 13.0
Food products 5.33 139.00 148.50 150.90 169.83 178.03 175.25 160.00 181.70 207.50 14.2Beverages, tobacco, etc. 1.57 84.90 92.10 103.00 104.79 107.29 113.66 137.80 134.80 160.80 -2.2 19.3Cotton textiles 12.31 111.20 107.80 112.30 126.64 139.00 150.09 160.50 155.80 159.60 -2.9 2.4Jute textiles 2.00 91.00 101.90 97.40 101.58 90.80 86.97 103.20 91.50 92.60 -11.3 1.2Textile products 0.82 91.70 134.20 151.70 103.18 97.24 75.82 73.40 78.60 89.70 7.1 14.1Wood & wood products 0.45 161.70 171.70 176.00 197.21 185.03 190.51 199.30 205.50 239.90 3.1 16.7Paper&paperproducts 3.23 166.30 171.30 181.50 197.95 203.03 210.86 224.80 258.10 286.40 14.8 11.0Leather& leather products 0.49 185.50 177.40 188.30 194.30 181.31 187.72 204.30 211.90 227.50 3.7 7.4Rubber, plastic & petroleum prod. 4.00 155.10 168.30 173.50 173.98 172.03 174.61 176.40 182.10 196.40 3.2 7.9Chemical & chemical products 12.51 200.90 233.40 247.60 254.14 261.20 276.92 297.90 326.30 360.90 9.5 10.6Non-metallic mineral products 3.00 158.10 184.60 189.90 193.09 205.16 208.90 218.50 236.00 264.30 8.0 12.0Basic metal & alloy products 9.80 135.60 144.90 143.70 158.79 167.83 168.40 224.20 214.50 225.00 -4.3 4.9Metal products 2.29 129.60 133.50 142.60 143.13 133.11 124.58 126.50 148.70 175.30 17.5 17.9Machinery & machine tools 6.24 139.20 161.20 171.90 186.85 183.29 181.14 189.20 206.90 252.20 9.4 21.9Electrical machinery 5.78 335.20 346.00 459.20 563.60 493.66 483.60 460.10 609.90 730.50 32.6 19.8Transport equipment 6.39 151.90 171.30 181.10 192.48 191.09 200.64 211.20 239.20 295.90 13.3 23.7Miscellaneous products 0.90 272.10 306.30 333.20 321.75 269.87 281.26 267.00 269.60 299.30 1.0 11.0
Note: Figures for 1995-96 are provisional.
Source: Ministry of Finance, Economic Survey, various issues.
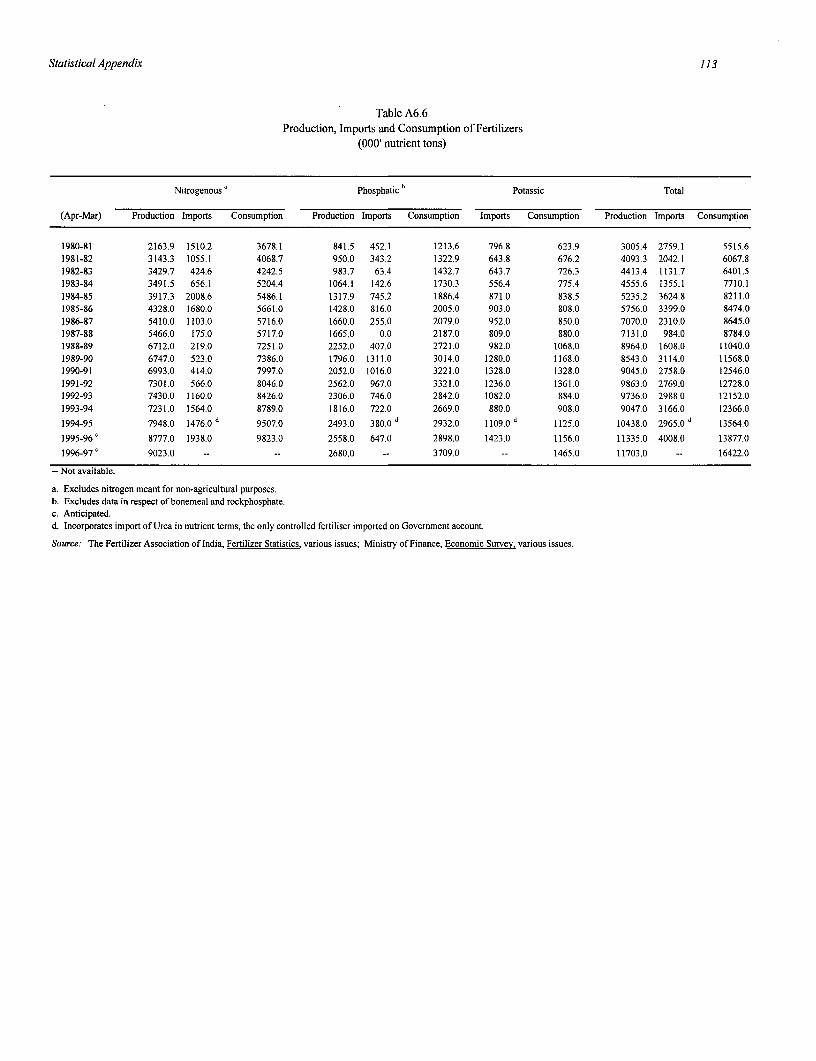
Statistical Appendix 113
Table A6.6Production, Imports and Consumption of Fertilizers
(000' nutrient tons)
Nitrogenous Phosphatic Potassic Total
(Apr-Mar) Production Imports Consumption Production Imports Consumption Imports Consumption Production Imports Consumption
1980-81 2163.9 1510.2 3678.1 841.5 452.1 1213.6 796.8 623.9 3005.4 2759.1 5515.61981-82 3143.3 1055.1 4068.7 950.0 343.2 1322.9 643.8 676.2 4093.3 2042.1 6067.81982-83 3429.7 424.6 4242.5 983.7 63.4 1432.7 643.7 726.3 4413.4 1131.7 6401.51983-84 3491.5 656.1 5204.4 1064.1 142.6 1730.3 556.4 775.4 4555.6 1355.1 7710.11984-85 3917.3 2008.6 5486.1 1317.9 745.2 1886.4 871.0 838.5 5235.2 3624.8 8211.01985-86 4328.0 1680.0 5661.0 1428.0 816.0 2005.0 903.0 808.0 5756.0 3399.0 8474.01986-87 5410.0 1103.0 5716.0 1660.0 255.0 2079.0 952.0 850.0 7070.0 2310.0 8645.01987-88 5466.0 175.0 5717.0 1665.0 0.0 2187.0 809.0 880.0 7131.0 984.0 8784.01988-89 6712.0 219.0 7251.0 2252.0 407.0 2721.0 982.0 1068.0 8964.0 1608.0 11040.01989-90 6747.0 523.0 7386.0 1796.0 1311.0 3014.0 1280.0 1168.0 8543.0 3114.0 11568.01990-91 6993.0 414.0 7997.0 2052.0 1016.0 3221.0 1328.0 1328.0 9045.0 2758.0 12546.01991-92 7301.0 566.0 8046.0 2562.0 967.0 3321.0 1236.0 1361.0 9863.0 2769.0 12728.01992-93 7430.0 1160.0 8426.0 2306.0 746.0 2842.0 1082.0 884.0 9736.0 2988.0 12152.01993-94 7231.0 1564.0 8789.0 1816.0 722.0 2669.0 880.0 908.0 9047.0 3166.0 12366.0
1994-95 7948.0 1476.0 9507.0 2493.0 380.0 2932.0 1109.0 1125.0 10438.0 2965.0 13564.0
1995-96C 8777.0 1938.0 9823.0 2558.0 647.0 2898.0 1423.0 1156.0 11335.0 4008.0 13877.0
1996-97' 9023.0 -- -- 2680.0 -- 3709.0 -- 1465.0 11703.0 -- 16422.0
-- Not available.
a. Excludes nitrogen meant for non-agricultural purposes.b. Excludes data in respect of bonemeal and rockphosphate.c. Anticipated.d. Incorporates import of Urea in nutrient terms, the only controlled fertiliser imported on Govemment account.
Source: The Fertilizer Association of India, Fertilizer Statistics various issues; Ministry of Finance, Economic Survey, various issues.
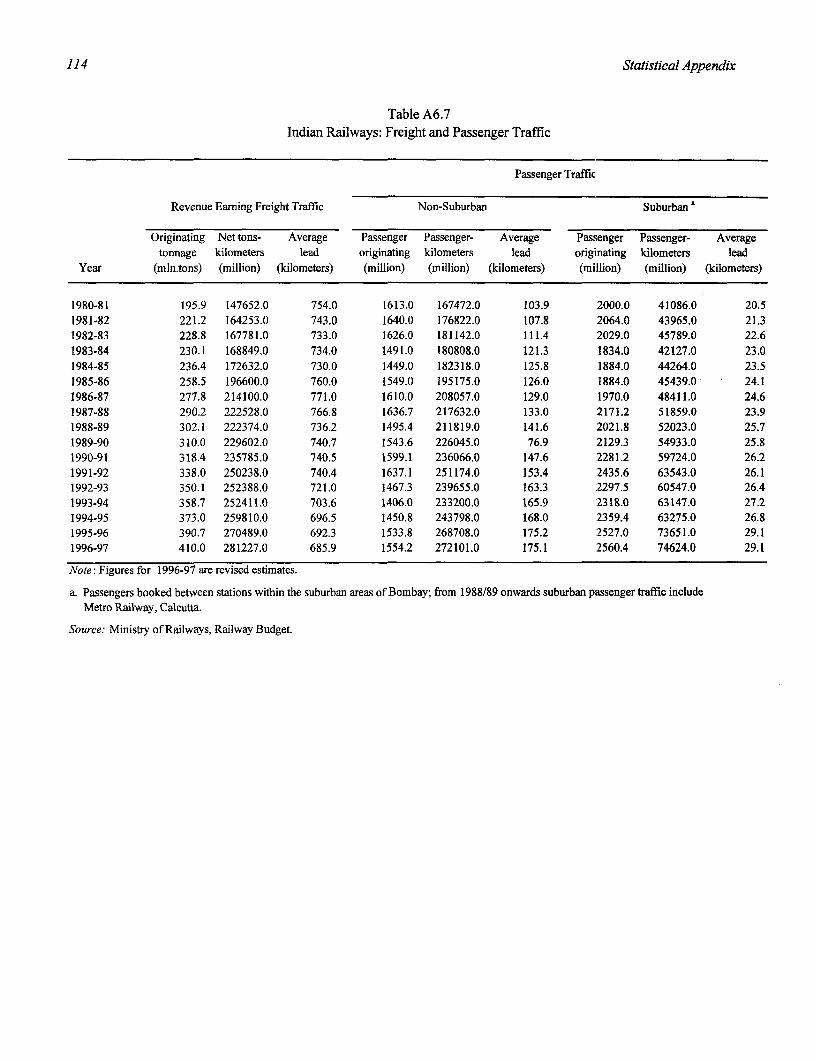
114 Statistical Appendix
Table A6.7Indian Railways: Freight and Passenger Traffic
Passenger Traffic
Revenue Earning Freight Traffic Non-Suburban Suburban a
Originating Net tons- Average Passenger Passenger- Average Passenger Passenger- Averagetonnage kilometers lead originating kilometers lead originating kilometers lead
Year (mln.tons) (million) (kilometers) (million) (million) (kilometers) (million) (million) (kilometers)
1980-81 195.9 147652.0 754.0 1613.0 167472.0 103.9 2000.0 41086.0 20.51981-82 221.2 164253.0 743.0 1640.0 176822.0 107.8 2064.0 43965.0 21.31982-83 228.8 167781.0 733.0 1626.0 181142.0 111.4 2029.0 45789.0 22.61983-84 230.1 168849.0 734.0 1491.0 180808.0 121.3 1834.0 42127.0 23.01984-85 236.4 172632.0 730.0 1449.0 182318.0 125.8 1884.0 44264.0 23.51985-86 258.5 196600.0 760.0 1549.0 195175.0 126.0 1884.0 45439.0 24.11986-87 277.8 214100.0 771.0 1610.0 208057.0 129.0 1970.0 48411.0 24.61987-88 290.2 222528.0 766.8 1636.7 217632.0 133.0 2171.2 51859.0 23.91988-89 302.1 222374.0 736.2 1495.4 211819.0 141.6 2021.8 52023.0 25.71989-90 310.0 229602.0 740.7 1543.6 226045.0 76.9 2129.3 54933.0 25.81990-91 318.4 235785.0 740.5 1599.1 236066.0 147.6 2281.2 59724.0 26.21991-92 338.0 250238.0 740.4 1637.1 251174.0 153.4 :2435.6 63543.0 26.11992-93 350.1 252388.0 721.0 1467.3 239655.0 163.3 :2297.5 60547.0 26.41993-94 358.7 252411.0 703.6 1406.0 233200.0 165.9 2318.0 63147.0 27.21994-95 373.0 259810.0 696.5 1450.8 243798.0 168.0 :2359.4 63275.0 26.81995-96 390.7 270489.0 692.3 1533.8 268708.0 175.2 :2527.0 73651.0 29.11996-97 410.0 281227.0 685.9 1554.2 272101.0 175.1 2560.4 74624.0 29.1
Note: Figures for 1996-97 are revised estimates.
a. Passengers booked between stations within the suburban areas of Bombay; from 1988/89 onwards suburban passenger traffic includeMetro Railway, Calcutta.
Source: Ministry of Railways, Railway Budget.
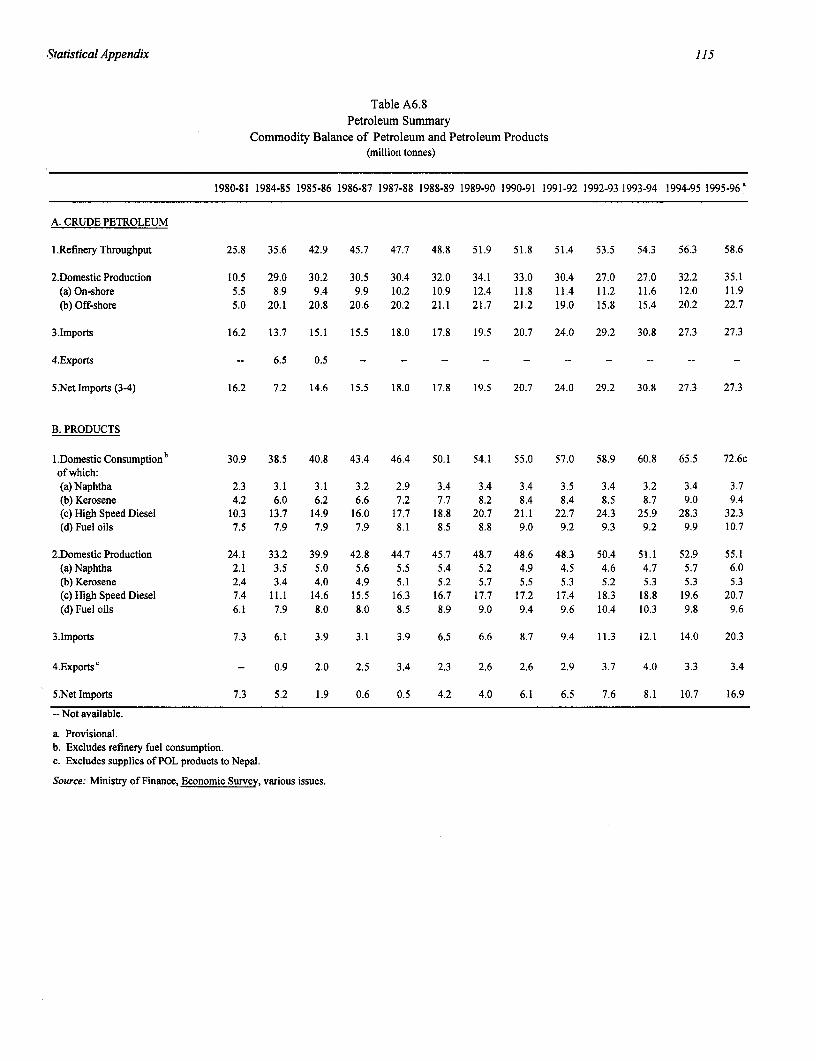
.Statistical Appendix 115
Table A6.8Petroleum Summary
Commodity Balance of Petroleum and Petroleum Products(million tonnes)
1980-81 1984-85 1985-86 1986-87 1987-88 1988-89 1989-90 1990-91 1991-92 1992-93 1993-94 1994-95 1995-96
A. CRUDE PETROLEUM
I.Refinery Throughput 25.8 35.6 42.9 45.7 47.7 48.8 51.9 51.8 51.4 53.5 54.3 56.3 58.6
2.Domestic Production 10.5 29.0 30.2 30.5 30.4 32.0 34.1 33.0 30.4 27.0 27.0 32.2 35.1(a) On-shore 5.5 8.9 9.4 9.9 10.2 10.9 12.4 11.8 11.4 11.2 11.6 12.0 11.9(b) Off-shore 5.0 20.1 20.8 20.6 20.2 21.1 21.7 21.2 19.0 15.8 15.4 20.2 22.7
3.1mports 16.2 13.7 15.1 15.5 18.0 17.8 19.5 20.7 24.0 29.2 30.8 27.3 27.3
4.Exports - 6.5 0.5 -- -- -- -- -- -- -- -- -- --
5.Net Imports (3-4) 16.2 7.2 14.6 15.5 18.0 17.8 19.5 20.7 24.0 29.2 30.8 27.3 27.3
B. PRODUCTS
I.Domestic Consumption b 30.9 38.5 40.8 43.4 46.4 50.1 54.1 55.0 57.0 58.9 60.8 65.5 72.6cof which:(a)Naphtha 2.3 3.1 3.1 3.2 2.9 3.4 3.4 3.4 3.5 3.4 3.2 3.4 3.7(b) Kerosene 4.2 6.0 6.2 6.6 7.2 7.7 8.2 8.4 8.4 8.5 8.7 9.0 9.4(c) High Speed Diesel 10.3 13.7 14.9 16.0 17.7 18.8 20.7 21.1 22.7 24.3 25.9 28.3 32.3(d) Fuel oils 7.5 7.9 7.9 7.9 8.1 8.5 8.8 9.0 9.2 9.3 9.2 9.9 10.7
2.Domestic Production 24.1 33.2 39.9 42.8 44.7 45.7 48.7 48.6 48.3 50.4 51.1 52.9 55.1(a) Naphtha 2.1 3.5 5.0 5.6 5.5 5.4 5.2 4.9 4.5 4.6 4.7 5.7 6.0(b) Kerosene 2.4 3.4 4.0 4.9 5.1 5.2 5.7 5.5 5.3 5.2 5.3 5.3 5.3(c) High Speed Diesel 7.4 11.1 14.6 15.5 16.3 16.7 17.7 17.2 17.4 18.3 18.8 19.6 20.7(d) Fuel oils 6.1 7.9 8.0 8.0 8.5 8.9 9.0 9.4 9.6 10.4 10.3 9.8 9.6
3.Imports 7.3 6.1 3.9 3.1 3.9 6.5 6.6 8.7 9.4 11.3 12.1 14.0 20.3
4.Exports' -- 0.9 2.0 2.5 3.4 2.3 2.6 2.6 2.9 3.7 4.0 3.3 3.4
5.Netlmports 7.3 5.2 1.9 0.6 0.5 4.2 4.0 6.1 6.5 7.6 8.1 10.7 16.9
-- Not available.
a. Provisional.b. Excludes refinery fuel consumption.c. Excludes supplies of POL products to Nepal.
Source: Ministry of Finance, Economic Survey, various issues.
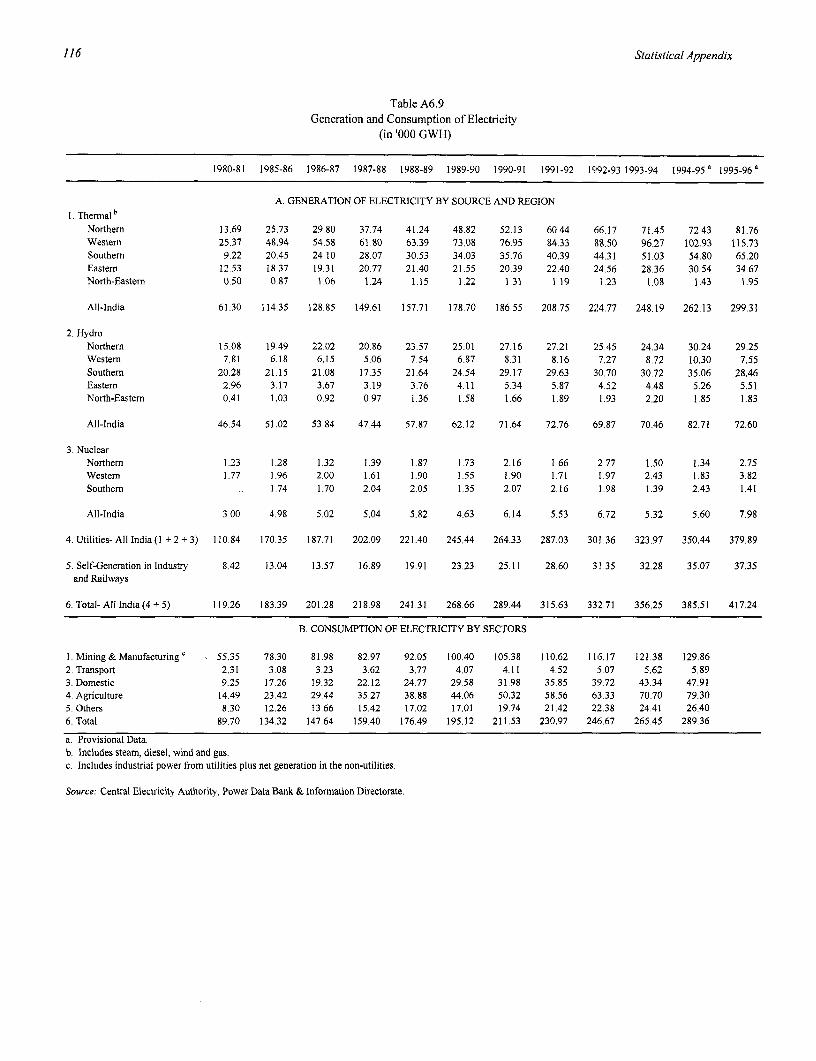
116 Statistical Appendix
Table A6.9Generation and Consumption of Electricity
(in '000 GWH)
1980-81 1985-86 1986-87 1987-88 1988-89 1989-90 1990-91 1991-92 1992-93 1993-94 1994-95 a 1995-96
A. GENERATION OF ELECTRICITY BY SOURCE AND REGIONI. Thermal b
Northern 13.69 25.73 29.80 37.74 41.24 48.82 52.13 60.44 656.17 71.45 72.43 81.76Westem 25.37 48.94 54.58 61.80 63.39 73.08 76.95 84.33 88.50 96.27 102.93 115.73Southem 9.22 20.45 24.10 28.07 30.53 34.03 35.76 40.39 44.31 51.03 54.80 65.20Eastem 12.53 18.37 19.31 20.77 21.40 21.55 20.39 22.40 24.56 28.36 30.54 34.67North-Eastem 0.50 0.87 1.06 1.24 1.15 1.22 1.31 1.19 1.23 1.08 1.43 1.95
All-India 61.30 114.35 128.85 149.61 157.71 178.70 186.55 208.75 224.77 248.19 262.13 299.31
2. HydroNorthern 15.08 19.49 22.02 20.86 23.57 25.01 27.16 27.21 25.45 24.34 30.24 29.25Westem 7.81 6.18 6.15 5.06 7.54 6.87 8.31 8.16 7.27 8.72 10.30 7.55Southem 20.28 21.15 21.08 17.35 21.64 24.54 29.17 29.63 30.70 30.72 35.06 28.46Eastem 2.96 3.17 3.67 3.19 3.76 4.11 5.34 5.87 4.52 4.48 5.26 5.51North-Eastem 0.41 1.03 0.92 0.97 1.36 1.58 1.66 1.89 1.93 2.20 1.85 1.83
All-India 46.54 51.02 53.84 47.44 57.87 62.12 71.64 72.76 69.87 70.46 82.71 72.60
3. NuclearNorthem 1.23 1.28 1.32 1.39 1.87 1.73 2.16 1.66 2.77 1.50 1.34 2.75Western 1.77 1.96 2.00 1.61 1.90 1.55 1.90 1.71 1.97 2.43 1.83 3.82Southem .. 1.74 1.70 2.04 2.05 1.35 2.07 2.16 1.98 1.39 2.43 1.41
All-India 3.00 4.98 5.02 5.04 5.82 4.63 6.14 5.53 6.72 5.32 5.60 7.98
4. Utilities- All India(1 +2+3) 110.84 170.35 187.71 202.09 221.40 245.44 264.33 287.03 301.36 323.97 350.44 379.89
5. Self-Generation in Industry 8.42 13.04 13.57 16.89 19.91 23.23 25.11 28.60 31.35 32.28 35.07 37.35and Railways
6. Total- All India (4+5) 119.26 183.39 201.28 218.98 241.31 268.66 289.44 315.63 332.71 356.25 385.51 417.24
B. CONSUMPTION OF ELECTRICITY BY SECTORS
1. Mining & Manufacturing'c 55.35 78.30 81.98 82.97 92.05 100.40 105.38 110.62 11 6.17 121.38 129.862. Transport 2.31 3.08 3.23 3.62 3.77 4.07 4.11 4.52 5.07 5.62 5.893. Domestic 9.25 17.26 19.32 22.12 24.77 29.58 31.98 35.85 39.72 43.34 47.914. Agriculture 14.49 23.42 29.44 35.27 38.88 44.06 50.32 58.56 63.33 70.70 79.305. Others 8.30 12.26 13.66 15.42 17.02 17.01 19.74 21.42 22.38 24.41 26.406. Total 89.70 134.32 147.64 159.40 176.49 195.12 211.53 230.97 246.67 265.45 289.36
a. Provisional Data.b. Includes steam, diesel, wind and gas.c. Includes industrial power from utilities plus net generation in the non-utilities.
Source: Central Electricity Authority, Power Data Bank & Information Directorate.
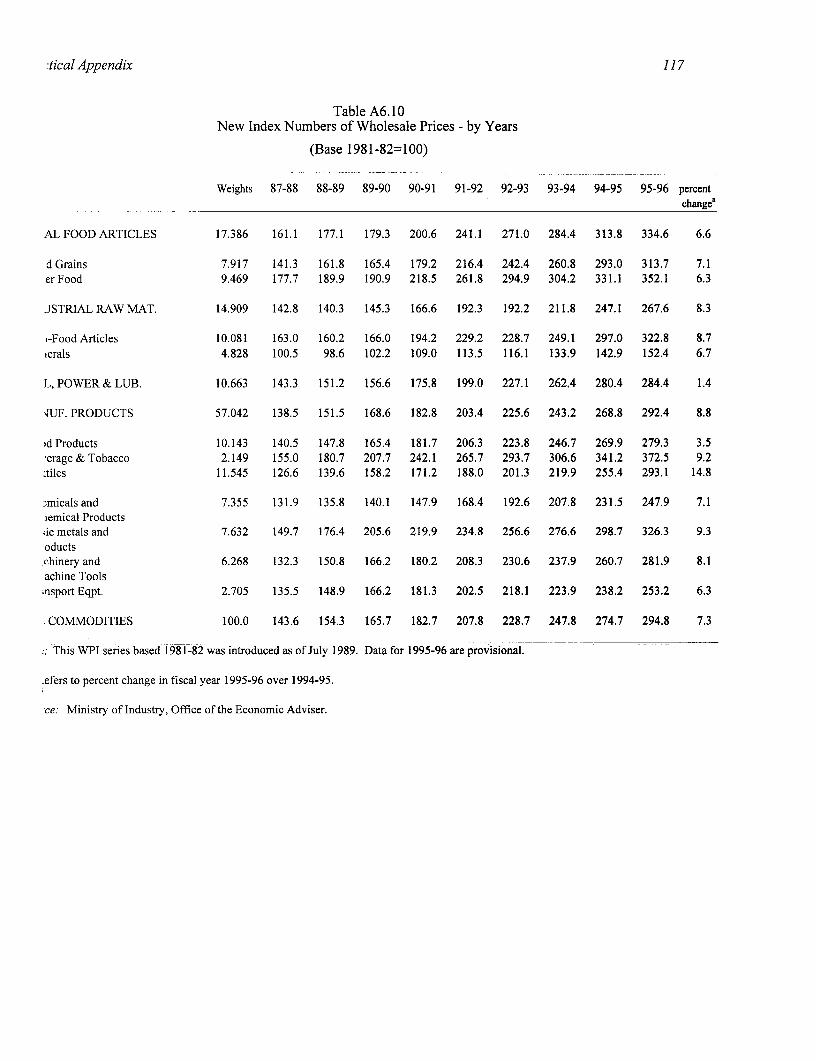
:tical Appendix 117
Table A6. 10New Index Numbers of Wholesale Prices - by Years
(Base 1981-82=100)
Weights 87-88 88-89 89-90 90-91 91-92 92-93 93-94 94-95 95-96 percentchange'
AL FOOD ARTICLES 17.386 161.1 177.1 179.3 200.6 241.1 271.0 284.4 313.8 334.6 6.6
d Grains 7.917 141.3 161.8 165.4 179.2 216.4 242.4 260.8 293.0 313.7 7.1erFood 9.469 177.7 189.9 190.9 218.5 261.8 294.9 304.2 331.1 352.1 6.3
JSTRIAL RAW MAT. 14.909 142.8 140.3 145.3 166.6 192.3 192.2 211.8 247.1 267.6 8.3
i-Food Articles 10.081 163.0 160.2 166.0 194.2 229.2 228.7 249.1 297.0 322.8 8.7ierals 4.828 100.5 98.6 102.2 109.0 113.5 116.1 133.9 142.9 152.4 6.7
L, POWER & LUB. 10.663 143.3 151.2 156.6 175.8 199.0 227.1 262.4 280.4 284.4 1.4
4UF. PRODUCTS 57.042 138.5 151.5 168.6 182.8 203.4 225.6 243.2 268.8 292.4 8.8
)d Products 10.143 140.5 147.8 165.4 181.7 206.3 223.8 246.7 269.9 279.3 3.5'erage & Tobacco 2.149 155.0 180.7 207.7 242.1 265.7 293.7 306.6 341.2 372.5 9.2:tiles 11.545 126.6 139.6 158.2 171.2 188.0 201.3 219.9 255.4 293.1 14.8
-micals and 7.355 131.9 135.8 140.1 147.9 168.4 192.6 207.8 231.5 247.9 7.1lemical Products.ic metals and 7.632 149.7 176.4 205.6 219.9 234.8 256.6 276.6 298.7 326.3 9.3oductschinery and 6.268 132.3 150.8 166.2 180.2 208.3 230.6 237.9 260.7 281.9 8.1achine Tools;nsport Eqpt. 2.705 135.5 148.9 166.2 181.3 202.5 218.1 223.9 238.2 253.2 6.3
COMMODITIES 100.0 143.6 154.3 165.7 182.7 207.8 228.7 247.8 274.7 294.8 7.3
This WPI series based 1981-82 was introduced as of July 1989. Data for 1995-96 are provisional.
efers to percent change in fiscal year 1995-96 over 1994-95.
ce: Ministry of Industry, Office of the Economic Adviser.
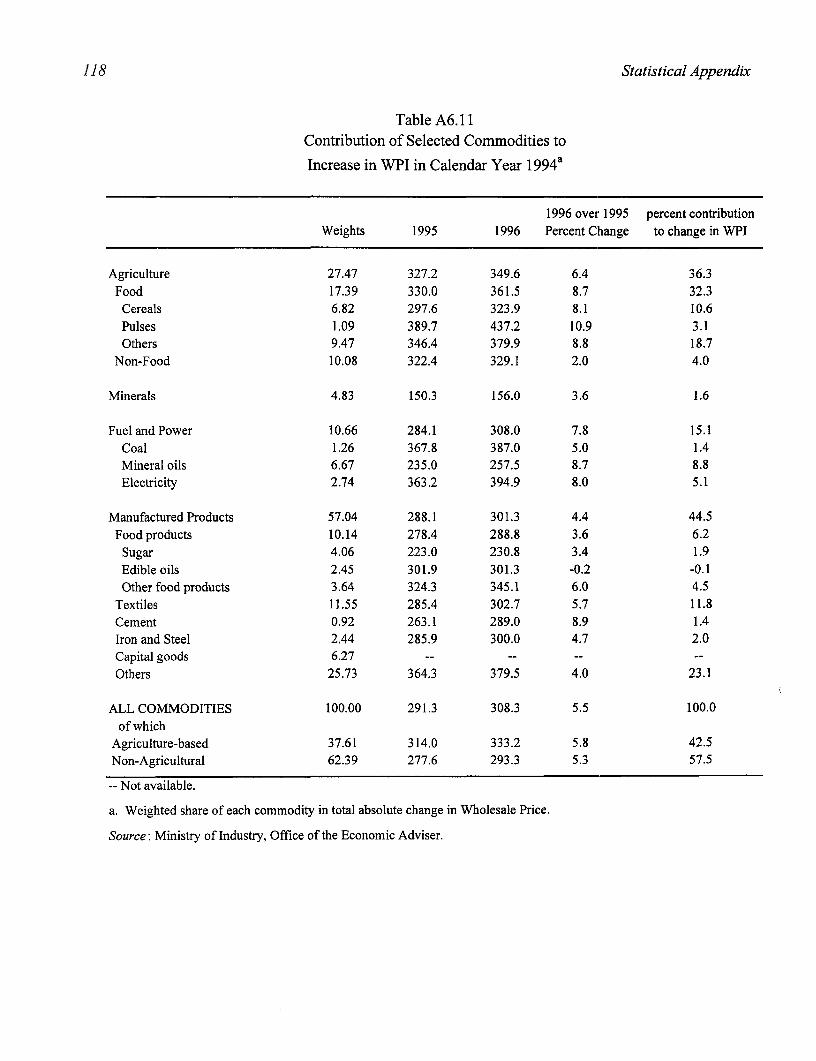
118 Statistical Appendix
Table A6.11Contribution of Selected Commodities to
Increase in WPI in Calendar Year 1 994a
1996 over 1995 percent contributionWeights 1995 1996 Percent Change to change in WPI
Agriculture 27.47 327.2 349.6 6.4 36.3Food 17.39 330.0 361.5 8.7 32.3Cereals 6.82 297.6 323.9 8.1 10.6Pulses 1.09 389.7 437.2 10.9 3.1Others 9.47 346.4 379.9 8.8 18.7
Non-Food 10.08 322.4 329.1 2.0 4.0
Minerals 4.83 150.3 156.0 3.6 1.6
Fuel and Power 10.66 284.1 308.0 7.8 15.1Coal 1.26 367.8 387.0 5.0 1.4Mineral oils 6.67 235.0 257.5 8.7 8.8Electricity 2.74 363.2 394.9 8.0 5.1
Manufactured Products 57.04 288.1 301.3 4.4 44.5Food products 10.14 278.4 288.8 3.6 6.2Sugar 4.06 223.0 230.8 3.4 1.9Edible oils 2.45 301.9 301.3 -0.2 -0.1Other food products 3.64 324.3 345.1 6.0 4.5
Textiles 11.55 285.4 302.7 5.7 11.8Cement 0.92 263.1 289.0 8.9 1.4Iron and Steel 2.44 285.9 300.0 4.7 2.0Capital goods 6.27 -- -- -- -
Others 25.73 364.3 379.5 4.0 23.1
ALL COMMODITIES 100.00 291.3 308.3 5.5 100.0of which
Agriculture-based 37.61 314.0 333.2 5.8 42.5Non-Agricultural 62.39 277.6 293.3 5.3 57.5
-- Not available.
a. Weighted share of each commodity in total absolute change in Wholesale Price.
Source: Ministry of Industry, Office of the Economic Adviser.
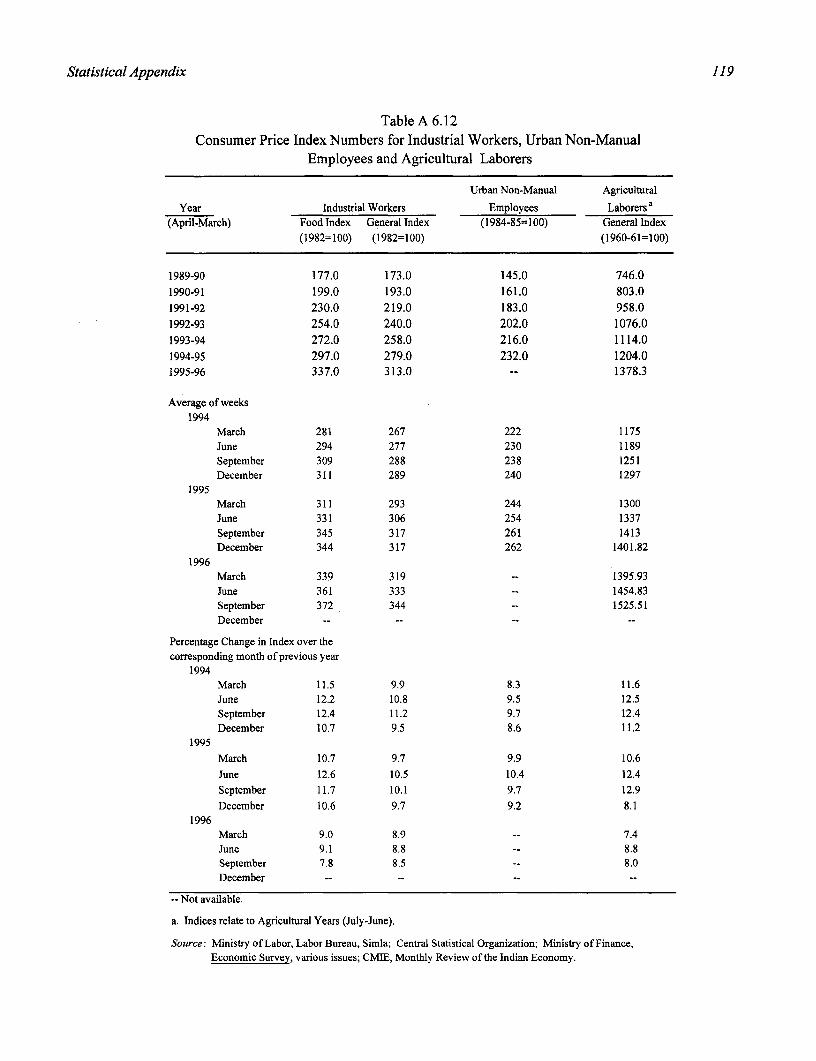
Statistical Appendix 119
Table A 6.12Consumer Price Index Numbers for Industrial Workers, Urban Non-Manual
Employees and Agricultural Laborers
Urban Non-Manual Agricultural
Year Industrial Workers Employees Laborers a(April-March) Food Index General Index (1984-85=100) General Index
(1982=100) (1982=100) (1960-61=100)
1989-90 177.0 173.0 145.0 746.01990-91 199.0 193.0 161.0 803.01991-92 230.0 219.0 183.0 958.01992-93 254.0 240.0 202.0 1076.01993-94 272.0 258.0 216.0 1114.01994-95 297.0 279.0 232.0 1204.01995-96 337.0 313.0 -- 1378.3
Average of weeks1994
March 281 267 222 1175June 294 277 230 1189September 309 288 238 1251December 311 289 240 1297
1995March 311 293 244 1300June 331 306 254 1337September 345 317 261 1413December 344 317 262 1401.82
1996March 339 319 -- 1395.93June 361 333 -- 1454.83September 372 344 -- 1525.51December -- -- -- --
Percentage Change in Index over thecorresponding month of previous year
1994March 11.5 9.9 8.3 11.6June 12.2 10.8 9.5 12.5September 12.4 11.2 9.7 12.4December 10.7 9.5 8.6 11.2
1995March 10.7 9.7 9.9 10.6June 12.6 10.5 10.4 12.4September 11.7 10.1 9.7 12.9December 10.6 9.7 9.2 8.1
1996March 9.0 8.9 -- 7.4June 9.1 8.8 -- 8.8September 7.8 8.5 -- 8.0December - -- -- --
-- Not available.
a. Indices relate to Agricultural Years (July-June).
Source: Ministry of Labor, Labor Bureau, Simla; Central Statistical Organization; Ministry of Finance,Economic Survey, various issues; CMIE, Monthly Review of the Indian Economy.
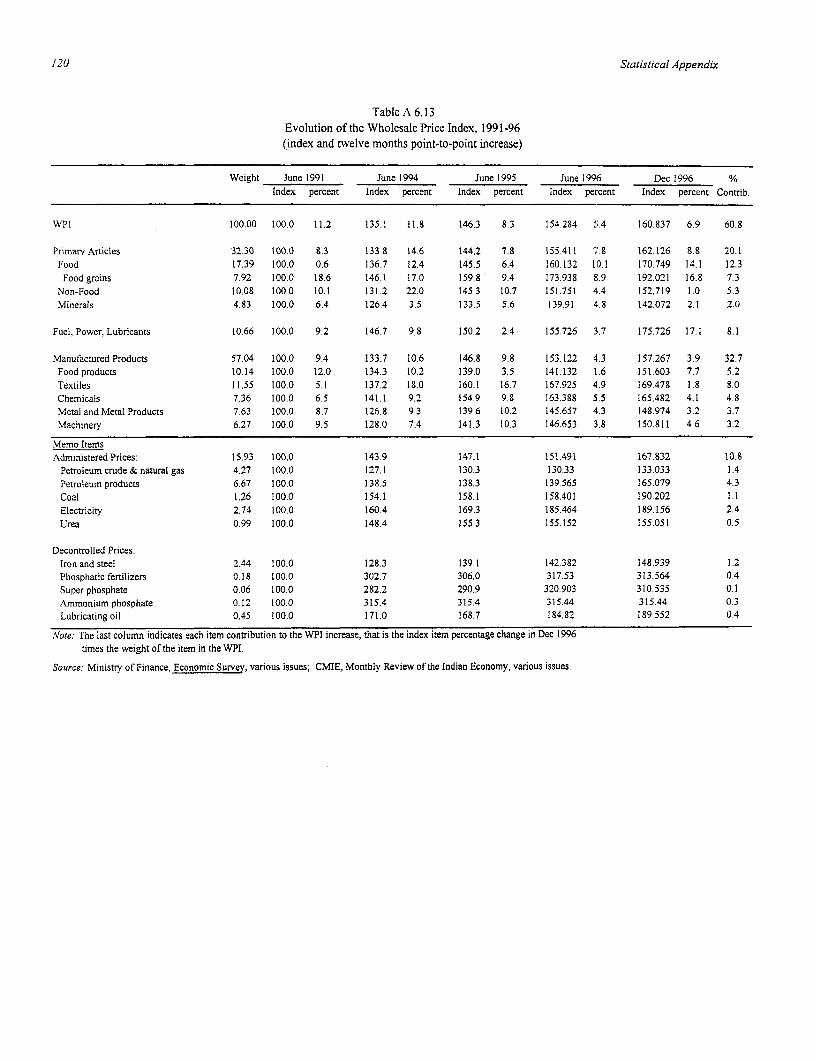
120 Statistical Appendix
Table A 6.13Evolution of the Wholesale Price Index, 1991-96(index and twelve months point-to-point increase)
Weight June 1991 June 1994 June 1995 June 1996 Dec 1996 %Index percent Index percent Index percent Index percent Index percent Contrib.
WPI 100.00 100.0 11.2 135.1 11.8 146.3 8.3 154.284 5.4 160.837 6.9 60.8
Primary Articles 32.30 100.0 8.3 133.8 14.6 144.2 7.8 155.411 7.8 162.126 8.8 20.1Food 17.39 100.0 0.6 136.7 12.4 145.5 6.4 160.132 10.1 170.749 14.1 12.3Food grains 7.92 100.0 18.6 146.1 17.0 159.8 9.4 173.938 F.9 192.021 16.8 7.3
Non-Food 10.08 100.0 10.1 131.2 22.0 145.3 10.7 151.751 4.4 152.719 1.0 5.3Minerals 4.83 100.0 6.4 126.4 3.5 133.5 5.6 139.91 4.8 142.072 2.1 2.0
Fuel, Power, Lubricants 10.66 100.0 9.2 146.7 9.8 150.2 2.4 155.726 3.7 175,726 17.1 8.1
Manufactured Products 57.04 100.0 9.4 133.7 10.6 146.8 9.8 153.122 4.3 157.267 3.9 32.7Food products 10.14 100.0 12.0 134.3 10.2 139.0 3.5 141.132 1.6 151.603 7.7 5.2Textiles 11.55 100.0 5.1 137.2 18.0 160.1 16.7 167.925 4.9 169.478 1.8 8.0Chemicals 7.36 100.0 6.5 141.1 9.2 154.9 9.8 163.388 5.5 165.482 4.1 4.8Metal and Metal Products 7.63 100.0 8.7 126.8 9.3 139.6 10.2 145.657 4.3 148.974 3.2 3.7Machinery 6.27 100.0 9.5 128.0 7.4 141.3 10.3 146.653 3.8 150.811 4.6 3.2
Memo ItemsAdministered Prices: 15.93 100.0 143.9 147.1 151.491 167.832 10.8
Petroleum crude & natural gas 4.27 100.0 127.1 130.3 130.33 133.033 1.4Petroleum products 6.67 100.0 138.5 138.3 139.565 165.079 4.3Coal 1.26 100.0 154.1 158.1 158.401 190.202 1.1Electricity 2.74 100.0 160.4 169.3 185.464 189.156 2.4Urea 0.99 100.0 148.4 155.3 155.152 155.051 0.5
Decontrolled Prices:Iron and steel 2.44 100.0 128.3 139.1 142.382 148.939 1.2Phosphatic fertilizers 0.18 100.0 302.7 306.0 317.53 313.564 0.4Super phosphate 0.06 100.0 282.2 290.9 320.903 310.535 0.1Ammonium phosphate 0.12 100.0 315.4 315.4 315.44 315.44 0.3Lubricating oil 0.45 100.0 171.0 168.7 184.82 189.552 0.4
Note: The last column indicates each item contribution to the WPI increase, that is the index item percentage change in Dec 1996times the weight of the item in the WPI.
Source: Ministry of Finance, Economic Survev, various issues; CMIE, Monthly Review of the Indian Economy, various issues.

I

��'>'>12»Q7& ->W>4»�'443*4fl>4»>-'>-- »>44 '44*41144»-»�r»>��>
4>$�'>
44
�>4444 >4 - j4$ 4444444 S 4''>>'
44' 44�>444 44*4444 *44444444 �>�>4 >4444444' 444444444444 >4» >4>444> 44444 44 }34> 44�444� 44 4$44-> > >>�>�>
>4444 »4>4 A- 444*4444> 44>4 >� *4,4
4 4>4'-> 4>>'>' 44 44'> >44'4>444>»4>'44'4"44> >4444444>44 -4444 444 44 4 44>4'>-44444>4 > -- >3444444>,4>4>4
4>44 44444�4 >4>44444 -'44444 -� A 4
MA> A �j44444�444>��>4 444> 44444444444>4 �4>4 >� 444>44>444444444>444 >44 >>4444444-
>3,4 4'4444>344>>'4">4 A A > 4>44 J4'4>'>' »44444� >'$4� 4>4>4444"
»'>t>(<b» *4>444>44>4>' �>4 >4 >44 §;44
4 iA4t >443,4>� 44 *4>4
>444 A 444 *4 >4'> >4�*4$ - - 444444'4>>�- 444>44 --444444
>4 '-4444 >� $444 4>44 444 >4>4 - ' 444>74*4 >�$> > A>'>' 4 44> �4444 >44
444<444 44$$4 >>'�� *4'-'»' 4 4 � 4j 4444 4 �A�>4 -44>4 »>*4 4> *4 4 y,4�A
'444 '444444 >44444 >4 4>� $»»>��>444 >44444 >4
44 44-4>tJV>44 44�47>4>-44444444444444444 4 44 5$- >4>4 A4444 - $4 A A A A >� *4>44444444
444-' ->4>4>->-4 >4-4>-�"4 444444>4 444�-'»>A-»'Ai--"A4-- 44 4 444444444444 42>
4> >- 44444 4444>4 $4444444 A 'A 4
4 � >44t444$K>A - "> A 4'-- $4 44 4>4 >444>4>4>4 A � A4445 - ->4
44 �4 >4->'' >44$>C 44 44*4*44444>4- 44 44 4>>A $4- '�44,444444>> 444 44*4 � 4444444445 44*4 »4$ 44> 44� 444>444 -- *444,> 4444*4>444*4-4444444-44
� $�4'->�� $4 >44 4 4> *44*4 444444*4 444>L4>A 44444*4444 444>44>4444� 444> 44444*4*4 444 4444 444>444 4$ 4>4 44
444>4444444 >->"> ¶�»> >4>44 �>�»»> -- 4»» 44>4»4>4>>4>4 -444*44 >44 4>4
4> 4 A4A>� � -> 4 4>»� ->4
>4 >-4½>44 244$4 -- >4>4>4
>4>444444>444 44*4444 4444 >44434>4 - 44444 44>4 44443*444>»'' $444444- 4 44>4' >4 >A>->�-<» 4»»>4 4>4� A
4>'> ' 4444>4
44,44 444 444� > 444 444 44444444>44>4 >44> 44>5 44> >4 >4- 4)4>4 >4
44 44 4444 4 44444 444 4444>4444 >4 4 44� $4, >4>444>44 4
*44 444444*4>4>444,4�44444444>>*4 4444>4 >44 444 44*444444 4>*4*44>4>44 4 444$ 44444»� 444444 4>44 4*44 4>44 4444>44>4 44 4 »442 44-> 44>4*4> >44>4>4>4> >�44 �> 44
444$444>4444�4>4444>74 >;�>�>4 44444 > >>>4$>44>4>>4>444444>4 44444
44>4>44 >> 4�»�> 4 � >4>4444 44>4>>�4 � �$44 $4 444>
4>444-444444 >4>44>4 »4444> 43>4 4444>4* 444444>4444>4,4> 4
4> � 4 >� 4 �
>4>4 444*4>4»44 *4*4> 4$>4 *4 44444
>44 4444 � 44 *4444444 34
4444 44>4444 '4 >>4444�>44 >44-'�- 4*4 44>- 4>4444>4 444>4 4*4>444> � 4*4
A>' 434�» -{;¶4 4 34> >>>44>4 4444
5 4, >4»->'»'�� >>4� *44>> >4 >-»4»�>�»'��> 4444444 3344 >
»444$4>'>4>4 ��»>4>4>4
4>4 �
>'>A 4>444 > 444444 »'A544�»444444> >--4> 44 442-4 44>' >4*4 >44
444>4>5 4»'» 4444 444> 444>44 >44>4» � »� 44>44> 4 >4> >44 - >4444444 >$;• 4>1 >4>4 ,�44,,45$A> �> 444 $4>5447>4
4 424*44 �44$ A A 44444444> 4*444 -4>4444 - 44 44444 4 44 4
$ 4444>4> 4> >44*444>44 >4 >�>4 4>�4>> 4>4>4 3>44'>$4$444>4>',4»44 4>4 > 4>4>4>444544 44444 A 44 4444444 >4444444>444>4>4>444 44444
>4444>5 44 >4> » »4 >4*4»> 4*4>444 >4> 4>4*44>44444 44 �»»> 4444444 5>4444> 4444>444>
44>4 > 44>4 33,4>44 >44»»:>> 45>43444»454> 4>4' 4'>4>�-4 »� > >4>4»4>4>4»> -
44>4�44444 *4 4 A __________________________
4 *4 4>4
344444> 4 >44»> 44444>4 >4»' * >4 4>4 »4 44-
4>4>44443,4444 4 44 >344444>4444>-
7S$4$A> 44>44444 A >� 44 IMAGING
4444444444 �4�44,444f>4 4 4>44 � 44444 444> 444>44 4444444>4444>44 44¾
>4>444*44444 44>44 ��>4*4 44*4 *4 44444 >4444444444444>44> 44>44 4444 44444 4444 44
444>44 :4 4*4-44>4444 44 5» 4 » 4$
44444444444 4>4444>44>444444
4> »»>;> 4
>4»44>444444 � A A 44»44> *4 No
>4444444444 16508 INA» >>4'>t>4t. A >4>4���A A >4> Tuno ER
Related Documents