INDEX Project Proposal (Draft) INDEX Project Report #98-006P Pravin P. Varaiya Richard J. Edell Harish Chand August 6, 1996 © 1996 U.C. Regents. All rights reserved. Do not redistribute this document electronically. This document may be found on the web at: http://www.INDEX.Berkeley.EDU/reports/98-006P Abstract This (draft) document proposes the INDEX Project. There are a few holes in this version. (A later version, submitted to the National Science Foundation, is much more complete; unfortunately, the NSF version isn’t available online.) Despite the holes, this version provides an interesting historical perspective of INDEX. The INDEX Project is supported by the National Science Foundation, Cisco Systems, SBC Communications and the California State MICRO Grant program. 1

Welcome message from author
This document is posted to help you gain knowledge. Please leave a comment to let me know what you think about it! Share it to your friends and learn new things together.
Transcript

INDEX Project Proposal (Draft)INDEX Project Report #98-006P
Pravin P. Varaiya Richard J. Edell Harish Chand
August 6, 1996
© 1996 U.C. Regents. All rights reserved.Do not redistribute this documentelectronically. This document may be found on the web at:
http://www.INDEX.Berkeley.EDU/reports/98-006P
AbstractThis (draft) document proposes the INDEX Project. There are a few holes in this version. (A later version,submitted to the National Science Foundation, is much more complete; unfortunately, the NSF version isn’tavailable online.) Despite the holes, this version provides an interesting historical perspective of INDEX.
The INDEX Project is supported by the National Science Foundation, Cisco Systems, SBC Communications and theCalifornia State MICRO Grant program.
1

INDEX: The Internet Demand Experiment∗
Pravin Varaiya, Richard Edell and Harish ChandDepartments of Electrical Engineering & Computer Science and Economics
University of California, Berkeley, CA 94720
August 6, 1996
Abstract
Successful growth of Internet and other sophisticated network services requires providers tooffer combinations of service quality and price that meet the needs of a diverse user population.But to do this providers need to understand the structure of user demand. Market data cannotprovide this information, because service providers today offer a very narrow range of quality-price combinations. Providers would also find it difficult to offer variable quality and priceusing their current systems.
This is a proposal for an experiment to measure the demand over a wide range of servicequality and price structures. INDEX—the Internet Demand Experiment—has four objectives:
1. Estimation of user demand for Internet access as a function of quality of service (QoS),price structure, and application;
2. Demonstration of an end-to-end system that provides network access to a diverse groupof users at attractive quality-price combinations;
3. Development of a prototype system that can be scaled to serve the demand for remotenetwork access from Berkeley students, faculty and staff on a user-financed basis; and
4. Exploration of the use of the prototype system for “distance learning.”
The two year-long experiment will recruit a representative group of 160 users from the Berkeleycampus. The experiment will cost $170 per month per user—well below commercial chargesfor comparable service.
The estimated price and quality elasticities of demand can be used by providers to offerservices that meet the needs of a much larger user group than is willing to purchase Inter-net access under current charges. The data will reveal changes in user demand over time, thecorrelation between user application and service demand, and the formation of discrete mar-ket segments. The experimental data can test hypotheses concerning the market for quality-differentiated ATM services.
The University can use the INDEX prototype system to improve network access on a user-financed basis. This will be a “market test” for network services with variable quality and price.
The experiment will also reveal the network costs of university distance-learning projectsnow underway. This will help determine the financial viability of these projects.
If facilities are available, INDEX will be enlarged to test CATV access and to include non-university participants.
∗Supported by grants from NSF, Pacific Telesis and the California Micro Program
2

1 Summary
Future growth of Internet and other sophisticated network services made possible by ATM networks willdepend upon how these services are marketed. Two related marketing decisions are involved: the divisionof services into market segments, and the pricing structure of each segment. Even a cursory observation ofnetwork user behavior shows a wide diversity in user needs, familiarity, and demand or willingness to pay.On the supply side, network technology can also now support a wide range in the quality of network service.
Successful marketing of network services therefore requires providers to offer combinations of service qualityand price that match user needs. But to do this providers need to understand the structure of user demand.Such information is lacking at present: current market data would be very costly to collect, and were it to beavailable it would not provide this information because network services offered today span a very narrowrange of quality-price combinations.
A market experiment that can reveal this information at a modest cost is difficult to conduct: it requiresa geographically concentrated pool of diverse users, a network that offers a range of service qualities andflexible pricing structures, a system that monitors user behavior, and complex econometric analysis. Theexperiment must be conducted over a sufficiently long period so that users can learn how to use those servicesand adapt their behavior accordingly.
This is a proposal for an experiment to measure the demand for network services. INDEX—the InternetDemand Experiment—has four objectives:
1. Measurement of user demand for Internet access as a function of quality of service (QoS), pricingstructure, and application;
2. Demonstration of an end-to-end system that provides access to a diverse group of users at attractiveprice-quality combinations;
3. Development of a prototype system that can be scaled to serve the demand for remote network accessfrom all Berkeley students, faculty and staff on a user-financed basis; and
4. Exploration of the use of the prototype system for “distance learning.”
Demand structure
The two year-long experiment will recruit a representative group of 160 users from the Berkeley campuscommunity. (The experiment will be enlarged to test CATV access and to include non-University participantsif it is practicable to do so.) Users will select network services from a menu of QoS-price offerings. The menuwill be changed eight times over two years in order to measure demand for a wide range of combinations ofQoS, price and user characteristics.
INDEX data will be analyzed to estimate price and quality elasticities. The elasticities will provide a basisfor the design of commercial Internet service offerings. The data will reveal information about how demandvaries with user experience, the correlation between user application and service demand, and whether usersform discrete market segments. The data will be able to test hypotheses about the structure of the market forvariable-quality ATM services.
Stated preference surveys will be conducted alongside the experiment. Comparison of this data with the“revealed” preferences of INDEX will permit calibration of stated preference surveys for use as a tool toinvestigate the market for network services.
System demonstration
The experiment will demonstrate a single system that offers: variable service quality-price combinations thatmeet the needs of a diverse user population; an automated billing system that also gives the user control overservice selection; and a remotely operated network monitoring and management system. The per user cost ofthe demonstration system will be well below commercial charges for comparable services.
3

If facilities can be acquired, the experiment will be expanded to demonstrate CATV access and to includenon-University participants. This is dependent upon cooperative arrangements with a CATV-access and otherISP providers.
University benefits
Limited campus resources now constrain remote Internet access through a highly congested pool of 28.8, 14.4Kbps and lower-speed modems. INDEX can serve as a prototype for expanding access on a user-financedbasis. The prototype will integrate with the existing campus network management and billing systems. Ifsuccessful, the prototype can be scaled to serve virtually the entire campus of 40,000 students, faculty andstaff. Users would pay for this alternative if they prefer it to the free but congested means of network access.The entire campus community will benefit as a result. User demand for services of the prototype system alsoprovides a “market test.”
Distance learning
Several distance-learning projects are now underway in the University. To be established as regular campusprograms, these experiments must be self-financed. INDEX will reveal the network cost component of theseprograms. This is not a crucial objective of INDEX, but it will demonstrate the use of the prototype systemfor purposes other than Internet access.
INDEX status
As of May 1996, the status of INDEX is as follows. The access network has been designed. Software systemsfor monitoring user behavior, the network-user interface, and billing have been developed. The eight sub-experiments have been designed; certain design parameters may be modified as data is collected and analyzedusing software developed in Berkeley’s Econometrics Laboratory. Outstanding econometricians have offeredassistance in data analysis and interpretation. A trial experiment involving an eight-unit apartment buildingis underway to test the INDEX software.
The experimental system must be integrated with the campus network which is managed by the University’sInformation Systems & Technology (IS&T) department. The responsible authorities of IS&T have approvedthe design, agreed to cooperate with the experiment, and helped in preparing this proposal. The University’sAccounts Receivable department will handle user accounts. The experiment involves people, and so theAcademic Senate’s Human Subjects Committee must approve the protocol describing user participation. TheCommittee has been contacted, and will act on the INDEX protocol at their next meeting in August, 1996.
The two-year experiment will cost $670,000, based on equipment list prices and published tariffs. Thisamounts to a fully loaded cost of $170 per user per month, on average. The cost comprises two elements:leasing of ISDN, DS-1 and DS-3 lines, and acquiring equipment. The experiment will be implemented intwo stages, of roughly equal cost. The second stage, to start five months after the first, will be launched onlyif the first stage proceeds satisfactorily. This staging halves the financial risk.
INDEX is a project of the Center for Multimedia Networking, whose co-Directors are Professors Martin Vet-terli and Jean Walrand. Financial support for INDEX will come from industry and state and federal agencies.Initial support is expected from Pacific Telesis and CISCO. Professor Pravin Varaiya is the Principal Investi-gator of INDEX. Richard Edell, PhD student in Electrical Engineering and Computer Sciences, designed thenetwork and most of the software. Harish Chand, PhD student in Economics, together with Richard Edell,designed the experiments. Edell is a networking expert, Chand is an expert in experimental economics.
Hal Varian, Dean of the School of Information Management and Systems and Professor of Economics andthe Haas Graduate School of Business, and Dan McFadden, Chair of the Department of Economics, willadvise the INDEX researchers on data analysis and experimental design.
Proposal details
Section2 discusses three barriers in the current model of Internet Service Provision (ISP) that limit Internetuse and exclude a significant fraction of potential users. INDEX will estimate the magnitude of those limitsand suggest changes in the current ISP model to overcome those limits. Preliminary but suggestive data for
4

•
CO ISP••••••••
•••••••••••••
Subscriber AccessPorts (M) ISP LinkLoops (N)
Packet Switched(B bps total)
Circuit Switched(A bps per circuit)
Figure 1: Traditional ISP Resource Model.
the Berkeley network are presented.
Section3 presents the economic case for INDEX. It draws upon the relevant economics literature to supportthe proposed experimental design.
Section4 summarizes the goals, nature and timing of a series of eight sub-experiments that will produce dataabout user responses to service quality and prices.
Section5 describes the technology employed by INDEX. This includes: the INDEX access network, TCP/IPusage accounting and network QoS emulation.
Section6 gives a cost estimate for INDEX. It also discusses how the access network might be economicallysized if it were built by the Information Systems & Technology department to serve the campus community.
Section7 discusses possible future INDEX projects, including CATV access and non-university participation.
AppendixA describes the experiments in detail.
AppendixB describes the network engineering for the INDEX access network in detail.
2 Three Barriers
Figure1 depicts the current Internet Service Provision (ISP) model. Subscribers access the ISP node witha circuit-switched connection, usually over telephone lines through a 28.8 Kbps or lower speed modem.Access may be blocked because of the limited size of the modem pool. The ISP node has a high-speed,packet-switched link to the Internet backbone network (the “cloud” in the figure). The model erects threebarriers that restrict marketdepthand marketwidth. Market depth is measured by the range of service qualityoffered and the variety of applications that can be run over the network. Market width is measured by thefraction of potential users that are paying subscribers.
One barrier is created by the inability of the current version of IP (IPv4) to provide service quality guarantees,making some applications impractical to run over the Internet. This barrier will be removed if IP is suitably
5

upgraded (e.g., IPv6 can provide guarantees) or if ATM networks are widely deployed. INDEX does notaddress this barrier.1
The second barrier is raised by the fixed, low-speed, dedicated link through which subscribers access the ISPnode. Higher speed access is available, but it is too expensive.2 More importantly, this inflexible, low-speedaccess constrains user choice: for example, a subscriber does not have the option to pay more for higher-speedaccess for the duration of an interactive application.
The third barrier arises from the common form of ISP charges: a fixed access charge plus a fee proportionalto usage, measured by volume or connect time. (Some ‘free’ connect time may be bundled into the fixedaccess charge. Charge for ‘content’, such as access to databases, is ignored in this discussion.) The fixedcharge excludes the occasional or novice user, shrinking market width.
The first and second barriers limit market depth as service quality, needed for some applications, cannot beguaranteed. The second and third barriers combine to limit both depth and width. Depth is restricted becausesubscribers cannot run applications that temporarily require higher speed access for which they are willingto pay. Width is limited because only those potential users whose needs are met by the prevailing structureof charges will actually become subscribers. Users with a structure of demand that is not well-served by thefixed access speed or the form of charges, will not become subscribers.
How people become subscribers is not known. They are likely at first to be occasional users. After someexperience, they may become habitual users. The current form of ISP charges may exclude the occasionaluser who is a potential subscriber. Evidence of the transformation from familiarity into habitual use comesfrom the CommerceNet/Nielsen survey (CommerceNet/Nielsen, 1995). The survey shows that Internet usersare more likely to have higher incomes and Internet access at work. Another analysis of the CN/Nielsendata finds four distinct market segments—which the analysts name ‘Hard Core’, ‘Regular’, ‘Lapsed regular’,and ‘Infrequent’—dependent on type of Internet access, computer ownership and length of computer use(Hoffman, Kalsbeek and Novak, 1996).
The CN/Nielsen data comes from a telephone-based survey of 4,200 respondents. Its purpose was to deter-mine the characteristics (age, income, education) of those with Internet access, those who browsed the Web,and those who have used the Web to shop. INDEX will obtain much more detailed data. It will track the pat-tern of use (amount of time spent and data transferred, applications run) of the user group over time. Unlikethe CN/Nielsen survey, however, INDEX will not be projectable to the US and Canada.
In summary, the second and third barriers serve to exclude many applications and potential users, restrictingmarket depth and width. Preliminary data from the Berkeley campus suggest the existence of this restriction,but it is not possible to estimate its magnitude. INDEX will gauge this magnitude by estimating quality andprice elasticities, i.e., the change in patterns of applications and network usage as a function of changes inaccess quality and prices.
2.1 Preliminary Berkeley Data
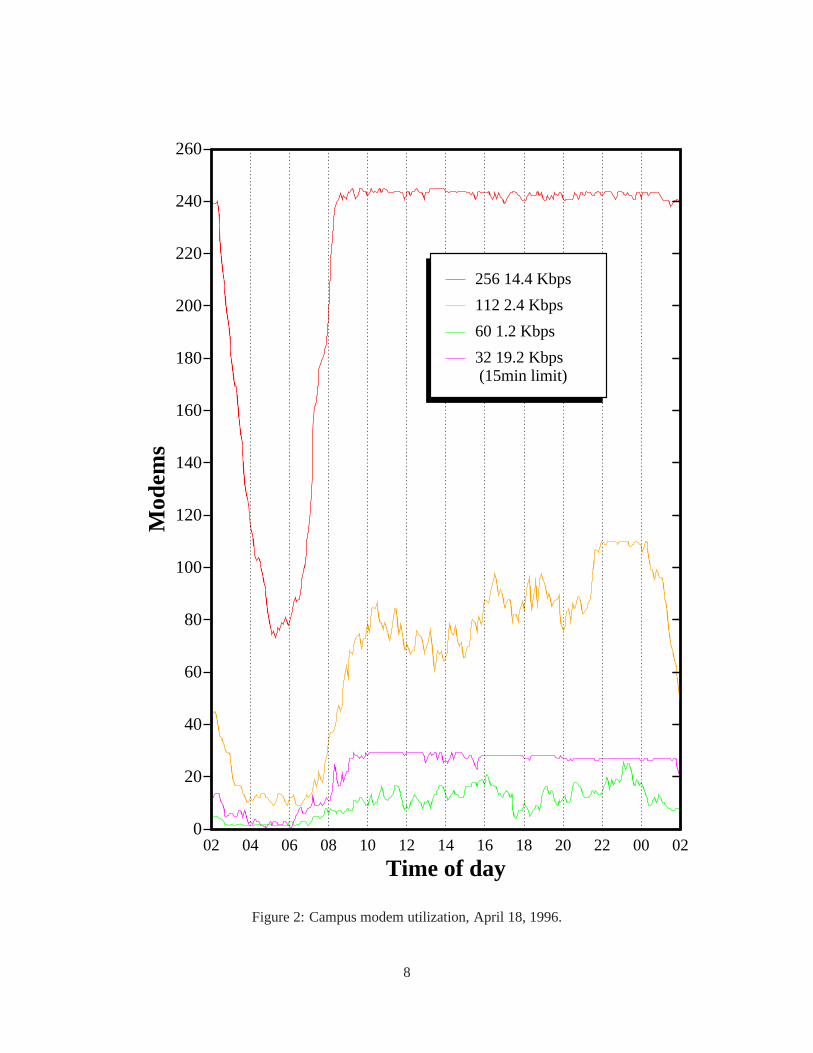
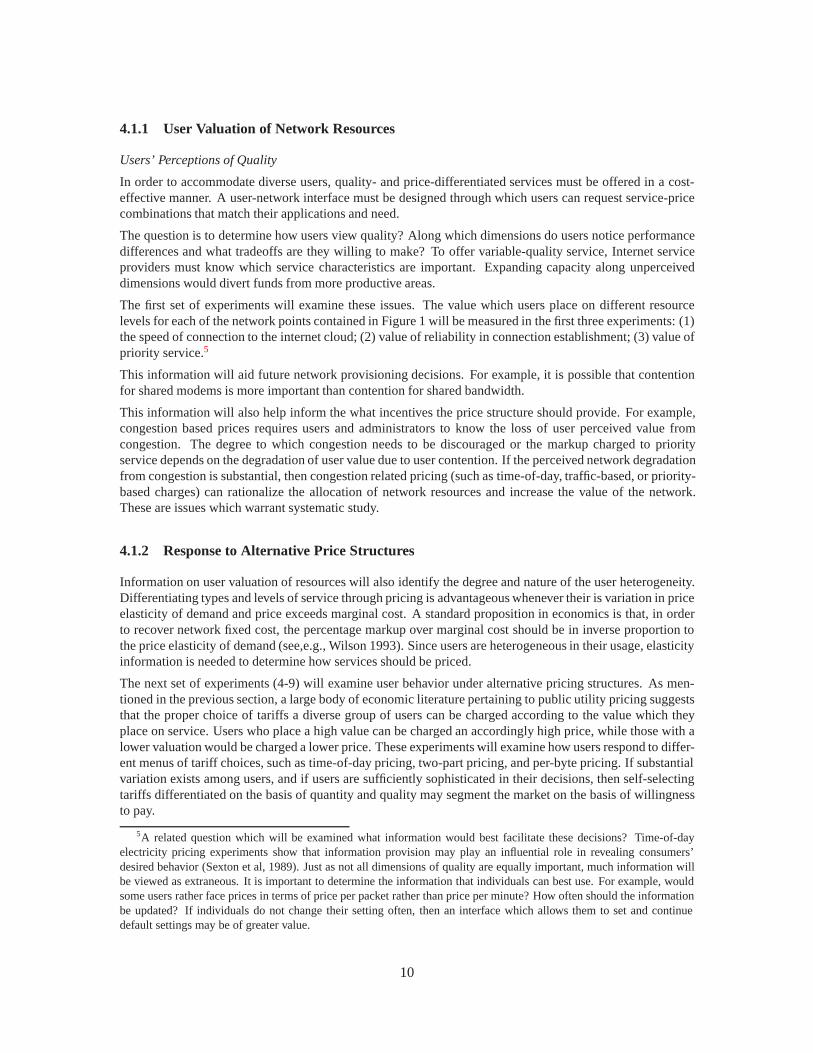
Remote access to the Berkeley network fits the ISP model of Figure1. The campus acts as the InternetService Provider. It is connected to the Internet backbone via a 45 Mbps, DS-3 link. Remote users accessthe network through a pool of modems. The pool consists of 128 28.8 Kbps modems limited to faculty use,32 19.2 Kbps modems limited to a 15-minute connection time (Warhol in Figure2), 256 14.4 Kbps, 112 2.4Kbps and 60 1.2 Kbps modems for a campus community of 40,000. The modem pool is accessed via phonelines to the Berkeley Central Office, from which the campus Centrex service is provisioned. Most modem
1However, a companion experiment involving a high-performance network emulator seeks to measure user subjectiveresponse to video applications over a network with variably quality guarantees.
2For example 56 Kbps Frame Relay access costs XXX, 128 Kbps ISDN access costs YYYY, and 1.5 Mbps DS-1access costs ZZZZ, according to Pacific Bell Internet. These costs do not include additional charges for circuit terminationequipment or the additional customer premises equipment. See (Pacific Internet, 1996).
6

connections use Home IP (PPP or SLIP).
Figure2 shows the typical daily pattern of modem use. The faculty pool is the least congested. All high-speed(14.4, 19.2) modems are used continually from 8.00 am until past 2.00 am. Evidently, the large demand is cur-tailed by blocking and resulting time delay, by reducing access speed which limits the range of applications3,and by flat-rate pricing of dedicated 28.8 Kbps modems. Users whose demand is not met by this modempool either suppress their demand or travel to campus for LAN access. The total number of TCP connectionsshows a daily cycle with a peak (in January, 1995) of 1,200 and a trough of 550. More interestingly, thereis a large variation in per-host usage even within the ten most active sub-domains. Data from the ElectricalEngineering and Computer Science Department sub-domain shows that 20 percent of users account for 93percent of total bytes exchanged between the campus and the rest of the world (Edell, McKeown and Varaiya,1995).
The following tentative conclusions may be drawn from the Berkeley data:
• The heavily congested use of the modem pool indicates a willingness to pay for better access;
• The daily pattern of peaks may be relieved by time-of-use pricing;
• The wide diversity in patterns of use across sub-domains and by user suggests that the market fornetwork access should be segmented.
3 Economic Rationale
To maximize the economic worth of current network resources and to optimally deploy future resources,pricing decisions should be based on empirical information about consumer valuation of quality-differentiatedservices and response to alternative tariff structures. This information can help to: (a) allocate resources onthe basis of user valuation rather than rationing through waiting times or chance; (b) provide correct signalsfor future network expansion; and (c) identify different market segments and target them for cost recoveryor profit maximization. The public utility pricing literature can lend theoretical direction to the empiricalresearch.
Internet service provision shares many features with public utilities. For example, telephone, electricity, andInternet provision all face declining marginal costs, usage with pronounced temporal patterns, and congestion.Despite these shared features, the pricing structures for utilities and Internet access are very different. Whiletelephony and electricity have been innovative in adopting time-of-day pricing, priority pricing, multi-parttariffs and self-selecting schedules, such pricing innovation has been absent from Internet pricing. Internetaccess is typically priced through a flat rate access charge and uniform usage fees. Such pricing practicereduces the economic worth of Internet service provision.
The public utility pricing literature of relevance to Internet is more fully discussed in Train (1991), Brown andSibley (1986), and Wilson (1993). That discussion explores two themes: (a) pricing resources so that theyare allocated on the basis of user value rather than an arbitrary rationing scheme such as waiting time; and(b) efficient pricing of resources to recover costs. The first theme leads to methods to maximize the economicvalue of network resources, the second seeks to differentiate the resources on the basis of quantity and qualityso as to appropriate this economic value.
The discussion below addresses congestion, usage-based and time-of-use and priority pricing, multi-parttariffs, and market segmentation.
Proposals for Internet congestion pricing are of little use to Internet service providers as they address con-gestion in the Internet “cloud” or propose congestion prices that are theoretically desirable but impractical.4
3Data not presented here shows that most data transfer occurs using FTP, which does not require high speed.4Shenker, Clark, Estrin, and Herzog (1996) discuss some of these issues. Congestion pricing focused on local pricing
7
0
20
40
60
80
100
120
140
160
180
200
220
240
260
Time of day
Mod
ems
02 04 06 08 10 12 14 16 18 20 22 00 02
256 14.4 Kbps
112 2.4 Kbps
60 1.2 Kbps
32 19.2 Kbps (15min limit)
Figure 2: Campus modem utilization, April 18, 1996.
8

Typically, there is only a very weak link between Internet prices and individual user traffic. As a consequence,users who occasionally need high bandwidth are either forced to lease over-provisioned dedicated lines, riskthe vagaries of the performance of shared resources, or forego the desired application altogether. Congestion-sensitive prices can increase the overall value of the network by making available resources when needed forhigh value applications.
Usage-based pricing such as per-byte charges of traffic needs study, because a small fraction of users typicallygenerate a large fraction of the traffic. Pronounced temporal variation in Internet usage suggests adoption oftime-of-use pricing. Priority service such as used in electricity provision can also increase welfare.
These variations in tariff structure all lead to more efficient allocation of available network resources providedthe price structure is properly selected on the basis of demand information.
Prices differentiated on the basis of quantity or quality can segment the market and maximize profits. Theprovision of Internet services involves large fixed costs and low marginal costs, so marginal cost pricing alonedoes not permit cost recovery. Estimates of price elasticities of access demand and usage demand are neededto determine where best to raise price over marginal cost in order to recover costs.
When demand for Internet access varies among the population, as the CN/Nielsen and Berkeley data indicate,a menu of service offerings can be improved through either a multi-part tariff or a set of self-selecting tariffs.In general, for any tariff with N distinct price blocks, there is a Paerto-superior tariff with N+1 blocks. Suchtariff designs could appeal to heavy users who desire a low marginal cost and are willing to pay a high fixedfee,withoutdeterring the occasional user, thus expanding the subscriber base.
Empirical research can determine whether individuals have strong preferences regarding tariff structures,whether they make rational choices when given more than one alternative tariff, and the amount of variationin usage and valuation. Self-selecting tariffs may also be used to segment the market in terms of willingnessto pay. Thus, it is possible to improve on the typical service offerings by block rate prices or self selectingtariffs, using estimated demand elasticities.
When pricing a product line, cross-price elasticities are needed to analyze the interrelationships of differentmarket segments. For example, appropriate pricing of different service quality levels needs to account for the“cannibalization” by one service of the demand for other services. This implies the need to understand howindividuals make tradeoffs between price, quantity, and quality for different applications and times of day.
In summary, empirical research about the structure of Internet demand would be extremely valuable in de-veloping service offerings that cater to a diverse population. This information could be used in the marketanalysis for new services and the optimal pricing of existing services. Such information would focus on users’perceptions of service quality, their valuation of service quality as measured by the different price elasticitiesof demand, and how these elasticities vary with user demographics and service quality.
4 Experimental Design
4.1 Goals
A series of eight experiments will be conducted to investigate the effects of alternative price and servicecombinations on consumer behavior, welfare, and satisfaction. These experiments will seek to examine theissues raised in the previous section and identify they key behavioral parameters needed for pricing decisions.The questions which are addressed may be grouped into: (1) ascertaining user value for price-based resourceallocations; (2) behavioral response to alternative pricing structures for cost recovery and profit maximization.
policies would be more useful. An important question is whether local policies can approximate theoretically superiorbut less practical schemes such as the smart market mechanism of Mackie-Mason and Varian (1994).
9
4.1.1 User Valuation of Network Resources
Users’ Perceptions of Quality
In order to accommodate diverse users, quality- and price-differentiated services must be offered in a cost-effective manner. A user-network interface must be designed through which users can request service-pricecombinations that match their applications and need.
The question is to determine how users view quality? Along which dimensions do users notice performancedifferences and what tradeoffs are they willing to make? To offer variable-quality service, Internet serviceproviders must know which service characteristics are important. Expanding capacity along unperceiveddimensions would divert funds from more productive areas.
The first set of experiments will examine these issues. The value which users place on different resourcelevels for each of the network points contained in Figure 1 will be measured in the first three experiments: (1)the speed of connection to the internet cloud; (2) value of reliability in connection establishment; (3) value ofpriority service.5
This information will aid future network provisioning decisions. For example, it is possible that contentionfor shared modems is more important than contention for shared bandwidth.
This information will also help inform the what incentives the price structure should provide. For example,congestion based prices requires users and administrators to know the loss of user perceived value fromcongestion. The degree to which congestion needs to be discouraged or the markup charged to priorityservice depends on the degradation of user value due to user contention. If the perceived network degradationfrom congestion is substantial, then congestion related pricing (such as time-of-day, traffic-based, or priority-based charges) can rationalize the allocation of network resources and increase the value of the network.These are issues which warrant systematic study.
4.1.2 Response to Alternative Price Structures
Information on user valuation of resources will also identify the degree and nature of the user heterogeneity.Differentiating types and levels of service through pricing is advantageous whenever their is variation in priceelasticity of demand and price exceeds marginal cost. A standard proposition in economics is that, in orderto recover network fixed cost, the percentage markup over marginal cost should be in inverse proportion tothe price elasticity of demand (see,e.g., Wilson 1993). Since users are heterogeneous in their usage, elasticityinformation is needed to determine how services should be priced.
The next set of experiments (4-9) will examine user behavior under alternative pricing structures. As men-tioned in the previous section, a large body of economic literature pertaining to public utility pricing suggeststhat the proper choice of tariffs a diverse group of users can be charged according to the value which theyplace on service. Users who place a high value can be charged an accordingly high price, while those with alower valuation would be charged a lower price. These experiments will examine how users respond to differ-ent menus of tariff choices, such as time-of-day pricing, two-part pricing, and per-byte pricing. If substantialvariation exists among users, and if users are sufficiently sophisticated in their decisions, then self-selectingtariffs differentiated on the basis of quantity and quality may segment the market on the basis of willingnessto pay.
5A related question which will be examined what information would best facilitate these decisions? Time-of-dayelectricity pricing experiments show that information provision may play an influential role in revealing consumers’desired behavior (Sexton et al, 1989). Just as not all dimensions of quality are equally important, much information willbe viewed as extraneous. It is important to determine the information that individuals can best use. For example, wouldsome users rather face prices in terms of price per packet rather than price per minute? How often should the informationbe updated? If individuals do not change their setting often, then an interface which allows them to set and continuedefault settings may be of greater value.
10

Table 1: Summary of Experiments
Exp # Description Duration Academic Calendar0 Practice Period 2 Weeks Fall Semester1 Value of Connection Speed 12 Weeks Fall Semester2 Value of Access Reliability 4 Weeks Spring Semester3 Value of Priority Service 6 Weeks Spring Semester4 Demand under Traffic-Based Charges12 Weeks Fall Semester5 Tariff Selection 10 Weeks Fall Semester6 Time of Use and Peak Shifting 8 Weeks Spring Semester7 Demand under Flat Rate Pricing 12 Weeks Summer8 Two Part Tariff Design 10 Weeks Spring Semester
4.2 Procedures
Berkeley students, faculty and staff will be recruited to participate in the experiment. Subjects will receivea subsidized dedicated ISDN connection in exchange for agreeing to connect through the Billing Gatewayand pay usage-based prices. A series of experiments involving different methods and levels of prices will beconducted in order to investigate the questions outlined above.
4.2.1 Subject pool
The University of California at Berkeley provides a ready group of experimental subjects. The campusmodem pool is highly congested. The potential to receive a high-speed dedicated connection to the campusnetwork should make participation attractive. No similar service currently exists.
The availability of this subject pool should reduce the costs of setting up the experiment and ensuring con-tinued participation. As a condition of participation, subjects must agree to allow their use of the networkto be monitored. This will include not only their usage from the ISDN connection provided through theexperiment, but their use via the campus modem pool as well.
Since the experiment will last roughly two years, students expecting to complete their degree before the endof the experiment will not be recruited. Otherwise, both undergraduate and graduate students will be recruitedwith the goal of obtaining a suitable variation in field of study, expected computer usage, travel distance tocampus, and demographic characteristics.
As described more fully in the following section, a stated preference survey experiment will be conductedprior to and after the main experiment. Completion of this survey will be a condition of application forparticipation in the experiment. In addition to eliciting attitudes and preferences between hypothetical servicechoices, the survey will gather the necessary demographic information to select a suitable distribution ofsubjects. The revealed demand from INDEX will serve to calibrate the stated preference experiment.
4.2.2 Sequence of experiments
Once the network and billing system are in place, a series of eight experiments will be conducted to examinethe perception and valuation of service quality. A trial or “practice” period of 2-4 weeks will allow thesubjects to gain familiarity with the billing interface and experimental procedures. During the practice period,users will be given pricing information but they will not be charged. Table1 summarizes the experiment.
11

Experiments 1-3 explore how the resources shown in Figure 1 affect users’ valuation of Internet access. Inparticular, Experiment 1 varies access link bandwidth (A); Experiment 2 varies access port contention (N andM); and Experiment 3 introduces interference over the packet switched link.
Experiments 5-8 explore how users react to different pricing schemes. In most of these experiments, userswill compare an alternative pricing schemes with a flat rate scheme. Experiment 4 introduces the users toper-byte pricing; experiment 5 offers users a self-selecting tariff where they may choose per-minute, per-byte,or a combination of the two pricing methods. Experiment 6 will gauge how much traffic can be shifted awaythe peak by time of use pricing. Experiment 7 will determine the usage and value under a flat-rate pricingsystem. Lastly, experiment 8 examines user self-selection into different two-part tariffs.
Each of these experiments is described in detail in Appendix A.
Table 1 shows the tentative schedule for the series of experiments. Rotation groups will be used to accountfor timing effects related to the academic calendar as well as to investigate a wider range of treatment levels.Experiment One, Elasticity of Demand, will be repeated during the summer when some of the subjects arelikely to be out of town.
4.2.3 Analysis
Randomized assignment of treatment groups allows many more questions to be answered than possible innon-experimental settings. Without controlled experiments, one typically is forced to turn to non-experimentalmarket data. If such data exists at all, it is usually plagued by problems of self-selection. Rather than ob-serving exogenous variation in the variables of interest such as price, one typically observes price and serviceofferings in to which individuals self-selected on the basis on expected outcome (Hausman, 1985). Therefore,econometric analysis is greatly complicated by the need to undo the effects of self-selection before the rela-tionships of interest can be isolated. While econometric methods may be used to account for self-selectionbias, they are often sensitive to embedded parametric assumptions, or have stringent data requirements fornon-parametric approaches.
The basic model to be estimated involves the relationship between price of the different service offerings andthe quantity of service use,
Qijt = fj(Pit, Zi) + εijt,
where i indexes individuals,j indexes the types of usage, andt denotes the time period. The types ofusage include the different service offerings (e.g., connection speed) as well as use of the network outsidethe subsidized connection (such as on-campus use).6 Pit represents the set of prices faced by individuali in periodt, allowing for cross-price effects. The vectorZ includes individual-specific demographic andpossibly attitudinal variables. The unobserved factors influencing usage are captured by the error term,εijt,which may be specified to allow an appropriate covariance structure for temporal effects, service specificeffects, and individual specific effects. Through the specification of a functional form forf consistent witheconomic theory and the distribution of the error term, the price elasticity of usage may be measured andused to determine optimal price schedules and bundles for the different services.
4.2.4 Stated preference experiment
Economists traditionally prefer to infer preferences from data based on actual choices rather than attemptingto measure preferences directly. The former approach is often referred to as revealed preference analysis,while the latter is often termed stated preference analysis. While revealed preference methods provide morereliable incentives to accurately represent ones preferences, stated preference methods have several benefits.
6Different applications used (e.g., HTTP, FTP, email) may be treated either as separate services or as additionalcovariates.
12
Repeated measurements are possible under various situations whereas market data typically only present dataon the observed choice. This not only permits more efficient estimation of preference parameters, but alsoavoids problems of self-selection bias. The relevant choice attributes can be uncorrelated by design in statedpreference experiments whereas they are typically correlated in market data. Lastly, data can be producedrelatively cheaply when market data may be either insufficient or nonexistent. Whereas market data cannotdirectly predict response to new alternatives, preferences can be elicited for these new choices.
For these reasons, a stated preference experiment will be conducted alongside the main experiments. This datashould nicely complement the observed behavior. In the context of the pricing experiment, the stated pref-erence data will have several additional benefits. Preferences are likely to change (or become more distinct)over the course of the experiment. A stated preference experiment conducted before and after the experimentwill provide a good basis for measuring preference change. This data will also permit the calibration of statedpreference results to revealed preference data. This information would permit future stated preference exper-iments regarding new product offerings and market analysis to be performed and calibrated to actual marketbehavior (Atherton and Train, 1995). With this calibration, market forecasting may be performed throughinexpensive stated preference methods without great risk of measurement bias.
The stated preference experiment will collect data on user’s preferences for different service offerings. Theseofferings will vary over the dimensions examined in the usage experiments—service quality (connectionspeed, access reliability), and tariff components (fixed fee, connection time, traffic charges, time-of-use dis-counts). It will also examine other dimensions not part of the usage experiments such as customer supportand content provision. Attitudinal information will also be elicited for background information as well aspossible incorporation into econometric models (Train, McFadden and Goett, 1987).
The stated preference experiment data will be analyzed using a random parameters logit model using statis-tical software developed in the economics department at UC Berkeley. This model is extremely useful formarket analysis of new product offerings and market segmentation analysis by measuring the distribution ofwillingness to pay for different product attributes (Revelt and Train, 1996).
5 INDEX Technology
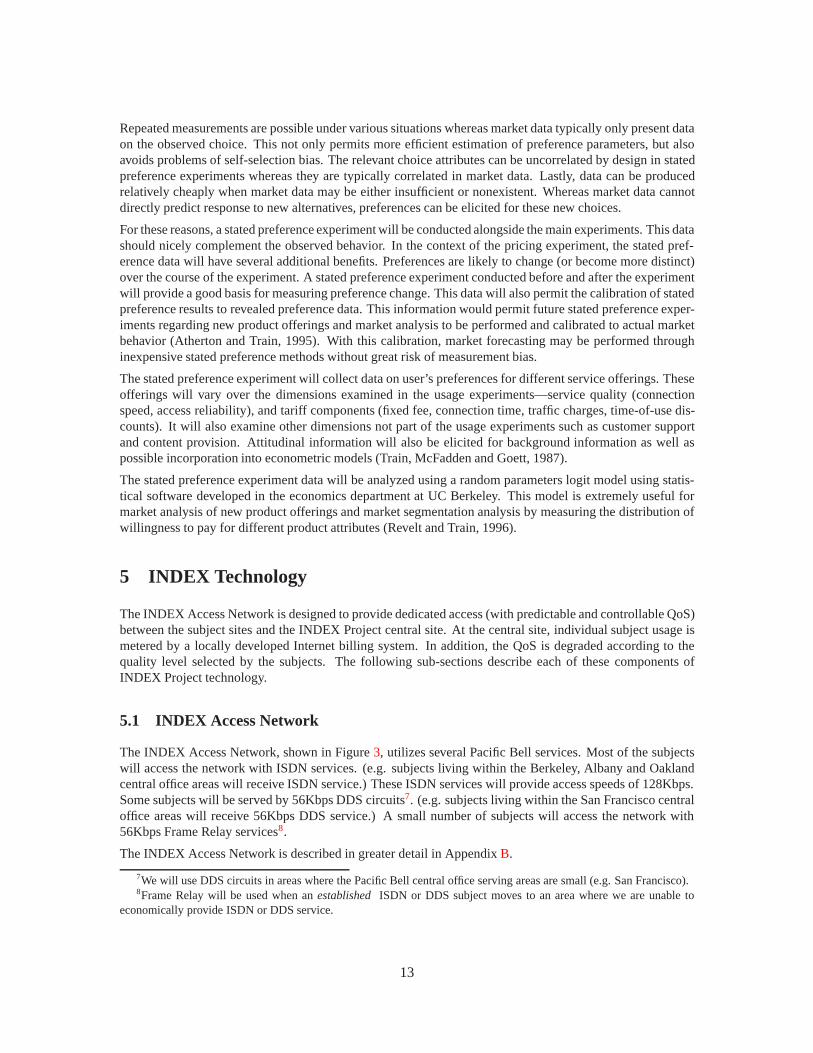
The INDEX Access Network is designed to provide dedicated access (with predictable and controllable QoS)between the subject sites and the INDEX Project central site. At the central site, individual subject usage ismetered by a locally developed Internet billing system. In addition, the QoS is degraded according to thequality level selected by the subjects. The following sub-sections describe each of these components ofINDEX Project technology.
5.1 INDEX Access Network
The INDEX Access Network, shown in Figure3, utilizes several Pacific Bell services. Most of the subjectswill access the network with ISDN services. (e.g. subjects living within the Berkeley, Albany and Oaklandcentral office areas will receive ISDN service.) These ISDN services will provide access speeds of 128Kbps.Some subjects will be served by 56Kbps DDS circuits7. (e.g. subjects living within the San Francisco centraloffice areas will receive 56Kbps DDS service.) A small number of subjects will access the network with56Kbps Frame Relay services8.
The INDEX Access Network is described in greater detail in AppendixB.
7We will use DDS circuits in areas where the Pacific Bell central office serving areas are small (e.g. San Francisco).8Frame Relay will be used when anestablished ISDN or DDS subject moves to an area where we are unable to
economically provide ISDN or DDS service.
13

CampusNetwork
&Internet
BillingSystem
• • •
OKLDCA11•••
BKLYCA01•••
SFCAxx•••
SFCA01•••PacBell
FrameRelay
Network 56Kb/s DDS
128Kb/s ISDN
1.5Mb/s DS-1
45Mb/s DS-3
ALBYCA01•••
Figure 3: INDEX Access Network.
5.2 TCP/IP Usage Accounting
The INDEX Project will use a locally designed Internet billing system. This billing system functions as aconnection aware Internet router. Connection establishment is postponed while the user is contacted, veri-fying in a secure way that they are prepared to pay. By presenting the user with cost and price information,the system can be used for cost recovery and to encourage efficient use of network resources. The systemrequires no changes to existing protocols or applications.
The operation of the billing system is described fully in (Edell, McKeown, Varaiya, 1995). The INDEXProject implementation of the billing system differs substantially from the implementation described in thepaper. For the INDEX Project, we will substitute a Netscape/WWW interface for the purchasing agentsoftware. By using a Netscape/WWW interface, we can describe the goals of the individual sub-experimentsto the subjects. Additionally, the “Billing Gateway” (BGW) functionality is implemented differently thanwas described in the paper. For INDEX, the BGW is implemented in the SunOS kernel. This implementationpermits the Network QoS Emulation capability that is described in the next sub-section.
5.3 Network QoS Emulation
Conducting an experiment such as INDEX requires controlling the QoS delivered to the subjects. Today’sInternet is generally incapable of controlling QoS. To facilitate INDEX, we have implemented an enhancedBGW. This enhanced BGW can selectively degrade the performance of individual TCP connections9. Thisdegradation may take the form of limiting bandwidth, delaying datagram delivery or discarding datagrams.The level of degradation may be quickly altered in response to subject choices or experimentally controlledrandom processes.
Admittedly, INDEX cannot provide a “better” QoS than the baseline undegraded QoS. However, much of
9Classes of connections may also be degraded. For example, all connections on behalf of a given subject.
14
our subject pool is accustomed to a congested 14.4Kbps modem pool for accessing the campus network. Inaddition, many of the services that our subjects would like to access are in fact campus services for whichthere would be little other sources of degradation. Therefore, we believe that INDEX is reasonably capableof controlling the QoS delivered to the subjects.
6 Funding Requirements
All the dollar figures in here need to be reworked...
INDEX project costs are dominated by access network costs. Access network costs depend on experimentlength and the number and location of experimental subjects. Our current plans call for a two year experimentwith approximately 160 subjects10. The experiment will be staged in two phases to facilitate deployment ofthe access network and to reduce financial risk. The total (two-year) cost for the INDEX access network isapproximately $680,000. These costs broken down by phase and type in Table2. These costs are explainedin much greater detail in AppendixB.
Table 2: INDEX access network cost summary.
Servicesa Equipmentb TotalPhase 1 $56,250 $166,425 $222,675Phase 2 $248,807 $147,000 $395,807Phase 2 Run-out $62,859 – $62,859Total $367,916 $313,425 $681,341
aPacific Bell service installations and recurring charges.bMostly CISCO equipment.
6.1 IS&T Network Access Costs
The INDEX access network is engineered to providededicated accessbetween the subject homes and thecentral site. This is not the usual Internet access arrangement and would represent over-engineering for nearlyany Internet access provider including U.C. Berkeley’s IS&T department. This section discusses how IS&Tmight provision an ISDN access network, the costs of such a network, and the cost recovery possibilities.
One possible relationship between IS&T and a “customer” is as follows:11
• The customer provides their own ISDN equipment.
• IS&T installs aCentrex ISDN BRI in the customer’s home (replacing the customer’s existing analogphone service).
• IS&T provides the central resources.
10Seventy to be served by the Berkeley central office; 70 by the nearby Albany and Oakland central offices; and 20 bythe more distant San Francisco or Walnut Creek central offices.
11An alternative arrangement makes sense for low intensity users. The less intense users will be better off usingPacific Bells Home-ISDN BRI services. This service costs $16/month less than Centrex ISDN BRI service but imposes a$0.01/minute cost for daytime usage (per B-channel, 8am-6pm, Monday-Friday). Therefore, a user who connects to thecampus for fewer than 80 B-channel minutes/business day will be better off with Home-ISDN. These less frequent userscan utilize the same central campus resources as the Centrex ISDN BRI users.
15

• The customer pays IS&T for the BRI, off-Centrex phone calls, and a usage sensitive charge for theaccessing IS&T’s central resources.
Under this arrangement, the cost to the customer is composed of fixed and variable components. The fixedcost component would be approximately $500 for the equipment and BRI installation, and $40/month for BRIservice. Naturally, the variable cost component would depend on individual customer usage and the pricingschedule. The cost, to IS&T for the central resources would be approximately $42/month per B-channel. Thisincludes service installation and equipment costs amortized over three years. Design of a pricing schedulewhich recovers IS&T’s costs is one of the goals of the INDEX project.
6.2 ISP Access Cost Comparison
The service quality delivered by the INDEX Project access network is equal to the quality of several commer-cial ISP offerings (i.e. flat-rate 128 Kbps access). These commercial ISP offerings cost the end-user about$375/month while the INDEX Project access network costs $150/month. Frame Relay (56 Kbps) servicecosts about $400/month. These cost figures assume an 36 month ammortization for equipment.
the following economics don’t seem very compelling for an IS&T offering. I’ll have to do some thinkingabout this. I think that perhaps 1/hr day peak usage may not support an IS&T network.
The service quality delivered by the IS&T network is simlar to many commercial ISP offerings (i.e. usagesensitive 64 or 128 Kbps access). The commercial ISP offering would cost the end-user about $90/monthwhile the IS&T service would cost about $70/month. These cost figures assume an 36 month ammortizationfor equipment and 1 hour of daytime usage per-day.
7 Future Experiments
The experiments described in this proposal are the beginning of we hope to be many Internet demand ex-periments. This section of this document is intended to describe the outlook for future INDEX experiments.None of these future experiments are included in the budget over-viewed in Section6 or in the budget detailedin AppendixB.
7.1 General Population Subjects
The INDEX Project results can be better calibrated to the general population if our subject pool were ex-panded to include general population persons. While including these subjects increases the administrativeburden for the project (subject recruitment, billing & payment processing, resolution of University policyissues, etc.), we believe that the additional burden can be managed once the U.C. affiliates experiment isunderway.
We believe that general population subjects can be adequately served with 56 Kbps DDS service becausetheir existing Internet access options do not include the “free” 14.4 Kbps access available to U.C. affiliates.This DDS service does not require the geographical density that our ISDN services require. In addition, weexpect general population subjects to participate in the experiments year-round. Therefore, we anticipatebeing complete the INDEX experiments in about half the calendar time that it takes for U.C. affiliates.
All together, these factors lead us to believe that we could add 200 general population subjects for approx-imately $300,000 over two years. This extension would structured as two groups of 100 subjects. The firstgroup would be studied in the first year and then the experimental resources would be relocated to serve thesecond group.
16
ISP
•••••••••••••
Subscribers (N) CATV ISP Link
Packet Switched(B bps total)
Packet Switched(A bps total)
Figure 4: Cable Television ISP Resource Model.
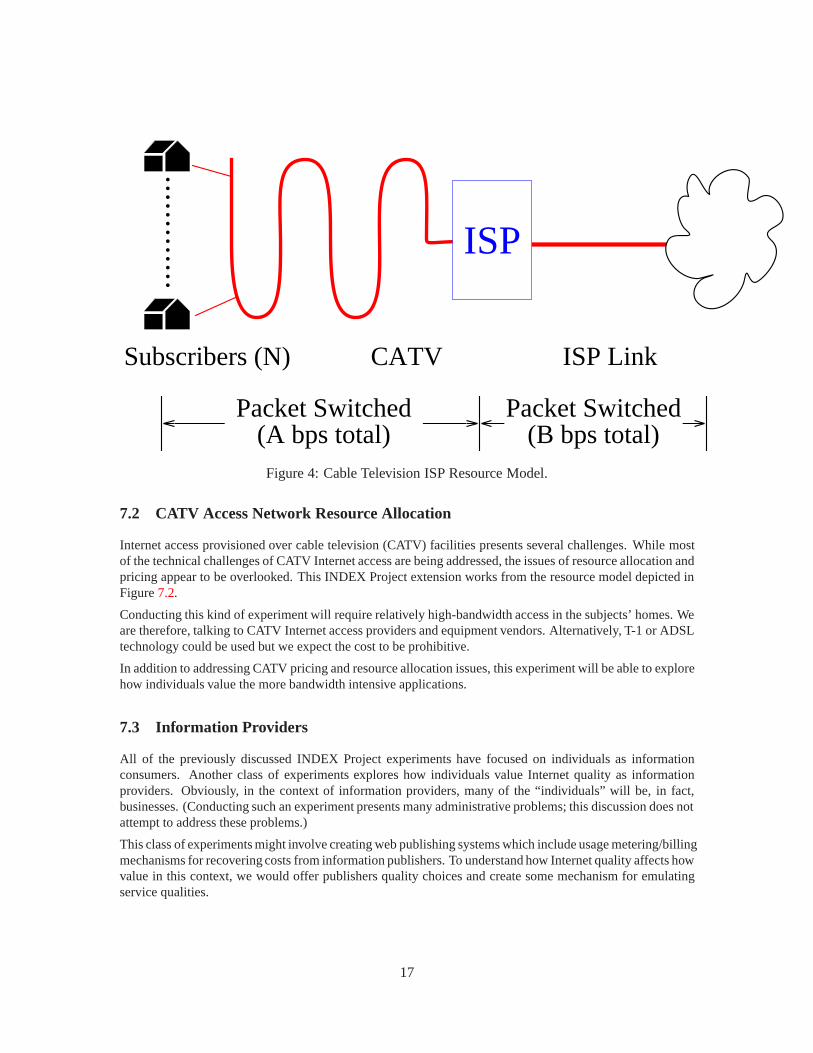
7.2 CATV Access Network Resource Allocation
Internet access provisioned over cable television (CATV) facilities presents several challenges. While mostof the technical challenges of CATV Internet access are being addressed, the issues of resource allocation andpricing appear to be overlooked. This INDEX Project extension works from the resource model depicted inFigure7.2.
Conducting this kind of experiment will require relatively high-bandwidth access in the subjects’ homes. Weare therefore, talking to CATV Internet access providers and equipment vendors. Alternatively, T-1 or ADSLtechnology could be used but we expect the cost to be prohibitive.
In addition to addressing CATV pricing and resource allocation issues, this experiment will be able to explorehow individuals value the more bandwidth intensive applications.
7.3 Information Providers
All of the previously discussed INDEX Project experiments have focused on individuals as informationconsumers. Another class of experiments explores how individuals value Internet quality as informationproviders. Obviously, in the context of information providers, many of the “individuals” will be, in fact,businesses. (Conducting such an experiment presents many administrative problems; this discussion does notattempt to address these problems.)
This class of experiments might involve creating web publishing systems which include usage metering/billingmechanisms for recovering costs from information publishers. To understand how Internet quality affects howvalue in this context, we would offer publishers quality choices and create some mechanism for emulatingservice qualities.
17

References
[1] Atherton, T. and Kenneth Train. 1995. “Rebates, Loans, and Customers’ Choice of Appliance EfficiencyLevel: Combining Stated- and Revealed-Preference Data.”Energy Journal, Vol. 16, No. 1, pp. 55-69.
[2] Bohn, Roger, Hans-Werner Braun, and Stephen Wolff. 1994. “Mitigating the coming Internet crunch:multiple service levels via Precedence.”
[3] Cocchi, Ron, Scott Shenker, Deborah Estrin, Lixia Zhang. “Pricing in Computer Networks: Motivation,Formulation, and Example.”
[4] CommerceNet/Nielsen. 1995. “ The CommerceNet/Nielsen Internet Demographic Survey, ExecutiveSummary,” CommerceNet Consortium/Nielsen Media Research.
[5] Edell, Richard, Nick McKeown and Pravin Varaiya. 1995. “Billing Users and Pricing for TCP.” IEEE J.Selected Areas in Communications. Vol. 13, No. 7.
[6] Gupta, Alok, Dale Stahl and Andrew Whinston. 1994. “Managing the Internet as an Economic System.”Technical report, University of Texas at Austin, TX, July 1994.
[7] Hausman, Jerry. 1985. “The Econometric of Nonlinear Budget Sets.” Econometrics. Vol. 53, No. 6.
[8] Hoffman, Donna, William Kalsbeek and Thomas Novak. 1996. “Internet Use in the United States:1995 Baseline Estimates and Preliminary Market Segments.” Project 2000 Working Paper. VanderbiltUniversity.
[9] Kelly, Frank P. “Charging and Accounting for Bursty Connections.”
[10] Low, Steven and Pravin Varaiya. “A New Approach to Service Provision in ATM Networks.”IEEEGlobecom, pp. 1633-37, 1991.
[11] Mackie-Mason, Jeffrey, Liam Murphy and John Murphy. 1995. “The Role of Responsive Pricing in theInternet.”
[12] Mackie-Mason, Jeffrey and Hal Varian. 1994. “Pricing the Internet.”
[13] McFadden, Daniel. 1986. “The Choice Theory Approach to Market Research.” Marketing Science. Vol.5, No. 4.
[14] Pacific Internet. 1996. Reference about tariffs.
[15] Revelt, David and Kenneth Train. 1996. “Incentives for Appliance Efficiency: Random-ParametersLogit Models of Households’ Choices.” mimeo.
[16] Sexton, Richard, Terri Sexton, Joyce Wann, and Catherine Kling. 1989. “The Conservation and WelfareEffects of Information in a Time-of-Day Pricing Experiment.” Land Economics, Vol. 65, No. 3.
[17] Shenker, Scott. “Service Models and Pricing Policies for an Integrated Services Internet.”
[18] Srinagesh, Padmanabhan. 1995?. “Internet Cost Structures and Interconnection Agreements.”
[19] Train, Kenneth. 1986. Qualitative Choice Analysis. Cambridge: MIT Press.
[20] Train, Kenneth. 1986. Optimal Regulation. Cambridge: MIT Press.
[21] Train, Kenneth, Daniel McFadden, and Andrew Goett. 1987. “Consumer Attitudes and Voluntary RateSchedules for Public Utilities.” Review of Economics and Statistics.
[22] Wilson, Robert. 1993. Nonlinear Pricing. Oxford: Oxford University Press.
18
Circuit Switched(A bps per circuit)
Connection Delays(i.e. busy signals)
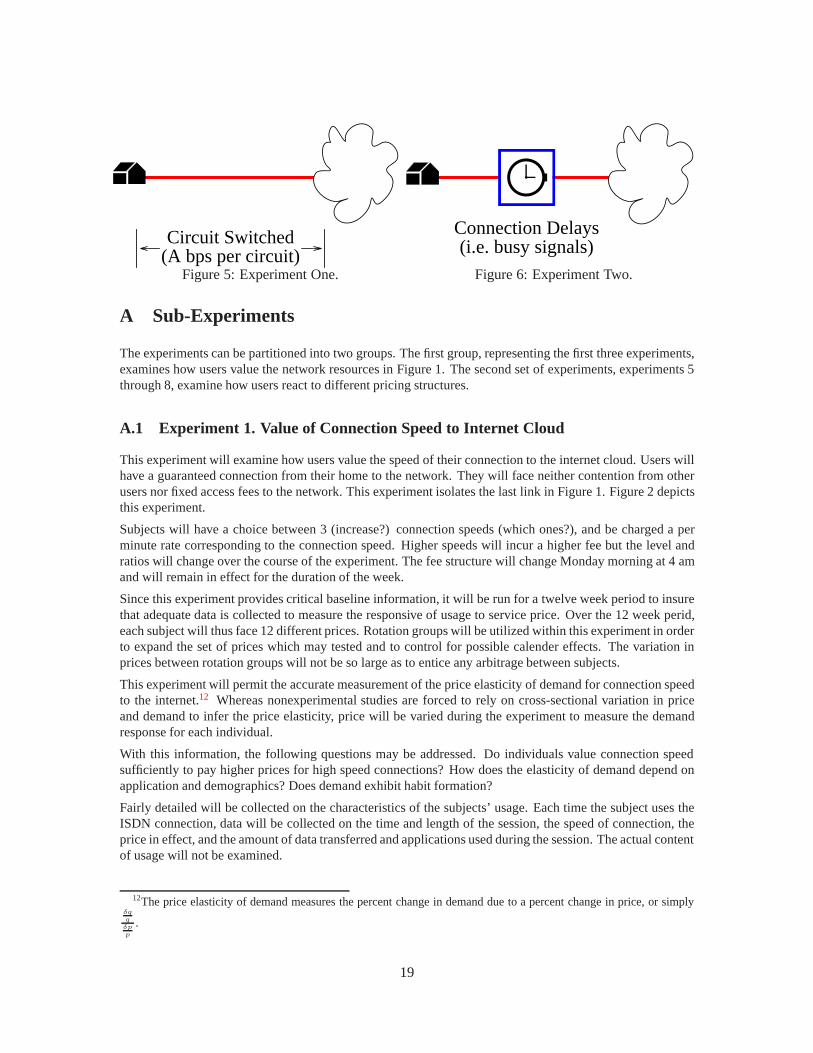
Figure 5: Experiment One. Figure 6: Experiment Two.
A Sub-Experiments
The experiments can be partitioned into two groups. The first group, representing the first three experiments,examines how users value the network resources in Figure 1. The second set of experiments, experiments 5through 8, examine how users react to different pricing structures.
A.1 Experiment 1. Value of Connection Speed to Internet Cloud
This experiment will examine how users value the speed of their connection to the internet cloud. Users willhave a guaranteed connection from their home to the network. They will face neither contention from otherusers nor fixed access fees to the network. This experiment isolates the last link in Figure 1. Figure 2 depictsthis experiment.
Subjects will have a choice between 3 (increase?) connection speeds (which ones?), and be charged a perminute rate corresponding to the connection speed. Higher speeds will incur a higher fee but the level andratios will change over the course of the experiment. The fee structure will change Monday morning at 4 amand will remain in effect for the duration of the week.
Since this experiment provides critical baseline information, it will be run for a twelve week period to insurethat adequate data is collected to measure the responsive of usage to service price. Over the 12 week perid,each subject will thus face 12 different prices. Rotation groups will be utilized within this experiment in orderto expand the set of prices which may tested and to control for possible calender effects. The variation inprices between rotation groups will not be so large as to entice any arbitrage between subjects.
This experiment will permit the accurate measurement of the price elasticity of demand for connection speedto the internet.12 Whereas nonexperimental studies are forced to rely on cross-sectional variation in priceand demand to infer the price elasticity, price will be varied during the experiment to measure the demandresponse for each individual.
With this information, the following questions may be addressed. Do individuals value connection speedsufficiently to pay higher prices for high speed connections? How does the elasticity of demand depend onapplication and demographics? Does demand exhibit habit formation?
Fairly detailed will be collected on the characteristics of the subjects’ usage. Each time the subject uses theISDN connection, data will be collected on the time and length of the session, the speed of connection, theprice in effect, and the amount of data transferred and applications used during the session. The actual contentof usage will not be examined.
12The price elasticity of demand measures the percent change in demand due to a percent change in price, or simplyδqq
δpp
.
19
Interfering Traffic
A bps
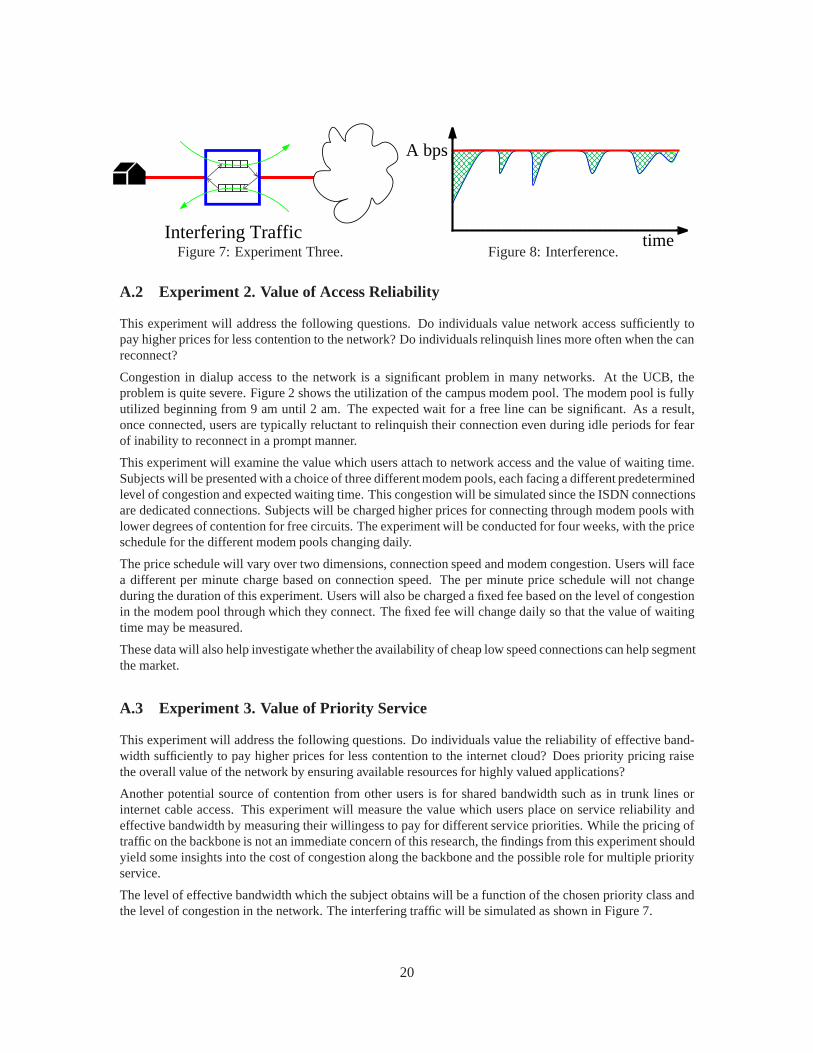
timeFigure 7: Experiment Three. Figure 8: Interference.
A.2 Experiment 2. Value of Access Reliability
This experiment will address the following questions. Do individuals value network access sufficiently topay higher prices for less contention to the network? Do individuals relinquish lines more often when the canreconnect?
Congestion in dialup access to the network is a significant problem in many networks. At the UCB, theproblem is quite severe. Figure 2 shows the utilization of the campus modem pool. The modem pool is fullyutilized beginning from 9 am until 2 am. The expected wait for a free line can be significant. As a result,once connected, users are typically reluctant to relinquish their connection even during idle periods for fearof inability to reconnect in a prompt manner.
This experiment will examine the value which users attach to network access and the value of waiting time.Subjects will be presented with a choice of three different modem pools, each facing a different predeterminedlevel of congestion and expected waiting time. This congestion will be simulated since the ISDN connectionsare dedicated connections. Subjects will be charged higher prices for connecting through modem pools withlower degrees of contention for free circuits. The experiment will be conducted for four weeks, with the priceschedule for the different modem pools changing daily.
The price schedule will vary over two dimensions, connection speed and modem congestion. Users will facea different per minute charge based on connection speed. The per minute price schedule will not changeduring the duration of this experiment. Users will also be charged a fixed fee based on the level of congestionin the modem pool through which they connect. The fixed fee will change daily so that the value of waitingtime may be measured.
These data will also help investigate whether the availability of cheap low speed connections can help segmentthe market.
A.3 Experiment 3. Value of Priority Service
This experiment will address the following questions. Do individuals value the reliability of effective band-width sufficiently to pay higher prices for less contention to the internet cloud? Does priority pricing raisethe overall value of the network by ensuring available resources for highly valued applications?
Another potential source of contention from other users is for shared bandwidth such as in trunk lines orinternet cable access. This experiment will measure the value which users place on service reliability andeffective bandwidth by measuring their willingess to pay for different service priorities. While the pricing oftraffic on the backbone is not an immediate concern of this research, the findings from this experiment shouldyield some insights into the cost of congestion along the backbone and the possible role for multiple priorityservice.
The level of effective bandwidth which the subject obtains will be a function of the chosen priority class andthe level of congestion in the network. The interfering traffic will be simulated as shown in Figure 7.
20

A.4 Experiment 1a. Price Elasticity of Connection Speed, Revisited
This experiment will be rerun for two weeks with two goals in mind. First, repeating the experiment can helpinvestigate whether price elasticities have changed over time. More importantly, rerunning the experimentwill help subjects to readjust to making choices based on connection speed and price. It is important to returnto this baseline so that salient comparisons to charges based on the traffic generated may be made.
A.5 Experiment 4. Demand under Traffic-Based Charges
How price sensitive is the amount of user generated traffic? What are the optimal usage charges for bandwidthon demand? How much learning about traffic generation occurs? Does the price elasticity change over time?
To the extent that service degradation occurs due to network traffic, prices should reflect the level of traf-fic which the user generates. Charges based solely on connection time result in a negative externality andincreased congestion.
While many researchers have suggested that users should be charged on the basis of their traffic, little isknown about whether users will adequately understand the basis for such prices, whether usage will besensitive to such prices, and whether users could benefit from usage based prices due to a reduction in networkcongestion. These questions may be addressed by examining the behavior of users when facing charges perbyte of traffic.
In this experiment, subjects will face per byte charges which change once per week during the eight weekduration of the experiment. Prices will be calibrated so that total charges would be approximately the same asunder per minute charges in the absence of behavioral effects. Of primary interest is whether usage decreasesin comparison to the first experiment, and whether usage decreases more when per byte charges are higher.
A.6 Experiment 5. Tariff Self-Selection
Would individuals voluntarily choose tariffs based on bytes rather than minutes? Are these choices of self-selecting tariffs rational? Is usage sufficiently predictable?
In this experiment, subjects will be presented with a choice of 3 different connection speeds and three differenttariff structures. The tariff structures will be different combinations of per minute charges and per bytecharges. Users will be offered the choice of being charged exclusively on the basis of either minutes or bytes,as well as the choice of having half of the charges being determined by each. (Include details on calibration,most likely based on past usage.)
Users will be asked to select which tariff structure they wish to be billed under for the course of the week.The prices contained in the tariff structure will remain in effect for two weeks at a time. Therefore, subjectswill have a chance to learn from past behavior.
A.7 Experiment 6. Time-of-Use Charges and Peak Shifting
Do individuals value connection speed sufficiently to pay higher prices for high speed connections?
Network use displays regular temporal patterns. For example, the modem utilization plots in Figure 3(?)show that the patterns of use throughout the day, as well as the consequences for congestion. In order toavoid building extra capacity to meet peak usage, price incentives may be provided in an effort to shift somedemand from peak to non-peak periods. This approach has been tried extensively in the public utility pricing.
This experiment will investigate the use of price incentives to shape demand. Since there is likely to be asignificant amount of variation in tastes and time constraints, significant welfare gains might be possible. For
21

example, if a sizable segment of the user population could be induced to shift usage to nonpeak hours, thevalue of the resouces to those unable to shift their usage may increase substantially.
A.8 Experiment 7. Demand under Flat Rate Pricing
This experiment would vary the level of the flat fee charged to users for unlimited usage in order to examinethe total value which users place on access at different connection speeds. The relationship of this value tovarious observable characteristics would also be examined. By obtaining this measure of user heterogeneityin the total value of usage, the design of optimal tariffs will be helped greatly.
This experiment will be similar to the first experiment which examined behavior under alternative per-minutecharges, with the difference being that a flat-price will be varied instead. The flat price will differ by con-nection speed (with higher speeds being charged at higher flat rates). The set of prices will be changed on aweekly basis. Unlike the first experiment where each connection speed could be reselecced as desired, onlythe speed(s) for which the flat fee has been paid will be allowed. Thus, if an individual discovers in midweekthat a higher speed is needed, the individual would have to pay the new higher fixed fee.
This experiment will allow the following questions to be addressed. How price sensitive are users to fixedfees? What are the optimal multi-part tariffs?
A.9 Experiment 8. Two Part Tariff Design
This experiment will combine some of the different features of the previous experiments. Individuals willface a menu of tariff choices which varies each week. The tariffs will vary according to the level of the fixedweekly fee and the usage sensitive fee. Whereas experiment five examined the selection of tariffs which variedaccording to the basis for usage sensitive fees (per-minute charges versus per-byte charges), this experimentwill vary only the relative contributions of the fixed and variable charges. This will allow examination of howusers respond to declining block tariffs. This will also provide some insight into whether individuals havepreferences over tariff structures themselves due to such effects as risk aversion or mental accounting costs(Train, 1993?).
Combined with data from the other experiments, this will allow the design of price structures which trackconsumer demand curves more closely than do either fixed fees or uniform prices. This information will alsothe relationship of these price schedules to different individual characteristics and market segments.
22

CampusNetwork
&Internet
BillingSystem
• • •OKLDCA11•
••
BKLYCA01•••
SFCAxx•••
SFCA01•••PacBell
FrameRelay
Network 56Kb/s DDS
128Kb/s ISDN
1.5Mb/s DS-1
45Mb/s DS-3
ALBYCA01•••
CampusNetwork
&Internet
BKLYCA01 BillingGateway
•••••••••••
•••
Centrex2
Centrex1
•••••••••••
•••C
entrex1
CO
Mux
Centrex2
M13 Mux
DS-3
ISDN PRIsISDN BRIs
Cisco“7513”
• • •
ALBYCA11
INDEX NOCPSTN
Figure 9: INDEX Access Network. Figure 10: INDEX ISDN Access Provisioning.
CampusNetwork
&Internet
BillingGateway
•••
CO
Mux
M13 Mux
DS-3
Cisco“7513”
• • •
SFCA01
BKLYCA01
{DS-1s forother
services
•••
SFCAXX (i.e. misc S.F. COs)
•••
CO
Mux
DS-1
56Kb/s DDS
CampusNetwork
&Internet
BillingGateway
•••
CO
Mux
M13 Mux
DS-3
Cisco“7513”
• • •
BKLYCA01
{DS-1s forother
services
•••
DS-1
56Kb/s DDS
PacBellFrameRelay
Network
Figure 11: INDEX 56 Kbps DDS Provisioning.Figure 12: INDEX Frame Relay Access Provi-sioning.
B Network Engineering
23
Related Documents


![DRAFT DRAFT DRAFT DRAFT DRAFT DRAFT DRAFT WORK …FP7-INFRASTRUCTURES-2011-1 Design Study (CP) proposal DRAFT V4 - Sunday, November 21, 2010[LAGUNA-LBNO] 5/ 70 Proposal abstract (Form](https://static.cupdf.com/doc/110x72/6113d45b3289ef731774bd7b/draft-draft-draft-draft-draft-draft-draft-work-fp7-infrastructures-2011-1-design.jpg)


