© 2014 Nature America, Inc. All rights reserved. NATURE NEUROSCIENCE ADVANCE ONLINE PUBLICATION ARTICLES Temporal structure is an essential aspect of communication in the brain. This is particularly evident in olfaction, where neural represen- tations are defined by sniffing 1 , animals are able to distinguish stimuli arriving at precise times in a sniff cycle 2 and evidence for timing sensitivities in higher olfactory regions are beginning to emerge 3 . Generally, given the importance of inhibitory circuits in neural com- putation, they are likely to have crucial roles in shaping such temporal structures in a wide range of frequencies 4–8 . Interactions between inhibitory and excitatory neurons are thought to underlie synchro- nous activities at fast gamma frequencies 4,5 , as well as on slower theta timescales 7 . Although modeling studies 4 and in vitro recordings 8 often predict circuit properties underlying rhythm generation, dem- onstrations of direct causal links in vivo remain scarce 5,6 . In addition, mechanisms underlying oscillations in a particular band are often studied in isolation, yet activities on different timescales coexist dur- ing many brain functions 9 ; both slow and fast rhythms are expressed by the same individual principal neurons 9 , interneuron activities show distinct phase relations to slow and fast rhythms simultaneously 7 , and the same molecularly defined interneuron class is, for example, implicated in driving gamma oscillations 5 and setting theta phase 6 . Thus, it is not clear whether common mechanisms govern both times- cales or whether circuits underlying slow and fast activity might be dissociable. Experimental dissection of these hypotheses in vivo faces particular challenges, largely because specific interneurons involved in generating and coordinating different rhythms are often found to overlap anatomically as well as molecularly 7,8 . The mammalian olfactory bulb (OB) provides a unique advan- tage in such quests. Here, two key classes of inhibitory circuits are anatomically segregated (Supplementary Fig. 1a), making dissection of circuits contributing to temporal structuring potentially feasible. The dynamics in the OB are characterized by activities spanning several distinct timescales, most notably in slow theta (1–12 Hz; Supplementary Fig. 1b,c) 10,11 and fast gamma (40–100 Hz; Supplementary Fig. 1d) 4,10,11 band activities. The former primarily arises from olfactory inputs robustly locking to the sniff rhythm 1,12–18 . However, even in the absence of odorous stimuli, distinct classes of pro- jection neurons lock to different respiration phases 15–17 (Supplementary Fig. 1b). It is inhibition in the OB that causes this temporal segregation 16 , where one class of projection neurons, mitral cells (MCs), is delayed relative to the other, tufted cells (TCs). Previous reports suggested that granule cells (GCs) are involved in shaping respiration coupling of projection neurons, as these interneurons exhibit robust sniff lock- ing 14,17–19 . Recent computational work, on the other hand, postulated glomerular feedforward circuitry as an underlying mechanism 16 . In addition to the baseline rhythm, odor presentations often evoke a variety of activities in the theta range 10,12–14,18,20 , notably inhibitory responses (Supplementary Fig. 1c). Such inhibitory responses are implicated in contrast enhancement and are widely thought to be mediated by lateral inhibition via GCs 19–21 , although more recent computational work has proposed alternative explanations based on feedforward inhibition 22 . Theta rhythms in turn provide a framework to the latter, fast, gamma-range activities generated in the OB, which occur nested in sniff rhythms 10 (Supplementary Fig. 1d). Such fast activities are observed under various behavioral states 10,23 and are correlated with higher task demands 10,23 . It is evident from pharmacological studies in vitro and in vivo that GABA A -mediated inhibition is a basis for gamma activity 24,25 . Modeling 26 , current-source density analysis 10 , localized pharmacology in brain slices 24 and constitutive genetic altera- tion of GC excitation 27 have pointed toward a prominent contribution from GCs to gamma activity, yet conclusive evidence is lacking. 1 Behavioural Neurophysiology, Max Planck Institute for Medical Research, Heidelberg, Germany. 2 Division of Neurophysiology, MRC National Institute for Medical Research, London, UK. 3 Department Anatomy and Cell Biology, Faculty of Medicine, University of Heidelberg, Heidelberg, Germany. 4 Media Lab, Synthetic Neurobiology Group, Massachusetts Institute of Technology, Cambridge, Massachusetts, USA. 5 Department of Neuroscience, Physiology and Pharmacology, University College London, London, UK. Correspondence should be addressed to I.F. ([email protected]) or A.T.S. ([email protected]). Received 27 February; accepted 10 June; published online 6 July 2014; doi:10.1038/nn.3760 Independent control of gamma and theta activity by distinct interneuron networks in the olfactory bulb Izumi Fukunaga 1,2 , Jan T Herb 1–3 , Mihaly Kollo 1,2 , Edward S Boyden 4 & Andreas T Schaefer 1–3,5 Circuits in the brain possess the ability to orchestrate activities on different timescales, but the manner in which distinct circuits interact to sculpt diverse rhythms remains unresolved. The olfactory bulb is a classic example of a place in which slow theta and fast gamma rhythms coexist. Furthermore, inhibitory interneurons that are generally implicated in rhythm generation are segregated into distinct layers, neatly separating local and global motifs. We combined intracellular recordings in vivo with circuit-specific optogenetic interference to examine the contribution of inhibition to rhythmic activity in the mouse olfactory bulb. We found that the two inhibitory circuits controlled rhythms on distinct timescales: local, glomerular networks coordinated theta activity, regulating baseline and odor-evoked inhibition, whereas granule cells orchestrated gamma synchrony and spike timing. Notably, granule cells did not contribute to baseline rhythms or sniff-coupled odor-evoked inhibition. Thus, activities on theta and gamma timescales are controlled by separate, dissociable inhibitory networks in the olfactory bulb.

Welcome message from author
This document is posted to help you gain knowledge. Please leave a comment to let me know what you think about it! Share it to your friends and learn new things together.
Transcript
©20
14 N
atu
re A
mer
ica,
Inc.
All
rig
hts
res
erve
d.
nature neurOSCIenCe advance online publication �
a r t I C l e S
Temporal structure is an essential aspect of communication in the brain. This is particularly evident in olfaction, where neural represen-tations are defined by sniffing1, animals are able to distinguish stimuli arriving at precise times in a sniff cycle2 and evidence for timing sensitivities in higher olfactory regions are beginning to emerge3. Generally, given the importance of inhibitory circuits in neural com-putation, they are likely to have crucial roles in shaping such temporal structures in a wide range of frequencies4–8. Interactions between inhibitory and excitatory neurons are thought to underlie synchro-nous activities at fast gamma frequencies4,5, as well as on slower theta timescales7. Although modeling studies4 and in vitro recordings8 often predict circuit properties underlying rhythm generation, dem-onstrations of direct causal links in vivo remain scarce5,6. In addition, mechanisms underlying oscillations in a particular band are often studied in isolation, yet activities on different timescales coexist dur-ing many brain functions9; both slow and fast rhythms are expressed by the same individual principal neurons9, interneuron activities show distinct phase relations to slow and fast rhythms simultaneously7, and the same molecularly defined interneuron class is, for example, implicated in driving gamma oscillations5 and setting theta phase6. Thus, it is not clear whether common mechanisms govern both times-cales or whether circuits underlying slow and fast activity might be dissociable. Experimental dissection of these hypotheses in vivo faces particular challenges, largely because specific interneurons involved in generating and coordinating different rhythms are often found to overlap anatomically as well as molecularly7,8.
The mammalian olfactory bulb (OB) provides a unique advan-tage in such quests. Here, two key classes of inhibitory circuits are anatomically segregated (Supplementary Fig. 1a), making dissection of circuits contributing to temporal structuring potentially feasible.
The dynamics in the OB are characterized by activities spanning several distinct timescales, most notably in slow theta (1–12 Hz; Supplementary Fig. 1b,c)10,11 and fast gamma (40–100 Hz; Supplementary Fig. 1d)4,10,11 band activities. The former primarily arises from olfactory inputs robustly locking to the sniff rhythm1,12–18. However, even in the absence of odorous stimuli, distinct classes of pro-jection neurons lock to different respiration phases15–17 (Supplementary Fig. 1b). It is inhibition in the OB that causes this temporal segregation16, where one class of projection neurons, mitral cells (MCs), is delayed relative to the other, tufted cells (TCs). Previous reports suggested that granule cells (GCs) are involved in shaping respiration coupling of projection neurons, as these interneurons exhibit robust sniff lock-ing14,17–19. Recent computational work, on the other hand, postulated glomerular feedforward circuitry as an underlying mechanism16. In addition to the baseline rhythm, odor presentations often evoke a variety of activities in the theta range10,12–14,18,20, notably inhibitory responses (Supplementary Fig. 1c). Such inhibitory responses are implicated in contrast enhancement and are widely thought to be mediated by lateral inhibition via GCs19–21, although more recent computational work has proposed alternative explanations based on feedforward inhibition22. Theta rhythms in turn provide a framework to the latter, fast, gamma-range activities generated in the OB, which occur nested in sniff rhythms10 (Supplementary Fig. 1d). Such fast activities are observed under various behavioral states10,23 and are correlated with higher task demands10,23. It is evident from pharmacological studies in vitro and in vivo that GABAA-mediated inhibition is a basis for gamma activity24,25. Modeling26, current-source density analysis10, localized pharmacology in brain slices24 and constitutive genetic altera-tion of GC excitation27 have pointed toward a prominent contribution from GCs to gamma activity, yet conclusive evidence is lacking.
1Behavioural Neurophysiology, Max Planck Institute for Medical Research, Heidelberg, Germany. 2Division of Neurophysiology, MRC National Institute for Medical Research, London, UK. 3Department Anatomy and Cell Biology, Faculty of Medicine, University of Heidelberg, Heidelberg, Germany. 4Media Lab, Synthetic Neurobiology Group, Massachusetts Institute of Technology, Cambridge, Massachusetts, USA. 5Department of Neuroscience, Physiology and Pharmacology, University College London, London, UK. Correspondence should be addressed to I.F. ([email protected]) or A.T.S. ([email protected]).
Received 27 February; accepted 10 June; published online 6 July 2014; doi:10.1038/nn.3760
Independent control of gamma and theta activity by distinct interneuron networks in the olfactory bulbIzumi Fukunaga1,2, Jan T Herb1–3, Mihaly Kollo1,2, Edward S Boyden4 & Andreas T Schaefer1–3,5
Circuits in the brain possess the ability to orchestrate activities on different timescales, but the manner in which distinct circuits interact to sculpt diverse rhythms remains unresolved. The olfactory bulb is a classic example of a place in which slow theta and fast gamma rhythms coexist. Furthermore, inhibitory interneurons that are generally implicated in rhythm generation are segregated into distinct layers, neatly separating local and global motifs. We combined intracellular recordings in vivo with circuit-specific optogenetic interference to examine the contribution of inhibition to rhythmic activity in the mouse olfactory bulb. We found that the two inhibitory circuits controlled rhythms on distinct timescales: local, glomerular networks coordinated theta activity, regulating baseline and odor-evoked inhibition, whereas granule cells orchestrated gamma synchrony and spike timing. Notably, granule cells did not contribute to baseline rhythms or sniff-coupled odor-evoked inhibition. Thus, activities on theta and gamma timescales are controlled by separate, dissociable inhibitory networks in the olfactory bulb.
©20
14 N
atu
re A
mer
ica,
Inc.
All
rig
hts
res
erve
d.
� advance online publication nature neurOSCIenCe
a r t I C l e S
Thus, although inhibition is clearly implicated in defining both gamma- and theta-range activities, the specific circuits behind the variety of temporal structures in the OB remain largely enigmatic. We used whole-cell recordings from interneurons and projection neurons and local field potential (LFP) recordings in the OB in brain slices, in anesthetized and awake mice, in combination with pharmacological and circuit-specific optogenetic interference to dissect the contribu-tion of GC and glomerular layer interneurons to gamma and theta activity in the OB.
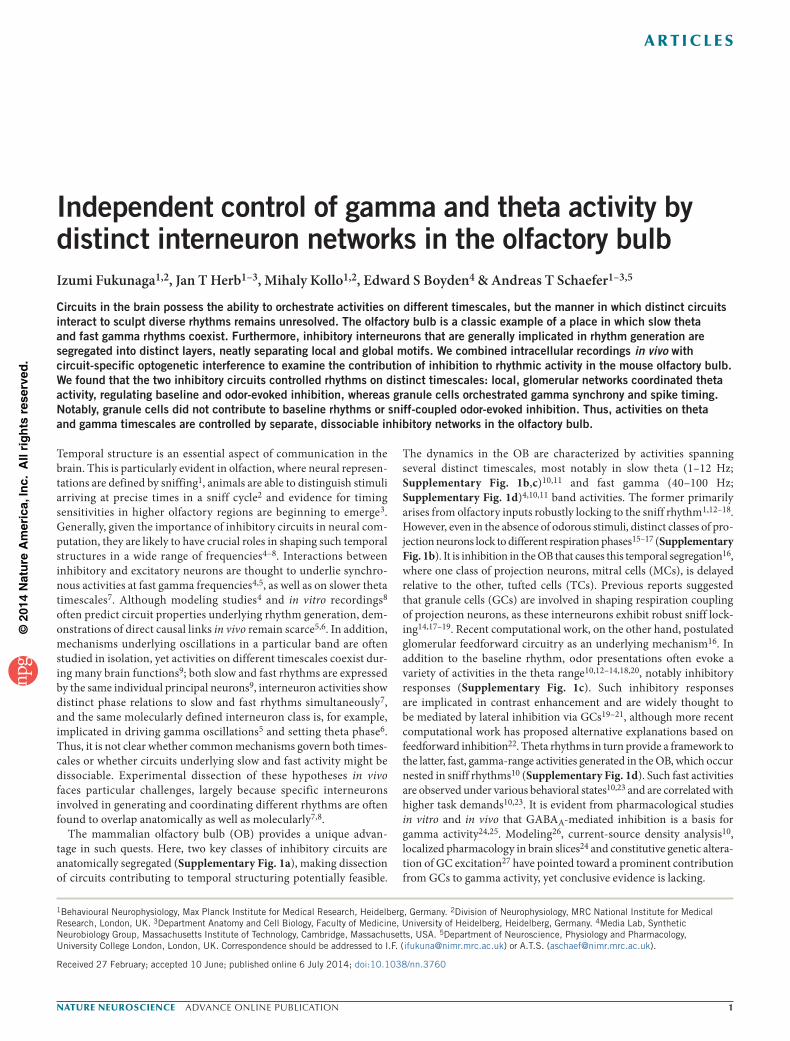
RESULTSEfficient and selective silencing of interneurons in the OBMCs and TCs both tightly lock to distinct, but opposite, phases of the sniff cycle, whose shift is established by inhibition in the OB16. To assess the circuits underlying this phase segregation, we aimed to selectively silence interneurons in the GC layer (GCL) or glomeru-lar layer in vivo. We first assessed the efficiency and selectivity of optogenetic silencing using GCL injections (Fig. 1). We injected adeno-associated virus (AAV1/2) to conditionally express the photo-activatable proton pump archaerhodopsinT (ArchT)28 into transgenic mice expressing Cre recombinase from an IRES construct in the Gad2 or Slc32a1 (also known as Vgat) loci29,30, aiming to restrict silencing to GABAergic neurons (Fig. 1a). GAD2 has been
reported to be expressed in 58% of GCL neurons31. Although no such report exists for VGAT expression, virtually all GABAergic neurons are thought to express VGAT30. With our deep GCL injections, more than 90% of Cre-expressing neurons in the GCL also expressed fluorescently tagged ArchT (90.2 ± 2.4%, n = 8 slices; Fig. 1a). To assess the extent and specificity of silencing, we performed whole-cell recordings from GCs and MCs in brain slices solely under infrared guidance for blind sampling. Consistent with the expected Cre-expression rate, 29 of 49 (59%) GCs in slices from Gad2-Cre mice hyperpolarized by more than 10 mV following white light presentations (Fig. 1c). In slices from Vgat-Cre mice, 22 of 26 GCs hyperpolarized by more than 10 mV, correspond-ing to efficient silencing of 85% of GCs in vitro (Fig. 1d). In vivo, blind whole-cell recordings from GCs mirrored the in vitro results: in Gad2-Cre mice with GCL injection, 50% (9 of 18 cells) of GCs hyperpolarized by more than 10 mV following light stimulation (Fig. 1e). The average evoked hyperpolarization for such infected cells was −20.4 ± 2.4 mV (Fig. 1e). In Vgat-Cre mice, this rate was 87% (13 of 15 cells; Fig. 1f). GCs consistently hyperpolarized by more than 20 mV at depths of 800 µm below the brain sur-face (Supplementary Fig. 2). Notably, excitatory odor responses evoked in GCs were consistently and completely suppressed (3 of 3 responses; Fig. 1g–i).
a b
c
d
e
f
g h i
GFP/DAPI
GCL MCL GL
GFPCre
In vitro
In vitro
In vitro
In vivo(anesthetised)
In vivo(awake, head-fixed)
In vivo(ane.)
Gad2-cre
Not silencedSilenced
Gad2-cre
Gad2-cre
Vgat-cre
Vgat-cre
151
49
26
18
15
–40LED
LED
–25.4 –17.2 –14.3
–40.7 –29.2 –24.6 –16.5
–6.2 –3.7
–3.3
LED
–20 0
–40 –20 0
–40 –20 0
–40 –20 0
–40 –20Vm deviation (mV)
0
1
0.5
0
0.4
0.2
0
0.4
0.2
0
0.4
0.2
0
0.2
0.1
0
MCL
GC
Odoronly
Odoronly
Odor+ LED Odor
+ LED
20
15
Evo
ked
AP
s
Fra
ctio
n of
cel
ls
10
5
0
Figure 1 Efficiency and specificity of optogenetic silencing of granule cells in vitro and in vivo. (a) Expression pattern in the OB following GCL injection in a Gad2-Cre mouse (top). Inset, magnification of the area in the white box. GL, glomerular layer; MCL, mitral cell layer. Scale bars represent 0.5 mm and 0.1 mm (inset). See also the Supplementary Video 1. Bottom, immunohistochemical assessment of infection efficiency in a Vgat-Cre mouse. Scale bar represents 50 µm. Image section was taken from the center of the GCL. (b–f) Electrophysiological assessment of infection and silencing efficiency and selectivity. (b) Example whole-cell recordings from MCs in OB slices from Gad2-Cre mice injected with AAV-FLEX-ArchT in the GCL during light presentation (left, yellow bar indicates light presentation). Scale bars represent 20 mV, 0.5 s. Right, proportion of recorded cells with corresponding light-evoked Vm deviation. Vm deviation more negative than 10 mV is defined as ‘silenced’. The number in the top right corner is the total number of cells recorded. (c,d) Data presented as in b, but recordings were from randomly selected GCs from GCL-injected Gad2-Cre (c) or Vgat-Cre (d) mice. (e,f) In vivo assessment of GC silencing in Gad2-Cre, anesthetized mice (e) and Vgat-Cre, awake, head-fixed mice (f). Data were from 5 and 3 mice, respectively. Traces in the middle are examples from different cells and numbers below indicate measured Vm deviation with the same color coding as the histograms. Scale bars represent 20 mV, 0.5 s. (g–i) GC silencing during excitatory odor responses in vivo. (g) Example of a reconstructed GC morphology. Scale bar represents 50 µm. (h) Top, action potentials evoked by 1-s odor presentation (gray) under the control condition. Bottom, response to the same odorant during light presentation. Scale bar represents 10 mV. (i) Summary data showing average number of APs evoked during 1-s odor presentation, for odor only and with additional light presentation (n = 3 cells from 3 animals).
©20
14 N
atu
re A
mer
ica,
Inc.
All
rig
hts
res
erve
d.
nature neurOSCIenCe advance online publication �
a r t I C l e S
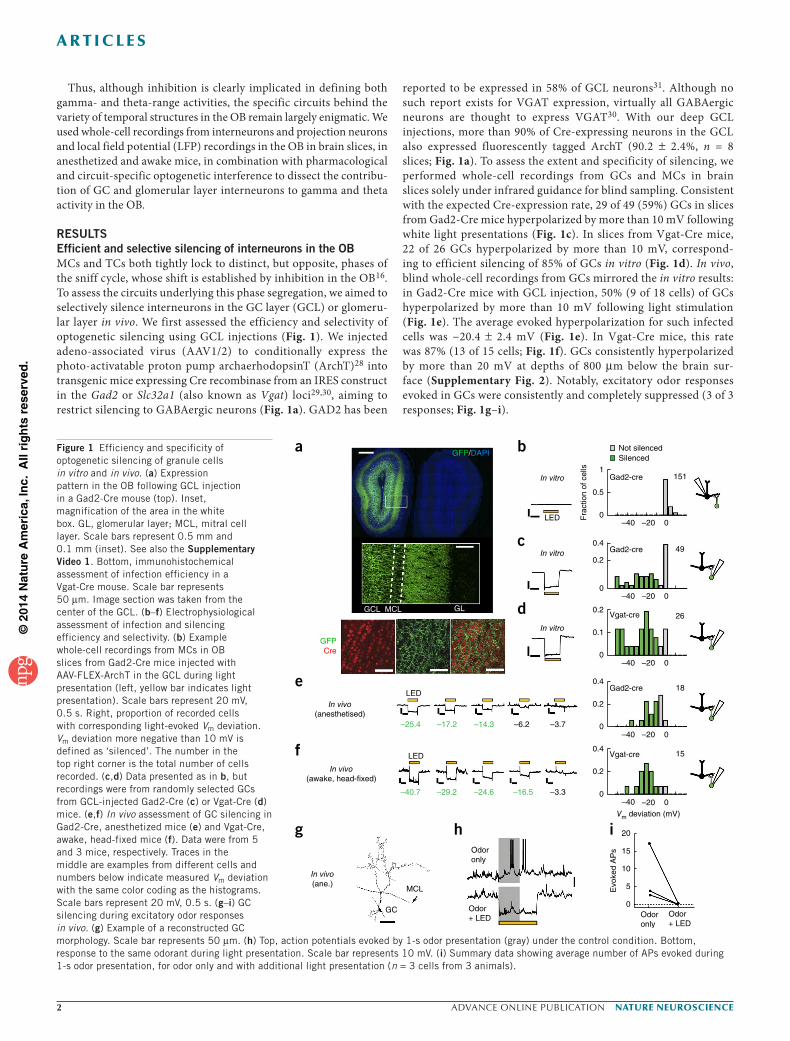
Deep injections resulted in infection highly restricted to the GCL: judged by immunohistochemistry, less than 2% of all infected neu-rons (1.57 ± 1.8%, n = 3 slices) were located outside the GCL, in the glomerular or external plexiform layers. In addition, recordings from 151 MCs in vitro from Gad2-Cre mice with GCL injection showed no hyperpolarization during light stimulation (Fig. 1b), indicating that infection was indeed specific to Cre-expressing neurons (Fig. 1a and Supplementary Video 1). For superficial injections, a local group of glomeruli was reliably targeted, selectively infecting almost 90% of all Cre-positive interneurons locally (89 ± 3.7%, n = 8 slices; Supplementary Fig. 2a,b). Thus, by taking advantage of the geom-etry of the OB and directed virus injections into deep and superficial layers, we were able to selectively and efficiently manipulate GC and glomerular layer inhibition, respectively (Fig. 2a,b).
Theta phase segregation is mediated by glomerular layer circuitsTo assess whether GC or glomerular layers set theta phases of OB principal neurons, we made whole-cell recordings from M/TCs in vivo, combined with GCL or glomerular layer silencing in the anesthetized preparation (Fig. 2). Notably, despite suppressing activity in >85% of all GCs, no depolarization or increase in M/TC firing occurred (mean baseline firing rate: control, 3.8 ± 0.5 Hz; GCL silencing, 2.8 ± 0.4 Hz; P = 0.997 paired one-tailed t test; Vm change = −1.0 ± 0.3 mV, P = 0.997, one-tailed t test; n = 18 cells). Furthermore, slow rhythms in M/TC were unaffected and preferred phases were unaltered (P = 0.07, Fisher’s rank test on circular distributions; Fig. 2c,e).
On the other hand, silencing the glomerular layer resulted in a small and variable membrane potential change (mean baseline firing rate: control, 2.6 ± 0.48 Hz; glomerular silencing, 3.0 ± 1.45 Hz; Vm change = –3.9 ± 0.66 mV; n = 23 cells). Notably, sniff locking was markedly altered, including widespread phase shifts (ranging from −2.68 to 1.25 radians, P = 0.004, Fisher’s rank test, n = 23 cells; Fig. 2d,f). This phase shift occurred particularly in cells that, in the absence of external stimuli, depolarize later in the sniff cycle. These neurons corresponded to MCs (Fig. 2g)16, suggesting that the baseline theta rhythm in the OB is structured by the local, glomerular inhibitory circuitry rather than by global, granule cell–mediated inhibition.
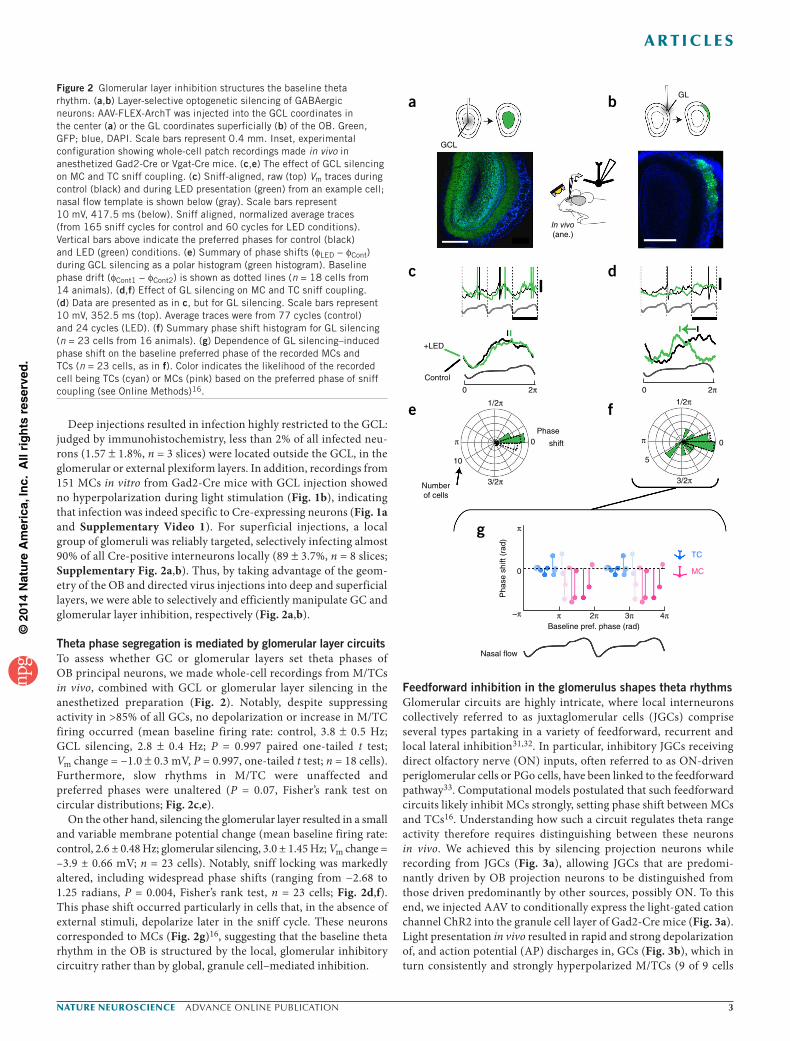
Feedforward inhibition in the glomerulus shapes theta rhythmsGlomerular circuits are highly intricate, where local interneurons collectively referred to as juxtaglomerular cells (JGCs) comprise several types partaking in a variety of feedforward, recurrent and local lateral inhibition31,32. In particular, inhibitory JGCs receiving direct olfactory nerve (ON) inputs, often referred to as ON-driven periglomerular cells or PGo cells, have been linked to the feedforward pathway33. Computational models postulated that such feedforward circuits likely inhibit MCs strongly, setting phase shift between MCs and TCs16. Understanding how such a circuit regulates theta range activity therefore requires distinguishing between these neurons in vivo. We achieved this by silencing projection neurons while recording from JGCs (Fig. 3a), allowing JGCs that are predomi-nantly driven by OB projection neurons to be distinguished from those driven predominantly by other sources, possibly ON. To this end, we injected AAV to conditionally express the light-gated cation channel ChR2 into the granule cell layer of Gad2-Cre mice (Fig. 3a). Light presentation in vivo resulted in rapid and strong depolarization of, and action potential (AP) discharges in, GCs (Fig. 3b), which in turn consistently and strongly hyperpolarized M/TCs (9 of 9 cells
a
GCL
+LED
Control
0 2π 0 2π
GL
In vivo(ane.)
b
c d
Phase
Numberof cells
Pha
se s
hift
(rad
)
shift
1/2π
3/2π
10
π
π
0
–π π 2πBaseline pref. phase (rad)
3π 4π
0
1/2π
3/2π
5
π 0
TC
MC
e
g
f
Nasal flow
Figure 2 Glomerular layer inhibition structures the baseline theta rhythm. (a,b) Layer-selective optogenetic silencing of GABAergic neurons: AAV-FLEX-ArchT was injected into the GCL coordinates in the center (a) or the GL coordinates superficially (b) of the OB. Green, GFP; blue, DAPI. Scale bars represent 0.4 mm. Inset, experimental configuration showing whole-cell patch recordings made in vivo in anesthetized Gad2-Cre or Vgat-Cre mice. (c,e) The effect of GCL silencing on MC and TC sniff coupling. (c) Sniff-aligned, raw (top) Vm traces during control (black) and during LED presentation (green) from an example cell; nasal flow template is shown below (gray). Scale bars represent 10 mV, 417.5 ms (below). Sniff aligned, normalized average traces (from 165 sniff cycles for control and 60 cycles for LED conditions). Vertical bars above indicate the preferred phases for control (black) and LED (green) conditions. (e) Summary of phase shifts (φLED − φCont) during GCL silencing as a polar histogram (green histogram). Baseline phase drift (φCont1 − φCont2) is shown as dotted lines (n = 18 cells from 14 animals). (d,f) Effect of GL silencing on MC and TC sniff coupling. (d) Data are presented as in c, but for GL silencing. Scale bars represent 10 mV, 352.5 ms (top). Average traces were from 77 cycles (control) and 24 cycles (LED). (f) Summary phase shift histogram for GL silencing (n = 23 cells from 16 animals). (g) Dependence of GL silencing–induced phase shift on the baseline preferred phase of the recorded MCs and TCs (n = 23 cells, as in f). Color indicates the likelihood of the recorded cell being TCs (cyan) or MCs (pink) based on the preferred phase of sniff coupling (see Online Methods)16.
©20
14 N
atu
re A
mer
ica,
Inc.
All
rig
hts
res
erve
d.
� advance online publication nature neurOSCIenCe
a r t I C l e S
showed 100% AP suppression; Fig. 3c,d). Whole-cell recordings from JGCs showed that spontaneous activity in some JGCs was mark-edly reduced as a consequence (Fig. 3e). Other JGCs showed no detectable alteration to spontaneous activity after silencing M/TCs, indicating that the dominant source of their excitatory drive was something other than OB projection neurons (Fig. 3f). We identified the latter population as putative PGo cells (Fig. 3g). PGo cells were physiologically more homogeneous, as judged by their respiration coupling: they preferably depolarized in a narrow range of respira-tory phase (mean preferred Vm phase = 1.79 radians, 25th and 75th percentiles = 1.45 radians and 2.08 radians, n = 6 cells, Fig. 3h–k), slightly preceding the trough of the MC theta rhythm (Fig. 3k), con-sistent with a role of PGo activity underlying hyperpolarization in MCs. JGCs in the residual population on the other hand (JGr cells) were individually tuned to respiration, albeit to vastly heterogeneous phases (Fig. 3l–o). Thus, direct recordings indicate that putative PGo cells in the feedforward pathway in glomeruli likely mediate the phase shift between MC and TC theta rhythms.
Glomerular layer interneurons mediate slow inhibitionOB activity undergoes marked changes in response to odors on both slow and fast timescales11–13,34. On slow timescales, odors frequently cause suppression of baseline firing in the principal neurons13,19,20,34.
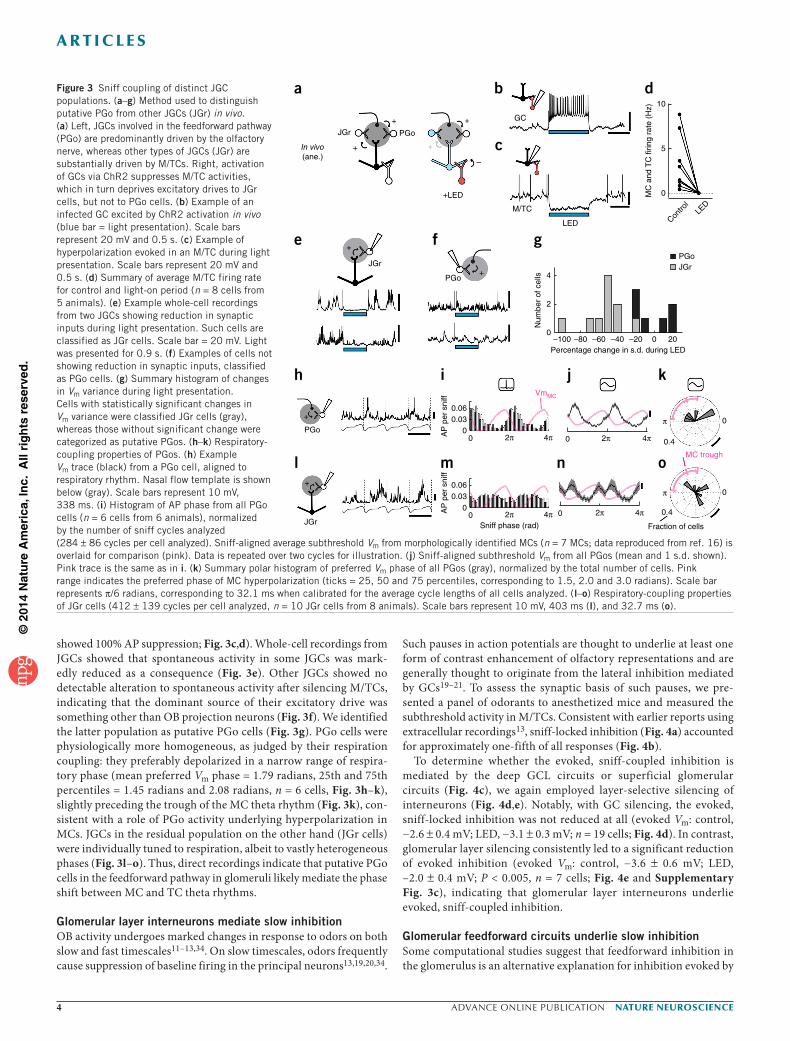
Such pauses in action potentials are thought to underlie at least one form of contrast enhancement of olfactory representations and are generally thought to originate from the lateral inhibition mediated by GCs19–21. To assess the synaptic basis of such pauses, we pre-sented a panel of odorants to anesthetized mice and measured the subthreshold activity in M/TCs. Consistent with earlier reports using extracellular recordings13, sniff-locked inhibition (Fig. 4a) accounted for approximately one-fifth of all responses (Fig. 4b).
To determine whether the evoked, sniff-coupled inhibition is mediated by the deep GCL circuits or superficial glomerular circuits (Fig. 4c), we again employed layer-selective silencing of interneurons (Fig. 4d,e). Notably, with GC silencing, the evoked, sniff-locked inhibition was not reduced at all (evoked Vm: control, −2.6 ± 0.4 mV; LED, −3.1 ± 0.3 mV; n = 19 cells; Fig. 4d). In contrast, glomerular layer silencing consistently led to a significant reduction of evoked inhibition (evoked Vm: control, −3.6 ± 0.6 mV; LED, –2.0 ± 0.4 mV; P < 0.005, n = 7 cells; Fig. 4e and Supplementary Fig. 3c), indicating that glomerular layer interneurons underlie evoked, sniff-coupled inhibition.
Glomerular feedforward circuits underlie slow inhibitionSome computational studies suggest that feedforward inhibition in the glomerulus is an alternative explanation for inhibition evoked by
Figure 3 Sniff coupling of distinct JGC populations. (a–g) Method used to distinguish putative PGo from other JGCs (JGr) in vivo. (a) Left, JGCs involved in the feedforward pathway (PGo) are predominantly driven by the olfactory nerve, whereas other types of JGCs (JGr) are substantially driven by M/TCs. Right, activation of GCs via ChR2 suppresses M/TC activities, which in turn deprives excitatory drives to JGr cells, but not to PGo cells. (b) Example of an infected GC excited by ChR2 activation in vivo (blue bar = light presentation). Scale bars represent 20 mV and 0.5 s. (c) Example of hyperpolarization evoked in an M/TC during light presentation. Scale bars represent 20 mV and 0.5 s. (d) Summary of average M/TC firing rate for control and light-on period (n = 8 cells from 5 animals). (e) Example whole-cell recordings from two JGCs showing reduction in synaptic inputs during light presentation. Such cells are classified as JGr cells. Scale bar = 20 mV. Light was presented for 0.9 s. (f) Examples of cells not showing reduction in synaptic inputs, classified as PGo cells. (g) Summary histogram of changes in Vm variance during light presentation. Cells with statistically significant changes in Vm variance were classified JGr cells (gray), whereas those without significant change were categorized as putative PGos. (h–k) Respiratory-coupling properties of PGos. (h) Example Vm trace (black) from a PGo cell, aligned to respiratory rhythm. Nasal flow template is shown below (gray). Scale bars represent 10 mV, 338 ms. (i) Histogram of AP phase from all PGo cells (n = 6 cells from 6 animals), normalized by the number of sniff cycles analyzed (284 ± 86 cycles per cell analyzed). Sniff-aligned average subthreshold Vm from morphologically identified MCs (n = 7 MCs; data reproduced from ref. 16) is overlaid for comparison (pink). Data is repeated over two cycles for illustration. (j) Sniff-aligned subthreshold Vm from all PGos (mean and 1 s.d. shown). Pink trace is the same as in i. (k) Summary polar histogram of preferred Vm phase of all PGos (gray), normalized by the total number of cells. Pink range indicates the preferred phase of MC hyperpolarization (ticks = 25, 50 and 75 percentiles, corresponding to 1.5, 2.0 and 3.0 radians). Scale bar represents π/6 radians, corresponding to 32.1 ms when calibrated for the average cycle lengths of all cells analyzed. (l–o) Respiratory-coupling properties of JGr cells (412 ± 139 cycles per cell analyzed, n = 10 JGr cells from 8 animals). Scale bars represent 10 mV, 403 ms (l), and 32.7 ms (o).
a
In vivo(ane.)
PGo
+LED
+
–
+
+
+
JGr
GC
b
LED
M/TC
c
+
JGr
e
PGo+
f
PGo
+
h
+
JGr
l
10
MC
and
TC
firin
g ra
te (
Hz)
d
5
0
LED
Contro
l
PGoJGr
–100
Num
ber
of c
ells
g
4
2
0–80
Percentage change in s.d. during LED–60 –40 –20 0 20
AP
per
sni
ff
i
0.060.03
00 2π 4π
VmMC
k
0
0.4
π
j
0 2π 4π
oMC trough
0.4
0π
Fraction of cells
n
0 2π 4πAP
per
sni
ff
m
Sniff phase (rad)2π 4π0
0.060.03
0
©20
14 N
atu
re A
mer
ica,
Inc.
All
rig
hts
res
erve
d.
nature neurOSCIenCe advance online publication �
a r t I C l e S
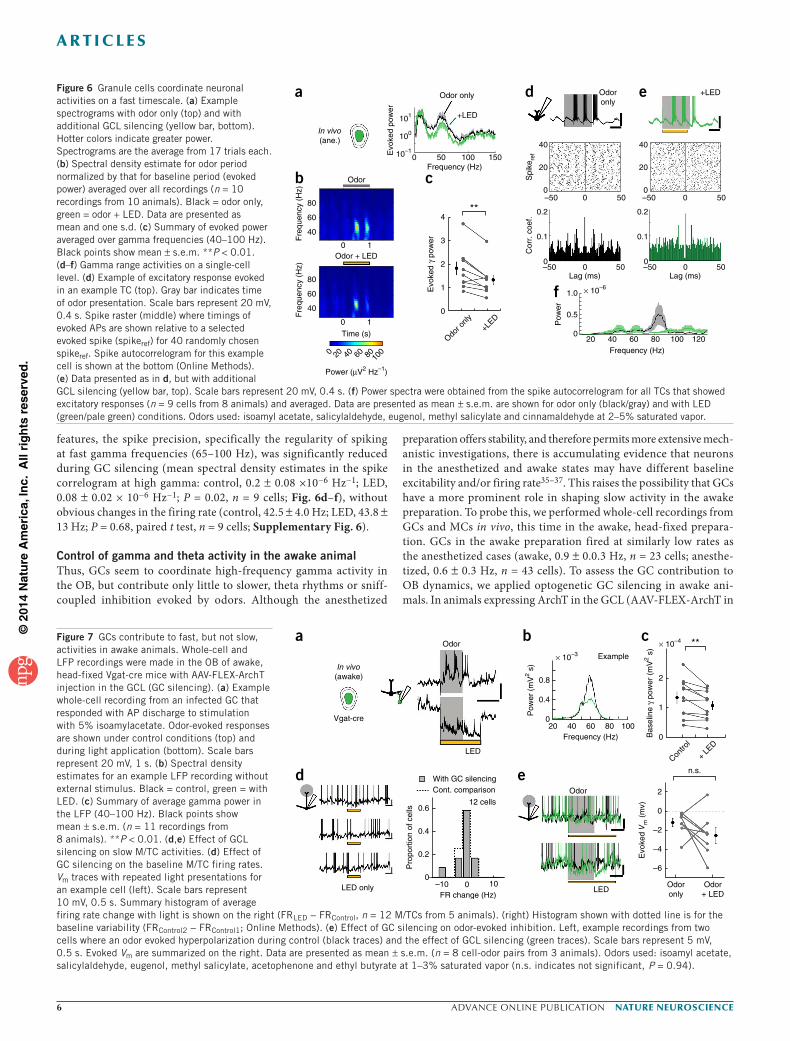
odors22. In this case, PGo cell activity should coincide with evoked inhibition in M/TCs. Indeed, PGo cells identified as described above (Fig. 3a–g) increased firing rates markedly in response to some odors, and such odor-evoked APs occurred at times match-ing evoked inhibition in M/TCs (Supplementary Fig. 4a–d). Furthermore, increasing input strength by applying odors at increas-ing concentrations frequently converted inhibitory responses to exci-tatory responses (Supplementary Fig. 4e). This is again consistent with the involvement of parallel feedforward inhibition and excitation (Supplementary Fig. 4i), where inhibition to the projection neuron dominates at lower input strengths, potentially due to the higher input resistance of PGos (see also ref. 22). This predicts that a total block of inhibition should unveil excitation at the input strength where inhi-bition normally dominates. To pharmacologically block inhibition in vivo, we applied a combination of GABAA antagonist gabazine and agonist muscimol, which blocks phasic synaptic inhibition while leaving basic network properties intact (GABAA clamp)16. GABAA clamp not only completely abolished evoked, sniff-coupled inhibition, but actually converted responses to phasic depolarization (control, −3.4 ± 0.7 mV; GABAA clamp, 1.7 ± 0.4 mV; P < 0.01, n = 11 cells; Fig. 5a and Supplementary Fig. 4f). In many cases, this was accom-panied by action potential discharge (Supplementary Fig. 4h). This conversion to excitation occurred for the majority of evoked sniff-coupled inhibition, but not for odors without detectable response during the control period (control, −0.2 ± 0.2 mV; GABAA clamp, −0.2 ± 0.1 mV; range: control, [−0.80 0.90] mV; GABAA clamp, [−0.66 0.04] mV; P = 0.94, n = 7 cells; Fig. 5b and Supplementary Fig. 4f), which is again consistent with feedforward inhibition as a mechanism underlying slow odor-evoked inhibitory responses. Thus, in contrast with common belief19–21, it is the glomerular circuitry, likely via a
feedforward inhibitory pathway, rather than lateral inhibition by GCs, that underlies evoked inhibition on slow timescales and potentially contrast enhancement22.
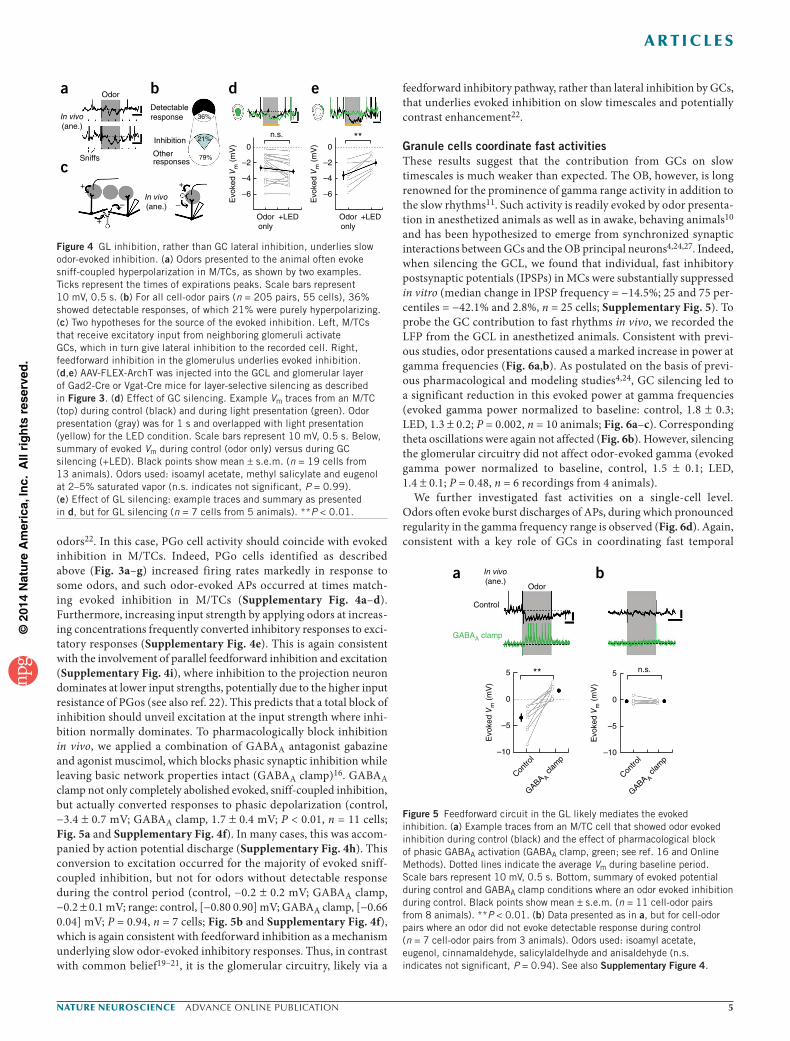
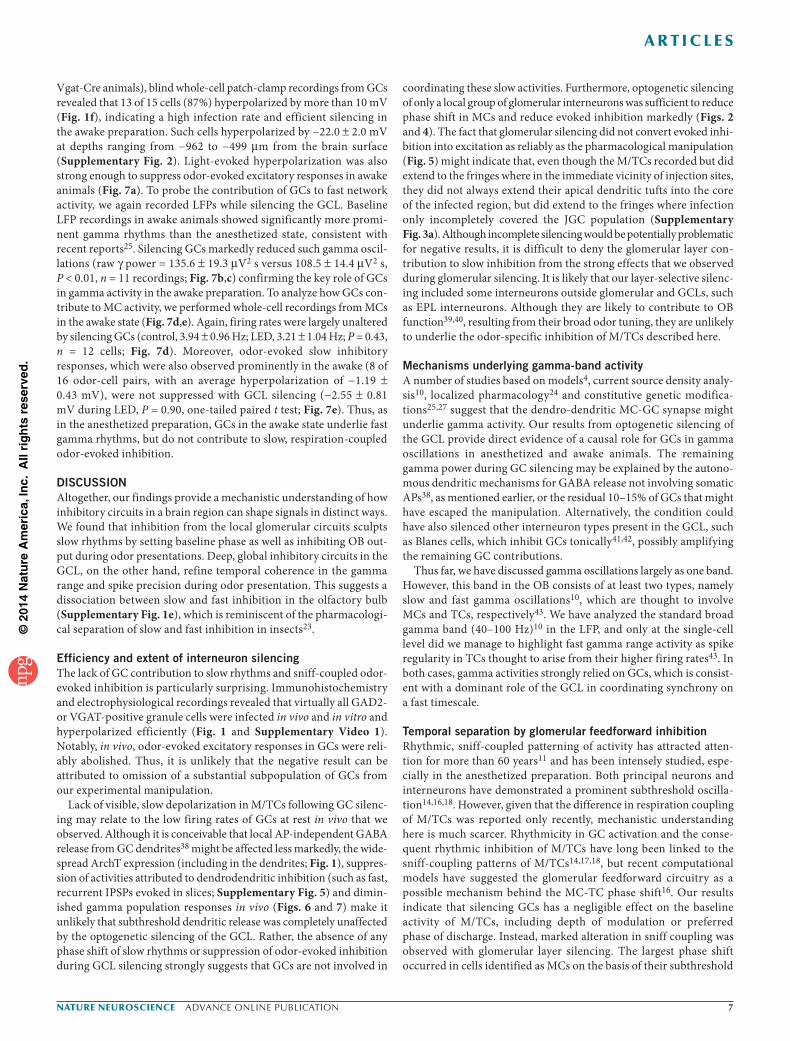
Granule cells coordinate fast activitiesThese results suggest that the contribution from GCs on slow timescales is much weaker than expected. The OB, however, is long renowned for the prominence of gamma range activity in addition to the slow rhythms11. Such activity is readily evoked by odor presenta-tion in anesthetized animals as well as in awake, behaving animals10 and has been hypothesized to emerge from synchronized synaptic interactions between GCs and the OB principal neurons4,24,27. Indeed, when silencing the GCL, we found that individual, fast inhibitory postsynaptic potentials (IPSPs) in MCs were substantially suppressed in vitro (median change in IPSP frequency = −14.5%; 25 and 75 per-centiles = −42.1% and 2.8%, n = 25 cells; Supplementary Fig. 5). To probe the GC contribution to fast rhythms in vivo, we recorded the LFP from the GCL in anesthetized animals. Consistent with previ-ous studies, odor presentations caused a marked increase in power at gamma frequencies (Fig. 6a,b). As postulated on the basis of previ-ous pharmacological and modeling studies4,24, GC silencing led to a significant reduction in this evoked power at gamma frequencies (evoked gamma power normalized to baseline: control, 1.8 ± 0.3; LED, 1.3 ± 0.2; P = 0.002, n = 10 animals; Fig. 6a–c). Corresponding theta oscillations were again not affected (Fig. 6b). However, silencing the glomerular circuitry did not affect odor-evoked gamma (evoked gamma power normalized to baseline, control, 1.5 ± 0.1; LED, 1.4 ± 0.1; P = 0.48, n = 6 recordings from 4 animals).
We further investigated fast activities on a single-cell level. Odors often evoke burst discharges of APs, during which pronounced regularity in the gamma frequency range is observed (Fig. 6d). Again, consistent with a key role of GCs in coordinating fast temporal
36%
21%
79%
bDetectableresponse
Inhibition
Otherresponses
a Odor
Sniffs
In vivo(ane.)
c+ +
+
– –In vivo(ane.)
d
0
–2
–4
–6
n.s.
Odoronly
+LED
Evo
ked
Vm
(m
V)
e
0
–2
–4
–6
**
Odoronly
+LED
Evo
ked
Vm
(m
V)
Figure 4 GL inhibition, rather than GC lateral inhibition, underlies slow odor-evoked inhibition. (a) Odors presented to the animal often evoke sniff-coupled hyperpolarization in M/TCs, as shown by two examples. Ticks represent the times of expirations peaks. Scale bars represent 10 mV, 0.5 s. (b) For all cell-odor pairs (n = 205 pairs, 55 cells), 36% showed detectable responses, of which 21% were purely hyperpolarizing. (c) Two hypotheses for the source of the evoked inhibition. Left, M/TCs that receive excitatory input from neighboring glomeruli activate GCs, which in turn give lateral inhibition to the recorded cell. Right, feedforward inhibition in the glomerulus underlies evoked inhibition. (d,e) AAV-FLEX-ArchT was injected into the GCL and glomerular layer of Gad2-Cre or Vgat-Cre mice for layer-selective silencing as described in Figure 3. (d) Effect of GC silencing. Example Vm traces from an M/TC (top) during control (black) and during light presentation (green). Odor presentation (gray) was for 1 s and overlapped with light presentation (yellow) for the LED condition. Scale bars represent 10 mV, 0.5 s. Below, summary of evoked Vm during control (odor only) versus during GC silencing (+LED). Black points show mean ± s.e.m. (n = 19 cells from 13 animals). Odors used: isoamyl acetate, methyl salicylate and eugenol at 2–5% saturated vapor (n.s. indicates not significant, P = 0.99). (e) Effect of GL silencing: example traces and summary as presented in d, but for GL silencing (n = 7 cells from 5 animals). **P < 0.01.
Odor
Control
5
0
**
–5
–10
Contro
l
GABA A cl
amp
Evo
ked
Vm
(m
V)
a bIn vivo(ane.)
GABAA clamp
5
0
n.s.
–5
–10
Contro
l
GABA A cl
amp
Evo
ked
Vm
(m
V)
Figure 5 Feedforward circuit in the GL likely mediates the evoked inhibition. (a) Example traces from an M/TC cell that showed odor evoked inhibition during control (black) and the effect of pharmacological block of phasic GABAA activation (GABAA clamp, green; see ref. 16 and Online Methods). Dotted lines indicate the average Vm during baseline period. Scale bars represent 10 mV, 0.5 s. Bottom, summary of evoked potential during control and GABAA clamp conditions where an odor evoked inhibition during control. Black points show mean ± s.e.m. (n = 11 cell-odor pairs from 8 animals). **P < 0.01. (b) Data presented as in a, but for cell-odor pairs where an odor did not evoke detectable response during control (n = 7 cell-odor pairs from 3 animals). Odors used: isoamyl acetate, eugenol, cinnamaldehyde, salicylaldelhyde and anisaldehyde (n.s. indicates not significant, P = 0.94). See also Supplementary Figure 4.
©20
14 N
atu
re A
mer
ica,
Inc.
All
rig
hts
res
erve
d.
� advance online publication nature neurOSCIenCe
a r t I C l e S
features, the spike precision, specifically the regularity of spiking at fast gamma frequencies (65–100 Hz), was significantly reduced during GC silencing (mean spectral density estimates in the spike correlogram at high gamma: control, 0.2 ± 0.08 ×10⁻⁶ Hz−1; LED, 0.08 ± 0.02 × 10⁻⁶ Hz−1; P = 0.02, n = 9 cells; Fig. 6d–f), without obvious changes in the firing rate (control, 42.5 ± 4.0 Hz; LED, 43.8 ± 13 Hz; P = 0.68, paired t test, n = 9 cells; Supplementary Fig. 6).
Control of gamma and theta activity in the awake animalThus, GCs seem to coordinate high-frequency gamma activity in the OB, but contribute only little to slower, theta rhythms or sniff-coupled inhibition evoked by odors. Although the anesthetized
preparation offers stability, and therefore permits more extensive mech-anistic investigations, there is accumulating evidence that neurons in the anesthetized and awake states may have different baseline excitability and/or firing rate35–37. This raises the possibility that GCs have a more prominent role in shaping slow activity in the awake preparation. To probe this, we performed whole-cell recordings from GCs and MCs in vivo, this time in the awake, head-fixed prepara-tion. GCs in the awake preparation fired at similarly low rates as the anesthetized cases (awake, 0.9 ± 0.0.3 Hz, n = 23 cells; anesthe-tized, 0.6 ± 0.3 Hz, n = 43 cells). To assess the GC contribution to OB dynamics, we applied optogenetic GC silencing in awake ani-mals. In animals expressing ArchT in the GCL (AAV-FLEX-ArchT in
Figure 6 Granule cells coordinate neuronal activities on a fast timescale. (a) Example spectrograms with odor only (top) and with additional GCL silencing (yellow bar, bottom). Hotter colors indicate greater power. Spectrograms are the average from 17 trials each. (b) Spectral density estimate for odor period normalized by that for baseline period (evoked power) averaged over all recordings (n = 10 recordings from 10 animals). Black = odor only, green = odor + LED. Data are presented as mean and one s.d. (c) Summary of evoked power averaged over gamma frequencies (40–100 Hz). Black points show mean ± s.e.m. **P < 0.01. (d–f) Gamma range activities on a single-cell level. (d) Example of excitatory response evoked in an example TC (top). Gray bar indicates time of odor presentation. Scale bars represent 20 mV, 0.4 s. Spike raster (middle) where timings of evoked APs are shown relative to a selected evoked spike (spikeref) for 40 randomly chosen spikeref. Spike autocorrelogram for this example cell is shown at the bottom (Online Methods). (e) Data presented as in d, but with additional GCL silencing (yellow bar, top). Scale bars represent 20 mV, 0.4 s. (f) Power spectra were obtained from the spike autocorrelogram for all TCs that showed excitatory responses (n = 9 cells from 8 animals) and averaged. Data are presented as mean ± s.e.m. are shown for odor only (black/gray) and with LED (green/pale green) conditions. Odors used: isoamyl acetate, salicylaldehyde, eugenol, methyl salicylate and cinnamaldehyde at 2–5% saturated vapor.
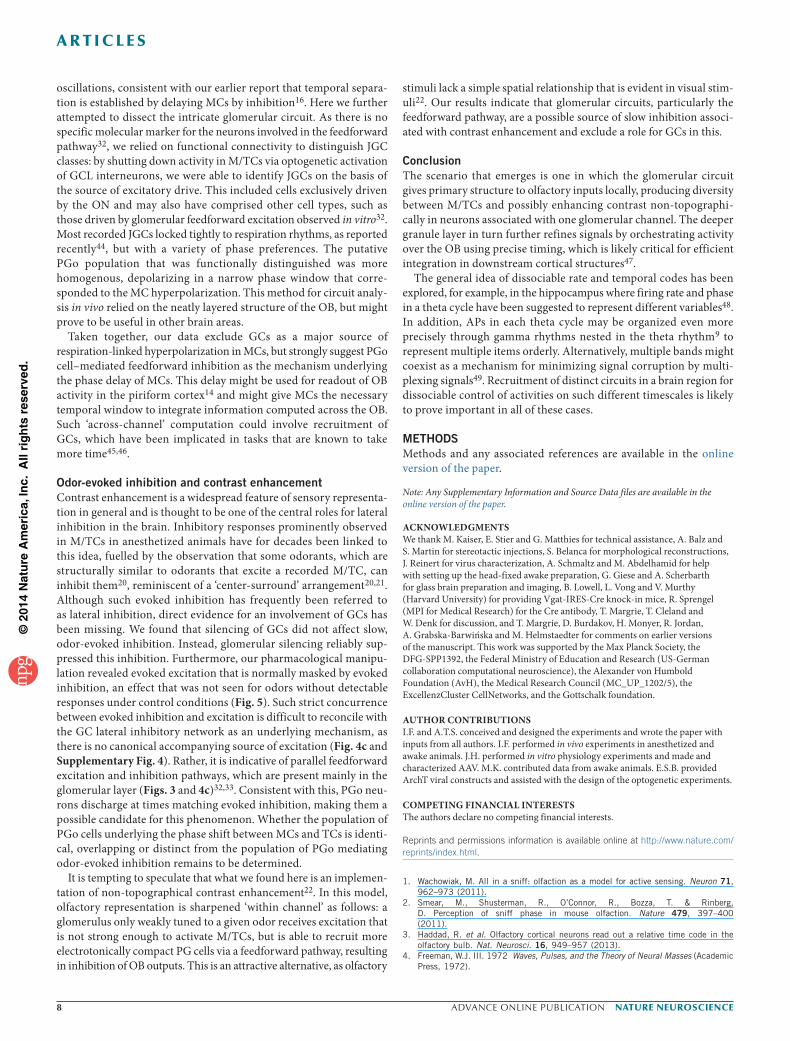
Figure 7 GCs contribute to fast, but not slow, activities in awake animals. Whole-cell and LFP recordings were made in the OB of awake, head-fixed Vgat-cre mice with AAV-FLEX-ArchT injection in the GCL (GC silencing). (a) Example whole-cell recording from an infected GC that responded with AP discharge to stimulation with 5% isoamylacetate. Odor-evoked responses are shown under control conditions (top) and during light application (bottom). Scale bars represent 20 mV, 1 s. (b) Spectral density estimates for an example LFP recording without external stimulus. Black = control, green = with LED. (c) Summary of average gamma power in the LFP (40–100 Hz). Black points show mean ± s.e.m. (n = 11 recordings from 8 animals). **P < 0.01. (d,e) Effect of GCL silencing on slow M/TC activities. (d) Effect of GC silencing on the baseline M/TC firing rates. Vm traces with repeated light presentations for an example cell (left). Scale bars represent 10 mV, 0.5 s. Summary histogram of average firing rate change with light is shown on the right (FRLED − FRControl, n = 12 M/TCs from 5 animals). (right) Histogram shown with dotted line is for the baseline variability (FRControl2 − FRControl1; Online Methods). (e) Effect of GC silencing on odor-evoked inhibition. Left, example recordings from two cells where an odor evoked hyperpolarization during control (black traces) and the effect of GCL silencing (green traces). Scale bars represent 5 mV, 0.5 s. Evoked Vm are summarized on the right. Data are presented as mean ± s.e.m. (n = 8 cell-odor pairs from 3 animals). Odors used: isoamyl acetate, salicylaldehyde, eugenol, methyl salicylate, acetophenone and ethyl butyrate at 1–3% saturated vapor (n.s. indicates not significant, P = 0.94).
a
In vivo(ane.)
Odor
Odor + LED
Time (s)Odo
r only
+LED
Odor only Odoronly
+LED
+LED
0 50 100Frequency (Hz)
Frequency (Hz)20 40 60 80 100 120
× 10–6
150
–50 0 50
–50 0Lag (ms)
50
**
Evo
ked
pow
er
Evo
ked
γ po
werF
requ
ency
(H
z)
Spi
kere
fC
orr.
coe
f.
Pow
er
101
100
80
60
40
Fre
quen
cy (
Hz)
80
60
40
0 1
0 1
10–140
20
0
0.2
–50 0 50
40
20
0
4
b c
f
d e
3
2
1
0
0.1
0
0
0.5
1.0
–50 0Lag (ms)
50
0.2
0.1
0
100806040200
Power (µV2 Hz–1)
a
LED
Odor
Vgat-cre
In vivo(awake)
LED
Odor
e
× 10–3
bExample
20
0.8
Pow
er (
mV
2 s)
40 60Frequency (Hz)
80 100
0.4
0
With GC silencingCont. comparison
12 cells0.6
FR change (Hz)–10
0.4
0.2
00
Pro
port
ion
of c
ells
10 Odoronly
Odor+ LED
n.s.
Evo
ked
Vm
(m
v)
2
0
–2
–4
–6
LED only
d
× 10–4 **
2
Bas
elin
e γ
pow
er (
mV
2 s)
c
1
0
Contro
l
+ LE
D
©20
14 N
atu
re A
mer
ica,
Inc.
All
rig
hts
res
erve
d.
nature neurOSCIenCe advance online publication �
a r t I C l e S
Vgat-Cre animals), blind whole-cell patch-clamp recordings from GCs revealed that 13 of 15 cells (87%) hyperpolarized by more than 10 mV (Fig. 1f), indicating a high infection rate and efficient silencing in the awake preparation. Such cells hyperpolarized by −22.0 ± 2.0 mV at depths ranging from −962 to −499 µm from the brain surface (Supplementary Fig. 2). Light-evoked hyperpolarization was also strong enough to suppress odor-evoked excitatory responses in awake animals (Fig. 7a). To probe the contribution of GCs to fast network activity, we again recorded LFPs while silencing the GCL. Baseline LFP recordings in awake animals showed significantly more promi-nent gamma rhythms than the anesthetized state, consistent with recent reports25. Silencing GCs markedly reduced such gamma oscil-lations (raw γ power = 135.6 ± 19.3 µV2 s versus 108.5 ± 14.4 µV2 s, P < 0.01, n = 11 recordings; Fig. 7b,c) confirming the key role of GCs in gamma activity in the awake preparation. To analyze how GCs con-tribute to MC activity, we performed whole-cell recordings from MCs in the awake state (Fig. 7d,e). Again, firing rates were largely unaltered by silencing GCs (control, 3.94 ± 0.96 Hz; LED, 3.21 ± 1.04 Hz; P = 0.43, n = 12 cells; Fig. 7d). Moreover, odor-evoked slow inhibitory responses, which were also observed prominently in the awake (8 of 16 odor-cell pairs, with an average hyperpolarization of −1.19 ± 0.43 mV), were not suppressed with GCL silencing (−2.55 ± 0.81 mV during LED, P = 0.90, one-tailed paired t test; Fig. 7e). Thus, as in the anesthetized preparation, GCs in the awake state underlie fast gamma rhythms, but do not contribute to slow, respiration-coupled odor-evoked inhibition.
DISCUSSIONAltogether, our findings provide a mechanistic understanding of how inhibitory circuits in a brain region can shape signals in distinct ways. We found that inhibition from the local glomerular circuits sculpts slow rhythms by setting baseline phase as well as inhibiting OB out-put during odor presentations. Deep, global inhibitory circuits in the GCL, on the other hand, refine temporal coherence in the gamma range and spike precision during odor presentation. This suggests a dissociation between slow and fast inhibition in the olfactory bulb (Supplementary Fig. 1e), which is reminiscent of the pharmacologi-cal separation of slow and fast inhibition in insects23.
Efficiency and extent of interneuron silencingThe lack of GC contribution to slow rhythms and sniff-coupled odor-evoked inhibition is particularly surprising. Immunohistochemistry and electrophysiological recordings revealed that virtually all GAD2- or VGAT-positive granule cells were infected in vivo and in vitro and hyperpolarized efficiently (Fig. 1 and Supplementary Video 1). Notably, in vivo, odor-evoked excitatory responses in GCs were reli-ably abolished. Thus, it is unlikely that the negative result can be attributed to omission of a substantial subpopulation of GCs from our experimental manipulation.
Lack of visible, slow depolarization in M/TCs following GC silenc-ing may relate to the low firing rates of GCs at rest in vivo that we observed. Although it is conceivable that local AP-independent GABA release from GC dendrites38 might be affected less markedly, the wide-spread ArchT expression (including in the dendrites; Fig. 1), suppres-sion of activities attributed to dendrodendritic inhibition (such as fast, recurrent IPSPs evoked in slices; Supplementary Fig. 5) and dimin-ished gamma population responses in vivo (Figs. 6 and 7) make it unlikely that subthreshold dendritic release was completely unaffected by the optogenetic silencing of the GCL. Rather, the absence of any phase shift of slow rhythms or suppression of odor-evoked inhibition during GCL silencing strongly suggests that GCs are not involved in
coordinating these slow activities. Furthermore, optogenetic silencing of only a local group of glomerular interneurons was sufficient to reduce phase shift in MCs and reduce evoked inhibition markedly (Figs. 2 and 4). The fact that glomerular silencing did not convert evoked inhi-bition into excitation as reliably as the pharmacological manipulation (Fig. 5) might indicate that, even though the M/TCs recorded but did extend to the fringes where in the immediate vicinity of injection sites, they did not always extend their apical dendritic tufts into the core of the infected region, but did extend to the fringes where infection only incompletely covered the JGC population (Supplementary Fig. 3a). Although incomplete silencing would be potentially problematic for negative results, it is difficult to deny the glomerular layer con-tribution to slow inhibition from the strong effects that we observed during glomerular silencing. It is likely that our layer-selective silenc-ing included some interneurons outside glomerular and GCLs, such as EPL interneurons. Although they are likely to contribute to OB function39,40, resulting from their broad odor tuning, they are unlikely to underlie the odor-specific inhibition of M/TCs described here.
Mechanisms underlying gamma-band activityA number of studies based on models4, current source density analy-sis10, localized pharmacology24 and constitutive genetic modifica-tions25,27 suggest that the dendro-dendritic MC-GC synapse might underlie gamma activity. Our results from optogenetic silencing of the GCL provide direct evidence of a causal role for GCs in gamma oscillations in anesthetized and awake animals. The remaining gamma power during GC silencing may be explained by the autono-mous dendritic mechanisms for GABA release not involving somatic APs38, as mentioned earlier, or the residual 10–15% of GCs that might have escaped the manipulation. Alternatively, the condition could have also silenced other interneuron types present in the GCL, such as Blanes cells, which inhibit GCs tonically41,42, possibly amplifying the remaining GC contributions.
Thus far, we have discussed gamma oscillations largely as one band. However, this band in the OB consists of at least two types, namely slow and fast gamma oscillations10, which are thought to involve MCs and TCs, respectively43. We have analyzed the standard broad gamma band (40–100 Hz)10 in the LFP, and only at the single-cell level did we manage to highlight fast gamma range activity as spike regularity in TCs thought to arise from their higher firing rates43. In both cases, gamma activities strongly relied on GCs, which is consist-ent with a dominant role of the GCL in coordinating synchrony on a fast timescale.
Temporal separation by glomerular feedforward inhibitionRhythmic, sniff-coupled patterning of activity has attracted atten-tion for more than 60 years11 and has been intensely studied, espe-cially in the anesthetized preparation. Both principal neurons and interneurons have demonstrated a prominent subthreshold oscilla-tion14,16,18. However, given that the difference in respiration coupling of M/TCs was reported only recently, mechanistic understanding here is much scarcer. Rhythmicity in GC activation and the conse-quent rhythmic inhibition of M/TCs have long been linked to the sniff-coupling patterns of M/TCs14,17,18, but recent computational models have suggested the glomerular feedforward circuitry as a possible mechanism behind the MC-TC phase shift16. Our results indicate that silencing GCs has a negligible effect on the baseline activity of M/TCs, including depth of modulation or preferred phase of discharge. Instead, marked alteration in sniff coupling was observed with glomerular layer silencing. The largest phase shift occurred in cells identified as MCs on the basis of their subthreshold
©20
14 N
atu
re A
mer
ica,
Inc.
All
rig
hts
res
erve
d.
� advance online publication nature neurOSCIenCe
a r t I C l e S
oscillations, consistent with our earlier report that temporal separa-tion is established by delaying MCs by inhibition16. Here we further attempted to dissect the intricate glomerular circuit. As there is no specific molecular marker for the neurons involved in the feedforward pathway32, we relied on functional connectivity to distinguish JGC classes: by shutting down activity in M/TCs via optogenetic activation of GCL interneurons, we were able to identify JGCs on the basis of the source of excitatory drive. This included cells exclusively driven by the ON and may also have comprised other cell types, such as those driven by glomerular feedforward excitation observed in vitro32. Most recorded JGCs locked tightly to respiration rhythms, as reported recently44, but with a variety of phase preferences. The putative PGo population that was functionally distinguished was more homogenous, depolarizing in a narrow phase window that corre-sponded to the MC hyperpolarization. This method for circuit analy-sis in vivo relied on the neatly layered structure of the OB, but might prove to be useful in other brain areas.
Taken together, our data exclude GCs as a major source of respiration-linked hyperpolarization in MCs, but strongly suggest PGo cell–mediated feedforward inhibition as the mechanism underlying the phase delay of MCs. This delay might be used for readout of OB activity in the piriform cortex14 and might give MCs the necessary temporal window to integrate information computed across the OB. Such ‘across-channel’ computation could involve recruitment of GCs, which have been implicated in tasks that are known to take more time45,46.
Odor-evoked inhibition and contrast enhancementContrast enhancement is a widespread feature of sensory representa-tion in general and is thought to be one of the central roles for lateral inhibition in the brain. Inhibitory responses prominently observed in M/TCs in anesthetized animals have for decades been linked to this idea, fuelled by the observation that some odorants, which are structurally similar to odorants that excite a recorded M/TC, can inhibit them20, reminiscent of a ‘center-surround’ arrangement20,21. Although such evoked inhibition has frequently been referred to as lateral inhibition, direct evidence for an involvement of GCs has been missing. We found that silencing of GCs did not affect slow, odor-evoked inhibition. Instead, glomerular silencing reliably sup-pressed this inhibition. Furthermore, our pharmacological manipu-lation revealed evoked excitation that is normally masked by evoked inhibition, an effect that was not seen for odors without detectable responses under control conditions (Fig. 5). Such strict concurrence between evoked inhibition and excitation is difficult to reconcile with the GC lateral inhibitory network as an underlying mechanism, as there is no canonical accompanying source of excitation (Fig. 4c and Supplementary Fig. 4). Rather, it is indicative of parallel feedforward excitation and inhibition pathways, which are present mainly in the glomerular layer (Figs. 3 and 4c)32,33. Consistent with this, PGo neu-rons discharge at times matching evoked inhibition, making them a possible candidate for this phenomenon. Whether the population of PGo cells underlying the phase shift between MCs and TCs is identi-cal, overlapping or distinct from the population of PGo mediating odor-evoked inhibition remains to be determined.
It is tempting to speculate that what we found here is an implemen-tation of non-topographical contrast enhancement22. In this model, olfactory representation is sharpened ‘within channel’ as follows: a glomerulus only weakly tuned to a given odor receives excitation that is not strong enough to activate M/TCs, but is able to recruit more electrotonically compact PG cells via a feedforward pathway, resulting in inhibition of OB outputs. This is an attractive alternative, as olfactory
stimuli lack a simple spatial relationship that is evident in visual stim-uli22. Our results indicate that glomerular circuits, particularly the feedforward pathway, are a possible source of slow inhibition associ-ated with contrast enhancement and exclude a role for GCs in this.
ConclusionThe scenario that emerges is one in which the glomerular circuit gives primary structure to olfactory inputs locally, producing diversity between M/TCs and possibly enhancing contrast non-topographi-cally in neurons associated with one glomerular channel. The deeper granule layer in turn further refines signals by orchestrating activity over the OB using precise timing, which is likely critical for efficient integration in downstream cortical structures47.
The general idea of dissociable rate and temporal codes has been explored, for example, in the hippocampus where firing rate and phase in a theta cycle have been suggested to represent different variables48. In addition, APs in each theta cycle may be organized even more precisely through gamma rhythms nested in the theta rhythm9 to represent multiple items orderly. Alternatively, multiple bands might coexist as a mechanism for minimizing signal corruption by multi-plexing signals49. Recruitment of distinct circuits in a brain region for dissociable control of activities on such different timescales is likely to prove important in all of these cases.
METhODSMethods and any associated references are available in the online version of the paper.
Note: Any Supplementary Information and Source Data files are available in the online version of the paper.
AcknowledgmentSWe thank M. Kaiser, E. Stier and G. Matthies for technical assistance, A. Balz and S. Martin for stereotactic injections, S. Belanca for morphological reconstructions, J. Reinert for virus characterization, A. Schmaltz and M. Abdelhamid for help with setting up the head-fixed awake preparation, G. Giese and A. Scherbarth for glass brain preparation and imaging, B. Lowell, L. Vong and V. Murthy (Harvard University) for providing Vgat-IRES-Cre knock-in mice, R. Sprengel (MPI for Medical Research) for the Cre antibody, T. Margrie, T. Cleland and W. Denk for discussion, and T. Margrie, D. Burdakov, H. Monyer, R. Jordan, A. Grabska-Barwinska and M. Helmstaedter for comments on earlier versions of the manuscript. This work was supported by the Max Planck Society, the DFG-SPP1392, the Federal Ministry of Education and Research (US-German collaboration computational neuroscience), the Alexander von Humbold Foundation (AvH), the Medical Research Council (MC_UP_1202/5), the ExcellenzCluster CellNetworks, and the Gottschalk foundation.
AUtHoR contRIBUtIonSI.F. and A.T.S. conceived and designed the experiments and wrote the paper with inputs from all authors. I.F. performed in vivo experiments in anesthetized and awake animals. J.H. performed in vitro physiology experiments and made and characterized AAV. M.K. contributed data from awake animals. E.S.B. provided ArchT viral constructs and assisted with the design of the optogenetic experiments.
comPetIng FInAncIAl InteReStSThe authors declare no competing financial interests.
Reprints and permissions information is available online at http://www.nature.com/reprints/index.html.
1. Wachowiak, M. All in a sniff: olfaction as a model for active sensing. Neuron 71, 962–973 (2011).
2. Smear, M., Shusterman, R., O’Connor, R., Bozza, T. & Rinberg, D. Perception of sniff phase in mouse olfaction. Nature 479, 397–400 (2011).
3. Haddad, R. et al. Olfactory cortical neurons read out a relative time code in the olfactory bulb. Nat. Neurosci. 16, 949–957 (2013).
4. Freeman, W.J. III. 1972 Waves, Pulses, and the Theory of Neural Masses (Academic Press, 1972).
©20
14 N
atu
re A
mer
ica,
Inc.
All
rig
hts
res
erve
d.
nature neurOSCIenCe advance online publication �
a r t I C l e S
5. Sohal, V.S., Zhang, F., Yizhar, O. & Deisseroth, K. Parvalbumin neurons and gamma rhythms enhance cortical circuit performance. Nature 459, 698–702 (2009).
6. Royer, S. et al. Control of timing, rate and bursts of hippocampal place cells by dendritic and somatic inhibition. Nat. Neurosci. 15, 769–775 (2012).
7. Klausberger, T. & Somogyi, P. Neuronal diversity and temporal dynamics: the unity of hippocampal circuit operations. Science 321, 53–57 (2008).
8. Whittington, M.A. & Traub, R.D. Interneuron diversity series: inhibitory interneurons and network oscillations in vitro. Trends Neurosci. 26, 676–682 (2003).
9. Lisman, J.E. & Jensen, O. The theta-gamma neural code. Neuron 77, 1002–1016 (2013).
10. Kay, L.M. et al. Olfactory oscillations: the what, how and what for. Trends Neurosci. 32, 207–214 (2009).
11. Adrian, E.D. The electrical activity of the mammalian olfactory bulb. Electroencephalogr. Clin. Neurophysiol. 2, 377–388 (1950).
12. Macrides, F. & Chorover, S.L. Olfactory bulb units: activity correlated with inhalation cycles and odor quality. Science 175, 84–87 (1972).
13. Shusterman, R., Smear, M.C., Koulakov, A.A. & Rinberg, D. Precise olfactory responses tile the sniff cycle. Nat. Neurosci. 14, 1039–1044 (2011).
14. Margrie, T.W. & Schaefer, A.T. Theta oscillation coupled spike latencies yield computational vigour in a mammalian sensory system. J. Physiol. (Lond.) 546, 363–374 (2003).
15. Igarashi, K.M. et al. Parallel mitral and tufted cell pathways route distinct odor information to different targets in the olfactory cortex. J. Neurosci. 32, 7970–7985 (2012).
16. Fukunaga, I., Berning, M., Kollo, M., Schmaltz, A. & Schaefer, A.T. Two distinct channels of olfactory bulb output. Neuron 75, 320–329 (2012).
17. Phillips, M.E., Sachdev, R.N.S., Willhite, D.C. & Shepherd, G.M. Respiration drives network activity and modulates synaptic and circuit processing of lateral inhibition in the olfactory bulb. J. Neurosci. 32, 85–98 (2012).
18. Cang, J. & Isaacson, J.S. In vivo whole-cell recording of odor-evoked synaptic transmission in the rat olfactory bulb. J. Neurosci. 23, 4108–4116 (2003).
19. Luo, M. & Katz, L.C. Response correlation maps of neurons in the mammalian olfactory bulb. Neuron 32, 1165–1179 (2001).
20. Yokoi, M., Mori, K. & Nakanishi, S. Refinement of odor molecule tuning by dendrodendritic synaptic inhibition in the olfactory bulb. Proc. Natl. Acad. Sci. USA 92, 3371–3375 (1995).
21. Shepherd, G.M., Chen, W.R., Willhite, D., Migliore, M. & Greer, C.A. The olfactory granule cell: from classical enigma to central role in olfactory processing. Brain Res. Rev. 55, 373–382 (2007).
22. Cleland, T.A. & Sethupathy, P. Non-topographical contrast enhancement in the olfactory bulb. BMC Neurosci. 7, 7 (2006).
23. MacLeod, K. & Laurent, G. Distinct mechanisms for synchronization and temporal patterning of odor-encoding neural assemblies. Science 274, 976–979 (1996).
24. Lagier, S., Carleton, A. & Lledo, P.-M. Interplay between local GABAergic interneurons and relay neurons generates gamma oscillations in the rat olfactory bulb. J. Neurosci. 24, 4382–4392 (2004).
25. Lepousez, G. & Lledo, P.-M. Odor discrimination requires proper olfactory fast oscillations in awake mice. Neuron 80, 1010–1024 (2013).
26. Bathellier, B., Lagier, S., Faure, P. & Lledo, P.-M. Circuit properties generating gamma oscillations in a network model of the olfactory bulb. J. Neurophysiol. 95, 2678–2691 (2006).
27. Nusser, Z., Kay, L.M., Laurent, G., Homanics, G.E. & Mody, I. Disruption of GABAA receptors on GABAergic interneurons leads to increased oscillatory power in the olfactory bulb network. J. Neurophysiol. 86, 2823–2833 (2001).
28. Han, X. et al. A high-light sensitivity optical neural silencer: development and application to optogenetic control of non-human primate cortex. Front. Syst. Neurosci. 5, 18 (2011).
29. Taniguchi, H. et al. A resource of cre driver lines for genetic targeting of GABAergic neurons in cerebral cortex. Neuron 71, 995–1013 (2011).
30. Vong, L. et al. Leptin action on GABAergic neurons prevents obesity and reduces inhibitory tone to POMC neurons. Neuron 71, 142–154 (2011).
31. Parrish-Aungst, S., Shipley, M.T., Erdelyi, F., Szabo, G. & Puche, A.C. Quantitative analysis of neuronal diversity in the mouse olfactory bulb. J. Comp. Neurol. 501, 825–836 (2007).
32. Kiyokage, E. et al. Molecular identity of periglomerular and short axon cells. J. Neurosci. 30, 1185–1196 (2010).
33. Najac, M., De Saint Jan, D., Reguero, L., Grandes, P. & Charpak, S. Monosynaptic and polysynaptic feed-forward inputs to mitral cells from olfactory sensory neurons. J. Neurosci. 31, 8722–8729 (2011).
34. Margrie, T.W., Sakmann, B. & Urban, N.N. Action potential propagation in mitral cell lateral dendrites is decremental and controls recurrent and lateral inhibition in the mammalian olfactory bulb. Proc. Natl. Acad. Sci. USA 98, 319–324 (2001).
35. Kato, H.K., Chu, M.W., Isaacson, J.S. & Komiyama, T. Dynamic sensory representations in the olfactory bulb: modulation by wakefulness and experience. Neuron 76, 962–975 (2012).
36. Rinberg, D., Koulakov, A. & Gelperin, A. Sparse odor coding in awake behaving mice. J. Neurosci. 26, 8857–8865 (2006).
37. Cazakoff, B.N., Lau, B.Y.B., Crump, K.L., Demmer, H.S. & Shea, S.D. Broadly tuned and respiration-independent inhibition in the olfactory bulb of awake mice. Nat. Neurosci. 17, 569–576 (2014).
38. Isaacson, J.S. & Strowbridge, B.W. Olfactory reciprocal synapses: dendritic signaling in the CNS. Neuron 20, 749–761 (1998).
39. Kato, H.K., Gillet, S.N., Peters, A.J., Isaacson, J.S. & Komiyama, T. Parvalbumin-expressing interneurons linearly control olfactory bulb output. Neuron 80, 1218–1231 (2013).
40. Miyamichi, K. et al. Dissecting local circuits: parvalbumin interneurons underlie broad feedback control of olfactory bulb output. Neuron 80, 1232–1245 (2013).
41. Labarrera, C., London, M. & Angelo, K. Tonic inhibition sets the state of excitability in olfactory bulb granule cells. J. Physiol. (Lond.) 591, 1841–1850 (2013).
42. Pressler, R.T. & Strowbridge, B.W. Blanes cells mediate persistent feedforward inhibition onto granule cells in the olfactory bulb. Neuron 49, 889–904 (2006).
43. Manabe, H. & Mori, K. Sniff rhythm-paced fast and slow gamma-oscillations in the olfactory bulb: relation to tufted and mitral cells and behavioral states. J. Neurophysiol. 110, 1593–1599 (2013).
44. Livneh, Y., Adam, Y. & Mizrahi, A. Odor processing by adult-born neurons. Neuron 81, 1097–1110 (2014).
45. Shimshek, D.R. et al. Enhanced odor discrimination and impaired olfactory memory by spatially controlled switch of ampa receptors. PLoS Biol. 3, e354 (2005).
46. Abraham, N.M. et al. Synaptic inhibition in the olfactory bulb accelerates odor discrimination in mice. Neuron 65, 399–411 (2010).
47. MacLeod, K., Backer, A. & Laurent, G. Who reads temporal information contained across synchronized and oscillatory spike trains? Nature 395, 693–698 (1998).
48. Huxter, J., Burgess, N. & O’Keefe, J. Independent rate and temporal coding in hippocampal pyramidal cells. Nature 425, 828–832 (2003).
49. Akam, T.E. & Kullmann, D.M. Efficient ‘communication through coherence’ requires oscillations structured to minimize interference between signals. PLoS Comput. Biol. 8, e1002760 (2012).
©20
14 N
atu
re A
mer
ica,
Inc.
All
rig
hts
res
erve
d.
nature neurOSCIenCe doi:10.1038/nn.3760
ONLINE METhODSAll animal experiments were performed according to the guidelines of the German animal welfare law, approved by the local ethics panel and UK Home Office under the Animals (Scientific Procedures) Act 1986. Mice used for the optogenetic experiments were from transgenic lines expressing Cre recombinase in GAD2-expressing or VGAT-expressing neurons (Gad2-ires-Cre or VGat- ires-Cre; from Jackson Laboratories and B. Lowell, Harvard University). Both male and female mice were used. All reagents were obtained from Sigma-Aldrich unless noted otherwise.
Virus generation and stereotactic injections. AAV-EF1A-DIO-Chr2-GFP50 and AAV-CAG-FLEX-ArchT-GFP28 were produced using a protocol described elsewhere51 to titers of 1.3 × 10¹³ particles per ml and 6.1 × 10¹² particles per ml, respectively.
Animals were anesthetized intraperitoneally with ketamine and xylazine (100 and 20 mg per kg of body weight, respectively) and prepared for surgery in a stereotactic frame (David Kopf Instruments). For injection of AAV, five coordi-nates were used for targeting the GCL, where virus was dispensed at 3 and 2 depths along the first and second tracks. The coordinates were: for the first track: +0.75 mm (anteroposterior), −0.75 mm (mediolateral, ML) from the midline rhinal fis-sure, at three dorsoventral (DV) depths, −0.7 mm (207 nl), −1.1 mm (103.5 nl) and −1.3 mm (103.5 nl); for the second track: +1.1 mm (anteroposterior), −0.75 mm (ML) from the midline rhinal fissure, at two depths, −0.7 mm (207 nl dis-pensed), −1.15 mm (103.5 nl). For targeting the glomerular layer, the co-ordinate was +2.0 mm (anteroposterior), −1.0 mm (ML), −0.3 mm (DV), with 92 nl injected at a single site. This coordinate was chosen to target dorsolaterally located glomeruli, ideal for subsequently targeting MCs belonging to those glomeruli. Furthermore, for glomerular layer injections, the head of the animals were tilted leftwards and backwards by 15 degrees and 10 degrees, respectively, so that the craniotomy for virus injection was as far away as possible from the craniotomy for electrophysiological recordings. Such injections resulted in approximately 95% of all infected cells being located in the GL (Supplementary Fig. 3). Viruses were dispensed from a thin capillary tube using a Nanoject injector (Drummond Scientific) at a rate of 46 nl min−1. Mice were 28–45 d old at the time of injections. Electrophysiology was carried out 1–4 weeks after the virus injections.
In vivo electrophysiology. Animals were anesthetized intraperitoneally with ketamine and xylazine (100 and 20 mg per kg, respectively, for induction; xylazine concentration was reduced to 10 mg per kg for maintenance) and kept warm (37 °C, DC temperature controller, FHC) for the duration of the experiments. A small craniotomy and durectomy of approximately 500 µm in diameter was made over the dorsolateral part of the left olfactory bulb, which was submerged in Ringer solution containing 135 mM NaCl, 5.4 mM KCl, 5 mM HEPES, 1 mM MgCl2, 1.8 mM CaCl2, and its pH adjusted to 7.2 and 280 mOsm kg−1. Whole-cell recordings were made with borosilicate glass pipette filled with 130 mM KMeSO4, 10 mM HEPES, 7 mM KCl, 2 mM ATP2-Na, 2 mM ATP-Mg, 0.5 mM GTP, 0.05 mM EGTA, 10 mM biocytin, with pH and osmolarity adjusted to 7.3 and 275–280 mOsm kg−1, respectively. Signals were amplified and filtered at 30 kHz by an Axoclamp 2B (Molecular Devices) and digitized at 20 kHz with a micro 1401 (Cambridge Electronic Design). Neurons were identified based on depth and passive membrane properties, and in some cases confirmed with morphology16 (Fig. 1g). PGo cells were functionally distinguished from JGr cells by assessing the major source of excitatory drive (Fig. 3). Depths of recorded neurons are vertical distances from the brain surface. Respiration was recorded using a piezoelectric band (Kent Scientific) wrapped around the animal’s chest and calibrated against nasal flow as previously described16. For morphologi-cal identification of some recorded neurons, recorded OBs were sectioned and stained for biocytin using an avidin-biocytin reaction coupled to peroxidase/DAB reaction52 (ABC kit, Vector Labs). Stained cells were traced using a Neurolucida system (MBF Bioscience). LFP was recorded with a glass pipette filled with Ringer solution, placed in the GCL.
Recordings from awake animals were performed as described previously16. In brief, 30–50-d-old C57BL/6 mice or Vgat-Cre mice previously injected with AAV were implanted with a stainless steel head-plate and allowed to recover. On the day of the experiments, animals were given meloxicam (2.5 mg per kg, subcutaneous) or carprofen (5 mg per kg, subcutaneous) and lidocaine (1%, subcutaneous) or levobupivacaine (0.5%, subcutaneous) pre-operatively. Under
isoflurane anesthesia (1.75% in air), a craniotomy approximately 2 mm in diame-ter was made over the dorsal surface of the olfactory bulb, which was subsequently covered with a thin layer of agarose (5% in the Ringer solution) for stability. The animals were allowed to recover from the isoflurane anesthesia for at least 30 min before recordings commenced. After this time, such head-fixed animals readily performed olfactory discrimination tasks during whole-cell recordings (Kollo, M., Schmaltz, A., Fukunaga, I. & Schaefer, A.T., Soc. Neurosci. Abstr. MM1, 2012).
Illumination for the optogenetic experiments in vivo in both anesthetized and awake preparations was presented by an XP-G LED (Cree) placed approximately 1 cm above the brain surface so that it produced ~15 mW mm−2 of light intensity on the surface. For experiments with odor presentations, control trials and trials with LED were interleaved for all experiments. For effects on spontaneous activity, light was presented for 1 s every 10 s.
GABAA clamp was carried out in a manner previously described16. Briefly, a solution containing gabazine and muscimol (0.45 mM and 2 mM, respectively; Tocris Biosciences) was superfused over the exposed brain using a peristaltic pump (Ismatec, IDEX Health and Science). The solution was superfused for at least 30 min for the drug condition. Odors at concentrations of 0.1–10% of saturated vapor (up to 35% in Supplementary Fig. 4e) were presented at 30-s intervals using a custom-made olfactometer timed to the peak of expiration detected from the chest distension signals (Spike-Height discriminator, FHC). A panel of odorants presented consisted of isoamylacetate, methylsalicylate, salicylaldehyde, cinnamaldehyde, eugenol, acetophenone, cineol, anisaldehyde and mineral oil (analytical standard). When all seven odors were presented, 47% of cells responded with excitation to at least one odor. Inhibition in response to at least one odor was observed in 16% of all cells.
In vitro electrophysiology. Dissected OBs were submerged in ice-cold artificial cerebrospinal fluid containing 125 mM NaCl, 25 mM NaHCO3, 1.25 mM NaH2PO4, 25 mM glucose, 2.5 mM KCl, 2 mM MgCl2 and 1 mM CaCl2, equilibrated with a mixture of 95% O2 and 5% CO2 and adjusted to 310–320 mOsm osmolarity, and horizontal slices 300 µm in thickness were made using a vibratome (Microm HM650V, Sigmann Elektronik). For electrophysiology, the concentration of MgCl2 and CaCl2 were changed to 1 mM and 2 mM, respectively, and the solution was warmed to 33–35 °C. Whole-cell recordings were made with borosilicate glass electrodes filled with the same internal solution used for in vivo electrophysiology, except the exclusion of biocytin. Signals were ampli-fied by a Multiclamp 700B (Molecular Devices), digitized at 16.67 kHz by an ITC 16 (HEKA) and acquired using the NClamp/Neuromatic package (J. Rothman, http://www.thinkrandom.com) in Igor Pro (Wavemetrics). The halogen micro-scope light source (100 W, Zeiss) was used for optogenetic experiments in vitro.
data analysis. Data was analyzed in Spike2 (CED), Matlab (Mathworks) and Igor Pro using custom-written routines. Unless otherwise stated, values stated in the text are the mean and the s.e.m. Sample sizes used are similar to those reported in the field and no statistical method was used to predetermine these. P values reported are, unless otherwise stated, from two-tailed paired t tests. For statistical tests requiring normal underlying distributions, normality was assumed while individual data points are displayed wherever possible. Data collection and analy-sis were not performed blind to the conditions of the experiments. One sniff cycle is defined to be from one expiration peak to the next expiration peak. Expiration peaks were the most reliable events for detection. On average, expiration peak occurs approximately 100 ms after the inhalation onset in anaesthetized mice16. Recordings were aligned and normalized to the sniff cycle and significance of sniff coupling was assessed as described previously16.
Vm change with light for testing the optogenetic method. Average Vm during baseline period (a 500-ms window approximately 100 ms before light onset) was subtracted from average Vm during light (a 500-ms window approximately 150 ms after light onset).
light-induced phase shift. Preferred phase of sniff aligned, subthreshold mem-brane potential average was obtained as described previously16 and compared with the baseline periods (5 s before the light onset) and during light (all complete sniff cycles during light presentations). Light presentation was for 1 s. This was repeated every 10 s at least 20 times. Preferred phase was calculated as the phase of an average vector, where sniff phase and the baseline-subtracted Vm
©20
14 N
atu
re A
mer
ica,
Inc.
All
rig
hts
res
erve
d.
nature neurOSCIenCedoi:10.1038/nn.3760
amplitude corresponded to the argument and magnitude of individual vectors. Phase-shift was the preferred phase during light minus the preferred phase during baseline, and is given in radians.
Fisher’s rank test on two circular distributions. Non-parametric tests com-paring two circular histograms were carried out as described previously53. Comparison was between the distribution of phaseshifts during silencing and the distribution of baseline phase fluctuations (φbaseline2 − φbaseline1, φbaseline1 = preferred phase during 5 s before each LED presentation, φbaseline2 = preferred phase between 6 and 5 s before LED presentation). Phase shifts and baseline phase fluctuations were circularly ranked together53 and the resulting rank vectors for each group compared against test statistics from randomly generated ranks (1,000 sets) to obtain the P values.
drift subtraction. During light presentations, a small drift of baseline membrane potential (−0.82 ± 0.71 mV per cycle) was observed, which was subtracted for display purpose only (Fig. 2c,d).
color-coding of mc/tc likelihood. The [R G B] values were determined as [1 − 0.9 * VmTC (φ), 1 − 0.9 * VmMC − 0.5 * VmTC (φ), 1 − 0.3 * VmMC (φ)], where VmTC(φ) and VmMC(φ) correspond to the sniff-aligned average subthreshold membrane potential from identified TCs and MCs (measured as in ref. 16), respectively, at the corresponding phase. This resulted in cells that lock to the average MC phase to appear bright pink, cells locking to the average TC phase cyan and cells at the border between MC and TC phase region to be plotted in pale colors16.
detection of odor responses (Fig. 4). Baseline Vm fluctuation was subtracted sniff-by-sniff46. A deviation greater than 2 s.d. of the baseline fluctuation dur-ing the first three sniff cycles after the valve opening was termed a response. A significantly negative deviation not accompanied by AP increase was classified as a purely hyperpolarizing response (slow inhibition). AP change was defined as an increase in the number of APs per sniff of more than 2 s.d. above the baseline fluctuation. Excitatory response was defined as a positive AP change during the first three sniff cycles after the valve opening.
Vm changes evoked by odor presentations (evoked Vm). Evoked Vm was obtained by subtracting the average baseline Vm (Vm during 5 s before odor onset) from average Vm during odor application (for 1 s since valve opening). Baseline drift due to light presentation alone was subtracted (−6.26 ± 1.29 mV for glomerular
layer silencing, n = 7 cells; no drift subtraction was necessary for GCL silencing). For illustration capacitive artifacts from LED/valve activation were removed in some figures.
Spectral analysis. Estimates of spectral densities were obtained using a multi-taper method (http://chronux.org)54, with time window 0.5 s (T*W = 2, and 3 tapers used55). Density estimates from evoked period (1 s since odor onset) were divided by those from baseline period (1 s before odor onset).
Spike precision during gc silencing. Spikes evoked in tufted cells during odor presentations (n = 9 cells) were analyzed. Display of spike regularity (Fig. 6d,e) was achieved by realigning spike times with respect to each spike (Spikeref)56. Correlograms of spikes were obtained for spikes within and across trials, which were averaged and spectral density estimates obtained for each cell by the multi-taper method (window = 0.5 s; T*W = 5, 9 tapers used).
Baseline variability in firing rate. The average firing rate during 1-s window before LED presentation (FRControl1) and the average firing rate during another 1-s window starting 2 s before LED presentation (FRControl2) were measured to obtain FRControl2-FRControl1 (baseline variability). The average baseline variability for all LED trials for each cell was averaged and summarized in the histogram (Fig. 7d).
A Supplementary methods checklist is available.
50. Tsai, H.-C. et al. Phasic firing in dopaminergic neurons is sufficient for behavioral conditioning. Science 324, 1080–1084 (2009).
51. During, M., Young, D., Baer, K., Lawlor, P. & Klugmann, M. Development and optimization of adeno-associated virus vector transfer into the central nervous system. in Viral Vectors for Gene Therapy, Vol. 76. Methods in Molecular Medicine (ed. Machida, C.A.) 221–236 (Humana Press, 2003).
52. Marx, M., Gunter, R.H., Hucko, W., Radnikow, G. & Feldmeyer, D. Improved biocytin labeling and neuronal 3D reconstruction. Nat. Protoc. 7, 394–407 (2012).
53. Fisher, N.I. Statistical Analysis of Circular Data (Cambridge University Press, 1996).
54. Mitra, P. & Bokil, H. 2007 Observed Brain Dynamics (Oxford University Press, USA, 2007).
55. Kay, L.M. & Lazzara, P. How global are olfactory bulb oscillations? J. Neurophysiol. 104, 1768–1773 (2010).
56. Gabbiani, F. & Koch, C. Principles of spike train analysis. in Methods In Neuronal Modeling: From Synapses To Networks (eds. Koch, C. & Segev, I.) 313–360 (MIT Press, 1998).
Related Documents