PERSONNEL PSYCHOLOGY 2006, 59, 281–305 INCREASING THE ACCURACY OF CORRECTIONS FOR RANGE RESTRICTION: IMPLICATIONS FOR SELECTION PROCEDURE VALIDITIES AND OTHER RESEARCH RESULTS FRANK L. SCHMIDT, IN-SUE OH Department of Management and Organizations Tippie College of Business University of Iowa HUY LE Human Resources Research Organization Alexandria, Virginia The common practice in meta-analyses and in individual studies of cor- recting for direct range restriction even though range restriction is ac- tually indirect has long been known to lead to undercorrection, but this error has been assumed to be small. Using validity generalization data sets for 4 jobs, this study calibrated this error by comparing meta-analysis results based on corrections for direct range restriction with the more accurate results from a recently developed method of correcting for indi- rect range restriction. It was found that, on average, correction for direct range restriction resulted in substantial underestimation of operational validities for both job performance measures (21%) and training per- formance measures (28%). In addition, 90% credibility values were on average underestimated by 38%–40%. In addition to the implications for personnel selection, these findings suggest that similar underestimation of important relationships has occurred in other areas of research, with potential implications for theory development. Because of its implications for theory development, accuracy of esti- mation of important parameters is critical in any science. In behavioral and social science research, accurate correction for range restriction (or more generally, range variation) is critical to such estimates, as are cor- rections for sampling error and the biases created by measurement error. In many research situations such as educational and employment selec- tion, researchers have data only from a restricted population and yet must attempt to estimate parameters of the unrestricted population. For exam- ple, the validity of the Law School Aptitude Test (LSAT) for predicting Correspondence and requests for reprints should be addressed to Frank L. Schmidt, Department of Management and Organizations, Henry B. Tippie College of Business, Uni- versity of Iowa, Iowa City, IA 52242; [email protected]. COPYRIGHT C 2006 BLACKWELL PUBLISHING, INC. 281

Welcome message from author
This document is posted to help you gain knowledge. Please leave a comment to let me know what you think about it! Share it to your friends and learn new things together.
Transcript
PERSONNEL PSYCHOLOGY
2006, 59, 281–305
INCREASING THE ACCURACY OF CORRECTIONSFOR RANGE RESTRICTION: IMPLICATIONSFOR SELECTION PROCEDURE VALIDITIESAND OTHER RESEARCH RESULTS
FRANK L. SCHMIDT, IN-SUE OHDepartment of Management and Organizations
Tippie College of BusinessUniversity of Iowa
HUY LEHuman Resources Research Organization
Alexandria, Virginia
The common practice in meta-analyses and in individual studies of cor-recting for direct range restriction even though range restriction is ac-tually indirect has long been known to lead to undercorrection, but thiserror has been assumed to be small. Using validity generalization datasets for 4 jobs, this study calibrated this error by comparing meta-analysisresults based on corrections for direct range restriction with the moreaccurate results from a recently developed method of correcting for indi-rect range restriction. It was found that, on average, correction for directrange restriction resulted in substantial underestimation of operationalvalidities for both job performance measures (21%) and training per-formance measures (28%). In addition, 90% credibility values were onaverage underestimated by 38%–40%. In addition to the implications forpersonnel selection, these findings suggest that similar underestimationof important relationships has occurred in other areas of research, withpotential implications for theory development.
Because of its implications for theory development, accuracy of esti-mation of important parameters is critical in any science. In behavioraland social science research, accurate correction for range restriction (ormore generally, range variation) is critical to such estimates, as are cor-rections for sampling error and the biases created by measurement error.In many research situations such as educational and employment selec-tion, researchers have data only from a restricted population and yet mustattempt to estimate parameters of the unrestricted population. For exam-ple, the validity of the Law School Aptitude Test (LSAT) for predicting
Correspondence and requests for reprints should be addressed to Frank L. Schmidt,Department of Management and Organizations, Henry B. Tippie College of Business, Uni-versity of Iowa, Iowa City, IA 52242; [email protected].
COPYRIGHT C© 2006 BLACKWELL PUBLISHING, INC.
281
282 PERSONNEL PSYCHOLOGY
performance in law school can only be estimated using samples of stu-dents admitted to the law program (the restricted sample). However, thegoal is to estimate the validity of the LSAT when used in the population ofapplicants to the law school. Because of range restriction, the populationof admitted students typically has higher mean LSAT scores and a smallerstandard deviation (SD) of scores. To estimate the validity in the applicantpopulation from the observed validity in the “incumbent” population ofadmitted students, one must correct for the effects of range restriction onLSAT scores. In such a situation, if applicants have been selected directlyon test scores top down, we have what is called direct or explicit rangerestriction. On the other hand, if students have been selected on someother variable that is correlated with LSAT scores (such as a composite ofundergraduate grade point and letters of recommendation), then the rangerestriction is said to be indirect.
Building on the earlier work of Pearson (1903), Thorndike (1949) pre-sented corrections for direct and indirect univariate range restriction; thatis, equations for correcting for range restriction when restriction has oc-curred on only one variable. His Case II correction for direct range restric-tion is widely used, as described later. His Case III correction for indirectrange restriction produced by direct restriction on a third, known variablecan rarely be used because its use requires considerable information onthe third variable, and in most research this information is unknown. Laterin this paper, we describe a correction method that does not require thatinformation. Corrections for multivariate range restriction are also avail-able (Johnson & Ree, 1994; Lawley, 1943; Ree, Caretta, Earles, & Albert,1994). Multivariate range restriction corrections are straightforward ex-tensions of the univariate correction, and they correct for both the directand the indirect range restriction simultaneously. However, to use this pro-cedure one must know the intercorrelations of the independent variablemeasures in both the restricted and unrestricted populations and must knowboth what tests are used in the selection composite and what the selectionratio is. This information is rarely available outside the military testingcontext. Sackett and Yang (2000) provide an overview of corrections formultivariate range restriction and other related issues in range restriction,and we refer the reader to that article for this general background informa-tion. Because the range-restriction corrections used in research are almostalways univariate corrections, the focus of this paper is on univariate rangerestriction.
As noted 51/2 decades ago by Thorndike (1949, p. 175), most rangerestriction in personnel selection and other areas is indirect. It is very rarefor individuals to be selected and rejected top down on any single mea-sure in personnel selection, as is required in the definition of direct range
FRANK L. SCHMIDT ET AL. 283
restriction. For example, in the General Aptitude Test Battery (GATB)database of the U.S. Department of Labor (Hunter & Hunter, 1984), noneof the 515 studies were characterized by direct range restriction; in all ofthem, range restriction was indirect (Hunter, Schmidt, & Le, in press). Allwere concurrent validity studies, and in none of the studies had GATBscores been used earlier to select the incumbents.
Typically a number of variables are used in selection, and selection de-cisions are based on a (weighted) sum or composite of these variables. Ifselection is top down, it produces direct range restriction on the composite.However, typically at least some of the variables in the composite are sub-jective judgments (e.g., unquantified interview impressions, impressionsbased on letters of recommendation) and are never coded explicitly asscores. As a result, the degree of direct range restriction on the composite(i.e., the ratio of the restricted to the unrestricted SD) cannot be assessed(because the SDs cannot be computed).
As in the case of the GATB, it is typically the case that the selectionmethod that the researcher seeks to validate was not used as even one part ofthe original selection process. This is the standard model for indirect rangerestriction (Hunter et al., in press). However, in some cases, the predictor ofinterest is one of the specific components of a composite used in the earlierselection decision. For example, the researcher may want to estimate thevalidity of the spatial ability test component of a selection composite thatincluded several other tests, a structured interview, letters of recommen-dation, and a background check. Technically, this situation does not fullycorrespond to either the model of direct or indirect range restriction. How-ever, it is closer to indirect than direct range restriction. It departs from themodel of indirect range restriction only in that the errors of measurementin the spatial ability test are included in the composite score, and thereforeto some small-degree selection is based on these errors of measurement,technically violating an assumption of indirect range restriction. However,given the presence of several components in the composite, this effect isso small that it is more hypothetical than real, and the correction for indi-rect range restriction is more accurate in this case than the correction fordirect range restriction (Hunter et al., in press). However, if only two orthree measures are included in the selection composite, the violation wouldbe more serious, and it is not clear whether the correction for indirect rangerestriction would be more accurate than use of the correction for directrange restriction.
In theory, we have long had the means available to correct for indirectrange restriction, namely, Thorndike’s (1949) Case III correction equa-tion for indirect range restriction. This equation can be written as follows(Thorndike, 1949, p. 174):
284 PERSONNEL PSYCHOLOGY
Rxy =rxy +
(1
u2z
− 1
)rxzryx√[(
1
u2z
− 1
)r 2
xz + 1
] [(1
u2z
− 1
)r 2
yz + 1
] , [1]
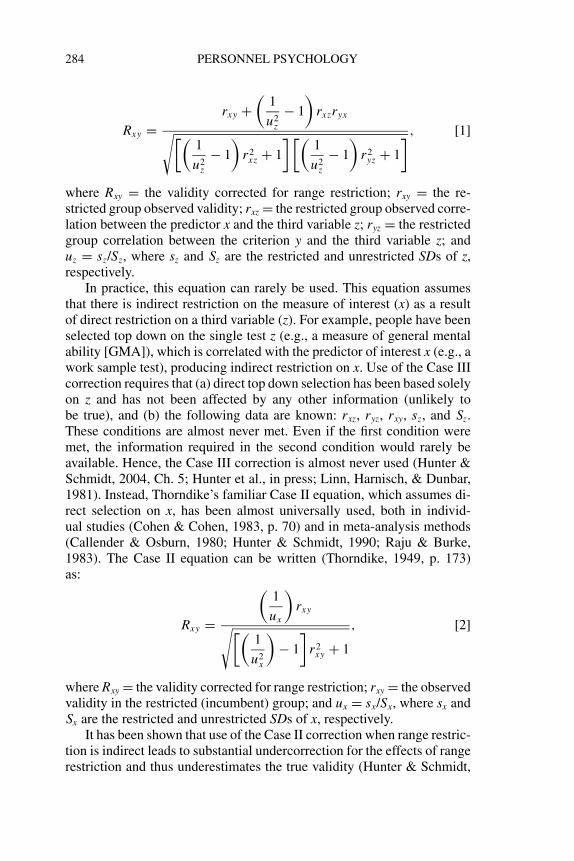
where Rxy = the validity corrected for range restriction; rxy = the re-stricted group observed validity; rxz = the restricted group observed corre-lation between the predictor x and the third variable z; ryz = the restrictedgroup correlation between the criterion y and the third variable z; anduz = sz/Sz, where sz and Sz are the restricted and unrestricted SDs of z,respectively.
In practice, this equation can rarely be used. This equation assumesthat there is indirect restriction on the measure of interest (x) as a resultof direct restriction on a third variable (z). For example, people have beenselected top down on the single test z (e.g., a measure of general mentalability [GMA]), which is correlated with the predictor of interest x (e.g., awork sample test), producing indirect restriction on x. Use of the Case IIIcorrection requires that (a) direct top down selection has been based solelyon z and has not been affected by any other information (unlikely tobe true), and (b) the following data are known: rxz, ryz, rxy, sz, and Sz.These conditions are almost never met. Even if the first condition weremet, the information required in the second condition would rarely beavailable. Hence, the Case III correction is almost never used (Hunter &Schmidt, 2004, Ch. 5; Hunter et al., in press; Linn, Harnisch, & Dunbar,1981). Instead, Thorndike’s familiar Case II equation, which assumes di-rect selection on x, has been almost universally used, both in individ-ual studies (Cohen & Cohen, 1983, p. 70) and in meta-analysis methods(Callender & Osburn, 1980; Hunter & Schmidt, 1990; Raju & Burke,1983). The Case II equation can be written (Thorndike, 1949, p. 173)as:
Rxy =
(1
ux
)rxy√[(
1
u2x
)− 1
]r 2
xy + 1
, [2]
where Rxy = the validity corrected for range restriction; rxy = the observedvalidity in the restricted (incumbent) group; and ux = sx/Sx, where sx andSx are the restricted and unrestricted SDs of x, respectively.
It has been shown that use of the Case II correction when range restric-tion is indirect leads to substantial undercorrection for the effects of rangerestriction and thus underestimates the true validity (Hunter & Schmidt,
FRANK L. SCHMIDT ET AL. 285
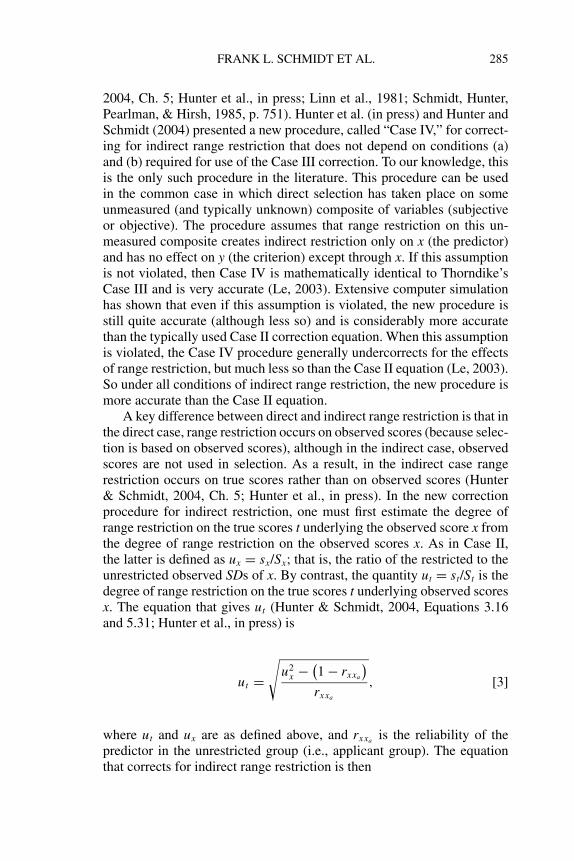
2004, Ch. 5; Hunter et al., in press; Linn et al., 1981; Schmidt, Hunter,Pearlman, & Hirsh, 1985, p. 751). Hunter et al. (in press) and Hunter andSchmidt (2004) presented a new procedure, called “Case IV,” for correct-ing for indirect range restriction that does not depend on conditions (a)and (b) required for use of the Case III correction. To our knowledge, thisis the only such procedure in the literature. This procedure can be usedin the common case in which direct selection has taken place on someunmeasured (and typically unknown) composite of variables (subjectiveor objective). The procedure assumes that range restriction on this un-measured composite creates indirect restriction only on x (the predictor)and has no effect on y (the criterion) except through x. If this assumptionis not violated, then Case IV is mathematically identical to Thorndike’sCase III and is very accurate (Le, 2003). Extensive computer simulationhas shown that even if this assumption is violated, the new procedure isstill quite accurate (although less so) and is considerably more accuratethan the typically used Case II correction equation. When this assumptionis violated, the Case IV procedure generally undercorrects for the effectsof range restriction, but much less so than the Case II equation (Le, 2003).So under all conditions of indirect range restriction, the new procedure ismore accurate than the Case II equation.
A key difference between direct and indirect range restriction is that inthe direct case, range restriction occurs on observed scores (because selec-tion is based on observed scores), although in the indirect case, observedscores are not used in selection. As a result, in the indirect case rangerestriction occurs on true scores rather than on observed scores (Hunter& Schmidt, 2004, Ch. 5; Hunter et al., in press). In the new correctionprocedure for indirect restriction, one must first estimate the degree ofrange restriction on the true scores t underlying the observed score x fromthe degree of range restriction on the observed scores x. As in Case II,the latter is defined as ux = sx/Sx; that is, the ratio of the restricted to theunrestricted observed SDs of x. By contrast, the quantity ut = st/St is thedegree of range restriction on the true scores t underlying observed scoresx. The equation that gives ut (Hunter & Schmidt, 2004, Equations 3.16and 5.31; Hunter et al., in press) is
ut =√
u2x − (
1 − rxxa
)rxxa
, [3]
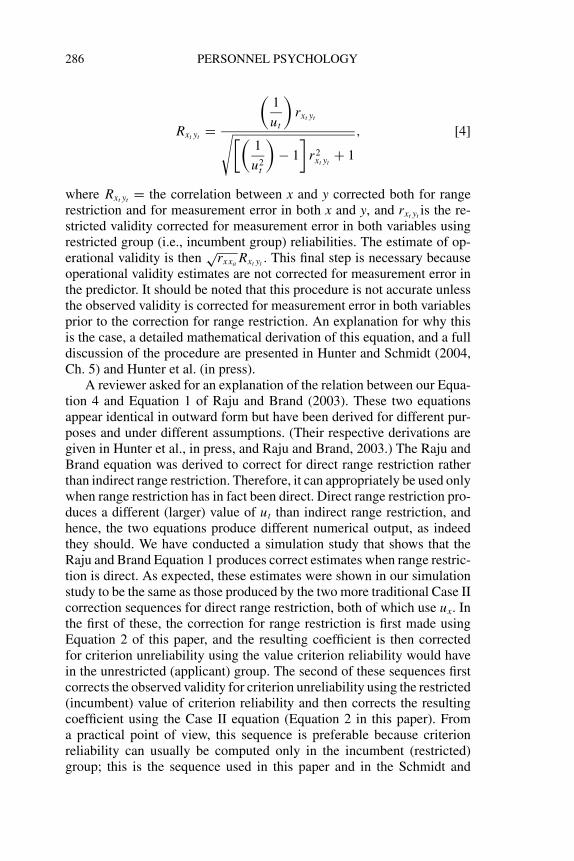
where ut and ux are as defined above, and rxxa is the reliability of thepredictor in the unrestricted group (i.e., applicant group). The equationthat corrects for indirect range restriction is then
286 PERSONNEL PSYCHOLOGY
Rxt yt =
(1
ut
)rxt yt√[(
1
u2t
)− 1
]r 2
xt yt+ 1
, [4]
where Rxt yt = the correlation between x and y corrected both for rangerestriction and for measurement error in both x and y, and rxt yt is the re-stricted validity corrected for measurement error in both variables usingrestricted group (i.e., incumbent group) reliabilities. The estimate of op-erational validity is then
√rxxa Rxt yt . This final step is necessary because
operational validity estimates are not corrected for measurement error inthe predictor. It should be noted that this procedure is not accurate unlessthe observed validity is corrected for measurement error in both variablesprior to the correction for range restriction. An explanation for why thisis the case, a detailed mathematical derivation of this equation, and a fulldiscussion of the procedure are presented in Hunter and Schmidt (2004,Ch. 5) and Hunter et al. (in press).
A reviewer asked for an explanation of the relation between our Equa-tion 4 and Equation 1 of Raju and Brand (2003). These two equationsappear identical in outward form but have been derived for different pur-poses and under different assumptions. (Their respective derivations aregiven in Hunter et al., in press, and Raju and Brand, 2003.) The Raju andBrand equation was derived to correct for direct range restriction ratherthan indirect range restriction. Therefore, it can appropriately be used onlywhen range restriction has in fact been direct. Direct range restriction pro-duces a different (larger) value of ut than indirect range restriction, andhence, the two equations produce different numerical output, as indeedthey should. We have conducted a simulation study that shows that theRaju and Brand Equation 1 produces correct estimates when range restric-tion is direct. As expected, these estimates were shown in our simulationstudy to be the same as those produced by the two more traditional Case IIcorrection sequences for direct range restriction, both of which use ux. Inthe first of these, the correction for range restriction is first made usingEquation 2 of this paper, and the resulting coefficient is then correctedfor criterion unreliability using the value criterion reliability would havein the unrestricted (applicant) group. The second of these sequences firstcorrects the observed validity for criterion unreliability using the restricted(incumbent) value of criterion reliability and then corrects the resultingcoefficient using the Case II equation (Equation 2 in this paper). Froma practical point of view, this sequence is preferable because criterionreliability can usually be computed only in the incumbent (restricted)group; this is the sequence used in this paper and in the Schmidt and
FRANK L. SCHMIDT ET AL. 287
Le (2004) computer program. The Raju and Brand Equation 1 producesan estimate of true score correlation rather than true validity. Once thisvalue is attenuated for the predictor unreliability correction, the Raju andBrand equation produces the same true validity estimate as these two moretraditional procedures for correcting for direct range restriction, a valuedifferent from that produced by our Equation 4 for indirect range restric-tion. Hence, the Raju and Brand (2003) equation is accurate but serves adifferent purpose from that of our Equation 4.
Increased accuracy of range restriction corrections is perhaps evenmore important in meta-analysis methods than in primary studies. Untilrecently, all meta-analysis methods (Callender & Osburn, 1980; Hunter& Schmidt, 1977; 1990; Raju & Burke, 1983) have used only the Case IIcorrection for direct range restriction (Equation 2). Hunter and Schmidt(2004) and Hunter et al. (in press) present methods for incorporatingthe new correction for indirect restriction into meta-analysis methods,both artifact distribution meta-analysis and meta-analysis methods thatcorrect each correlation individually. These methods address the ques-tion of the required sequencing of corrections for range restriction andmeasurement error, a sequencing that is different from that required incorrection for direct range restriction. Hunter and Schmidt (2004) alsodescribe Windows-based computer programs for such meta-analysis meth-ods (Schmidt & Le, 2004). In addition to the analytic derivations pre-sented in Hunter and Schmidt (2004, Ch. 5) and Hunter et al. (in press),the accuracy of this method is supported by computer simulation stud-ies (Le, 2003) showing that these computer programs provide accurateestimates.
Although the implications of increased accuracy of range restrictioncorrections are perhaps most obvious for validity estimation in person-nel selection, they are also important in many other areas of researchin I-O psychology and other disciplines. For example, in studies of therelationship between job satisfaction and other variables (e.g., organiza-tional commitment and absenteeism; see Terborg & Lee, 1982), there arebetween-study differences in range variation on the satisfaction measure.This is clearly indirect, not direct, range variation. Properly correcting allcorrelations to a reference population SD requires the use of the Case IVprocedure. As another example, people who volunteer for experiments orother studies may, as a result of self-selection, be less variable on keytraits or other variables than the populations that the researcher wishesto generalize to. This is clearly indirect range restriction. Other examplesfrom I-O research could be given. The general implication is that manyrelationships in the I-O literature may be stronger than they have beenestimated to be in the past on the basis of use of the correction for directrange restriction (Hunter & Schmidt, 2004, Ch. 5).
288 PERSONNEL PSYCHOLOGY
The specific focus of this paper is on the implications for estimatesin the literature of selection procedure validity. This literature containsnumerous meta-analytic studies of selection validity, all of which to datehave been based on use of the Case II correction for range restriction.A key question therefore is how inaccurate are these estimates and howmuch do they change if the data are re-analyzed using meta-analytic (va-lidity generalization) methods that incorporate the Case IV correction forindirect range restriction? What are the implications of these changes forpersonnel psychology? In this study, we re-analyze available data fromprevious validity generalization studies to answer this question. Usingthe computer programs of Schmidt and Le (2004; described in Hunter& Schmidt, 2004), we compare validity generalization results based oncorrections for indirect range restriction with the results for the same databased on corrections assuming direct range restriction.
Method
Data Bases
The data set for job performance criteria for the job of first-line super-visor was available from Schmidt, Hunter, Pearlman, and Shane (1979).This included validity data for GMA tests, Mechanical Comprehensiontests, and Spatial Ability tests. These data are described in full in Schmidt,Hunter, Pearlman, and Shane (1979), including a discussion of the natureof the job and the tests used. Next, we used the data base from Schmidt,Gast-Rosenberg, and Hunter (1980) for computer programmers. This dataset included validity data for the three subtests of the Programmer AptitudeTest (PAT; McNamara & Hughes, 1961) and its total score (i.e., the sumof the three subtests). This data set is described in full in Schmidt et al.(1980). Finally, the database from Schmidt, Hunter and Caplan (1981a)for petroleum plant operator and maintenance jobs was also available.Test types included GMA, Mechanical Comprehension, Chemical Com-prehension, Numerical Computation, and Arithmetic Reasoning. This dataset included both training and job performance criteria, and in some cases,the number of coefficients was slightly larger than shown in Schmidt et al.(1981a) because a later updating of this research (Schmidt, Hunter, &Caplan, 1981b) located several additional studies. Again, this data set isdescribed in detail in the original published article (Schmidt et al., 1981a).
Data Analysis
The meta-analysis program for artifact distribution meta-analysisbased on the Case IV correction for indirect range restriction (Schmidt
FRANK L. SCHMIDT ET AL. 289
& Le, 2004) was applied to each of these data sets. This program is de-scribed in detail in Hunter and Schmidt (2004, Ch. 4 and appendix tothe book). The artifact distributions used for ux, and criterion and testreliability were the same ones used in the original studies, thus holdingthis condition constant. These artifact distributions may be viewed in theoriginal studies. For the indirect range restriction correction, the ux valueswere transformed to ut values using Equation 3 for use in the Equation 4correction. In addition, for the indirect range restriction correction, theinitial values for predictor reliability in the unrestricted (applicant group;the initial rxxa values) were transformed to their restricted values (rxxi ) inthe incumbent group using Equation 27 of Hunter et al. (in press), as re-quired by Equation 4 of this paper. Equation 4 provides an estimate of thetrue score correlation; to estimate true (operational) validity, these valueswere attenuated by the square root of (unrestricted group) predictor unre-liability. A complete description of these steps and the rationale for themis provided in Hunter et al. (in press). However, in some cases, some of thesmaller values in the distribution of applicant pool predictor reliabilities(rxxa values) led to negative values under the radical in Equation 3, leadingto undefined ut values. In these cases, these rxxa values were omitted forboth the Case IV and Case II analyses. Each of these data sets had pre-viously been analyzed using earlier meta-analysis methods and programsthat applied the Case II correction for direct range restriction. Hence, wewould expect the original reported validity estimates to be lower than thoseobtained with the more accurate corrections for indirect range restriction.However, a direct comparison between the new analysis with correctionsfor indirect range restriction and the original published analyses basedon corrections assuming direct range restriction would not be optimallyinformative because other refinements and changes have been introducedin recent decades to increase the accuracy of the meta-analysis programs, inaddition to the introduction of the correction for indirect range restriction.These refinements have been shown via computer simulation studies (Law,Schmidt, & Hunter, 1994a, 1994b) to improve accuracy. Law et al. (1994a,1994b), Hunter and Schmidt (2004), and Schmidt, Law, Hunter, Rothstein,Pearlman, and McDaniel et al. (1993) describe these refinements in de-tail. The new program package (Schmidt & Le, 2004) also contains aprogram for the direct restriction case that, like the program for the indi-rect restriction case, includes these improvements. So, it is clear that themost informative comparison is that between the results produced by thisprogram for direct range restriction and the (current) program for indi-rect range restriction. By holding all other data analysis factors constant,this comparison isolates the effect on the results of assuming direct rangerestriction when in fact the range restriction is really indirect. So in ad-dition to re-analyzing each data set using the new program for Case IV
290 PERSONNEL PSYCHOLOGY
indirect range restriction, we also re-analyzed each data set using theupdated program that corrects for direct range restriction (Case II). Theresults of these two analyses form the basis for our comparisons.
Results and Discussion
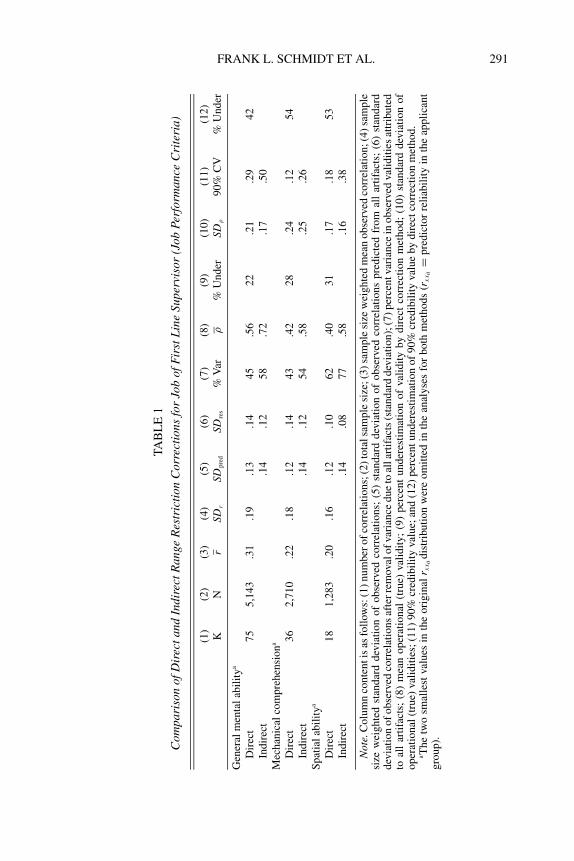
The results are presented in Tables 1 though 6 and average results arepresented as a summary in Table 7. In each table, Columns 1 through4 are data checks. These values are computed in the same way forboth corrections and so should always be the same for the direct and indi-rect corrections, as in fact they are. Column 5 shows the SD of the observedcorrelations predicted from artifacts alone (sampling error variance anddifferences between studies in range restriction, criterion reliability, andtest reliability). According to earlier derivations (Hunter et al., in press)and simulation studies (Le, 2003), these values are expected to be usu-ally (but not always) slightly larger when the range restriction correctionis indirect. (Here as elsewhere, exact outcomes depend on the idiosyn-crasies of particular data sets.) Column 6 shows the residual SD, which isthe square root of the variance remaining in the observed validities aftersubtraction of the variance due to artifacts. This value is expected to besomewhat smaller on average when the range correction is indirect, as aconsequence of the larger value in Column 5. Another consequence of thedifference in Column 5 is that the percent of variance in the observed va-lidities accounted for by artifacts (Column 7) is expected to be somewhatlarger for the indirect correction. We note here that these percentages andthose in Columns 9 and 12 were computed on the basis of the rounded (totwo decimal places) results shown in the tables. This is based on the factthat in actual applications, it is the rounded results that would be used.
The most important differences are shown in Columns 9 through 12.Column 8 presents the estimate of the mean operational (i.e., true) va-lidity. This is the mean observed validity corrected for range restrictionand measurement error in the criterion, but not for measurement error inthe predictor. As discussed above, these values are expected to be largerfor the indirect correction (Case IV). Column 9 shows the percentage bywhich the direct correction (Case II) underestimates the mean operationalvalidity. It is important to remember that these percentages may be onthe low side. The reader will recall that when the basic assumption of theindirect range correction is violated (as it may sometimes be), the indi-rect correction underestimates the validity (although not by as much asthe direct correction). When this occurs, it will result in an underestimateof the inaccuracy of the direct range restriction correction. Column 10shows the SD estimates for the operational validity distribution for thetwo methods (SDρ) . The simulation studies of Le (2003) found that these
FRANK L. SCHMIDT ET AL. 291
TA
BL
E1
Com
pari
son
ofD
irec
tand
Indi
rect
Ran
geR
estr
icti
onC
orre
ctio
nsfo
rJo
bof
Fir
stL
ine
Supe
rvis
or(J
obPe
rfor
man
ceC
rite
ria)
(1)
(2)
(3)
(4)
(5)
(6)
(7)
(8)
(9)
(10
)(1
1)
(12
)K
Nr
SDr
SDpre
dSD
res
%V
arρ
%U
nd
erSD
ρ9
0%
CV
%U
nd
er
Gen
eral
men
tal
abil
ity
a
Dir
ect
75
5,1
43
.31
.19
.13
.14
45
.56
22
.21
.29
42
Ind
irec
t.1
4.1
25
8.7
2.1
7.5
0M
ech
anic
alco
mp
reh
ensi
on
a
Dir
ect
36
2,7
10
.22
.18
.12
.14
43
.42
28
.24
.12
54
Ind
irec
t.1
4.1
25
4.5
8.2
5.2
6S
pat
ial
abil
ity
a
Dir
ect
18
1,2
83
.20
.16
.12
.10
62
.40
31
.17
.18
53
Ind
irec
t.1
4.0
87
7.5
8.1
6.3
8
Not
e.C
olu
mn
con
ten
tis
asfo
llow
s:(1
)n
um
ber
of
corr
elat
ion
s;(2
)to
talsa
mp
lesi
ze;(3
)sa
mp
lesi
zew
eig
hte
dm
ean
ob
serv
edco
rrel
atio
n;(4
)sa
mp
lesi
zew
eig
hte
dst
and
ard
dev
iati
on
of
ob
serv
edco
rrel
atio
ns;
(5)
stan
dar
dd
evia
tio
no
fo
bse
rved
corr
elat
ion
sp
red
icte
dfr
om
all
arti
fact
s;(6
)st
and
ard
dev
iati
on
of
ob
serv
edco
rrel
atio
ns
afte
rre
mova
lo
fva
rian
ced
ue
toal
lar
tifa
cts
(sta
nd
ard
dev
iati
on
);(7
)p
erce
ntva
rian
cein
ob
serv
edva
lid
itie
sat
trib
ute
dto
all
arti
fact
s;(8
)m
ean
op
erat
ion
al(t
rue)
vali
dit
y;
(9)
per
cen
tu
nd
eres
tim
atio
no
fva
lid
ity
by
dir
ect
corr
ecti
on
met
ho
d;
(10
)st
and
ard
dev
iati
on
of
op
erat
ion
al(t
rue)
vali
dit
ies;
(11
)9
0%
cred
ibil
ity
valu
e;an
d(1
2)
per
cen
tu
nd
eres
tim
atio
no
f9
0%
cred
ibil
ity
valu
eb
yd
irec
tco
rrec
tio
nm
eth
od
.aT
he
two
smal
lest
valu
esin
the
ori
gin
alr x
x ad
istr
ibu
tio
nw
ere
om
itte
din
the
anal
yse
sfo
rb
oth
met
ho
ds
(rx
x a=
pre
dic
tor
reli
abil
ity
inth
eap
pli
can
tg
rou
p).
292 PERSONNEL PSYCHOLOGY
values are typically but not always slightly lower for the indirect rangecorrection. Column 11 shows the 90% credibility values in the estimatedoperational validity distributions; these values are important because theyplay a critical role in determination of whether validity can be consid-ered generalizable or not. In general, if the 90% credibility value is abovesome preset value (sometimes zero, sometimes a positive value), it isconcluded that validity can be generalized. Column 12 presents the per-centage by which the direct correction underestimates the 90% credibilityvalues. As was the case with the Column 9 figures, and for the same rea-son, these percentages should be viewed as lower-bound estimates whenthey are interpreted as indicating the inaccuracy of the direct correctionmethod.
Table 1 presents the results for the job of first-line supervisor based onthe data from Schmidt, Hunter, Pearlman, and Shane (1979). In the case ofall three predictors, the percentage of variance accounted for by artifactsis larger for the indirect correction (Column 7), the estimated mean opera-tional validity is larger (Column 8), and the 90% credibility value is larger(Column 11). The percentage by which mean validity is underestimatedby the direct correction ranges from 22% to 31%. In all three cases, thedifferences are large enough to have a substantial effect on the practicalutility of a selection program (Brogden, 1949). The underestimation ofthe 90% credibility intervals by the direct method is even greater, rangingfrom 42% to 53%. In two of the three cases, the 90% credibility values aretwice as large with the indirect correction in comparison with the directcorrection. Clearly, these are major differences.
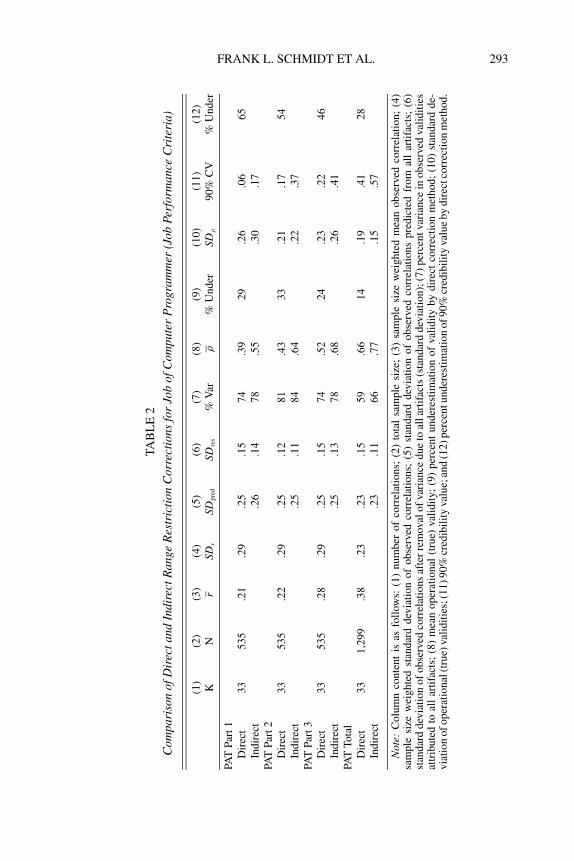
Table 2 shows the results for the subscales and total score for the PATdata from Schmidt et al. (1980). Criterion measures were ratings of overalljob performance. For this data set, the percentages of variance accountedfor by artifacts are less dissimilar across the methods, but the pattern ofunderestimation of mean validity by the direct correction method is repli-cated. Underestimation of mean validity by the direct correction methodranges from 14% to 33%, and these differences again are large enoughto have practical significance. Again, the direct method greatly underesti-mates the 90% credibility values, with the underestimation ranging from28% to 65%. With the exception of the PAT Total score, the 90% credibil-ity values are about twice as large for the indirect correction in comparisonto the direct correction method. Again, these differences are fairly large.One unexpected result in this data set is that, with the exception of the PATTotal score, the SDρ values are larger for the indirect method. This resultpoints up the fact that the relative pattern of outcomes for the two rangecorrection methods is not the same for all data sets.
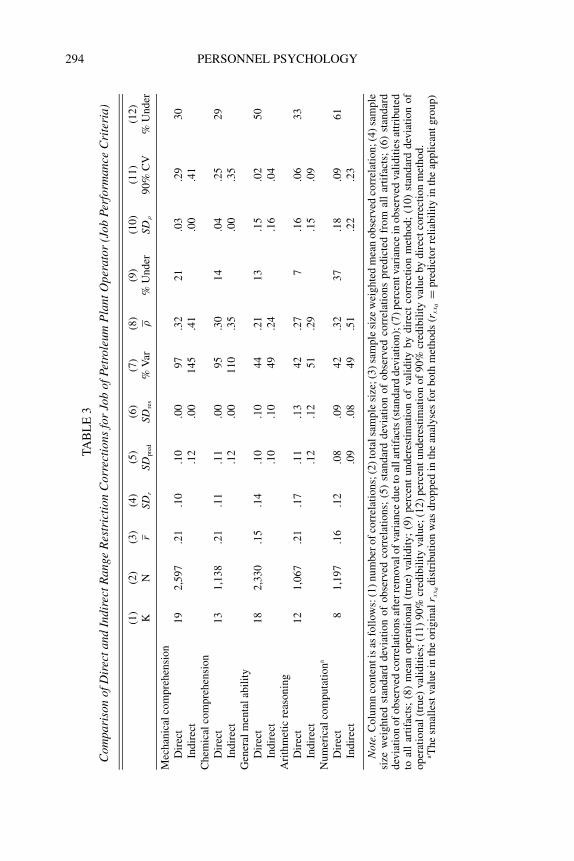
Table 3 shows the results for the job of petroleum plant operator for fivetests against the criterion of ratings of job performance. The same general
FRANK L. SCHMIDT ET AL. 293
TA
BL
E2
Com
pari
son
ofD
irec
tand
Indi
rect
Ran
geR
estr
icti
onC
orre
ctio
nsfo
rJo
bof
Com
pute
rP
rogr
amm
er(J
obPe
rfor
man
ceC
rite
ria)
(1)
(2)
(3)
(4)
(5)
(6)
(7)
(8)
(9)
(10
)(1
1)
(12
)K
Nr
SDr
SDpre
dSD
res
%V
arρ
%U
nd
erSD
ρ9
0%
CV
%U
nd
er
PAT
Par
t1
Dir
ect
33
53
5.2
1.2
9.2
5.1
57
4.3
92
9.2
6.0
66
5In
dir
ect
.26
.14
78
.55
.30
.17
PAT
Par
t2
Dir
ect
33
53
5.2
2.2
9.2
5.1
28
1.4
33
3.2
1.1
75
4In
dir
ect
.25
.11
84
.64
.22
.37
PAT
Par
t3
Dir
ect
33
53
5.2
8.2
9.2
5.1
57
4.5
22
4.2
3.2
24
6In
dir
ect
.25
.13
78
.68
.26
.41
PAT
To
tal
Dir
ect
33
1,2
99
.38
.23
.23
.15
59
.66
14
.19
.41
28
Ind
irec
t.2
3.1
16
6.7
7.1
5.5
7
Not
e:C
olu
mn
con
ten
tis
asfo
llow
s:(1
)n
um
ber
of
corr
elat
ion
s;(2
)to
tal
sam
ple
size
;(3
)sa
mp
lesi
zew
eig
hte
dm
ean
ob
serv
edco
rrel
atio
n;
(4)
sam
ple
size
wei
gh
ted
stan
dar
dd
evia
tio
no
fo
bse
rved
corr
elat
ion
s;(5
)st
and
ard
dev
iati
on
of
ob
serv
edco
rrel
atio
ns
pre
dic
ted
fro
mal
lar
tifa
cts;
(6)
stan
dar
dd
evia
tio
no
fo
bse
rved
corr
elat
ion
saf
ter
rem
ova
lo
fva
rian
ced
ue
toal
lar
tifa
cts
(sta
nd
ard
dev
iati
on
);(7
)p
erce
nt
vari
ance
ino
bse
rved
vali
dit
ies
attr
ibu
ted
toal
lar
tifa
cts;
(8)
mea
no
per
atio
nal
(tru
e)va
lid
ity
;(9
)p
erce
nt
un
der
esti
mat
ion
of
vali
dit
yb
yd
irec
tco
rrec
tio
nm
eth
od
;(1
0)
stan
dar
dd
e-v
iati
on
of
op
erat
ion
al(t
rue)
vali
dit
ies;
(11
)9
0%
cred
ibil
ity
valu
e;an
d(1
2)
per
cen
tun
der
esti
mat
ion
of
90
%cr
edib
ilit
yva
lue
by
dir
ectc
orr
ecti
on
met
ho
d.
294 PERSONNEL PSYCHOLOGY
TA
BL
E3
Com
pari
son
ofD
irec
tand
Indi
rect
Ran
geR
estr
icti
onC
orre
ctio
nsfo
rJo
bof
Petr
oleu
mP
lant
Ope
rato
r(J
obPe
rfor
man
ceC
rite
ria)
(1)
(2)
(3)
(4)
(5)
(6)
(7)
(8)
(9)
(10
)(1
1)
(12
)K
Nr
SDr
SDpre
dSD
res
%V
arρ
%U
nd
erSD
ρ9
0%
CV
%U
nd
er
Mec
han
ical
com
pre
hen
sio
nD
irec
t1
92
,59
7.2
1.1
0.1
0.0
09
7.3
22
1.0
3.2
93
0In
dir
ect
.12
.00
14
5.4
1.0
0.4
1C
hem
ical
com
pre
hen
sio
nD
irec
t1
31
,13
8.2
1.1
1.1
1.0
09
5.3
01
4.0
4.2
52
9In
dir
ect
.12
.00
11
0.3
5.0
0.3
5G
ener
alm
enta
lab
ilit
yD
irec
t1
82
,33
0.1
5.1
4.1
0.1
04
4.2
11
3.1
5.0
25
0In
dir
ect
.10
.10
49
.24
.16
.04
Ari
thm
etic
reas
on
ing
Dir
ect
12
1,0
67
.21
.17
.11
.13
42
.27
7.1
6.0
63
3In
dir
ect
.12
.12
51
.29
.15
.09
Nu
mer
ical
com
pu
tati
on
a
Dir
ect
81
,19
7.1
6.1
2.0
8.0
94
2.3
23
7.1
8.0
96
1In
dir
ect
.09
.08
49
.51
.22
.23
Not
e.C
olu
mn
con
ten
tis
asfo
llow
s:(1
)n
um
ber
of
corr
elat
ion
s;(2
)to
talsa
mp
lesi
ze;(3
)sa
mp
lesi
zew
eig
hte
dm
ean
ob
serv
edco
rrel
atio
n;(4
)sa
mp
lesi
zew
eig
hte
dst
and
ard
dev
iati
on
of
ob
serv
edco
rrel
atio
ns;
(5)
stan
dar
dd
evia
tio
no
fo
bse
rved
corr
elat
ion
sp
red
icte
dfr
om
all
arti
fact
s;(6
)st
and
ard
dev
iati
on
of
ob
serv
edco
rrel
atio
ns
afte
rre
mova
lo
fva
rian
ced
ue
toal
lar
tifa
cts
(sta
nd
ard
dev
iati
on
);(7
)p
erce
ntva
rian
cein
ob
serv
edva
lid
itie
sat
trib
ute
dto
all
arti
fact
s;(8
)m
ean
op
erat
ion
al(t
rue)
vali
dit
y;
(9)
per
cen
tu
nd
eres
tim
atio
no
fva
lid
ity
by
dir
ect
corr
ecti
on
met
ho
d;
(10
)st
and
ard
dev
iati
on
of
op
erat
ion
al(t
rue)
vali
dit
ies;
(11
)9
0%
cred
ibil
ity
valu
e;(1
2)
per
cen
tu
nd
eres
tim
atio
no
f9
0%
cred
ibil
ity
valu
eb
yd
irec
tco
rrec
tio
nm
eth
od
.aT
he
smal
lest
valu
ein
the
ori
gin
alr x
x ad
istr
ibu
tio
nw
asd
rop
ped
inth
ean
aly
ses
for
bo
thm
eth
od
s(r
xx a
=p
red
icto
rre
liab
ilit
yin
the
app
lica
nt
gro
up
)
FRANK L. SCHMIDT ET AL. 295
pattern of underestimation of validity by the direct correction method isseen in this data set, but the differences in mean operational validity esti-mates (Column 8) are smaller for three of the five tests (Chemical Compre-hension, GMA, and Arithmetic Reasoning). The underestimation by thedirect correction method is substantial for the remaining two tests (21%and 37% underestimation for Mechanical Comprehension and NumericalComputation, respectively). The underestimation of the 90% credibilityvalues by the direct correction method ranges from 29% to 61% (Col-umn 12). These differences are again large enough to have practical im-plication. In this data set when the range correction is indirect, SDρ valuesare smaller for three of the five tests but are larger for the other two (GMAand Numerical Computation).
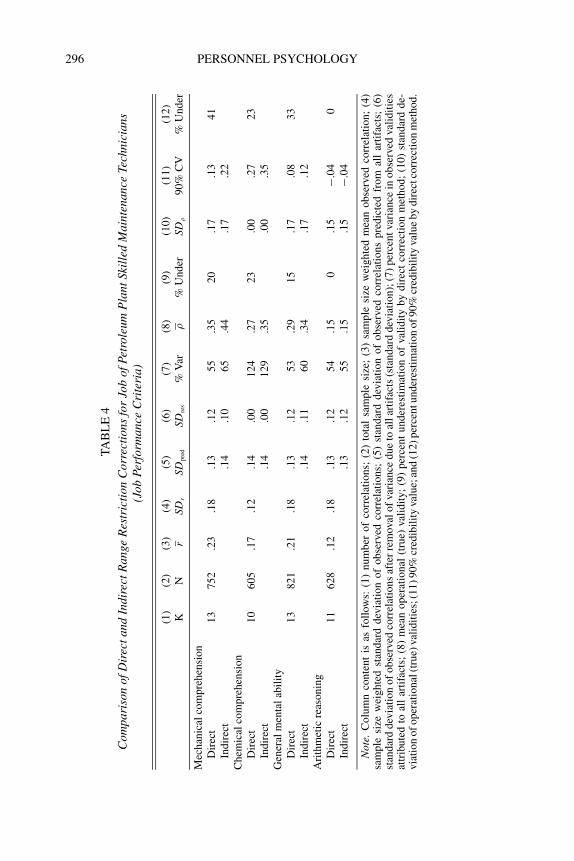
In Table 4, the results for skilled maintenance personnel in petroleumplants against the criterion of supervisor ratings of overall job performanceare presented. With one exception, the pattern is similar to that in Table 3.The exception is that for the Arithmetic Reasoning test, the direct correc-tion method did not underestimate validity (after rounding to two places;Column 8). [This was an unusual data set in that it included an observedvalidity of −.45. This extreme value was probably due to a data error ofsome sort, but Schmidt et al. (1981a, 1981b) were not able to confirm this.Hence, it was not excluded.] For the tests other than Arithmetic Reason-ing, the underestimation ranges from 15% to 23%. In the case of the 90%credibility value, underestimation ranges from 23% to 41%. Once again,the differences are not trivial.
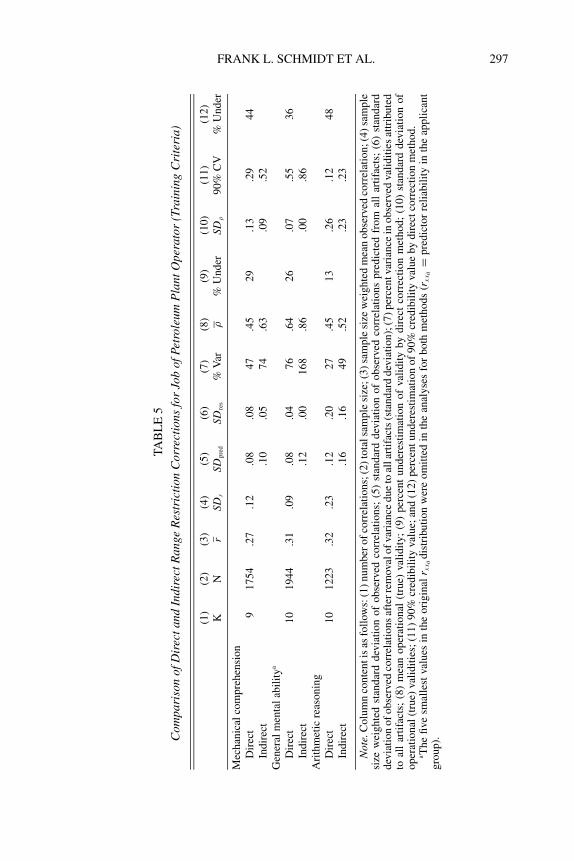
Table 5 is based on training performance criteria for petroleum plantoperators (data set from Schmidt et al., 1981a, 1981b). As is usually thecase, validities for cognitive tests are larger for general training criteriathan for ratings of job performance (Compare Tables 3 and 5). However,the general pattern of underestimation of validity by the direct correctionmethod is again replicated, with underestimation ranging from 13% to29%. For the 90% credibility values, underestimation ranged from 36%to 48%. Again, both the mean validity differences and the 90% credibilityvalue differences are more than large enough to have important practicalimplications in selection programs.
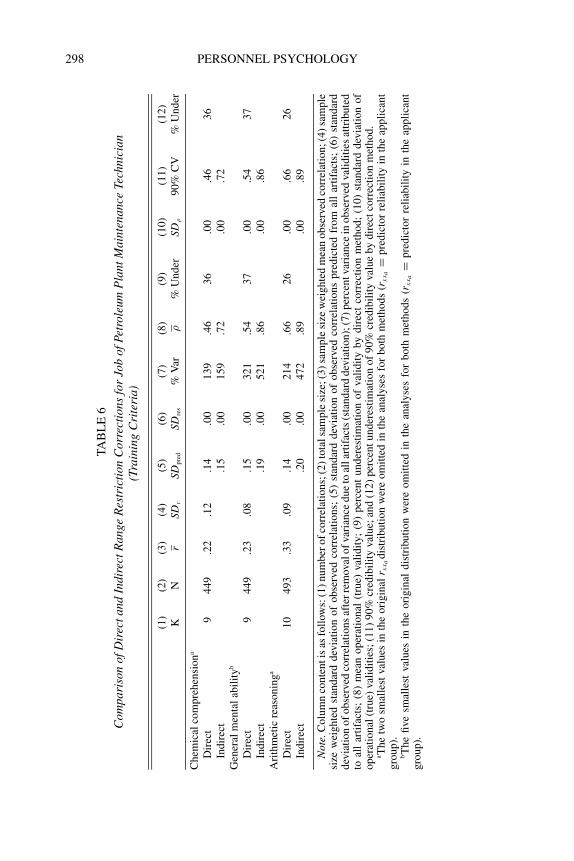
Results for training criteria for petroleum plant maintenance personnelare shown in Table 6. These data show the same pattern of underestimationof validity by the direct correction method, with underestimation rangingfrom 26% to 37%. However, both methods estimated all the SDρ values atzero, and hence, the 90% credibility values are the same as the means forboth methods. This data set appears to be a case of second-order samplingerror (Hunter & Schmidt, 2004, Ch. 9). The number of studies is small(9 or 10) and by chance (i.e., second-order sampling error) the SD of theobserved validities is smaller (see Column 4) than it would be on average.
296 PERSONNEL PSYCHOLOGY
TA
BL
E4
Com
pari
son
ofD
irec
tand
Indi
rect
Ran
geR
estr
icti
onC
orre
ctio
nsfo
rJo
bof
Petr
oleu
mP
lant
Skil
led
Mai
nten
ance
Tech
nici
ans
(Job
Perf
orm
ance
Cri
teri
a)
(1)
(2)
(3)
(4)
(5)
(6)
(7)
(8)
(9)
(10
)(1
1)
(12
)K
Nr
SDr
SDpre
dSD
res
%V
arρ
%U
nd
erSD
ρ9
0%
CV
%U
nd
er
Mec
han
ical
com
pre
hen
sio
nD
irec
t1
37
52
.23
.18
.13
.12
55
.35
20
.17
.13
41
Ind
irec
t.1
4.1
06
5.4
4.1
7.2
2C
hem
ical
com
pre
hen
sio
nD
irec
t1
06
05
.17
.12
.14
.00
12
4.2
72
3.0
0.2
72
3In
dir
ect
.14
.00
12
9.3
5.0
0.3
5G
ener
alm
enta
lab
ilit
yD
irec
t1
38
21
.21
.18
.13
.12
53
.29
15
.17
.08
33
Ind
irec
t.1
4.1
16
0.3
4.1
7.1
2A
rith
met
icre
aso
nin
gD
irec
t1
16
28
.12
.18
.13
.12
54
.15
0.1
5−.
04
0In
dir
ect
.13
.12
55
.15
.15
−.0
4
Not
e.C
olu
mn
con
ten
tis
asfo
llow
s:(1
)n
um
ber
of
corr
elat
ion
s;(2
)to
tal
sam
ple
size
;(3
)sa
mp
lesi
zew
eig
hte
dm
ean
ob
serv
edco
rrel
atio
n;
(4)
sam
ple
size
wei
gh
ted
stan
dar
dd
evia
tio
no
fo
bse
rved
corr
elat
ion
s;(5
)st
and
ard
dev
iati
on
of
ob
serv
edco
rrel
atio
ns
pre
dic
ted
fro
mal
lar
tifa
cts;
(6)
stan
dar
dd
evia
tio
no
fo
bse
rved
corr
elat
ion
saf
ter
rem
ova
lo
fva
rian
ced
ue
toal
lar
tifa
cts
(sta
nd
ard
dev
iati
on
);(7
)p
erce
nt
vari
ance
ino
bse
rved
vali
dit
ies
attr
ibu
ted
toal
lar
tifa
cts;
(8)
mea
no
per
atio
nal
(tru
e)va
lid
ity
;(9
)p
erce
nt
un
der
esti
mat
ion
of
vali
dit
yb
yd
irec
tco
rrec
tio
nm
eth
od
;(1
0)
stan
dar
dd
e-v
iati
on
of
op
erat
ion
al(t
rue)
vali
dit
ies;
(11
)9
0%
cred
ibil
ity
valu
e;an
d(1
2)
per
cen
tun
der
esti
mat
ion
of
90
%cr
edib
ilit
yva
lue
by
dir
ectc
orr
ecti
on
met
ho
d.
FRANK L. SCHMIDT ET AL. 297
TA
BL
E5
Com
pari
son
ofD
irec
tand
Indi
rect
Ran
geR
estr
icti
onC
orre
ctio
nsfo
rJo
bof
Petr
oleu
mP
lant
Ope
rato
r(T
rain
ing
Cri
teri
a)
(1)
(2)
(3)
(4)
(5)
(6)
(7)
(8)
(9)
(10
)(1
1)
(12
)K
Nr
SDr
SDpre
dSD
res
%V
arρ
%U
nd
erSD
ρ9
0%
CV
%U
nd
er
Mec
han
ical
com
pre
hen
sio
nD
irec
t9
17
54
.27
.12
.08
.08
47
.45
29
.13
.29
44
Ind
irec
t.1
0.0
57
4.6
3.0
9.5
2G
ener
alm
enta
lab
ilit
ya
Dir
ect
10
19
44
.31
.09
.08
.04
76
.64
26
.07
.55
36
Ind
irec
t.1
2.0
01
68
.86
.00
.86
Ari
thm
etic
reas
on
ing
Dir
ect
10
12
23
.32
.23
.12
.20
27
.45
13
.26
.12
48
Ind
irec
t.1
6.1
64
9.5
2.2
3.2
3
Not
e.C
olu
mn
con
ten
tis
asfo
llow
s:(1
)n
um
ber
of
corr
elat
ion
s;(2
)to
talsa
mp
lesi
ze;(3
)sa
mp
lesi
zew
eig
hte
dm
ean
ob
serv
edco
rrel
atio
n;(4
)sa
mp
lesi
zew
eig
hte
dst
and
ard
dev
iati
on
of
ob
serv
edco
rrel
atio
ns;
(5)
stan
dar
dd
evia
tio
no
fo
bse
rved
corr
elat
ion
sp
red
icte
dfr
om
all
arti
fact
s;(6
)st
and
ard
dev
iati
on
of
ob
serv
edco
rrel
atio
ns
afte
rre
mova
lo
fva
rian
ced
ue
toal
lar
tifa
cts
(sta
nd
ard
dev
iati
on
);(7
)p
erce
ntva
rian
cein
ob
serv
edva
lid
itie
sat
trib
ute
dto
all
arti
fact
s;(8
)m
ean
op
erat
ion
al(t
rue)
vali
dit
y;
(9)
per
cen
tu
nd
eres
tim
atio
no
fva
lid
ity
by
dir
ect
corr
ecti
on
met
ho
d;
(10
)st
and
ard
dev
iati
on
of
op
erat
ion
al(t
rue)
vali
dit
ies;
(11
)9
0%
cred
ibil
ity
valu
e;an
d(1
2)
per
cen
tu
nd
eres
tim
atio
no
f9
0%
cred
ibil
ity
valu
eb
yd
irec
tco
rrec
tio
nm
eth
od
.aT
he
five
smal
lest
valu
esin
the
ori
gin
alr x
x ad
istr
ibu
tio
nw
ere
om
itte
din
the
anal
yse
sfo
rb
oth
met
ho
ds
(rx
x a=
pre
dic
tor
reli
abil
ity
inth
eap
pli
can
tg
rou
p).
298 PERSONNEL PSYCHOLOGY
TA
BL
E6
Com
pari
son
ofD
irec
tand
Indi
rect
Ran
geR
estr
icti
onC
orre
ctio
nsfo
rJo
bof
Petr
oleu
mP
lant
Mai
nten
ance
Tech
nici
an(T
rain
ing
Cri
teri
a)
(1)
(2)
(3)
(4)
(5)
(6)
(7)
(8)
(9)
(10
)(1
1)
(12
)K
Nr
SDr
SDpre
dSD
res
%V
arρ
%U
nd
erSD
ρ9
0%
CV
%U
nd
er
Ch
emic
alco
mp
reh
ensi
on
a
Dir
ect
94
49
.22
.12
.14
.00
13
9.4
63
6.0
0.4
63
6In
dir
ect
.15
.00
15
9.7
2.0
0.7
2G
ener
alm
enta
lab
ilit
yb
Dir
ect
94
49
.23
.08
.15
.00
32
1.5
43
7.0
0.5
43
7In
dir
ect
.19
.00
52
1.8
6.0
0.8
6A
rith
met
icre
aso
nin
ga
Dir
ect
10
49
3.3
3.0
9.1
4.0
02
14
.66
26
.00
.66
26
Ind
irec
t.2
0.0
04
72
.89
.00
.89
Not
e.C
olu
mn
con
ten
tis
asfo
llow
s:(1
)n
um
ber
of
corr
elat
ion
s;(2
)to
talsa
mp
lesi
ze;(3
)sa
mp
lesi
zew
eig
hte
dm
ean
ob
serv
edco
rrel
atio
n;(4
)sa
mp
lesi
zew
eig
hte
dst
and
ard
dev
iati
on
of
ob
serv
edco
rrel
atio
ns;
(5)
stan
dar
dd
evia
tio
no
fo
bse
rved
corr
elat
ion
sp
red
icte
dfr
om
all
arti
fact
s;(6
)st
and
ard
dev
iati
on
of
ob
serv
edco
rrel
atio
ns
afte
rre
mova
lo
fva
rian
ced
ue
toal
lar
tifa
cts
(sta
nd
ard
dev
iati
on
);(7
)p
erce
ntva
rian
cein
ob
serv
edva
lid
itie
sat
trib
ute
dto
all
arti
fact
s;(8
)m
ean
op
erat
ion
al(t
rue)
vali
dit
y;
(9)
per
cen
tu
nd
eres
tim
atio
no
fva
lid
ity
by
dir
ect
corr
ecti
on
met
ho
d;
(10
)st
and
ard
dev
iati
on
of
op
erat
ion
al(t
rue)
vali
dit
ies;
(11
)9
0%
cred
ibil
ity
valu
e;an
d(1
2)
per
cen
tu
nd
eres
tim
atio
no
f9
0%
cred
ibil
ity
valu
eb
yd
irec
tco
rrec
tio
nm
eth
od
.aT
he
two
smal
lest
valu
esin
the
ori
gin
alr x
x ad
istr
ibu
tio
nw
ere
om
itte
din
the
anal
yse
sfo
rb
oth
met
ho
ds
(rx
x a=
pre
dic
tor
reli
abil
ity
inth
eap
pli
can
tg
rou
p).
bT
he
five
smal
lest
valu
esin
the
ori
gin
ald
istr
ibu
tio
nw
ere
om
itte
din
the
anal
yse
sfo
rb
oth
met
ho
ds
(rx
x a=
pre
dic
tor
reli
abil
ity
inth
eap
pli
can
tg
rou
p).
FRANK L. SCHMIDT ET AL. 299
(The sampling error variance formula in meta-analysis procedures assumesthe expected (or average) amount of sampling error.) Table 6 shows thesame pattern of underestimation of validity by the direct correction methodwe have seen in the previous tables. Because operational validities areestimated to have no variability, the 90% credibility values are the sameas the mean operational validities.
At the request of a reviewer, we insert here a note on the ux values usedin our analyses. As noted earlier, to hold this factor constant across time andmethods, we used the same values used in the original studies, and thesevalues of ux were used in both the direct and indirect range restrictioncorrections. In the analyses in Tables 3 through 6, the ux values weredetermined empirically from the studies in the meta-analyses. In Tables 1and 2, the mean ux value was .60, based on a general (nonquantitative)review of the literature by Schmidt and Hunter in the late 1970s (e.g., seeHunter & Schmidt, 2004, p. 171). A reviewer pointed out that quantitativereviews of the literature that appeared some years after these original meta-analyses were published found slightly lower mean ux values. Hunter andHunter (1984) found a mean value of .67 and Alexander, Carson, Alliger,and Cronshaw (1989) found a mean value of .72, for an average of .69.This reviewer pointed out that use of .69 instead of .60 would lead tosomewhat smaller corrected validities in Tables 1 and 2. However, it isnot clear that use of the .69 value would produce more accurate resultsbecause many of the empirically determined mean ux values used in theother tables were less than .60. For example, the mean ux values for thethree analyses in Table 5 were .68, .51, and .82. For the analyses in Table6, these values are .54, .46, and .52. In any event, the difference between.60 and .69 is not large, and comparability with the original meta-analyseswould be compromised if the .69 value were used in our analyses.
As seen in Tables 1 through 6, the exact relationship between the resultsproduced by the direct and indirect corrections varies somewhat acrossdata sets. This occurs because the exact nature of the output depends incomplex ways on the idiosyncrasies of each data set. However, the overallpicture is fairly clear: The indirect (Case IV) correction procedure indi-cates generally higher levels of mean validity and larger 90% credibilityvalues.
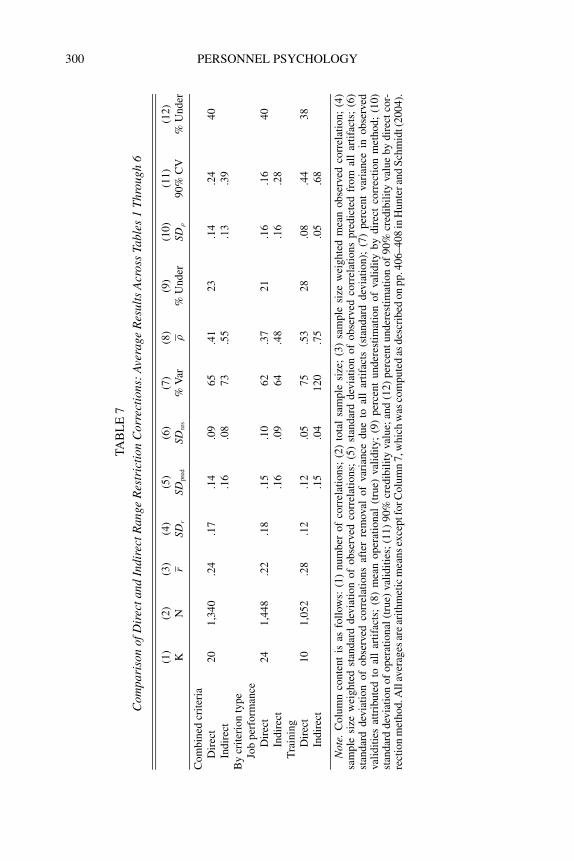
Table 7 summarizes this overall trend by averaging across the cells inTables 1 through 6. All averages are arithmetic means except for Column 7,which is the harmonic mean, computed as described in Hunter and Schmidt(2004, pp. 406–408). Across all data sets, the average SD predicted fromartifacts alone is .14 for the direct correction versus .16 for the indirectcorrection (Column 5). The average residual SDs (Column 6) are .09 forthe direct and .08 for the indirect correction. The mean percentage varianceaccounted for by artifacts is 65% for the direct and 73% for the indirect
300 PERSONNEL PSYCHOLOGY
TA
BL
E7
Com
pari
son
ofD
irec
tand
Indi
rect
Ran
geR
estr
icti
onC
orre
ctio
ns:
Ave
rage
Res
ults
Acr
oss
Tabl
es1
Thr
ough
6
(1)
(2)
(3)
(4)
(5)
(6)
(7)
(8)
(9)
(10
)(1
1)
(12
)K
Nr
SDr
SDpre
dSD
res
%V
arρ
%U
nd
erSD
ρ9
0%
CV
%U
nd
er
Co
mb
ined
crit
eria
Dir
ect
20
1,3
40
.24
.17
.14
.09
65
.41
23
.14
.24
40
Ind
irec
t.1
6.0
87
3.5
5.1
3.3
9B
ycr
iter
ion
typ
eJo
bp
erfo
rman
ceD
irec
t2
41
,44
8.2
2.1
8.1
5.1
06
2.3
72
1.1
6.1
64
0In
dir
ect
.16
.09
64
.48
.16
.28
Tra
inin
gD
irec
t1
01
,05
2.2
8.1
2.1
2.0
57
5.5
32
8.0
8.4
43
8In
dir
ect
.15
.04
12
0.7
5.0
5.6
8
Not
e.C
olu
mn
con
ten
tis
asfo
llow
s:(1
)n
um
ber
of
corr
elat
ion
s;(2
)to
tal
sam
ple
size
;(3
)sa
mp
lesi
zew
eig
hte
dm
ean
ob
serv
edco
rrel
atio
n;
(4)
sam
ple
size
wei
gh
ted
stan
dar
dd
evia
tio
no
fo
bse
rved
corr
elat
ion
s;(5
)st
and
ard
dev
iati
on
of
ob
serv
edco
rrel
atio
ns
pre
dic
ted
fro
mal
lar
tifa
cts;
(6)
stan
dar
dd
evia
tio
no
fo
bse
rved
corr
elat
ion
saf
ter
rem
ova
lo
fva
rian
ced
ue
toal
lar
tifa
cts
(sta
nd
ard
dev
iati
on
);(7
)p
erce
nt
vari
ance
ino
bse
rved
vali
dit
ies
attr
ibu
ted
toal
lar
tifa
cts;
(8)
mea
no
per
atio
nal
(tru
e)va
lid
ity
;(9
)p
erce
nt
un
der
esti
mat
ion
of
vali
dit
yb
yd
irec
tco
rrec
tio
nm
eth
od
;(1
0)
stan
dar
dd
evia
tio
no
fo
per
atio
nal
(tru
e)va
lid
itie
s;(1
1)
90
%cr
edib
ilit
yva
lue;
and
(12
)p
erce
nt
un
der
esti
mat
ion
of
90
%cr
edib
ilit
yva
lue
by
dir
ect
cor-
rect
ion
met
ho
d.A
llav
erag
esar
ear
ith
met
icm
ean
sex
cep
tfo
rC
olu
mn
7,w
hic
hw
asco
mp
ute
das
des
crib
edo
np
p.4
06
–4
08
inH
un
ter
and
Sch
mid
t(2
00
4).
FRANK L. SCHMIDT ET AL. 301
correction. More important, the average estimated mean validity (Column8) is .41 for the direct method versus .55 for the indirect method, meaningthat the direct method underestimates validity on average by (at least)23%.
Alternatively, the Case IV validity estimates are on average 34% largerthan the Case II estimates. The difference between mean validity estimates(.14) is large enough to have practical implications in selection programs.As shown in Schmidt, Hunter, McKenzie, and Muldrow (1979), validityis directly (linearly) related to selection utility (holding selection ratioconstant). This means that a 34% increase in validity (holding other vari-ables constant) translates into a 34% increase in utility. For example, ifthe increase in output or production of the average employer hired dueto use of the selection method (Hunter, Schmidt, & Judiesch, 1990) hadbeen estimated (under the assumption of direct range restriction) at, say,15%, the actual increase would in fact be 34% larger than this, or 20%.Likewise, if the dollar value of increased performance due to selection hadbeen estimated at $500,000, the actual value would $670,000.
Returning to Table 7, we can see that the average estimated 90% cred-ibility value is much larger for the indirect correction than the directcorrection: .39 versus .24. On average across these data sets, the directcorrection underestimates the 90% credibility value by 40%. Alterna-tively, the Case IV 90% credibility estimates are on average 63% largerthan the Case II estimates. Finally, the really striking finding is that theaverage 90% credibility value from the indirect correction (.39) is al-most as large as the average estimate of mean validity from the directcorrection method (.41). Assuming a normal distribution of operationalvalidity, this means that, at least for these data sets, the mean of valid-ity estimates from the direct correction method is at the 14th percentilefor the validity estimates from the indirect correction method. That is,the mean validity estimate produced by the correction for direct rangerestriction is too small by 1.08 SDs. These figures cast the results in starkcontrast.
The second half of Table 7 shows the averaged results separately forjob performance and training criteria. The overall pattern of results isvery similar for the two criterion types. The Case II correction methodunderestimates validity by 21% for job performance criteria and by 28%for training criteria. The Case II correction method underestimates 90%credibility value by 40% for job performance criteria and by 38% fortraining criteria. Two findings stand out in these averages. First, for jobperformance criteria the mean estimate of SDρ is the same for the Case IIand Case IV correction methods. Second, in the case of training criteria,the average 90% credibility value for the Case IV estimates (.68) is largerthan the mean of the validity estimates for the Case II estimates (.53).
302 PERSONNEL PSYCHOLOGY
It may not be possible to re-analyze all meta-analyses in the litera-ture using the Case IV method of correction for range restriction. Thisraises the question of how we should take into account the underestima-tion of validities and other correlations in these studies. An extremelyconservative possibility would be to simply take the published resultsas lower-bound estimates. Another possibility would be to use the sum-mary figures presented in Table 7 to produce approximate adjustmentsfrom the older published results. For example, for job performance criteriaTable 7 indicates that mean validity is typically underestimated by 21%and the 90% credibility interval is typically underestimated by 40%. Henceone would multiply the mean validity estimate by 1.27 [i.e., 1/(1−.21) =1.27] and the 90% credibility interval by 1.67 [i.e., 1/(1−.40) = 1.67] toproduce approximately correct estimates of the real values for these twocritical parameters. This approach would clearly be more accurate thanthe extremely conservative approach of simply using the older publishedresults while noting that they should be viewed as lower-bound values.On the other hand, it is possible that many published meta-analyses canbe re-analyzed but that journals will be reluctant to allocate scarce journalpages to these corrections to earlier meta-analyses. It is possible that anarchive or depository could be set up to accept these re-analyses and tomake them available to researchers and practitioners. It seems likely thatsome combination of these two solutions will become the reality.
Summary and Conclusion
Until recently, the range restriction correction formula used in themeta-analysis methods of Hunter and Schmidt (1977, 1990), Callenderand Osburn (1980), and Raju and Burke (1983) has been Thorndike’s(1949) Case II formula [Equation (2) in this paper]. This formula as-sumes direct range restriction (truncation) on the predictor. It has longbeen known that if range restriction is indirect rather than direct, this for-mula will undercorrect (e.g., see Linn et al., 1981; Schmidt, Hunter, &Pearlman, 1981; Schmidt et al., 1985, p. 751; Schmidt et al., 1993, p. 7). Ithas also long been known that most, if not all, range restriction in real datais indirect and that direct range restriction is quite rare (Thorndike, 1949).Until recently, no method was available that could be used to correct forthe most common case of indirect range restriction, called Case IV in thispaper. Hence, the Thorndike (1949) Case II correction formula was usedby default. Although it was known that this formula undercorrected, it wasapparently assumed that the undercorrection was modest (e.g., 2%–5%).As shown in this study based on multiple data sets, it is not. In the datasets examined in this study, application of the Case II correction resultedon average in underestimation of mean validity by 23%, with the 95%
FRANK L. SCHMIDT ET AL. 303
credibility intervals being underestimated by 40%. The absolute amountby which the Case IV validity estimates exceeded the Case II estimates wastypically large enough to have important practical implications (Brogden,1949). The immediate implication is that published validity generaliza-tion studies have probably typically underestimated validity substantially.One striking finding (shown in Table 7) is that the mean validity estimateproduced by the Case II correction is only at the 14th percentile in thedistribution of validities produced by the Case IV correction.
The broader implication extends beyond the level of validity of se-lection procedures to the research literature in general. In particular, thesize of effects and the strength of relationships are likely to have been sub-stantially underestimated in any research literature where range restrictioncorrections are necessary. This includes a potentially large number of sub-stantive research areas in I-O psychology and other fields.
A key question that might be raised is whether we can be certain thatthese conclusions are correct. This is the question of the accuracy of theCase IV correction for indirect range restriction. Both the mathematicalderivations of Hunter and Schmidt (2004, Ch. 5) and Hunter et al. (in press)and the simulation studies of Le (2003) and Le and Schmidt (2005) indicatethat the Case IV procedure for correcting for indirect range restrictiondescribed in this paper is accurate and, more important, more accuratethan use of the Case II direct procedure. Hence, accuracy does not appearto be a problem.
Finally, the authors predict that it will require some time for the fullimplications of this research to become apparent in research in I-O psy-chology and other areas. Although it is difficult to foresee at present, it ispossible that the finding that many relationships between constructs arestronger and many effect sizes are larger than previously believed willlead to the development of new theories or to substantial modifications ofexisting theories.
REFERENCES
Alexander RA, Carson KP, Alliger GM, Cronshaw SF. (1989). Empirical distributions ofrange restricted SDx in validity studies. Journal of Applied Psychology, 74, 253–258.
Brogden HE. (1949). When testing pays off. PERSONNEL PSYCHOLOGY, 2, 171–183.Callender JC, Osburn HG. (1980). Development and test of a new model for validity gen-
eralization. Journal of Applied Psychology, 65, 543–558.Cohen J, Cohen P. (1983). Applied multiple regression/correlation analysis for the behav-
ioral sciences. Hillsdale, NJ: Erlbaum.Hunter JE, Hunter RF. (1984). Validity and utility of alternative predictors of job perfor-
mance. Psychological Bulletin, 96(1), 72–98.Hunter JE, Schmidt FL. (1977). A critical analysis of the statistical and ethical implications
of various definitions of test fairness. Psychological Bulletin, 83, 1053–1071.
304 PERSONNEL PSYCHOLOGY
Hunter JE, Schmidt FL. (1990). Methods of meta-analysis: Correcting error and bias inresearch findings. Beverly Hills, CA: Sage.
Hunter JE, Schmidt FL. (2004). Methods of meta-analysis: Correcting error and bias inresearch findings (2nd ed.). Thousand Oaks, CA: Sage.
Hunter JE, Schmidt FL, Judiesch MK. (1990). Individual differences in output variabilityas a function of job complexity. Journal of Applied Psychology, 75, 28–42.
Hunter JE, Schmidt FL, Le H. (in press). Implications of direct and indirect range restrictionfor meta-analysis methods and findings. Journal of Applied Psychology.
Johnson JT, Ree MJ. (1994). RANGEJ: A pascal program to compute the multivariatecorrection for range restriction. Educational and Psychological Measurement, 54,693–695.
Law KS, Schmidt FL, Hunter JE. (1994a). Nonlinearity of range corrections in meta-analysis: A test of an improved procedure. Journal of Applied Psychology, 79, 425–438.
Law KS, Schmidt FL, Hunter JE. (1994b). A test of two refinements in meta-analysisprocedures. Journal of Applied Psychology, 79, 978–986.
Lawley DN. (1943). A note on Karl Pearson’s selection formulae. Proceedings of the RoyalSociety of Edinburgh, Section A, 62, Part 1, 28–30.
Le H. (2003). Correcting for indirect range restriction in meta-analysis: Testing a newmeta-analysis method. Unpublished doctoral dissertation, University of Iowa, IowaCity.
Le H, Schmidt FL. (2005). Correcting for indirect range restriction in meta-analysis: Testinga new meta-analytic procedure. Manuscript submitted for publication.
Linn RL, Harnish DL, Dunbar SB. (1981). Corrections for range restriction: An empiricalinvestigation of conditions resulting in conservative corrections. Journal of AppliedPsychology, 66, 655–663.
McNamara WJ, Hughes JL. (1961). A review of research on the selection of computer-programmers. PERSONNEL PSYCHOLOGY, 14, 39–51.
Pearson K. (1903). Mathematical contributions to the theory of evolution: Part XI. On theinfluence of natural selection on the variability and correlation of organs. RoyalSociety Philosophical Transactions, Series A, 200, 1–66.
Raju NS, Brand, PA. (2003). Determinig the significance of correlations corrected forunreliability and range restriction. Applied Psychological Measurement, 27, 52–71.
Raju NS, Burke MJ. (1983). Two new procedures for studying validity generalization.Journal of Applied Psychology, 68, 382–395.
Ree MJ, Caretta TR, Earles JA, Albert W. (1994). Sign changes when correcting for rangerestriction: A note on Pearson’s and Lawley’s selection formulas. Journal of AppliedPsychology, 79, 298–301.
Sackett PR, Yang H. (2000). Correction for range restriction: An expanded typology. Journalof Applied Psychology, 85, 112–118.
Schmidt FL, Gast-Rosenberg IF, Hunter JE. (1980). Validity generalization results forcomputer programmers. Journal of Applied Psychology, 65, 643–661.
Schmidt FL, Hunter JE, Caplan JR. (1981a). Selection procedure validity generalization(transportability) results for three job groups in the petroleum industry. Washington,DC: American Petroleum Institute.
Schmidt FL, Hunter JE, Caplan JR. (1981b). Validity generalization results for twojob groups in the petroleum industry. Journal of Applied Psychology, 66, 261–273.
Schmidt FL, Hunter JE, McKenzie RC, Muldrow TW. (1979). The impact of valid selectionprocedures on work-force productivity. Journal of Applied Psychology, 64, 609–626.
FRANK L. SCHMIDT ET AL. 305
Schmidt FL, Hunter JE, Pearlman K. (1981). Task difference and validity of aptitude testsin selection: A red herring. Journal of Applied Psychology, 66, 166–185.
Schmidt FL, Hunter JE, Pearlman K, Hirsh HR. (1985). Forty questions about validitygeneralization and meta-analysis (with commentary by P. R. Sackett, M.L. Tenopyr,N. Schmitt, J. Kehoe, S. Zedeck). PERSONNEL PSYCHOLOGY, 38, 697–798.
Schmidt FL, Hunter JE, Pearlman K, Shane GS. (1979). Further tests of the Schmidt–HunterBayesian Validity Generalization Model. PERSONNEL PSYCHOLOGY, 32, 257–281.
Schmidt FL, Law K, Hunter JE, Rothstein HR, Pearlman K, McDaniel M. (1993). Refine-ments in validity generalization methods: Implications for the situational specificityhypothesis. Journal of Applied Psychology, 78, 3–13.
Schmidt FL, Le H. (2004). Software for the Hunter-Schmidt meta-analysis methods.(Version 1.1) Unpublished manuscript, Department of Management and Organi-zations, University of Iowa, Iowa City.
Terborg JR, Lee TW. (1982). Extension of the Schmidt–Hunter validity generalization pro-cedure to the prediction of absenteeism behavior from knowledge of job satisfactionand organizational commitment. Journal of Applied Psychology, 67, 280–296.
Thorndike RL. (1949). Personnel Selection. New York: Wiley.
Related Documents


