February 2016 Increasing Investment and Capital Flows in Ohio Why Ohio Policy Matters – Opportunities to Grow Renewable Energy Markets

Welcome message from author
This document is posted to help you gain knowledge. Please leave a comment to let me know what you think about it! Share it to your friends and learn new things together.
Transcript

February 2016
Increasing Investment and
Capital Flows in Ohio
Why Ohio Policy Matters –
Opportunities to Grow
Renewable Energy Markets

Executive Summary
Ohio’s Renewable Portfolio Standard (RPS) and other policies helped create a robust market for renewable energy generation. Over 430 megawatts (MW) of wind power and 100 MW of solar power have been constructed since the 2008 enactment of the RPS. Ninety-eight percent (98%) of Ohio’s renewable energy generation has been constructed since the enactment of the RPS.
Ohio currently ranks 26th in the amount of installed wind capacity in the country and 20th in the amount of installed solar capacity.1, 2 Due to Ohio’s traditional manufacturing strength, Ohio ranks 12th for the number of wind-related jobs (as of 2014)3 and 10th for the number of solar jobs.4
The scale up of renewable energy in Ohio has attracted more than $1.3 billion in asset finance, private equity and venture capital to Ohio since 2008.5 AWEA estimates that over $2.5 million in annual lease payments are made to Ohio landowners, providing additional income to rural communities.4
Renewable energy development has also created domestic supply chains that support domestic manufacturing, construction, and technology sectors and have created tens of thousands of jobs. Ohio is currently home to over 280 companies that are involved in the renewable energy industry, with 119 of those involved in manufacturing.2,3 In addition, the technologies and products developed and manufactured in the U.S. help support the global energy industry and are exported around the world.
Despite these gains, almost no new wind development and very little solar development have occurred in Ohio since 2014 due to SB 310, which froze Ohio’s RPS law for two years, and HB 483, which created unreasonable new setbacks for wind energy facilities. The uncertainty surrounding Ohio’s RPS is jeopardizing future investment in the state, while the onerous setbacks have prevented any new permit applications for wind energy from being approved.
The market for renewable energy is significant, notably from numerous corporations seeking opportunities to purchase renewable energy. Many of these corporations are making choices about where to locate new facilities based upon where renewable energy is available. Ohio’s recent policy choices are jeopardizing these significant investment opportunities.
The correct mix of policies would usher in a large-scale development of renewable energy resources. US PREF projects that over $5 billion in increased economic activity would take place in Ohio through anticipated renewable energy development.
Business friendly policies and greater policy certainty would provide a clear, stable signal to the market, motivate large amounts of capital, and allow for continued investment and growth of the renewable energy sector.
(1) AWEA, Ohio State Profiles, available at http://awea.files.cms-plus.com/FileDownloads/pdfs/Ohio.pdf. (2) SEIA, Ohio State Profile, http://www.seia.org/state-solar-policy/ohio. (3) AWEA, Ohio Wind Energy, available at http://www.awea.org/Resources/state.aspx?ItemNumber=5395. (4) SEIA, Top Ten Solar States, available at http://www.seia.org/research-resources/2014-top-10-solar-states. (5) Bloomberg New Energy Finance.

Global Renewable Energy Trends: Massive Private Capital Investment
The Renewable Energy Sector is Attracting Large Amounts of Private Capital Over $380 billion was invested in the U.S. renewable energy sector from
2004-2015.
In 2015 alone, $44 billion was invested in U.S. renewable energy.1
This capital has been invested to create domestic supply chains that support both our domestic energy market and the global energy technology industry, which attracted over $1.9 trillion in global new investment from 2004-2015.1
Global clean energy sector investment in 2015 alone is estimated at $310 billion.1
Falling Renewable Energy Costs Are a Function of Industry Scale Up
Thanks to polices that have driven investment, and therefore industry growth, both wind and solar PV have reduced their respective costs over the past six years by ~61% and ~82% respectively.2
Empirical data suggests that coal, natural gas, and nuclear generation technologies have required massive increases in scale in order to achieve current favorable cost structures. Solar and wind, by contrast, are continuing to experience significant improvements in their cost structure with relatively much smaller increases in scale.
Economic Impact: Job Creation
The solar industry experienced a nearly 20% growth in employment from 2012-2015, 20 times the national average.3
The solar industry is forecasting jobs growth at 14.7% in 2016.3
At the end of 2014, over 73,000 wind-related jobs existed in the U.S.4
(1) UNEP and BNEF, Global Trends in Renewable Energy Investment 2015, http://fs-unep-centre.org/sites/default/files/attachments/key_findings.pdf; BNEF Clean Energy Investment Data.
(2) Lazard, Lazard‘s Levelized Cost of Energy Analysis – Version 9.0, November 2015. (3) The Solar Foundation, National Solar Jobs Census 2014: The Annual Review of the U.S. Solar Workforce, January 2015. (4) AWEA, Wind Energy Facts at a Glance, https://www.awea.org/Resources/Content.aspx?ItemNumber=5059.
$6
$12
$28
$34 $36
$24
$35
$53
$40
$36 $38
$44
$0
$50
$100
$150
$200
$250
$300
$350
$400
$450
$0
$10
$20
$30
$40
$50
$60
2004 2005 2006 2007 2008 2009 2010 2011 2012 2013 2014 2015
U.S Total New Renewable Energy Investment ($ billion)
Total Cumulative Investment Total Annual Investment
Technologies include: all biomass and waste-to-energy, geothermal, and wind projects greater than 1 MW; all hydropower between 1 MW and 50 MW; all wave
and tidal projects; all biofuel projects with a capacity of one million liters or greater per year; and all solar projects.
Source: Frankfurt School-UNEP/BNEF

Renewable Energy is Cost-Competitive Energy
82% Reduction in Solar LCOE since 2009
61% Reduction in Wind LCOE since 2009
Renewable energy is already cost competitive with traditional generation sources on a levelized cost of electricity (LCOE) basis.
Renewable energy costs are falling rapidly. The levelized cost of solar has fallen 82% since
2009 and the levelized cost of wind has fallen 61%.1
The costs of renewable energy will continue to fall as the industry continues to increase scale.
Source: Lazard
Source: Lazard Source: Lazard
(1) Lazard, Lazard‘s Levelized Cost of Energy Analysis – Version 9.0, November 2015, available at https://www.lazard.com/media/2390/lazards-levelized-cost-of-energy-analysis-90.pdf

Global Renewable Energy Trends: Corporations Want Renewables
Corporations Want Renewable Energy 3.44 GW of renewable energy and renewable energy facilities were purchased by corporations in 2015, up from 1.18 GW in 2014.1
Several corporations have already purchased renewable energy in Ohio and several more are interested in doing so.
Corporations like Amazon, Apple and Facebook have stated that they are more interested in locating their facilities in states where renewable energy is available.
Amazon is building a number of data and fulfillment centers in Ohio and is committed to powering them with 100% renewable energy, including a recently announced 100 MW wind farm in Ohio.
Other States are Outcompeting Ohio for These New Investment Opportunities
In 2015 alone, corporations signed Power Purchase Agreements for 1 GW of renewable power from Texas, 555 MW from California, 326 MW from Oklahoma, and 391 MW from North Carolina, among other states.2
In comparison, two (2) PPAs that total 102.4 MW of renewable power produced in Ohio were signed in 2015, lead by Amazon Web Services’ contract for 100 MW of Ohio wind power.2
Corporate Renewable Energy Purchases 2010-2015
Source: RMI BRC
(1) Rocky Mountain Institute, Business Resource Center, available at http://www.rmi.org/business_renewables_center_newsletter_002_jan_2016. (2) BNEF, Corporate PPA Database.
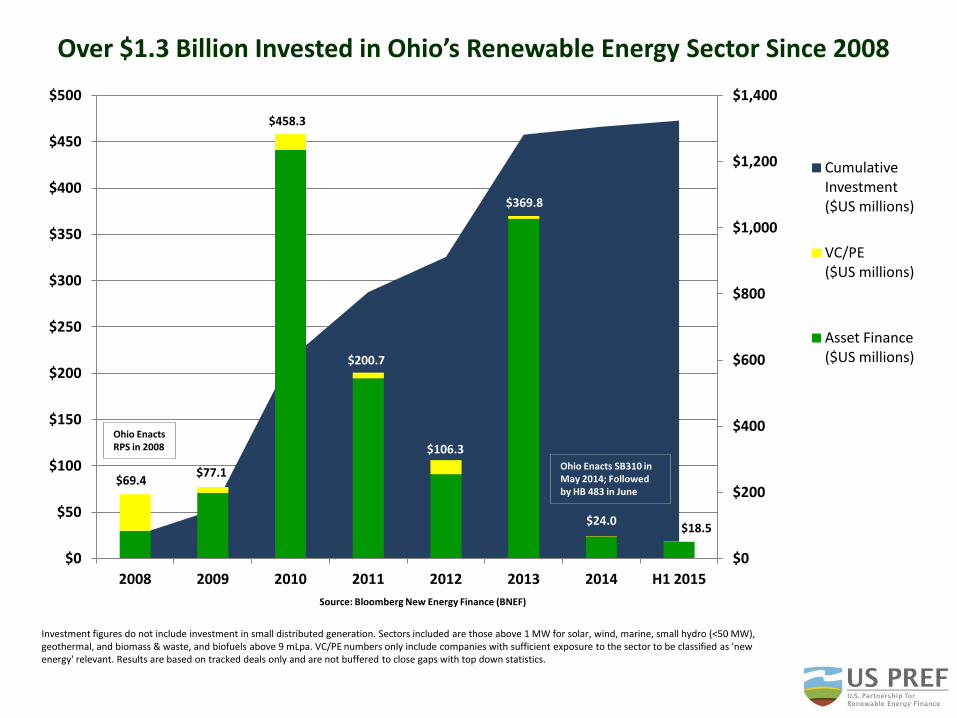
Over $1.3 Billion Invested in Ohio’s Renewable Energy Sector Since 2008
$69.4 $77.1
$458.3
$200.7
$106.3
$369.8
$24.0 $18.5
$0
$200
$400
$600
$800
$1,000
$1,200
$1,400
$0
$50
$100
$150
$200
$250
$300
$350
$400
$450
$500
2008 2009 2010 2011 2012 2013 2014 H1 2015
Cumulative Investment ($US millions)
VC/PE ($US millions)
Asset Finance ($US millions)
Source: Bloomberg New Energy Finance (BNEF)
Ohio Enacts SB310 in May 2014; Followed by HB 483 in June
Investment figures do not include investment in small distributed generation. Sectors included are those above 1 MW for solar, wind, marine, small hydro (<50 MW), geothermal, and biomass & waste, and biofuels above 9 mLpa. VC/PE numbers only include companies with sufficient exposure to the sector to be classified as 'new energy' relevant. Results are based on tracked deals only and are not buffered to close gaps with top down statistics.
Ohio Enacts RPS in 2008

Ohio is an Important Manufacturing Center for the Renewable Energy Industry
Over 119 Ohio Companies Are Part of the Renewable Energy Manufacturing Supply Chain Companies include manufacturers, installers, developers, construction and finance.
Together, these companies employ over 89,000 Ohioans.1
In 2015, a total of 221 Ohio companies are engaged in the solar industry. Fifty-six (56) of these companies are engaged in manufacturing solar components.2
First Solar, the nation’s largest solar manufacturer, has its manufacturing plant in Perrysburg, Ohio, where it produces over 600 MW of panels annually.
First Solar employs over 1,400 workers at the plant, including engineers, researchers, and manufacturing technicians.
First Solar has invested over $750 million in Ohio’s economy through wages, purchases, research and development, taxes and more.
In 2015, a total of 63 Ohio companies are engaged in the wind industry supply chain. Ohio ranks first in the nation for wind-related manufacturing.3
Several factors have helped Ohio establish itself as a leading wind and solar component manufacturer:
Supportive policies
Established manufacturing base and trained workforce
Central location with proven transportation, transmission and logistics
(1) Environmental Entrepreneurs, Clean Jobs Ohio, May 2015. (2) SEIA, Ohio State Solar Policy, available at http://www.seia.org/state-solar-policy/ohio. (3) AWEA, State Wind Energy Statistics: Ohio, available at http://awea.files.cms-plus.com/FileDownloads/pdfs/Ohio.pdf.
Source: First Solar
Thin-Film Solar Panels Made in Ohio
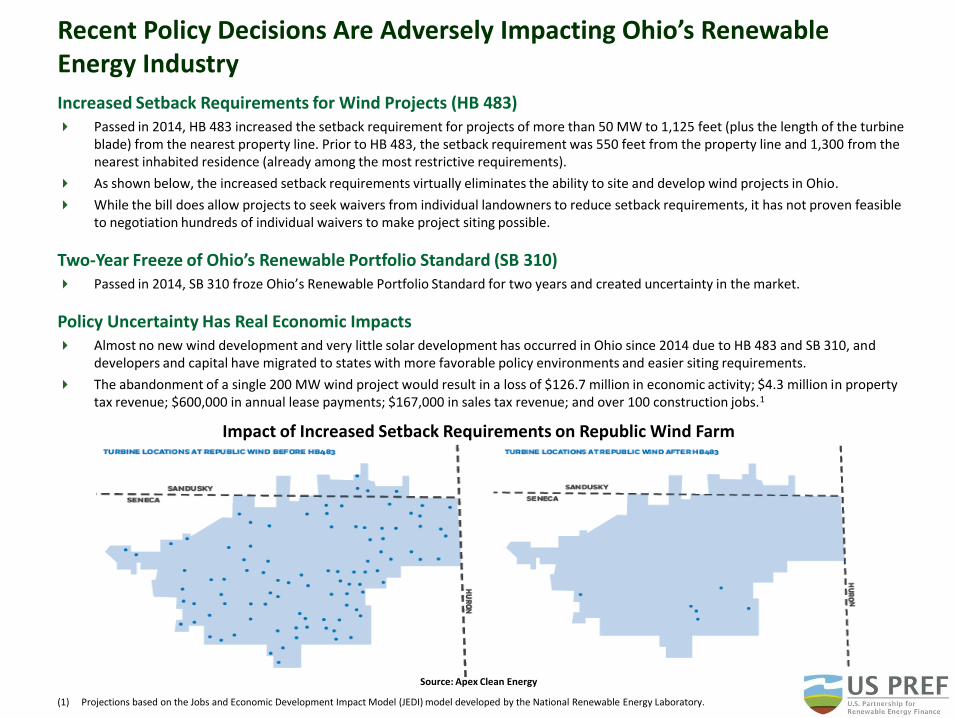
Recent Policy Decisions Are Adversely Impacting Ohio’s Renewable Energy Industry
Increased Setback Requirements for Wind Projects (HB 483) Passed in 2014, HB 483 increased the setback requirement for projects of more than 50 MW to 1,125 feet (plus the length of the turbine
blade) from the nearest property line. Prior to HB 483, the setback requirement was 550 feet from the property line and 1,300 from the nearest inhabited residence (already among the most restrictive requirements).
As shown below, the increased setback requirements virtually eliminates the ability to site and develop wind projects in Ohio.
While the bill does allow projects to seek waivers from individual landowners to reduce setback requirements, it has not proven feasible to negotiation hundreds of individual waivers to make project siting possible.
Two-Year Freeze of Ohio’s Renewable Portfolio Standard (SB 310) Passed in 2014, SB 310 froze Ohio’s Renewable Portfolio Standard for two years and created uncertainty in the market.
Policy Uncertainty Has Real Economic Impacts Almost no new wind development and very little solar development has occurred in Ohio since 2014 due to HB 483 and SB 310, and
developers and capital have migrated to states with more favorable policy environments and easier siting requirements.
The abandonment of a single 200 MW wind project would result in a loss of $126.7 million in economic activity; $4.3 million in property tax revenue; $600,000 in annual lease payments; $167,000 in sales tax revenue; and over 100 construction jobs.1
Impact of Increased Setback Requirements on Republic Wind Farm
Source: Apex Clean Energy
(1) Projections based on the Jobs and Economic Development Impact Model (JEDI) model developed by the National Renewable Energy Laboratory.

7.2 0 0.23 0 0 0.3 4.33
102.2
314.9
3.4 0.9 7.5
0
50
100
150
200
250
300
350
400
450
500
0
50
100
150
200
250
300
350
2004 2005 2006 2007 2008 2009 2010 2011 2012 2013 2014 2015
Cumulative Capacity (MW)
Annual Capacity (MW)
SB 310 and HB 483 passed in 2014
Ohio Enacts RPS in 2008
Source: AWEA, BNEF
Historical Wind Builds in Ohio
Over 97% of Ohio’s wind capacity (425 MW) has been built following the passage of the state’s RPS and before HB 483 was passed.
Average price of a wind Power Purchase Agreement in Ohio is currently $41.34/MWh.1 This compares to an average real-time wholesale price for all forms of electricity of $46.02/MWh in PJM for 2015.2
Ohio’s RPS has been effective at stimulating development of wind resources. However, the increased setback requirements of HB 483 along with the RPS freeze have restricted development.
There are several wind projects totaling more than 1,300 MW approved but not yet constructed and hundreds of megawatts more ready to file for permits.3
(1) Bloomberg New Energy Finance PPA database, accessed Nov. 11, 2015. (2) Energy Information Administration, Wholesale Electricity Market Data, available at http://www.eia.gov/electricity/wholesale/. (3) Ohio Power Siting Board.
The reduction in wind deployment in 2013 was due in large part to the expiration of the Federal Production Tax Credit. After, its reinstatement, wind builds rebounded in 2014 to almost equal 2011 totals. This rebound in wind deployment did not occur in Ohio, however.

Historical Solar Builds in Ohio
Solar power in Ohio has rapidly grown to 106 MW of installed capacity.1
Nearly 100% of Ohio’ solar capacity has been built following the passage of the state’s RPS.
Ohio’s RPS has been effective at stimulating development of solar resources. However, the current RPS freeze is impacting
development.
Sources: SEIA, IREC, PUCO
(1) SEIA, Ohio State Solar Policy, available at http://www.seia.org/state-solar-policy/ohio.
0.4 0.6
13.1 10.9
48.3
18.5
15
6.3
0
20
40
60
80
100
120
0
10
20
30
40
50
60
2008 2009 2010 2011 2012 2013 2014 H1 2015
Cumulative (MW)
Annual (MW)
Ohio Enacts RPS in 2008
SB 310 passed in 2014

The Future of Energy Development in Ohio
According to the Energy Information Administration (EIA), 26.5 GW of electrical generation capacity is scheduled to be retired by 2022. Of this total, 176 MW are located in Ohio, but 3.5 GW are located in the PJM service territory, of which Ohio is a part.1
In conjunction with these planned retirements, the recently promulgated Clean Power Plan sets new emission
limitations on fossil-fuel-fired electrical generating units while also putting in place incentives to develop low and zero carbon generation.
Growing corporate demand for renewable energy has created a robust market of over 3 GW in 2015 alone. Over 80 large corporations recently committed to become powered by renewable energy, and this amount will continue to increase.2
EIA projects that U.S. renewable generation will grow by 72% between 2013 and 2040 (base case), with the overall
share of renewables in the energy mix increasing from 13% in 2013 to 18% in 2040.3
Macro trends clearly point to an electrical generating mix that is increasingly renewable. States will therefore be
competing amongst each other for development and investment. In this regard, Ohio, with its local manufacturing base and central location for distribution and data centers, is positioned to reap the benefit of increased development of renewable energy.
Simply meeting Ohio’s RPS would result in large scale renewable energy development across the state with the attendant economic benefits of increased investment, jobs, and economic growth. Based on average capacity factors of current wind and solar generation in Ohio, compliance with Ohio’ current RPS requires the construction of 5,522 MW of wind and 160 MW of solar.
This level of development would result in tangible and significant economic benefits for Ohio, as shown on the following page.
(1) Energy Information Administration, Planned U.S. Electric Generating Unit Retirements, available at http://www.eia.gov/electricity/monthly/ (2) American Business Act on Climate Pledge, available at https://www.whitehouse.gov/the-press-office/2015/10/19/fact-sheet-white-house-
announces-commitments-american-business-act (3) Energy Information Administration, Annual Energy Outlook 2015, available at http://www.eia.gov/forecasts/aeo/

Projected Economic Impacts of Wind and Solar Development in Ohio
Impact Category Amount of Impact
Amount spent by the State of Ohio on Renewable Energy Annually
~ 12 million1
Asset Finance $17.4 billion
Increase in Economic Activity $5.3 billion ($322.7 million annually after construction)
Sales Taxes Paid $550 million ($4.7 annually after construction)
Annual Property Taxes Paid $123 million
Annual Lease Payments $16.8 million
Total Wages Paid $2.22 billion ($78.9 million annually after construction)
Economic impacts were calculated using the Jobs and Economic Development Impact Model (JEDI) model developed by the National Renewable Energy Laboratory. The modeling is based upon full compliance with Ohio’s RPS in 2026 using BNEF’s projection for anticipated electricity demand subject to RPS requirements in that year. Modeling further assumes that compliance would be met through project s built within Ohio and not through the purchase of out-of-state Renewable Energy Credits. Dollar values are in 2016 dollars. Actual investment would occur over a 10 year period until 2026. Model assumes that a total of 5,522 MW of wind would be built with an average turbine size of 2.5 MW and an average project size of 100 MW. Model also assumes that a total of 160 MW of solar would be built divided between utility- and commercial-scale projects (135MW each), and 10 MW of residential solar.
(1) The Ohio Advanced Energy Fund’s budget for FY2015 was $11.25 million. The state does not appropriate any money for this fund which was funded by a $0.09 surcharge on electric bills. The surcharge expired in 2010. Ohio does not charge sales tax on the sales of certain renewable energy equipment. The budget impact of this policy is less than $1 million per year. See http://obm.ohio.gov/budget/operating/doc/fy-14-15/bluebook/budget/Tax_14-15.pdf .
The correct mix of policies would usher in a large-scale development of renewable energy resources and provide Ohio with tangible economic benefits

ABOUT US PREF US PREF is a coalition of senior level financiers who invest in all sectors of the energy industry, including renewable energy. US PREF members focus on increasing capital formation and investment in renewable energy and educate the public sector to assure policy impacts the market as efficiently and effectively as possible. US PREF is a program of the American Council On Renewable Energy (ACORE), a Washington, DC ‐ based non‐profit organization dedicated to building a secure and prosperous America with clean, renewable energy. For more information please contact Todd Foley, Senior Vice President, Strategy, Policy & Government Relations, Chief Strategy Officer at [email protected], or Scott Clausen, Policy and Research Associate, at [email protected] or visit www.uspref.org.
ABOUT ACORE ACORE, a 501(c)(3) non-profit membership organization, is dedicated to building a secure and prosperous America with clean, renewable energy. ACORE seeks to advance renewable energy through finance, policy, technology, and market development and is concentrating its member focus in 2015 on National Defense & Security, Power Generation & Infrastructure, and Transportation. Additional information is available at www.acore.org.
Related Documents


