energies Review Increasing Energy Efficiency and Productivity of the Comminution Process in Tumbling Mills by Indirect Measurements of Internal Dynamics—An Overview Mateusz Góralczyk 1, * , Pavlo Krot 1, * , Radoslaw Zimroz 1 and Szymon Ogonowski 2 1 Faculty of Geoengineering, Mining and Geology, Wroclaw University of Science and Technology, Na Grobli 15, 50-421 Wroclaw, Poland; [email protected] 2 Faculty of Automatic Control, Electronics and Computer Science, Silesian University of Technology, Akademicka 16, 44-100 Gliwice, Poland; [email protected] * Correspondence: [email protected] (M.G.); [email protected] (P.K.) Received: 15 November 2020; Accepted: 10 December 2020; Published: 21 December 2020 Abstract: Tumbling mills have been widely implemented in many industrial sectors for the grinding of bulk materials. They have been used for decades in the production of fines and in the final stages of ore comminution, where optimal levels for the enrichment particles’ sizes are obtained. Even though these ubiquitous machines of relatively simple construction have been subjected to extensive studies, the industry still struggles with very low energy efficiency of the comminution process. Moreover, obtaining an optimal size for the grinding product particles is crucial for the effectiveness of the following processes and waste production reduction. New, innovative processing methods and machines are being developed to tackle the problem; however, tumbling mills are still most commonly used in all ranges of the industry. Since heavy equipment retrofitting is the most costly approach, process optimization with dedicated models and control systems is the most preferable solution for energy consumption reduction. While the classic technological measurements in mineral processing are well adopted by the industry, nowadays research focuses on new methods of the mill’s internal dynamics analysis and control. This paper presents a retrospective overview of the existing models of internal load motion, an overview of the innovations in process control, and some recent research and industrial approaches from the energy consumption reduction point of view. Keywords: ball mills; energy efficiency; internal dynamics; DEM model; resonance oscillations; measurements 1. Introduction Up to 70% of the costs of materials size-reduction operations fall on the rock particle’s size reduction from 30–50 mm to 20–50 microns [1,2]. This operation is performed by the most common type of milling comminution equipment—ball milling. The design of ball mills was described back in the 18th century—and the principle of their operation has not changed; the only significant changes are the increased diameter and some new solutions for the mill’s drives introduced. Energy consumption in ball and rod mills reaches up to 10–20 kWh per ton of rock. According to the study prepared by the U.S. Department of Energy [3] the biggest potential for energy savings in all of the energy-intensive ore and coal mining-related operations is to be found in grinding optimization (see Figure 1). To increase efficiency, designers of mining equipment tried to improve all the elements of ball mills, such as the geared mechanical drives, bearings, their lubrication systems, and electric motors. Moreover, efforts have been made to optimize the size of the grinding bodies, control the filling level of the drum with the material, and stabilize the rotation speed. However, the main problem of dramatically low energy efficiency is still unresolved—about 30% of grinding bodies are not involved in the dynamical Energies 2020, 13, 6735; doi:10.3390/en13246735 www.mdpi.com/journal/energies

Welcome message from author
This document is posted to help you gain knowledge. Please leave a comment to let me know what you think about it! Share it to your friends and learn new things together.
Transcript
energies
Review
Increasing Energy Efficiency and Productivity of theComminution Process in Tumbling Mills by IndirectMeasurements of Internal Dynamics—An Overview
Mateusz Góralczyk 1,* , Pavlo Krot 1,* , Radosław Zimroz 1 and Szymon Ogonowski 2
1 Faculty of Geoengineering, Mining and Geology, Wroclaw University of Science and Technology,Na Grobli 15, 50-421 Wrocław, Poland; [email protected]
2 Faculty of Automatic Control, Electronics and Computer Science, Silesian University of Technology,Akademicka 16, 44-100 Gliwice, Poland; [email protected]
* Correspondence: [email protected] (M.G.); [email protected] (P.K.)
Received: 15 November 2020; Accepted: 10 December 2020; Published: 21 December 2020 �����������������
Abstract: Tumbling mills have been widely implemented in many industrial sectors for the grindingof bulk materials. They have been used for decades in the production of fines and in the finalstages of ore comminution, where optimal levels for the enrichment particles’ sizes are obtained.Even though these ubiquitous machines of relatively simple construction have been subjected toextensive studies, the industry still struggles with very low energy efficiency of the comminutionprocess. Moreover, obtaining an optimal size for the grinding product particles is crucial for theeffectiveness of the following processes and waste production reduction. New, innovative processingmethods and machines are being developed to tackle the problem; however, tumbling mills arestill most commonly used in all ranges of the industry. Since heavy equipment retrofitting is themost costly approach, process optimization with dedicated models and control systems is the mostpreferable solution for energy consumption reduction. While the classic technological measurementsin mineral processing are well adopted by the industry, nowadays research focuses on new methods ofthe mill’s internal dynamics analysis and control. This paper presents a retrospective overview of theexisting models of internal load motion, an overview of the innovations in process control, and somerecent research and industrial approaches from the energy consumption reduction point of view.
Keywords: ball mills; energy efficiency; internal dynamics; DEM model; resonance oscillations;measurements
1. Introduction
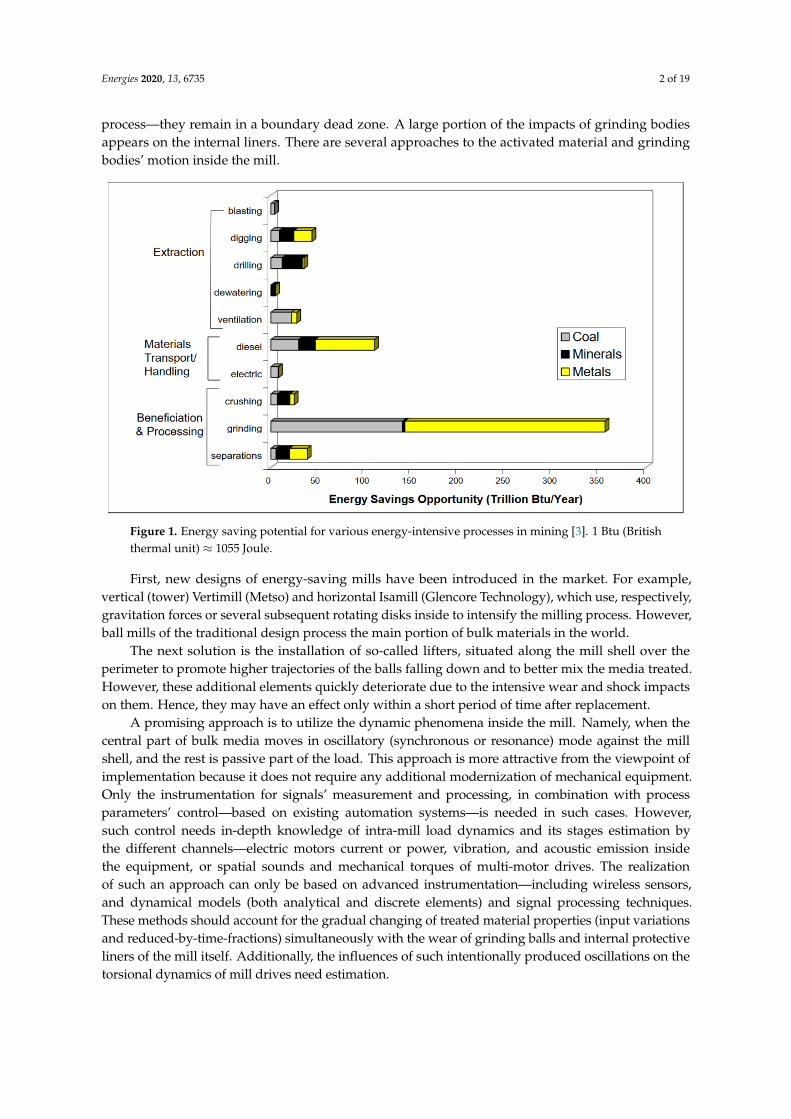
Up to 70% of the costs of materials size-reduction operations fall on the rock particle’s sizereduction from 30–50 mm to 20–50 microns [1,2]. This operation is performed by the most commontype of milling comminution equipment—ball milling. The design of ball mills was described back inthe 18th century—and the principle of their operation has not changed; the only significant changes arethe increased diameter and some new solutions for the mill’s drives introduced. Energy consumptionin ball and rod mills reaches up to 10–20 kWh per ton of rock. According to the study prepared by theU.S. Department of Energy [3] the biggest potential for energy savings in all of the energy-intensive oreand coal mining-related operations is to be found in grinding optimization (see Figure 1). To increaseefficiency, designers of mining equipment tried to improve all the elements of ball mills, such asthe geared mechanical drives, bearings, their lubrication systems, and electric motors. Moreover,efforts have been made to optimize the size of the grinding bodies, control the filling level of the drumwith the material, and stabilize the rotation speed. However, the main problem of dramatically lowenergy efficiency is still unresolved—about 30% of grinding bodies are not involved in the dynamical
Energies 2020, 13, 6735; doi:10.3390/en13246735 www.mdpi.com/journal/energies
Energies 2020, 13, 6735 2 of 19
process—they remain in a boundary dead zone. A large portion of the impacts of grinding bodiesappears on the internal liners. There are several approaches to the activated material and grindingbodies’ motion inside the mill.
Figure 1. Energy saving potential for various energy-intensive processes in mining [3]. 1 Btu (Britishthermal unit) ≈ 1055 Joule.
First, new designs of energy-saving mills have been introduced in the market. For example,vertical (tower) Vertimill (Metso) and horizontal Isamill (Glencore Technology), which use, respectively,gravitation forces or several subsequent rotating disks inside to intensify the milling process. However,ball mills of the traditional design process the main portion of bulk materials in the world.
The next solution is the installation of so-called lifters, situated along the mill shell over theperimeter to promote higher trajectories of the balls falling down and to better mix the media treated.However, these additional elements quickly deteriorate due to the intensive wear and shock impactson them. Hence, they may have an effect only within a short period of time after replacement.
A promising approach is to utilize the dynamic phenomena inside the mill. Namely, when thecentral part of bulk media moves in oscillatory (synchronous or resonance) mode against the millshell, and the rest is passive part of the load. This approach is more attractive from the viewpoint ofimplementation because it does not require any additional modernization of mechanical equipment.Only the instrumentation for signals’ measurement and processing, in combination with processparameters’ control—based on existing automation systems—is needed in such cases. However,such control needs in-depth knowledge of intra-mill load dynamics and its stages estimation bythe different channels—electric motors current or power, vibration, and acoustic emission insidethe equipment, or spatial sounds and mechanical torques of multi-motor drives. The realizationof such an approach can only be based on advanced instrumentation—including wireless sensors,and dynamical models (both analytical and discrete elements) and signal processing techniques.These methods should account for the gradual changing of treated material properties (input variationsand reduced-by-time-fractions) simultaneously with the wear of grinding balls and internal protectiveliners of the mill itself. Additionally, the influences of such intentionally produced oscillations on thetorsional dynamics of mill drives need estimation.
Energies 2020, 13, 6735 3 of 19
This paper intends to represent a comprehensive retrospective overview of existing methodsand recent trends in ball mills modeling and control aimed at increasing their energy efficiency andproductivity by indirect measurements of internal dynamics with signals of different physical nature.
2. State-of-the-Art in Mill Control
Being the main equipment used for fine-grinding in the raw materials industry and an element ofthe most energy-consuming stage in mineral processing, responsible for roughly half of the miningcompanies’ energy consumption [4,5], tumbling mills were subjected to legitimate and intensivestudies in the search for improving the efficiency of ore processing. Depending on the industry’snature, dedicated open and close grinding circuits are designed to perform comminution in a dry orwet environment [6,7]. Depending on the stage of the process and the requirement of the product grainsize distribution (coarse, fine, or ultra-fine grinding) the specific energy rises exponentially with thefinal grains’ size reduction [8]. In many applications, comminution is performed in order to achievethe desired degree of minerals liberation, that is, the percentage of the valuable mineral in the free formin relation to the valuable injected in the gangue (locked form) [9]. Thus, improved control over thecomminution process has significant influences on the concentration processes, such as flotation [10,11]and bio-leaching [12]. Obtaining high efficiency from the energy and material consumption pointsof view, has a significant potential to contribute to decreasing the environmental impact of this veryburdensome process. Due to the difficulty of balancing the large ore particle supply with the optimalfeed rate, the autogenous (AG) and semi-autogenous (SAG) mills operate in a meta-stable state,which creates a demand for accurate and real-time assessments of a mill’s load and its behavior [13].
Circuit retrofitting is the most difficult and costly approach to the grinding process optimization;thus, after initial circuit design, further optimization is achieved through the process control. In mostcases it requires, however, process parameters’ measurement for the feedback approach or accurateprocess models for the feed-forward approach [14]. Taking into account the complexity and thedynamics of the close grinding circuits (most popular in the mineral processing industry) the mostsuitable solution would be to measure or model the mill’s output itself. The necessity of robustnessand complexity of multivariate nonlinear predictive control of SAG ball mills is underlined in [15].
Direct observation of internal load motion is practically impossible; however, the knowledgeabout its trajectory plays the main role in the optimization of the disintegration of bulk material intosmaller particles. Therefore, many scientists and engineers devoted their efforts to developing andimproving indirect methods of studying the differences in operating conditions of ball mills. Some ofthe flagship examples of these types of measurements are the passive inertial measurements on thesurface of a SAG mill, which have been used by Campbell et al. [16] to study the operating conditionsof the machine, namely, to specify variations of the volumetric filling and motion characteristics.The vibrations of the machine’s shell taking place as a result of the collisions of the grinding media’and ground ore with each other and with liners have been proven to provide informative datafor condition surveillance when subjected to appropriate signal processing techniques. The usageof polar contour plots and spectrogram analysis has been presented as appropriate for derivingsignals’ characteristics that respond well to changes in operating conditions, such as frequency bandpower. Such indirect methods can be based on various signals—on vibration signature: [17–27];acoustic data: [28–31]; using both—acoustic and vibration data together: [24,32–36]. The weight ofthe mill’s charge has been also successfully evaluated by measuring strain changes in the mill’sshell, together with obtaining some information about the dynamic behavior of grinding media [37].Another possibility for monitoring the mill filling level is the measurement of the motor: powerdraw [38], torque [39] and other signals from the motor control units [18,24,40]. Since the engine’selectrical signals’ characteristics are dependent on the process of elevation of the particles inside thedrum—their collisions and impacts [41]—they allow one to observe the intra-mill material dynamicbehavior as well [42]. Another important set of issues to be taken into consideration includes theaccelerated wear of lifters and liners, and the destruction of discharge grates emerging when the
Energies 2020, 13, 6735 4 of 19
feed rate deviates from a desirable value. The identification of the regions where direct shell impacttakes place, leading to the damage of liners and accelerated wear, by means of vibration data analysis,has been demonstrated in [43].
Physical variables describing the performance of ball mill have been successfully measuredwith an instrumented ball, equipped with a data storage module, a power supply, communicationselectronics, and inertial sensors connected to a small micro-controller [44–46].
A wide range of scientific research in that area led to various industrial applications of theautomatic stabilization of the mill’s motor power and the design of technical solutions for the control ofits maximum level. Such solutions are becoming the standard in the raw materials industry worldwide,representing trends of Industry 4.0. Some of the most popular industrial solutions are StarCS fromMintek [47,48], MilSense from Outotek [49], and LoadIQ from FLSmidth [50]. Such systems usuallymeasure a set of technological parameters, e.g., feed mass or volume flow rate, density, particle sizedistribution (PSD), and power drawn by the mill’s engines. Most recently, on top of classic directmeasurements, industrial solutions use indirect measurements based on vibration, strain, and acousticor vision signals. Such systems allow for a 1–2% increase of efficiency, without reducing specific energyconsumption. Taking into account that the largest mills have electrical power of about 20–30 MW,even a tenth of a percent reduction in energy consumption gives tremendous annual savings for plantsusually having several mills.
Circuit control systems are being implemented widely in order to control the feed rate and runthe mill at the optimum efficiency level, which means, depending on the specific objective function:maximizing output, minimizing energy consumption, or providing an accurate particle size distributionfor the further stages of mineral processing. Examples of such systems are: Grinding Circuit Control(GCC) solutions, used in Canadian processing plants [51] (e.g., Strathcona Mill, Raglan Mill, Eland Mill),MillVis system [52] developed by AMEplus and KGHM Polska Miedz S.A. for all of the Polish millingsections, where rod-primary-mills and ball-mills for regrinding are used in Divisions of Concentrators(O/ZWR Lubin, O/ZWR Polkowice, O/ZWR Rudna), or an intelligent optimal-setting control (IOSC)applied in the Chinese iron ore concentration plants’ grinding circuits [53]. While the systems operatingin Canadian mines focus on accurate observation of the ore stream in multiple points of the circuit andreacting to the variations—in order to provide the stability of the milling process, the Polish processcontrol and optimization system includes inertial and acoustic measurements aimed at the mill itself.More precisely speaking, in the case of MillVis, monitoring of the mill’s performance and its technicalstate is based on inertial data, acquired by accelerometers distributed on the machine’s shell—todiagnose liners and lifters; acoustic signal recorded in the direct neighborhood of the machine—forindirect assessment of grinding media and rotational speed; and additionally—video recording ofthe feed—to control feeds’ granulation variability and lithological compound [54]. In the case of theChinese processing plant, the developed approach includes a loop controller using case-based reasoningand a soft sensor for particle size distribution control based on a neural network, together with thefuzzy inference adjusting method [55]. The goal function of the IOSC is to provide an optimal rate ofproduction, maintaining appropriate particle size distribution for further enrichment processes.
Increased control over the comminution process may be beneficial since it allows one to takeadvantage of the phenomenon occurring in the grinding chamber, which can improve the efficiency ofthe particles’ size reduction. It was proven in the laboratory and industrial-scale studies of the internalmechanics of tumbling mills, that there is a resonant oscillation mode of the central part of the mill’scharge, occurring at a certain value of the feed and rotational speed [56].
Such an oscillation of the material in the low-frequency range (1–3 Hz), if maintained, may leadto an increase of the mill’s efficiency by 6–8% and a decrease of its energy consumption by 8–10% as itwas discovered by industrial investigations in [57]. Some studies conducted on laboratory mills withdifferent types of building materials give available energy savings up to 50% [58].
It was found in the experimental research that the resonant mode of oscillation can be preserved bychanging the load factor in all the types of ball mills: ball mills using grinding media, semi-autogenous,
Energies 2020, 13, 6735 5 of 19
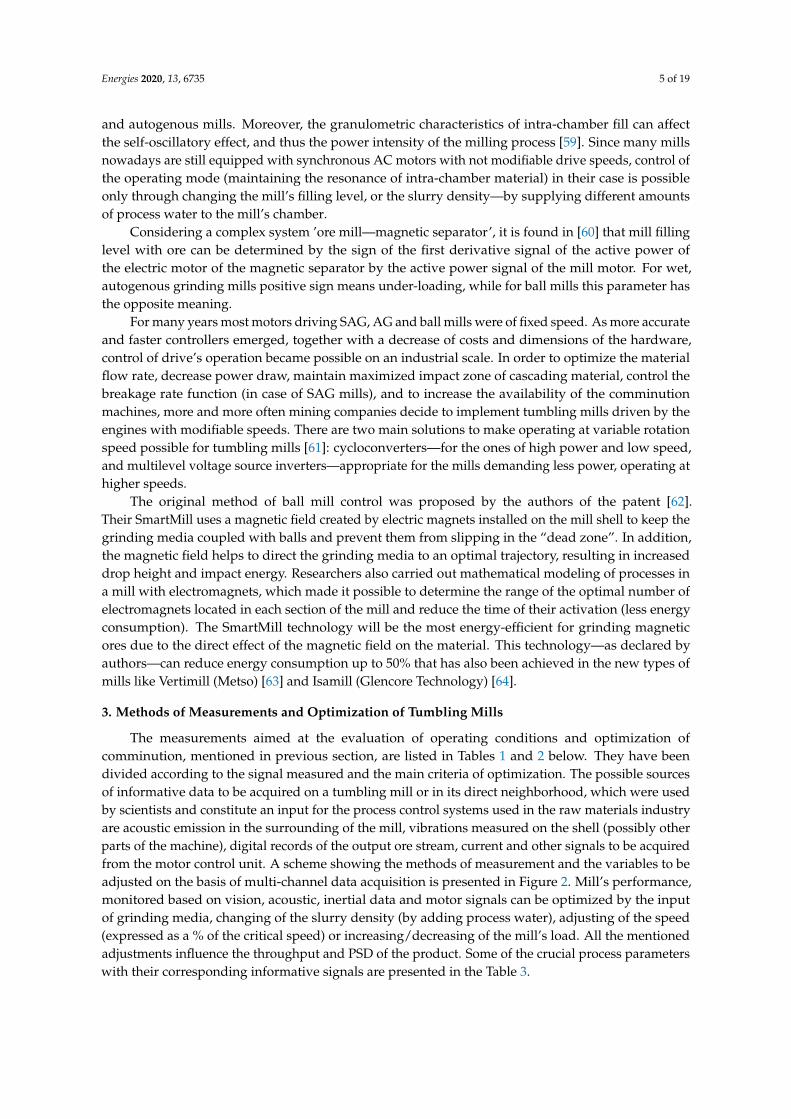
and autogenous mills. Moreover, the granulometric characteristics of intra-chamber fill can affectthe self-oscillatory effect, and thus the power intensity of the milling process [59]. Since many millsnowadays are still equipped with synchronous AC motors with not modifiable drive speeds, control ofthe operating mode (maintaining the resonance of intra-chamber material) in their case is possibleonly through changing the mill’s filling level, or the slurry density—by supplying different amountsof process water to the mill’s chamber.
Considering a complex system ’ore mill—magnetic separator’, it is found in [60] that mill fillinglevel with ore can be determined by the sign of the first derivative signal of the active power ofthe electric motor of the magnetic separator by the active power signal of the mill motor. For wet,autogenous grinding mills positive sign means under-loading, while for ball mills this parameter hasthe opposite meaning.
For many years most motors driving SAG, AG and ball mills were of fixed speed. As more accurateand faster controllers emerged, together with a decrease of costs and dimensions of the hardware,control of drive’s operation became possible on an industrial scale. In order to optimize the materialflow rate, decrease power draw, maintain maximized impact zone of cascading material, control thebreakage rate function (in case of SAG mills), and to increase the availability of the comminutionmachines, more and more often mining companies decide to implement tumbling mills driven by theengines with modifiable speeds. There are two main solutions to make operating at variable rotationspeed possible for tumbling mills [61]: cycloconverters—for the ones of high power and low speed,and multilevel voltage source inverters—appropriate for the mills demanding less power, operating athigher speeds.
The original method of ball mill control was proposed by the authors of the patent [62].Their SmartMill uses a magnetic field created by electric magnets installed on the mill shell to keep thegrinding media coupled with balls and prevent them from slipping in the “dead zone”. In addition,the magnetic field helps to direct the grinding media to an optimal trajectory, resulting in increaseddrop height and impact energy. Researchers also carried out mathematical modeling of processes ina mill with electromagnets, which made it possible to determine the range of the optimal number ofelectromagnets located in each section of the mill and reduce the time of their activation (less energyconsumption). The SmartMill technology will be the most energy-efficient for grinding magneticores due to the direct effect of the magnetic field on the material. This technology—as declared byauthors—can reduce energy consumption up to 50% that has also been achieved in the new types ofmills like Vertimill (Metso) [63] and Isamill (Glencore Technology) [64].
3. Methods of Measurements and Optimization of Tumbling Mills
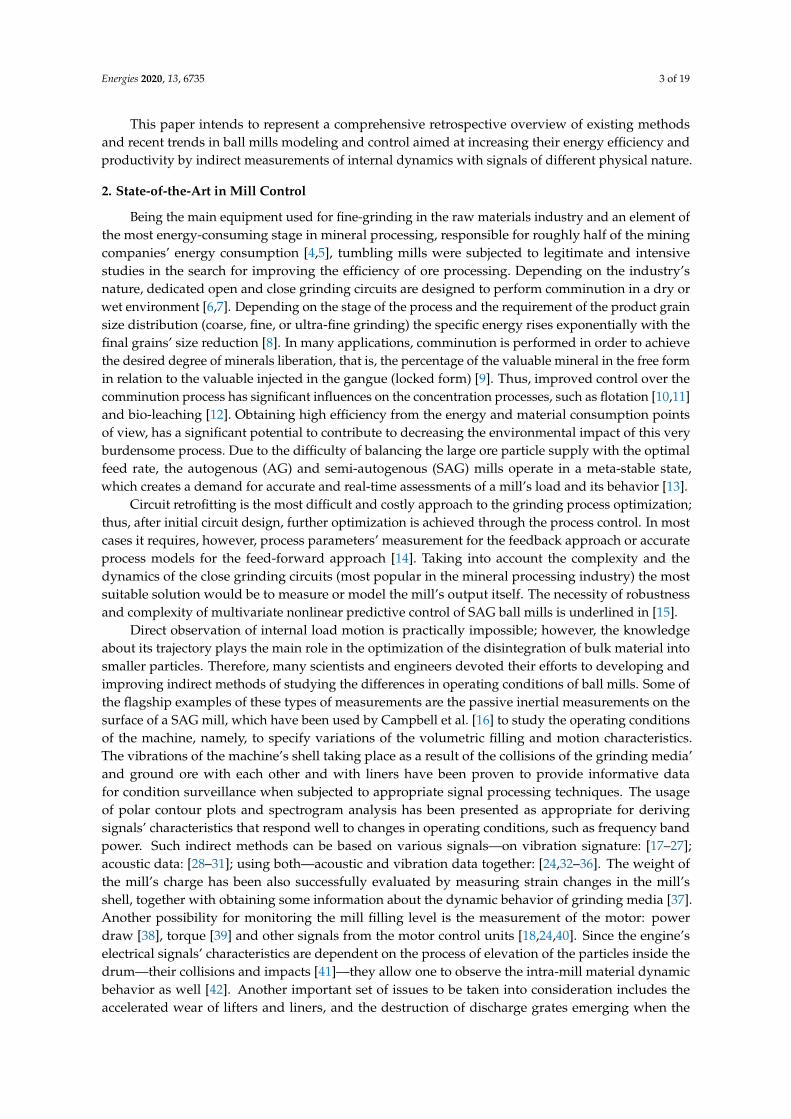
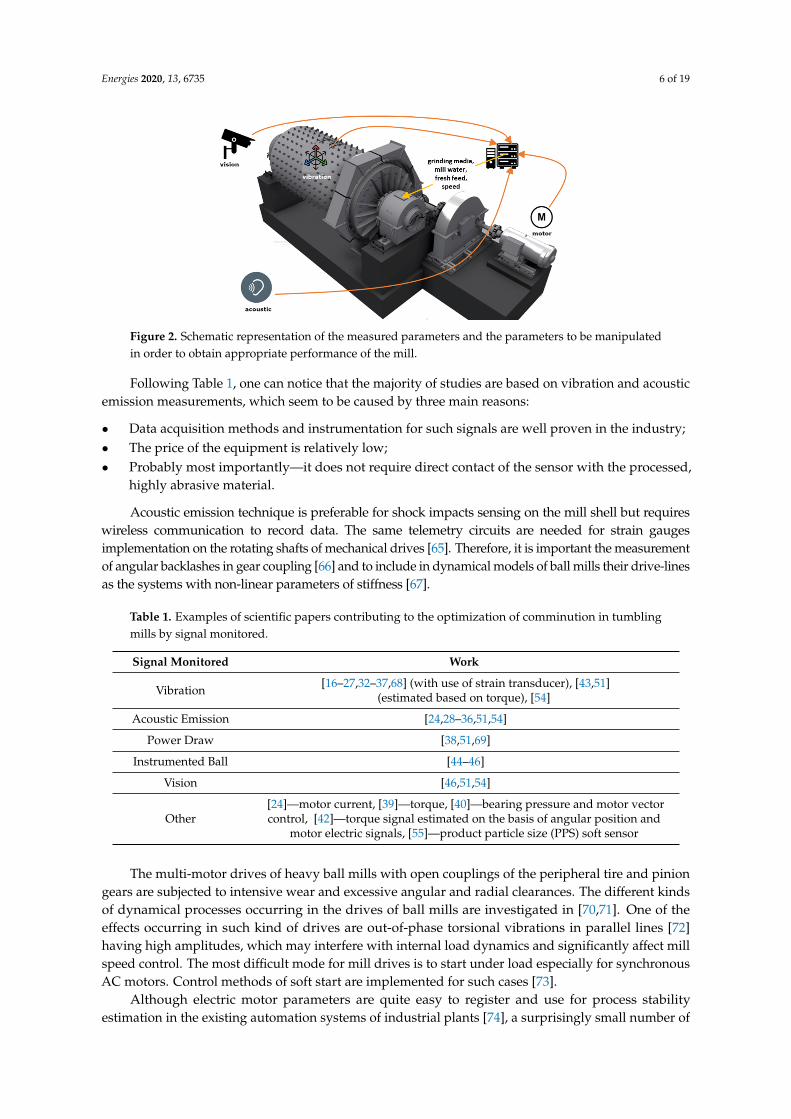
The measurements aimed at the evaluation of operating conditions and optimization ofcomminution, mentioned in previous section, are listed in Tables 1 and 2 below. They have beendivided according to the signal measured and the main criteria of optimization. The possible sourcesof informative data to be acquired on a tumbling mill or in its direct neighborhood, which were usedby scientists and constitute an input for the process control systems used in the raw materials industryare acoustic emission in the surrounding of the mill, vibrations measured on the shell (possibly otherparts of the machine), digital records of the output ore stream, current and other signals to be acquiredfrom the motor control unit. A scheme showing the methods of measurement and the variables to beadjusted on the basis of multi-channel data acquisition is presented in Figure 2. Mill’s performance,monitored based on vision, acoustic, inertial data and motor signals can be optimized by the inputof grinding media, changing of the slurry density (by adding process water), adjusting of the speed(expressed as a % of the critical speed) or increasing/decreasing of the mill’s load. All the mentionedadjustments influence the throughput and PSD of the product. Some of the crucial process parameterswith their corresponding informative signals are presented in the Table 3.
Energies 2020, 13, 6735 6 of 19
Figure 2. Schematic representation of the measured parameters and the parameters to be manipulatedin order to obtain appropriate performance of the mill.
Following Table 1, one can notice that the majority of studies are based on vibration and acousticemission measurements, which seem to be caused by three main reasons:
• Data acquisition methods and instrumentation for such signals are well proven in the industry;• The price of the equipment is relatively low;• Probably most importantly—it does not require direct contact of the sensor with the processed,
highly abrasive material.
Acoustic emission technique is preferable for shock impacts sensing on the mill shell but requireswireless communication to record data. The same telemetry circuits are needed for strain gaugesimplementation on the rotating shafts of mechanical drives [65]. Therefore, it is important the measurementof angular backlashes in gear coupling [66] and to include in dynamical models of ball mills their drive-linesas the systems with non-linear parameters of stiffness [67].
Table 1. Examples of scientific papers contributing to the optimization of comminution in tumblingmills by signal monitored.
Signal Monitored Work
Vibration [16–27,32–37,68] (with use of strain transducer), [43,51](estimated based on torque), [54]
Acoustic Emission [24,28–36,51,54]
Power Draw [38,51,69]
Instrumented Ball [44–46]
Vision [46,51,54]
Other[24]—motor current, [39]—torque, [40]—bearing pressure and motor vectorcontrol, [42]—torque signal estimated on the basis of angular position and
motor electric signals, [55]—product particle size (PPS) soft sensor
The multi-motor drives of heavy ball mills with open couplings of the peripheral tire and piniongears are subjected to intensive wear and excessive angular and radial clearances. The different kindsof dynamical processes occurring in the drives of ball mills are investigated in [70,71]. One of theeffects occurring in such kind of drives are out-of-phase torsional vibrations in parallel lines [72]having high amplitudes, which may interfere with internal load dynamics and significantly affect millspeed control. The most difficult mode for mill drives is to start under load especially for synchronousAC motors. Control methods of soft start are implemented for such cases [73].
Although electric motor parameters are quite easy to register and use for process stabilityestimation in the existing automation systems of industrial plants [74], a surprisingly small number of
Energies 2020, 13, 6735 7 of 19
works in the domain of ball mills is discovered. This is most likely related to the simplicity of the signalprocessing methods used, which are not allowing to recognize multivariate correlations in materialproperties in the motor current data, which is reacting only to the integral load inside the mill.
Therefore, as it follows from Tables 2 and 3, the main efforts are undertaken in bulk mediaproperties detection and related working conditions of the mill. Only a few studies are noted on thewear diagnostics of the grinding balls and protective liners, although this is very important for millsmaintenance and balls replacement planning. Method of liners diagnostics is proposed in [69] basedon analysis of infra-low frequencies (up to 0.01 Hz) of components in the active power spectrum.Another way to detect the wear of internal protective liners is to analyze self-excited torsional vibrationsat the natural frequencies of the drive-line of the mill [75].
Table 2. Examples of scientific papers contributing to the optimization of comminution in tumblingmills by different criteria.
Purpose of Measurement Work
Power draw reduction [32]
Wear reduction [31,43,54]
Particle size distributionoptimization [25,28,29,32,51,54,55]
Detection of characteristicworking conditions [17,23,27,51]
Fill level/behaviour [16,18–22,26,30,31,34,37,39,40,42,44,45,68]
Other [32]—pulp temperature, [51,55]—throughputmaximization, [46]—DEM tuning, [69]—wear diagnostics of liners
Table 3. Examples of milling process parameters to be assessed by the measurement of particular signals.
Signal Measured/Process Parameters Fill Level Balls Wear Liners Wear Particle SizeDistribution
Acoustic 3 3 3
Vibration 3 3 3
Vision 3
Power draw 3 3 3
Torque 3
Other signals from electric motor 3
Application of the above-mentioned methods can be well described based on the MillVis systemexample [52]. As described in [54] the system uses vibration, acoustic, and vision measurements.Depending on the application (first or second stage grinding) it uses also other technological parameterslike pulp density or average particle size. The latter are, however, accessible for mixed product streamsfrom several mills sections and are used for global optimization purposes rather than individual millsperformance improvement.
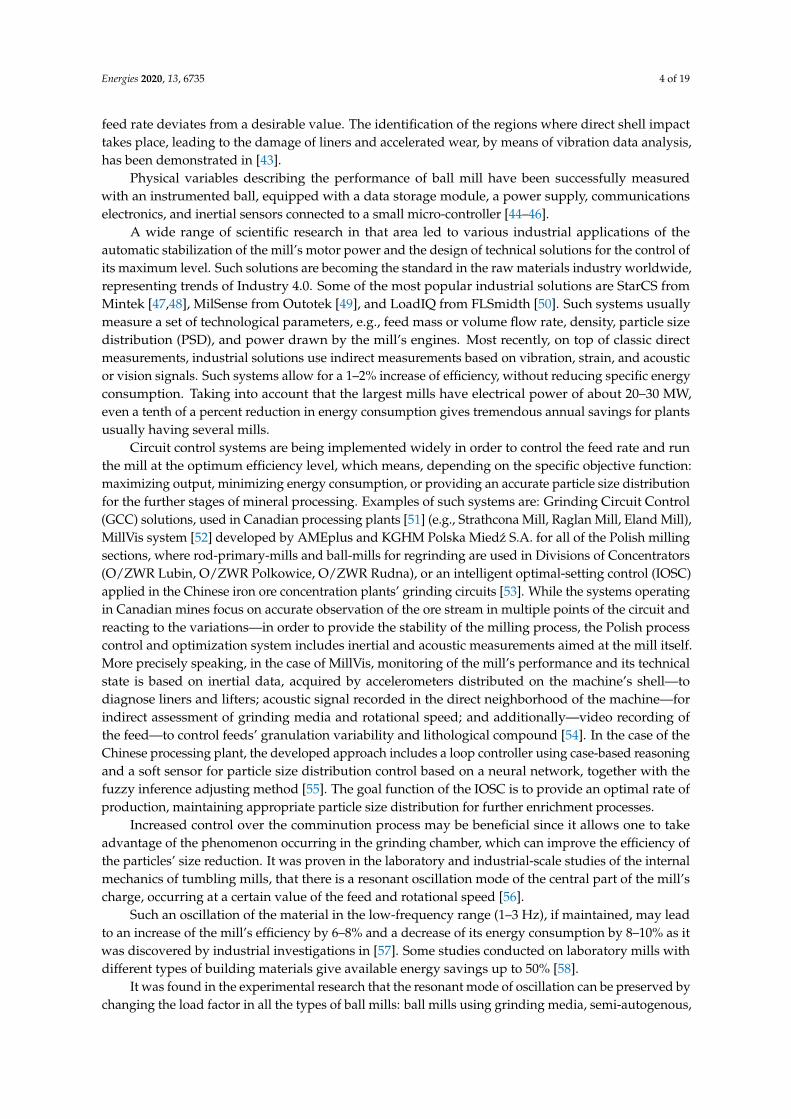
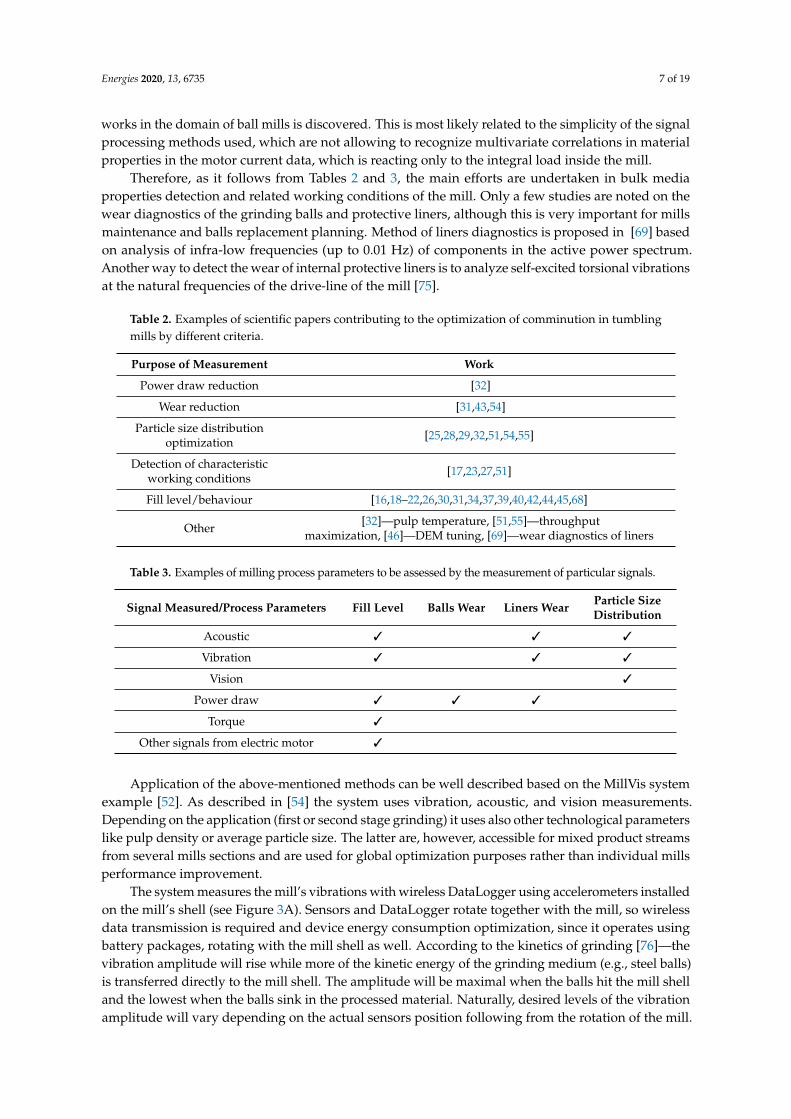
The system measures the mill’s vibrations with wireless DataLogger using accelerometers installedon the mill’s shell (see Figure 3A). Sensors and DataLogger rotate together with the mill, so wirelessdata transmission is required and device energy consumption optimization, since it operates usingbattery packages, rotating with the mill shell as well. According to the kinetics of grinding [76]—thevibration amplitude will rise while more of the kinetic energy of the grinding medium (e.g., steel balls)is transferred directly to the mill shell. The amplitude will be maximal when the balls hit the mill shelland the lowest when the balls sink in the processed material. Naturally, desired levels of the vibrationamplitude will vary depending on the actual sensors position following from the rotation of the mill.
Energies 2020, 13, 6735 8 of 19
Thus, quite important is to correlate the amplitude measurements with the mill position. It is quitestraightforward using the vibration signal from the individual sensor rotating together with the millshell and low-pass filtering in frequency domain [77].
Figure 3B shows exemplary data from two full convolutions of the mill represented by blueand red parts of the chart. Black parts represent the final stages of the previous convolution andinitial stages of the following convolution. The yellow sine-wave-shaped chart is the filtration result,representing the position of one of the sensors rotating with the mill shell. Binding the angular positionof the sensor with the vibration signal values allows one to perform easy-to-understand signal analysisusing e.g., polar plots.
Figure 3. Location of the vibration sensors on the mill’s shell (A) and time series of the ball millvibration measurements (black, blue, and red representing separate full convolutions) and a rotationsignal reconstructed from the original (B).
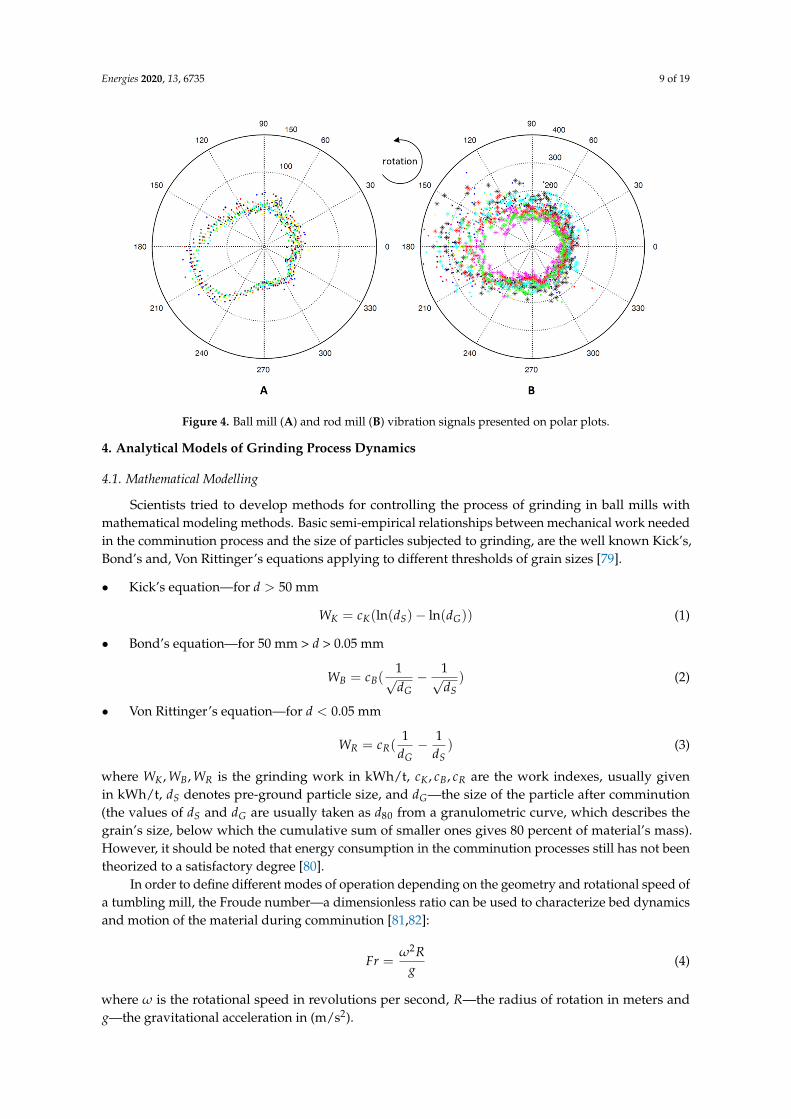
Figure 4 shows the comparison of the vibration signal for rod and ball mills. Each point onthe polar plot represents the vibration amplitude (represented as a distance from the plot center)registered by the sensor in the given position during the mill rotation (represented by the angle value).One can easily observe the maximum amplitude angle changes with the process parameters variation(e.g., pulp density, throughput, grinding media charge).
The difference in the maximum amplitude angle for two compared mills is obvious and followsfrom different grinding media behaviour inside the mill’s working chamber. The visual representationof the mill’s behavior on the polar plots is useful for the operators to determine the state of thegrinding process and the technical condition of the mill itself. Constant analysis of the above-mentionedparameters allows predictive maintenance and increases machinery availability.
Vibration signal amplitude analysis is only one of the system components. Values of technologicalprocess parameters, together with vibration signals’ other parameters (e.g., dedicated indexescalculated at the frequency domain) and vision system measurements for the feed particles sizedistribution estimation are finally used by the dedicated software in the supervisory control layer tocalculate optimal control set-points hints for the operator [78].
Energies 2020, 13, 6735 9 of 19
Figure 4. Ball mill (A) and rod mill (B) vibration signals presented on polar plots.
4. Analytical Models of Grinding Process Dynamics
4.1. Mathematical Modelling
Scientists tried to develop methods for controlling the process of grinding in ball mills withmathematical modeling methods. Basic semi-empirical relationships between mechanical work neededin the comminution process and the size of particles subjected to grinding, are the well known Kick’s,Bond’s and, Von Rittinger’s equations applying to different thresholds of grain sizes [79].
• Kick’s equation—for d > 50 mm
WK = cK(ln(dS)− ln(dG)) (1)
• Bond’s equation—for 50 mm > d > 0.05 mm
WB = cB(1√dG− 1√
dS) (2)
• Von Rittinger’s equation—for d < 0.05 mm
WR = cR(1
dG− 1
dS) (3)
where WK, WB, WR is the grinding work in kWh/t, cK, cB, cR are the work indexes, usually givenin kWh/t, dS denotes pre-ground particle size, and dG—the size of the particle after comminution(the values of dS and dG are usually taken as d80 from a granulometric curve, which describes thegrain’s size, below which the cumulative sum of smaller ones gives 80 percent of material’s mass).However, it should be noted that energy consumption in the comminution processes still has not beentheorized to a satisfactory degree [80].
In order to define different modes of operation depending on the geometry and rotational speed ofa tumbling mill, the Froude number—a dimensionless ratio can be used to characterize bed dynamicsand motion of the material during comminution [81,82]:
Fr =ω2R
g(4)
where ω is the rotational speed in revolutions per second, R—the radius of rotation in meters andg—the gravitational acceleration in (m/s2).
Energies 2020, 13, 6735 10 of 19
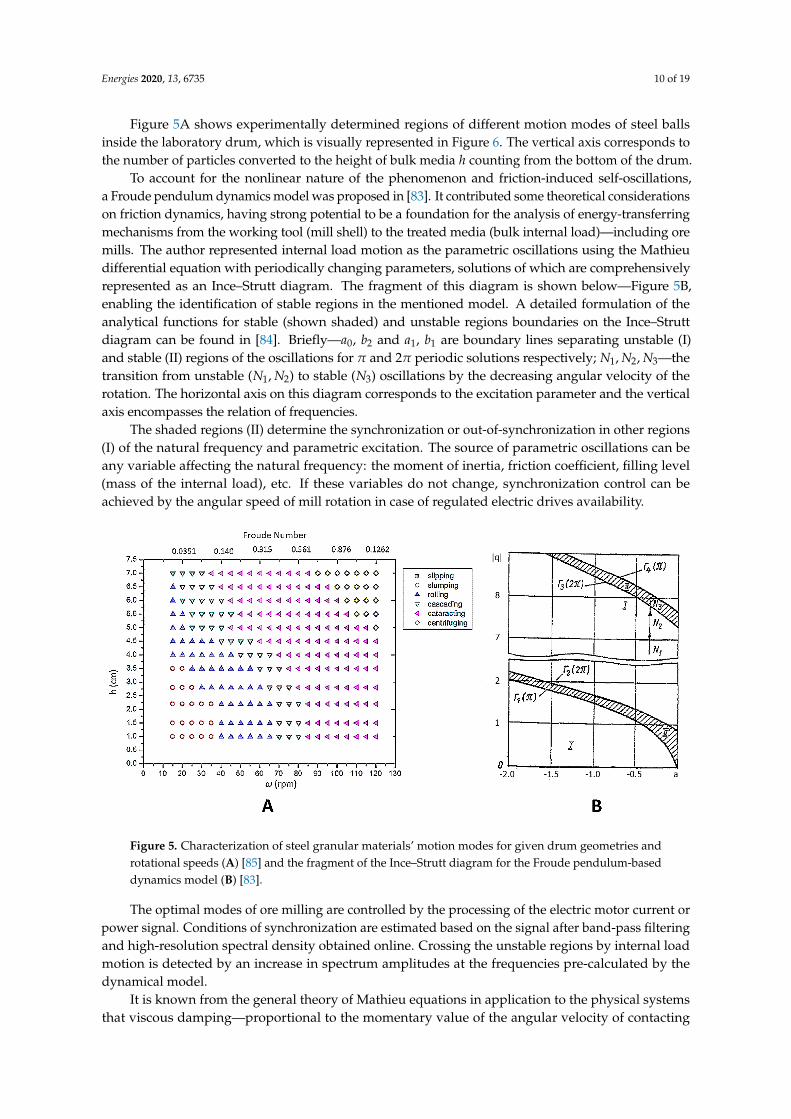
Figure 5A shows experimentally determined regions of different motion modes of steel ballsinside the laboratory drum, which is visually represented in Figure 6. The vertical axis corresponds tothe number of particles converted to the height of bulk media h counting from the bottom of the drum.
To account for the nonlinear nature of the phenomenon and friction-induced self-oscillations,a Froude pendulum dynamics model was proposed in [83]. It contributed some theoretical considerationson friction dynamics, having strong potential to be a foundation for the analysis of energy-transferringmechanisms from the working tool (mill shell) to the treated media (bulk internal load)—including oremills. The author represented internal load motion as the parametric oscillations using the Mathieudifferential equation with periodically changing parameters, solutions of which are comprehensivelyrepresented as an Ince–Strutt diagram. The fragment of this diagram is shown below—Figure 5B,enabling the identification of stable regions in the mentioned model. A detailed formulation of theanalytical functions for stable (shown shaded) and unstable regions boundaries on the Ince–Struttdiagram can be found in [84]. Briefly—a0, b2 and a1, b1 are boundary lines separating unstable (I)and stable (II) regions of the oscillations for π and 2π periodic solutions respectively; N1, N2, N3—thetransition from unstable (N1, N2) to stable (N3) oscillations by the decreasing angular velocity of therotation. The horizontal axis on this diagram corresponds to the excitation parameter and the verticalaxis encompasses the relation of frequencies.
The shaded regions (II) determine the synchronization or out-of-synchronization in other regions(I) of the natural frequency and parametric excitation. The source of parametric oscillations can beany variable affecting the natural frequency: the moment of inertia, friction coefficient, filling level(mass of the internal load), etc. If these variables do not change, synchronization control can beachieved by the angular speed of mill rotation in case of regulated electric drives availability.
Figure 5. Characterization of steel granular materials’ motion modes for given drum geometries androtational speeds (A) [85] and the fragment of the Ince–Strutt diagram for the Froude pendulum-baseddynamics model (B) [83].
The optimal modes of ore milling are controlled by the processing of the electric motor current orpower signal. Conditions of synchronization are estimated based on the signal after band-pass filteringand high-resolution spectral density obtained online. Crossing the unstable regions by internal loadmotion is detected by an increase in spectrum amplitudes at the frequencies pre-calculated by thedynamical model.
It is known from the general theory of Mathieu equations in application to the physical systemsthat viscous damping—proportional to the momentary value of the angular velocity of contacting
Energies 2020, 13, 6735 11 of 19
bodies motion (ore load and mill shell), can only narrow the regions of instability but not eliminate theunlimited increase of the amplitude of parametric oscillations. In other words, for the same relationof natural to exciting frequencies, e.g., for principal resonance in Figure 5B, higher amplitudes ofperiodical disturbance are required, but when its certain level is achieved, the amplitude of oscillationscan develop to unlimited values. However, in real systems like ball mills, some non-linearity in energydissipation always exists, and this is the reason for parametric oscillation attenuation.
Based on this approach, the mechanism of friction-induced oscillations is proposed in ball oremills—including their journal bearings diagnostics and different types of other industrial machines [57],e.g., steel rolling mills [86–88], where the effect of synchronization is also observed, like in ball mills.
Regardless of applied models for frictional interaction investigation, this dynamic phenomenonhas shown the following common features observed in many experimental studies [89]:
• Quick relative displacements observed at low speeds of mutual sliding of surfaces disappear withincreasing speed;
• The amplitude and frequency of the separate displacements depend on the sliding speed, the massof the moving body and the rigidity of the system;
• The first displacement of contacted bodies is much larger than the subsequent ones.
The appearance of abrupt displacements is explained either by the presence of a negative (falling)section of the friction force (moment) characteristic by sliding velocity or by an increase in the staticfriction force, which depends on the duration of the motionless contact.
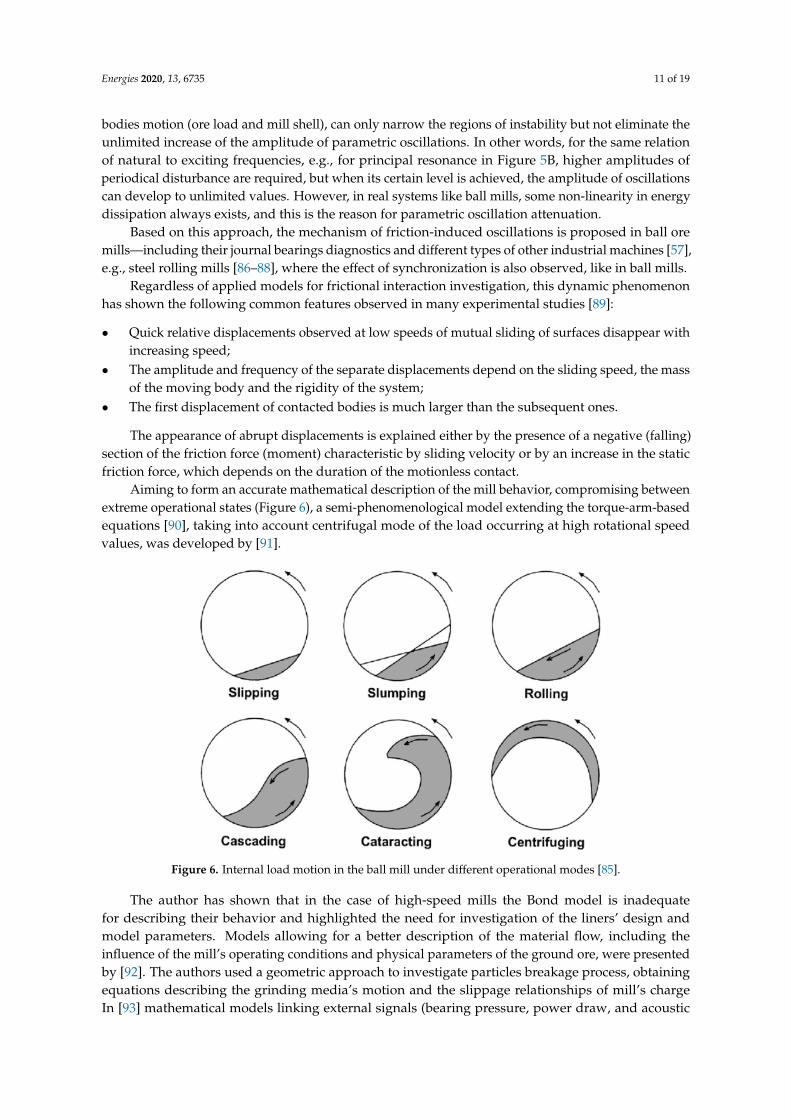
Aiming to form an accurate mathematical description of the mill behavior, compromising betweenextreme operational states (Figure 6), a semi-phenomenological model extending the torque-arm-basedequations [90], taking into account centrifugal mode of the load occurring at high rotational speedvalues, was developed by [91].
Figure 6. Internal load motion in the ball mill under different operational modes [85].
The author has shown that in the case of high-speed mills the Bond model is inadequatefor describing their behavior and highlighted the need for investigation of the liners’ design andmodel parameters. Models allowing for a better description of the material flow, including theinfluence of the mill’s operating conditions and physical parameters of the ground ore, were presentedby [92]. The authors used a geometric approach to investigate particles breakage process, obtainingequations describing the grinding media’s motion and the slippage relationships of mill’s chargeIn [93] mathematical models linking external signals (bearing pressure, power draw, and acoustic
Energies 2020, 13, 6735 12 of 19
emission) with internal parameters of the mill, that can be utilized for optimization of the comminutionprocess were presented.
A specific energy model and power consumption mathematical models derived with the useof the operational data from 4 industrial grinding circuits in Chilean Cu beneficiation plants wereproposed by [94]. Despite having the potential to be used for predictive optimization of comminutionprocesses, the model—referring to the authors’ words—can be useful for the SAG mills’ designpurposes. In addition to the standard design variables (size of the mills, grinding media chargelevel, the concentration of solids in feed, rotation speed—expressed as a percentage of critical speed),an additional granulometric variable was included to account for PSD.
4.2. Discrete Element Method
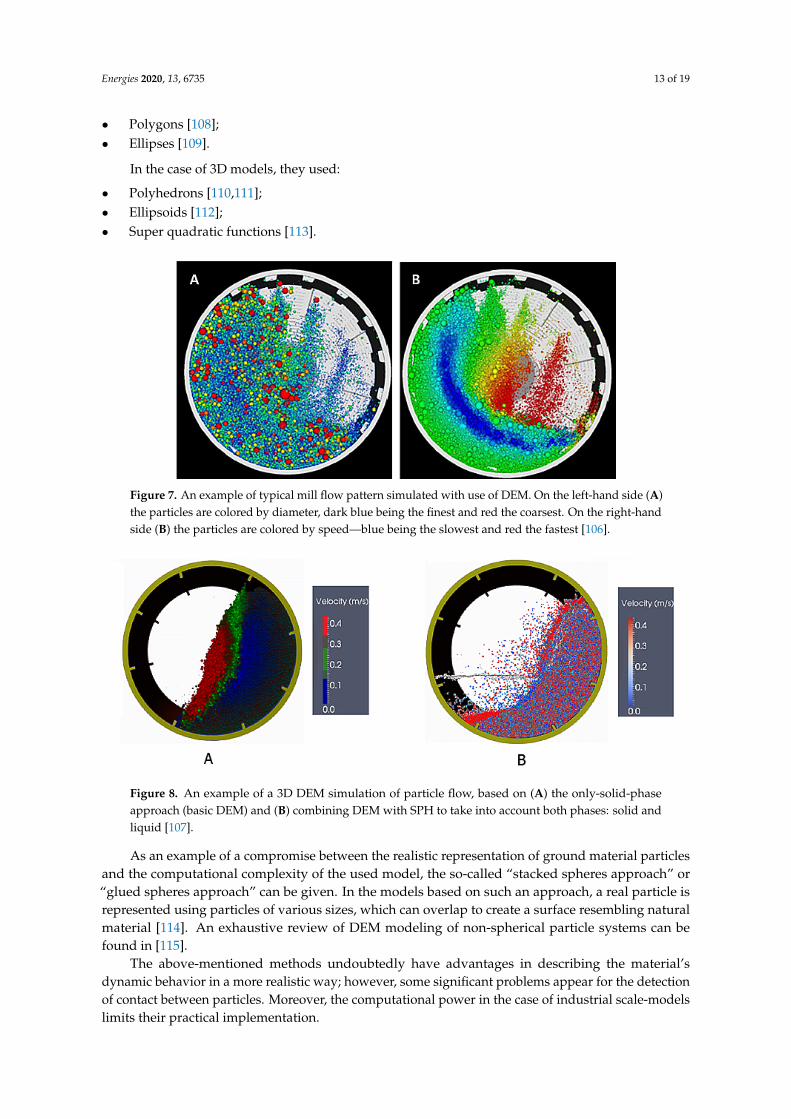
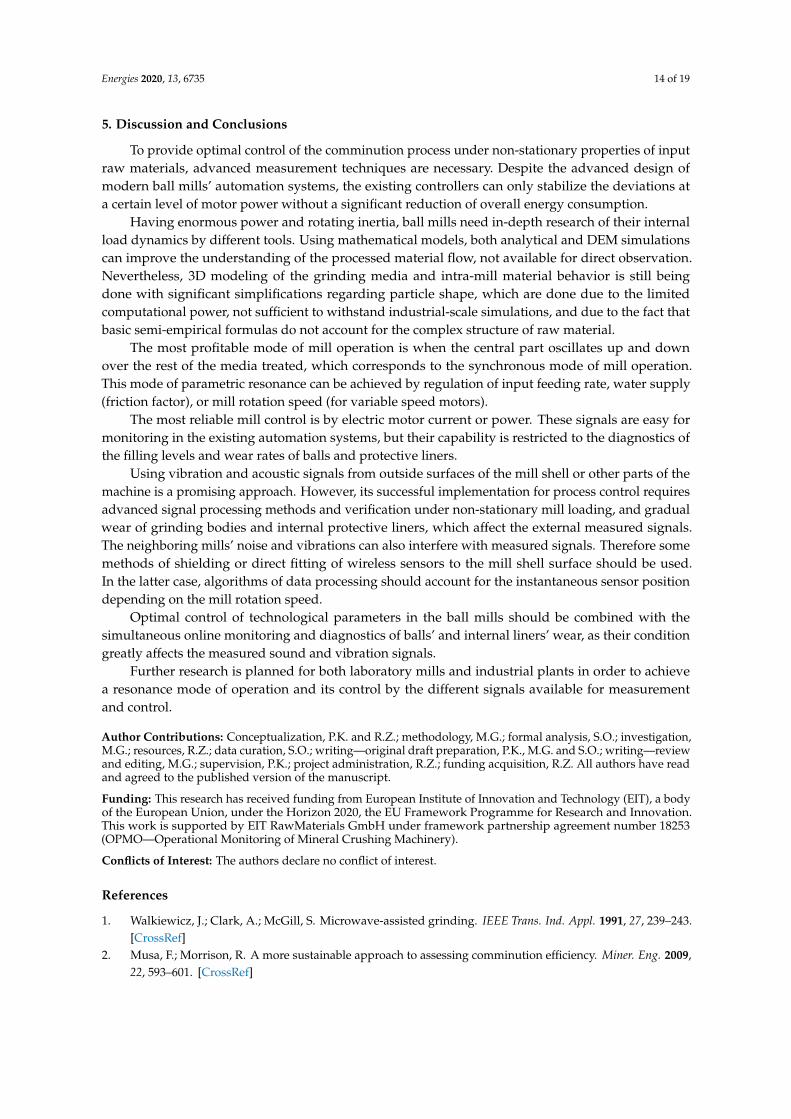
The recent rapid increase of computational power allowed researchers and technicians touse numerical methods that reflect the granular nature of the feed better, applying discontinuoussimulations. The most widely utilized technique of such type is a discrete element method (DEM) [95].Discrete numerical models were already found to be valid for the study of granular assemblies’dynamics in 1979 [96]; however, for more than a decade DEM’s practical applications remainedrestrained to 2D analyses because even when the problem was simplified to two dimensions, it stilltook “hours of super-computer time” to solve it [97]. Despite the fact that the computational abilities ofthat day’s supercomputers were incomparable even to those of current smartphone devices, the authorsof [98] have already managed to obtain some valuable information about the energy distribution,which occurs when ball-shape-represented particles collide. In a further study, the same authors founda potential of DEM to be employed for predictions of a real mill’s power draw [97]. The method waslater extended to three-dimensions and applied to assess the mill’s power draw in a broad range ofworking conditions. Moreover, it could correctly model the motion of grinding media, what wasconfirmed by comparison with mill power consumption’s torque-based measurement and with videorecordings of the charge’s behavior [99]. In [100] previously developed models were compared, toshow their usefulness in describing different issues related to the charge movement. The modelproposed in [101] was presented as an appropriate one for the definition of charge’s outer boundarybehavior [102]—was found a valuable contribution, properly describing the movement of individualballs, whereas the advantage of the one presented in [103] was the ability of a quick charge profile’scomputation. In [104] some constructive criticism about the definitions of significant parametersdescribing the behavior of intra-mill material has appeared. What is more, the authors presented how,and with which parameters as an input, the severity and incidence of impacting can be calculated,which is undoubtedly valuable from the mill’s design point of view. In a work devoted to the modelingof mill’s power draw with use of 3D discrete element method [105], the author proposes a methodfor decreasing the computational demand by assigning the mass of finer fractions, which requireshorter timesteps, to the next coarser fraction classes. In this way, due to the increased timestep of thecalculation, its speed was successfully reduced, allowing the modeling of the power consumption withthe use of DEM—similarly accurately as in the case of empirical models however with higher flexibility.Another important contribution to the development of DEM as a tool for optimization and descriptionof the comminution process in ball mills was the introduction of Smoothed Particle Hydrodynamics(SPH) [106,107]. It significantly improved the modeling of mill charge’s dynamic behavior, enablingadditional predictions related to the fluid slurry flow, as a result providing more realistic simulations.Examples of such simulations are presented in Figures 7 and 8 below.
There is a significant simplification used in DEM modeling, however, which is the representationof intra-mill material in the form of spheres. Most of the raw materials subjected to comminutioncomprise irregular particles, the interactions of which can not be accurately described when they arenot represented with realistic, complex shapes. Some researchers extended DEM models, replacingcircular particle representations in 2D with:
Energies 2020, 13, 6735 13 of 19
• Polygons [108];• Ellipses [109].
In the case of 3D models, they used:
• Polyhedrons [110,111];• Ellipsoids [112];• Super quadratic functions [113].
Figure 7. An example of typical mill flow pattern simulated with use of DEM. On the left-hand side (A)the particles are colored by diameter, dark blue being the finest and red the coarsest. On the right-handside (B) the particles are colored by speed—blue being the slowest and red the fastest [106].
Figure 8. An example of a 3D DEM simulation of particle flow, based on (A) the only-solid-phaseapproach (basic DEM) and (B) combining DEM with SPH to take into account both phases: solid andliquid [107].
As an example of a compromise between the realistic representation of ground material particlesand the computational complexity of the used model, the so-called “stacked spheres approach” or“glued spheres approach” can be given. In the models based on such an approach, a real particle isrepresented using particles of various sizes, which can overlap to create a surface resembling naturalmaterial [114]. An exhaustive review of DEM modeling of non-spherical particle systems can befound in [115].
The above-mentioned methods undoubtedly have advantages in describing the material’sdynamic behavior in a more realistic way; however, some significant problems appear for the detectionof contact between particles. Moreover, the computational power in the case of industrial scale-modelslimits their practical implementation.
Energies 2020, 13, 6735 14 of 19
5. Discussion and Conclusions
To provide optimal control of the comminution process under non-stationary properties of inputraw materials, advanced measurement techniques are necessary. Despite the advanced design ofmodern ball mills’ automation systems, the existing controllers can only stabilize the deviations ata certain level of motor power without a significant reduction of overall energy consumption.
Having enormous power and rotating inertia, ball mills need in-depth research of their internalload dynamics by different tools. Using mathematical models, both analytical and DEM simulationscan improve the understanding of the processed material flow, not available for direct observation.Nevertheless, 3D modeling of the grinding media and intra-mill material behavior is still beingdone with significant simplifications regarding particle shape, which are done due to the limitedcomputational power, not sufficient to withstand industrial-scale simulations, and due to the fact thatbasic semi-empirical formulas do not account for the complex structure of raw material.
The most profitable mode of mill operation is when the central part oscillates up and downover the rest of the media treated, which corresponds to the synchronous mode of mill operation.This mode of parametric resonance can be achieved by regulation of input feeding rate, water supply(friction factor), or mill rotation speed (for variable speed motors).
The most reliable mill control is by electric motor current or power. These signals are easy formonitoring in the existing automation systems, but their capability is restricted to the diagnostics ofthe filling levels and wear rates of balls and protective liners.
Using vibration and acoustic signals from outside surfaces of the mill shell or other parts of themachine is a promising approach. However, its successful implementation for process control requiresadvanced signal processing methods and verification under non-stationary mill loading, and gradualwear of grinding bodies and internal protective liners, which affect the external measured signals.The neighboring mills’ noise and vibrations can also interfere with measured signals. Therefore somemethods of shielding or direct fitting of wireless sensors to the mill shell surface should be used.In the latter case, algorithms of data processing should account for the instantaneous sensor positiondepending on the mill rotation speed.
Optimal control of technological parameters in the ball mills should be combined with thesimultaneous online monitoring and diagnostics of balls’ and internal liners’ wear, as their conditiongreatly affects the measured sound and vibration signals.
Further research is planned for both laboratory mills and industrial plants in order to achievea resonance mode of operation and its control by the different signals available for measurementand control.
Author Contributions: Conceptualization, P.K. and R.Z.; methodology, M.G.; formal analysis, S.O.; investigation,M.G.; resources, R.Z.; data curation, S.O.; writing—original draft preparation, P.K., M.G. and S.O.; writing—reviewand editing, M.G.; supervision, P.K.; project administration, R.Z.; funding acquisition, R.Z. All authors have readand agreed to the published version of the manuscript.
Funding: This research has received funding from European Institute of Innovation and Technology (EIT), a bodyof the European Union, under the Horizon 2020, the EU Framework Programme for Research and Innovation.This work is supported by EIT RawMaterials GmbH under framework partnership agreement number 18253(OPMO—Operational Monitoring of Mineral Crushing Machinery).
Conflicts of Interest: The authors declare no conflict of interest.
References
1. Walkiewicz, J.; Clark, A.; McGill, S. Microwave-assisted grinding. IEEE Trans. Ind. Appl. 1991, 27, 239–243.[CrossRef]
2. Musa, F.; Morrison, R. A more sustainable approach to assessing comminution efficiency. Miner. Eng. 2009,22, 593–601. [CrossRef]
Energies 2020, 13, 6735 15 of 19
3. BCS Incoprorated for the U.S. Department of Energy: U.S. Mining Industry Energy Bandwidth Study.Available online: https://www.energy.gov/sites/prod/files/2013/11/f4/mining_bandwidth.pdf (accessedon 5 December 2020).
4. Jeswiet, J.; Szekeres, A. Energy consumption in mining comminution. Procedia CIRP 2016, 48, 140–145.[CrossRef]
5. Fuerstenau, D.; Abouzeid, A.Z. The energy efficiency of ball milling in comminution. Int. J. Miner. Process.2002, 67, 161–185. [CrossRef]
6. Mular, A. Mineral Processing Plant Design, Practice, and Control Proceedings; Society for Mining, Metallurgy,and Exploration: New York, NY, USA, 2002.
7. Chelgani, S.C.; Parian, M.; Parapari, P.S.; Ghorbani, Y.; Rosenkranz, J. A comparative study on the effects ofdry and wet grinding on mineral flotation separation—A review. J. Mater. Res. Technol. 2019, 8, 5004–5011.[CrossRef]
8. Wang, Y.; Forssberg, E. Enhancement of energy efficiency for mechanical production of fine and ultra-fineparticles in comminution. China Particuol. 2007, 5, 193–201. [CrossRef]
9. Wills, B.A.; Napier-Munn, T. Comminution. In Wills’ Mineral Processing Technology; Butterworth-Heinemann:Oxford, UK, 2005; Chapter 5, pp. 108–117. [CrossRef]
10. Sosa-Blanco, C.; Hodouin, D.; Bazin, C.; Lara-Valenzuela, C.; Salazar, J. Economic optimization of a flotationplant through grinding circuit tuning. Miner. Eng. 2000, 13, 999–1018. [CrossRef]
11. Gao, P.; Zhou, W.; Han, Y.; Li, Y.; Ren, W. Enhancing the capacity of large-scale ball mill through process andequipment optimization: An industrial test verification. Adv. Powder Technol. 2020, 31, 2079–2091. [CrossRef]
12. Nagar, N.; Garg, H.; Sharma, H.; Angadi, S.; Gahan, C. Influence of Grinding Time on The Bioleaching ofCopper from Copper Slag. Biosci. Biotechnol. Res. Commun. 2019, 12, 512–522. [CrossRef]
13. Jonsen, P.; Palsson, B.; Haggblad, H.A.; Tano, K.; Berggren, A. Simulation of charge and structure behaviourin a tumbling mill. In Proceedings of the European LS-DYNA Users Conference, Strasbourg, France,23–24 May 2011.
14. Astrom, K.; Wittenmark, B. Computer-Controlled Systems: Theory and Design; Prentice Hall: Upper Saddle River,NJ, USA, 1997.
15. Craig, I. Grinding mill modeling and control: Past, present and future. In Proceedings of the 31st ChineseControl Conference, Anchui, China, 25–27 July 2012; pp. 16–21.
16. Campbell, J.; Spencer, S.; Sutherland, D.; Rowlands, T.; Weller, K.; Cleary, P.; Hinde, A. SAG millmonitoring using surface vibrations. In Proceedings of the Third International Conference on Autogenousand Semiautogenous Grinding Technology (SAG2001), Vancouver, BC, Canada, 30 September–3 October2001; Volume 2, pp. 373–385.
17. Su, Z.; Wang, P.; Yu, X.; Lv, Z. Experimental investigation of vibration signal of an industrial tubular ball mill:Monitoring and diagnosing. Miner. Eng. 2008, 21, 699–710. [CrossRef]
18. Bai, R.; Chai, T. Optimization control of ball mill load in blending process with data fusion and case-basedreasoning. Huagong Xuebao/CIESC J. 2009, 60, 1746–1752.
19. Tang, J.; Chai, T.; Zhao, L.; Yu, W.; Yue, H. Soft sensor for parameters of mill load based on multi-spectralsegments PLS sub-models and on-line adaptive weighted fusion algorithm. Neurocomputing 2012, 78, 38–47.[CrossRef]
20. Tang, J.; Zhao, L.; Yu, W.; Yue, H.; Chai, T. Soft Sensor Modeling of Ball Mill Load via Principal ComponentAnalysis and Support Vector Machines. In Lecture Notes in Electrical Engineering; Springer: Berlin, Germany,2010; pp. 803–810. [CrossRef]
21. Tang, J.; Zhao, L.-j.; Zhou, J.-w.; Yue, H.; Chai, T.-y. Experimental analysis of wet mill load based on vibrationsignals of laboratory-scale ball mill shell. Miner. Eng. 2010, 23, 720–730. [CrossRef]
22. Tang, J.; Zhao, L.; Yue, H.; Yu, W.; Chai, T. Vibration Analysis Based on Empirical Mode Decomposition andPartial Least Square. Procedia Eng. 2011, 16, 646–652. [CrossRef]
23. Das, S.P.; Das, D.P.; Behera, S.K.; Mishra, B.K. Interpretation of mill vibration signal via wireless sensing.Miner. Eng. 2011, 24, 245–251. [CrossRef]
24. Tang, J.; Chai, T.; Yu, W.; Zhao, L. Modeling Load Parameters of Ball Mill in Grinding Process Based onSelective Ensemble Multisensor Information. IEEE Trans. Autom. Sci. Eng. 2013, 10, 726–740. [CrossRef]
Energies 2020, 13, 6735 16 of 19
25. Mohanty, S.; Gupta, K.K.; Raju, K.S. Vibration Feature Extraction and Analysis of Industrial Ball Mill UsingMEMS Accelerometer Sensor and Synchronized Data Analysis Technique. Procedia Comput. Sci. 2015,58, 217–224. [CrossRef]
26. Nayak, D.K.; Das, D.P.; Behera, S.K.; Das, S.P. Monitoring the fill level of a ball mill using vibration sensingand artificial neural network. Neural Comput. Appl. 2019, 32, 1501–1511. [CrossRef]
27. Behera, B.; Mishra, B.; Murty, C. Experimental analysis of charge dynamics in tumbling mills by vibrationsignature technique. Miner. Eng. 2007, 20, 84–91. [CrossRef]
28. Cho, K.S.; Kim, S.H.; Lee, Y.H. Correlation between Acoustic Intensity and Ground Particle Size in AluminaBall Mill Process. J. Korean Ceram. Soc. 2018, 55, 275–284. [CrossRef]
29. Aldrich, C.; Theron, D. Acoustic estimation of the particle size distributions of sulphide ores in a laboratoryball mill. J. S. Afr. Inst. Min. Metall. 2000, 100, 243–248.
30. Pax, R.; Djordjevic, N.; Hocking, R. Non contact acoustics measurement and validation of SAG milloperation. In Proceedings of the XXII International Mineral Processing Congress, Cape Town, South Africa,29 September–3 October 2003; SAIMM: Cape Town, South Africa, 2003; Volume 1, pp. 371–377.
31. Wu, D.; Chen, W.; Yan, H.; Fischer, J.; Doolan, C. Identifying grinding mill dynamics using acoustic beamformingand numerical modelling. Powder Technol. 2020, 371, 231–243. [CrossRef]
32. Zeng, Y.; Forssberg, E. Monitoring grinding parameters by signal measurements for an industrial ball mill.Int. J. Miner. Process. 1993, 40, 1–16. [CrossRef]
33. Tang, J.; Liu, Z.; Wu, Y.J.; Zhao, L.J. Modeling Difficult-to-Measure Process Parameters Based on IntrinsicMode Functions Frequency Spectral Features of Mechanical Vibration and Acoustical Signals. Adv. Mater. Res.2014, 989–994, 3671–3674. [CrossRef]
34. Tang, J.; Yu, W.; Chai, T.; Liu, Z.; Zhou, X. Selective ensemble modeling load parameters of ball mill based onmulti-scale frequency spectral features and sphere criterion. Mech. Syst. Signal Process. 2016, 66–67, 485–504.[CrossRef]
35. Tang, J.; Chai, T.; Yu, W.; Liu, Z.; Zhou, X. A Comparative Study That Measures Ball Mill Load ParametersThrough Different Single-Scale and Multiscale Frequency Spectra-Based Approaches. IEEE Trans. Ind. Inform.2016, 12, 2008–2019. [CrossRef]
36. Tang, J.; Qiao, J.; Liu, Z.; Zhou, X.; Yu, G.; Zhao, J. Mechanism characteristic analysis and soft measuringmethod review for ball mill load based on mechanical vibration and acoustic signals in the grinding process.Miner. Eng. 2018, 128, 294–311. [CrossRef]
37. Kolacz, J. Measurement system of the mill charge in grinding ball mill circuits. Miner. Eng. 1997, 10,1329–1338. [CrossRef]
38. Morrell, S. Power Draw of Grinding Mills—Its measurements and Prediction. In Proceedings of the 5th MillOperators Conference, Roxby Downs, Australia, 16–20 October 1994.
39. Melero, M.; Cano, J.; Norniella, J.; Pedrayes, F.; Cabanas, M.; Rojas, C.; Alonso, G.; Aguado, J.M.; Ardura, P.Electric motors monitoring: An alternative to increase the efficiency of ball mills. Renew. Energy Power Qual. J2014, 849–854. [CrossRef]
40. Pontt, J. MONSAG: A new monitoring system for measuring the load filling of a SAG mill. Miner. Eng. 2004,17, 1143–1148. [CrossRef]
41. Cleary, P. Predicting charge motion, power draw, segregation and wear in ball mills using discreteelement methods. Miner. Eng. 1998, 11, 1061–1080. [CrossRef]
42. Esteves, P.M.; Stopa, M.M.; Filho, B.J.C.; Galery, R. Charge behavior analysis in ball mill by using estimatedtorque. In Proceedings of the 2014 IEEE Industry Application Society Annual Meeting, Vancouver, BC,Canada, 5–9 October 2014. [CrossRef]
43. Campbell, J.; Holmes, R.; Spencer, S.; Sharp, V.; Davey, K.; Barker, D.; Phillips, P. The collection and analysisof single sensor surface vibration data to estimate operating conditions in pilot-scale and production-scaleAG/SAG mills. In Proceedings of the XXII International Mineral Processing Congress, Cape Town,South Africa, 29 September–3 October 2003; pp. 280–288.
44. Martins, S.; Li, W.; Radziszewski, P.; Caron, S. Investigating the differences in charge dynamics due to a variationof the instrumented ball properties. IFAC Proc. Vol. 2007, 12, 463–468. [CrossRef]
45. Martins, S.; Li, W.; Radziszewski, P.; Caron, S.; Aguanno, M.; Bakhos, M.; Petch, E.L. Validating the instrumentedball outputs with simple trajectories. Miner. Eng. 2008, 21, 782–788. [CrossRef]
Energies 2020, 13, 6735 17 of 19
46. Martins, S.; Li, W.; Radziszewski, P.; Faucher, A.; Makni, S. Experimental and simulated instrumented ball ina tumbling mill—A comparison. Miner. Eng. 2013, 43–44, 79–84. [CrossRef]
47. Coetzee, L. Stabilising and optimising a primary closed-loop milling circuit feeding a flotation circuit usingStarCS RNMPC. In Proceedings of the 19th IFAC World Congress on International Federation of AutomaticControll Congress, Cape Town, South Africa, 24–29 August 2014; Volume 47, pp. 9786–9791. [CrossRef]
48. Coetzee, L.; Ramonotsi, M. Applying StarCS RNMPC with Real-Time Optimiser to Pilanesberg PlatinumMines Primary UG2 Milling Circuit. IFAC-PapersOnLine 2016, 49, 78–83. [CrossRef]
49. Outotec. Outotec Automation Solutions for Grinding Optimization. Available online: https://www.outotec.com/globalassets/products/analyzers-and-automation/ote_act_grinding_optimization_eng.pdf (accessedon 5 November 2020).
50. FLSmidth. Maximize Grinding Efficiency with LoadIQ. Available online: https://www.kscape.com/loadiq(accessed on 5 November 2020).
51. Thwaites, P. Developments in Process Control—Grinding Controls. 2015. Available online: https://xps.ca/files/31/Presentations/131/Developments-in-Process-Control---Grinding-Controls-by-P-Thwaites.pdf(accessed on 5 November 2020).
52. AMEplus. MillVis: System for the Optimization of the Grinding Process Control. Available online: https://www.ameplus.pl/tag/millvis/ (accessed on 5 November 2020).
53. Chai, T.; Ding, J. Integrated automation system for hematite ores processing and its applications. Meas. Control2006, 39, 140–146.
54. Kuzba, B.; Pawlos, W.; Konieczny, A.; Krzeminska, M. Optimisation Platform for copper ore processingat the Division of Concentrator of KGHM Polska Miedz SA. In Proceedings of the E3S Web of Conferences;EDP Sciences: Les Ulis, France, 2016; Volume 8, p. 01037.
55. Zhou, P.; Chai, T.; Wang, H. Intelligent Optimal-Setting Control for Grinding Circuits of MineralProcessing Process. IEEE Trans. Autom. Sci. Eng. 2009, 6, 730–743. [CrossRef]
56. Deineka, K.; Naumenko, Y. Revealing the effect of decreased energy intensity of grinding in a tumbling millduring selfexcitation of autooscillations of the intrachamber fill. Eastern-Eur. J. Enterp. Technol. 2019, 1, 6–15.[CrossRef]
57. Maryuta, A. Frictional Oscillations in Mechanical Systems; Nedra: Moscow, Russia, 1993; p. 240.58. Naumenko, Y. Fundamentals of the Theory of Working Processes of Drum Mills; NUVGP: Rivne, Ukraine, 2014; p. 336.59. Deineka, K.; Naumenko, Y. Establishing the effect of a decrease in power intensity of self-oscillating grinding
in a tumbling mill with a reduction in an intrachamber fill. Eastern-Eur. J. Enterp. Technol. 2019, 6, 43–52.[CrossRef]
60. Alekseyev, M.; Alkhori, F. Automated control of ore-pebble mill charge by the signal of active power ofmagnetic separator electric motor. Sci. Bull. Natl. Min. Univ. Ukraine 2014, 3, 71–76.
61. Atutxa, I.; Legarra, I. Stepping forward: Using variable speed drives for optimizing the grinding processin SAG and ball mills. In Proceedings of the Sixth International Conference on Semi-Autogenous HighPressure Grinding Technology, Vancouver, BC, Canada, 20–24 September 2015.
62. Smotritskiy, A.; Smotritskiy, A.; Boriskov, F.; Chervyakov, S. Method for Grinding Materials in RotatingDrum Using Ferromagnetic Grinding Bodies. EU Patent EP3020483B1, 8 July 2013.
63. Vertimill. Metso Mining. Available online: https://www.metso.com/products/grinding-mills/stirred-mills/vertimill/ (accessed on 5 November 2020).
64. Isamill. Glencore Technology. Available online: https://www.isamill.com/en/downloads/Brochures/IsaMillBrochure.pdf (accessed on 5 November 2020).
65. Krot, P. Telemetering systems for monitoring dynamic loads in drive lines of rolling mills. Vib. Mach. Meas.Reduct. Prot. 2008, 1, 46–53.
66. Krot, P. Methods and instrumentation for measuring wear in drivelines of rolling mills. Metall. Process. Equip.2003, 2, 45–53.
67. Krot, P. Dynamics and diagnostics of the rolling mills drivelines with non-smooth stiffness characteristics.In Proceedings of the 3rd International Conference of Nonlinear Dynamic (ND-KhPI2010), Kharkov, Ukraine,21–24 September 2012; pp. 115–120.
68. Tang, J.; Chai, T.Y.; Cong, Q.M.; Liu, Z.; Yu, W. Modeling mill load parameters based on selective fusionof multi-scale shell vibration frequency spectra. Kongzhi Lilun Yu Yingyong/Control Theory Appl. 2015,32, 1582–1591. [CrossRef]
Energies 2020, 13, 6735 18 of 19
69. Meshcheryakov, L. Recognition of the operational state of the lining of drum mill. Sci. Bull. Natl. Min.Univ. Ukraine 2018, 53, 200–213.
70. Vinogradov, B. Dynamics of Tumbling Mills; Economic Herald of State Higher Educational Institution, USUCT:Dnipro, Ukraine, 2004.
71. Vinogradov, B.; Khristenko, A. The forced vibrations are in twin-engine synchronous drives of ball mills.Sci. Bull. Natl. Min. Univ. Ukraine 2012, 6, 72–76.
72. Krot, P.V. Dynamical processes in a multi-motor gear drive of heavy slabbing mill. J. Vibroeng. 2019,21, 2064–2081. [CrossRef]
73. Borodai, V.; Borovyk, R.; Nesterova, O. Efficient transient modes of synchronous drive for mining andsmelting mechanisms. Mech. Mater. Sci. Eng. J. 2017, 8. [CrossRef]
74. Putnoki, A.; Klevtsov, O.; Ermolenko, A.; Verenev, V.; Krot, P. Evaluation of operation of equipment at therolling mill. Stal 2003, 10, 56–58.
75. Maryuta, A.; Kovalenko, A.; Meshcheryakov, L. Method for Determining Wear of Shaped Linings inGrinding Aggregate. Patent SU709173, 15 January 1980.
76. Beke, B. The Process of Fine Grinding, 1st ed.; Springer: Dordrecht, The Netherlands, 1981; Volume 1.[CrossRef]
77. Nussbaumer, H.J. Fast Fourier Transform and Convolution Algorithms; Springer: Berlin, Germany, 1982.[CrossRef]
78. Konieczny, A.; Ogonowski, S.; Kurzydlo, M.; Foszcz, D. Vision systems in O/ZWR as a support toolfor production management and optimization. In Proceedings of the Mineral Engineering Conference(MEC2014), Istebna, Poland, 15–18 September 2014.
79. Thomas, A.; Filippov, L. Fractures, fractals and breakage energy of mineral particles. Int. J. Miner. Process.1999, 57, 285–301. [CrossRef]
80. Naziemiec, Z.; Saramak, D. Analiza energochłonnosci procesów rozdrabniania kruszyw mineralnych.Prace Naukowe Instytutu Górnictwa Politechniki Wrocławskiej. Studia i Materiały 2012, 134, 209–220.
81. Weidenbaum, S.S. Mixing of solids. In Advances in Chemical Engineering; Elsevier: Amsterdam,The Netherlands, 1958; Volume 2, pp. 209–324.
82. Heim, A.; Gluba, T.; Obraniak, A. Bed dynamics during drum granulation. Fizykochemiczne ProblemyMineralurgii/Physicochem. Probl. Miner. Process. 2004, 38, 167–176.
83. Maryuta, A.N. Analysis of motion of mechanical systems with frictional interaction. Sov. Appl. Mech. 1989,25, 1031–1040. [CrossRef]
84. Butikov, E.I. Analytical expressions for stability regions in the Ince–Strutt diagram of Mathieu equation.Am. J. Phys. 2018, 86, 257–267. [CrossRef]
85. Mardiansyah, Y.; Khotimah, S.; Viridi, S. Characterization of motion modes of pseudo-two dimensionalgranular materials in a vertical rotating drum. J. Phys. Conf. Ser. 2016, 739, 012148. [CrossRef]
86. Marjuta, A.; Krot, P. High frequency rolling mills chatter–mathematical identification and simulation.In Proceedings of the 1st International Symposium on “Multi-Body Dynamics Monitoring and SimulationTechniques”, Bradford, UK, 25–27 March 1997; pp. 407–419.
87. Krot, P. Parametrical vibrations in the rolling mills. Collect. Sci. Pap. Natl. Min. Acad. Ukraine 2002, 3, 15–21.88. Krot, P. Investigation of ’ribbing’ defect and high-frequency oscillations of mills for strip cold rolling.
Proizvod. Prokata 2002, 3, 21–23.89. Kragelsky, I.; Dobychin, M.; Kombalov, V. Friction and Wear: Calculation Methods; Pergamon Press: Oxford,
UK, 1982; p. 474.90. Arbiter, N.; Harris, C. Scale-up and dynamics of large grinding mills-a case study. In Design and Installation
of Comminution Circuits; AIME: New York, NY, USA, 1982; pp. 491–508.91. Moys, M. A model of mill power as affected by mill speed, load volume, and liner design. J. S. Afr. Inst.
Min. Metall. 1993, 93, 135–141.92. Abou, S.C.; Tarasiewicz, S.; Remy, M. Mathematical modelling of ball mill charge slippage: Geometric
approach. In Proceedings of the 4e Conférence International sur l’Automatisation Industrielle, Montréal,QC, Canada, 9–11 June 2003; CIAI: Montreal, QC, Canada, 2003. [CrossRef]
93. Wang, Z.H.; Han, Y.X.; Chen, B.C. A Mathematical Model for Predicting the Internal Parameters of Ball Mill.Adv. Mater. Res. 2012, 454, 151–156. [CrossRef]
Energies 2020, 13, 6735 19 of 19
94. Silva, M.; Casali, A. Modelling SAG milling power and specific energy consumption including the feedpercentage of intermediate size particles. Miner. Eng. 2015, 70, 156–161. [CrossRef]
95. Kozicki, J.; Donze, F. YADE-OPEN DEM: An opensource software using a discrete element method tosimulate granular material. Eng. Comput. 2008, 26. [CrossRef]
96. Cundall, P.A.; Strack, O.D.L. A discrete numerical model for granular assemblies. Géotechnique 1979, 29, 47–65.[CrossRef]
97. Mishra, B.; Rajamani, R.K. The discrete element method for the simulation of ball mills. Appl. Math. Model.1992, 16, 598–604. [CrossRef]
98. Mishra, B.K.; Rajamani, R.K. Motion Analysis in Tumbling Mills by the Discrete Element Method.KONA Powder Part. J. 1990, 8, 92–98. [CrossRef]
99. Agrawala, S.; Rajamani, R.; Songfack, P.; Mishra, B. Mechanics of media motion in tumbling mills with 3ddiscrete element method. Miner. Eng. 1997, 10, 215–227. [CrossRef]
100. Radiszewski, P. Comparing three DEM charge motion models. Miner. Eng. 1999, 12, 1501–1520. [CrossRef]101. Powell, M.; Nurick, G. A study of charge motion in rotary mills Part 1—Extension of the theory. Miner. Eng.
1996, 9, 259–268. [CrossRef]102. Mishra, B.; Rajamai, R.K. Simulation of charge motion in ball mills. Part 2: Numerical simulations. Int. J.
Miner. Process. 1994, 40, 187–197. [CrossRef]103. Radziszewski, P.; Tarasiewicz, S. Ballmill simulation: Part II—Numerical solution to ballcharge model.
Trans. Soc. Comput. Simul. 1989, 6, 75–88.104. Powell, M.; McBride, A. A three-dimensional analysis of media motion and grinding regions in mills.
Miner. Eng. 2004, 17, 1099–1109. [CrossRef]105. Djordjevic, N. Influence of charge size distribution on net-power draw of tumbling mill based on DEM
modelling. Miner. Eng. 2005, 18, 375–378. [CrossRef]106. Cleary, P.W.; Morrison, R.D. Prediction of 3D slurry flow within the grinding chamber and discharge from a
pilot scale SAG mill. Miner. Eng. 2012, 39, 184–195. [CrossRef]107. Jahani Chegeni, M. Combined DEM and SPH simulation of ball milling. J. Min. Environ. 2019, 10, 151–161.
[CrossRef]108. Walton, O. Particle-Dynamics Calculations of Shear Flow. In Mechanics of Granular Materials—New Models
and Constitutive Relations; Elsevier: Amsterdam, The Netherlands, 1983; pp. 327–338. [CrossRef]109. Ting, J.M.; Khwaja, M.; Meachum, L.R.; Rowell, J.D. An ellipse-based discrete element model for granular
materials. Int. J. Numer. Anal. Methods Geomech. 1993, 17, 603–623. [CrossRef]110. Cundall, P. Formulation of a three-dimensional distinct element model—Part I. A scheme to detect
and represent contacts in a system composed of many polyhedral blocks. Int. J. Rock Mech. Min. Sci.Geomech. Abstr. 1988, 25, 107–116. [CrossRef]
111. Hocking, G. The discrete element method for analysis of fragmentation of discontinua. Eng. Comput. 1992,9, 145–155. [CrossRef]
112. Lin, X.; Ng, T.T. A three-dimensional discrete element model using arrays of ellipsoids. Geotechnique 1997,47, 319–329. [CrossRef]
113. Williams, J.R.; Pentland, A.P. Superquadrics and modal dynamics for discrete elements in interactive design.Eng. Comput. 1992, 9, 115–127. [CrossRef]
114. Favier, J.; Fard, M.; Kremmer, M.; Raji, A. Shape representation of axi-symmetrical, non-spherical particles indiscrete element simulation using multi-element model particles. Eng. Comput. Int. J. Comput.-Aided Eng.1999, 16, 467–480. [CrossRef]
115. Zhong, W.; Yu, A.; Liu, X.; Tong, Z.; Zhang, H. DEM/CFD-DEM modelling of non-spherical particulatesystems: Theoretical developments and applications. Powder Technol. 2016, 302, 108–152. [CrossRef]
Publisher’s Note: MDPI stays neutral with regard to jurisdictional claims in published maps and institutionalaffiliations.
c© 2020 by the authors. Licensee MDPI, Basel, Switzerland. This article is an open accessarticle distributed under the terms and conditions of the Creative Commons Attribution(CC BY) license (http://creativecommons.org/licenses/by/4.0/).
Related Documents