Moving Upward and Onward: Income Mobility at Historically Black Colleges and Universities Robert A. Nathenson, Consortium for Policy Research in Education, University of Pennsylvania Graduate School of Education Andrés Castro Samayoa, Boston College Marybeth Gasman, Rutgers University–New Brunswick Samuel DeWitt Proctor Institute for Leadership, Equity & Justice

Welcome message from author
This document is posted to help you gain knowledge. Please leave a comment to let me know what you think about it! Share it to your friends and learn new things together.
Transcript

Moving Upward and Onward: Income Mobility at
Historically Black Colleges and Universities
Robert A. Nathenson, Consortium for Policy Research in Education, University of Pennsylvania Graduate School of Education
Andrés Castro Samayoa, Boston College
Marybeth Gasman, Rutgers University–New BrunswickSamuel DeWitt Proctor Institute for Leadership, Equity & Justice
“Over the past few years, a number of researchers have begun to seriously look at mobility, specifically, those colleges and universities that are pathways to people from modest means to achieve the American dream. These studies have highlighted the awesome work of America’s HBCUs, a sector where over two-thirds of students are Pell Grant eligible, but as a sector has been able to achieve the greatest results in terms of mobility to the middle class and beyond. Dillard University has played a significant role in this work, always enrolling a high number of low-income students yet creating a campus culture, which supports them not only through college but leads them on a path to a new level of prosperity for their families.” – Walter Kimbrough, President, Dillard University
Moving Upward and Onward: Income Mobility at Historically Black Colleges and Universities 2
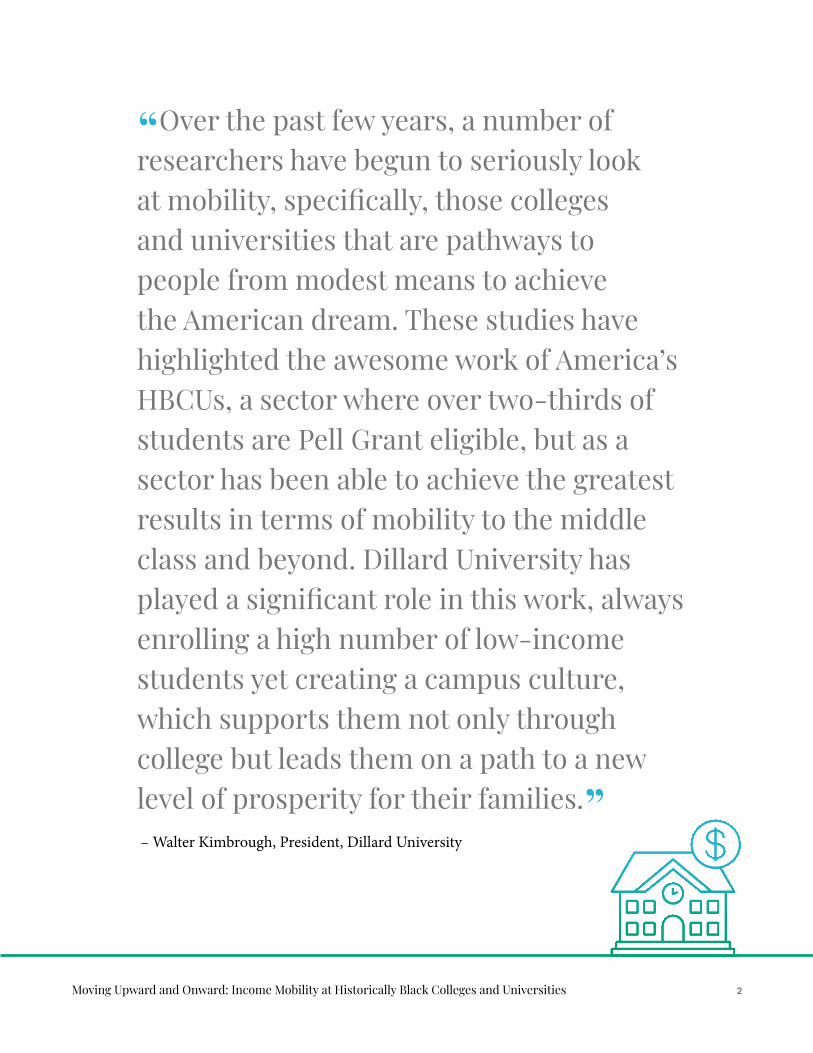
Research Aims
Our key research aims are to (1) examine the intergenerational income mobility experienced by students
who recently attended Historically Black Colleges and Universities (HBCUs) and Predominantly White
Institutions (PWIs) and (2) to examine variation across HBCUs, including on such measures as upward
mobility into the top fifth of income earners.
Overview
Key Findings
01. HBCUs enroll far more low-income students than PWIs.
02. More students experience upward mobility at HBCUs than at PWIs.
03. Nearly 70% of students at HBCUs attain at least middle-class incomes.
04. Two-thirds of low-income students at HBCUs end up in at least the middle class.
05. There is less downward mobility at HBCUs than at PWIs.
06. HBCUs like Xavier University of Louisiana, Dillard University, and Tuskegee University are doing a particularly good job fostering upward mobility for their students.
07. Children of affluent parents who attended PWIs were 50% more likely to stay affluent than children of affluent parents who attended HBCUs.
Moving Upward and Onward: Income Mobility at Historically Black Colleges and Universities 3
Background
In recent years, federal and state officials have questioned the value of Historically Black Colleges
and Universities (HBCUs), going so far as to cut funding streams and raise concerns over their
constitutionality (Boland and Gasman, 2014). With this questioning in mind, we are interested in
understanding HBCUs as a vehicle of social mobility.
We are aware of only a handful of quantitative studies in this area. Kim and Conrad (2006) found that
the graduation rate for African Americans at HBCUs is comparable to Predominantly White Institutions
(PWIs), despite HBCUs having substantially fewer institutional resources. While this work indicates
that HBCUs may be performing exceptionally well with limited support, graduation rates are only one
indicator of mobility, and one that is limited as it does not pertain to longer labor market outcomes. Both
Fryer and Greenstone (2010) and Price, Spriggs, and Swinton (2011) compare the labor market earnings
of graduates at HBCUs to non-HBCUs, but they find conflicting results. The data from each of these
studies is also dated - Kim and Conrad’s study is derived from a 1985 cohort of college freshman, Price,
Spriggs, and Swinton study’s latest sample is 1992, and the latest year in Fryer and Greenstone’s study
is 1997, twenty years ago. As the college landscape has and continues to change, the literature would
benefit from a study using more recent data, which our study seeks to offer using data from Opportunity
Insights (formerly the Equality of Opportunity Project).
Importantly, our work seeks to build on a recent research project in this area. The American Council
on Education’s (2018) report sheds a preliminary spotlight on upward mobility at Minority Serving
Institutions (MSIs). The report examined mobility rates at a variety of four-year and two-year MSIs,
including HSIs (Hispanic Serving Institutions), HBCUs, and AANAPISIs (Asian American and Native
American Pacific Islander Serving Institutions). The report presented aggregate national information
by MSI type. The authors concluded that “income mobility by students who attended MSIs across the
country exceeded mobility rates at non-MSIs” (Espinosa, Kelchen, and Taylor 2018, p. 17).
Higher education is most often a local decision and experience (Turley, 2009). For instance, the median
commuting distance for students attending public institutions is 11 miles (Hillman, 2016). We, therefore,
choose to focus on the localized higher education market instead of nationally, comparing mobility at
HBCUs to PWIs within the same commuting area. We also take a more holistic approach of mobility by
examining the proportion of students that experience any upward mobility. Lastly and critically, the ACE
report does not condition their key outcomes on students’ origin, i.e. the parents’ income level. Far more
low-income students enroll in HBCUs and other MSIs than PWIs. We believe that the most accurate
measure of mobility also accounts for students’ origins, i.e. the mobility trajectories of students with
low-income parents. As detailed in Blau & Duncan’s seminal Status Attainment Model (1967), parental
Ongoing Importance
Moving Upward and Onward: Income Mobility at Historically Black Colleges and Universities 4
origin is a crucial component of the origin-education-destination mobility pathway.1 In this study, we
therefore also analyze students’ conditional mobility outcomes in order to obtain what we believe to
be the most candid examination of students’ local mobility opportunities. For example, in Atlanta, the
higher education market includes such HBCUs as Spelman College and Clark Atlanta University, as well
as Georgia State and Clayton State, which are both PWIs.
Motivation
Our work focuses on understanding persistent educational and economic stratification and the role of
institutions of higher education (IHE) in upward mobility. HBCUs are regarded as institutions that can
address racial inequalities embedded within the educational system (Gasman, 2007; Gasman, 2011).
For this study, we conceptualize HBCUs as vehicles for Black empowerment given their rich history,
including as incubators for Black activism and protest during the Civil Rights Movement (Williamson-
Lott, 2008). Tatum (1997) argues that HBCUs foster a shared experience and mutual understanding for
their students. Price, Spriggs, and Swinton (2011) posit that HBCUs positively shape students’ “identity,
self-image, and self-esteem” (p. 106), which, they find, yields a wage premium in the labor market. Our
work furthers this research by examining recent population-level data of income mobility at HBCUs and
then unpacks variation in the mobility across institutions.
Research Aims
Our key research aims are to (1) examine the income mobility experienced by students who recently
attended HBCUs and PWIs and (2) to examine the variation across HBCUs, including on such measures
as mobility to the top income quintile and any upward mobility. We compare intergenerational income
mobility at HBCUs to the mobility rates at PWIs within the same set of commuting zones. Doing so
allows us to compare and contrast student outcomes at the localized institutional level, and to draw
plausible generalizations about the tradeoffs students face when deciding which local institution
to attend.
Moving Upward and Onward: Income Mobility at Historically Black Colleges and Universities 5
1Origin modeled as father’s education.
Data Sources
We use publicly available aggregate U.S. population-level intergenerational (parent linked to child) income
information from the Internal Revenue Service (IRS), with college attendance information from the
National Center for Education Statistics’ Integrated Postsecondary Education Data System (IPEDS). These
data were created as a collaboration between U.S. government employees and researchers affiliated with
Harvard’s Opportunity Insights. The IRS data links parents and their children’s reported income earnings
for children born from 1980-1991. Opportunity Insights publicly released aggregated information by
postsecondary institution after merging in key college demographic and institutional characteristics
information from IPEDS. Institutions are identified and linked to IPEDS data through their unique Office
of Postsecondary Education identifier (OPEID) assigned by the U.S. Department of Education.
Parents’ household earnings are calculated as the five-year average when the child was age 15-19.
Children’s earnings are calculated as wage and self-employment earnings in 2014, when children were
in their early to mid-thirties. Postsecondary institution is defined as the institution the child most often
attended between the ages of 19 and 22. Income mobility by postsecondary institution is calculated as
an aggregation of students and parents’ income for children born in 1980, 1981, and 1982. Data on the
1983-1991 cohorts is also available, though there is less information on post-college outcomes for them
as fewer years have passed since postsecondary exit.
Analytic Sample
Of the 101 postsecondary institutions classified as HBCUs within IPEDS, 50 four-year institutions are
individually identified in the 1980-1982 cohorts (four others are classified as two-year institutions). All
other HBCUs were part of a university system and therefore not individually identifiable or did not have
sufficient data from 1980-1982 (i.e. enough students observed) to be included. While we acknowledge
having data on only half of HBCUs as a potential limitation, we have information on a greater number
of HBCUs than previous work in the area (i.e. Fryer & Greenstone, 2010; Kim & Conrad, 2006; Price,
Spriggs, and Swinton, 2011) and the institutions for which we have data are geographically representative
of all HBCUs. Figure 1 depicts the HBCUs contained in our analytic sample. The comparison PWIs are
located within the same commuting zone of at least one of these HBCUs and are of similar institutional
selectivity according to the Barron’s Selectivity Index. We identify 115 PWIs, yielding an analytic sample
of 165 institutions.
Methodology
Moving Upward and Onward: Income Mobility at Historically Black Colleges and Universities 6

39
40
7
6
49
50
48
37
18
43
1
2
3
28
27
2620
21
4
5
25 24
44
45
38
8
10
9
13
11
16
15
41 42
36
31
30
34
35
3332
47
46
14 17
12
19 23
22
29
Moving Upward and Onward: Income Mobility at Historically Black Colleges and Universities 7
Figure 1. Historically Black Colleges and Universities in the Analytic Sample
1. Alabama Agricultural & Mechanical University AL 2. Stillman College AL
3. Tuskegee University AL 4. Philander Smith College AR
5. University of Arkansas at Pine Bluff AR 6. Howard University DC 7. University of the District of Columbia DC 8. Bethune Cookman University FL
9. Florida Agricultural & Mechanical University FL
10. Florida Memorial University FL 11. Albany State University GA 12. Clark Atlanta University GA 13. Fort Valley State University GA 14. Morehouse College GA 15. Paine College GA
16. Savannah State University GA 17. Spelman College GA 18. Kentucky State University KY
19. Dillard University LA 20. Grambling State University LA
21. Southern University & Agricultural & Mechanical College at Baton Rouge LA
22. Southern University at New Orleans LA 23. Xavier University of Louisiana LA 24. Harris-Stowe State University MO
25. Lincoln University of Jefferson City MO
26. Jackson State University MS 27. Mississippi Valley State University MS 28. Rust College MS 29. Bennett College NC
30. Elizabeth City State University NC 31. Fayetteville State University NC 32. North Carolina Agricultural & Technical State University NC 33. North Carolina Central University NC 34. Saint Augustine’s University NC 35. Shaw University NC 36. Winston-Salem State University NC 37. Central State University OH
38. Langston University OK 39. Cheyney University of Pennsylvania PA 40. Lincoln University of Pennsylvania PA 41. Claflin University SC 42. South Carolina State University SC 43. Tennessee State University TN 44. Prairie View Agricultural & Mechanical University TX 45. Texas Southern University TX 46. Hampton University VA 47. Norfolk State University VA 48. Virginia State University VA 49. Bluefield State College WV 50. West Virginia State University WV
Outcome Measures
Throughout the text, we often refer to students in the 1st/bottom quintile as low-income, the 2nd
quintile as lower-income, the 3rd quintile as middle class, and also as median—students who come from
households with close to the median income, the 4th quintile as upper-middle, and the 5th/top quintile
as affluent/high-income.2 We examine both the joint and conditional intergenerational (parent-child)
income mobility distributions, what Chetty, Friedman, et al. (2017) call the ‘mobility rate’ and the
‘success rate,’ respectively. The mobility rate is defined as the percent of children who originate in a
specific income quintile and end up as adults in a specific (often different) income quintile. The success
rate is defined as the percent of children in a specific income quintile, conditional on their parent being
in a specific income quintile. The former presents a holistic picture of the origin-destination income
mobility patterns from parents to students (e.g. what percent of all students were in the top quintile and
had parents with incomes in the bottom quintile). The latter details the income mobility of students
given that their parents’ income was in a specific income bracket (e.g. of students who had parents in the
bottom quintile, what percent of students achieved income in the top quintile). It is our emphasis on the
success rate, specifically, that helps distinguish our work from other research in the area.
Moving Upward and Onward: Income Mobility at Historically Black Colleges and Universities 8
“It is our emphasis on the success rate, specifically, that helps distinguish our work from other research in the area.”
2 Parental household income cutoffs (set to 2015 dollars) are as follows: $25,000 for the 20th percentile, $46,000 for the 40th percentile, $74,000 for the 60th percentile, and $111,000 for the 80th percentile. The median parental income is $60,000 and the 99th percentile is $512,000. Parental income cutoffs are derived from the pre-tax adjusted gross income of parents of children born in 1980 during the five years their child was 15-19 years old. For further information, see Chetty et al., “Mobility Report Cards: The Role of Colleges in Intergenerational Mobility,” https://nberg.org/papers/w23618.
Descriptive Comparisons
We first detail descriptive institutional and student characteristics for the HBCUs and PWIs contained
in our analytic sample, which highlights similarities and differences across these institution types. We
discuss various (unconditional) Mobility Rate measures and a number of (conditional) Success Rate
measures. We discuss mobility variation within HBCUs and highlight HBCUs that are observed to be
fostering particularly high rates of upward mobility. Lastly, we discuss inter-generational perpetuation of
privilege at institutions of higher education.
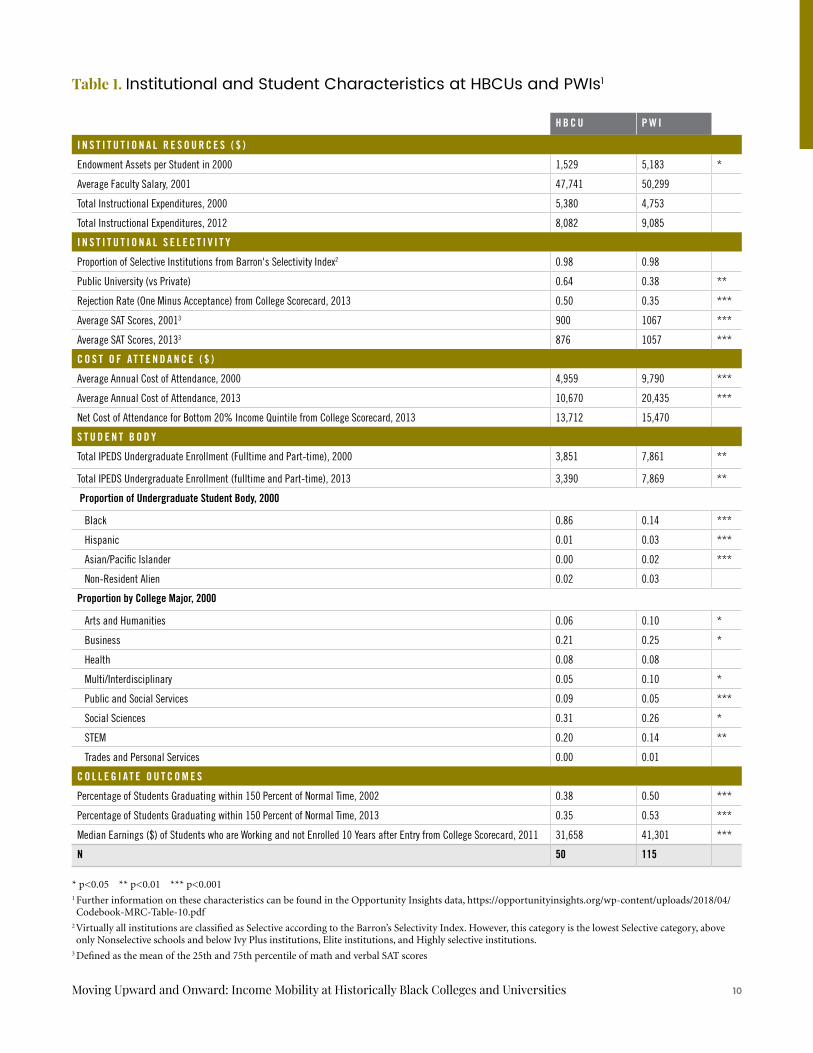
Table 1 reports descriptive institutional and student characteristics at HBCUs and PWIs. By including
information on the ways in which our set of HBCUs and PWIs are similar to each other and the ways
in which they differ, we provide important context to our main findings. Descriptively, HBCUs have far
fewer institutional resources per student than PWIs, with less than 1/3rd of the endowment per student
at PWIs, though both types of institutions spend similar amounts on instruction. Far more HBCUs are
public institutions than PWIs, and the average SAT scores of students at HBCUs are significantly lower
than students at PWIs. The sticker price of attendance at HBCUs is lower than their PWI counterparts,
but, critically, the net cost of attendance for the bottom fifth of students based on income profiles, a more
accurate measure of the holistic cost of attendance, indicates that HBCUs are not significantly different
than PWIs. Students at HBCUs are less likely to major in arts and humanities and multi/interdisciplinary
studies, and more likely to major in STEM, social science, and public and social service fields. Fewer
students graduate within 150 percent of normal time at HBCUs and, 10 years after enrollment, HBCU
students’ median earnings are approximately one-quarter (over $10,000) lower than their counterparts
at PWIs.
Main Findings
Moving Upward and Onward: Income Mobility at Historically Black Colleges and Universities 9
H B C U P W I
I N S T I T U T I O N A L R E S O U R C E S ( $ )
Endowment Assets per Student in 2000 1,529 5,183 *
Average Faculty Salary, 2001 47,741 50,299 **
Total Instructional Expenditures, 2000 5,380 4,753 **
Total Instructional Expenditures, 2012 8,082 9,085 **
I N S T I T U T I O N A L S E L E C T I V I T Y
Proportion of Selective Institutions from Barron's Selectivity Index2 0.98 0.98 **
Public University (vs Private) 0.64 0.38 **
Rejection Rate (One Minus Acceptance) from College Scorecard, 2013 0.50 0.35 ***
Average SAT Scores, 20013 900 1067 ***
Average SAT Scores, 20133 876 1057 ***
C O S T O F A T T E N D A N C E ( $ )
Average Annual Cost of Attendance, 2000 4,959 9,790 ***
Average Annual Cost of Attendance, 2013 10,670 20,435 ***
Net Cost of Attendance for Bottom 20% Income Quintile from College Scorecard, 2013 13,712 15,470 ***
S T U D E N T B O D Y
Total IPEDS Undergraduate Enrollment (Fulltime and Part-time), 2000 3,851 7,861 **
Total IPEDS Undergraduate Enrollment (fulltime and Part-time), 2013 3,390 7,869 **
Proportion of Undergraduate Student Body, 2000
Black 0.86 0.14 ***
Hispanic 0.01 0.03 ***
Asian/Pacific Islander 0.00 0.02 ***
Non-Resident Alien 0.02 0.03 **
Proportion by College Major, 2000
Arts and Humanities 0.06 0.10 *
Business 0.21 0.25 *
Health 0.08 0.08 **
Multi/Interdisciplinary 0.05 0.10 *
Public and Social Services 0.09 0.05 ***
Social Sciences 0.31 0.26 *
STEM 0.20 0.14 **
Trades and Personal Services 0.00 0.01 **
C O L L E G I A T E O U T C O M E S
Percentage of Students Graduating within 150 Percent of Normal Time, 2002 0.38 0.50 ***
Percentage of Students Graduating within 150 Percent of Normal Time, 2013 0.35 0.53 ***
Median Earnings ($) of Students who are Working and not Enrolled 10 Years after Entry from College Scorecard, 2011 31,658 41,301 ***
N 50 115
Table 1. Institutional and Student Characteristics at HBCUs and PWIs1
* p<0.05 ** p<0.01 *** p<0.0011 Further information on these characteristics can be found in the Opportunity Insights data, https://opportunityinsights.org/wp-content/uploads/2018/04/Codebook-MRC-Table-10.pdf
2 Virtually all institutions are classified as Selective according to the Barron’s Selectivity Index. However, this category is the lowest Selective category, above only Nonselective schools and below Ivy Plus institutions, Elite institutions, and Highly selective institutions.
3 Defined as the mean of the 25th and 75th percentile of math and verbal SAT scores
Moving Upward and Onward: Income Mobility at Historically Black Colleges and Universities 10
Mobility Rates
M O B I L I T Y M A T R I X
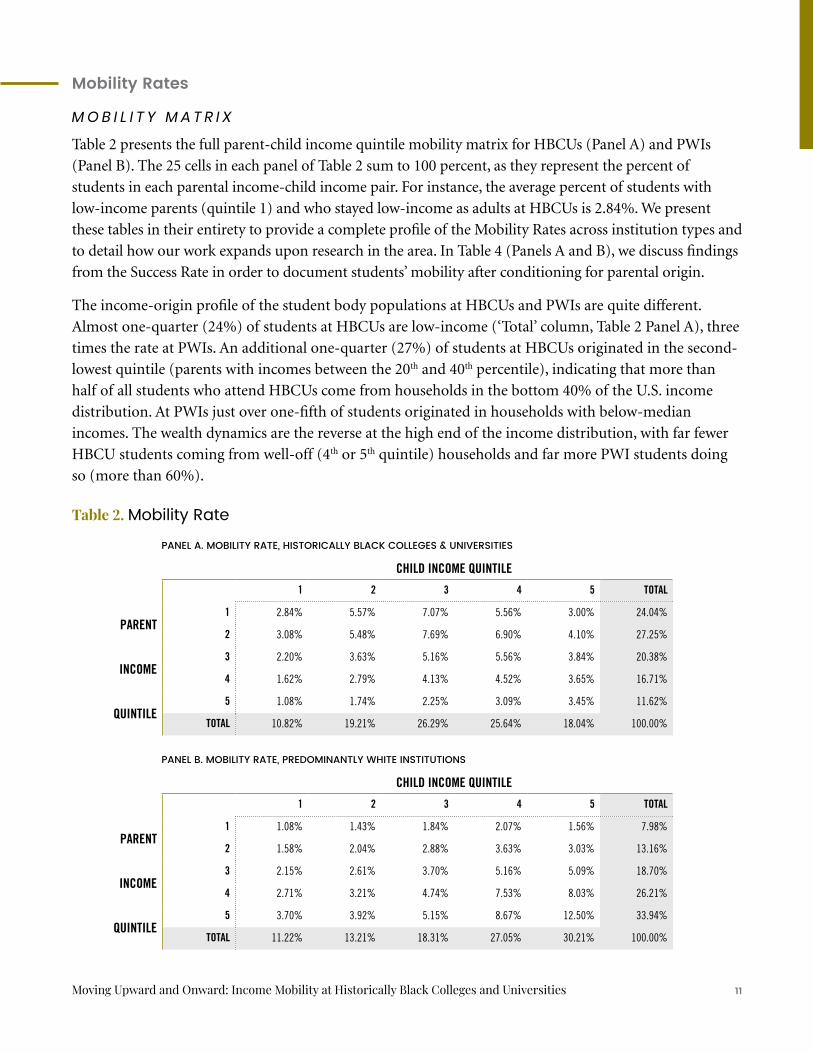
Table 2 presents the full parent-child income quintile mobility matrix for HBCUs (Panel A) and PWIs
(Panel B). The 25 cells in each panel of Table 2 sum to 100 percent, as they represent the percent of
students in each parental income-child income pair. For instance, the average percent of students with
low-income parents (quintile 1) and who stayed low-income as adults at HBCUs is 2.84%. We present
these tables in their entirety to provide a complete profile of the Mobility Rates across institution types and
to detail how our work expands upon research in the area. In Table 4 (Panels A and B), we discuss findings
from the Success Rate in order to document students’ mobility after conditioning for parental origin.
The income-origin profile of the student body populations at HBCUs and PWIs are quite different.
Almost one-quarter (24%) of students at HBCUs are low-income (‘Total’ column, Table 2 Panel A), three
times the rate at PWIs. An additional one-quarter (27%) of students at HBCUs originated in the second-
lowest quintile (parents with incomes between the 20th and 40th percentile), indicating that more than
half of all students who attend HBCUs come from households in the bottom 40% of the U.S. income
distribution. At PWIs just over one-fifth of students originated in households with below-median
incomes. The wealth dynamics are the reverse at the high end of the income distribution, with far fewer
HBCU students coming from well-off (4th or 5th quintile) households and far more PWI students doing
so (more than 60%).
Moving Upward and Onward: Income Mobility at Historically Black Colleges and Universities 11
Table 2. Mobility Rate
CHILD INCOME QUINTILE
1 2 3 4 5 TOTAL
PARENT 1 2.84% 5.57% 7.07% 5.56% 3.00% 24.04%
2 3.08% 5.48% 7.69% 6.90% 4.10% 27.25%
INCOME3 2.20% 3.63% 5.16% 5.56% 3.84% 20.38%
4 1.62% 2.79% 4.13% 4.52% 3.65% 16.71%
QUINTILE5 1.08% 1.74% 2.25% 3.09% 3.45% 11.62%
TOTAL 10.82% 19.21% 26.29% 25.64% 18.04% 100.00%
PANEL A. MOBILITY RATE, HISTORICALLY BLACK COLLEGES & UNIVERSITIES
CHILD INCOME QUINTILE
1 2 3 4 5 TOTAL
PARENT 1 1.08% 1.43% 1.84% 2.07% 1.56% 7.98%
2 1.58% 2.04% 2.88% 3.63% 3.03% 13.16%
INCOME3 2.15% 2.61% 3.70% 5.16% 5.09% 18.70%
4 2.71% 3.21% 4.74% 7.53% 8.03% 26.21%
QUINTILE5 3.70% 3.92% 5.15% 8.67% 12.50% 33.94%
TOTAL 11.22% 13.21% 18.31% 27.05% 30.21% 100.00%
PANEL B. MOBILITY RATE, PREDOMINANTLY WHITE INSTITUTIONS

M O B I L I T Y R A T E S
Prior scholars have used select information from these mobility tables to draw conclusions about the
upward mobility rate at IHEs and MSIs specifically. Chetty et al. (2017) define their mobility rate as “the
fraction of its students who come from the bottom quintile of the income distribution and end up in
the top quintile,” (Chetty et al. 2017, p.2) which can be thought of as the American Dream rags-to-riches
leap. We refer to it as the ‘Classic’ Mobility Rate. Espinosa et al. (2018) take a broader perspective on
mobility, defining an ‘extended mobility rate’ as the share of students with parents in the 1st or 2nd quintile
who move up to the 4th or 5th quintile as adults. Using a slightly different version of the Opportunity
Insights data, they find that the mobility rate and extended mobility rate at HBCUs is 2.8% and 19.3%,
respectively, higher than at non-MSIs (1.5% and 9.4%).3
While our classic mobility (3% vs 1.7%) and extended mobility (19.6 vs 10.9%) rates at HBCUs and
PWIs are similar to other scholars, we argue that it is important to take a more holistic approach to
mobility. The measures used by these researchers have a narrow focus on either a single or only four
of the 25 cells in the mobility matrix, which risks missing broader patterns. The much larger share of
students at HBCUs that are low-income also inflates the values they highlight. By reporting these select
unconditional mobility rates, their findings reflect the skewed parental-income distribution at HBCUs,
rather than any institution-based driver of income mobility.
In Table 3, we report several broader mobility measures in addition to the classic and extended mobility
rates. We define ‘Upwardly Mobile’ as the share of students that moved into a higher income quintile. It is
calculated by summing the ten cells above the matrix diagonal. ‘Middle Class+’ is defined as students that
are in the top three quintiles.
More than half of all students at HBCUs experience some
measure of upward mobility. Moreover, upward mobility
is about 50% higher at HBCUs than PWIs, driven by
PWIs enrolling far fewer lower-income students. Nearly
the same number of students at both sets of institutions
move up into the middle class, and at least 70% end
up there.
We depict several of these measures in Figures 2 and Appendix Figures A1 and A2. Figure 2 shows
students who come from households with below-median incomes but move into the top three quintiles.
Appendix Figure A1 displays the rags-to-riches success rate by the proportion of low-income students
and Appendix Figure A2 highlights the proportion of students who move into the top two quintiles who
have parents with below-median incomes.
As described above, the vast majority of HBCUs enroll far more low-income students than PWIs.
Although Morehouse, Spelman, and Howard, several of the most highly ranked HBCUs, do propel a
similar proportion of low-income students into high-income careers as many PWIs (Appendix Figure
Moving Upward and Onward: Income Mobility at Historically Black Colleges and Universities 12
Table 3. Mobility Measures
M O B I L I T Y M E A S U R E H B C U P W I
Upwardly Mobile 52.93% 34.72%
Move into Middle Class+ 60.50% 57.01%
End up in Middle Class+ 69.97% 75.57%
'Classic' Mobility Rate 3.00% 1.56%
Extended Mobility Rate 19.57% 10.28%
3Espinosa et al. utilize the 1983-1985 cohorts in their analyses, while we use the 1980-1982 cohorts, the primary data cohorts according to Raj Chetty and the other creators of the Opportunity Insights data.

A1), these schools enroll some of the lowest shares of low-income students at any of the HBCUs. Xavier
and Tuskegee University enroll more low-income students while achieving a higher mobility rate than
almost any other HBCU.
Our preferred measure of mobility (Figure 2) shows students who have moved up to reach incomes on
par with at least the median U.S. earner. For both PWIs and HBCUs, at least two-thirds of students do
so. Xavier University of Louisiana has the highest value of any HBCU, at nearly 80%, while schools like
Florida A&M University achieve levels on par with the higher-end of the PWI distribution.
Moving Upward and Onward: Income Mobility at Historically Black Colleges and Universities 13
Figure 2. Proportion of Students who Move into the Top Three Quartiles
.5.6
.7.8
.9
.20 .4 .6 .8
C3 t
o C
5 |
P1
or
P2
P1 or P2
HBCU
PWIXavier University of Louisiana
Florida A&M
Success Rate
While the classic mobility and extended mobility rates reported above relate our work to the previous
literature and the broader mobility measures provide a more holistic lens in which to view unconditional
mobility at HBCUs and PWIs, we believe that the best approach to examine intergenerational mobility
within higher education is to condition students on their origins. We, therefore, present the full Success
Rate matrices (Table 4 Panels A and B), which distinguishes our work from other research in the area
and, we feel, more accurately details students’ mobility trajectories. Each row in Table 4 sums to 100
percent as the values represent the proportion of students who achieve a particular income in adulthood,
conditional on their parents’ income.
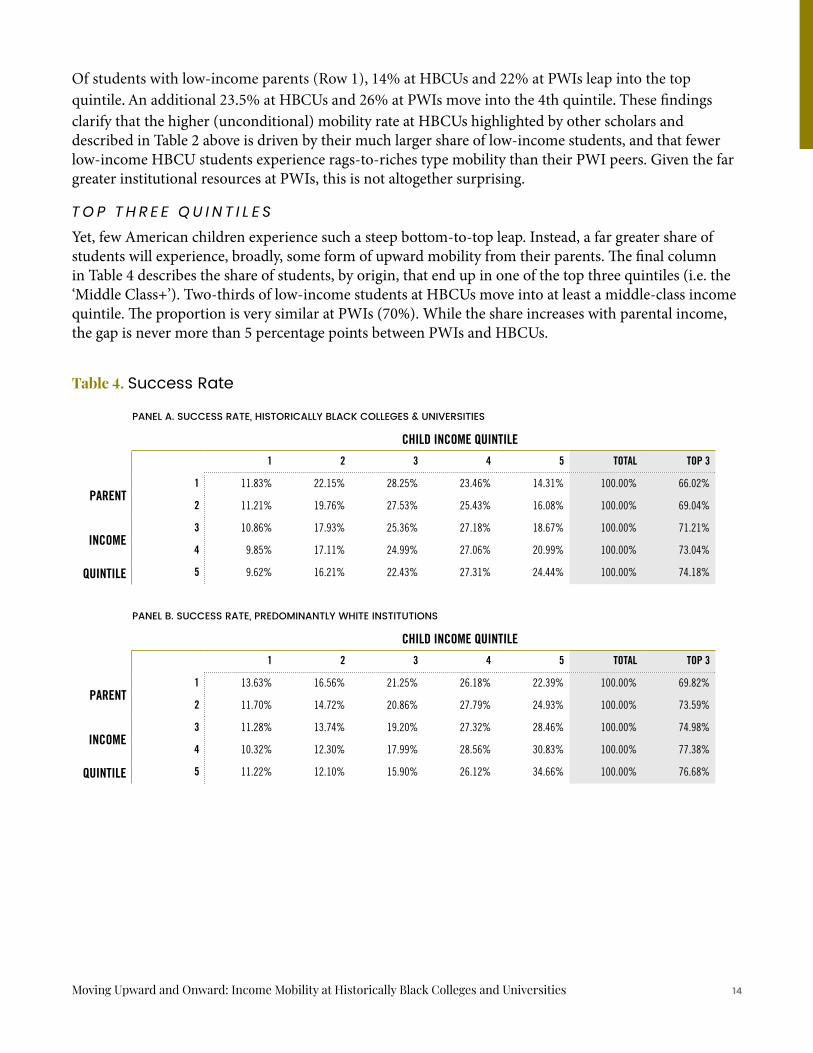
Of students with low-income parents (Row 1), 14% at HBCUs and 22% at PWIs leap into the top
quintile. An additional 23.5% at HBCUs and 26% at PWIs move into the 4th quintile. These findings
clarify that the higher (unconditional) mobility rate at HBCUs highlighted by other scholars and described in Table 2 above is driven by their much larger share of low-income students, and that fewer low-income HBCU students experience rags-to-riches type mobility than their PWI peers. Given the far greater institutional resources at PWIs, this is not altogether surprising.
T O P T H R E E Q U I N T I L E SYet, few American children experience such a steep bottom-to-top leap. Instead, a far greater share of students will experience, broadly, some form of upward mobility from their parents. The final column in Table 4 describes the share of students, by origin, that end up in one of the top three quintiles (i.e. the ‘Middle Class+’). Two-thirds of low-income students at HBCUs move into at least a middle-class income quintile. The proportion is very similar at PWIs (70%). While the share increases with parental income, the gap is never more than 5 percentage points between PWIs and HBCUs.
Table 4. Success Rate
CHILD INCOME QUINTILE
1 2 3 4 5 TOTAL TOP 3
PARENT 1 11.83% 22.15% 28.25% 23.46% 14.31% 100.00% 66.02%
2 11.21% 19.76% 27.53% 25.43% 16.08% 100.00% 69.04%
INCOME3 10.86% 17.93% 25.36% 27.18% 18.67% 100.00% 71.21%
4 9.85% 17.11% 24.99% 27.06% 20.99% 100.00% 73.04%
QUINTILE 5 9.62% 16.21% 22.43% 27.31% 24.44% 100.00% 74.18%
PANEL A. SUCCESS RATE, HISTORICALLY BLACK COLLEGES & UNIVERSITIES
CHILD INCOME QUINTILE
1 2 3 4 5 TOTAL TOP 3
PARENT 1 13.63% 16.56% 21.25% 26.18% 22.39% 100.00% 69.82%
2 11.70% 14.72% 20.86% 27.79% 24.93% 100.00% 73.59%
INCOME3 11.28% 13.74% 19.20% 27.32% 28.46% 100.00% 74.98%
4 10.32% 12.30% 17.99% 28.56% 30.83% 100.00% 77.38%
QUINTILE 5 11.22% 12.10% 15.90% 26.12% 34.66% 100.00% 76.68%
PANEL B. SUCCESS RATE, PREDOMINANTLY WHITE INSTITUTIONS
Moving Upward and Onward: Income Mobility at Historically Black Colleges and Universities 14
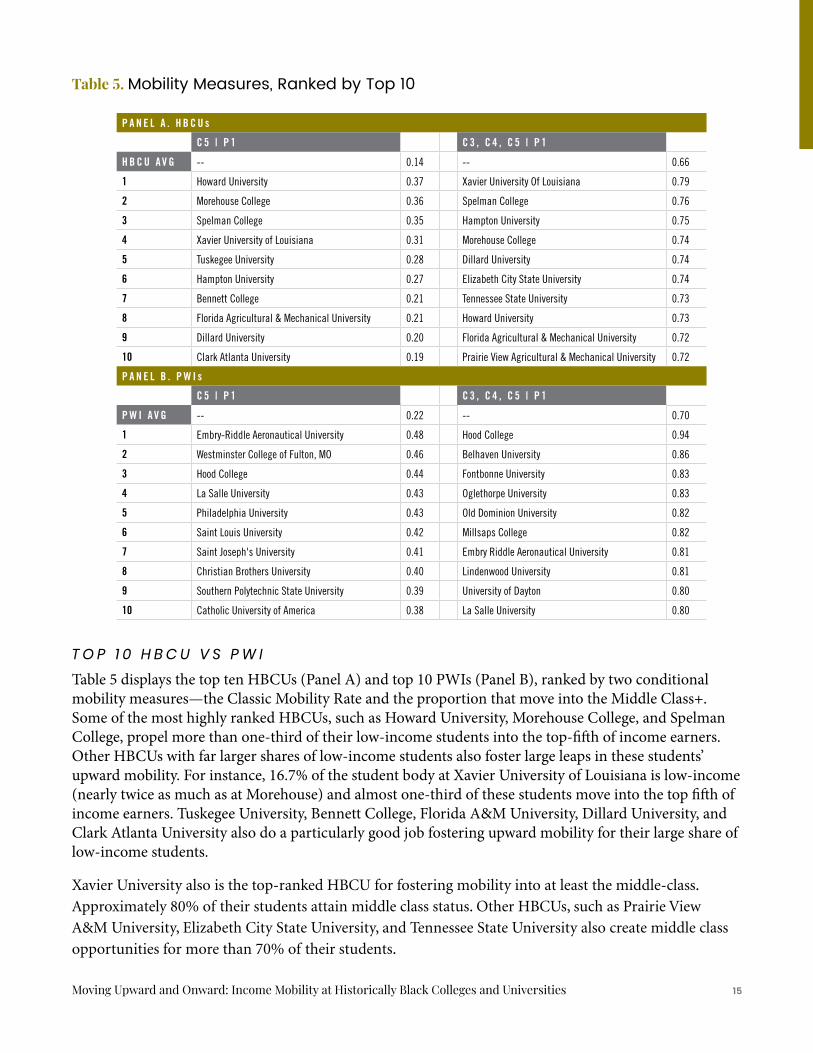
Table 5. Mobility Measures, Ranked by Top 10
P A N E L A . H B C U s
C 5 | P 1 C 3 , C 4 , C 5 | P 1
H B C U A V G -- 0.14 -- 0.66
1 Howard University 0.37 Xavier University Of Louisiana 0.79
2 Morehouse College 0.36 Spelman College 0.76
3 Spelman College 0.35 Hampton University 0.75
4 Xavier University of Louisiana 0.31 Morehouse College 0.74
5 Tuskegee University 0.28 Dillard University 0.74
6 Hampton University 0.27 Elizabeth City State University 0.74
7 Bennett College 0.21 Tennessee State University 0.73
8 Florida Agricultural & Mechanical University 0.21 Howard University 0.73
9 Dillard University 0.20 Florida Agricultural & Mechanical University 0.72
10 Clark Atlanta University 0.19 Prairie View Agricultural & Mechanical University 0.72
P A N E L B . P W I s
C 5 | P 1 C 3 , C 4 , C 5 | P 1
P W I A V G -- 0.22 -- 0.70
1 Embry-Riddle Aeronautical University 0.48 Hood College 0.94
2 Westminster College of Fulton, MO 0.46 Belhaven University 0.86
3 Hood College 0.44 Fontbonne University 0.83
4 La Salle University 0.43 Oglethorpe University 0.83
5 Philadelphia University 0.43 Old Dominion University 0.82
6 Saint Louis University 0.42 Millsaps College 0.82
7 Saint Joseph's University 0.41 Embry Riddle Aeronautical University 0.81
8 Christian Brothers University 0.40 Lindenwood University 0.81
9 Southern Polytechnic State University 0.39 University of Dayton 0.80
10 Catholic University of America 0.38 La Salle University 0.80
T O P 1 0 H B C U V S P W I Table 5 displays the top ten HBCUs (Panel A) and top 10 PWIs (Panel B), ranked by two conditional mobility measures—the Classic Mobility Rate and the proportion that move into the Middle Class+. Some of the most highly ranked HBCUs, such as Howard University, Morehouse College, and Spelman College, propel more than one-third of their low-income students into the top-fifth of income earners. Other HBCUs with far larger shares of low-income students also foster large leaps in these students’ upward mobility. For instance, 16.7% of the student body at Xavier University of Louisiana is low-income (nearly twice as much as at Morehouse) and almost one-third of these students move into the top fifth of income earners. Tuskegee University, Bennett College, Florida A&M University, Dillard University, and Clark Atlanta University also do a particularly good job fostering upward mobility for their large share of low-income students.
Xavier University also is the top-ranked HBCU for fostering mobility into at least the middle-class.
Approximately 80% of their students attain middle class status. Other HBCUs, such as Prairie View
A&M University, Elizabeth City State University, and Tennessee State University also create middle class
opportunities for more than 70% of their students.
Moving Upward and Onward: Income Mobility at Historically Black Colleges and Universities 15
Privilege Perpetuation
If intergenerational mobility were truly random, there would be no relationship between children’s
income as adults and that of their parents. Social scientists have long documented how parental
education (Blau & Duncan, 1967) and other forms of capital (e.g. social, cultural, economic) are
fundamental factors in predicting children’s outcomes—parents are invested in fostering the best possible
lives for their children. Recent work by Annette Lareau shows how middle class and wealthy families can
even unconsciously facilitate greater access to opportunity for their children, sometimes to the exclusion
of less well-off households (Lareau, 2014). The Opportunity Insights data allow us to directly observe
the intergenerational perpetuation of privilege, what we call an ‘affluence floor,’ for the children of well-
off parents.
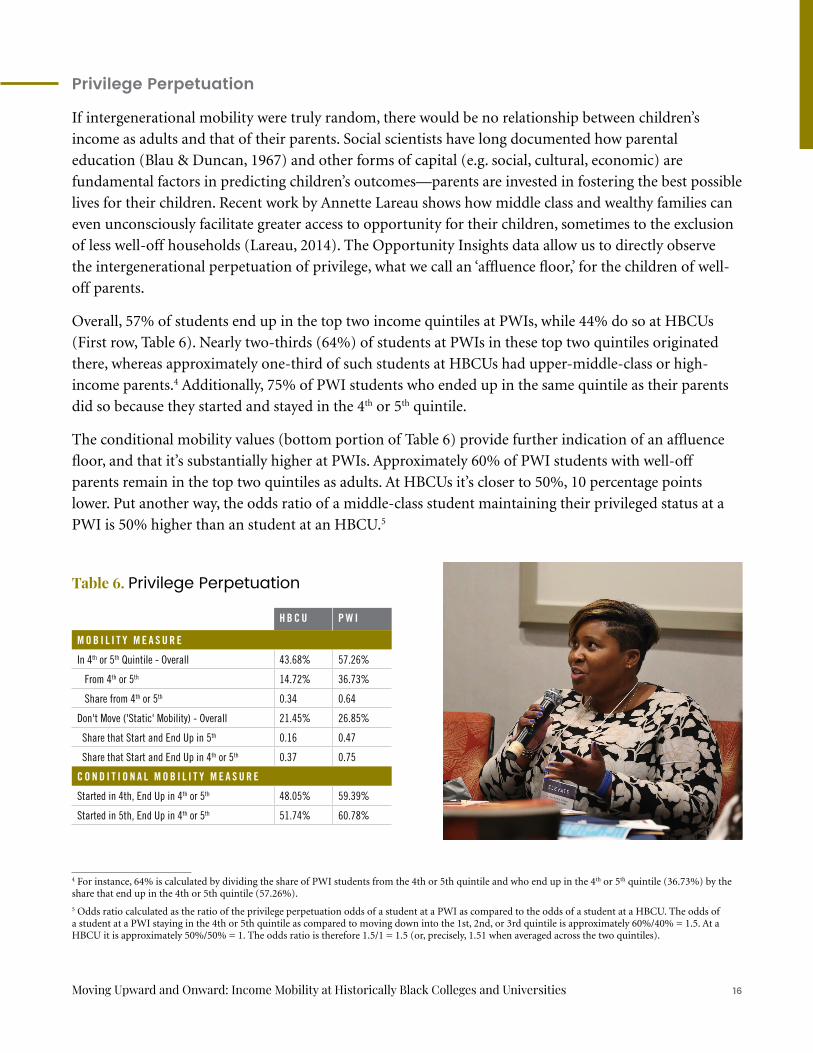
Overall, 57% of students end up in the top two income quintiles at PWIs, while 44% do so at HBCUs
(First row, Table 6). Nearly two-thirds (64%) of students at PWIs in these top two quintiles originated
there, whereas approximately one-third of such students at HBCUs had upper-middle-class or high-
income parents.4 Additionally, 75% of PWI students who ended up in the same quintile as their parents
did so because they started and stayed in the 4th or 5th quintile.
The conditional mobility values (bottom portion of Table 6) provide further indication of an affluence
floor, and that it’s substantially higher at PWIs. Approximately 60% of PWI students with well-off
parents remain in the top two quintiles as adults. At HBCUs it’s closer to 50%, 10 percentage points
lower. Put another way, the odds ratio of a middle-class student maintaining their privileged status at a
PWI is 50% higher than an student at an HBCU.5
Table 6. Privilege Perpetuation
H B C U P W I
M O B I L I T Y M E A S U R E
In 4th or 5th Quintile - Overall 43.68% 57.26%
From 4th or 5th 14.72% 36.73%
Share from 4th or 5th 0.34 0.64
Don't Move ('Static' Mobility) - Overall 21.45% 26.85%
Share that Start and End Up in 5th 0.16 0.47
Share that Start and End Up in 4th or 5th 0.37 0.75
C O N D I T I O N A L M O B I L I T Y M E A S U R E
Started in 4th, End Up in 4th or 5th 48.05% 59.39%
Started in 5th, End Up in 4th or 5th 51.74% 60.78%
4 For instance, 64% is calculated by dividing the share of PWI students from the 4th or 5th quintile and who end up in the 4th or 5th quintile (36.73%) by the share that end up in the 4th or 5th quintile (57.26%).
5 Odds ratio calculated as the ratio of the privilege perpetuation odds of a student at a PWI as compared to the odds of a student at a HBCU. The odds of a student at a PWI staying in the 4th or 5th quintile as compared to moving down into the 1st, 2nd, or 3rd quintile is approximately 60%/40% = 1.5. At a HBCU it is approximately 50%/50% = 1. The odds ratio is therefore 1.5/1 = 1.5 (or, precisely, 1.51 when averaged across the two quintiles).
Moving Upward and Onward: Income Mobility at Historically Black Colleges and Universities 16
T O P 1 0 H B C U s V S P W I sTo further explore privilege perpetuation, we describe the same conditional mobility measures in Table 6 at the institutional level for the top 10 ranked HBCUs (Table 7 Panel A) and PWIs (Table 7 Panel B). Similar to the upward mobility findings, Xavier University is ranked exceptionally high. At least 70% of Xavier University students that come from more affluent backgrounds replicate this status more than a decade later. Approximately two-thirds do so at the most highly ranked HBCUs—Spelman College, How-ard University, Hampton University, and Morehouse College. Other HBCUs, such as Florida A&M Uni-versity, Southern University and A&M College at Baton Rouge, Clark Atlanta University, Virginia State University, Lincoln University of Pennsylvania, North Carolina A&T University, and Dillard University, also foster intergenerational retention of upper-middle-class status.
As to the PWIs (Table 7 Panel B), many institutions help maintain the upper-middle-class origins for
a large proportion of their students. For instance, the proportion of students staying in the 4th or 5th
quintile as adults at the University of Dayton is at least 72% and nearly 80% at La Salle University.
It is critical to note that many of these PWIs do not have widespread name recognition—recall that the
analytic sample consists of PWIs and HBCUs in the same commuting zone. Institutions like Embry Riddle
Aeronautical and Ursinus College do not carry the same level of recognition as Morehouse or Spelman.
And yet, these institutions, on average, have an inter-generational maintenance of relative affluence that is
10 percentage points higher than at HBCUs, including HBCUs with acclaimed national reputations. This
simultaneously suggests that while the odds are 50% greater than children at PWIs will experience similar
or higher incomes than their parents as compared to substantially lower than their parents, the underlying
mechanisms facilitating such perpetuation of privilege are not as strong for students at HBCUs. Children
of upper-middle class and affluent parents at HBCUs are no more likely than the flip of a coin to end up
in a similar income bracket as compared to moving down to the median or below. These findings suggest
that forces outside of the institution, including systemic racism in society, continue to have a strong
influence on children’s outcomes. Other recent work from Opportunity Insights finds similar results, with
African American men who grew up in high-income households being far less likely to maintain that level
of income as adults than white men (Chetty et al. 2019; Badger et al. 2018).
“At least 70% of Xavier University students that come from more affluent backgrounds replicate this status more than a decade later.”
Moving Upward and Onward: Income Mobility at Historically Black Colleges and Universities 17

Table 7. Privilege Perpetuation, Ranked by Top 10
P A N E L A . H B C U s
% I N 4 T H O R 5 T H Q U I N T I L E , F R O M 4 T H % I N 4 T H O R 5 T H Q U I N T I L E , F R O M 5 T H
H B C U A V G -- 0.48 -- 0.52
1 Xavier University of Louisiana 0.70 Spelman College 0.72
2 Spelman College 0.68 Xavier University of Louisiana 0.70
3 Howard University 0.67 Howard University 0.69
4 Hampton University 0.65 Hampton University 0.68
5 Morehouse College 0.64 Tuskegee University 0.68
6 Florida Agricultural & Mechanical University 0.58 Lincoln University of Pennsylvania 0.65
7 Southern University And Agricultural & Mechanical College at Baton Rouge
0.57 Florida Agricultural & Mechanical University 0.64
8 Clark Atlanta University 0.56 Morehouse College 0.62
9 Virginia State University 0.56 Dillard University 0.62
10 Tuskegee University 0.55 North Carolina Agricultural & Technical State University 0.59
P A N E L B . P W I s
% I N 4 T H O R 5 T H Q U I N T I L E , F R O M 4 T H % I N 4 T H O R 5 T H Q U I N T I L E , F R O M 5 T H
P W I A V G -- 0.59 -- 0.61
1 Embry Riddle Aeronautical University 0.80 Embry-Riddle Aeronautical University 0.82
2 La Salle University 0.78 La Salle University 0.78
3 Ursinus College 0.78 Ursinus College 0.78
4 Saint Joseph’s University 0.77 Saint Joseph’s University 0.78
5 University of Dayton 0.75 Mount Saint Mary’s University 0.77
6 Saint Louis University 0.72 Saint Louis University 0.76
7 Christian Brothers University 0.72 Randolph-Macon College 0.76
8 Gwynedd Mercy University 0.72 University of Dayton 0.75
9 Rowan University 0.71 Southern Polytechnic State University 0.74
10 Philadelphia University 0.71 Richard Stockton College of New Jersey 0.74
Moving Upward and Onward: Income Mobility at Historically Black Colleges and Universities 18
Concluding Thoughts and Recommendations
HBCUs are doing an admirable job fostering the upward mobility of their students, especially considering
the large share of their students that come from lower-income backgrounds. Taking a broader lens, HBCUs
are furthering upward mobility of their student population, which is drawn from the lower economic
rungs than the general college-going population at PWIs. Specific schools are doing a particularly good job,
including Xavier University of Louisiana, Dillard University, Tuskegee University, Florida A&M University,
Prairie View A&M University, Spelman College, and Clark Atlanta University.
Recommendation: Researchers interested in the long-term sustainability and impact of HBCUs should examine the student success strategies at these particular institutions with attention toward low-income students.
The perpetuation of economic privilege is not as strong for students at HBCUs as
compared to PWIs. In other words, being born into a relatively affluent African
American family does not provide the same sort of class safety net as does being
born into a white family. Even children of upper-middle-class and affluent families
at HBCUs (4th or 5th quintile) are as likely to fall down into the 3rd quintile or below
as they are to stay in the 4th or 5th quintile. They have a 50/50 chance. For children at
PWIs, it’s 60% stay versus 40% fall down. The odds, therefore, of a student maintaining
their privileged status at a PWI are 50% higher than for a student at an HBCU. College
attendance is not a panacea. HBCUs are doing a great deal while students are enrolled,
but upon postsecondary exit students still need to enter the workforce and lead lives as
adults in the United States. Our study suggests that entering the workforce and moving
forward in one’s career is still harder to do for African Americans than for whites.
Recommendation: Researchers interested in understanding the outcomes for African Americans must look at their overall life experiences after college rather than isolating higher education experiences and institutions.
Nearly 70% of students at HBCUs attain at least middle-class incomes and there is less
downward mobility at HBCUs than at PWIs.
Recommendation: Researchers should examine the practices of HBCUs in comparison to PWIs. PWIs could learn from HBCUs in terms of furthering the experiences and outcomes of their African American students.
Moving Upward and Onward: Income Mobility at Historically Black Colleges and Universities 19
ReferencesBadger, E., Miller, C.C., Pearce, A., and Quealy, K. 2018. “Extensive data shows punishing reach of racism for Black boys.” The New York Times (https://www.nytimes.com/interactive/2018/03/19/upshot/race-class-white-and-black-men.html).
Blau, P. M., and Duncan, O. D. 1967. The American occupational structure. New York: John Wiley and Sons.
Boland, W. and Gasman, M. 2014. America’s public HBCUs: A four state comparison of institutional capacity and state funding priorities. Philadelphia, PA: Penn Center for Minority Serving Institutions.
Chetty, R., Hendren, N., Jones, M.R., and Porter, S.R. 2019. “Race and economic opportunity in the United States: An intergenerational perspective.” Opportunity Insights Working Paper (https://opportunityinsights.org/wp-content/uploads/2018/04/race_paper.pdf)
Chetty, R., Friedman, J., Saez, E., Turner, N., and Yagan, D. 2017. “Mobility report cards: The role of colleges in intergenerational mobility.” National Bureau of Economic Research, Working Paper No. 23618 (https://www.nber.org/papers/w23618).
DeSilver, D. August 7, 2018. “For most U.S. workers, real wages have barely budged in decades.” Pew Hispanic Center (https://www.pewresearch.org/fact-tank/2018/08/07/for-most-us-workers-real-wages-have-barely-budged-for-decades/).
Espinosa, L.L., Kelchen, R., and Taylor, M. 2018. “Minority Serving Institutions as engines of upward mobility.” Washington, DC: American Council on Education.
Fryer, R.G. Jr. and Greenstone, M. 2010. “The changing consequences of attending Historically Black Colleges and Universities.” American Economic Journal: Applied Economics 2(1): 116-148.
Gasman, M. 2007. Envisioning Black colleges: A history of the United Negro College Fund. Baltimore, MD: The Johns Hopkins University Press.
Gasman, M. 2011. “Perceptions of Black college presidents: Sorting through stereotypes and reality to gain a complex picture,” American Educational Research Journal 48(4): 836-870.
Hillman, N. 2016. “Geography of college opportunity: The case of education deserts.” American Education Research Journal 53(4): 987-1021.
Kim, M. and Conrad, C. 2006. “The impact of Historically Black Colleges and Universities on the academic success of African-American students.” Research in Higher Education 47(4): 399-427.
Lareau, A. 2014. “Schools, housing, and the reproduction of inequality.” In Lareau, A. and Goyette, K., Eds. Choosing Homes, Choosing Schools. Russell Sage Foundation.
Opportunity Insights (formerly The Equality of Opportunity Project (https://opportunityinsights.org/).
Price, G.N., Spriggs, W., and Swinton, O.H. 2011. “The relative returns to graduation from a Historically Black College/University: Propensity score matching estimates from the National Survey of Black Americans.” Review of Black Political Economy 38: 103-130.
Tatum, B.D. 1997. Why Are all the Black kids sitting together in the cafeteria? And other conversations about race. New York, NY: Basic Books.
Turley, R. 2009. “College proximity: Mapping success to opportunity.” Sociology of Education 82(2): 126-146.
Williamson-Lott, J. 2008. Radicalizing the ebony tower: Black colleges and the Black freedom struggled in Mississippi. New York, NY: Teachers College Press.
Moving Upward and Onward: Income Mobility at Historically Black Colleges and Universities 20

Methodological AppendicesInstitutional CharacteristicsInstitutional characteristics and student body demographics are derived from IPEDS and have previously been linked to the IRS data. Variables include total undergraduate enrollment, tuition and fees, average faculty salary, instructional expenditures per student, rejection rate, endowment assets per student, and net cost for the bottom income quintile (a proxy for financial aid).
Student CharacteristicsWhile the data does not contain individual student-level characteristics, it does include aggregate student demographic information. To help describe variation in students’ peers across institutions, we highlight such information as the percent of students graduating with 150 percent of normal time, average SAT score, share of the student body by race/ethnicity, and share of college major by discipline (e.g. business, social sciences). These demographics also come from merged IPEDS data.
Downward MobilityThe reverse side of upward mobility is downward mobility, that some children will become less affluent than their parents. This is of increasing concern as real-wage income growth for middle-income earners has stagnated over the last several decades (DeSilver, 2018). Appendix Table A1 reports several down-ward mobility measures.
One-quarter of children at HBCUs experienced downward mobility, which is one-third less than students at PWIs. This suggests that for most students attending an HBCU improves their long-term economic outlook.
Table A1. Downward Mobility
H B C U P W I
M E A S U R E
Downwardly Mobile 25.62% 38.44%
End up in 1st or 2nd Quintile -- --
Overall 30.03% 24.43%
Excluding P1->C21 24.47% 23.00%
Excluding starting in P1 or P2 13.07% 18.30%
1 Parent in first quintile, child in second quintile
Moving Upward and Onward: Income Mobility at Historically Black Colleges and Universities 21
Please cite as: Natheson, R., Castro Samayoa, A., & Gasman, M. (2019). Onward and upward: Income mobility at Historically Black Colleges and Universities. New Brunswick, NJ: Rutgers Center for Minority Serving Institutions.
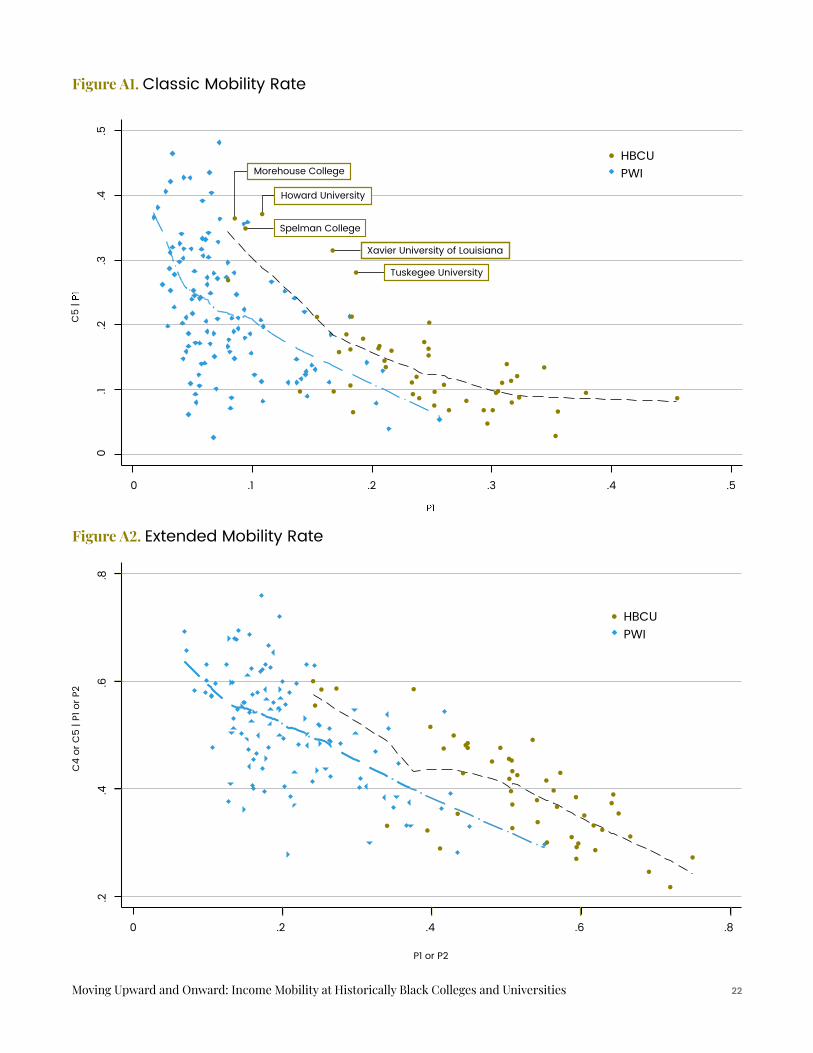
Figure A1. Classic Mobility Rate
Figure A2. Extended Mobility Rate
Moving Upward and Onward: Income Mobility at Historically Black Colleges and Universities 22
0.1
.2.3
.4.5
0 .1 .2 .3 .4 .5
C5
| P
P1
Howard University
Spelman College
Xavier University of Louisiana
Tuskegee University
HBCU
PWIMorehouse College
HBCU
PWI
.2.4
.6.8
0 .2 .4 .6 .8
C4
or
C5
| P
1 o
r P2
P1 or P2
Related Documents