1 Income Inequality and the Resource Curse † Osiris PARCERO a Elissaios PAPYRAKIS b, c a Department of Economics and Finance, United Arab Emirates University, United Arab Emirates b School of International Development, University of East Anglia, Norwich, UK c Institute for Environmental Studies, Vrije Universiteit Amsterdam, Amsterdam, The Netherlands Abstract Surprisingly, there has been little research conducted about the cross-country relationship between mineral abundance and income inequality. At the same time, there is some tentative evidence suggesting that mineral rich nations tend to under-report data on income inequality, which can potentially influence any estimated empirical relationship between mineral resources and income inequality. In this paper we contribute to the literature in a twofold manner. First, we explore in depth the empirical relationship between mineral abundance and income inequality by making use of the Standardized World Income Inequality Database – the most comprehensible dataset on income inequality providing comparable data for the broadest set of country-year observations. Second, this is the first study to our knowledge that adopts an empirical framework to examine whether mineral rich nations tend to under-report data on income inequality and the possible implications thereof. We make use of Heckman selection models to validate the tendency of mineral rich countries to under-report and correct for the bias that might arise as a result of this – contrary to what the earlier resource curse literature has suggested, we find that mineral abundant economies appear to suffer less from income inequality. Acknowledgements: We would like to thank Abdul Rashid Faizi for his excellent research assistance. Keywords: Income Inequality, Resource Curse JEL classification: D63, N50, O57 † Correspondence: Elissaios Papyrakis, School of International Development, University of East Anglia, Norwich, NR4 7TJ, UK, tel. +44 - 1603 - 59 2338, fax. +44 - 1603 - 45 1999, e-mail [email protected].

Welcome message from author
This document is posted to help you gain knowledge. Please leave a comment to let me know what you think about it! Share it to your friends and learn new things together.
Transcript
1
Income Inequality and the Resource Curse †
Osiris PARCERO a
Elissaios PAPYRAKIS b, c
a
Department of Economics and Finance, United Arab Emirates University, United Arab Emirates
b School of International Development, University of East Anglia, Norwich, UK
c Institute for Environmental Studies, Vrije Universiteit Amsterdam, Amsterdam, The Netherlands
Abstract
Surprisingly, there has been little research conducted about the cross-country relationship between mineral
abundance and income inequality. At the same time, there is some tentative evidence suggesting that
mineral rich nations tend to under-report data on income inequality, which can potentially influence any
estimated empirical relationship between mineral resources and income inequality. In this paper we
contribute to the literature in a twofold manner. First, we explore in depth the empirical relationship
between mineral abundance and income inequality by making use of the Standardized World Income
Inequality Database – the most comprehensible dataset on income inequality providing comparable
data for the broadest set of country-year observations. Second, this is the first study to our knowledge
that adopts an empirical framework to examine whether mineral rich nations tend to under-report data
on income inequality and the possible implications thereof. We make use of Heckman selection
models to validate the tendency of mineral rich countries to under-report and correct for the bias that
might arise as a result of this – contrary to what the earlier resource curse literature has suggested, we
find that mineral abundant economies appear to suffer less from income inequality.
Acknowledgements: We would like to thank Abdul Rashid Faizi for his excellent research assistance.
Keywords: Income Inequality, Resource Curse
JEL classification: D63, N50, O57
† Correspondence: Elissaios Papyrakis, School of International Development, University of East Anglia, Norwich,
NR4 7TJ, UK, tel. +44 - 1603 - 59 2338, fax. +44 - 1603 - 45 1999, e-mail [email protected].

2
1. INTRODUCTION
In recent years there has been a fast expanding literature researching the impacts of resource
abundance on several measures of economic performance. Much of the so-called resource curse
literature has developed theoretical and empirical research explaining the negative correlation
observed between several measures of mineral abundance and long-term economic growth (Andersen
and Aslaksen, 2008; Arezki and van der Ploeg, 2010; Baggio and Papyrakis, 2010; Caselli and
Cunningham, 2009; Gylfason and Zoega, 2006; Kolstad, 2009; Mursheb and Serino, 2011; Papyrakis
and Gerlagh, 2004, 2007; Papyrakis, 2011, 2014; Sachs and Warner 1995, 1997, 1999a, 1999b,
2001).
Several explanations of the underperformance of mineral rich economies have been provided in
the literature. A first stream of the literature has focused on political economy explanations
associating mineral resources with the presence of inferior institutions and rent-seeking competition
(Bjorvatn and Naghavi, 2011; Bjorvatn and Selvik, 2008; Bulte et al., 2005; Dalmazzo and De Blasio,
2003; Torvik, 2002; Wick and Bulte, 2006). Competition for natural resource rents might also lead to
violent conflict, particularly in the case of ethnically fragmented societies (see Brunnschweiler and
Bulte, 2009; Dixon, 2009; Olsson, 2007). A second branch of the literature looks at Dutch Disease (DD)
explanations of the negative economic side-effects of resource abundance (Beine et al., 2010; Cherif,
2013; Corden, 1984; Corden and Neary, 1982; Pegg, 2010; Papyrakis and Raveh, 2013; Torvik, 2002).
In this context mineral exports can cause both a relocation of production factors from various sectors
towards the mineral sector as a result of wage premia in the latter (i.e. the so-called resource movement
effect), as well as inflationary pressures and loss of competitiveness in exporting industries (i.e. the so-
called spending effect).
While the resource curse literature initially focused attention on economic growth impacts, it
gradually broadened its scope to other development variables. For example, Bulte et al. (2005) and

3
Daniele (2011) demonstrated that mineral resource dependence is associated with lower values of the
Human Development Index (a composite development index of life expectancy, education and GDP per
capita), undernourishment, higher child mortality and limited access to safe water. Ross (2008) claimed
that oil dependence is associated with gender inequality measured by reduced female political
representation and labour participation. Mineral-rich countries are also expected to be characterised by
reduced genuine savings (i.e. net total investment in physical, natural and human capital), that is often
used as a measure of long-term (weak) sustainability (assuming that different forms of capital are
perfectly substitutable, see Atkinson and Hamilton, 2003; Boos and Holm-Müller, 2012; Dietz and
Neumayer, 2007). There is also some tentative evidence of a poor empirical track record of poverty
alleviation in mineral dependent economies (see Pegg, 2006).
Surprisingly, though, there has been little research conducted about the relationship between mineral
wealth and income inequality. Mineral rents can, in principle, reduce income inequality if the revenues
become redistributed equitably and possibly target lower income groups. On the other hand, an
expansive mineral sector can also exacerbate income inequality by reducing production in the non-
resource economy via Dutch Disease effects, by inducing rent-seeking behaviour and disproportionately
benefiting specific interest groups (particularly in ethnically fragmented societies, see Fum and Hodler,
2010) and/or disadvantaging the mineral-scarce regions within the country (Ross, 2007). Ross (2007)
claims that the Gini coefficient (the typical measure of income inequality) tends to be uncorrelated with
mineral dependence, although he acknowledges that this might be driven by a sample bias. Mineral rich
nations tend to under-report data on income inequality, which can potentially influence any estimated
empirical relationship between mineral dependence and income inequality (Ross, 2007). Gylfason and
Zoega (2003) mention that resource abundance is likely to increase income inequality when the
distribution of natural capital is more unequal compared to other forms of capital in the economy. In
an earlier paper, Leamer et al. (1999) suggest that the availability of natural resources (primarily land)
4
reduces human capital accumulation, diverts physical capital away from manufacturing and worsens
income inequality.
In this paper we contribute to this strand of the literature in a twofold manner. First, we explore
in depth the empirical relationship between mineral abundance and income inequality by making use
of the Standardized World Income Inequality Database (SWIID) developed by Solt (2009). This is
one the most comprehensible dataset on income inequality providing comparable data for the broadest
set of country-year observations. While our primary focus is to shed light on the links between
mineral wealth and income inequality, our empirical specifications also control for other variables
that have been found to influence income inequality in the literature. Secondly, this is the first study
to our knowledge that adopts an empirical framework to examine whether mineral rich nations tend to
under-report data on income inequality and the possible implications thereof. We make use of
Heckman selection models to validate the tendency of mineral rich countries to under-report and
correct for the bias that might arise as a result of this – contrary to what the earlier resource curse
literature has suggested, we find that mineral abundant economies appear to suffer less from income
inequality.
The next section is devoted to our empirical analysis on income inequality and mineral
abundance. Section 3 focuses on the under-reporting behaviour of mineral rich nations and presents a
series of Heckman selection models that allow to correct for the bias that might arise from such
under-reporting. Section 4 concludes.
2. INEQUALITY AND MINERAL ABUNDANCE
In this section we explore the dependence of income inequality on mineral resource abundance, as
well as on a vector of other explanatory variables that have been found to be important in the
literature. We rely on cross-country panel regressions to draw empirical estimations for these
underlying relationships. A matrix reporting all pairwise correlations between all dependent and

5
explanatory variables in our analysis is presented in Appendix 1. Our initial empirical specification is
of the following form:
( ) , (1)
where Giniit is the Gini coefficient of (gross/net) income inequality for country i at time t, Mineralsi(t-
5) refers to mineral resource abundance (5-year lagged values), Z it is a vector of control variables
found to explain cross-country variation in income inequality in the literature, and ε it corresponds to
the error term1. One needs to keep in mind that an omitted variable bias can either over or under-
estimate the coefficient of mineral abundance if the latter is correlated with unobserved characteristics
that have not been accounted for. To be on the safe side, we examined for all regressions how the
residuals (i.e. the unobserved component of income inequality) correlate with mineral abundance (see
Beck, 2008 for a similar approach) – in all regressions the correlation was rather small and
statistically insignificant, implying that the omitted variable bias for the adopted specifications is not
of great concern.
We estimate equation (1) using pooled OLS regressions with country observations from an
unbalanced panel (for the years 1975 - 2005). We opted for pooled OLS estimations, given that it is
customary in the empirical literature to treat panels as extended cross-sectional datasets when
pursuing baseline comparisons against panel Heckman selection models (which in effect also make
use of pooled OLS procedures; e.g. see Dastidar, 2009; Dutt and Traca, 2009; Tang and Wei, 2009;
Wooldridge, 1995; Zhou et al. 2011). We present our empirical estimations in Table 1. Our dependent
variable is the log of the Gini coefficient of net income inequality (that is, public redistribution in the
form of taxes and fiscal transfers is taken into account when index values are calculated). The
coefficient ranges between 0 and 100, with larger values corresponding to more unequal income
1 Appendix 2 lists all variable descriptions and data sources. Descriptive statistics are presented in Appendix 3.
6
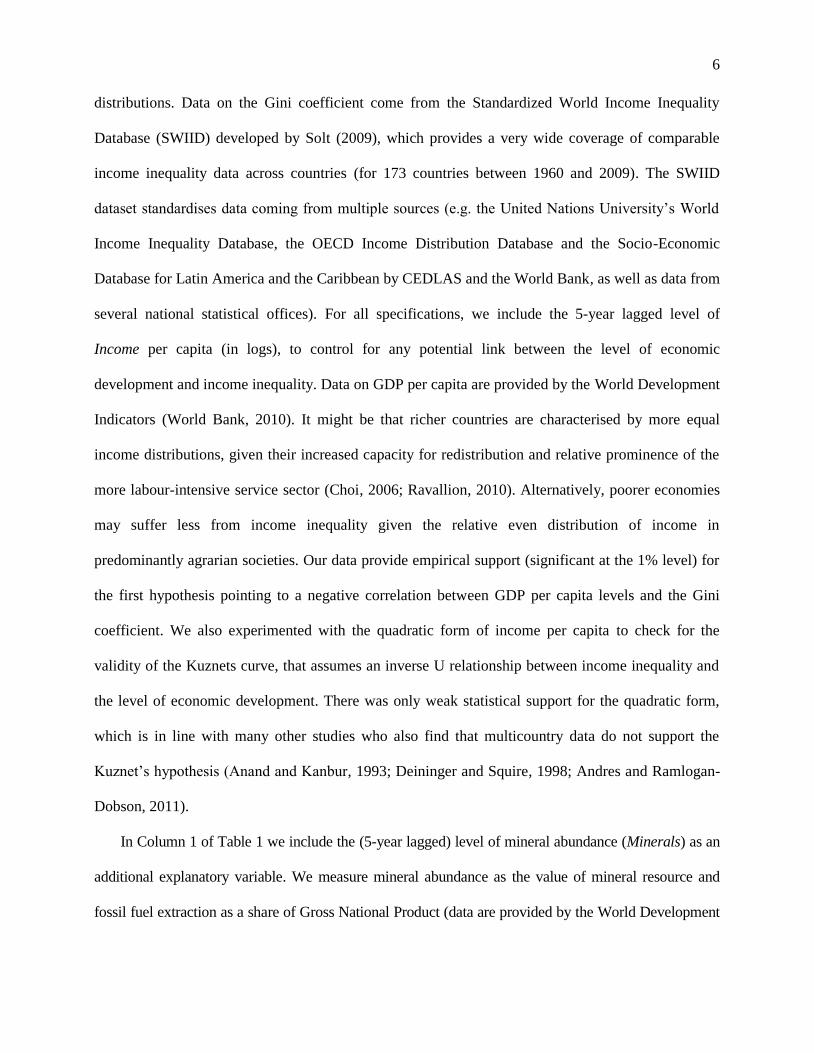
distributions. Data on the Gini coefficient come from the Standardized World Income Inequality
Database (SWIID) developed by Solt (2009), which provides a very wide coverage of comparable
income inequality data across countries (for 173 countries between 1960 and 2009). The SWIID
dataset standardises data coming from multiple sources (e.g. the United Nations University’s World
Income Inequality Database, the OECD Income Distribution Database and the Socio-Economic
Database for Latin America and the Caribbean by CEDLAS and the World Bank, as well as data from
several national statistical offices). For all specifications, we include the 5-year lagged level of
Income per capita (in logs), to control for any potential link between the level of economic
development and income inequality. Data on GDP per capita are provided by the World Development
Indicators (World Bank, 2010). It might be that richer countries are characterised by more equal
income distributions, given their increased capacity for redistribution and relative prominence of the
more labour-intensive service sector (Choi, 2006; Ravallion, 2010). Alternatively, poorer economies
may suffer less from income inequality given the relative even distribution of income in
predominantly agrarian societies. Our data provide empirical support (significant at the 1% level) for
the first hypothesis pointing to a negative correlation between GDP per capita levels and the Gini
coefficient. We also experimented with the quadratic form of income per capita to check for the
validity of the Kuznets curve, that assumes an inverse U relationship between income inequality and
the level of economic development. There was only weak statistical support for the quadratic form,
which is in line with many other studies who also find that multicountry data do not support the
Kuznet’s hypothesis (Anand and Kanbur, 1993; Deininger and Squire, 1998; Andres and Ramlogan-
Dobson, 2011).
In Column 1 of Table 1 we include the (5-year lagged) level of mineral abundance (Minerals) as an
additional explanatory variable. We measure mineral abundance as the value of mineral resource and
fossil fuel extraction as a share of Gross National Product (data are provided by the World Development

7
Indicators of the World Bank (2010)). The coefficient of the mineral abundance is a focal point of our
analysis. Mineral rents can, in principle, either reduce income inequality (if they become equitably
redistributed) or exacerbate it (for example by disproportionately benefiting certain interest groups or
crowding out via Dutch Disease effects other labour-intensive non-resource sectors; see Fum and Hodler,
2010 and Ross, 2007). Gylfason and Zoega (2003) suggest that mineral abundance can increase income
inequality if natural capital is more unequally distributed in comparison to other production factors.
Surprisingly, little is known about the empirical relationship between income inequality and mineral
abundance. Column 1 points to a negative correlation between the (net) Gini coefficient and mineral
abundance, suggesting, hence, that mineral resources tend to be beneficial in terms of reducing income
inequality (please note that the effect becomes of much higher statistical significance in subsequent
richer specifications).
Insert Table 1
Column 2 expands the set of explanatory variables by including the log of the Polity 2 variable from
the Polity IV Project (variable Institutions) as a measure of institutional quality and the democratic
accountability of the political system (Marshall and Jaggers, 2009). The variable is arguably the most
commonly used source of information for capturing cross-country variation in democratic (vs.
authoritarian) governance (Plümper and Neumayer, 2010). Higher values of the index correspond to
more extensive democratic governance (we have rescaled the index to a 10-30 range in order to avoid
zero values). Lee (2005) claims that fully institutionalised democracies are characterised by lower
income inequality as a result of successful targeted redistribution – “democratic political mechanisms
enable state institutions to be more responsive to the demands of the lower classes and more committed
to achieving better distributional outcomes”. In more authoritarian regimes, governments may use the

8
public sector and fiscal mechanisms to selectively support industries and lobby groups with vested
interests in government policies. Democratic institutions support the establishment of trade unions and
political parties that represent the lower and middle classes and the expansion of suffrage has been
historically associated with decreases in income inequality (see Reuveny and Li, 2003).
In Column 3 we enrich our empirical specification by including two additional regressors that have
been found to correlate with income inequality in the literature. First, we introduce the share of
agriculture in GDP (Agriculture) as an additional explanatory variable. One might expect a negative
correlation between agriculture and income inequality to the extent that income distribution is more
equally distributed across agrarian economies (e.g. see Andres and Ramlogan-Dobson, 2011; Chong,
2004). Data on the value of agricultural production are from the World Development Indicators (World
Bank, 2010). Second, we include an index of ethnic fractionalisation in column (2). We make use of the
ethnic fractionalisation index by Montalvo and Reynal-Querol (2005), which captures the probability
of two randomly chosen individuals from the general population belonging to different ethnic groups.
The index is of the following form: fractionalisation
N
i i1
21 , where πi stands for the proportion of
the total population belonging to the i-th ethnic group and N stands for the number of groups. The
fractionalisation index approaches unity as the number of different ethnic groups in the economy
increases (and takes the value of zero for a perfectly homogenous society). The index by Montalvo and
Reynal-Querol (2005) is one of the most commonly used proxies of ethnic fragmentation in the
economic literature (e.g. see Akdede, 2010; Cole et al., 2013; Papyrakis, 2013) and largely correlates
with other indices that use slightly different levels of disaggregation amongst ethnic groups (e.g. the ones
by Alesina et al., 2003). As it is common in cross-country empirical analysis, the index of
fractionalisation enters the regressions as a time invariant variable (it is customary in the economic
literature to treat ethnic diversity as a non-time-varying variable due to limited data availability; e.g.
see Arezki and Brückner, 2012; Montalvo and Reynal-Querol, 2005). Ethnic heterogeneity is likely to

9
increase income inequality as a result of competitive rent-seeking across ethnic groups and selective
redistributive government policies (Clarke et al., 2006; Easterly and Levine, 1997; Milanovic, 2003).
We find that the GDP share of agriculture is negatively correlated with income inequality as predicted by
theory (although the corresponding coefficient is statistically insignificant). Furthermore, we find ethnic
heterogeneity to be positively associated with income inequality (and statistically significant at the
1% level).
Column 4 introduces Trade Openness as an additional explanatory factor behind cross-country
variation in income inequality (measured by the 5-year lagged log values of exports and imports in
GDP; data are provided by the World Development Indicators (World Bank, 2010)). Several
theoretical papers suggest that trade openness and globalisation can either increase (Monfort and
Nicolini, 2000; Paluzie, 2001) or decrease (Alonso-Villar, 2001; Behrens et al., 2007) regional
income inequality dependent on the spatial implications of trade integration (i.e. patterns of internal
dispersion or agglomeration of economic activity and comparative advantage). Empirical evidence is
also mixed with some studies pointing to a positive (Ezcurra and Rodríquez-Pose, 2013; Rodríquez-
Pose, 2012) and some to a negative (Asteriou et al., 2014; Zhou et al., 2011) effect of trade expansion
on income inequality (with the relationship largely depending on the sample selection and empirical
specification). We find trade openness to have a positive correlation with income inequality
(significant at 10%).
In Column 5, we also interact our mineral abundance measure with our institutional proxy
(Minerals*Institutions), given that many papers in the empirical literature on the resource curse suggest
that the development impacts of mineral abundance depend on the incumbent institutional environment
(i.e. good institutions can turn a ‘resource curse’ into a ‘resource blessing’, see Boschini et al., 2007,
Brunnschweiler, 2008, Kolstad, 2009 and Mehlum et al., 2006). For this reason, special consideration
needs be given to the coefficients of minerals, institutions as well as their interaction term (the
10
coefficients of the other variables remain rather stable after the inclusion of the interaction term in
Column 5). The interaction term does not allow for a direct interpretation of the coefficient of the mineral
abundance variable, given that its effect is conditioned on institutional quality – for this reason (as it is
standard in the empirical literature), it is more appropriate to look at the marginal effects of Minerals
instead. Figure 1 presents the marginal effects of mineral abundance on net income inequality for varying
values of institutional quality for specification 5 of Table 1. As it can be seen, the marginal effect from
mineral resources is negative and moreover, the magnitude of the effect increases with institutions
(suggesting that good institutions further increase the inequality-reducing effect of mineral abundance).
The confidence intervals (dotted lines) around the marginal effects line determine the statistical
significance of the marginal effect of minerals (at each given level of institutional quality); the marginal
effect is statistically significant at the 5% level when both the upper and lower bounds of the confidence
intervals are below the zero line (i.e. for values of Institutions above 2.48). One can see, that, for
countries where Institutions are close to the sample-mean value of 3.22, a difference in the share of
Minerals in GNP of 100 percentage points (i.e. the difference between a country that produces no
minerals and one where mineral rents are equal to its GDP) is associated with a drop of the Gini
coefficient (in logs) for the latter by 0.39 (i.e. 0.0039*100), or a drop by 32.3% of the Gini in absolute
values.
Insert Figure 1
Appendix 4 focuses on the Gini coefficient of gross income inequality (that is, the Gini
coefficient excluding public redistribution in the form of taxes and fiscal transfers) as the dependent
variable. In Table A1, we replicate the exact sequence of regressions found in Table 1 for the case of
gross income inequality. Data on gross income inequality are again provided by Solt (2009). Contrary

11
to Table 1, we find that richer economies tend to suffer more from higher levels of gross income
inequality (the opposite sign of Table 1 is likely to reflect the larger capacity of richer economies to
redistribute income via taxes and fiscal transfers). The results with respect to the coefficient of
mineral abundance (as well as its interaction term) are in line with the earlier findings of Table 1 (i.e.
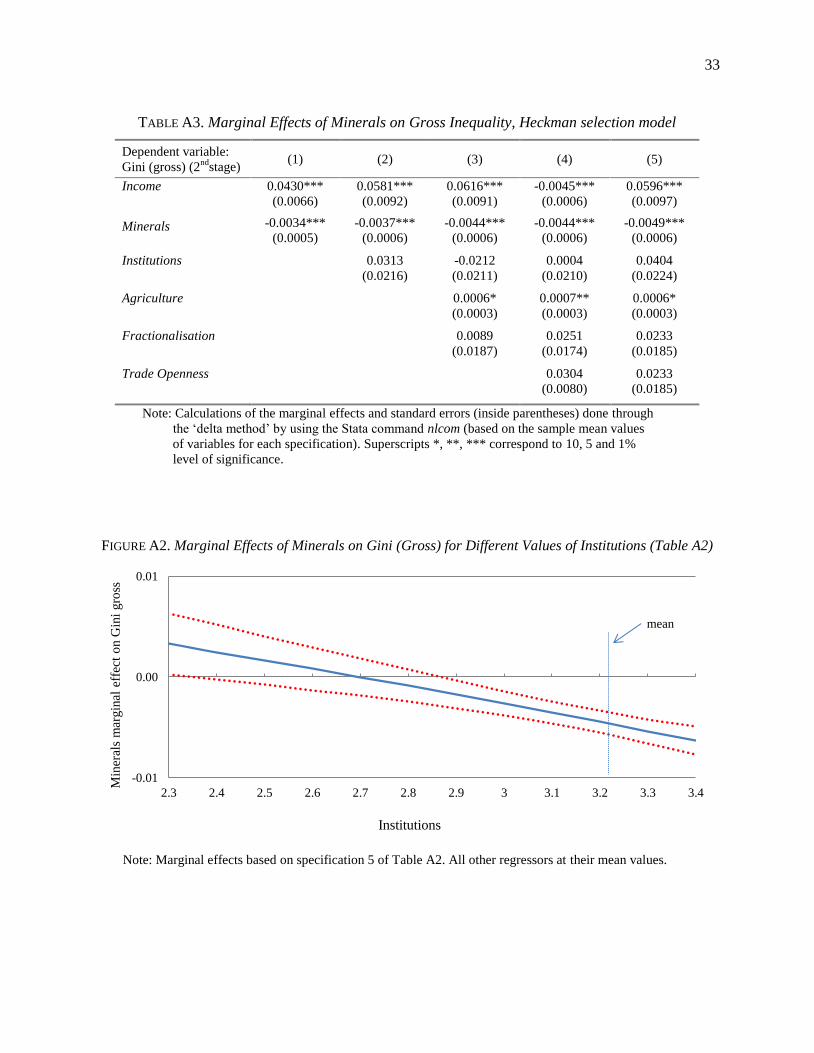
minerals tend to be associated with lower levels of gross income inequality). Figure A1 presents the
marginal effects of mineral abundance on net income inequality for varying values of institutional quality
for Column 5 of Table A1. Results are similar to Figure 1 – minerals are associated with lower gross
income inequality (for values of Institutions above 2.4), and the effect increases as Institutions improve
(the effect is statistically significant at the 5% for values of Institutions above 2.63).
3. MINERAL ABUNDANCE, UNDER-REPORTING AND HECKMAN CORRECTION
In an earlier study, Ross (2007) claimed that mineral rich countries tend to under-report data on
income inequality. Such under-reporting and corresponding sample bias can influence any estimated
empirical relationship between measures of mineral abundance and income inequality to the extent
that under-reporting is not random and correlates with mineral abundance and other underlying
factors. In this section we estimate a series of Heckman selection models that allow us to correct for
the bias that might arise from such under-reporting when estimating the relationship between
inequality and minerals. The first stage of the Heckman selection model estimates a selection
equation, where the propensity to report (or not) depends on a number of factors. In this step (which
is equivalent to a Probit regression) we hypothesise that reporting on income inequality can be
influenced by the extent of mineral abundance (if indeed governments in mineral rich countries lack
transparency and are reluctant to reveal sensitive information related to income inequality; see
Williams, 2011). Several papers in the literature suggest that mineral-rich countries suffer from
limited transparency (e.g. in terms of disclosing fiscal information; see de Renzio, 2009; O’Lear,
2011; Kalyuzhnova, 2011) – a phenomenon which could possibly also extend to the provision of
12
inequality-related information. In mineral rich nations there is generally lower dependence on taxes
and heavier reliance on resource rents, which possibly reduces citizen demand for government
accountability and transparency (e.g. see Ross, 2001; Sandbu, 2006). Naturally, some countries might
under-report data on income inequality as a result of a broader tendency to under-report data of any
kind, for example as a consequence of weak government administration (i.e. the tendency to under-
report data on income inequality may reflect inadequate government capacity, or simply bad practice,
rather than any intentional effort to conceal information that could be considered to be sensitive). For
this reason we construct an index (Data Reporting Index) that proxies the overall tendency (capacity)
of countries to report data of any kind2 – we measure this as the number of data entries reported for
any variables appearing in the World Development Indicators database for country i and year t
(World Bank, 2010) as a share of the maximum number of data entries provided by the best
performer in the sample in terms of reporting behaviour for that particular year. In the selection
equation (see bottom panel of Table 2) the dependent variable is a dummy variable taking the value of
1 if the country reports information on income inequality and zero otherwise. We expect that the Data
Reporting Index is likely to correlate positively with the probability of disclosing data on income
inequality.
More specifically, the Heckman model considers that observations are ordered into two regimes.
In the present context these regimes are defined by whether or not the country reports data on
inequality. The first stage defines a dichotomous variable indicating the regime into which the
observation falls:
( )
(2)
2 In addition this variable acts as an exclusion restriction. In the Heckman selection model an exclusion restriction is
a variable that appears in the selection equation, but not in the outcome equation. The inclusion of such a variable is
the most common means of solving the over-identification problem, see Fu and Mare (2004).

13
(3)
where is a latent variable indicating the utility of reporting data on income inequality, is an
indicator for the reporting behaviour, the is the vector of control variables already defined above,
and is the error term. We use the two-step method estimation which is based on the following
conditional expectation3:
( ( ) ) ( ) ( ( ) ( )⁄ ) ,(4)
where ( ( ) ( )⁄ ) is the inverse Mill’s ratio, defined by the ratio of the density function of the
standard normal distribution, , to its cumulative density function, . The third term in (4) can be
estimated by ( ( ) ), where , and
are
obtained by applying a probit regression to (2). The regression of on ( ) and
and the generated regressor, ( ( ) ) yields a
semi-parametric estimate of ( ).
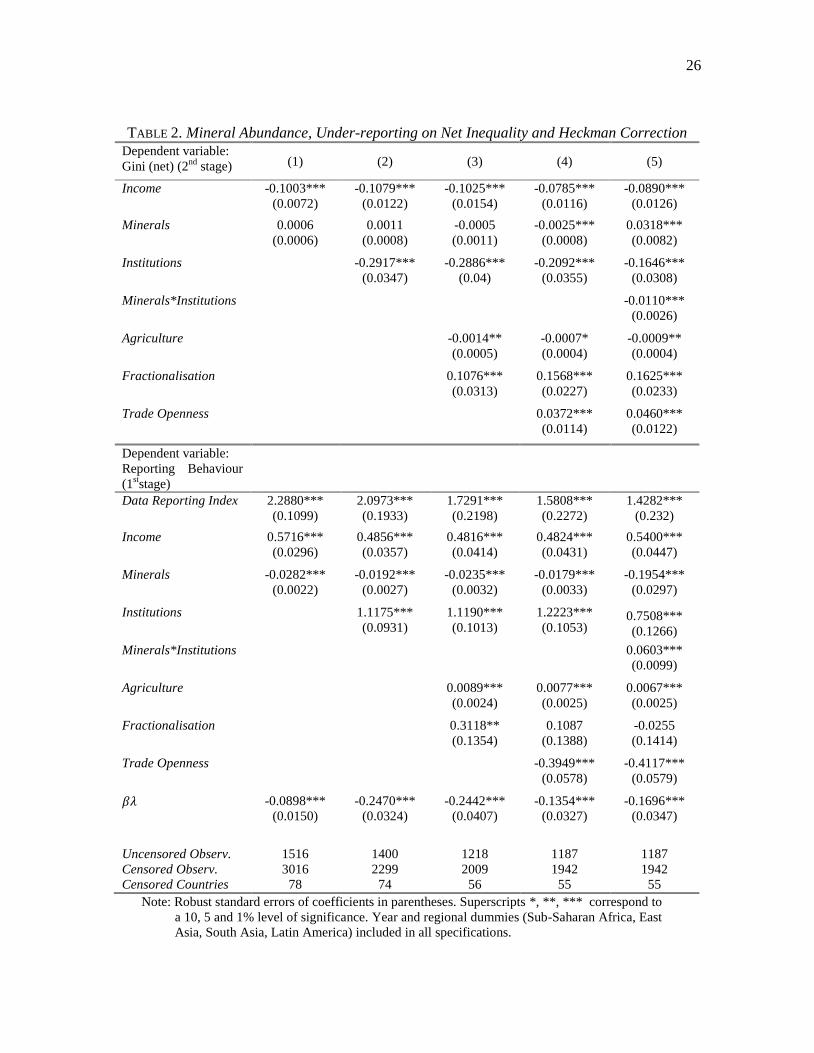
The results of the first stage of the Heckman selection model are presented at the bottom panel of
Table 2, where the first regressor is the Data Reporting Index and the rest of the regressors appear in
the same order as the ones present in the empirical specifications of Table 1 (i.e. the panel regressions
that do not correct for any systematic selection bias). Some interesting findings are revealed. First, in
line with Ross (2007), we find that mineral rich nations tend to under-report on income inequality (a
relationship that is statistically significant at 1% level in all the specifications). This holds even when
we control for the Data Reporting Index, which captures the overall tendency (capacity) of countries
to report data of any kind (the effect is positive and statistically significant). Democratic
3 The two-step estimation relies on a univariate normality assumption for and and is expected to be relatively
more robust that the Maximum Likelihood estimation, which relies on a bivariate normality assumption.

14
accountability (Institutions) is also positively and significantly correlated with reporting behaviour
and the interactive term (Minerals*Institutions) suggests that mineral-rich nations endowed with good
institutions suffer less from under-reporting (see Column 5 of Table 2). It is important to note that the
parameter λ (bottom panel of Table 2) appears to be significant in all regressions, suggesting that the
null hypothesis of a selection problem is not rejected. In more technical words, the null hypothesis
that the two parts of the model are independent is rejected.
Insert Table 2
The results of the second stage of the Heckman Selection Model (top panel of Table 2) make
inferences based on both, the countries reporting data on inequality, as well as the non-reporting ones
for which data were inferred based on the first stage. However, the coefficients of the Heckman’s
second stage cannot be directly interpreted as the corresponding marginal effects, which need to be
calculated separately. Some earlier papers in the literature show unawareness of this issue, though the
formula for the calculation of the marginal effect in the Heckman Selection Model has been gaining
popularity. The formula is explained in detail in Green (2000), as well as in Hoffmann and Kassouf
(2005). Moreover, a general version of it is proposed in Frondel and Vance (2009), which allows for
the calculation of the marginal effect even in the presence of interactive terms. The marginal effects
in effect capture both the direct effect of the independent variable on income inequality (second stage
of Heckman) as well as the indirect effect on the probability that an observation is part of the sample
(first stage of Heckman). Moreover, there are two types of marginal effects in the Heckman Selection
Model, the conditional and the unconditional ones. The conditional marginal effect is the one for the
observed (uncensored) sample and so the most appropriate to be compared against the coefficients
(marginal effects) from the pooled OLS regressions (Section 2). These conditional marginal effects,

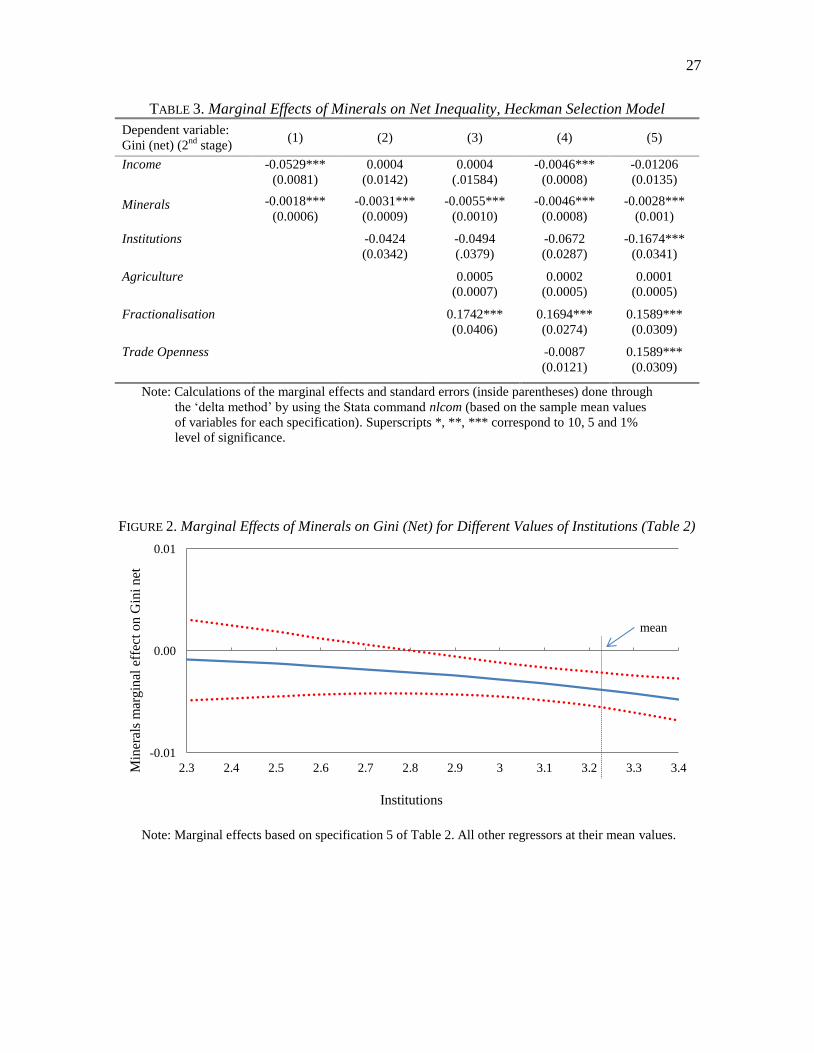
15
calculated by using formula A1 in Appendix 5 (see Frondel and Vance, 2009, for a detailed
description) are presented in Table 3. Clearly, the marginal effects do not need to have the same
magnitude or even the same sign as the second stage coefficients; the latter case occurs, for example,
for the variable Agriculture (please compare top panel of Table 2 with Table 3).4 Minerals are
negatively associated with net income inequality for all specifications (and are statistically significant
at the 1% level). Fractionalization also appears to have a consistently positive and significant effect
on net income inequality. In other words, the earlier findings in Table 1, pointing to an inequality-
reducing effect of minerals, are robust to any selection bias arising from the tendency of mineral-rich
countries to under-report data on income inequality.
Insert Table 3
Figure 2 presents the marginal effects of mineral abundance on net income inequality for varying
values of institutional quality for the richer specification 5 of Table 2. Minerals are associated with lower
net income inequality, and the effect increases in magnitude as Institutions improve (the effect is
statistically significant at the 5% for values of Institutions above 2.8). In other words, while there is
evidence that mineral rich economies under-report data on income inequality, our data analysis
largely suggests that mineral richness is more likely to be associated with lower rather than higher
income inequality. The tendency of governments in mineral-rich countries to under-report data on
income inequality may simply reflect their general predisposition towards limited transparency and
accountability (Williams, 2011, Renzio, 2009; O’Lear, 2011; Kalyuzhnova, 2011), rather than any
intentional effort to conceal underperformance in tackling inequality. The fact that this holds even
4 The reason for that is clear in Appendix 5’s formula A1. Note that one important determinant of the marginal effect
sign is the sign of ( ), whose values are reported in Table A4 (Appendix 5).

16
when we include the Data Reporting Index (that aims to measure the overall tendency (capacity) of
countries to report data of any kind), might suggest that mineral-rich countries might consider less
important to provide detailed data on income inequality, possibly because of reduced citizen demand
for government accountability and provision of such generally-perceived sensitive statistics (as a
result of lower dependence on taxes).
Insert Figure 2
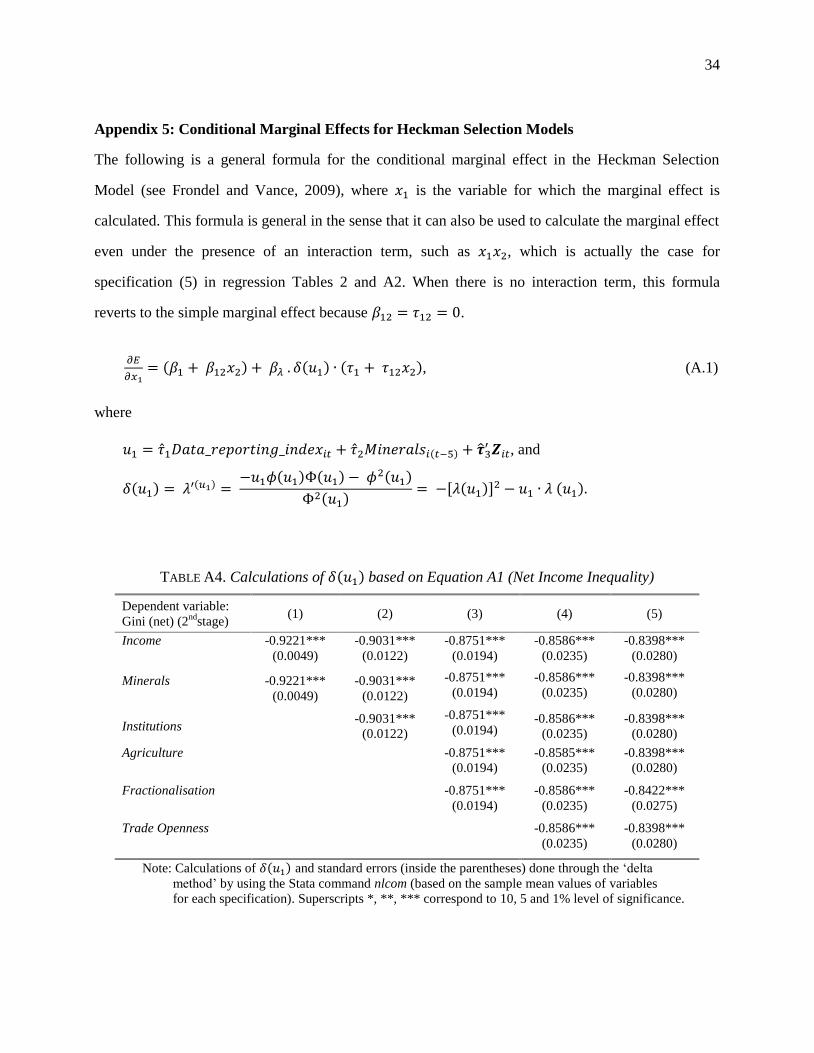
Table A2 (in Appendix 5) replicates Table 2 for the case of gross income inequality. The results of
the first stage of the Heckman Selection model are identical to those in Table 2, given that there is an
identical number of missing data for both gross and net income inequality. The conditional marginal
effects, calculated by using formula A1 in Appendix 5, are presented in Table A3 of Appendix 4. 5
Figure A2 (in Appendix 4) presents the marginal effects of mineral abundance on gross income
inequality for varying levels of institutional quality based on specification (5) of Table A2. Minerals
are associated with lower net income inequality for sufficiently high levels of institutional quality (above
2.7), and the effect increases in magnitude as Institutions improve (the effect is statistically significant at
the 5% for values of Institutions above 2.85).
4. CONCLUSION
There has been an increasing interest in recent years in how mineral affluence can affect the
development trajectory of mineral rich nations. Mineral revenues can in principle magnify the ability
of governments to reduce income inequality and improve the relative position of the economically
5 The respective values for ( ) are reported in Table A5.

17
disadvantaged. Surprisingly, though, the relationship between mineral wealth and income inequality has
been largely under-researched. In this paper we empirically explore in depth the relationship between
mineral abundance and income inequality by making use of the Standardized World Income
Inequality Database (SWIID) and we pay particular attention to the tendency of mineral rich nations
to under-report relevant data. We make use of Heckman selection models to correct for the bias that
might arise from such under-reporting when estimating the relationship between inequality and
minerals. We show that once we control for under-reporting behaviour, mineral abundant economies
appear to suffer, in general, from lower rather than higher levels of income inequality.
These findings have significant policy implications. With limited information about the link
between mineral abundance and income inequality (and given the general presumption of the resource
curse literature pointing to a negative relationship between mineral resources and most development
outcomes), policy-makers are likely to expect that mineral rents tend to support a less equitable
distribution of income. The tendency of mineral rich economies to under-report data on income
inequality might also hint on an intentional effort to conceal such sensitive information. Here, we
have shown that mineral rich nations do not suffer from increased income inequality, as one might
expect at first sight. For this reason, governments in mineral rich nations, as well as the international
community (donors, international organizations) do not need to design a different set of distributive
policies bur rather pay more attention on how to utilize the resource rents against resource curse
‘ailments’ that are already well-established in the literature (such as the lack of economic
diversification or excessive investment in ‘white elephant’-type public investment projects).
The question of what makes some countries more successful than others in managing their
mineral wealth is certainly one of the most fascinating economists can ask. Our analysis is simply a
first step in exploring the intriguing relationship between mineral abundance and income inequality.
Future research could attempt to disentangle in more detail the mechanisms (or the “transmission
18
channels” as commonly referred to in the literature) through which mineral resources can influence
the income distribution – for example by looking at income inequality levels across regions, gender
groups or economic sectors. Another direction for future research would be to complement large-
sample econometric studies with more case histories of economic policy in mineral-rich countries
(e.g. by looking at how decision-making and redistributive policies are shaped in the context of
mineral dependent economies).
19
References
Akdede, S.H. (2010). Do more ethnically and religiously diverse countries have lower
democratization? Economics Letters 106: 101-104.
Alesina, A., Devleeschauwer, A., Easterly, W., Kurlat, S. and Wacziarg, R. (2003). Fractionalization.
Journal of Economic Growth 8: 155-194.
Alonso-Villar, O. (2001). Large metropolises in the third world: An explanation. Urban Studies 38:
1359–1371.
Anand, S. and Kanbur, S.M.R. (1993). Inequality and development: A critique. Journal of
Development Economics 41: 19-43.
Andersen, J.J. and Aslaksen, S. (2008). Constitutions and the resource curse. Journal of Development
Economics 87: 227-246.
Andres, A.R. and Ramlogan-Dobson, C. (2011). Is corruption really bad for inequality? Evidence
from Latin America. Journal of Development Studies 47: 959-976.
Atkinson, G. and Hamilton, K. (2003). Savings, growth and the resource curse hypothesis. World
Development 31: 1793-1807.
Arezki, R. and Brückner, M. (2012). Commodity windfalls, polarization, and net foreign assets: Panel
data evidence on the voracity effect. Journal of International Economics 86: 318-326.
Arezki, R. and van der Ploeg, F. (2010). Trade policies, institutions and the natural resource curse.
Applied Economics Letters 17: 1443-1451.
Asteriou, D., Dimelis, S. and Moudatsou, A. (2014). Globalization and income inequality: A panel
data econometric approach for the EU27 countries. Economic modelling 36: 592-599.
Baggio, J. and Papyrakis, E. (2010). Ethnic diversity, property rights, and natural resources.
Developing Economies 48: 473-495.
Beck, T. (2008). The econometrics of finance and growth. World Bank Policy Research Working
Paper No 4608.
Behrens, C., Caigné, C., Ottaviano, G.I.P., and Thisse, J.-P. (2007). Countries, regions and trade: On
the welfare impacts of economic integration. European Economic Review 51: 1277-1301.
Beine, M., Bos, C.S. and Coulombe, S. (2012). Does the Canadian economy suffer from Dutch
Disease? Resource and Energy Economics 34: 468-492.
Bjorvatn, K. and Naghavi, A. (2011). Rent seeking and regime stability in rentier states. European
Journal of Political Economy 27: 740-748.

20
Bjorvatn, K. and Selvik, K. (2008). Destructive competition: Factionalism and rent-seeking in Iran.
World Development 36: 2314-2324.
Boos, A. and Holm-Müller, K. (2012). A theoretical overview of the relationship between the
resource curse and genuine savings as an indicator for “weak” sustainability. Natural Resources
Forum 36: 145-159.
Boschini, A.D., Pettersson, J. and Roine, J. (2007). Resource curse or not: A question of
appropriability. Scandinavian Journal of Economics 109: 593-617.
Brunnschweiler, C.N. (2008). Cursing the blessings? Natural resource abundance, institutions, and
economic growth. World Development 36: 399-419.
Brunnschweiler, C.N. and Bulte, E.H. (2009). Natural resources and violent conflict: Resource
abundance, dependence, and the onset of civil wars. Oxford Economic Papers 61: 651-674.
Bulte, E., Damania, R. and Deacon, R.T. (2005). Resource intensity, institutions, and development.
World Development 33: 1029-1044.
Caselli, F. and Cunnigham, T. (2009). Leader behaviour and the natural resource curse. Oxford
Economic Papers 61: 628-650.
Cherif, R. (2013). The Dutch Disease and the technological gap. Journal of Development Economics
101, 248-255.
Choi, C. (2006). Does foreign direct investment affect domestic income inequality? Applied
Economics Letters 13: 811-814.
Chong, A. (2004). Inequality, democracy, and persistence: Is there a political Kuznets curve?
Economics and Politics 16: 189-212.
Clarke, G.R.G., Xu, L.C. and Zou, H. (2006). Finance and income inequality: What do the data tell
us? Southern Economic Journal 72: 578-596.
Cole, M.A., Elliott, R.J.R. and Khemmarat, K. (2013). Local exposure to toxic releases: Examining
the role of ethnic fractionalization and polarization. Ecological Economics 93: 249-259.
Corden, M.W. (1984). Booming sector and Dutch disease economics: Survey and consolidation.
Oxford Economic Papers 36: 359-380.
Corden, M.W. and Neary, P.J. (1982). Booming sector and de-industrialisation in a small open
economy. Economic Journal 92: 825-48.
Dalmazzo, A. and De Blasio, G. (2003). Resources and incentives to reform. IMF Staff Papers 50:
250-273.

21
Daniele, V. (2011). Natural resources and the quality of economic development. Journal of
Development Studies 47, 545-573.
Dastidar, P. (2009). International corporate diversification and performance: Does firm self-selection
matter? Journal of International Business Studies 40: 71-85.
de Renzio, P., Gomez, P. and Sheppard, J. (2009). Budget transparency and development in resource-
dependent countries. International Social Science Journal 57: 57-69.
Deininger, K. and Squire, L. (1998). New ways of looking at old issues: Inequality and growth.
Journal of Development Economics 57: 259–87
Dietz, S. and Neumayer, E. (2007). Corruption, the resource curse and genuine saving. Environment
and Development Economics 12: 33-53.
Dixon, J. (2009). What causes civil wars? Integrating quantitative research findings. International
Studies Review 11: 707-735.
Dutt, P. and Traca, D. (2010). Corruption and bilateral trade flows: Extortion or evasion. Review of
Economics and Statistics 92: 843-860.
Easterly, W. and Levine, R. (1997). Africa’s growth tragedy: Policies and ethnic divisions. Quarterly
Journal of Economics 112: 1203-1250.
Ezcurra, R. and Rodríquez-Pose, A. (2013). Does economic globalization affect regional inequality?
A cross-country analysis. World Development 52: 92-103.
Frondel, M. and Vance, C. (2009). On marginal and interaction effects: the case of Heckit and Two-
Part Models (No. 138). Ruhr economic papers.
Fu, V.K., Winship, C. and Mare, R.D. (2004). Sample selection bias models. In Hardy M. And
Bryman, A., Handbook of Data Analysis, London: Sage, pp. 409-430.
Fum, R.M. and Hodler, R. (2010). Natural resources and income inequality: The role of ethnic
divisions. Economics Letters, 107, 360-363.
Greene, W (2000). Econometric Analysis. 4th edition. London: Prentice Hall.
Gylfason, T. and Zoega. G. (2003). Inequality and economic growth: Do natural resources matter? In
Inequality and Growth: Theory and Policy Implications, Eicher, T. and Turnovsky, S. (eds.), MIT
Press, Cambridge (MA).
Gylfason, T. and Zoega, G. (2006). Natural resources and economic growth: The role of investment.
The World Economy 29: 1091-1115.
Hodler, R. (2006). The curse of natural resources in fractionalized countries. European Economic
Review 50: 1367-1386.

22
Hoffmann, R. and Kassouf, A.L. (2005). Deriving conditional and unconditional marginal effects in
log earnings equations estimated by Heckman's procedure. Applied Economics 37: 1303-1311.
Kalyuzhnova, Y. (2011). The National Fund of the Republic of Kazakhstan (NFRK): From
accumulation to stress-test to global future. Energy Policy 39: 6650-6657.
Kolstad, I. (2009). The resource curse: Which institutions matter? Applied Economics Letters 16:
439-442.
Leamer, E.E., Maul, H., Rodriguez, S. and Schott, P.K. (1999). Does natural resource abundance
increase Latin American income inequality? Journal of Development Economics 59: 3-42.
Lee, C.-S. (2005). Income inequality, democracy and public sector size. American Sociological
Review 70: 158-181.
Marshall, M.G. and Jaggers, K. (2009). Polity IV Project: Political regime characteristics and
transitions, 1800–2009; available online at www.systemicpeace.org/polity/polity4.htm.
Mehlum, H., Moene, K. and Torvik, R. (2006). Institutions and the Resource Curse. Economic
Journal 116: 1-20.
Milanovic, B. (2003). Is inequality in Africa really different? World Bank Working Paper 3169,
Washington DC.
Monfort, P. and Nicolini, R. (2000). Regional convergence and international integration. Journal of
Urban Economics 48: 286-306.
Montalvo, J.G. and Reynal-Querol. M. (2005). Ethnic diversity and economic development. Journal
of Development Economics 76: 293-323.
Murshed, S.Y. and Serino, L.A. (2011). The pattern of specialization and economic growth: The
resource curse hypothesis revisited. Structural Change and Economic Dynamics 22, 151-161.
O’Lear, S. (2007). Azerbaijan’s resource wealth: Political legitimacy and public opinion.
Geographical Journal 173: 207-223.
Olsson, O. (2007). Conflict diamonds. Journal of Development Economics 82: 267-86.
Paluzie, E. (2001). Trade policies and regional inequalities. Papers in Regional Science 80: 67-85.
Papyrakis, E. (2011). Resource windfalls, innovation, and growth. Journal of Economic Policy
Reform 14: 301-312.
Papyrakis, E. (2013). Environmental performance in socially fragmented countries. Environmental
and Resource Economics 55: 119-140.
Papyrakis, E. (2014). A development curse: Formal vs. informal activities in resource-dependent
economies. International Journal of Social Economics 41: 244-264.

23
Papyrakis, E. and Gerlagh, R. (2004). The resource curse hypothesis and its transmission channels.
Journal of Comparative Economics 32: 181-193.
Papyrakis, E. and Gerlagh, R. (2007). Resource abundance and economic growth in the United States.
European Economic Review 51: 1011-1039.
Papyrakis, E. and Raveh, O. (2013). An Empirical Analysis of a Regional Dutch Disease: The Case
of Canada. Environmental and Resource Economics, In Press.
Pegg, S. (2006). Mining and poverty reduction: Transforming rhetoric into reality. Journal of Cleaner
Production 35: 183-193.
Pegg, S. (2010). Is there a Dutch Disease in Botswana? Resources Policy 35: 14-19.
Plümper, T. and Neumayer, E. (2010). The level of democracy during interregnum periods: Recoding
the Polity2 score. Political Analysis 18: 206-226.
Ravallion, M. (2011). Do poorer countries have less capacity for redistribution? Journal of
Globalization and Development 1: 1-31.
Reuveny, R and Li, Q. (2003). Economic openness, democracy and income inequality: An empirical
analysis. Comparative Political Studies 36: 575-601.
Rodríguez-Pose, A. (2012). Trade and regional inequality. Economic Geography 88: 109–136.
Ross, M.L. (2001). Does oil hinder democracy? World Politics 53: 325-361.
Ross. M.L. (2007). How mineral-rich states can reduce inequality. In Escaping the Resource Curse,
Humphreys, M., Sachs, J.D. and Stiglitz, J.E. (eds), New York, Columbia University Press.
Ross, M.L. (2008). Oil, Islam, and women. American Political Science Review 102, 107-123.
Sachs, J.D., and Warner, A.M. (1995). Natural resource abundance and economic growth. NBER
Working Paper No. 5398.
Sachs, J.D. and Warner, A.M. (1997). Fundamental sources of long-run growth. American Economic
Review 87: 184-188.
Sachs, J.D. and Warner, A.M. (1999a). The big push, natural resource booms and growth. Journal of
Development Economics 59: 43-76.
Sachs, J.D. and Warner, A.M. (1999b). Natural resource intensity and economic growth, in: J. Sala-i-
Martin, X. and Subramanian, A. (2003). Addressing the natural resource curse: An illustration
from Nigeria. NBER Working Paper No. 9804.
Sachs, J.D. and Warner, A.M. (2001). The curse of natural resources. European Economic Review
45: 827-838.
24
Sandbu, M.E (2006). Natural wealth accounts: A proposal for alleviating the natural resource curse.
World Development 34: 1153-1170.
Tang, M.-K. and Wei, S.-J. (2009). The value of making commitments externally: Evidence from
WTO accessions. Journal of International Economics 78: 216-229.
Torvik, R. (2001). Learning by doing and the Dutch disease. European Economic Review 45: 285-
306.
Torvik, R. (2002). Natural resources, rent seeking and welfare. Journal of Development Economics
67: 455-470.
Wick, K. and Bulte, E.H. (2006). Contesting resources – Rent seeking, conflict and the natural
resource curse. Public Choice 128: 457-476.
Williams, A. (2011). Shining a light on the resource curse: An empirical analysis of the relationship
between natural resources, transparency, and economic growth. World Development 39: 490-505.
Wooldridge, J.M. (1995). Selection corrections for panel data models under conditional mean
independence assumptions. Journal of Econometrics 68: 115-132.
World Bank (2010). World Development Indicators. Available at http://data.worldbank.org/data-
catalog/world-development-indicators.
Zhou, H., Dekker, R. and Kleinknecht, A. (2011). Flexible labor and innovation performance:
Evidence from longitudinal firm-level data. Industrial and Corporate Change 20: 941-968.
Zhu, L., Biswas, B., Bowles, B. and Saunders, P.J. (2011). Impact of globalization on income
distribution inequality in 60 countries. Global Economy Journal 11: 1-18.

TABLE 1. Effects of Minerals on Net Income Inequality
Dependent variable: Gini
(1)
Gini
(2)
Gini
(3)
Gini
(4)
Gini
(5)
Income -0.0826***
(0.0075)
-0.0615***
(0.0097)
-0.0508***
(0.0123)
-0.0570***
(0.0128)
-0.0564***
(0.0129)
Minerals
-0.0006
(0.0006)
-0.0014**
(0.0006)
-0.0036***
(0.0005)
-0.0036***
(0.0005)
0.0045
(0.0043)
Institutions
-0.1026***
(0.0243)
-0.1083***
(0.0249)
-0.0832***
(0.0274)
-0.0682**
(0.0299)
Minerals*Institutions -0.0026
(0.0014)
Agriculture
-0.0003
(0.0004)
-0.0001
(0.0004)
-0.0002
(0.0004)
Fractionalisation
0.1617***
(0.0153)
0.1685***
(0.0158)
0.1696***
(0.0158)
Trade Openness
0.0136*
(0.008)
0.0149*
(0.0081)
R2 adjusted 0.6659 0.6771 0.7308 0.7330 0.7335
N 1587 1471 1286 1255 1255
Countries 78 74 56 55 55
Note: Robust standard errors of coefficients in parentheses. Superscripts *, **,*** correspond to a
10, 5 and 1% level of significance. Year and regional dummies (Sub-Saharan Africa, East
Asia, South Asia, Latin America) included in all specifications.
FIGURE 1. Marginal Effects of Minerals on Gini (Net) for Different Values of Institutions (Table 1)
Note: Marginal effects based on specification 5 of Table 1. All other regressors at their mean values.
-0.01
0.00
0.01
2.3 2.4 2.5 2.6 2.7 2.8 2.9 3 3.1 3.2 3.3 3.4Min
eral
s m
argin
al e
ffec
t o
n G
ini
net
Institutions
-0.0039
mean
26
TABLE 2. Mineral Abundance, Under-reporting on Net Inequality and Heckman Correction
Dependent variable:
Gini (net) (2nd
stage) (1) (2) (3) (4) (5)
Income -0.1003***
(0.0072)
-0.1079***
(0.0122)
-0.1025***
(0.0154)
-0.0785***
(0.0116)
-0.0890***
(0.0126)
Minerals
0.0006
(0.0006)
0.0011
(0.0008)
-0.0005
(0.0011)
-0.0025***
(0.0008)
0.0318***
(0.0082)
Institutions -0.2917***
(0.0347)
-0.2886***
(0.04)
-0.2092***
(0.0355)
-0.1646***
(0.0308)
Minerals*Institutions -0.0110***
(0.0026)
Agriculture
-0.0014**
(0.0005)
-0.0007*
(0.0004)
-0.0009**
(0.0004)
Fractionalisation
0.1076***
(0.0313)
0.1568***
(0.0227)
0.1625***
(0.0233)
Trade Openness
0.0372***
(0.0114)
0.0460***
(0.0122)
Dependent variable:
Reporting Behaviour
(1ststage)
Data Reporting Index 2.2880***
(0.1099)
2.0973***
(0.1933)
1.7291***
(0.2198)
1.5808***
(0.2272)
1.4282***
(0.232)
Income
0.5716***
(0.0296)
0.4856***
(0.0357)
0.4816***
(0.0414)
0.4824***
(0.0431)
0.5400***
(0.0447)
Minerals
-0.0282***
(0.0022)
-0.0192***
(0.0027)
-0.0235***
(0.0032)
-0.0179***
(0.0033)
-0.1954***
(0.0297)
Institutions
1.1175***
(0.0931)
1.1190***
(0.1013)
1.2223***
(0.1053)
0.7508***
(0.1266)
Minerals*Institutions
0.0603***
(0.0099)
Agriculture
0.0089***
(0.0024)
0.0077***
(0.0025)
0.0067***
(0.0025)
Fractionalisation
0.3118**
(0.1354)
0.1087
(0.1388)
-0.0255
(0.1414)
Trade Openness
-0.3949***
(0.0578)
-0.4117***
(0.0579)
-0.0898***
(0.0150)
-0.2470***
(0.0324)
-0.2442***
(0.0407)
-0.1354***
(0.0327)
-0.1696***
(0.0347)
Uncensored Observ. 1516 1400 1218 1187 1187
Censored Observ. 3016 2299 2009 1942 1942
Censored Countries 78 74 56 55 55
Note: Robust standard errors of coefficients in parentheses. Superscripts *, **, *** correspond to
a 10, 5 and 1% level of significance. Year and regional dummies (Sub-Saharan Africa, East
Asia, South Asia, Latin America) included in all specifications.
27
TABLE 3. Marginal Effects of Minerals on Net Inequality, Heckman Selection Model
Dependent variable:
Gini (net) (2nd
stage) (1) (2) (3) (4) (5)
Income
-0.0529***
(0.0081)
0.0004
(0.0142)
0.0004
(.01584)
-0.0046***
(0.0008)
-0.01206
(0.0135)
Minerals
-0.0018***
(0.0006)
-0.0031***
(0.0009)
-0.0055***
(0.0010)
-0.0046***
(0.0008)
-0.0028***
(0.001)
Institutions -0.0424
(0.0342)
-0.0494
(.0379)
-0.0672
(0.0287)
-0.1674***
(0.0341)
Agriculture
0.0005
(0.0007)
0.0002
(0.0005)
0.0001
(0.0005)
Fractionalisation
0.1742***
(0.0406)
0.1694***
(0.0274)
0.1589***
(0.0309)
Trade Openness
-0.0087
(0.0121)
0.1589***
(0.0309)
Note: Calculations of the marginal effects and standard errors (inside parentheses) done through
the ‘delta method’ by using the Stata command nlcom (based on the sample mean values
of variables for each specification). Superscripts *, **, *** correspond to 10, 5 and 1%
level of significance.
FIGURE 2. Marginal Effects of Minerals on Gini (Net) for Different Values of Institutions (Table 2)
Note: Marginal effects based on specification 5 of Table 2. All other regressors at their mean values.
-0.01
0.00
0.01
2.3 2.4 2.5 2.6 2.7 2.8 2.9 3 3.1 3.2 3.3 3.4Min
eral
s m
argin
al e
ffec
t on G
ini
net
Institutions
mean

Appendix 1: Correlation Matrix
Gini Reporting
Behaviour Income Minerals Institutions
Minerals*
Institutions Agriculture Fractionalisation
Data
Reporting
Index
Openness
Gini 0.1
(1.0)
Reporting
Behaviour
-0.2
(n/a)
1.0
(n/a)
Income -0.6
(-0.6)
0.3
(n/a)
1.0
(1.0)
Minerals 0.2
(0.2)
-0.2
(n/a)
-0.2
(-0.2)
1.0
(1.0)
Institutions -0.3
(-0.3)
0.2
(n/a)
0.6
(0.6)
-0.2
(-0.1)
1.0
(1.0)
Minerals*
Institutions
0.2
(0.2)
-0.1
(n/a)
-0.1
(-0.1)
0.9
(1.0)
0.0
(0.0)
1.0
(1.0)
Agriculture -0.3
(-0.3)
0.0
(n/a)
0.0
(0.0)
-0.1
(-0.2)
0.1
(0.1)
-0.2
(-0.2)
1.0
(1.0)
Fractionalisation 0.5
(0.5)
-0.2
(n/a)
-0.5
(-0.5)
0.4
(0.4)
-0.4
(-0.3)
0.4
(0.4)
-0.2
(-0.2)
1.0
(1.0)
Data Reporting
Index
-0.0
(-0.1)
-0.1
(n/a)
0.0
(0.0)
0.1
(0.1)
-0.1
(-0.1)
0.1
(0.1)
0.0
(0.0)
0.1
(0.0)
1.0
(1.0)
Openness -0.1
(-0.1)
0.1
(0.2)
0.2
(0.1)
0.0
(0.0)
0.1
(0.0)
0.1
(0.2)
-0.0
(-0.0)
-0.2
(-0.2)
-0.2
(-0.2)
1.0
(1.0)
Note: Pairwise correlations for the joint sample of data reporting and non-reporting countries outside parenthesis. Pairwise correlations for the
sample of reporting countries in parenthesis.
29
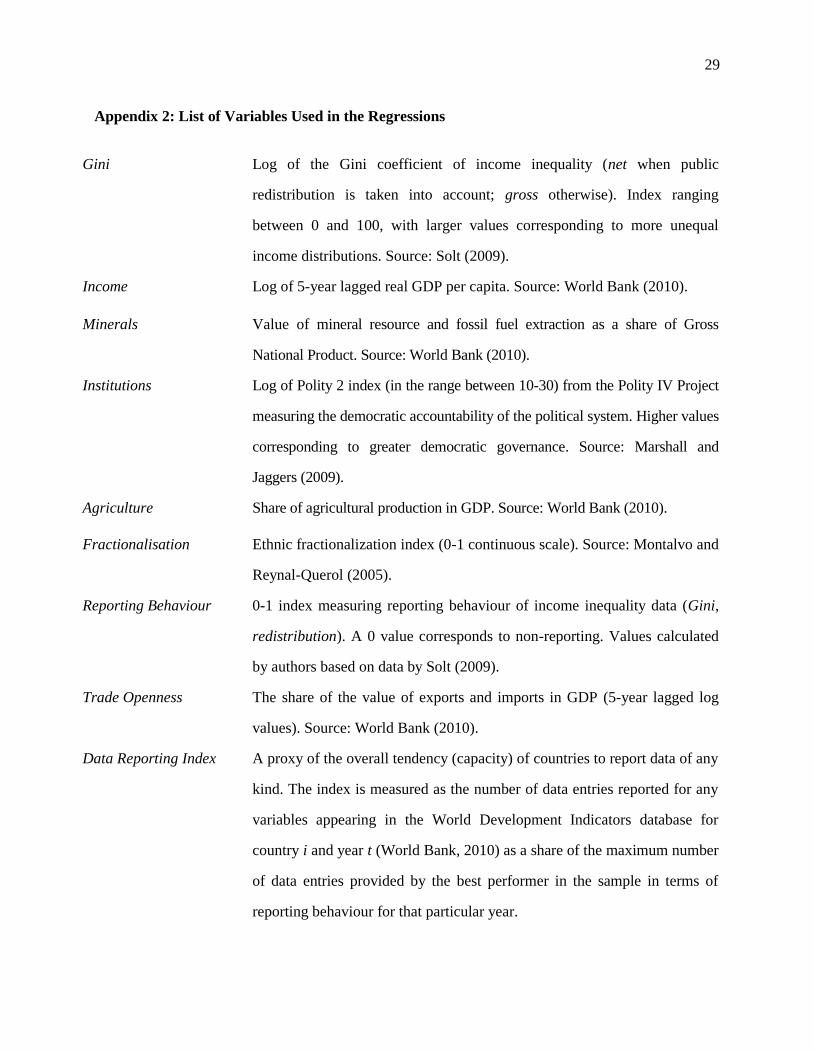
Appendix 2: List of Variables Used in the Regressions
Gini Log of the Gini coefficient of income inequality (net when public
redistribution is taken into account; gross otherwise). Index ranging
between 0 and 100, with larger values corresponding to more unequal
income distributions. Source: Solt (2009).
Income Log of 5-year lagged real GDP per capita. Source: World Bank (2010).
Minerals Value of mineral resource and fossil fuel extraction as a share of Gross
National Product. Source: World Bank (2010).
Institutions Log of Polity 2 index (in the range between 10-30) from the Polity IV Project
measuring the democratic accountability of the political system. Higher values
corresponding to greater democratic governance. Source: Marshall and
Jaggers (2009).
Agriculture Share of agricultural production in GDP. Source: World Bank (2010).
Fractionalisation Ethnic fractionalization index (0-1 continuous scale). Source: Montalvo and
Reynal-Querol (2005).
Reporting Behaviour 0-1 index measuring reporting behaviour of income inequality data (Gini,
redistribution). A 0 value corresponds to non-reporting. Values calculated
by authors based on data by Solt (2009).
Trade Openness The share of the value of exports and imports in GDP (5-year lagged log
values). Source: World Bank (2010).
Data Reporting Index A proxy of the overall tendency (capacity) of countries to report data of any
kind. The index is measured as the number of data entries reported for any
variables appearing in the World Development Indicators database for
country i and year t (World Bank, 2010) as a share of the maximum number
of data entries provided by the best performer in the sample in terms of
reporting behaviour for that particular year.

30
Appendix 3: Descriptive Statistics
Variable Mean Standard
Deviation Minimum Maximum
Gini gross
3.79
(3.79)
0.30
(0.30)
3.02
(3.02)
4.23
(4.23)
Gini net
3.59
(3.57)
0.29
(0.28)
2.92
(2.92)
4.22
(4.21)
Income
9.60
(9.63)
9.30
(9.29)
6.50
(6.50)
11.17
(11.17)
Minerals
4.10
(3.8)
8.10
(7.6)
0
(0)
58.40
(58.40)
Institutions
3.22
(3.23)
0.35
(0.35)
2.3
(2.3)
3.4
(3.4)
Agriculture
18.2
(18.1)
14.8
(14.6)
0.9
(0.9)
70.2
(70.2)
Fractionalisation
0.37
(0.4)
0.27
(0.27)
0.01
(0.01)
0.90
(0.90)
Openness 4.07
(4.08)
0.60
(0.61)
2.38
(2.38)
5.67
(5.67)
Reporting Behaviour
0.96 0.21 0.00 1.00
Data Index
1.30 0.19 0.28 1.68
Note: Descriptive statistics for the joint sample of both Gini reporting and non-reporting countries
outside parenthesis. Descriptive statistics for the sample of reporting countries in parenthesis.

31
Appendix 4: Empirical Analysis on Gross Income Inequality
TABLE A1. Effects of Minerals on Gross Income Inequality
Dependent variable: Gini
(1)
Gini
(2)
Gini
(3) Gini
(4)
Gini
(5)
Income
0.0400***
(0.0052)
0.0389***
(0.0072)
0.0489***
(0.0085)
0.0444***
(0.0088)
0.0458***
(0.0088)
Minerals
-0.0031***
(0.0005)
-0.0031***
(0.0005)
-0.0039***
(0.0005)
-0.0042***
(0.0005)
0.0153***
(0.0038)
Institutions
0.0088
(0.024)
-0.036
(0.0229)
-0.0062
(0.0247)
0.0304
(0.0263)
Minerals*Institutions
-0.0063***
(0.0012)
Agriculture
0.0003
(0.0003)
0.0006**
(0.0003)
0.0004
(0.0003)
Fractionalisation
0.007
(0.0136)
0.0278*
(0.0142)
0.0304**
(0.0143)
Trade Openness
0.0390***
(0.0065)
0.0421***
(0.0064)
R2 adjusted 0.3833 0.3851 0.4541 0.4759 0.4854
N 1587 1471 1286 1255 1255
Countries 78 74 56 55 55
Note: Robust standard errors of coefficients in parentheses. Superscripts *, **, *** correspond to a
10, 5 and 1% level of significance. Year and regional dummies (Sub-Saharan Africa, East Asia,
South Asia, Latin America) included in all specifications.
FIGURE A1. Marginal Effects of Minerals on Gini (Gross) for Different Values of Institutions (Table A1)
Note: Marginal effects based on specification 5 of Table 1. All other regressors at their mean values.
-0.01
0.00
0.01
2.3 2.4 2.5 2.6 2.7 2.8 2.9 3 3.1 3.2 3.3 3.4
Min
eral
s m
argin
al e
ffec
t on G
ini
gro
ss
Institutions
mean

32
TABLE A2. Mineral Abundance, Under-reporting on Gross Inequality and Heckman Correction
Dependent variable:
Gini (net) (2nd
stage) (1) (2) (3) (4) (5)
Income
0.0342***
(0.0061)
0.0186**
(0.0087)
0.0302***
(0.0095)
0.0331***
(0.009)
0.0298***
(0.0096)
Minerals
-0.0029***
(0.0005)
-0.0022***
(0.0006)
-0.0029***
(0.0006)
-0.0038***
(0.0006)
0.0329***
(0.0066)
Institutions
-0.0595**
(0.0255)
-0.0943***
(0.0254)
-0.0489*
(0.0281)
-0.0011
(0.0241)
Minerals*Institutions
-0.0116***
(0.0021)
Agriculture
0.0001
(0.0003)
0.0004
(0.0003)
0.0002
(0.0003)
Fractionalisation
-0.0114
(0.0179)
0.0208
(0.0169)
0.0247
(0.0167)
Trade Openness
0.0463***
(0.0086)
0.0529***
(0.0089)
Dependent variable:
Reporting Behaviour:
(1st stage)
Data Reporting Index
2.2880***
(0.1099)
2.0973***
(0.1933)
1.7291***
(0.2198)
1.5808***
(0.2272)
1.4282***
(0.232)
Income
0.5716***
(0.0296)
0.4856***
(0.0357)
0.4816***
(0.0414)
0.4824***
(0.0431)
0.5400***
(0.0447)
Minerals
-0.0282***
(0.0022)
-0.0192***
(0.0027)
-0.0235***
(0.0032)
-0.0179***
(0.0033)
-0.1954***
(0.0297)
Institutions
1.1175***
(0.0931)
1.1190***
(0.1013)
1.2223***
(0.1053)
0.7508***
(0.1266)
Minerals*Institutions
0.0603***
(0.0099)
Agriculture
0.0089***
(0.0024)
0.0077***
(0.0025)
0.0067***
(0.0025)
Fractionalisation
0.3118**
(0.1354)
0.1087
(0.1388)
-0.0255
(0.1414)
Trade Openness
-0.3949***
(0.0578)
-0.4117***
(0.0579)
βλ -0.0169
(0.0128)
-0.0899***
(0.0245)
-0.0746***
(0.0264)
-0.0469*
(0.0259)
-0.0657***
(0.0272)
Uncensored-
Observations 1516 1400 1218 1187 1187
Censored-
Observations 3016 2299 2009 1942 1942
Censored Countries 78 74 56 55 55
Note: Robust standard errors of coefficients in parentheses. Superscripts *, **, *** correspond to a
10, 5 and 1% level of significance. Year and regional dummies (Sub-Saharan Africa, East Asia,
South Asia, Latin America) included in all specifications.
33
TABLE A3. Marginal Effects of Minerals on Gross Inequality, Heckman selection model
Dependent variable:
Gini (gross) (2nd
stage) (1) (2) (3) (4) (5)
Income
0.0430***
(0.0066)
0.0581***
(0.0092)
0.0616***
(0.0091)
-0.0045***
(0.0006)
0.0596***
(0.0097)
Minerals
-0.0034***
(0.0005)
-0.0037***
(0.0006)
-0.0044***
(0.0006)
-0.0044***
(0.0006)
-0.0049***
(0.0006)
Institutions
0.0313
(0.0216)
-0.0212
(0.0211)
0.0004
(0.0210)
0.0404
(0.0224)
Agriculture
0.0006*
(0.0003)
0.0007**
(0.0003)
0.0006*
(0.0003)
Fractionalisation
0.0089
(0.0187)
0.0251
(0.0174)
0.0233
(0.0185)
Trade Openness
0.0304
(0.0080)
0.0233
(0.0185)
Note: Calculations of the marginal effects and standard errors (inside parentheses) done through
the ‘delta method’ by using the Stata command nlcom (based on the sample mean values
of variables for each specification). Superscripts *, **, *** correspond to 10, 5 and 1%
level of significance.
FIGURE A2. Marginal Effects of Minerals on Gini (Gross) for Different Values of Institutions (Table A2)
Note: Marginal effects based on specification 5 of Table A2. All other regressors at their mean values.
-0.01
0.00
0.01
2.3 2.4 2.5 2.6 2.7 2.8 2.9 3 3.1 3.2 3.3 3.4
Min
eral
s m
argin
al e
ffec
t o
n G
ini
gro
ss
Institutions
mean
34
Appendix 5: Conditional Marginal Effects for Heckman Selection Models
The following is a general formula for the conditional marginal effect in the Heckman Selection
Model (see Frondel and Vance, 2009), where is the variable for which the marginal effect is
calculated. This formula is general in the sense that it can also be used to calculate the marginal effect
even under the presence of an interaction term, such as , which is actually the case for
specification (5) in regression Tables 2 and A2. When there is no interaction term, this formula
reverts to the simple marginal effect because .
( ) ( ) ( ), (A.1)
where
( ) , and
( ) ( ) ( ) ( ) ( )
( ) [ ( )]
( )
TABLE A4. Calculations of ( ) based on Equation A1 (Net Income Inequality)
Dependent variable:
Gini (net) (2nd
stage) (1) (2) (3) (4) (5)
Income
-0.9221***
(0.0049)
-0.9031***
(0.0122)
-0.8751***
(0.0194)
-0.8586***
(0.0235)
-0.8398***
(0.0280)
Minerals
-0.9221***
(0.0049)
-0.9031***
(0.0122)
-0.8751***
(0.0194)
-0.8586***
(0.0235)
-0.8398***
(0.0280)
Institutions
-0.9031***
(0.0122)
-0.8751***
(0.0194)
-0.8586***
(0.0235)
-0.8398***
(0.0280)
Agriculture
-0.8751***
(0.0194)
-0.8585***
(0.0235)
-0.8398***
(0.0280)
Fractionalisation
-0.8751***
(0.0194)
-0.8586***
(0.0235)
-0.8422***
(0.0275)
Trade Openness
-0.8586***
(0.0235)
-0.8398***
(0.0280)
Note: Calculations of ( ) and standard errors (inside the parentheses) done through the ‘delta
method’ by using the Stata command nlcom (based on the sample mean values of variables
for each specification). Superscripts *, **, *** correspond to 10, 5 and 1% level of significance.

35
TABLE A5. Calculations of ( ) based on Equation A1 (Gross Income Inequality)
Dependent variable:
Gini (gross) (2nd
stage) (1) (2) (3) (4) (5)
Income
-0.9221***
(0.0049)
-0.9031***
(0.0121)
-0.8751***
(0.0194)
-0.8585***
(0.0235)
-0.8398***
(0.0280)
Minerals
-0.9221***
(0.0049)
-0.9031***
(0.0121)
-0.8751***
(0.0194)
-0.8586***
(0.0235)
-0.8398***
(0.0280)
Institutions
-0.9031***
(0.0122)
-0.8751***
(0.0194)
-0.8586***
(0.0235)
-0.8398***
(0.0280)
Agriculture
-0.8751***
(0.0194)
-0.8585***
(0.0235)
-0.8398***
(0.0280)
Fractionalisation
-0.8751***
(0.0194)
-0.8585***
(0.0235)
-0.8421***
(0.0274)
Trade Openness
-0.8585***
(0.0235)
-0.8398***
(0.0280)
Note: Calculations of ( ) and standard errors (inside the parentheses) done through the ‘delta
method’ by using the Stata command nlcom (based on the sample mean values of variables
for each specification). Superscripts *, **, *** correspond to 10, 5 and 1% level of significance.
Related Documents