Association between Income and the Hippocampus Jamie L. Hanson 1,2 *, Amitabh Chandra 3 , Barbara L. Wolfe 4 *, Seth D. Pollak 1,2 1 Department of Psychology, University of Wisconsin-Madison, Madison, Wisconsin, United States of America, 2 Waisman Center, University of Wisconsin-Madi son, Madison, Wisconsin, United States of America, 3 Harvard Kennedy School of Government, Harvard University, Cambridge, Massachusetts, United States of America, 4 Departments of Economics, Population Health Sciences and Public Affairs, and Institute for Research on Poverty, University of Wisconsin-Madison, Madison, Wisconsin, United States of America Abstract Facets of the post-natal environment including the type and comple xity of environmental stimuli, the quality of parent ing behaviors, and the amount and type of stress experienced by a child affects brain and behavioral functioning. Poverty is a type of pervasive experience that is likely to influenc e biobehavioral processes because children develo ping in such environments oft en enc ount er high lev els of stress and reduce d env ironment al sti mula tion. Thi s study explore s the association between socioeconomic status and the hippocampus, a brain region involved in learning and memory that is known to be affected by stress. We employ a voxel-based morphometry analytic framework with region of interest drawing for structural brain images acquired from particip ants across the socioec onomic spectrum (n = 317) . Children from lower income backgrounds had lower hippocampal gray matter density, a measure of volume. This finding is discussed in terms of disparities in education and health that are observed across the socioeconomic spectrum. Citation: Hanson JL, Chandra A, Wolfe BL, Poll ak SD (2011) Asso ciati on between Income and the Hipp ocampus. PLoS ONE 6(5): e18712. doi:10.137 1/ journal.pone.0018712 Editor: Monica Uddin, University of Michigan, United States of America Received September 15, 2010; Accepted March 16, 2011; Published May 4, 2011 Copyright: ß 2011 Hanson et al. This is an open-access article distributed under the terms of the Creative Commons Attribution License, which permits unrestricted use, distribution, and reproduction in any medium, provided the original author and source are credited. Funding: This work was supported by the US National Institute on Drug Abuse (Grant DA028087 to JLH), the US National Institute of Mental Health (Grants MH61285 and MH68858 to SDP) and the Children’s Bureau of the Administration on Children, Youth and Families as part of the Child Neglect Research Consortium. This project was also supported by the Russell Sage Foundation and the University of Wisconsin-Madison Graduate School grants to BLW. The authors also thank the Russell Sage Foundation for their support of Health and SES working group. The funders had no role in study design, data collection and analysis, decision to publish, or preparation of the manuscript. Competing Interests: The authors have declared that no competing interests exist. * E-mail: [email protected] (BLW); [email protected] (JLH) Introduction A growing body of research, conducted mainly in rodents, has found that factors such as the complexity of stimuli present in the post-n atal environment, the quality of parent ing behaviors, and the amount of str ess that occu rs duri ng the lifes pan can aff ect neural, emotional and cognitive functioning (for review, see [1,2]). These findings raise complex questions about how variations in the env ironme nt can sha pe neural deve lopment in humans [3] . In par tic ula r, an inc rea sin g int erest is bei ng pai d to the eff ects of socioeconomic status and poverty on brain and behavior, since living in poverty is often characterized by heightened amounts of stress and reductions in environmental stimulation [4]. This study focuses on associations between household income and the hippocampus. The hippocampus is located in the medial temporal lobe of the brain. This region is known to be affected by stress and is tied to cognitive functions such as learning, memory, and beha vioral reg ula tion (for rev iew, see [5] ). It is dif fic ult to quantify the many facets of an individual’s environment; for this reas on, we use income as a proxy for a mult it ude of factors inc luding enriched cul tura l environment, bet ter school s and nei ghborhoods, and acc ess to sti mul ati ng mat eri als in ear ly childhood. Non-human animal research has found environmental enrich- ment is relate d to greater dendri tic branching and wider dendriti c fields [6,7], increased astrocyte number and size [8], and improved synapti c transmissi on [9] in por ti ons of the hi ppo campus. Envi ronmental enr ichment, in addi tion, appears to bol ster neurobi ologi cal resil iency. For exampl e, enrich ed envir onments result in increases in neuronal precursor cells in portions of the hippoca mpus [10] and greate r rec overy aft er a les ion in the hippocampus [11]. Stress also exerts long-lasting negative effects on the hippocampus. For example, research has found prolonged maternal separa tion and brief handling impacts the hippoca mpus and affects stress regulation and memory ability later in life [12]. Similar effects have been noted in humans. These studies suggest that parental nurturance and environmental stimulation, including both resources such as the number of books in a child’s home and pare nta l time spe nd rea ding to a child, pre dict neuroc ogniti ve performance on tests related to the hippocampus such as long- term memory [13,14]. Prior research has linked poverty with a myriad of deleterious outcome s from poor hea lth to lower educ ati ona l achiev eme nt [15, 16,17, 18]. Yet li ttl e is cur rent ly understoo d about the neurobiological mec hanisms leadin g to these soc ioe conomi c disparities. We hypothesized that the morphometric properties of hippocampus would be related to gradients in income. We focus on thi s bra in reg ion both bec ause of its known sen sit ivi ty to environmental stress and its role in core adaptive processes such as learning. Methods Subjects and MRI acquisition Behavi oral and MRI data were taken from the Na tional Institutes of Health (NIH) MRI study of normal brain develop- PLoS ONE | www.plosone.org 1 May 2011 | Volume 6 | Issue 5 | e18712

Welcome message from author
This document is posted to help you gain knowledge. Please leave a comment to let me know what you think about it! Share it to your friends and learn new things together.
Transcript
8/3/2019 Income Hippo Campus
http://slidepdf.com/reader/full/income-hippo-campus 1/8
Association between Income and the Hippocampus
Jamie L. Hanson1,2*, Amitabh Chandra3, Barbara L. Wolfe4*, Seth D. Pollak 1,2
1 Department of Psychology, University of Wisconsin-Madison, Madison, Wisconsin, United States of America, 2 Waisman Center, University of Wisconsin-Madison,
Madison, Wisconsin, United States of America, 3 Harvard Kennedy School of Government, Harvard University, Cambridge, Massachusetts, United States of America,
4 Departments of Economics, Population Health Sciences and Public Affairs, and Institute for Research on Poverty, University of Wisconsin-Madison, Madison, Wisconsin,
United States of America
Abstract
Facets of the post-natal environment including the type and complexity of environmental stimuli, the quality of parentingbehaviors, and the amount and type of stress experienced by a child affects brain and behavioral functioning. Poverty is atype of pervasive experience that is likely to influence biobehavioral processes because children developing in suchenvironments often encounter high levels of stress and reduced environmental stimulation. This study explores theassociation between socioeconomic status and the hippocampus, a brain region involved in learning and memory that isknown to be affected by stress. We employ a voxel-based morphometry analytic framework with region of interest drawingfor structural brain images acquired from participants across the socioeconomic spectrum (n = 317). Children from lowerincome backgrounds had lower hippocampal gray matter density, a measure of volume. This finding is discussed in terms of disparities in education and health that are observed across the socioeconomic spectrum.
Citation: Hanson JL, Chandra A, Wolfe BL, Pollak SD (2011) Association between Income and the Hippocampus. PLoS ONE 6(5): e18712. doi:10.1371/ journal.pone.0018712
Editor: Monica Uddin, University of Michigan, United States of America
Received September 15, 2010; Accepted March 16, 2011; Published May 4, 2011
Copyright: ß 2011 Hanson et al. This is an open-access article distributed under the terms of the Creative Commons Attribution License, which permitsunrestricted use, distribution, and reproduction in any medium, provided the original author and source are credited.
Funding: This work was supported by the US National Institute on Drug Abuse (Grant DA028087 to JLH), the US National Institute of Mental Health (GrantsMH61285 and MH68858 to SDP) and the Children’s Bureau of the Administration on Children, Youth and Families as part of the Child Neglect ResearchConsortium. This project was also supported by the Russell Sage Foundation and the University of Wisconsin-Madison Graduate School grants to BLW. Theauthors also thank the Russell Sage Foundation for their support of Health and SES working group. The funders had no role in study design, data collection andanalysis, decision to publish, or preparation of the manuscript.
Competing Interests: The authors have declared that no competing interests exist.
* E-mail: [email protected] (BLW); [email protected] (JLH)
Introduction
A growing body of research, conducted mainly in rodents, has
found that factors such as the complexity of stimuli present in the
post-natal environment, the quality of parenting behaviors, and
the amount of stress that occurs during the lifespan can affect
neural, emotional and cognitive functioning (for review, see [1,2]).
These findings raise complex questions about how variations in the
environment can shape neural development in humans [3]. In
particular, an increasing interest is being paid to the effects of
socioeconomic status and poverty on brain and behavior, since
living in poverty is often characterized by heightened amounts of
stress and reductions in environmental stimulation [4].
This study focuses on associations between household income
and the hippocampus. The hippocampus is located in the medial
temporal lobe of the brain. This region is known to be affected by
stress and is tied to cognitive functions such as learning, memory,and behavioral regulation (for review, see [5]). It is difficult to
quantify the many facets of an individual’s environment; for this
reason, we use income as a proxy for a multitude of factors
including enriched cultural environment, better schools and
neighborhoods, and access to stimulating materials in early
childhood.
Non-human animal research has found environmental enrich-
ment is related to greater dendritic branching and wider dendritic
fields [6,7], increased astrocyte number and size [8], and improved
synaptic transmission [9] in portions of the hippocampus.
Environmental enrichment, in addition, appears to bolster
neurobiological resiliency. For example, enriched environments
result in increases in neuronal precursor cells in portions of thehippocampus [10] and greater recovery after a lesion in the
hippocampus [11]. Stress also exerts long-lasting negative effects
on the hippocampus. For example, research has found prolonged
maternal separation and brief handling impacts the hippocampus
and affects stress regulation and memory ability later in life [12].
Similar effects have been noted in humans. These studies suggest
that parental nurturance and environmental stimulation, including
both resources such as the number of books in a child’s home and
parental time spend reading to a child, predict neurocognitive
performance on tests related to the hippocampus such as long-
term memory [13,14].
Prior research has linked poverty with a myriad of deleterious
outcomes from poor health to lower educational achievement
[15,16,17,18]. Yet little is currently understood about the
neurobiological mechanisms leading to these socioeconomicdisparities. We hypothesized that the morphometric properties of
hippocampus would be related to gradients in income. We focus
on this brain region both because of its known sensitivity to
environmental stress and its role in core adaptive processes such as
learning.
Methods
Subjects and MRI acquisitionBehavioral and MRI data were taken from the National
Institutes of Health (NIH) MRI study of normal brain develop-
PLoS ONE | www.plosone.org 1 May 2011 | Volume 6 | Issue 5 | e18712
8/3/2019 Income Hippo Campus
http://slidepdf.com/reader/full/income-hippo-campus 2/8
ment (website: http://nihpd.crbs.ucsd.edu/nihpd/info/index.
html and [19]). This public-access database was developed by
the NIH to aid in understanding the course of normal brain-
behavior development. The database consists of clinical, behav-
ioral and neuroimaging metrics that were acquired at multiple
research centers across the US from a large cohort of children and
adolescents ages 4 to 18. To participate in the study, subjects had
to meet criteria based on demographic, prenatal history, physical,
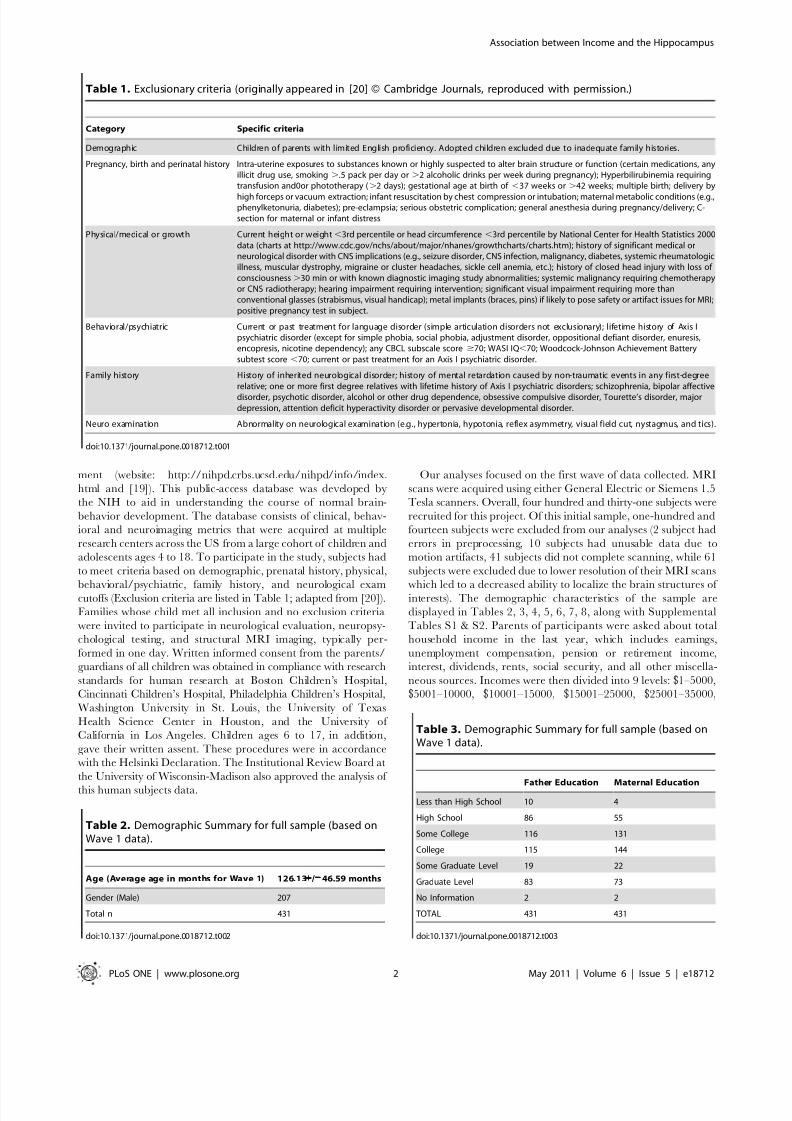
behavioral/psychiatric, family history, and neurological examcutoffs (Exclusion criteria are listed in Table 1; adapted from [20]).
Families whose child met all inclusion and no exclusion criteria
were invited to participate in neurological evaluation, neuropsy-
chological testing, and structural MRI imaging, typically per-
formed in one day. Written informed consent from the parents/
guardians of all children was obtained in compliance with research
standards for human research at Boston Children’s Hospital,
Cincinnati Children’s Hospital, Philadelphia Children’s Hospital,
Washington University in St. Louis, the University of Texas
Health Science Center in Houston, and the University of
California in Los Angeles. Children ages 6 to 17, in addition,
gave their written assent. These procedures were in accordance
with the Helsinki Declaration. The Institutional Review Board at
the University of Wisconsin-Madison also approved the analysis of
this human subjects data.
Our analyses focused on the first wave of data collected. MRI
scans were acquired using either General Electric or Siemens 1.5
Tesla scanners. Overall, four hundred and thirty-one subjects were
recruited for this project. Of this initial sample, one-hundred and
fourteen subjects were excluded from our analyses (2 subject had
errors in preprocessing, 10 subjects had unusable data due to
motion artifacts, 41 subjects did not complete scanning, while 61
subjects were excluded due to lower resolution of their MRI scans
which led to a decreased ability to localize the brain structures of interests). The demographic characteristics of the sample are
displayed in Tables 2, 3, 4, 5, 6, 7, 8, along with Supplemental
Tables S1 & S2. Parents of participants were asked about total
household income in the last year, which includes earnings,
unemployment compensation, pension or retirement income,
interest, dividends, rents, social security, and all other miscella-
neous sources. Incomes were then divided into 9 levels: $1–5000,
$5001–10000, $10001–15000, $15001–25000, $25001–35000,
Table 1. Exclusionary criteria (originally appeared in [20] ß Cambridge Journals, reproduced with permission.)
Category Specific criteria
Demographic Children of parents with limited English proficiency. Adopted children excluded due to inadequate family histories.
Pregnancy, birth and perinatal history Intra-uterine exposures to substances known or highly suspected to alter brain structure or function (certain medications, anyillicit drug use, smoking ..5 pack per day or .2 alcoholic drinks per week during pregnancy); Hyperbilirubinemia requiringtransfusion and0or phototherapy (.2 days); gestational age at birth of ,37 weeks or .42 weeks; multiple birth; delivery by
high forceps or vacuum extraction; infant resuscitation by chest compression or intubation; maternal metabolic conditions (e.g.,phenylketonuria, diabetes); pre-eclampsia; serious obstetric complication; general anesthesia during pregnancy/delivery; C-section for maternal or infant distress
Physical/medical or growth Current height or weight,3rd percentile or head circumference ,3rd percentile by National Center for Health Statistics 2000data (charts at http://www.cdc.gov/nchs/about/major/nhanes/growthcharts/charts.htm); history of significant medical orneurological disorder with CNS implications (e.g., seizure disorder, CNS infection, malignancy, diabetes, systemic rheumatologicillness, muscular dystrophy, migraine or cluster headaches, sickle cell anemia, etc.); history of closed head injury with loss of consciousness.30 min or with known diagnostic imaging study abnormalities; systemic malignancy requiring chemotherapyor CNS radiotherapy; hearing impairment requiring intervention; significant visual impairment requiring more thanconventional glasses (strabismus, visual handicap); metal implants (braces, pins) if likely to pose safety or artifact issues for MRI;positive pregnancy test in subject.
Behavioral/psychiatric Current or past treatment for language disorder (simple articulation disorders not exclusionary); lifetime history of Axis Ipsychiatric disorder (except for simple phobia, social phobia, adjustment disorder, oppositional defiant disorder, enuresis,encopresis, nicotine dependency); any CBCL subscale score $70; WASI IQ,70; Woodcock-Johnson Achievement Batterysubtest score ,70; current or past treatment for an Axis I psychiatric disorder.
Family history History of inherited neurological disorder; history of mental retardation caused by non-traumatic events in any first-degreerelative; one or more first degree relatives with lifetime history of Axis I psychiatric disorders; schizophrenia, bipolar affectivedisorder, psychotic disorder, alcohol or other drug dependence, obsessive compulsive disorder, Tourette’s disorder, majordepression, attention deficit hyperactivity disorder or pervasive developmental disorder.
Neuro examination Abnormality on neurological examination (e.g., hypertonia, hypotonia, reflex asymmetry, visual field cut, nystagmus, and tics).
doi:10.1371/journal.pone.0018712.t001
Table 2. Demographic Summary for full sample (based onWave 1 data).
Age (Average age in months for Wave 1) 126.13+/246.59 months
Gender (Male) 207
Total n 431
doi:10.1371/journal.pone.0018712.t002
Table 3. Demographic Summary for full sample (based onWave 1 data).
Father Education Maternal Education
Less than High School 10 4
High School 86 55
Some College 116 131
College 115 144
Some Graduate Level 19 22
Graduate Level 83 73
No Information 2 2
TOTAL 431 431
doi:10.1371/journal.pone.0018712.t003
Association between Income and the Hippocampus
PLoS ONE | www.plosone.org 2 May 2011 | Volume 6 | Issue 5 | e18712
8/3/2019 Income Hippo Campus
http://slidepdf.com/reader/full/income-hippo-campus 3/8
$35001–50000, $50001–75000, $75001–100000,and $100001+ in
the publicly available data. Parents of participants were also asked
about their education and responded whether they had completed
less than a 6th grade education, less than high school, graduated
high school, completed some college, graduated college, obtain
some graduate education, or completed graduate school.
Imaging AnalysesTo examine the relationship between income and hippocampal
gray matter, we employed a voxel-based morphometry (VBM)
analytic framework with region of interest drawing. VBM is a fully
automatic imaging analysis strategy which allows for the precise
localization of anatomical differences between groups, involves a
comparison between two groups of subjects of the local
concentration of gray matter (or volume comparison) using
Jacobian modulation, and has been applied to the study of various
types of pathologies [21,22,23,24]. The steps involved with VBMhave recently been improved with the Diffeomorphic Anatomical
Registration using Exponentiated Lie algebra (DARTEL) regis-
tration method [25]. Previous structural imaging research focused
on the hippocampus has often employed manual segmentation
protocol. Such procedures require specific anatomical expertise,
are operator time consuming and may result in high intra- and
inter-rater variability (as noted by [26]). Advancement in
registration methods, such as DARTEL, improves the realignment
of small brain structures [27], making such an analytic strategy
particularly robust for quantifying the hippocampus in such a large
dataset.
In this analysis, we used Statistical Parametric Mapping 8
(Wellcome Department of Cognitive Neurology: London, En-
gland) with the following steps: first, T1-weighted images were
checked for scanner artifacts (e.g., extreme field inhomogeneity).
Next, these volumes were segmented using custom a priori braintissue segmentations generated by the Template-O-Matic toolbox
[28]. These custom segmentations were based on the age and
gender distributions of the full sample. The first author then
checked the accuracy of each subjects’ segmentation. If any errors
were present, the bounding box or image matrix was adjusted and
MRI images were reprocessed. If after this correction segments still
contained errors, they were corrected by hand to remove skull,
dura, and other non-brain matter.
Once segmentation was completed, creation of and registration
to study specific templates began. This process first involved rigidly
aligning and averaging each tissue class (i.e., grey and white matter
segments) for each subject. Using the initial template, an advanced
non-linear registration algorithm (DARTEL) was employed to
register each participant’s segments to the template gray and whitematter maps. The results of this registration process were then
averaged to create a second template. Averaging and registering of
gray and white matter segments was repeated six times. This
processing pipeline allows for robust registration, while preserving
the topology of the brain via constant velocity flow fields [25].
These processing procedures were recently validated as a robust
approach to detecting hippocampal differences [26]. After
Table 4. Demographic Summary for full sample (based onWave 1 data).
Income at Wave 1
,$5000 1
5001–$10,000 2
10001–15000 415001–25000 10
25001–35000 21
35001–50,000 82
50001–75000 104
75001–100,000 102
.100001 94
No information 11
TOTAL 431
doi:10.1371/journal.pone.0018712.t004
Table 5. Demographic Variables for Subjects with andwithout MRI Scans and/or Income.
Subjects with all
variables (n= 317)
Subjects without
all variables
(n=114)
Age (Averageage in monthsfor Wave 1)
133.74+/245.76months
133.74+/245.76months
F(1,429)= 44.675,p,.001
Gender (Male) 146 61 x2 =.305, p=.642
doi:10.1371/journal.pone.0018712.t005
Table 6. Demographic Variables for Subjects with andwithout MRI Scans and/or Income.
Father’s Education
Subjects with all
variables (n= 317)
Subjects without all
variables (n= 114)
Less than High School 7 3
High School 61 25
Some College 83 33
College 85 30
Some Graduate Level 13 6
Graduate Level 68 17
TOTAL 317 114
doi:10.1371/journal.pone.0018712.t006
Table 7. Demographic Variables for Subjects with andwithout MRI Scans and/or Income.
Maternal Education
Subjects with allvariables (n= 317)
Subjects without allvariables (n= 114)
Less than High School 2 3
High School 45 25
Some College 88 33
College 107 30
Some Graduate Level 16 6
Graduate Level 59 17
TOTAL 317 114
doi:10.1371/journal.pone.0018712.t007
Association between Income and the Hippocampus
PLoS ONE | www.plosone.org 3 May 2011 | Volume 6 | Issue 5 | e18712
8/3/2019 Income Hippo Campus
http://slidepdf.com/reader/full/income-hippo-campus 4/8
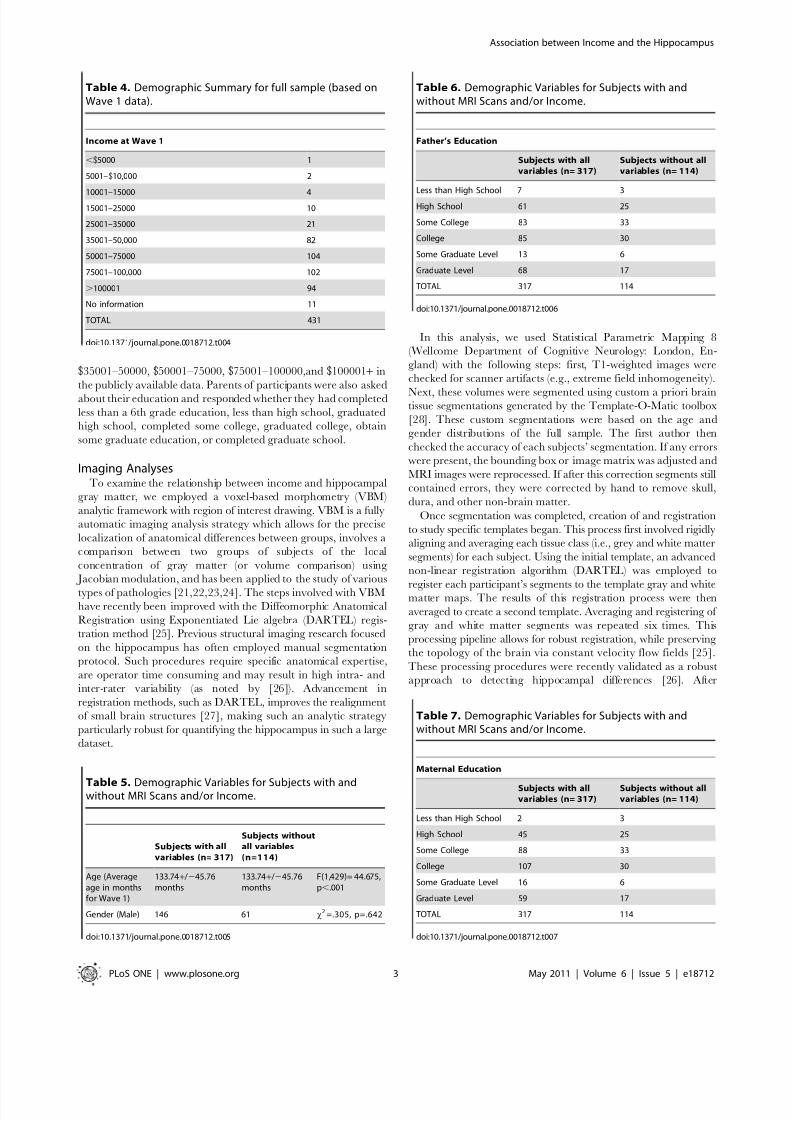
warping the images to the final template, region of interest
drawing was completed on the template through the Anatomical
Automatic Labeling Toolbox [29]. The hippocampal and
amygdala region of interest drawings used for our analyses are
shown in Figure 1. Modulated Segments, adjusted for the non-
linear registration were then generated to assess gray matter
differences in relation to socioeconomic status (SES) variables.
After processing neuroimaging data from each subject with the
procedures detailed above, we conducted linear regressions in
Statistical Package for the Social Sciences (SPSS Inc., Chicago, IL)
controlling for participant age in months, gender (dummy-coded),
and whole-brain volumes entered as independent variables. The
log-transformed, mid-point for each income category and the
approximate number of years of education obtained by parents
( ,6th grade = 5 years, less than high school = 11 years, high
school= 12 years, some college = 14 years, college = 16 years,some grad= 17 years and graduate level = 19 years) were also used
as continuous independent variables in these analyses. Gray
matter probability for the hippocampus or the amygdala (for total
gray matter, as well as for the left and right side separately) was
entered as the dependent variable in these regressions. The brain
variables in these analyses are the unsmoothed average ‘‘modu-
lated’’ gray matter density in a whole-hippocampal or amygdala
region of interest drawing. Recent evaluations of registration
algorithms have noted superior performance of DARTEL, with
top ratings in overlap and distance measures [30]. Age, gender,
whole-brain volume, and parental education were included toisolate the unique effects of income on the medial temporal lobe.
Results
Examining the association between income and thehippocampus
In terms of income and the neurobiological correlates of
socioeconomic status, we examined hippocampal and amygdala
gray matter across a large income spectrum: participants had
annual family incomes of below $5000 to above $100,000 per year.
Our lowest income group is composed of families below 150% of
the Federal Poverty Line (for 2010 levels, see http://aspe.hhs.gov/
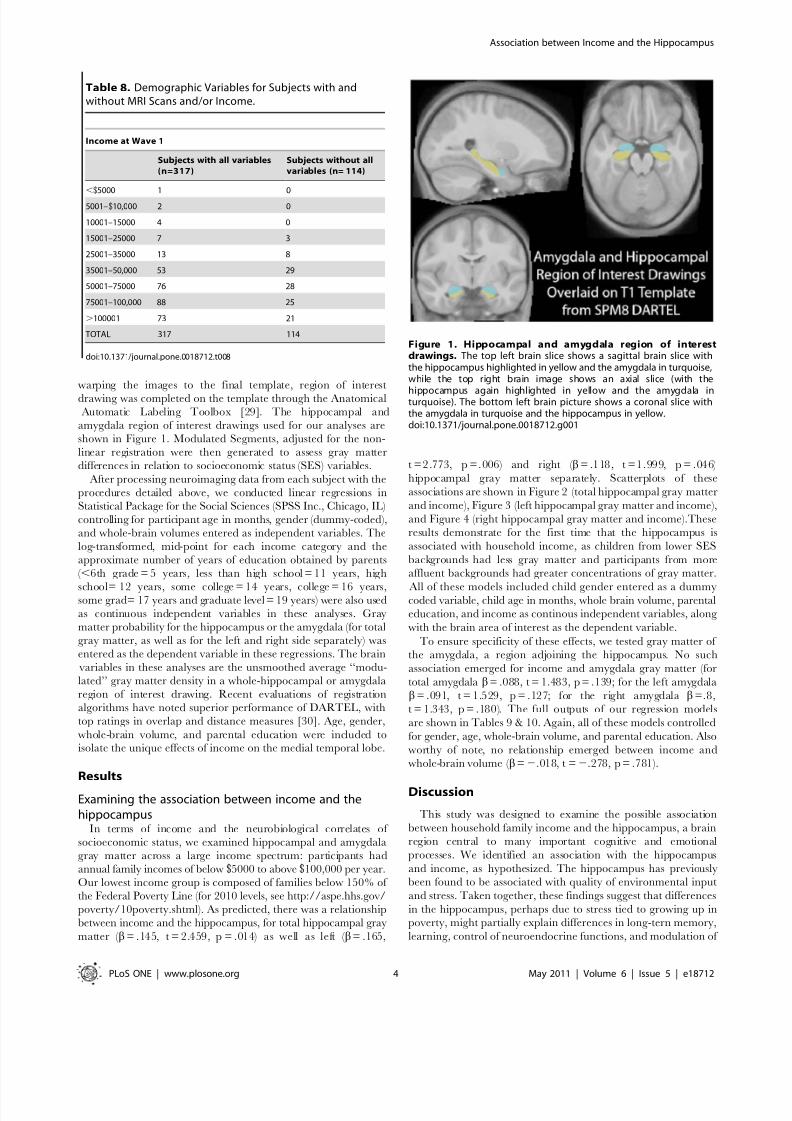
poverty/10poverty.shtml). As predicted, there was a relationship
between income and the hippocampus, for total hippocampal gray
matter ( b= .145, t = 2.459, p = .014) as well as left ( b= .165,
t =2.773, p =. 006) and right ( b= .118, t =1.999, p = .046)
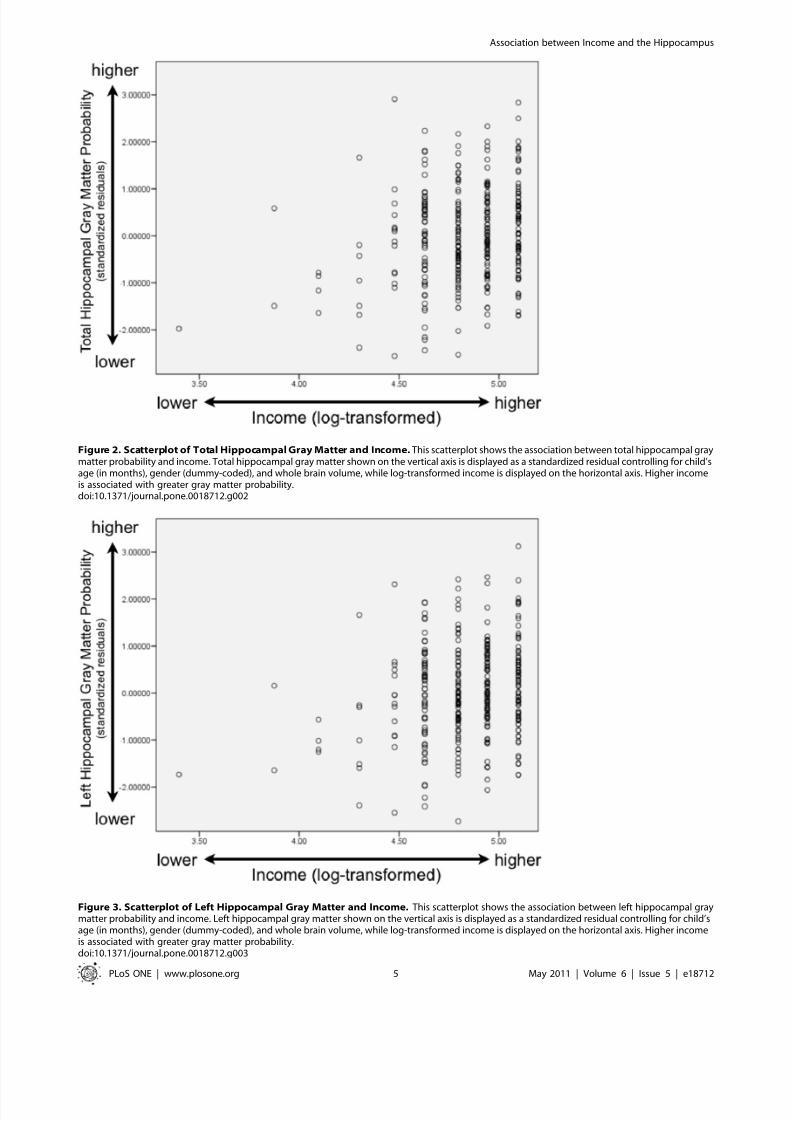
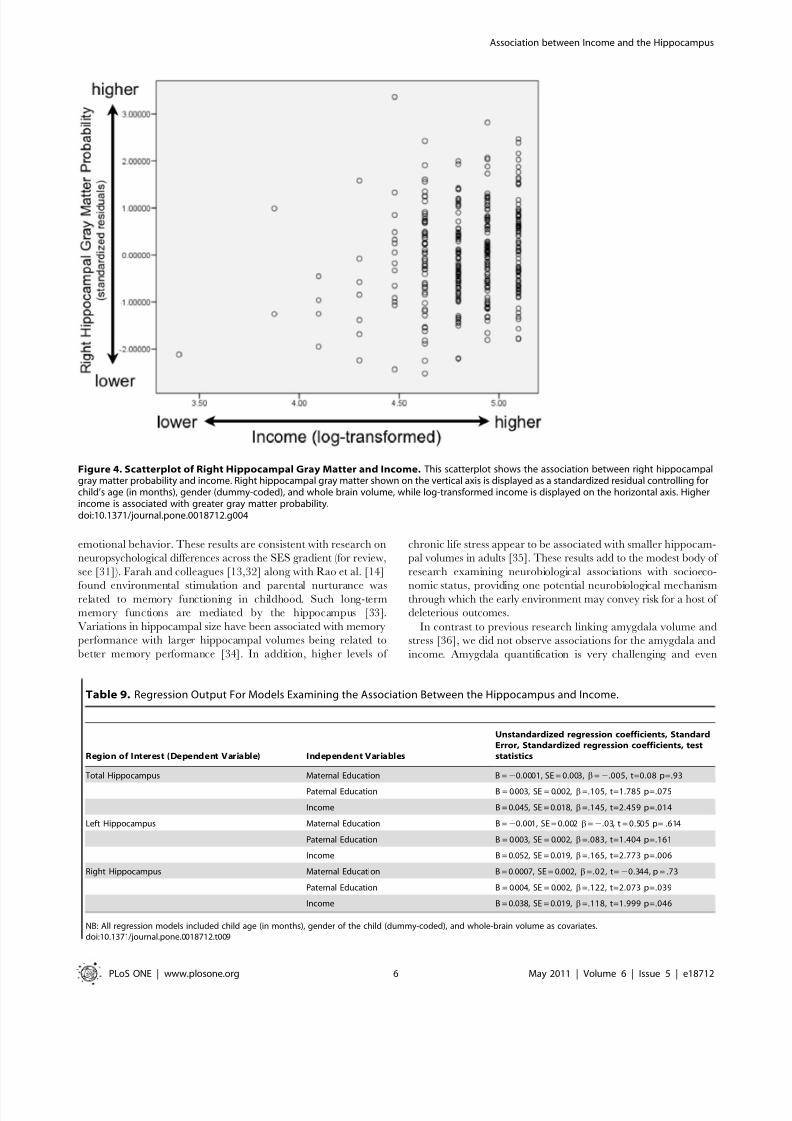
hippocampal gray matter separately. Scatterplots of these
associations are shown in Figure 2 (total hippocampal gray matter
and income), Figure 3 (left hippocampal gray matter and income),
and Figure 4 (right hippocampal gray matter and income).These
results demonstrate for the first time that the hippocampus is
associated with household income, as children from lower SES
backgrounds had less gray matter and participants from more
affluent backgrounds had greater concentrations of gray matter.
All of these models included child gender entered as a dummycoded variable, child age in months, whole brain volume, parental
education, and income as continous independent variables, along
with the brain area of interest as the dependent variable.
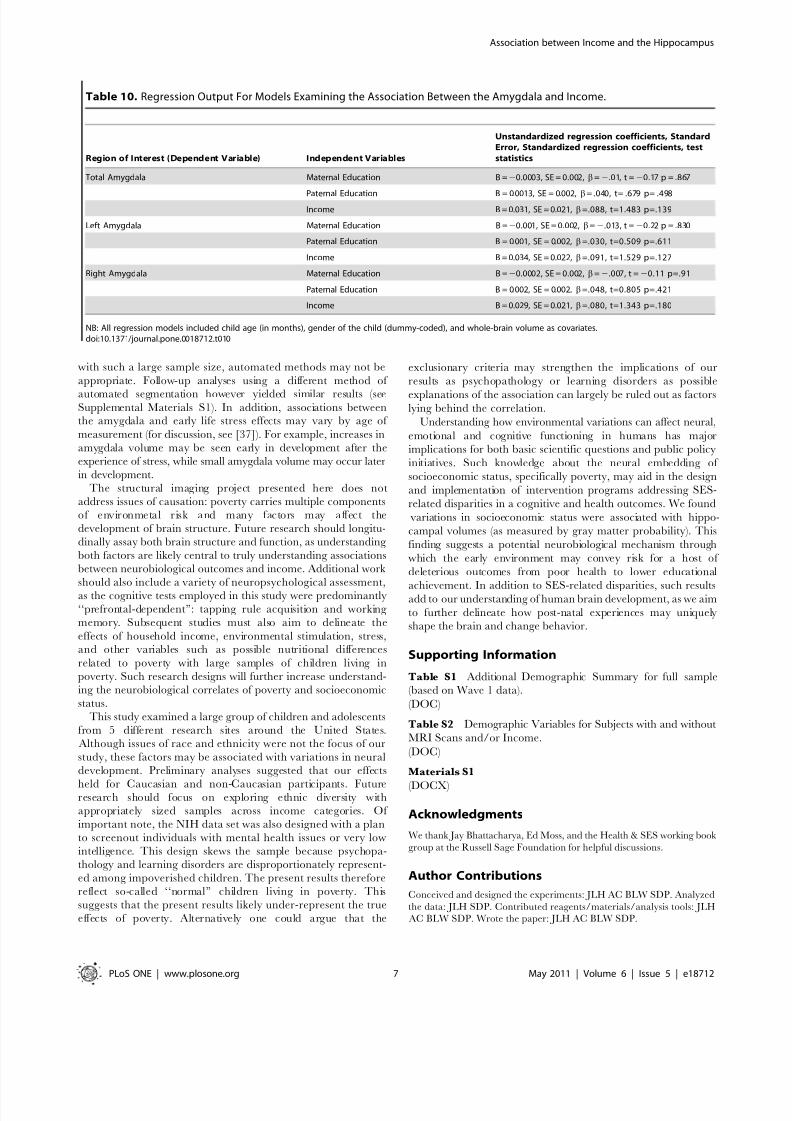
To ensure specificity of these effects, we tested gray matter of
the amygdala, a region adjoining the hippocampus. No such
association emerged for income and amygdala gray matter (for
total amygdala b= .088, t = 1.483, p = .139; for the left amygdala
b= .091, t = 1.529, p = .127; for the right amygdala b=.8,
t = 1.343, p = .180). The full outputs of our regression models
are shown in Tables 9 & 10. Again, all of these models controlled
for gender, age, whole-brain volume, and parental education. Also
worthy of note, no relationship emerged between income and
whole-brain volume ( b=2.018, t =2.278, p = .781).
Discussion
This study was designed to examine the possible association
between household family income and the hippocampus, a brain
region central to many important cognitive and emotional
processes. We identified an association with the hippocampus
and income, as hypothesized. The hippocampus has previously
been found to be associated with quality of environmental input
and stress. Taken together, these findings suggest that differences
in the hippocampus, perhaps due to stress tied to growing up in
poverty, might partially explain differences in long-tern memory,
learning, control of neuroendocrine functions, and modulation of
Table 8. Demographic Variables for Subjects with andwithout MRI Scans and/or Income.
Income at Wave 1
Subjects with all variables
(n=317)
Subjects without all
variables (n= 114)
,$5000 1 0
5001–$10,000 2 0
10001–15000 4 0
15001–25000 7 3
25001–35000 13 8
35001–50,000 53 29
50001–75000 76 28
75001–100,000 88 25
.100001 73 21
TOTAL 317 114
doi:10.1371/journal.pone.0018712.t008
Figure 1. Hippocampal and amygdala region of interestdrawings. The top left brain slice shows a sagittal brain slice withthe hippocampus highlighted in yellow and the amygdala in turquoise,while the top right brain image shows an axial slice (with the
hippocampus again highlighted in yellow and the amygdala inturquoise). The bottom left brain picture shows a coronal slice withthe amygdala in turquoise and the hippocampus in yellow.doi:10.1371/journal.pone.0018712.g001
Association between Income and the Hippocampus
PLoS ONE | www.plosone.org 4 May 2011 | Volume 6 | Issue 5 | e18712
8/3/2019 Income Hippo Campus
http://slidepdf.com/reader/full/income-hippo-campus 5/8
Figure 3. Scatterplot of Left Hippocampal Gray Matter and Income. This scatterplot shows the association between left hippocampal graymatter probability and income. Left hippocampal gray matter shown on the vertical axis is displayed as a standardized residual controlling for child’sage (in months), gender (dummy-coded), and whole brain volume, while log-transformed income is displayed on the horizontal axis. Higher incomeis associated with greater gray matter probability.doi:10.1371/journal.pone.0018712.g003
Figure 2. Scatterplot of Total Hippocampal Gray Matter and Income. This scatterplot shows the association between total hippocampal graymatter probability and income. Total hippocampal gray matter shown on the vertical axis is displayed as a standardized residual controlling for child’sage (in months), gender (dummy-coded), and whole brain volume, while log-transformed income is displayed on the horizontal axis. Higher incomeis associated with greater gray matter probability.doi:10.1371/journal.pone.0018712.g002
Association between Income and the Hippocampus
PLoS ONE | www.plosone.org 5 May 2011 | Volume 6 | Issue 5 | e18712
8/3/2019 Income Hippo Campus
http://slidepdf.com/reader/full/income-hippo-campus 6/8
emotional behavior. These results are consistent with research on
neuropsychological differences across the SES gradient (for review,
see [31]). Farah and colleagues [13,32] along with Rao et al. [14]
found environmental stimulation and parental nurturance wasrelated to memory functioning in childhood. Such long-term
memory functions are mediated by the hippocampus [33].
Variations in hippocampal size have been associated with memory
performance with larger hippocampal volumes being related to
better memory performance [34]. In addition, higher levels of
chronic life stress appear to be associated with smaller hippocam-
pal volumes in adults [35]. These results add to the modest body of
research examining neurobiological associations with socioeco-
nomic status, providing one potential neurobiological mechanismthrough which the early environment may convey risk for a host of
deleterious outcomes.
In contrast to previous research linking amygdala volume and
stress [36], we did not observe associations for the amygdala and
income. Amygdala quantification is very challenging and even
Figure 4. Scatterplot of Right Hippocampal Gray Matter and Income. This scatterplot shows the association between right hippocampalgray matter probability and income. Right hippocampal gray matter shown on the vertical axis is displayed as a standardized residual controlling forchild’s age (in months), gender (dummy-coded), and whole brain volume, while log-transformed income is displayed on the horizontal axis. Higherincome is associated with greater gray matter probability.doi:10.1371/journal.pone.0018712.g004
Table 9. Regression Output For Models Examining the Association Between the Hippocampus and Income.
Region of Interest (Dependent Variable) Independent Variables
Unstandardized regression coefficients, Standard
Error, Standardized regression coefficients, test
statistics
Total Hippocampus Maternal Education B =20.0001, SE = 0.003, b=2.005, t=0.08 p=.93
Paternal Education B = 0.003, SE = 0.002, b=.105, t=1.785 p=.075
Income B = 0.045, SE = 0.018, b=.145, t=2.459 p=.014
Left Hippocampus Maternal Education B =20.001, SE = 0.002 b=2.03, t = 0.505 p= .614
Paternal Education B = 0.003, SE = 0.002, b=.083, t=1.404 p=.161
Income B = 0.052, SE = 0.019, b=.165, t=2.773 p=.006
Right Hippocampus Maternal Education B = 0.0007, SE = 0.002, b=.02, t=20.344, p = .73
Paternal Education B = 0.004, SE = 0.002, b=.122, t=2.073 p=.039
Income B = 0.038, SE = 0.019, b=.118, t=1.999 p=.046
NB: All regression models included child age (in months), gender of the child (dummy-coded), and whole-brain volume as covariates.doi:10.1371/journal.pone.0018712.t009
Association between Income and the Hippocampus
PLoS ONE | www.plosone.org 6 May 2011 | Volume 6 | Issue 5 | e18712
8/3/2019 Income Hippo Campus
http://slidepdf.com/reader/full/income-hippo-campus 7/8
with such a large sample size, automated methods may not be
appropriate. Follow-up analyses using a different method of
automated segmentation however yielded similar results (seeSupplemental Materials S1). In addition, associations betweenthe amygdala and early life stress effects may vary by age of
measurement (for discussion, see [37]). For example, increases in
amygdala volume may be seen early in development after the
experience of stress, while small amygdala volume may occur later
in development.
The structural imaging project presented here does not
address issues of causation: poverty carries multiple components
of environmetal risk and many factors may affect the
development of brain structure. Future research should longitu-
dinally assay both brain structure and function, as understanding
both factors are likely central to truly understanding associations
between neurobiological outcomes and income. Additional work
should also include a variety of neuropsychological assessment,
as the cognitive tests employed in this study were predominantly
‘‘prefrontal-dependent’’: tapping rule acquisition and working
memory. Subsequent studies must also aim to delineate the
effects of household income, environmental stimulation, stress,and other variables such as possible nutritional differences
related to poverty with large samples of children living in
poverty. Such research designs will further increase understand-
ing the neurobiological correlates of poverty and socioeconomic
status.
This study examined a large group of children and adolescents
from 5 different research sites around the United States.
Although issues of race and ethnicity were not the focus of our
study, these factors may be associated with variations in neural
development. Preliminary analyses suggested that our effects
held for Caucasian and non-Caucasian participants. Futureresearch should focus on exploring ethnic diversity with
appropriately sized samples across income categories. Of
important note, the NIH data set was also designed with a plan
to screenout individuals with mental health issues or very low
intelligence. This design skews the sample because psychopa-
thology and learning disorders are disproportionately represent-
ed among impoverished children. The present results therefore
reflect so-called ‘‘normal’’ children living in poverty. This
suggests that the present results likely under-represent the true
effects of poverty. Alternatively one could argue that the
exclusionary criteria may strengthen the implications of our
results as psychopathology or learning disorders as possible
explanations of the association can largely be ruled out as factorslying behind the correlation.
Understanding how environmental variations can affect neural,
emotional and cognitive functioning in humans has major
implications for both basic scientific questions and public policy
initiatives. Such knowledge about the neural embedding of
socioeconomic status, specifically poverty, may aid in the design
and implementation of intervention programs addressing SES-
related disparities in a cognitive and health outcomes. We found
variations in socioeconomic status were associated with hippo-
campal volumes (as measured by gray matter probability). This
finding suggests a potential neurobiological mechanism through
which the early environment may convey risk for a host of
deleterious outcomes from poor health to lower educational
achievement. In addition to SES-related disparities, such resultsadd to our understanding of human brain development, as we aim
to further delineate how post-natal experiences may uniquely
shape the brain and change behavior.
Supporting Information
Table S1 Additional Demographic Summary for full sample
(based on Wave 1 data).
(DOC)
Table S2 Demographic Variables for Subjects with and without
MRI Scans and/or Income.
(DOC)
Materials S1
(DOCX)
Acknowledgments
We thank Jay Bhattacharya, Ed Moss, and the Health & SES working book
group at the Russell Sage Foundation for helpful discussions.
Author Contributions
Conceived and designed the experiments: JLH AC BLW SDP. Analyzed
the data: JLH SDP. Contributed reagents/materials/analysis tools: JLH
AC BLW SDP. Wrote the paper: JLH AC BLW SDP.
Table 10. Regression Output For Models Examining the Association Between the Amygdala and Income.
Region of Interest (Dependent Variable) Independent Variables
Unstandardized regression coefficients, Standard
Error, Standardized regression coefficients, test
statistics
Total Amygdala Maternal Education B =20.0003, SE = 0.002, b=2.01, t =20.17 p = .867
Paternal Education B = 0.0013, SE = 0.002, b= .040, t= .679 p= .498Income B = 0.031, SE = 0.021, b=.088, t=1.483 p=.139
Left Amygdala Maternal Education B =20.001, SE = 0.002, b=2.013, t =20.22 p = .830
Paternal Education B = 0.001, SE = 0.002, b=.030, t=0.509 p=.611
Income B = 0.034, SE = 0.022, b=.091, t=1.529 p=.127
Right Amygdala Maternal Education B =20.0002, SE = 0.002, b=2.007, t =20.11 p=.91
Paternal Education B = 0.002, SE = 0.002, b=.048, t=0.805 p=.421
Income B = 0.029, SE = 0.021, b=.080, t=1.343 p=.180
NB: All regression models included child age (in months), gender of the child (dummy-coded), and whole-brain volume as covariates.doi:10.1371/journal.pone.0018712.t010
Association between Income and the Hippocampus
PLoS ONE | www.plosone.org 7 May 2011 | Volume 6 | Issue 5 | e18712
8/3/2019 Income Hippo Campus
http://slidepdf.com/reader/full/income-hippo-campus 8/8
References
1. Greenough W, Black J (1992) Induction of brain structure by experience:Substrate for cognitive development. In Gunnar MR, Nelson CA, eds.Minnesota Symposia on Child Psychology 24: Developmental BehavioralNeuroscience. Hillsdale, NJ: Lawrence Erlbaum. pp 155–200.
2. Meaney MJ, Szyf M (2005) Environmental programming of stress responsesthrough DNA methylation: life at the interface between a dynamic environmentand a fixed genome. Dialogues Clin Neurosci 7: 103–23.
3. Raizada RD, Kishiyama MM (2010) Effects of socioeconomic status on braindevelopment, and how cognitive neuroscience may contribute to levelling the
playing field. Front Hum Neurosci 4: 3. Available: http://www.frontiersin.org/human_neuroscience/10.3389/neuro.09/003.2010/abstract Accessed 2011March 18.
4. Evans GW, Kim P (2007) Childhood Poverty and Health Cumulative Risk Exposure and Stress Dysregulation. Psychological Science 18: 953–957.
5. McEwen BS (2001) Plasticity of the hippocampus: adaptation to chronic stressand allostatic load. Ann N Y Acad Sci 933: 265–77.
6. Fiala BA, Joyce JN, Greenough WT (1978) Environmental complexitymodulates growth of granule cell dendrites in developing but not adulthippocampus of rats. Exp Neurol 59: 372–83.
7. Greenough WT, Volkmar FR, Juraska JM (1973) Effects of rearing complexityon dendritic branching in frontolateral and temporal cortex of the rat. ExpNeurol 41: 371–8.
8. Soffie M, Hahn K, Terao E, Eclancher F (1999) Behavioural and glial changesin old rats following environmental enrichment. Behav Brain Res 101: 37–49.
9. Green EJ, Greenough WT (1986) Altered synaptic transmission in dentate gyrusof rats reared in complex environments: evidence from hippocampal slicesmaintained in vitro. J Neurophysiol 55: 739–50.
10. Kempermann G, Kuhn HG, Gage FH (1997) More hippocampal neurons in
adult mice living in an enriched environment. Nature 386: 493–5.11. Will BE, Rosenzweig MR, Bennett EL, Hebert M, Morimoto H (1977)
Relatively brief environmental enrichment aids recovery of learning capacityand alters brain measures after postweaning brain lesions in rats. J Comp PhysiolPsychol 91: 33–50.
12. Meaney MJ (2001) Maternal care, gene expression, and the transmission of individual differences in stress reactivity across generations. Annu Rev Neurosci24: 1161–92.
13. Farah MJ, Betancourt L, Shera DM, Savage JH, Giannetta JM, et al. (2008)Environmental stimulation, parental nurturance and cognitive development inhumans. Dev Sci 11: 793–801.
14. Rao H, Betancourt L, Giannetta JM, Brodsky NL, Korczykowski M, et al. (2010)Early parental care is important for hippocampal maturation: Evidence frombrain morphology in humans. Neuroimage 49: 1144–50.
15. Adler NE, Boyce T, Chesney MA, Cohen S, Folkman S, et al. (1994)Socioeconomic status and health. The challenge of the gradient. Am Psychol 49:15–24.
16. Lupien SJ, Maheu F, Tu M, Fiocco A, Schramek TE (2007) The effects of stressand stress hormones on human cognition: Implications for the field of brain and
cognition. Brain Cogn 65: 209–37.17. McLoyd VC, Wilson L (1990) Maternal behavior, social support, and economicconditions as predictors of distress in children. New Dir Child Dev Winter 46:49–69.
18. Moffitt TE, Gabrielli WF, Mednick SA, Schulsinger F (1981) Socioeconomicstatus, IQ, and delinquency. J Abnorm Psychol 90: 152–6.
19. Brain Development Cooperative Group, Evans AC (2006) The NIH MRI studyof normal brain development. Neuroimage 30: 184–202.
20. Waber DP, De Moor C, Forbes PW, Almli CR, Botteron KN, et al. (2007) TheNIH MRI study of normal brain development: performance of a populationbased sample of healthy children aged 6 to 18 years on a neuropsychologicalbattery. J Int Neuropsychol Soc 13: 729–746.
21. Ashburner J, Friston KJ (2000) Voxel-based morphometry—the methods.Neuroimage 11: 805–821.
22. Busatto GF, Diniz BS, Zanetti MV (2008) Voxel-based morphometry in
Alzheimer’s disease. Expert Rev Neurother 8: 1691–702.23. Williams LM (2008) Voxel-based morphometry in schizophrenia: implications
for neurodevelopmental connectivity models, cognition and affect. Expert RevNeurother 8: 1049–65.
24. Whitwell JL, Josephs KA (2007) Voxel-based morphometry and its applicationto movement disorders. Parkinsonism Relat Disord 13 Suppl 3: S406–16.
25. Ashburner J (2007) A fast diffeomorphic image registration algorithm. Neuro-image 38: 95–113.
26. Bergouignan L, Chupin M, Czechowska Y, Kinkingnehun S, Lemogne C, et al.(2009) Can voxel based morphometry, manual segmentation and automatedsegmentation equally detect hippocampal volume differences in acute depres-sion? Neuroimage 45: 29–37.
27. Yassa MA, Stark CE (2009) A quantitative evaluation of cross-participantregistration techniques for MRI studies of the medial temporal lobe. Neuro-image 44: 319–27.
28. Wilke M, Holland SK, Altaye M, Gaser C (2008) Template-O-Matic: a toolboxfor creating customized pediatric templates. Neuroimage 41: 903–13.
29. Tzourio-Mazoyer N, Landeau B, Papathanassiou D, Crivello F, Etard O, et al.(2002) Automated anatomical labeling of activations in SPM using a
macroscopic anatomical parcellation of the MNI MRI single-subject brain.Neuroimage 15: 273–89.
30. Klein A, Andersson J, Ardekani BA, Ashburner J, Avants B, et al. (2009)Evaluation of 14 nonlinear deformation algorithms applied to human brain MRIregistration. Neuroimage 46: 786–802.
31. Hackman DA, Farah MJ (2009) Socioeconomic status and the developing brain.Trends Cogn Sci 13: 65–73.
32. Farah MJ, Shera DM, Savage JH, Betancourt L, Giannetta JM, et al. (2006)Childhood poverty: specific associations with neurocognitive development. BrainRes 1110: 166–174.
33. Squire LR (1992) Memory and the hippocampus: a synthesis from findings withrats, monkeys, and humans. Psychol Rev 99: 195–231.
34. Biegler R, McGregor A, Krebs JR, Healy SD (2001) A larger hippocampus isassociated with longer-lasting spatial memory. Proc Natl Acad Sci U S A 98:6941–4.
35. Gianaros PJ, Jennings JR, Sheu LK, Greer PJ, Kuller LH, et al. (2007)Prospective reports of chronic life stress predict decreased grey matter volume inthe hippocampus. Neuroimage 35: 795–803.
36. McEwen BS (2010) Stress, sex, and neural adaptation to a changing
environment: mechanisms of neuronal remodeling. Ann N Y Acad Sci 1204Suppl: E38–59.37. Tottenham N, Sheridan MA (2010) A review of adversity, the amygdala and the
hippocampus: a consideration of developmental timing. Front Hum Neurosci 3:68. Availabl e: http://www.frontiersin.org/human_neuroscience/10.3389/neuro.09/068.2009/abstract Accessed 2011 March 18.
Association between Income and the Hippocampus
PLoS ONE | www.plosone.org 8 May 2011 | Volume 6 | Issue 5 | e18712
Related Documents