Inclusion, diversity and social equality targets The business case for inclusive and diverse businesses is clear: companies with greater diversity are 70% more likely to capture a new market 1 , have 19% points higher innovation revenues 2 , enjoy greater customer satisfaction and better market position 3 , and outperform non diverse teams by 35% 4 . Back in 2014, we published diversity target zones for achievement by 2018. These target zones encapsulated our ambition to become a more representative workforce. They focused on: Gender; Ethnicity; Disability and Sexual Orientation. Every year, we have continued to report progress against these metrics in our Annual Report (see our Workforce and student recruitment diversity data section for how we performed through to 2018). As part of our new Fairer Futures campaign we have set new inclusion, diversity and social equality targets 5 which we aim to achieve by 2022. In support of our leading work on social mobility, we are exploring setting a socio- economic background target. This year we have also increased our support for Black Heritage 6 talent, as we want to drive a signifcant increase in representation. We have started by setting a target for FY19 of 4.2% of our workforce, compared to the national workforce average of 4.2% per most recent Census data, and have a clear action plan to support us in achieving this. Our ambition is to become a Magnet for Talent. It is more important than ever that our talent is diverse – in their background and perspectives. Our services are rooted in people and their ideas. The diversity of our people not only makes KPMG a great place to work but is critical to bringing the fresh perspectives that our clients trust and value.” Bill Michael, Chairman and Senior Partner These targets are based on our learning over the past four years, are founded in our frm belief that inclusion, diversity and social equality are fundamental to driving our future success and demonstrate the commitment of our leadership to effect change. Our 2022 targets Gender – Female Partner 25% Director 39% Senior Manager 49% Ethnicity – BAME 7 Partner 11% Director 15% Senior Manager 22% Disability 8 Overall 6.7% © 2018 KPMG LLP, a UK limited liability partnership and a member frm of the KPMG network of independent member frms affliated with KPMG International Cooperative (“KPMG International”), a Swiss entity. All rights reserved. Sexual Orientation – LGB 9 Overall 3%

Welcome message from author
This document is posted to help you gain knowledge. Please leave a comment to let me know what you think about it! Share it to your friends and learn new things together.
Transcript
Inclusion, diversity and social equality targets
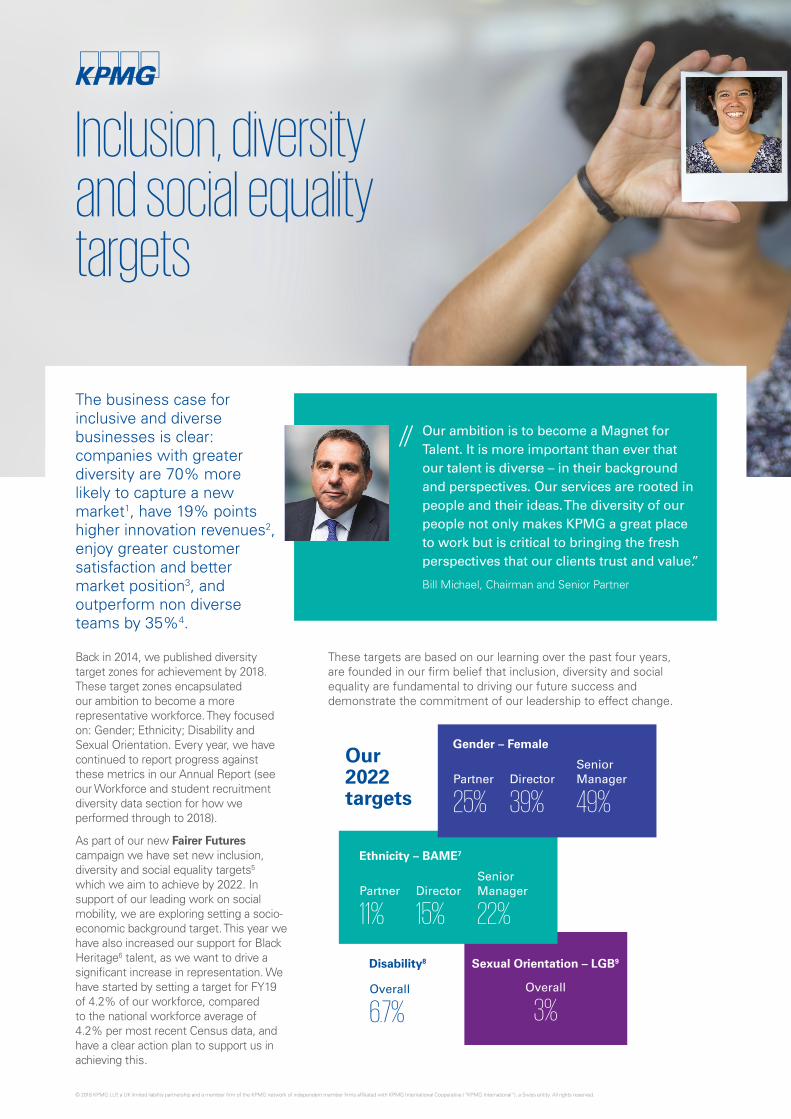
The business case for inclusive and diverse businesses is clear: companies with greater diversity are 70% more likely to capture a new market1, have 19% points higher innovation revenues2, enjoy greater customer satisfaction and better market position3, and outperform non diverse teams by 35%4.
Back in 2014, we published diversity target zones for achievement by 2018. These target zones encapsulated our ambition to become a more representative workforce. They focused on: Gender; Ethnicity; Disability and Sexual Orientation. Every year, we have continued to report progress against these metrics in our Annual Report (see our Workforce and student recruitment diversity data section for how we performed through to 2018).
As part of our new Fairer Futures campaign we have set new inclusion, diversity and social equality targets5 which we aim to achieve by 2022. In support of our leading work on social mobility, we are exploring setting a socio-economic background target. This year we have also increased our support for Black Heritage6 talent, as we want to drive a signifcant increase in representation. We have started by setting a target for FY19 of 4.2% of our workforce, compared to the national workforce average of 4.2% per most recent Census data, and have a clear action plan to support us in achieving this.
Our ambition is to become a Magnet for Talent. It is more important than ever that our talent is diverse – in their background and perspectives. Our services are rooted in people and their ideas. The diversity of our people not only makes KPMG a great place to work but is critical to bringing the fresh perspectives that our clients trust and value.”
Bill Michael, Chairman and Senior Partner
These targets are based on our learning over the past four years, are founded in our frm belief that inclusion, diversity and social equality are fundamental to driving our future success and demonstrate the commitment of our leadership to effect change.
Our 2022 targets
Gender – Female
Partner
25% Director
39%
Senior Manager
49%
Ethnicity – BAME7
Partner
11% Director
15%
Senior Manager
22%
Disability8
Overall
6.7%
© 2018 KPMG LLP, a UK limited liability partnership and a member frm of the KPMG network of independent member frms affliated with KPMG International Cooperative (“KPMG International”), a Swiss entity. All rights reserved.
Sexual Orientation – LGB9
Overall
3%
© 2018 KPMG LLP, a UK limited liability partnership and a member firm of the KPMG network of independent member firms affiliated with KPMG International Cooperative (“KPMG International”), a Swiss entity. All rights reserved.
1 Center for Talent Innovation, 2013.
2 Harvard Business Review, 2018.
3 Harvard Business Review, 2014.
4 Forbes Report, 2015.
5 The reporting of representation in our organisation is based on the collection of diversity data from employees who choose to declare as part of the diversity monitoring exercise.
6 By Blac k Heritage we mean employees who have self-identifed as the following Census 2011 categories: Black African, Black Caribbean or Any Other Black background, Mixed White and Black Caribbean and Mixed White and Black African.
7 B AME stands for Black, Asian and Minority Ethnic.
8 This includes disability and long term conditions, as covered in the Equality Act 2010. Long term conditions are not limited to, but include diabetes, autism, asthma, dyslexia, arthritis, or mental health conditions.
9 L esbian, Gay, Bisexual.
kpmg.com/uk
© 2018 KPMG LLP, a UK limited liability partnership and a member frm of the KPMG network of independent member frms affliated with KPMG International Cooperative (“KPMG International”), a Swiss entity. All rights reserved.
The KPMG name and logo are registered trademarks or trademarks of KPMG International.
Design by CREATE | CRT102056 | December 2018
Related Documents