Annual CANA Statistics Report 2011 Including Projections to 2016

Welcome message from author
This document is posted to help you gain knowledge. Please leave a comment to let me know what you think about it! Share it to your friends and learn new things together.
Transcript

Annual CANAStatistics Report2011Including Projections to 2016

2 CANA ANNUAL STATISTIC REPORT 2011
Annual CANA Statistics Report Featuring final 2010 data, newly released 2011 data and projections to 2016 Prepared by Singhal LLC and originally presented at the 94th Annual CANA Convention in Vancouver, B.C. on Aug. 17, 2012©Copyright CANA, 2012
DataThe vital statistics department or other designated regulatory agency in each state and Canadian province was contacted to collect the death and cremation data. Due to recessionary times and governmental budget cuts, we received a smaller set of data than expected.
Individual states and provinces finalize their annual data on a separate and individual timeframe. Some take up to three years following the close of the calendar year. As a result, statistics published here may have been updated from those previously published in CANA’s annual reports. Where verified data differs from that which was previously reported, the most recent data is used. Additionally, several states or provinces will not release provisional data. In these instances, CANA must perform estimates that are calculated based on detailed regression.All death and cremation figures are based on the state where they occurred, regardless of residency. In addition, 2006-2011 Canadian data excludes Quebec, as the The Institut de la Statistique du Québec is no longer able to provide these figures.
In both of the charts below, the number of cremations is shown by the columns and are read on the left side of the chart and these numbers are in thousands. The percentages are shown by the line and are read on the right side.
IntroductionSince its founding, CANA has been at the forefront of the cremation industry by disseminating its flagship CANA Cremation Statistics Annual Report. This publication is the preeminent source on cremation data from the United States and Canada. For years, CANA has been collecting cremation figures from state and provincial vital statistics departments or other designated regulatory agencies in the United States and Canada. From these figures, CANA has determined the annual percentage of cremations to deaths, which includes all the states and provinces. CANA has also been able to use these figures to forecast future cremation percentages.
In the past, the majority of the states and provinces had resources to provide death and cremation data; however, due to budget cuts a significant number of them have reduced or eliminated this service. As a result, CANA’s role in collecting the relevant data and forecasting these trends has become more significant than ever before. CANA is in the process of implementing methods and systems to collect this data. We expect that the data from individual crematories will play a bigger role going forward. The implementation of this new system will take at least six months; therefore, we are planning to update this report again in February 2013.
Projection MethodologySince 1998, CANA has used a five-year comparison period in order to arrive at the projections. Given the significant political and recessional changes, a regression analysis was implemented to aid the interpretation of the data.
Report Highlights – United States and Canadian Cremation Trends
United States number of cremations and percent cremation
Canada number of cremations and percent cremation (excluding Quebec)

CANA ANNUAL STATISTIC REPORT 2011 3
Annual Growth Rate The annual growth rate is the difference between the yearly percentages of deaths cremated that are averaged over a five-year period. The table below shows the rates for the United States from 1996 through 2011. Further, this table illustrates that the cremation rate is increasing exponentially, with the current average growth at 1.64 percent annually.
Annual Growth Rate – Five Year Average USAYear % Cremated1996 21.8%
2001 27.0%
2006 33.8%
2011 42.0%
% change 1996-2001 5.3%
% change 2001-2006 6.8%
% change 2006-2011 8.2%
Annual Growth Rate per Year over 2006-2011 1.64%
The table below shows the cremation rates for Canada, excluding Quebec. This also shows that the cremation rates are increasing; however, the cremation rates appear to be flattening out.
Annual Growth Rate – Five Year Average CanadaYear % Cremated2001 47.2%
2006 57.3%
2011 59.2%
% change 2001-2006 10.0%
% change 2006-2011 1.9%
Annual Growth Rate per Year over 2006-2011 0.4%
Percentages of Cremations in the States/Provinces for 2007 and 2011
2007
2007
2011
2011
4 CANA ANNUAL STATISTIC REPORT 2011
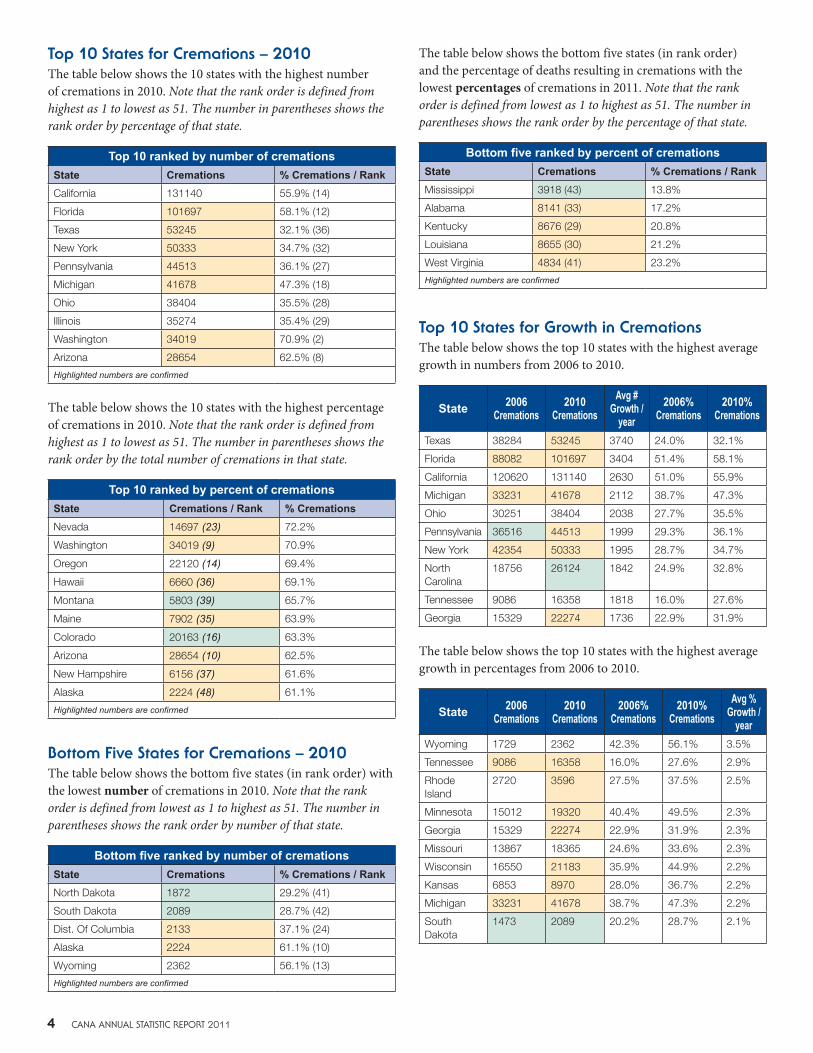
The table below shows the bottom five states (in rank order) and the percentage of deaths resulting in cremations with the lowest percentages of cremations in 2011. Note that the rank order is defined from lowest as 1 to highest as 51. The number in parentheses shows the rank order by the percentage of that state.
Bottom five ranked by percent of cremationsState Cremations % Cremations / RankMississippi 3918 (43) 13.8%
Alabama 8141 (33) 17.2%
Kentucky 8676 (29) 20.8%
Louisiana 8655 (30) 21.2%
West Virginia 4834 (41) 23.2%
Highlighted numbers are confirmed
Top 10 States for Growth in CremationsThe table below shows the top 10 states with the highest average growth in numbers from 2006 to 2010.
State 2006 Cremations
2010 Cremations
Avg # Growth /
year2006%
Cremations2010%
Cremations
Texas 38284 53245 3740 24.0% 32.1%
Florida 88082 101697 3404 51.4% 58.1%
California 120620 131140 2630 51.0% 55.9%
Michigan 33231 41678 2112 38.7% 47.3%
Ohio 30251 38404 2038 27.7% 35.5%
Pennsylvania 36516 44513 1999 29.3% 36.1%
New York 42354 50333 1995 28.7% 34.7%
North Carolina
18756 26124 1842 24.9% 32.8%
Tennessee 9086 16358 1818 16.0% 27.6%
Georgia 15329 22274 1736 22.9% 31.9%
The table below shows the top 10 states with the highest average growth in percentages from 2006 to 2010.
State 2006 Cremations
2010 Cremations
2006% Cremations
2010% Cremations
Avg % Growth /
yearWyoming 1729 2362 42.3% 56.1% 3.5%
Tennessee 9086 16358 16.0% 27.6% 2.9%
Rhode Island
2720 3596 27.5% 37.5% 2.5%
Minnesota 15012 19320 40.4% 49.5% 2.3%
Georgia 15329 22274 22.9% 31.9% 2.3%
Missouri 13867 18365 24.6% 33.6% 2.3%
Wisconsin 16550 21183 35.9% 44.9% 2.2%
Kansas 6853 8970 28.0% 36.7% 2.2%
Michigan 33231 41678 38.7% 47.3% 2.2%
South Dakota
1473 2089 20.2% 28.7% 2.1%
Top 10 States for Cremations – 2010The table below shows the 10 states with the highest number of cremations in 2010. Note that the rank order is defined from highest as 1 to lowest as 51. The number in parentheses shows the rank order by percentage of that state.
Top 10 ranked by number of cremationsState Cremations % Cremations / RankCalifornia 131140 55.9% (14)
Florida 101697 58.1% (12)
Texas 53245 32.1% (36)
New York 50333 34.7% (32)
Pennsylvania 44513 36.1% (27)
Michigan 41678 47.3% (18)
Ohio 38404 35.5% (28)
Illinois 35274 35.4% (29)
Washington 34019 70.9% (2)
Arizona 28654 62.5% (8)
Highlighted numbers are confirmed
The table below shows the 10 states with the highest percentage of cremations in 2010. Note that the rank order is defined from highest as 1 to lowest as 51. The number in parentheses shows the rank order by the total number of cremations in that state.
Top 10 ranked by percent of cremationsState Cremations / Rank % CremationsNevada 14697 (23) 72.2%
Washington 34019 (9) 70.9%
Oregon 22120 (14) 69.4%
Hawaii 6660 (36) 69.1%
Montana 5803 (39) 65.7%
Maine 7902 (35) 63.9%
Colorado 20163 (16) 63.3%
Arizona 28654 (10) 62.5%
New Hampshire 6156 (37) 61.6%
Alaska 2224 (48) 61.1%
Highlighted numbers are confirmed
Bottom Five States for Cremations – 2010The table below shows the bottom five states (in rank order) with the lowest number of cremations in 2010. Note that the rank order is defined from lowest as 1 to highest as 51. The number in parentheses shows the rank order by number of that state.
Bottom five ranked by number of cremationsState Cremations % Cremations / RankNorth Dakota 1872 29.2% (41)
South Dakota 2089 28.7% (42)
Dist. Of Columbia 2133 37.1% (24)
Alaska 2224 61.1% (10)
Wyoming 2362 56.1% (13)
Highlighted numbers are confirmed
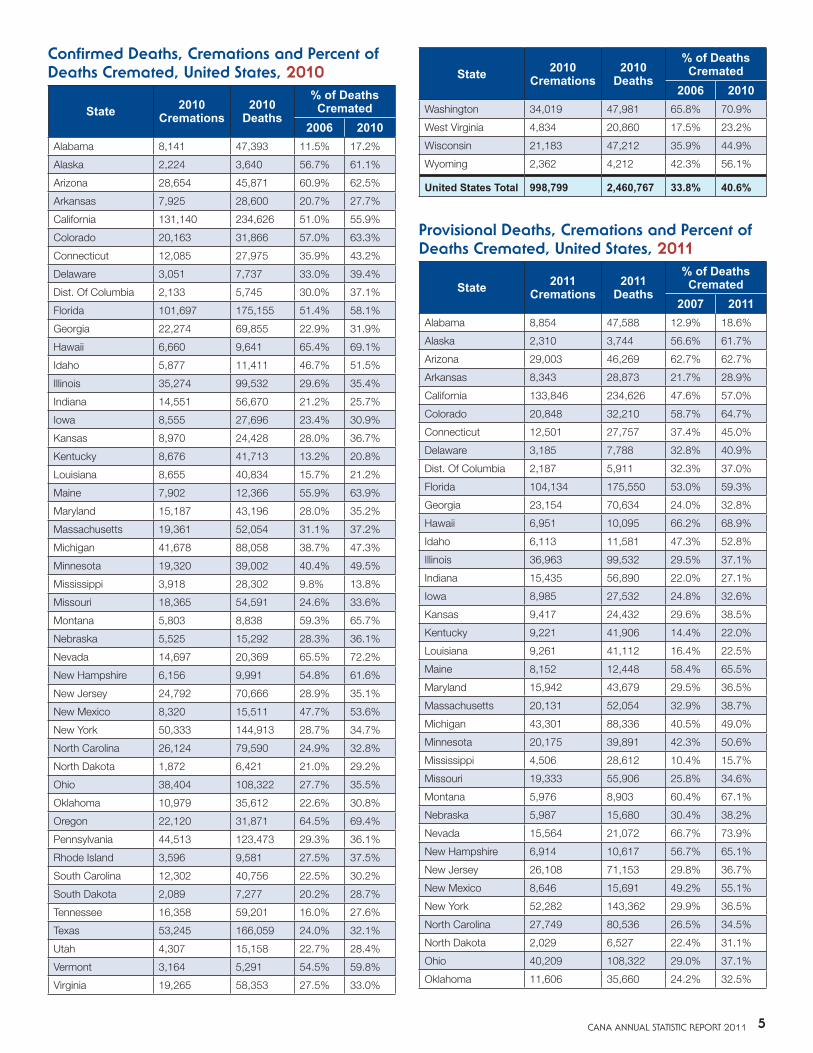
CANA ANNUAL STATISTIC REPORT 2011 5
State 2010 Cremations
2010 Deaths
% of Deaths Cremated
2006 2010Washington 34,019 47,981 65.8% 70.9%
West Virginia 4,834 20,860 17.5% 23.2%
Wisconsin 21,183 47,212 35.9% 44.9%
Wyoming 2,362 4,212 42.3% 56.1%
United States Total 998,799 2,460,767 33.8% 40.6%
Provisional Deaths, Cremations and Percent of Deaths Cremated, United States, 2011
State 2011 Cremations
2011 Deaths
% of Deaths Cremated
2007 2011Alabama 8,854 47,588 12.9% 18.6%
Alaska 2,310 3,744 56.6% 61.7%
Arizona 29,003 46,269 62.7% 62.7%
Arkansas 8,343 28,873 21.7% 28.9%
California 133,846 234,626 47.6% 57.0%
Colorado 20,848 32,210 58.7% 64.7%
Connecticut 12,501 27,757 37.4% 45.0%
Delaware 3,185 7,788 32.8% 40.9%
Dist. Of Columbia 2,187 5,911 32.3% 37.0%
Florida 104,134 175,550 53.0% 59.3%
Georgia 23,154 70,634 24.0% 32.8%
Hawaii 6,951 10,095 66.2% 68.9%
Idaho 6,113 11,581 47.3% 52.8%
Illinois 36,963 99,532 29.5% 37.1%
Indiana 15,435 56,890 22.0% 27.1%
Iowa 8,985 27,532 24.8% 32.6%
Kansas 9,417 24,432 29.6% 38.5%
Kentucky 9,221 41,906 14.4% 22.0%
Louisiana 9,261 41,112 16.4% 22.5%
Maine 8,152 12,448 58.4% 65.5%
Maryland 15,942 43,679 29.5% 36.5%
Massachusetts 20,131 52,054 32.9% 38.7%
Michigan 43,301 88,336 40.5% 49.0%
Minnesota 20,175 39,891 42.3% 50.6%
Mississippi 4,506 28,612 10.4% 15.7%
Missouri 19,333 55,906 25.8% 34.6%
Montana 5,976 8,903 60.4% 67.1%
Nebraska 5,987 15,680 30.4% 38.2%
Nevada 15,564 21,072 66.7% 73.9%
New Hampshire 6,914 10,617 56.7% 65.1%
New Jersey 26,108 71,153 29.8% 36.7%
New Mexico 8,646 15,691 49.2% 55.1%
New York 52,282 143,362 29.9% 36.5%
North Carolina 27,749 80,536 26.5% 34.5%
North Dakota 2,029 6,527 22.4% 31.1%
Ohio 40,209 108,322 29.0% 37.1%
Oklahoma 11,606 35,660 24.2% 32.5%
Confirmed Deaths, Cremations and Percent of Deaths Cremated, United States, 2010
State 2010 Cremations
2010 Deaths
% of Deaths Cremated
2006 2010Alabama 8,141 47,393 11.5% 17.2%
Alaska 2,224 3,640 56.7% 61.1%
Arizona 28,654 45,871 60.9% 62.5%
Arkansas 7,925 28,600 20.7% 27.7%
California 131,140 234,626 51.0% 55.9%
Colorado 20,163 31,866 57.0% 63.3%
Connecticut 12,085 27,975 35.9% 43.2%
Delaware 3,051 7,737 33.0% 39.4%
Dist. Of Columbia 2,133 5,745 30.0% 37.1%
Florida 101,697 175,155 51.4% 58.1%
Georgia 22,274 69,855 22.9% 31.9%
Hawaii 6,660 9,641 65.4% 69.1%
Idaho 5,877 11,411 46.7% 51.5%
Illinois 35,274 99,532 29.6% 35.4%
Indiana 14,551 56,670 21.2% 25.7%
Iowa 8,555 27,696 23.4% 30.9%
Kansas 8,970 24,428 28.0% 36.7%
Kentucky 8,676 41,713 13.2% 20.8%
Louisiana 8,655 40,834 15.7% 21.2%
Maine 7,902 12,366 55.9% 63.9%
Maryland 15,187 43,196 28.0% 35.2%
Massachusetts 19,361 52,054 31.1% 37.2%
Michigan 41,678 88,058 38.7% 47.3%
Minnesota 19,320 39,002 40.4% 49.5%
Mississippi 3,918 28,302 9.8% 13.8%
Missouri 18,365 54,591 24.6% 33.6%
Montana 5,803 8,838 59.3% 65.7%
Nebraska 5,525 15,292 28.3% 36.1%
Nevada 14,697 20,369 65.5% 72.2%
New Hampshire 6,156 9,991 54.8% 61.6%
New Jersey 24,792 70,666 28.9% 35.1%
New Mexico 8,320 15,511 47.7% 53.6%
New York 50,333 144,913 28.7% 34.7%
North Carolina 26,124 79,590 24.9% 32.8%
North Dakota 1,872 6,421 21.0% 29.2%
Ohio 38,404 108,322 27.7% 35.5%
Oklahoma 10,979 35,612 22.6% 30.8%
Oregon 22,120 31,871 64.5% 69.4%
Pennsylvania 44,513 123,473 29.3% 36.1%
Rhode Island 3,596 9,581 27.5% 37.5%
South Carolina 12,302 40,756 22.5% 30.2%
South Dakota 2,089 7,277 20.2% 28.7%
Tennessee 16,358 59,201 16.0% 27.6%
Texas 53,245 166,059 24.0% 32.1%
Utah 4,307 15,158 22.7% 28.4%
Vermont 3,164 5,291 54.5% 59.8%
Virginia 19,265 58,353 27.5% 33.0%
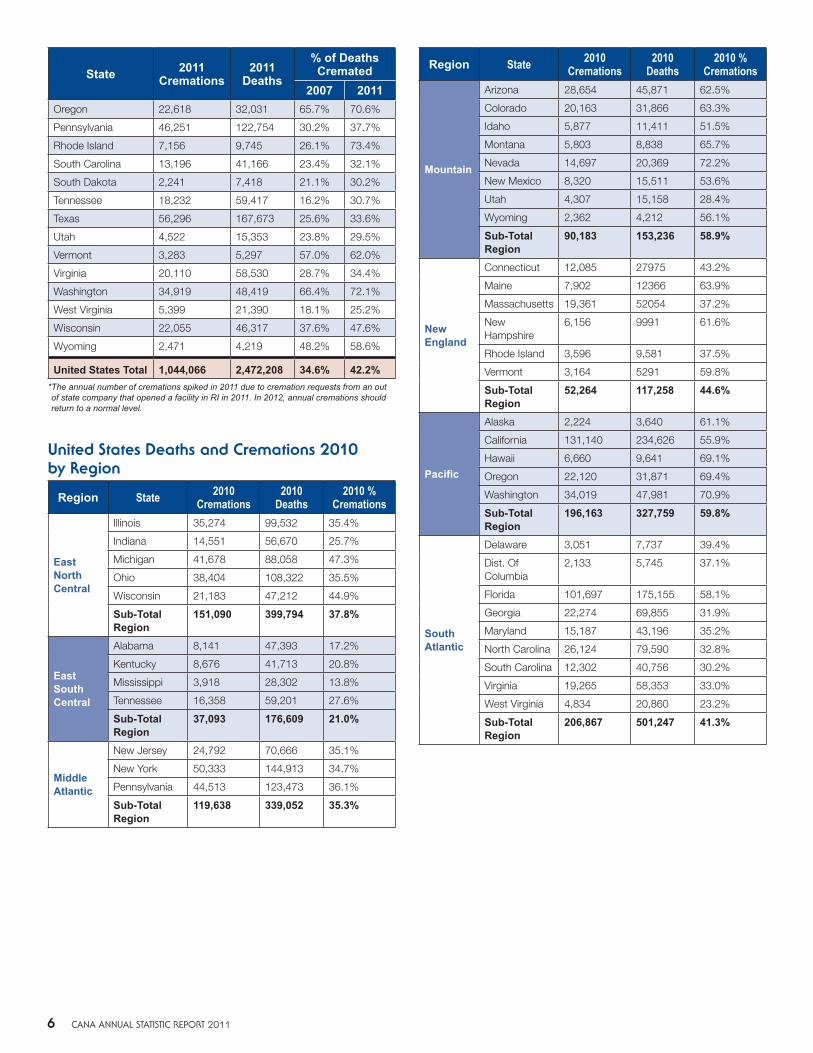
6 CANA ANNUAL STATISTIC REPORT 2011
State 2011 Cremations
2011 Deaths
% of Deaths Cremated
2007 2011Oregon 22,618 32,031 65.7% 70.6%
Pennsylvania 46,251 122,754 30.2% 37.7%
Rhode Island 7,156 9,745 26.1% 73.4%
South Carolina 13,196 41,166 23.4% 32.1%
South Dakota 2,241 7,418 21.1% 30.2%
Tennessee 18,232 59,417 16.2% 30.7%
Texas 56,296 167,673 25.6% 33.6%
Utah 4,522 15,353 23.8% 29.5%
Vermont 3,283 5,297 57.0% 62.0%
Virginia 20,110 58,530 28.7% 34.4%
Washington 34,919 48,419 66.4% 72.1%
West Virginia 5,399 21,390 18.1% 25.2%
Wisconsin 22,055 46,317 37.6% 47.6%
Wyoming 2,471 4,219 48.2% 58.6%
United States Total 1,044,066 2,472,208 34.6% 42.2%* The annual number of cremations spiked in 2011 due to cremation requests from an out of state company that opened a facility in RI in 2011. In 2012, annual cremations should return to a normal level.
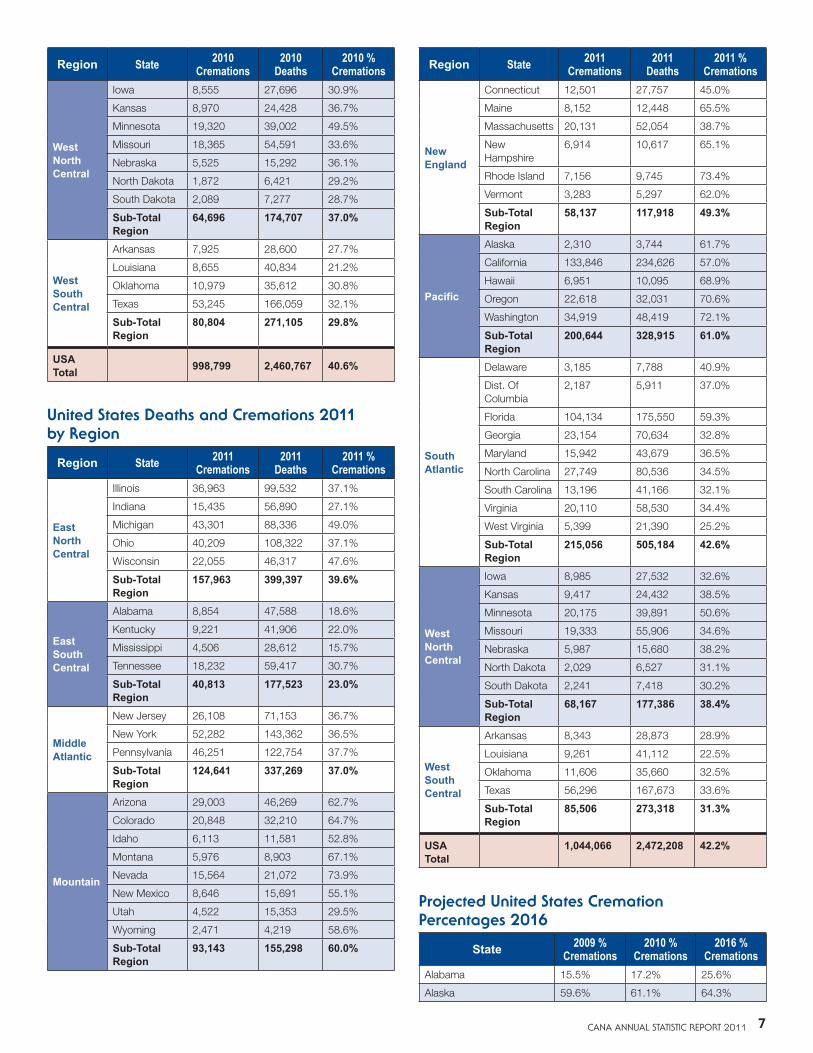
United States Deaths and Cremations 2010 by Region
Region State 2010 Cremations
2010 Deaths
2010 % Cremations
East North Central
Illinois 35,274 99,532 35.4%
Indiana 14,551 56,670 25.7%
Michigan 41,678 88,058 47.3%
Ohio 38,404 108,322 35.5%
Wisconsin 21,183 47,212 44.9%
Sub-Total Region
151,090 399,794 37.8%
East South Central
Alabama 8,141 47,393 17.2%
Kentucky 8,676 41,713 20.8%
Mississippi 3,918 28,302 13.8%
Tennessee 16,358 59,201 27.6%
Sub-Total Region
37,093 176,609 21.0%
Middle Atlantic
New Jersey 24,792 70,666 35.1%
New York 50,333 144,913 34.7%
Pennsylvania 44,513 123,473 36.1%
Sub-Total Region
119,638 339,052 35.3%
Region State 2010 Cremations
2010 Deaths
2010 % Cremations
Mountain
Arizona 28,654 45,871 62.5%
Colorado 20,163 31,866 63.3%
Idaho 5,877 11,411 51.5%
Montana 5,803 8,838 65.7%
Nevada 14,697 20,369 72.2%
New Mexico 8,320 15,511 53.6%
Utah 4,307 15,158 28.4%
Wyoming 2,362 4,212 56.1%
Sub-Total Region
90,183 153,236 58.9%
New England
Connecticut 12,085 27975 43.2%
Maine 7,902 12366 63.9%
Massachusetts 19,361 52054 37.2%
New Hampshire
6,156 9991 61.6%
Rhode Island 3,596 9,581 37.5%
Vermont 3,164 5291 59.8%
Sub-Total Region
52,264 117,258 44.6%
Pacific
Alaska 2,224 3,640 61.1%
California 131,140 234,626 55.9%
Hawaii 6,660 9,641 69.1%
Oregon 22,120 31,871 69.4%
Washington 34,019 47,981 70.9%
Sub-Total Region
196,163 327,759 59.8%
South Atlantic
Delaware 3,051 7,737 39.4%
Dist. Of Columbia
2,133 5,745 37.1%
Florida 101,697 175,155 58.1%
Georgia 22,274 69,855 31.9%
Maryland 15,187 43,196 35.2%
North Carolina 26,124 79,590 32.8%
South Carolina 12,302 40,756 30.2%
Virginia 19,265 58,353 33.0%
West Virginia 4,834 20,860 23.2%
Sub-Total Region
206,867 501,247 41.3%
CANA ANNUAL STATISTIC REPORT 2011 7
Region State 2010 Cremations
2010 Deaths
2010 % Cremations
West North Central
Iowa 8,555 27,696 30.9%
Kansas 8,970 24,428 36.7%
Minnesota 19,320 39,002 49.5%
Missouri 18,365 54,591 33.6%
Nebraska 5,525 15,292 36.1%
North Dakota 1,872 6,421 29.2%
South Dakota 2,089 7,277 28.7%
Sub-Total Region
64,696 174,707 37.0%
West South Central
Arkansas 7,925 28,600 27.7%
Louisiana 8,655 40,834 21.2%
Oklahoma 10,979 35,612 30.8%
Texas 53,245 166,059 32.1%
Sub-Total Region
80,804 271,105 29.8%
USA Total 998,799 2,460,767 40.6%
United States Deaths and Cremations 2011 by Region
Region State 2011 Cremations
2011 Deaths
2011 % Cremations
East North Central
Illinois 36,963 99,532 37.1%
Indiana 15,435 56,890 27.1%
Michigan 43,301 88,336 49.0%
Ohio 40,209 108,322 37.1%
Wisconsin 22,055 46,317 47.6%
Sub-Total Region
157,963 399,397 39.6%
East South Central
Alabama 8,854 47,588 18.6%
Kentucky 9,221 41,906 22.0%
Mississippi 4,506 28,612 15.7%
Tennessee 18,232 59,417 30.7%
Sub-Total Region
40,813 177,523 23.0%
Middle Atlantic
New Jersey 26,108 71,153 36.7%
New York 52,282 143,362 36.5%
Pennsylvania 46,251 122,754 37.7%
Sub-Total Region
124,641 337,269 37.0%
Mountain
Arizona 29,003 46,269 62.7%
Colorado 20,848 32,210 64.7%
Idaho 6,113 11,581 52.8%
Montana 5,976 8,903 67.1%
Nevada 15,564 21,072 73.9%
New Mexico 8,646 15,691 55.1%
Utah 4,522 15,353 29.5%
Wyoming 2,471 4,219 58.6%
Sub-Total Region
93,143 155,298 60.0%
Region State 2011 Cremations
2011 Deaths
2011 % Cremations
New England
Connecticut 12,501 27,757 45.0%
Maine 8,152 12,448 65.5%
Massachusetts 20,131 52,054 38.7%
New Hampshire
6,914 10,617 65.1%
Rhode Island 7,156 9,745 73.4%
Vermont 3,283 5,297 62.0%
Sub-Total Region
58,137 117,918 49.3%
Pacific
Alaska 2,310 3,744 61.7%
California 133,846 234,626 57.0%
Hawaii 6,951 10,095 68.9%
Oregon 22,618 32,031 70.6%
Washington 34,919 48,419 72.1%
Sub-Total Region
200,644 328,915 61.0%
South Atlantic
Delaware 3,185 7,788 40.9%
Dist. Of Columbia
2,187 5,911 37.0%
Florida 104,134 175,550 59.3%
Georgia 23,154 70,634 32.8%
Maryland 15,942 43,679 36.5%
North Carolina 27,749 80,536 34.5%
South Carolina 13,196 41,166 32.1%
Virginia 20,110 58,530 34.4%
West Virginia 5,399 21,390 25.2%
Sub-Total Region
215,056 505,184 42.6%
West North Central
Iowa 8,985 27,532 32.6%
Kansas 9,417 24,432 38.5%
Minnesota 20,175 39,891 50.6%
Missouri 19,333 55,906 34.6%
Nebraska 5,987 15,680 38.2%
North Dakota 2,029 6,527 31.1%
South Dakota 2,241 7,418 30.2%
Sub-Total Region
68,167 177,386 38.4%
West South Central
Arkansas 8,343 28,873 28.9%
Louisiana 9,261 41,112 22.5%
Oklahoma 11,606 35,660 32.5%
Texas 56,296 167,673 33.6%
Sub-Total Region
85,506 273,318 31.3%
USA Total
1,044,066 2,472,208 42.2%
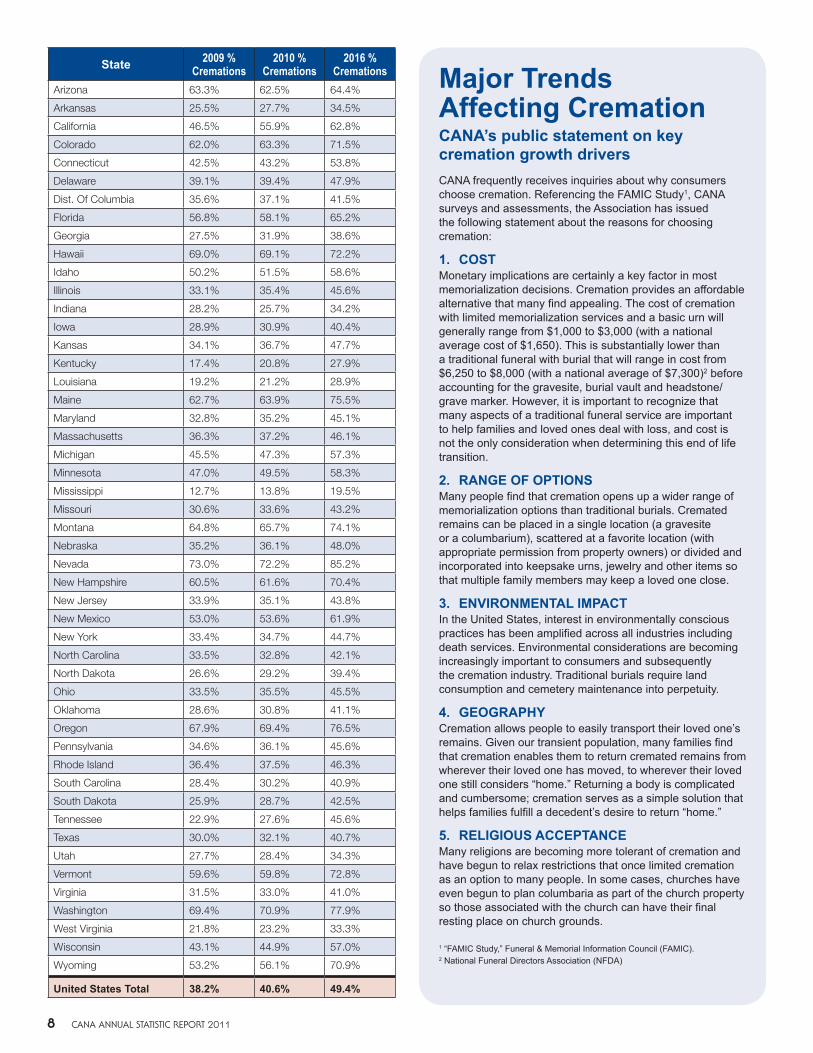
Projected United States Cremation Percentages 2016
State 2009 % Cremations
2010 % Cremations
2016 % Cremations
Alabama 15.5% 17.2% 25.6%
Alaska 59.6% 61.1% 64.3%
8 CANA ANNUAL STATISTIC REPORT 2011
State 2009 % Cremations
2010 % Cremations
2016 % Cremations
Arizona 63.3% 62.5% 64.4%
Arkansas 25.5% 27.7% 34.5%
California 46.5% 55.9% 62.8%
Colorado 62.0% 63.3% 71.5%
Connecticut 42.5% 43.2% 53.8%
Delaware 39.1% 39.4% 47.9%
Dist. Of Columbia 35.6% 37.1% 41.5%
Florida 56.8% 58.1% 65.2%
Georgia 27.5% 31.9% 38.6%
Hawaii 69.0% 69.1% 72.2%
Idaho 50.2% 51.5% 58.6%
Illinois 33.1% 35.4% 45.6%
Indiana 28.2% 25.7% 34.2%
Iowa 28.9% 30.9% 40.4%
Kansas 34.1% 36.7% 47.7%
Kentucky 17.4% 20.8% 27.9%
Louisiana 19.2% 21.2% 28.9%
Maine 62.7% 63.9% 75.5%
Maryland 32.8% 35.2% 45.1%
Massachusetts 36.3% 37.2% 46.1%
Michigan 45.5% 47.3% 57.3%
Minnesota 47.0% 49.5% 58.3%
Mississippi 12.7% 13.8% 19.5%
Missouri 30.6% 33.6% 43.2%
Montana 64.8% 65.7% 74.1%
Nebraska 35.2% 36.1% 48.0%
Nevada 73.0% 72.2% 85.2%
New Hampshire 60.5% 61.6% 70.4%
New Jersey 33.9% 35.1% 43.8%
New Mexico 53.0% 53.6% 61.9%
New York 33.4% 34.7% 44.7%
North Carolina 33.5% 32.8% 42.1%
North Dakota 26.6% 29.2% 39.4%
Ohio 33.5% 35.5% 45.5%
Oklahoma 28.6% 30.8% 41.1%
Oregon 67.9% 69.4% 76.5%
Pennsylvania 34.6% 36.1% 45.6%
Rhode Island 36.4% 37.5% 46.3%
South Carolina 28.4% 30.2% 40.9%
South Dakota 25.9% 28.7% 42.5%
Tennessee 22.9% 27.6% 45.6%
Texas 30.0% 32.1% 40.7%
Utah 27.7% 28.4% 34.3%
Vermont 59.6% 59.8% 72.8%
Virginia 31.5% 33.0% 41.0%
Washington 69.4% 70.9% 77.9%
West Virginia 21.8% 23.2% 33.3%
Wisconsin 43.1% 44.9% 57.0%
Wyoming 53.2% 56.1% 70.9%
United States Total 38.2% 40.6% 49.4%
Major Trends Affecting CremationCANA’s public statement on key cremation growth driversCANA frequently receives inquiries about why consumers choose cremation. Referencing the FAMIC Study1, CANA surveys and assessments, the Association has issued the following statement about the reasons for choosing cremation:
1. COSTMonetary implications are certainly a key factor in most memorialization decisions. Cremation provides an affordable alternative that many find appealing. The cost of cremation with limited memorialization services and a basic urn will generally range from $1,000 to $3,000 (with a national average cost of $1,650). This is substantially lower than a traditional funeral with burial that will range in cost from $6,250 to $8,000 (with a national average of $7,300)2 before accounting for the gravesite, burial vault and headstone/grave marker. However, it is important to recognize that many aspects of a traditional funeral service are important to help families and loved ones deal with loss, and cost is not the only consideration when determining this end of life transition.
2. RANGE OF OPTIONSMany people find that cremation opens up a wider range of memorialization options than traditional burials. Cremated remains can be placed in a single location (a gravesite or a columbarium), scattered at a favorite location (with appropriate permission from property owners) or divided and incorporated into keepsake urns, jewelry and other items so that multiple family members may keep a loved one close.
3. ENVIRONMENTAL IMPACTIn the United States, interest in environmentally conscious practices has been amplified across all industries including death services. Environmental considerations are becoming increasingly important to consumers and subsequently the cremation industry. Traditional burials require land consumption and cemetery maintenance into perpetuity.
4. GEOGRAPHYCremation allows people to easily transport their loved one’s remains. Given our transient population, many families find that cremation enables them to return cremated remains from wherever their loved one has moved, to wherever their loved one still considers “home.” Returning a body is complicated and cumbersome; cremation serves as a simple solution that helps families fulfill a decedent’s desire to return “home.”
5. RELIGIOUS ACCEPTANCEMany religions are becoming more tolerant of cremation and have begun to relax restrictions that once limited cremation as an option to many people. In some cases, churches have even begun to plan columbaria as part of the church property so those associated with the church can have their final resting place on church grounds.
1 “FAMIC Study,” Funeral & Memorial Information Council (FAMIC).2 National Funeral Directors Association (NFDA)
CANA ANNUAL STATISTIC REPORT 2011 9
Continued on page 16
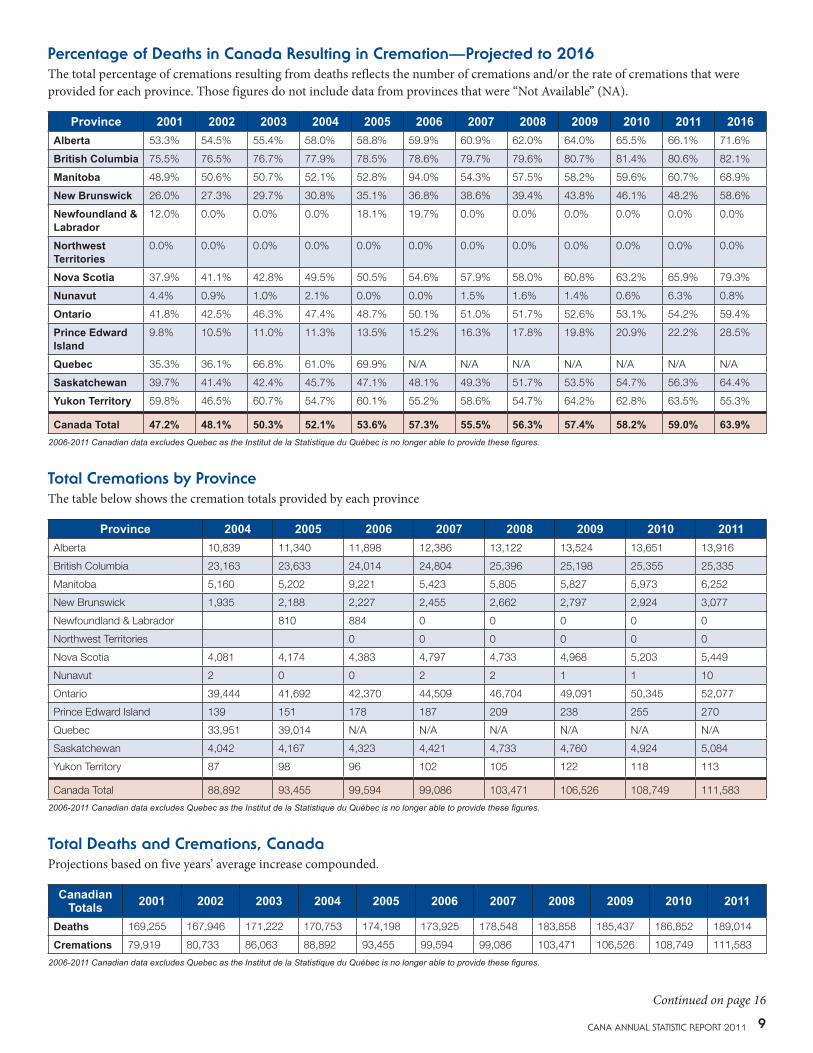
Percentage of Deaths in Canada Resulting in Cremation—Projected to 2016The total percentage of cremations resulting from deaths reflects the number of cremations and/or the rate of cremations that were provided for each province. Those figures do not include data from provinces that were “Not Available” (NA).
Province 2001 2002 2003 2004 2005 2006 2007 2008 2009 2010 2011 2016Alberta 53.3% 54.5% 55.4% 58.0% 58.8% 59.9% 60.9% 62.0% 64.0% 65.5% 66.1% 71.6%
British Columbia 75.5% 76.5% 76.7% 77.9% 78.5% 78.6% 79.7% 79.6% 80.7% 81.4% 80.6% 82.1%
Manitoba 48.9% 50.6% 50.7% 52.1% 52.8% 94.0% 54.3% 57.5% 58.2% 59.6% 60.7% 68.9%
New Brunswick 26.0% 27.3% 29.7% 30.8% 35.1% 36.8% 38.6% 39.4% 43.8% 46.1% 48.2% 58.6%
Newfoundland & Labrador
12.0% 0.0% 0.0% 0.0% 18.1% 19.7% 0.0% 0.0% 0.0% 0.0% 0.0% 0.0%
Northwest Territories
0.0% 0.0% 0.0% 0.0% 0.0% 0.0% 0.0% 0.0% 0.0% 0.0% 0.0% 0.0%
Nova Scotia 37.9% 41.1% 42.8% 49.5% 50.5% 54.6% 57.9% 58.0% 60.8% 63.2% 65.9% 79.3%
Nunavut 4.4% 0.9% 1.0% 2.1% 0.0% 0.0% 1.5% 1.6% 1.4% 0.6% 6.3% 0.8%
Ontario 41.8% 42.5% 46.3% 47.4% 48.7% 50.1% 51.0% 51.7% 52.6% 53.1% 54.2% 59.4%
Prince Edward Island
9.8% 10.5% 11.0% 11.3% 13.5% 15.2% 16.3% 17.8% 19.8% 20.9% 22.2% 28.5%
Quebec 35.3% 36.1% 66.8% 61.0% 69.9% N/A N/A N/A N/A N/A N/A N/A
Saskatchewan 39.7% 41.4% 42.4% 45.7% 47.1% 48.1% 49.3% 51.7% 53.5% 54.7% 56.3% 64.4%
Yukon Territory 59.8% 46.5% 60.7% 54.7% 60.1% 55.2% 58.6% 54.7% 64.2% 62.8% 63.5% 55.3%
Canada Total 47.2% 48.1% 50.3% 52.1% 53.6% 57.3% 55.5% 56.3% 57.4% 58.2% 59.0% 63.9%2006-2011 Canadian data excludes Quebec as the Institut de la Statistique du Québec is no longer able to provide these figures.
Total Cremations by ProvinceThe table below shows the cremation totals provided by each province
Province 2004 2005 2006 2007 2008 2009 2010 2011Alberta 10,839 11,340 11,898 12,386 13,122 13,524 13,651 13,916
British Columbia 23,163 23,633 24,014 24,804 25,396 25,198 25,355 25,335
Manitoba 5,160 5,202 9,221 5,423 5,805 5,827 5,973 6,252
New Brunswick 1,935 2,188 2,227 2,455 2,662 2,797 2,924 3,077
Newfoundland & Labrador 810 884 0 0 0 0 0
Northwest Territories 0 0 0 0 0 0
Nova Scotia 4,081 4,174 4,383 4,797 4,733 4,968 5,203 5,449
Nunavut 2 0 0 2 2 1 1 10
Ontario 39,444 41,692 42,370 44,509 46,704 49,091 50,345 52,077
Prince Edward Island 139 151 178 187 209 238 255 270
Quebec 33,951 39,014 N/A N/A N/A N/A N/A N/A
Saskatchewan 4,042 4,167 4,323 4,421 4,733 4,760 4,924 5,084
Yukon Territory 87 98 96 102 105 122 118 113
Canada Total 88,892 93,455 99,594 99,086 103,471 106,526 108,749 111,583
2006-2011 Canadian data excludes Quebec as the Institut de la Statistique du Québec is no longer able to provide these figures.
Total Deaths and Cremations, CanadaProjections based on five years’ average increase compounded.
Canadian Totals 2001 2002 2003 2004 2005 2006 2007 2008 2009 2010 2011
Deaths 169,255 167,946 171,222 170,753 174,198 173,925 178,548 183,858 185,437 186,852 189,014
Cremations 79,919 80,733 86,063 88,892 93,455 99,594 99,086 103,471 106,526 108,749 111,583
2006-2011 Canadian data excludes Quebec as the Institut de la Statistique du Québec is no longer able to provide these figures.

10 CANA ANNUAL STATISTIC REPORT 2011
Total Cremations Carried Out in the United KingdomSource: Pharos International, the official journal of the Cremation Society of Great Britain, Volume 77, Issue 2: Summer 2011.
Year Operating Crematoria
New Crematoria Deaths** Cremations Percentage
1960 148 17 588,032 204,019 34.70
1970 206 2 638,834 353,957 55.41
1980 220 1 644,684 420,717 65.26
1990 225 0 629,629 438,066 69.58
1991 225 0 634,339 441,108 69.54
1992 226 1 622,410 437,000 70.21
1993 227 1 646,477 453,045 70.08
1994 228 1 616,719 434,223 70.41
1995 229 3* 649,635 445,574 68.59
1996 230 1 640,081 445,934 69.67
1997 234 4 633,635 446,305 70.44
1998 238 4 633,062 439,145 69.37
1999 240(1) 3 635,785 444,169 69.86
2000 242 2 611,960 437,609 71.51
2001 242 0 605,835 428,383 70.71
2002 242 1 609,943 437,124 71.67
2003 242 1 615,177 442,538 71.94
2004 242 1 588,753 424,835 72.16
2005 242 3 586,829 424,684 72.37
2006 250 2 576,211 416,881 72.35
2007 253 3 578,716 417,920 72.22
2008 253 0 583,754 422,853 72.44
2009 256 4 563,741 413,870 73.41
2010 260 4 565,624 413,780 73.15
2011 265 5 556,229+ 413,845 74.40+
* Includes replacement of existing crematorium.** Office for National Statistics. Crown copyright is reproduced with the permission of the
Controller of HMSO and the Queen’s Printer for Scotland.(1) Includes Arnos Vale which closed in 1998.+ Provisional figures as at 20th March 2012.
Current Versus Projected Deaths and Cremations in the United StatesThe graph below shows a comparison of the current year (2011) deaths and cremations to the 2016 projections. The 2011 provisional data was collected from the individual state agencies or estimated based on 2009-2010 state data and 2011 provisional death count from the CDC. The 2016 rates were calculated based on an average of the past five years’ growth rates compounded annually.
CANA’s Projections Versus Actual Deaths to Cremations Comparisons in the United States
Year% of U.S. Cremations
to Deaths# of U.S. Cremations
(in thousands)Projected Actual Difference Projected Actual Difference
1988 15.7% 15.3% -0.4% NA NA NA
1989 16.2% 16.4% +0.2% NA NA NA
1990 16.9% 17.0% +0.1% NA NA NA
1991 17.47% 18.50% +1.03% NA NA NA
1992 18.89% 19.11% +0.22% NA NA NA
1993 20.16% 19.78% -0.38% 438.5 448.5 +10.0
1994 20.79% 20.60% -0.19% 469.2 471.0 +1.8
1995 21.49% 21.14% -0.35% 496.8 488.3 -8.5
1996 21.78% 21.77% -0.01% 514.1 502.1 -12.0
1997 22.04% 23.13% +1.09% 520.9 533.8 +12.9
1998 23.75% 23.99% 0.24% 553.4 558.2 +4.8
1999 25.39% 24.81% -0.58% 595.6 599.7 +4.1
2000 25.56% 26.17% 0.61% 605.1 628.8 +23.7
2001 27.25% 27.01% -0.24% 651.2 652.8 +1.6
2002 27.78% 28.15% 0.37% 677.7 688.3 +10.6
2003 28.63% 29.53% 0.90% 693.7 723.7 +30.0
2004 29.61% 31.25% +1.64% 708.7 745.9 +37.2
2005 31.99% 32.13% 0.14% 778.0 790.5 +12.5
2006 33.53% 33.87% 0.34% 800.2 821.6 +21.4
2007 34.89% 34.60% -0.29% 842.5 838.6 -3.9
2008 36.02% 36.22% 0.20% 884.3 895.4 +11.1
2009 37.02% 38.15% +1.13% 901.4 931.7 +30.3
2010 40.62% 40.60% -.02% 998.5 998.8 +0.3
2011 42.10% NA NA 1036.4 NA NA
CANA ANNUAL STATISTIC REPORT 2011 11
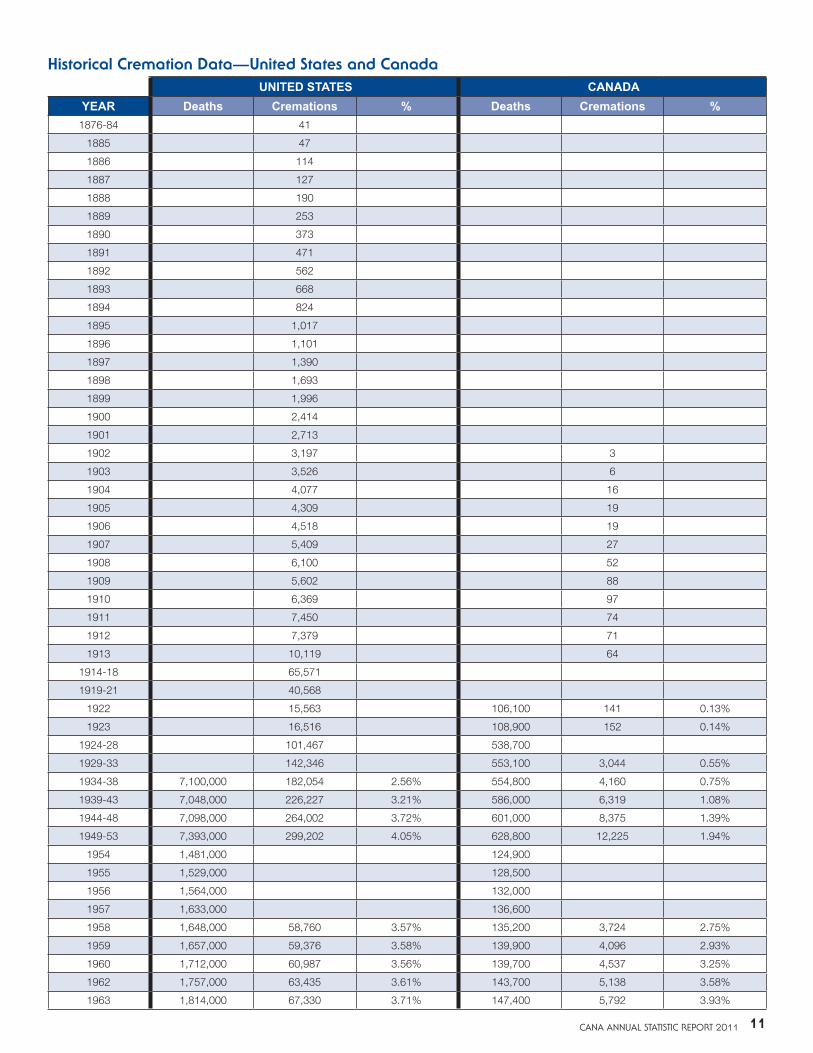
Historical Cremation Data—United States and CanadaUNITED STATES CANADA
YEAR Deaths Cremations % Deaths Cremations %1876-84 41
1885 47
1886 114
1887 127
1888 190
1889 253
1890 373
1891 471
1892 562
1893 668
1894 824
1895 1,017
1896 1,101
1897 1,390
1898 1,693
1899 1,996
1900 2,414
1901 2,713
1902 3,197 3
1903 3,526 6
1904 4,077 16
1905 4,309 19
1906 4,518 19
1907 5,409 27
1908 6,100 52
1909 5,602 88
1910 6,369 97
1911 7,450 74
1912 7,379 71
1913 10,119 64
1914-18 65,571
1919-21 40,568
1922 15,563 106,100 141 0.13%
1923 16,516 108,900 152 0.14%
1924-28 101,467 538,700
1929-33 142,346 553,100 3,044 0.55%
1934-38 7,100,000 182,054 2.56% 554,800 4,160 0.75%
1939-43 7,048,000 226,227 3.21% 586,000 6,319 1.08%
1944-48 7,098,000 264,002 3.72% 601,000 8,375 1.39%
1949-53 7,393,000 299,202 4.05% 628,800 12,225 1.94%
1954 1,481,000 124,900
1955 1,529,000 128,500
1956 1,564,000 132,000
1957 1,633,000 136,600
1958 1,648,000 58,760 3.57% 135,200 3,724 2.75%
1959 1,657,000 59,376 3.58% 139,900 4,096 2.93%
1960 1,712,000 60,987 3.56% 139,700 4,537 3.25%
1962 1,757,000 63,435 3.61% 143,700 5,138 3.58%
1963 1,814,000 67,330 3.71% 147,400 5,792 3.93%

12 CANA ANNUAL STATISTIC REPORT 2011
UNITED STATES CANADAYEAR Deaths Cremations % Deaths Cremations %1964 1,798,000 67,658 3.76% 145,900 6,382 4.37%
1965 1,828,000 70,796 3.87% 148,900 6,906 4.64%
1966 1,863,000 73,339 3.94% 149,900 7,388 4.93%
1967 1,851,000 77,375 4.18% 150,300 7,991 5.32%
1968 1,930,000 83,977 4.35% 153,200 8,081 5.27%
1969 1,922,000 85,683 4.46% 154,500 8,408 5.44%
1970 1,921,000 88,096 4.59% 156,000 9,188 5.89%
1971 1,928,000 92,251 4.78% 157,300 9,406 5.98%
1972 1,964,000 97,067 4.94% 162,400 11,717 7.21%
1973 1,973,000 112,298 5.69% 164,000 15,880 9.68%
1974 1,934,400 119,480 6.18% 166,800 17,415 10.44%
1975 1,892,900 123,918 6.55% 167,400 20,694 12.36%
1976 1,910,900 140,052 7.33% 171,000 22,615 13.23%
1977 1,902,100 145,733 7.66% 167,500 24,713 14.75%
1978 1,924,100 163,260 8.49% 171,000 28,456 16.64%
1979 1,905,000 179,393 9.42% 170,600 30,274 17.75%
1980 1,989,841 193,343 9.72% 172,000 32,423 18.85%
1981 1,977,981 217,770 11.01% 173,000 34,884 20.16%
1982 1,974,797 232,789 11.79% 183,700 37,222 20.26%
1983 2,019,201 249,182 12.34% 184,000 41,887 22.76%
1984 2,039,369 266,441 13.06% 185,500 44,630 24.06%
1985 2,086,440 289,091 13.86% 190,500 49,216 25.84%
1986 2,105,361 300,587 14.28% 195,000 54,482 27.94%
1987 2,123,323 323,371 15.23% 197,000 53,867 27.34%
1988 2,167,999 332,183 15.32% 186,600 57,568 30.85%
1989 2,150,466 352,370 16.39% 195,500 60,087 30.74%
1990 2,148,463 367,975 17.13% 193,000 62,797 32.54%
1991 2,169,518 400,465 18.46% 195,000 66,087 33.89%
1992 2,175,613 415,966 19.12% 185,211 64,557 34.86%
1993 2,268,553 448,532 19.77% 193,557 70,017 36.17%
1994 2,278,994 470,915 20.66% 195,331 75,489 38.65%
1995 2,312,132 488,224 21.11% 210,545 79,206 37.62%
1996 2,306,470 502,120 21.77% 207,772 81,960 39.45%
1997 2,308,077 533,773 23.13% 209,395 85,196 40.69%
1998 2,327,411 558,238 23.99% 213,004 90,200 42.35%
1999 2,417,619 599,691 24.81% 219,836 101,454 46.15%
2000 2,401,062 628,807 26.19% 223,789 106,756 47.70%
2001 2,415,487 652,826 27.03% 223,580 110,327 49.35%
2002 2,441,044 688,299 28.20% 223,603 115,026 51.44%
2003 2,445,069 723,686 29.60% 226,181 119,021 52.62%
2004 2,395,680 745,875 31.13% 226,408 121,597 53.71%
2005 2,442,940 790,548 32.36% 230,008 132,469 57.59%
20061 2,429,578 821,592 33.82% 173,925 99,594 57.26%
20071 2,426,126 838,628 34.57% 178,548 99,086 55.50%
20081 2,471,877 895,370 36.22% 183,858 103,471 56.28%
20091 2,437,986 931,722 38.22% 185,437 106,526 57.45%
20101 2,460,767 998,799 40.59% 186,852 108,749 58.20%
20111 2,472,208 1,044,066 42.23% 189,014 111,582 59.03%1 2006-2011 Canadian data excludes Quebec as the The Institut de la Statistique du Québec is no longer able to provide these figures.

CANA ANNUAL STATISTIC REPORT 2011 13
Related Documents