FINAL REPORT Incident Cost Analysis and Modeling Project I-CAMP II 0 0 0 0 0 0 0 0 A Report to the USENIX Association 1

Welcome message from author
This document is posted to help you gain knowledge. Please leave a comment to let me know what you think about it! Share it to your friends and learn new things together.
Transcript

FINAL REPORT Incident Cost Analysis and Modeling Project I-CAMP II 0 0 0 0 0 0 0 0
A Report to the USENIX Association
1

Project Staff Virginia Rezmierski, Ph.D. Project Director Director, CIO's Office of Policy Development and Education The University of Michigan Adriana Carroll, M.P.P. Project Coordinator and Research Associate Gerald Ford School of Public Policy The University of Michigan Jamie Hine, B.A. Research Associate Gerald Ford School of Public Policy The University of Michigan We are thankful for and acknowledge here the valuable part-time assistance of Todd Lee, M.P.P. and Jason Weller, M.P.P., during data gathering and project design phases of this project.
Project Advisory Board Robert Charette George Cubberly Chief Executive Office Assistant Risk Manager Risk Management Consultant Office of Associate V. P. for Finance ITABHI Corporation Department of Risk Management The University of Michigan Kathy Kimball, M. S. Eugene Spafford, PhD Security Director Professor of Computer Sciences Computer Information Systems Director, CERIAS Project Pennsylvania State University Laboratory Purdue University Dennis Steinauer Larry Stephens, AIC, EPCU, ARM Computer Security Division Director of Risk Management National Institute for Standards and Department of Risk Management Technology Indiana University
2

Acknowledgments First and foremost, we are thankful to the USENIX Association for their vision and interest in understanding the impact, type, frequency, and cost of IT related incidents in college and university settings. Without their interest, support, and the project funding this work could not have been accomplished. USENIX is the Advanced Computing Systems Association. Since 1975 the USENIX Association has brought together the community of engineers, system administrators, scientists, and technicians working on the cutting edge of the computing world. The USENIX Association and its members are dedicated to: problem-solving with a practical bias, fostering innovation and research that works, communicating rapidly the results of both research and innovation, and providing a neutral forum for the exercise of critical thought and the airing of technical issues. USENIX supports its members' professional and technical development through a variety of on-going activities: Annual technical and system administration conferences, a highly regarded tutorial program, SAGE, a special technical group for system administrators, student programs, and awards programs. Special thanks also go to the members of our Project Advisory Board for I-CAMP II. We thank them for their attendance at I-CAMP II Board Meetings in light of their demanding travel and work responsibilities. Most importantly we thank them for their critical thinking and input to the project. They were not hesitant to make suggestions, to criticize ideas or procedures, or to make themselves available to us when questions arose. Their guidance kept the research team moving forward. We also thank each of the study's participating schools and their personnel who gave of their time and expertise. Instead of cautiously hiding incident data and refusing to openly discuss problems in data collection, these people were sincerely and professionally interested in trying to understand and improve IT-related incident handling on campuses. Special thanks go to Robert Bartlett, Andrea Basing, Mark Bruhn, David Brumley, Katrina Cook, Jacqueline Craig, Jane Drews, Bob Foertsch, Helen Green, Clair Goldsmith, Steve Griese, Stephen Hansen, Susan Levy Haskell, Margie Hodges Shaw, Kathy Kimball, Jim Knox, Doug Nelson, Rodney Peterson, Chris Pruess, Steve Romig, Roger Safian, Jeffrey Savoy, Sara Staebler, Kevin Unrue, Elaine Ward, and Ed Zawacki. Finally, special gratitude goes to the staff of the Office of Policy Development and Education at The University of Michigan for their continued input and support to this project. Thanks go especially to our editor, Kathleen Young for her help with the final report, to David Nesom and Jon Leonard for technical advice, and to our Office Assistant Joyce Ruppert for her support and scheduling of Advisory Board meetings. The original I-CAMP report was funded by the Chief Information Officers of the Committee on Institutional Cooperation (CIC). That report, describes and analyzes thirty technology-related incidents occurring on university campuses and provides discussion of factors that seem to affect both cost and occurrence of the incidents. It is available through the CIC representative by sending e-mail to [email protected].
3

TABLE OF CONTENTS TABLE OF CONTENTS 4 EXECUTIVE SUMMARY 7 PREFACE 8 INTRODUCTION 9 The Problem 9 Personnel Skills and Knowledge 9 Unfavorable Trends 9 Time and Skill Required 9 Management Implications 10 I-CAMP STUDY OVERVIEW 10 PURPOSE OF THE I-CAMP II STUDY 11 I-CAMP II METHODOLOGY 11 FIGURE I - ICAMP II PROJECT OVERVIEW 13 EXPANDING STUDY PARTICIPATION 14 PART I -COST ANALYSIS SECTION 15 Purpose 15 Expanding the Sample of Incidents 15 Table I - INCIDENT CATEGORIES TO BE COST ANALYZED 16 Providing Comparison Data 16 Procedure for Incident Identification 16 Procedure for Incident Cost Analysis 16 Assumptions 17 I-CAMP II Methodology for Calculating User-Side Costs 19 Refining and Increasing the Robustness of the Cost Analysis Model 19 Methodologies for calculating User-Side Costs 20 Table II - CALCULATIONS FOR WILLINGNESS TO PAY OF ONE HOUR OF STUDY 22 FIGURE 2 - WILLINGNESS TO PAY AND OPPORTUNITY COST 22 Method of calculation 23
4

Table III - Summary of Results from the Incident Cost Analysis 24 Recommendations Regarding Cost Analyzing IT-Incidents in Academic Environments25 Questionnaire Template 25 Calculation Template 25 Machine cost 25 Reports 25 Part II - FREQUENCY SECTION 26 Database Analysis and Categorizations 26 Designing a Methodology and Gathering Frequency Data 26 Availability of Databases 26 Aggregated Data 26 Problems in Data Collection 27 Summarization of Interview Results 27 FIGURE 3 -DATABASE CREATOR ROLE AND PURPOSE 29 Status of School Categorizations 30 Fairness and Justice in Incident Handling 30 Similarities in Incident Categories 30 Factors Appear Again-Lack of Knowledge/Information, Lack of Resources 31 Frequencies from Database Schools 31 Frequencies from Expert Estimates 32 Who Were the Experts? 32 Methodology for Expert Estimates 32 TABLE IV -A, B, C - EXPERT ESTIMATES - MAIL BOMBS 34 TABLE V - A, B, C - EXPERT ESTIMATES - SYSTEM PROBES 37 TABLE VI - A, B, C - EXPERTS ESTIMATES - WAREZ SITES 40 Results of Expert Estimates 43 Towards a Comprehensive Categorization Scheme 43 Literature Review 43 I-CAMP II Recommended Categorization Scheme 43 FIGURE 4 - INTERFACE OF USERS, DATA AND OPERATING SYSTEMS IN THE ACADEMIC ENVIRONMENT 45 FIGURE 5 - I-CAMP II CATEGORIZATION SCHEME 47 SUMMARY AND CONCLUSIONS 48
5
FINAL RECOMMENDATIONS 51 APPENDIXES A: QUESTIONNAIRE TEMPLATE B: CONVENTIONS FOR COST VARIABLES C: I-CAMP II INCIDENTS D: QUESTION TEMPLATE E: CATEGORIES AND INCIDENT TYPES USED BY DATABASE SCHOOLS F: INCIDENT FREQUENCY COUNT G: GLOSSARY
6

EXECUTIVE SUMMARY Information technology related incidents are occurring on college and university campuses. Some threaten the reliability or integrity of systems or data, operations, reputation, or resources and constitute a risk. To manage these risks senior managers need data to measure potential costs. The I-CAMP II study was designed to provide incident data. The study, funded by the USENIX Association, had two major objectives. The first was to refine the costing model for calculating user costs for IT incidents. I-CAMP I showed that it was easy to calculate worker costs in IT-incidents. The number of hours - needed to resolve the incident was multiplied by the employee's hourly wage. When users are disrupted in using networks or other IT-resources, on which they are increasingly dependent, real costs also exist. This study improved the model for calculating user-side costs. The study confirmed the usefulness of a common template for gathering data on IT-related incidents and for guiding the cost analysis process. It expanded the number and the geographical representation of participating schools in the study to eighteen. It expanded the collection of cost-analyzed incidents by 15 including incidents of compromised access, harmful code, denial-of-service, hacker attacks, and copyright violations. For the 15 incidents, 90 employees were involved, 506 hours were devoted to resolution, and $59,000 in cost, was incurred. The assumption that, though their frequency might be high, the costs of resolving these selected types of incidents would be low, was generally confirmed. The average cost for incidents of access compromise was $1,800, for harmful code was $980, for denial of service was $22,350, for hacker attacks was $2,100, and for copyright violations was $340. The second major objective of the I-CAMP II study was to investigate the availability of incident frequency data and the incident categorization schemes. The study found that only 38% of the participating schools had incident databases. After analysis, the team concluded that colleges and universities are not currently equipped to understand the types of IT-related incidents that are occurring on their campuses. They are not currently able to identify the number or type of incidents or assess the level of organizational impact caused by IT-incidents because of the lack of robust database tools and insufficient staffing. The study team analyzed the currently existing diverse incident categorization schemes. The category schemes reflected the specific roles of their creators, the individual institutional cultures, and organizational needs. Therefore, the frequency counts recorded in these disparate systems could not be statistically compared and aggregated across schools. The team gathered expert estimates of the annual number of occurrences of mail bombs, system probes, and Warez sites. It concluded that expert estimates of incidents logged and handled annually were very similar to actual frequency counts for those same type incidents when compared to data from school databases. It concluded that school size did not appear to affect the level of expert estimates for any of the three types of incidents. They found that, in general, experts as a group, believe they are identifying and handling only about 28% of mailbombs occurring campus-wide-an average of 15 incidents per year, 12% of system probes-an average of 565 per year, and 28% of Warez sites-an average of 15 per year. The study report provides nine specific recommendations for future study and practice. It provides a model for a comprehensive categorization system encompassing both operating system vulnerabilities and interpersonal and policy violations.
7

PREFACE This final project report has two major parts; Part I covers Cost Analysis and Part II covers Frequency Analysis. In Part I we describe the problem of information technology incidents on campuses, and provide highlights from the initial Incident and Cost Analysis and Modeling Project (I-CAMP I) study. In the section of Part I, entitled Cost Analysis, we provide the new methodology for calculating user-side costs, analysis of fifteen new and specifically selected IT-related incidents and a guideline for cost analyzing IT-incidents in the academic environment. In Part II of the report we describes the investigation of incident frequencies, the state of existing incident databases, the results of expert frequency estimates, and provide a categorization scheme to assist administrators. The report concludes with a set of recommended best practices. The appendices of this report also provide valuable information. They include, among other information, the actual descriptions and analyses of incidents, the categories currently used by seven of the schools that have incident databases, and an explanation of the cost conventions used in this study.
8

INTRODUCTION Information technology related incidents are occurring on college and university campuses. Incidents that threaten the reliability or integrity of systems or data, can constitute risks for the organization, risks to its operations, its reputation, its resources, and effect the trust that members of its community have in the organization. To manage these risks senior managers need to understand them, have sufficient data to measure their potential costs, and make informed management decisions. The I-CAMP 11 study is designed to help provide data regarding such information technology related incidents. The Problem The implementation and rapid evolution of information technology (IT) resources at colleges and universities have increased the number of security and risk management issues for institutions of higher education. Physical and electronic security processes, common to the mainframe environment, are often not suitable in the more distributed computing environment that exists today. Personnel Skills and Knowledge Individuals who handle these distributed services as system administrators have differing levels of sophistication regarding the technology, laws, and ethics governing data security. To guarantee a viable computing environment, colleges and universities are becoming aware that they must provide education and training for the system administrators who manage the environment. They must also ensure increased community awareness of key features of data protection and security, hardware maintenance, software compatibility, disaster planning and recovery, and basic security standards for configuring personal computing devices. Finally, they must take steps to ensure that administrators and senior management understand the legal, fiscal, and ethical implications of physical theft, infrastructure failure, and employee incompetence or inexperience and receive sufficient on-going data to manage responsibly the associated risks within these technology dependent and networked environments. Unfavorable Trends Recent news regarding denial-of-service attacks aimed at Internet sites and unauthorized access and modification of data at major government and commercial sites has raised awareness of potential security threats. Additional information from a recently completed Computer Security Institute survey showed that "90% of respondents (primarily large corporations and government agencies) had detected computer security breaches; 75% reported a variety of serious security breaches such as theft of proprietary information, financial fraud, system penetration from outsiders, denial of service attacks and so on; and 74% acknowledged financial losses due to computer breaches." ' This information is just beginning to cause the administrators within most organizations, profit or non-profit, to devote sufficient fiscal and human resources to security. Time and Skill Required Increased dependency on networks and technology brings with it a growing demand for the availability and reliability of information technology systems. Administrators realize that both time and skill are needed to keep systems and networks operating. "Availability" and "Reliability,"' concepts that have long been recognized as key components of security by security professionals, auditors, and risk managers are now being recognized by students, staff, and faculty as requiring resource commitment, and the time and attention of system administrators.
9

Time and skill are required to address known vulnerabilities in operating system and in various applications-to patch known operating system holes. Time and skill are also required to maintain a current and appropriate level of security knowledge. In the fast-changing technology environment, system administrators can not rely on the information they obtained even one year ago to do their current jobs with sufficient competency. The time of systems administrators is also required to provide security education to users and to set standards for ethical, legal, and appropriate use of resources. Time and skill are needed to detect those vulnerabilities that are not readily obvious, to thoroughly understand who is accessing systems and data and whether they have authority to do so. This requires that system administrators gather systems log data, analyze existing patterns, and monitor access and use of resources. These important activities contribute valuable data to address the concerns of auditors, risk managers, and security professionals-data regarding the processes of identification, authentication, and authorization. Without robustness in these three features of security-"Identification", "Authentication", and "'Authorization"- and without knowledge of who is accessing and using networks and systems, no resources or data can be secure. Management Implications Risk managers within organizations are finding it difficult to learn about the capabilities of technology at a pace fast enough to understand the implications of new and emerging applications. Risk managers, accustomed to thinking in terms of risks against which the organization can insure, find themselves behind innovation in the area of information technology. IT incidents involving risk, liability, and even significant financial loss are difficult to comprehend unless they are related to physical losses such as fire, flood, or theft-the more commonly known risks for management. Only recently have the large insurance companies begun to recognize that risks and losses within university information technology and networking areas may also require protection and insurance. Like system administrators, risk managers find it difficult to convince senior management of the need for more attention to the management of IT risks and of the importance of systems security. Often it takes a major incident before sufficient attention is paid to security. The absence of data, the press of conflicting demands for fiscal resources, and an environment of rapid technological change can combine to create a climate in which administrators prefer not to hear about-more problems. As a result, a tendency can develop to underestimate the frequency with which incidents occur or to consider individual incident costs as insignificant when compared with the institution's overall expenses. Such an approach, however, leaves an organization open to the possibility of serious financial liability. A single incident may cost only $2,000. If, however, that type of incident is repeated 60 times per month, then the costs to the organization are significantly increased to $120,000 per month or $1,440,000 per year-an amount that would be considered far from insignificant when compared with any institution's overall expenses. Determining the multiplier for specific types of information technology incidents requires data. We need to know about the nature of information technology incidents, about their different types, about the costs associated with each of the different types, and ultimately about the frequency of occurrence on each campus. Do these data exist?
I-CAMP STUDY OVERVIEW In 1997, the first "Incident Cost Analysis and Modeling Project," I-CAMP, was funded by the Chief Information Officers of the CIC (Committee for Institutional Cooperation/Big 10) Universities. The objective of the study was to design a cost analysis model for IT-related incidents and to gather and analyze a sample of such incidents.
10

University of Michigan staff and graduate students developed the model. They gained access to information about such incidents through partnership with security professionals at each of the 13 CIC campuses. They also described the incidents and provided detailed cost analysis information about 30 such incidents. No particular incident type was sought for this study. Rather, it was the goal to establish a mechanism for gathering information about any IT-related incidents occurring on the campuses and to collect cost data for the analysis. The study began identifying factors that appear to influence the occurrence of IT incidents and those that appear to affect the cost of incidents once they occur. For purposes of the first study, and extended to the present study (I-CAMP II), "incident" was defined as:
"Any event that takes place through, on, or constituting information technology resources requiring a staff member or administrator to investigate and/or take action to reestablish, maintain, or protect the resources, services, or data of the community or of its individual members."
In summary, the first I-CAMP study examined 30 IT-related incidents and researchers found that:
• 210 employees were involved in incident investigation/resolution,
• 9,078 employee hours were devoted to incident investigation/ resolution
• 270,805 computer /network users were affected by the incidents, and,
• Calculated costs for the 30 incidents exceeded $1,000,000. Although a model had been developed and beginning data regarding the cost of IT-related incidents was made available through the I-CAMP I study, it was important to refine the cost analysis model, analyze additional incidents to ensure the usefulness of the model, and begin to collect data regarding incident frequencies to allow managers to evaluate organizational risks and costs. A second study was undertaken. This report, parts I and II, describe the work of this second study, ICAMP II.
PURPOSE OF THE I-CAMP II STUDY The purpose of the study is threefold: First the study provides guidelines to cost analyze IT-incidents in the academic environment. Through the use of a template, IT personnel are able to identify true costs and follow a guide in analyzing them. This template is used to guide an interview process for the gathering of cost information in each incident. Second, the study analyzes the status of the databases of the participating institutions and their categorization schemes for classifying incidents. It also begins the examination of the frequencies of occurrence for specific types of incidents in three different periods of time (periods of high, medium, and low academic activity.) Finally, the study provides a categorization scheme as a guide to encourage more incident data gathering and to encourage consistency in the classification process.
I-CAMP II METHODOLOGY The I-CAMP II study, and this report, have two major parts as represented in Figure 1. (In this figure the circles rep resent data gathering efforts and the rectangles represent output from project activities.) Part I, the Cost
11

Analysis section, provides information about the gathering of 15 IT-incidents from the total participant pool-incidents of service interruption and copyright violation. The specific objectives for this section of the project were to increase the robustness of the cost-analysis model, to enhance the collection of IT-incidents, and to confirm the variables and factors that affect the cost and resolution of incidents. Part II, the Frequency Analysis section, provides information from a subset of the total participant pool-those schools with incident databases. In this section of the project, data were gathered in three time periods, April, July, and October. To meet the objectives of: understanding database conditions and categorization schemes, and gaining knowledge of the frequencies for particular types of incidents, the project team completed in-depth interviews with participants and gathered expert estimates of incident occurrences from each of the campuses. As a result of this section, the study then developed and proposed a new categorization scheme for IT-related incidents within academic environments.
12

FIGURE 1 - ICAMP II PROJECT OVERVIEW
13
EXPANDING STUDY PARTICIPATION In the initial I-CAMP study, existing expertise and cooperation from each of the participating campuses facilitated the study. These partners consisted primarily of the security and policy officers /professionals of the CIC schools. One of the problems that has existed in the past, as individuals have tried to understand the occurrence of IT-related incidents in profit and non-profit organizations, has been an unwillingness on the part of key personnel to share incident information. Their fear is that such incidents may reflect poorly either on the personnel within the organization or on the organizations themselves. In for-profit organizations, such incidents could have direct effects on a customer's trust and therefore on the profitability of the company. In all organizations where prestige and reputation is important, loss of trust can negatively impact the organization's success. Therefore, incident data historically has been difficult to obtain and study. Through the CIC partnerships, this was not the case for the I-CAMP study. For I-CAMP II, we sought to retain the same partners as in the initial study. However, we determined that expanding the pool would be beneficial. This would provide more representative data by providing input from schools with different populations and experiences than the CIC schools. It would potentially increase the dissemination of results and increase the overall investment in the process of incident data analysis. We decided to include large West Coast, East Coast, and central states universities-universities that have had a history of information technology development and use. The same CIC universities as in the initial I-CAMP study were encouraged, and agreed, to participate. These included:
• Indiana University, • Michigan State University, • Northwestern University, • The Ohio State University, • The Pennsylvania State University, • Purdue University, • The University of Chicago, • University of Illinois at Chicago, • University of Illinois at Urbana-Champaign, • The University of Iowa • The University of Michigan-Ann Arbor, • University of Minnesota, • The University of Wisconsin-Madison.
Participation was expanded to include: • Stanford University, • The University of California, Berkeley, • Cornell University, • The University of Maryland, and, • The University of Texas at Austin.
14

PART I -COST ANALYSIS SECTION Purpose The I-CAMP II study was designed to provide system administrators and others with additional information about which IT-related risks are of highest priority to address, about factors relating to their occurrence and costs, and about how best to manage certain risks. The USENIX Association funded the study. The I-CAMP II study first sought to improve the methodology for cost-analyzing IT-related incidents. We wanted to learn more about particular types of incidents that were not included in the first study. We also wanted to create a classification scheme for incidents-a scheme that would help system administrators and others understand how to manage these incidents more effectively. Finally, we wanted to see if it was possible to gather frequency data regarding incident occurrences on campuses. Expanding the Sample of Incidents The first goal for I-CAMP II, noted above, was to enhance the existing model. The best way to determine which factors affect the cost and occurrence of incidents was to expand the sample of same-type incidents. The study team examined the original I-CAMP incidents and discussed the need for more data with IT security personnel from each of the participating schools. We determined that if IT-related incidents were put into two categories-those that were the result of purposeful acts and those that were the result of unwitting acts or accidents--it was the first category about which security professionals were most concerned. Systems security personnel indicated that they needed more data regarding the costs of service interrupts and copyright violations. They believed that while these incidents may be small in cost, these incidents are occurring with high and growing frequency on campuses. The aggregate costs of these types of incidents may be significant. Project staff continued also to be interested in data and identity theft. However, little information is currently available regarding such incidents. While it appears that a combination of data stewards, such as university registrars or directors of personnel, and law enforcement/campus safety personnel, are in the best position to learn about incidents of this type, it also appears that incidents of this type are only starting to be recognized on college and university campuses. Because of the paucity of information, I-CAMP II did not include this type of incident in the study. The I-CAMP II study gathered and cost analyzed data regarding Purposeful/ Malicious behaviors of two types: 1) Service Interruptions- specifically, compromised access, insertion of harmful code, and denial of service, and 2) Copyright Violations- specifically, distribution of MP3 and Warez distribution of illegal software. The study goal was to augment the first sample of incidents (N=30) by adding the analysis of a small sample of these specific type incidents (N=15). (15 of these were analyzed and appear in Appendix C of this report). The incident categories collected in I-CAMP II appear in Table I.
15

Providing Comparison Data The current study sought to "gather more same-type incidents to facilitate analysis and comparisons and refine the cost analysis model." It was determined that within the scope and time allowed for this study it would not be possible to gather a large enough number of same-type incidents to provide a statistically significant sample (40-50) for comparisons. The project Advisory Board recommended that instead, we narrow the study--collect and analyze three of each type of the targeted incidents if possible. Three same-type incidents would allow the project team to begin comparing costs and actions that were necessary to resolve the incidents. Two or more of each of the specific incident types shown in Table I were collected. Procedure for Incident Identification The system administrators of the participating schools identified incidents. As in the initial study, a specific process was used to gain access to campus information. Authorization came directly from campus Chief Information Officers (CIO's) who identified the key staff members from whom data should initially be sought and who relayed those names to the study team. Participating personnel in each of the 18 universities were then asked to identify incidents of service interrupt and copyright violations. Specifically, they were asked to inform the I-CAMP II team of access compromises, insertion of harmful code such as NetBus, Back Orifice, and others, denial of service attacks such as mail bombs, ping attacks, smurf attacks and others, and incidents involving distribution of MP3 and Warez. (See Glossary for definition of terms.) Procedure for Incident Cost Analysis Once an incident was identified, data gathering was accomplished in person through a visit to the campus, or by telephone call using a questionnaire template (see Appendix A). Often an incident required follow-up activities
16

to clarify particular aspects of the event, gather a piece of needed data, or ask a question when some aspect of the event was omitted. Additional details were exchanged using electronic mail or file transfer. (The standard template for cost analyzing IT-incidents appears in Appendix A.) Assumptions This section of the report details the assumptions and methods used in gathering data and the manner in which cost variables were treated. This information should be used as a guide for understanding the subsequent incident analyses. (Refer to Appendix B for a detailed description of the conventions used in calculating costs.)
Assumption I - Truthful Information We assumed that the information that we received from the people directly involved in an incident was truthful to the best of their knowledge. Other than an occasional log of employee actions, we depended primarily on the person's best recollection of events. We attempted to gather data as close to the incident's occurrence as possible to minimize data loss due to memory lapses. While some measure of error exists when recalling past events, we have no grounds for disputing the information conveyed. If an incident was too old to gather valid data, it was not included in the study. All incident data collected were subjected to a final review by the provider of the data prior to inclusion in this report.
Assumption 2 - Appropriate Data Suppliers We assumed that the individuals identified to provide data about incidents were appropriate and valuable for the purposes of this study. Within each participating school, others who had some involvement with a particular incident were identified to us for purposes of more complete data gathering. We recognized, however, that as a result of their association with the information technology organizations of these colleges and universities, they would identify incidents of one type more often than might individuals in non-technology departments.
Assumption 3 - User-Side Costs Regarding the costs on the user side of the equation, we assumed that:
a) The tuition fee is the basis for the calculation using this methodology. This fee includes all the academic resources that the university offers to the student: libraries, professors, rooms, places to study, networked services, computer rooms, restrooms, etc. It is too difficult to separate which part of the overall fee corresponds to the particular service offered. b) For each credit hour, the student incurs three "study hours." The total number of study hours includes class time plus required preparation. For example, a 3- course entails 3 hours in the classroom plus 9 hours of additional study and hence, a total of 12 hours of study per week. Note: This calculation, three times the number of in-class hours for each credit is an accepted standard device for estimating preparation time in most universities. c) The fee/ student cost used for calculations depends on the number of in-state and out-of-state students in a particular university. From these numbers we can calculate an average student cost. To illustrate this ideal, we took the weighted student cost for a semester for one of the participating schools and we calculated, $17,802.00. d) It is "virtually impossible to speak to every affected user to determine her or his real loss in dollars. We expect that when the network manager is learning about the resolution of an incident, she or he can ask the users involved questions about how much time the user lost as a result of the IT-incident. Alternatively, the network engineer can estimate the traffic of users connected to the computer network at a specific period of time. These estimations can help to identify (either by increasing or decreasing) the number of users affected when there is
17
an incident that affects the entire community (e.g., a probe that results in a massive denial-of-service for members of the campus.) We do not estimate any loss of hours due to an IT-incident. The following methodology (see "I-CAMP II Methodology for Calculating User-Side Costs") for the user side is based on the concept of the willingness to pay and the individual opportunity cost. Both methodologies will be used in instances where the user cannot perform an alternative activity; e.g., if the paper that the student was writing was stored on a hard drive that is compromised and cannot be obtained to be turned in on time. When quantifying an incident, we do so from a university's perspective. However, we made the assumption that the term "university" implies the entire community of students, faculty, and staff. (Some feel that if the cost of an incident is not a direct cost to a university department it is not a cost to the university. This is not the position taken here.) Thus, costs borne by students, for example, from the inability to complete work as a result of a server crash, are considered a real cost to the university and estimated for reporting even though the university may not directly pay out resources. Generally, any quantifiable cost borne by any member of the community as a result of an incident, if we are able to estimate it reasonably, is included in our calculations. Otherwise, the real costs and their implications are described qualitatively in the incident report. There were those who, when reading the first I-CAMP study results, commented that costs associated with system administrators who repair computers or networks as a result of unauthorized intrusions, for example, should not be included because they were already assumed as part of their salaries and their expected work. We might assume that if a system administrator spent all of his/her time managing IT-related incidents, there would be a real cost to the institution. The system administrator would be totally unavailable to perform the other duties associated with their position such as configuring machines, trouble-shooting network and system problems, supporting users, and so on. Likewise, we might assume that if no one spent time and effort dealing with the IT-related incidents that are occurring, there would be a real cost to the institution through unmanaged risk, and potential liability. Depending on the frequency and impact of the incident and between total and no response lies the real cost to the institution. For purpose of this study, we assumed that employee effort to detect and manage IT-related incidents should be considered a real cost to the institution, and therefore be included in the analysis. In I-CAMP I, user costs for faculty and staff were calculated on an hourly basis from their stated salaries. In that study, student costs, where the number of students affected by an incident was known, were calculated according to an average part-time wage commensurate with undergraduate employment wages and graduate employment wages. It was assumed that students would have been working if they had not been interrupted by the downtime caused by the incident.
Assumption 4 - Limiting Incident Scope For the purposes of this study, we concluded our cost analysis when the network, system, LAN, PC, or other environment was returned to its pre-incident condition. The decision of when to close the quantification of an incident is debatable and, in some sense, arbitrary. Often it involves a judgment in terms of natural closure-that is, a judgment of when the incident really ended. In general, we attempted to capture the essence of an incident without carrying it out too far. Therefore, if a security audit or review was stimulated by the event and was performed after the problem had been resolved or the hole closed, it was not included in the cost analysis. For the purposes of this study, we did not consider these additional events and their concomitant costs to be directly related to the cost analysis of the incident.
18

Assumption 5 - Common Costs Excluded There are specific variables common to all incidents that we did not attempt to quantify unless they presented themselves as inordinately large in proportion to and specifically related to the overall incident. Generally, these variables did not provide any clearer sense of the situation, but would have required a significant commitment to data gathering. Included in this category are office supply costs (such as paper and pens), telephone bills, and costs of secretarial support to the individuals involved.
Assumption 6 - Study Team Cost Excluded We did not include the time spent by the researchers of this project as part of the overall costs to a university. Under normal circumstances, an incident would not include an investigation by a separate party; thus, we did not want to skew the results of an incident analysis by including the commitment of the project team. I-CAMP II Methodology for Calculating User-Side Costs Refining and Increasing the Robustness of the Cost Analysis Model We felt that it was important to focus a fair amount of attention to refining this part of the cost analysis model because students and their time, as well as faculty and staff, are the users of these information technology systems. Students are the customers of colleges and universities. Even though their losses in productivity do not reflect directly on the budget expenditures of the organization, such losses reflect on and affect perceptions of the value of the educational experience at a college or university, and the satisfaction of the students -therefore its reputation. In calculating the costs of an IT-related incident, there are actual costs related to actions that need to be taken to manage the incident and return the environment to its original state. These actions may include incident investigation, patching identified vulnerabilities, repairing or replacing systems or applications, managing publicity, supporting and informing users, and so on. There are also costs related to the effects of the incident on users. The original I-CAMP model underscored the difficulty in estimating the costs to users when an IT-related incident occurs. The authors of the first report specifically identified three areas of difficulty:
"First, it is virtually impossible to speak to every affected user to determine his or her real loss in dollars. Second, we cannot say for certain what the user's time is worth. Wage rates are traditional measures of a person's time, but it is difficult to put a number on, for instance, a student who is not employed. Third, opportunity costs are always involved. If a person cannot retrieve needed information from the network, he or she may be able to do some alternative activity that provides some utility. Measuring the difference between the real loss and gain in utility from an alternative activity is a difficult task at best.,, 2
A revised model for calculating the student user-side costs was developed for the ICAMP II project. This model is based on -the theory of willingness to pay as an approach to the concept of an allied market. It provides what we consider to be an improved methodology for calculating the user cost of IT-related incidents. Although the cost of the user side is not a direct cost for the university, it will have an important relevance when it is included as a shadow price. The I-CAMP II team learned that there is no single methodology for cost analyzing the user side of an incident. Cost varies according to the type of incident. The two incident types we gathered for I-CAMP II (service interruptions and copyright violations) have two potentially different cost approximations: a) the marginal cost
19
to access the network, and b) the willingness to pay for one hour of study. These different cost approximations-this methodology for examining costs-is based on the work of economist Edward Gramlich's concept of allied markets. He states:
"... Many times in a benefit-cost study there will be changes in quantities for which there is no market...' Further, "...the simplest answer is to -try to find some allied market where the price or quantity change can be used to infer valuations for the missing market". " Methodologies for calculating User-Side Costs
Marginal cost to access the network If an IT-incident denies access to a university's network, the user could pay for a connection to another service provider. In such cases, our proposed methodology uses the marginal average cost of the connection to another server times the hours the user spent connected to it (or, when appropriate, the fixed cost). The marginal average cost of the connection to another server can be obtained from Internet Service Providers. It is the simple average cost of one hour of connection time.
Willingness to pay for one hour of study If the user loses worktime because he or she cannot access the hard drive of the computer that has been compromised or shut down, the cost analysis methodology depends on the type of user. If the user is a professor or a staff member, the analysis technique will be the individual opportunity cost, approximated by using the hourly wage rate. If, on the other hand, the user is a student, the methodology is the willingness to pay for one hour of study. Based on the concept of allied markets, the methodology of willingness to pay can be used to derive missing values that previously were roughly estimated. The willingness to pay is a good alternative methodology. As shown in Figure 2, we derive marginal income from the consumer demand curve. It is interpreted as the willingness to pay where consumers, at quantity Q, are willing to pay just P for the last unit of product, but no more. Thus, the price that consumers are willing to pay exactly equals the marginal utility for the good they receive. Therefore, at the economically efficient allocation point, marginal income equals marginal cost (the willingness to pay is equal to the opportunity cost). But when there is an imbalance, markets suffer from irrationality problems. Such discontinuity makes the willingness to pay different from the opportunity cost. If this occurs, we must ask how to approach the imperfect market-from the demand side (the willingness to pay) or from the supply side (the opportunity cost). The willingness to pay is a direct measurement obtained through an estimation of demand. That is, the amount of money the consumer is willing to pay for one additional unit of good. Conversely, the opportunity cost is an indirect measure addressed by the offer. In other words, the market states a price for the last unit of good, without differentiating if the price is correctly allocated.
20

To illustrate this concept more clearly, let's assume that in the unskilled labor market, students are offered a job. The unskilled labor worker is defined as the market where people having a high school education or less are offered a job. Students fall under this category because employers do not differentiate between a student and an unskilled worker until the students have received their college degrees.' When a student is willing to work while he/she attends school the opportunity cost is an hourly salary rate of $6.00. As can be seen on the left side of Figure II, the unskilled labor market represents the opportunity cost. Conversely, as shown on the right side of Figure 2, we assume a "study market" denoted by a fixed supply curve representing the university's student cost (or tuition fee)" and a demand curve for study (without differentiating quality or quantity). We also assume that students are rational agents that will search for a university that best matches their preferences, depending on costs of tuition fee and living, quality of the degree they are pursuing and services offered by the university. Under such assumptions, the willingness to pay for one hour of study is equal to $15.00, the cost of a marginal hour of study (based on an average weighted student cost of $10,000.) What is "one hour of study"? To study in an academic environment requires interaction with the computer. Thus, "one hour of study" would likely involve computers and networks. Using e-mail for communication between the school and the student, or between students, has become the norm. Students use computers to write essays and articles, work with data, work in the laboratories, and so on. The computer network is an essential part of the academic experience.
21

FIGURE 2
22

Method of calculation As we showed early in the assumptions, on average, students take 4 classes per term with 3 credits for each class. Each class entails 12 hours of study per week (3 hours in class plus 9 additional hours of study). Therefore, in a month, a student is required to study 48 hours per week, or the equivalent of 192 hours per month. On average a semester lasts 3.5 months. Taking the student cost of X dollars and dividing it by the total hours per month times the duration of the semester, we obtained the student's willingness to pay for one hour of study, or the marginal hour of study equal to $15.00. In summary, when the user is a student' and he/she is involved in an IT-related incident that causes a loss of time, the cost for the user's time should be $15.00 per hour, the weighted average of in- and out-of-state student cost plus fees. If the user is a . professor, the cost should be calculated at his/her hourly wage rate. In reality, each university has different student costs. When applying this methodology, each university will have to calculate its own weighted average. For example, for the calculations of the user cost in the IT-incidents we cost analyzed, use the respective tuition fee (out-of-state vs. in-state) and student enrollment figures from each respective university. We applied this methodology in the incidents entitled, "Experts Lying", "Jumping Hacker", "'Possessed Mouse", and "Post Fourth of July", since these incidents involved specific user costs. (Table III provides a summary of results.) To augment the incident sample, a total of 15 incidents of the two types-service interruptions and copyright violations- was gathered and cost analyzed. Within the service interruption category, the sample contains three examples of compromised accounts, three of hacker attacks, three of harmful code insertion, and three denial-of-service attacks. Within the copyright violation category, the sample contains three MP3 incidents.
23

Table III - Summary of Results from the Incident Cost Analysis
Examples of five types of selected incidents were collected, described, and cost analyzed. In these 15 incidents, we found the following:
• 90 employees were involved in incident investigation and resolution. • 506 employee hours were devoted to incident investigation and/or resolution. • The estimated number of computer and network users who were affected by the incidents was not
available. • Calculated costs for the 15 incidents totaled $59,250. • The average calculated cost for the (2) compromises of access incidents was $1,800. • The average calculated cost for the (3) harmful code incidents was $980. • The average calculated cost for the (2) denial-of-service incidents was $22,350. • The average calculated cost for the (3) hacker attacks incidents was $2,100. • The average calculated cost for the (5) copyright violations incidents was $340.
At first review, the cost figures for these incidents appear so small as to be entirely insignificant. However, it is important to remember two key points:
• We purposefully solicited these types of incidents because security and policy experts in the participating schools perceived that the frequency of occurrence of these types of incidents was high or rising, therefore, the overall costs to the organization may indeed be significant.
• We have used the most conservative figures for calculating costs in all cases. For these types of incidents it is extremely difficult to understand user costs because knowing the number of users that were actually affected in a denial-of-service attack, for instance, is impossible. The average costs are small and they provide only the beginning insights into the overall costs of these incidents for a campus.
24

In a future study we would suggest obtaining information about the number of users who were connected to systems at the time of an incident and using that number to begin estimating user impact figures.
Recommendations Regarding Cost Analyzing IT-Incidents in Academic Environments Questionnaire Template Once an IT-incident is reported to staff member in charge of handling IT-incidents, the staff member should try to gather as much information as possible about the incident. The template shown in Appendix A provides a useful guideline to direct this process of information gathering. With this template the staff member can easily identify the relevant costs that affect the incidents: number of machines involved, number of users affected, and staff hours devoted to handling the incident among others. Calculation Template Depending on the type of user affected in the incident, the staff member, following the cost data template in Appendix A, can decide which calculation is appropriate for the user costs. E.g., If the user is a faculty or staff member, the model suggests the hourly wage rate be used as the "opportunity cost". If the user is a student, the model suggests a weighted average of in- and out-state student costs as the "willingness to pay". In addition, the staff members must remember to calculate their own hourly wage rate times the number of hours spent handling the incident. Machine cost The staff member must add to the staff and user costs, the cost of any hardware or software that is damaged or lost during the incident thereby calculating the total cost of the incident. Reports Finally, it is recommended that the staff member keep a brief description of the response to and resolution of the incident.
25

Part II - FREQUENCY SECTION Database Analysis and Categorizations The purpose of Part II of the study is first to understand the database condition and the categorization schemes of the participating schools and to begin to calculate the frequency of occurrence for particular types of incidents. To address the above objectives, I-CAMP II designed a methodology to gather frequency data from the schools that had databases. During the process, the team found that the participating schools had difficulty delivering the database information in response to the study request. Therefore, the team proceeded to interview the participants to learn more about their database conditions. The results are discussed and reviewed in this section of the report. In addition, the team gathered additional information from experts at each of the participating schools in an attempt to gain estimates of incident frequencies. Finally, I-CAMP II reviewed literature on incident categorization and together with the category schemes from the participating schools, the team developed a scheme that IT-personnel can use as a guide in categorizing incidents on their individual campuses. Designing a Methodology and Gathering Frequency Data The I-CAMP II team anticipated that Part II of the study would be relatively straightforward. The plan was to identify participating schools that maintained incident databases, arrange a method for them to transport the full database of incidents (stripped of individual identifying information) to the team three times during the project period (April, July, and October), and then analyze the frequency results. Anticipating that there would be some variance in the way the data were collected, we attempted to standardize the data we received by asking each school to provide the following information for each incident in their database:
• Name and type of the IT-related incident; • Number of people involved in the incident resolution; • Number of machines compromised; and, • Dates the incident investigation /resolution began and ended.
Availability of Databases We began by interviewing the contact persons at each of the 18 participating schools to identify those who maintained incident databases. Several important conclusions were drawn from these interviews. To our surprise, only 38% (7 of 18 participating schools) maintained any form of incident database. Representatives from a number of the schools expressed a desire to have a sophisticated incident database but indicated that they had neither the time nor resources to build and maintain it. Two of the schools had begun building such a database, however, they had so few incidents recorded at the time of this study that the data would not prove useful. There was a genuine interest in participating and a support for the effort of analyzing incident data. Everyone we interviewed indicated that they felt such data, if collected, would be valuable to their school. Aggregated Data Individuals from many of the schools indicated that the distributed nature of their computing environments made it difficult, if not impossible, to aggregate incidents from across their campuses. Most of the
26
representatives felt that there were many incidents going on that were unnoticed; some, if identified, were minimally managed or ignored altogether. Some were investigated and managed within individual departments, but not reported to a central database. Within the seven schools that have incident databases, each made an effort to aggregate campus incident data into their database, but with varying degrees of success. Some schools relied on their departments to self-report the incidents to a database manager. Some systematically and routinely collected incident data from the two or three key areas on campus that they knew had such data. Two representatives indicated that they had established, with the support of campus executive officers, a campus-wide procedure for reporting incidents to the central database and felt confident that the database represented a comprehensive picture of the incidents on campus. They, however, were less sure about regional and medical campus reporting. For 100% (7 of 7 of the respondents), the comprehensiveness of the database information, its inclusiveness, was a problem. This inability to aggregate incidents and to see the full picture of IT-related incident activity on the campus, for all respondents, made it impossible to construct a true picture of the frequency of different types of incidents on any one campus. The I-CAMP team initiated a data-gathering procedure with the seven schools that maintained incident databases.' For each school it was necessary to design a process for transporting the data to the study team. Data collection was scheduled for April, July',, and October of the project period. We expected that these dates would generally provide representation from an end-of-semester period, a low-enrollment/activity period, and an early-in-semester period. Problems in Data Collection As attempts were made to collect the database information in the first two periods, April and July, it appeared that our requests for the data were causing considerable difficulty for the participating schools. April data were not received until well into the summer; July data, well into the fall. We began to realize, due to the genuinely expressed willingness to participate on the part of the school representatives, yet the significant delay in delivering data, that what we were asking of them must be more difficult than seemed reasonable to us. To determine why the process was so difficult, in-depth interviews were performed with each of the database school representatives. (The interview template to ensure comparable information from representatives appears in Appendix D.) Summarization of Interview Results We. asked what types of difficulties respondents were having meeting our request for data. Four basic problems were reported.
Too few or changing personnel For 43% (3 of 7 respondents), new personnel or changes in personnel resulted in confusions or discontinuities in work processes and therefore, in fulfilling the requests of the I-CAMP II study. 57% (4 of 7 respondents) reported that they did not have enough staff members to maintain their logs or input data to the databases in a timely fashion and therefore, fulfilling the I-CAMP II study request was an additional burden on an already taxed staff. It is important to note that "'lack of continuity in staffing and responsibilities" was one of the factors identified in the initial I-CAMP study that was felt to contribute to the increased costs of incidents when they occurred.
27

The authors wrote: "Incidents affected by this cost factor were characterized by high turnover and lack of clarity and continuity in passing responsibilities for system management functions from one employee to another, resulting in lost documentation and missed or poorly executed procedures." It is interesting that this same factor caused problems with the collection, management, and maintenance of data about incidents in the I-CAMP II study. Limited or fast-changing human resources appear to be detracting from the ease with which we manage and understand incident data, and most certainly from the efficiency of managing the incidents themselves.
Confusion caused by the I-CAMP II request For 14% (1 of 7 school representatives), the I-CAMP II staff were unclear in their request for data, causing confusion. For another, confusion resulted from the ICAMP II request being more comprehensive than what they had readily available in their database. The study team did not know that what they were requesting was simply not available in most of the databases retained by the schools or would require special calculations in order to report. The entire area of categorization of incidents, the diversity of the present category systems at the participating schools, and the need for a more common and mutually useful classifying, counting, and reporting incidents will be discussed later in this report.
Problems inputting data to the databases Many of the respondents had difficulty due to the nature of their data input processes. Forty-three percent (3 of 7) reported that they manually enter data in the database or have to manually classify the data from e-mail messages or flat files. Twenty-nine percent (2 of 7) reported that they had to aggregate data manually from two or three individual sources on their campuses where incidents were recorded and that the different reporting mechanisms did not merge the information easily. For some, different people input the data and do so at different levels of specificity, perhaps also differing in their judgment as to how to classify a particular incident. For 71% (5 of 7 respondents), the greatest difficulty was that because of limited resources, the databases were not kept up to date and therefore, data had to be entered prior to their being able to respond to the I-CAMP II request.
Limited functionality of the log Since logs contained information about student activities for many of the incidents, all of the school respondents were sensitive to privacy restrictions on the data. Access in nearly all cases was limited to three part- or full-time employees and was password protected to control access to only those authorized for investigation and handling of the incidents. In three of the seven schools, student-employees were involved in the investigation and resolution of incidents. The databases were not designed, however, to facilitate the sorting of the information by different fields, and therefore to automatically eliminate the personal identifier information from the aggregated records. Therefore, to respond to the I-CAMP II request, most of the respondents, to protect the confidentiality of the records, had to strip out the personally identifiable information manually before sending the information to I-CAMP II. One -hundred percent (7 of 7 of the respondents) had some difficulty responding to the I-CAMP II request because their databases either were not up to date, could not sort by incident type, or did not have information on the other variables asked for by the study. For many of the respondents, the database tool they used did not allow an automatic classification of incidents as they were entered or a sorting function; they functioned more
28

like spreadsheets than interactive databases. They were designed to be useful as recording tools not as reporting tools. One hundred percent (7 of 7) of the respondents indicated that they wanted an interactive logging and sorting tool that generate periodic reports for CIOs, senior management and others. None provided such reports on a regular basis at the present time, though some, with great effort, were pulling data from the logs and reporting occasionally. Respondents want the database tool to be able to aggregate data on an incident from multiple sources such as machine logs, trouble ticket, and police reports, and provide automatic incident entry and classification. Trend analysis and incident tracking were the two greatest needs.
Design and purpose of the existing database schemata The fact that so few schools in the sample had a working database of incident information was surprising. However, our suspicions that many schools were struggling without the needed tool and with too few resources and personnel time to maintain this information source were confirmed during our interviews. The importance of this information resource was also confirmed during our interviews. Our next task then was to examine what existed, the purpose for which the category systems had been devised, and the roles of the people who had designed the databases in our participating schools. We wanted to understand the rationale behind the various categorization schemes. The existing database function as management tools rather than search or aggregating tools because they were designed to do just that-to capture information in one place and ensure that someone was assigned to handle each incident. Figure 3 provides information about role and background of the database creators and purpose of the tools.
FIGURE 3 -DATABASE CREATOR ROLE AND PURPOSE
29

In summary, the I-CAMP II requests for "regular data transfers of incident data from each of the participating schools" were very difficult to fulfill. The requests were difficult because of limited personnel, limited functions on the existing databases, difficulty maintaining the timeliness of the data, and non-automatic (or no) aggregation of incident data from multiple sources on the campuses. Status of School Categorizations Analysis of data confirmed that there was a wide and varied set of categorization schemes used among the database schools. (Appendix E provides a listing of the different category and incident types recorded by the database schools.) Fairness and justice in Incident Handling When an incident occurs and a suspect is identified, colleges and universities today too often judge cases and impose penalties on an almost ad hoc basis. Record keeping and human memories vary widely. Each incident stands nearly alone. Little can be done to reconcile actions with previous judgments or to create a written record for future judgments. The quality of incident-justice may suffer accordingly. Arbitrary and capricious decisions, even naked exercises of power, become possible in such an environment. Fairness and consistency are more likely to occur by accident than by design. Any sense of legitimacy becomes elusive at best. Guidance for the future fares no better. If judgments are not collected and published, they can serve neither as deterrent cautionary tales nor as guidelines to permissible behavior. If decision-makers have no obligation to publish reasons for their judgments, then no tested body of principles can emerge, leaving prudent information technology users no choice but to limit their behaviors excessively so as to avoid being charged with a violation. Carey Heckman writes:
"Evolution of just and efficient information technology regulation depends on creation of a system for constantly accumulating an accessible body of incident judgments. Oliver Wendell Holmes observed that "the life of the law has not been logic: it has been experience." Holmes rejected conceiving law as the product of abstract deduction from on high. He wrote about law as an organic product reflecting a community's evolving common practice in light of its evolving common values. The nature and pace of change in the information technology context makes particularly essential a process that produces an adaptive, constantly improving regulatory regime."
Similarities in Incident Categories Each of the category systems used by the participating database schools served a functional role for that school. While representatives indicated that they would like to have the capability of reporting from their database data, the tools were not designed to allow sorting by incident type, or to provide aggregate reports from all sources on campus by incident type, or by date, or by whatever other variable might be sought. Inspection of the incident categories across schools showed many commonalties in the titles that they gave to particular types of incidents. For example, 75% identified harassment as one of the categories in classifying incidents; 71% identified copyright violations; 71% categorized intrusions; 75% identified Spam as one of the categories in classifying incidents; and 71% identified various forms of abuse and misuse of systems as an
30

incident type. Though these commonalties in titles exist, we cannot be certain how the categories were understood and how reliably they were used by each of the participants during their classification of incidents Most striking, beyond the commonalties in the category systems, is the fact that they so clearly reflect the area of specialization of the incident database builder. Those builders, whose primary responsibilities lie in the area of system security, over time, have constructed incident databases that are much more robust in classifying intrusion-type incidents. Those builders with responsibility for handling misbehaviors or abuses of systems by students have constructed incident databases that classify abuse and policy violation-type incidents. But how consistently are these database categories being used in any of the schools that have them? While this question cannot be answered in this, study, we recommend a rater reliability measure in future work of this type. Factors Appear Again-Lack of Knowledge/Information, Lack of Resources The initial I-CAMP study team identified several f actors that they believed contributed to increases in costs when incidents occurred. Among the factors identified was lack of knowledge. The authors wrote: "This factor affects costs when the personnel do not know how to handle, investigate, or manage an incident. Such incidents involve lack of direction, planning, and procedures." Without an archive or database of incidents- an institutional "memory"- of how previous incidents of a particular type were handled, what was learned, what worked, what did not, what policies and laws were relevant, what procedures to follow, a "lack of knowledge" exists. Those who are trying to handle the incidents on a day-by-day basis are left without guidance for consistent, expeditious, and fair management of the incidents. Again, the factor of "lack of knowledge"' appears to be contributing to inefficiencies and, perhaps then to incident management costs. The initial I-CAMP study team also identified lack of resources as a factor contributing to cost. They wrote: "The lack of human, physical, or fiscal resources needed to resolve an incident can contribute to both the occurrence and the cost of an incident, but they are distinct effects. For example, if an incident needs 20 employees to resolve it efficiently, yet the department can afford to pay only five employees, then the incident will take longer to resolve and the costs will rise." Many of the schools in the current sample appeared not to have sufficient resources, human or fiscal, to develop and maintain an incident database or to manage incidents in the manner they felt was needed. Again, the factor of "lack of resources" appears to be contributing to inefficiencies and ultimately, the cost of data gathering, organization, and incident management. Several other factors were thought to contribute to incident costs in the initial I-CAMP study. It was thought that these factors might be eliminated through the existence of a well-designed, maintained, and used database-a database that provided needed information about past related or similar incidents and their handling. But such databases do not yet exist in practice. They require a comprehensive, well designed, database may require the contributions of both those in roles that concern themselves with security features of operating systems and networks and those who focus on policy violations and interpersonal conflicts played out in the electronic environment. Frequencies from Database Schools We found that the category systems used by the different participating database schools varied significantly and that, while there were commonalties in some of the category titles that were used, we had no assurance that what one school called an intrusion, for instance, was the same as what another labeled such an incident.
31

Additionally, we found that due to the lack of resources and the way in which college and university administrators were operating, given the current tools and resources that they have to record and manage incidents, that the reliability of incident classification within a single school might also vary significantly among those persons doing data input. Finally, we found that variance in the way the data were delivered to the I-CAMP II team, due to the condition and organization of the existing databases, made tabulation across schools unreliable. Some participants were able to provide only a stream of e-mail messages regarding an incident while others provided actual counts by their existing category systems. Given these conditions, we had to conclude that tabulating frequencies of different types of incidents across the seven participating schools would not produce useful or valid data for this study. (However, for the interest of the reader, Appendix F shows frequencies by school, by their individual category system. Appendix F also shows the synthesized category system that the I-CAMP II study team constructed from the seven individual systems. From this attempt to synthesize categories and from our literature review, the team then created the model we propose later in this report.) Frequencies from Expert Estimates Since our ability to analyze the data from the database schools fell far short of our expectations due to the varied nature of the database classification schemes and the small number of schools with operational incident databases, we decided to turn again to the representatives to gather further information. Our intent was to gather estimates of the frequency of occurrence of selected types of IT incidents and gather these estimates from the people who would likely know. Who Were the Experts? To understand the kind of expertise these representatives possessed in relation to IT incidents, we asked them about their positions within the IT organizational structures of their universities. We hypothesized that representatives from each of the schools who were in positions of responsibility for security, incident handling, or user services could reasonably be expected to know about IT incidents on their campuses. We hypothesized further that individuals high in the IT organizational structure would have a campus-wide perspective and a good idea of the frequency of occurrence, and of the types, of incidents that were happening on the campus. Analysis showed that the roles of our representative fell into three primary categories. Some were responsible for IT security services for their campuses and had titles such as Director of Network Services, Director of Computer Security, Manager of Data Security, or Manager of Operations and System Security. Some were responsible for customers support with titles such as Manager of Academic IT Support, Information Technology User Advocate, or Manager of User Help Desks. The final group were responsible for policy and planning and had titles such as Director of University IT-Services, or Director of Policy and Planning. Of the 18 schools queried, 17% (3 of the 18 representatives) reported directly to the Chief Information Officers of the University. They were identified as level 1 respondents-one step from the CIO. Twenty-two percent (4 of the 18 representatives were identified as level 2 respondents. Fifty percent, (9 of the 18) as level 3 respondents, 5% (1 of 18) as a level 4, and 5% (1 of 18) as level 5. All respondents were management level personnel. Methodology for Expert Estimates The I-CAMP II team first selected three types of incidents for additional information gathering. The types of incident were selected randomly from all of the categories involved in the I-CAMP II study. The three that were randomly selected were mail bombs, Warez sites, and system probes. Next the team standardized a set of questions to ask the campus experts. We asked each school representative the same questions.
32

All 18 representatives (100%) responded to our request for frequency of occurrence estimates. They were asked the following questions: How many reported occurrences of this do you estimate are handled and entered into your log or database in a year's time? _____
• How many occurrences of this do you estimate are identified at the various incident handling points on your campus (es) in a year's time? _____
• How many occurrences of this do you estimate take place at your university in one year's time? _____ The three questions were repeated for mail bombs, system probes and Warez sites. Two notes of clarification are necessary. Mail bombs were understood to be bombs received, not those sent by members of the community to other sites. Likewise, system probes were just that, i.e., probes, not necessarily penetrations. We clarified these understandings with each of the participants at the time of questioning. We already knew that most of these campuses did not have a systematic method for aggregating, recording, analyzing, and reporting IT-related incidents from the low number who were able to participate in the database portion of the I-CAMP II study. Therefore, it was only estimates that we were interested in gathering during this exercise. Many of the representatives expressed discomfort in giving these estimates because they wanted but did not have the foundation of recorded data. Representatives used various informal devices for establishing the estimates. Most used weekly or monthly figures and extrapolated to annual estimates. Table IV provides a set of estimates and figures regarding the occurrences, identification and handling of mail bombs. Table V provides a set of estimates and figures regarding the occurrences, identification, and handling of system probes. Table VI provides a set of estimates and figures regarding the occurrences, identification and handling of Warez sites. To see how consistent the experts were in their estimates relative to the actual occurrences of the specific incidents gathered in their databases, we compared the database figures with their estimates. For the schools that had databases, we added the number of recorded probes, or mailbombs or denial of service attacks that showed up in the databases in the three reporting periods, extended that figure out to twelve months, and compared it with their answers to question one: expert estimates for those types of incidents handled and logged. We found that their estimates, as might be expected at least for this question, appeared to be informed by what they knew had been logged over several months. Their estimates were very close to the number extrapolated from their logged data in the three months during which data were gathered.
33

Table IV-A Expert Estimates regarding the occurrences, identification and handling of Mail bombs
34

Table IV-B Expert Estimates Grouped by School Population Mail Bombs In this table we provide expert estimates grouped by school population. The ranges of school population are: under 20,000, 20,001 to 40,000, 40,001 – 60,000 and over 60,000 students. The corresponding means for each school population range are also provided.
35
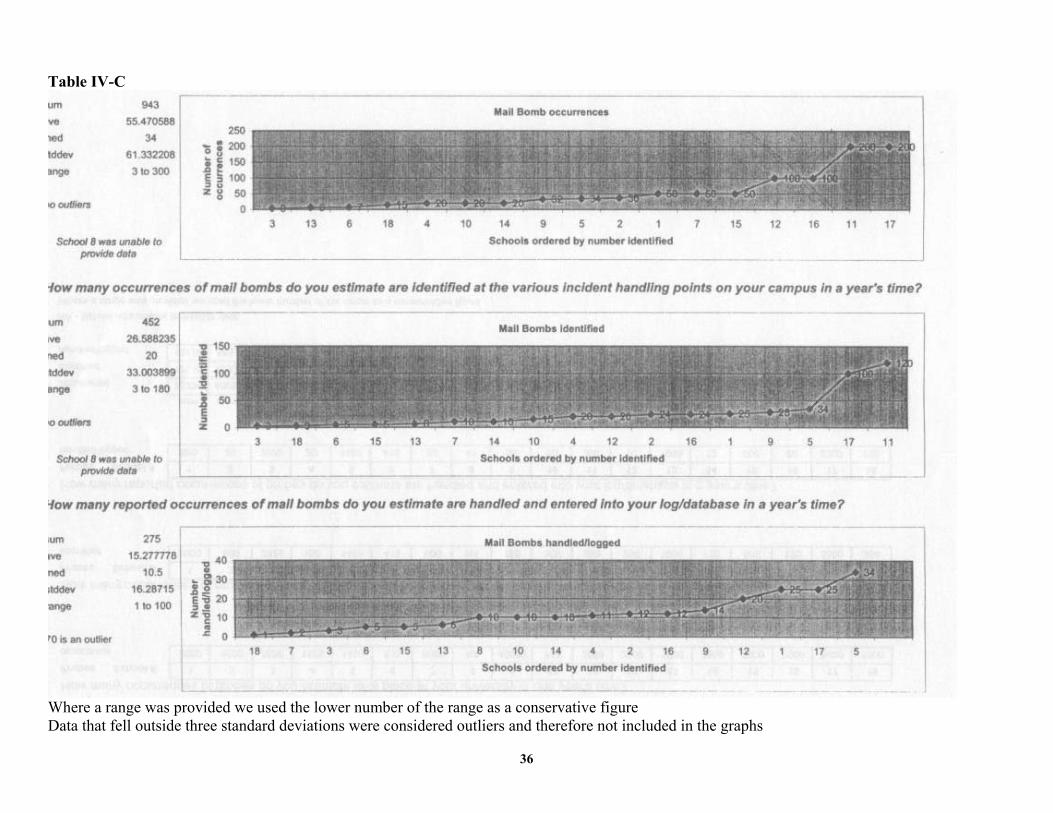
Table IV-C
Where a range was provided we used the lower number of the range as a conservative figure Data that fell outside three standard deviations were considered outliers and therefore not included in the graphs
36
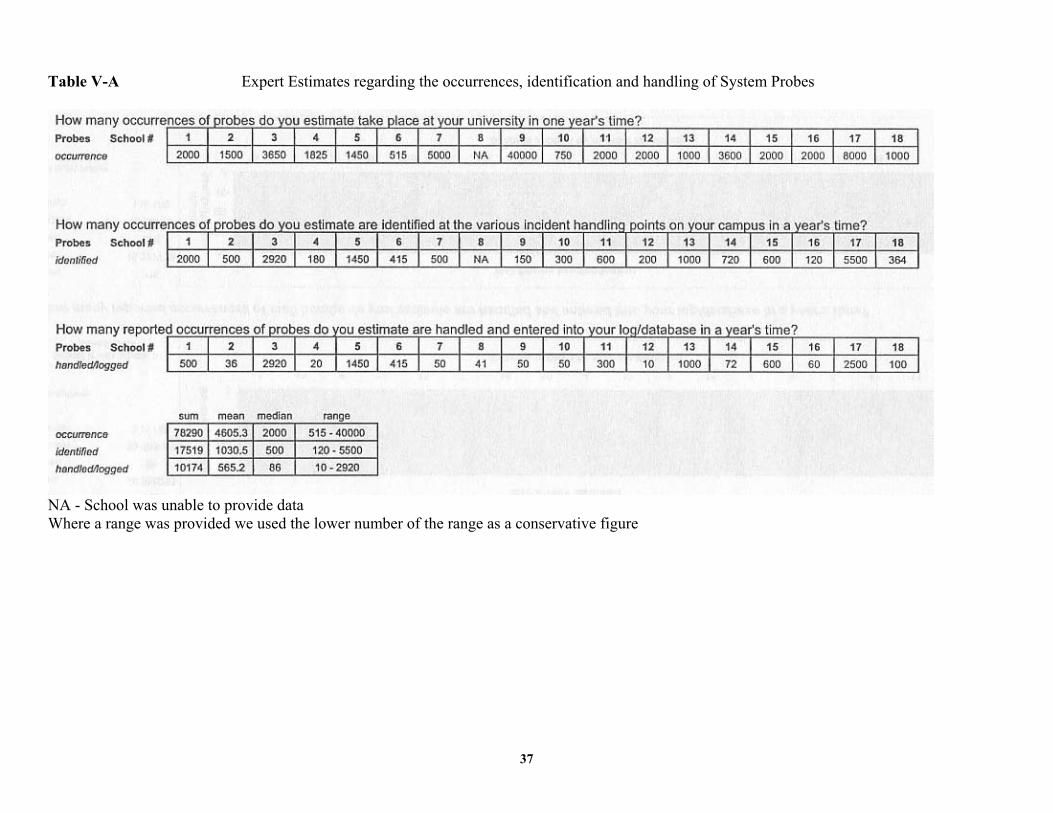
Table V-A Expert Estimates regarding the occurrences, identification and handling of System Probes
NA - School was unable to provide data Where a range was provided we used the lower number of the range as a conservative figure
37

Table V-B Expert Estimates Grouped by School Population Probes In this table we provide expert estimates grouped by school population. The ranges of school population are: under 20,000, 20,001 to 40,000, 40,001 - 60,000 and over 60,000 students. The corresponding means for each school population range are also provided.
NA - School was unable to provide data
38

Table V-C
Where a range was provided we used the lower number of the range as a conservative figure Data that fell outside three standard deviations were considered outliers and therefore not included in the graphs
39

Table VI-A Expert Estimates regarding the occurrences, identification and handling of Warez
NA - School was unable to provide data Where a range was provided we used the lower number of the range as a conservative figure
40

Table VI-B Expert Estimates Grouped by School Population Warez In this table we provide expert estimates grouped by school population. The ranges of school population are: under 20,000, 20,001 to 40,000, 40,001 - 60,000 and over 60,000 students. The corresponding means for each school population range are also provided.
Percentage of incidents handled out of those Perceived to be occurring Less than 20,000 students 20, 001 to 40, 000 students 40,001 to 60,000 students Over 60,000 students
50% 30% 46% 56% NA - School was unable to provide data
41

Table VI-C
Where a range was provided we used the lower number of the range as a conservative figure Data that fell outside three standard deviations were considered outliers and therefore not included in the graphs
42

Results of Expert Estimates First, it is striking that so many of the experts were so similar in their estimates of occurrences, identified incidents on campus, and handled incidents. While there were similarities, there were also those whose estimates far exceeded those of the other experts. (Such estimates, if they exceeded three standard deviations from the mean, were considered outliers and, for purely statistical purposes, were excluded from the summary figures. The potential validity of those estimates should still be contemplated, however.) Some experts, instead of giving a-single number estimate, gave a range, e.g., 30-40, etc. In all cases, we were conservative in our handling of those numbers, taking the lower bound of the range and representing that as the data point on the accompanying table. Second, it appears that in estimating incidents, school size was not necessarily reflected in the size of the estimates. For mail bombs, approximately 30% of the incidents that were perceived to be occurring on campus were thought to be logged and handled, regardless of the size of the school. For system probes, the range of estimates was very large. This may indicate that the experts are truly guessing without any basis for. their perceptions, or that they perceive very large numbers and know that they are unable to detect and handle even a small portion of those incidents. A median estimate of 2,000 probes per year is something of interest to contemplate. Using only median figures, it appears that the experts perceive that only one-tenth of those that are occurring on campus are being logged and handled. It is interesting to note that for Warez sites, an incident type about which schools have been aware and educated, the percentage of those perceived to be logged and handled relative to those occurring on the campus is much higher than for the other two types of incidents measured, especially probes. The number of estimated incidents of Warez sites occurring is also significantly lower than estimates for system probes. It would have been interesting to see the estimates from experts on occurrences of MP3 incidents, another copyright violation-type incident. However this was not one of the three randomly selected incident types for expert estimates. The-low perceived occurrence of Warez; sites may be the result of campus actions to combat copyright violations of software resulting in decreases, or the result of the diverted attention of the experts. It might be hypothesized that the newer copyright problem on campus, MP3 sites, has overshadowed the older type Warez; incidents. Towards a Comprehensive Categorization Scheme Literature Review Does a comprehensive category system exist? Our research indicates that the answer to that question is "No. The struggle that we see played out by the database schools in the construction of their incident database classification scheme-the mix of policy/ behavioral abuse categories and security/system abuse categories-is also seen in the literature regarding incident classifications. Several authors have focused attention on incidents that result from systems-related vulnerabilities. In their work, they create taxonomy of the different vulnerabilities that can exist in operating systems. Vulnerability scanning tools such as SATAN and ISS, using inventories of such vulnerabilities, are valuable for scanning networks and machines to identify existing vulnerabilities. These and other such tools have expanded awareness of potential vulnerabilities in systems and networks. In a 1996 paper by Taimur Aslam, Ivan Krsul, and Eugene Spafford entitled, "Use of A Taxonomy of Security Faults,"" the authors describe a classification scheme, focused on UNIX systems. The system helps readers understand various types of coding faults, which include synchronization errors and condition validation errors,
43

and emergent faults, which include configuration errors and environment faults. They conclude that, by using the classifications described, it is possible to design a decision process that would "help us classify faults automatically and unambiguously." In his 1995 book entitled, Computer Related Risks, " Peter Neumann has categorized a wider range of human-system interactions that result in both intentional and accidental IT-related incidents. He presents the experiential material "according to threats that relate to specific attributes (notably reliability, safety, security, privacy, and well-being, and within those attributes, by types of applications). This wider range of incident types comes closer to that used by the builders of the databases in the I-CAMP II participating schools. Like the participants in I-CAMP II, Neumann's incidents come from experience, and the categorization scheme reflects both human abuses/misuses of information and technology as well as system vulnerabilities and the incidents that result from accidental or purposeful exploitation of systems I-CAMP II Recommended Categorization Scheme We believe that a categorization scheme that helps to identify the target of the incident can provide significant benefit to decision making and management. Our review of the incident databases, the literature, and our research from I-CANT I and I-CAMP II indicate that incidents fall into, and can best be understood by examining, three TARGET groups-Operating System (OS)/Applications, Information/Data, and Human/Interpersonal Each of these target groups can be broken down into categories entitled: "purposeful" and "accidental", where sufficient data exists to allow such a determination of motive. Colleges and universities are not solely interested in the vulnerabilities that exist in operating systems and networks except in areas of technical development and research. Neither are they solely concerned about vulnerabilities in data except, as they are accountable for data accuracy. Finally, they are not solely interested in human vulnerabilities except as they affect the development of members of their community. It is the interaction of humans with data, humans with humans, humans with operating systems, and the overlap of these areas with each other where the information technology-related incidents occur. Especially in colleges and universities, it is the interaction of humans, purposeful or accidental, with the vulnerabilities in the other areas, interpersonal, data, and operating systems, that bring the focus upon the incidents, which we are studying. More than any other organization, colleges and universities must deal with the human interactions in these three areas and must consider the most appropriate interventions, technical, policy, or educational, to achieve-the desired results when incident occur. It is the interface of users, data, and operating systems-this arena of information technology-related incidents-that is of most concern for these institutions.
44

There are incidents for which the target is the operating system/ applications. The behaviors, either purposeful or accidental/ unwitting, are directed at the operating system or a specific application. The resulting incident will necessitate an intervention of some sort with that system or application such as repair, reconstruction, patching a vulnerability, etc. There are also incidents, for which the target is information/ data. The behavior of an individual, either purposeful or accidental, results in some action of information/ data access, alteration, release, etc. The resulting incident requires an intervention related to the information or data such as reconstruction, correction, or retrieval. Finally, there are incidents for which the target is other people. In organizations such as colleges and universities where much of the population is young and learning new or different modes of interpersonal interaction, incidents in this category are often the result of poor judgments, underdeveloped communication skills, or immature social understanding and responsibility. Behaviors in this category, whether purposeful or accidental, have an effect on at least one other human being. Interventions often require education or interpersonal conflict resolution and sometimes, due to the power of the current information technologies to spread information rapidly, require small or large group interventions. We offer the following classification scheme, with examples of incidents by category, as a useful tool. It should be noted that many of the incident types are drawn directly from the incidents described by Peter Neumann. They also include those from the incident classification schemes of the participating schools. It should also be noted that, while we have provided for decisions about Intentional /Purposeful or Unintentional /Accidental behaviors, we know that some incidents begin as one thing and result in further behaviors that take on a fully different motive. For example, a system vulnerability may be accidentally discovered, but then a decision made to purposefully exploit that vulnerability to access or alter data. In making decisions about how to classify incidents and, more important, what interventions are needed to treat or manage the incidents, it is important to explore and understand each part of the event to the greatest extent possible. Such analysis of incidents, looking first at the target, then the event and its specifics, and then to the degree possible, at the motive, can both expedite the movement of serious events to other authorities such as law enforcement where necessary, or can prevent unfair treatment when the incident results from immaturity and/or poor judgment. Figure 6 shows the I-CAMP II categorization scheme that we suggest as a guide for categorizing IT-related incidents in the academic environment. It is worth mentioning again that by no means is the only or a totally unique way to categorize incidents. Rather, it is a rationale for organizing incidents that starts by focusing on the target of the behavior, attempts to clarify the incident in terms of intent, and then potentially leads to the most appropriate interventions for that category of incidents.
46

Figure 5 - ICAMP II Categorization Scheme
47

SUMMARY AND CONCLUSIONS The I-CAMP II study's first major objective was to examine and refine the costing model for calculating user costs for IT-related incidents. We knew from the first I-CAMP study that it was relatively straightforward to calculate the costs of incidents from the worker/staff perspective-those that were assigned to investigate and resolve information technology related incidents. The number of hours needed to investigate and resolve the incident was multiplied by the employee's hourly wage. Adding the cost of any hardware or software that may have been damaged or destroyed in the incident provided a calculation of, what many might call the direct costs. We also knew, however, that when users are disrupted from using the networks or other technology-related resources, on which they are becoming increasingly dependent, there are real costs to them as well. Likewise, when technology-related incidents cause the organization damage due to loss of reputation or trust, there are also costs that should be calculated. Calculating these, seemingly more indirect, costs needed more attention. The I-CAMP II study examined and revised the original cost analysis model and suggested a new model for calculating user-side costs. The study also confirmed the usefulness of a common template for gathering data on IT-related incidents, and guiding the cost analysis process. The project revised this template. It recommends the consistent use of a cost analysis template as a best practice for system administrators who want to understand and document the organizational costs of IT incidents. The I-CAMP II study expanded the number and geographical representation of participating schools in the study, raising awareness of the need for incident cost analysis and for a systematic methodology for analyzing data regarding the incidents that are occurring on college and university campuses. Eighteen schools participated in the study. In an effort to expand the existing collection of cost-analyzed incidents, the ICAMP II study gathered and analyzed data on 15 additional incidents. Selected because they were not included in the original study, these incidents, thought to be frequently occurring on the campuses but small in overall costs, included incidents where access had been compromised, insertions of harmful code, denial-of-service attacks, hacker attacks, and copyright violations. The study found that for the 15 incidents that were analyzed, 90 employees were involved, 506 employee hours were devoted to investigation and resolution, and over $59,000 in costs were incurred. The assumption that the costs for resolving these selected incidents would be low was generally confirmed; the average cost for incidents of access compromise was $1,800, for harmful code was $980, for denial of service was $22,350, for hacker attacks was $2,100, and for copyright violations was $340. But information technology security experts have also indicated that these types of incidents are occurring with high and growing frequencies on the campuses. Therefore the I-CAMP II study pursued its second major objective which was to investigate the availability of frequency data from the campuses. The study found that out of the 18 participating schools, only 38%, 7, had incident data collections in a working database. Though 7 of the participating schools had incident databases, the study team found as it began receiving data in the study's three data collection periods- April, July, and October- that its requests to the participating schools for data were causing great difficulty. This needed to be understood. Through in-depth interviews with representatives from each of participating schools, the team found that nearly all of the schools had difficulty aggregating incident data from across their campuses. While efforts were made to collect incident data, most of the school representatives reported that they were confident that incidents were
48

happening that no one knew about. They reported that, even for those incidents that were identified, specific information about the incidents was not systematically collected and recorded in a central database. Therefore they were unable to construct an aggregated picture of the occurrence of technology-related incidents for the campus as a whole. The 7 participating database schools had too few and frequently changing personnel resources to maintain the incident data repository/ database in the manner they desired. They had problems inputting data to the databases due to limited time and personnel. Their databases were originally designed to include fewer functions than were now considered desirable; they were designed capture incident data in one place and coordinate response, however other functions such as searching, archiving, aggregating, and reporting functions were needed. They also reported that their incident categorization schemes, which had evolved over time, were not as comprehensive and functional as they now needed. The I-CAMP II study found that, given the state of the existing databases, the study team's request to the 7 schools for frequency data was very difficult to fulfill. A clear conclusion from this study is that colleges and universities are not currently equipped to understand the types of IT-related incidents that are occurring on their campuses. They are not currently able to identify the number or type of incidents that are occurring. They are not able to assess the level of organizational impact these incidents are having either in terms of direct costs such as staff time, hardware and software costs, and costs to users, or in terms of indirect costs that may result from loss of reputation or trust due to a major IT-incident The study team, in cooperation with the 7 participating schools, analyzed the currently existing incident categorization schemes. They found that the categorization schemes used by the different schools, as might be expected, had been developed over time out of the needs and responsibilities of various individuals in the process of fulfilling particular roles. Individuals with responsibility for security functions developed schemes that categorized operating system and network vulnerabilities. Those with responsibility for conduct or policy violations developed schemes that categorized misbehaviors, misuses of institutional resources, or interpersonal abuses. Since each category scheme then reflected nearly individual institutional cultures and needs, the frequency counts recorded in these disparate systems could not be statistically compared and aggregated across schools. The incident types that were selected for cost analysis in the I-CAMP II study were thought to be occurring with high frequencies. The currently existing databases were found to be so diverse in their category systems as to not allow confidence in the aggregation of frequency data for any one category. Therefore the team needed to pursue an alternate method for gathering frequency data. The study team gathered expert estimates from all 18 participating schools for three selected incident types. Respondents were asked to estimate the number of occurrences of mail bombs, system probes, and Warez sites that were identified, logged, and handled, annually. They were asked to estimate the number of occurrences of mail bombs, system probes, and Warez sites, that were identified at various incident handling sites on campus, annually. Finally, they were asked to estimate the number of mail bombs, system probes, and Warez sites that occurred campus-wide, annually. The I-CAMP 11 study concluded that the expert estimates of incidents logged and handled annually were very similar to the actual frequency counts for those same type incidents when compared to the data from participating school databases. The study team concluded that school size did not appear to affect the level of estimate given by experts in those schools for any of the three types of incidents-mail bombs, probes or Warez. The study concluded that, in general, experts believe that they are identifying and handling only about 28% of the mailbombs that are occurring campus-wide, approximately 12% of the system probes, and approximately
49

28% of the Warez sites. These last two conclusions may reinforce the earlier conclusion that the schools were unable to understand the level or frequency of incident occurrence because of their inability to aggregate incident data across any one campus. Experts estimated that they were handling and logging an average of 15 mail bomb incidents per year, an average of 565 system probes per year, and an average of 15 Warez site incidents per year. Given the diverse categorization schemes used at the 7 participating schools, and the absence of systematic data collection processes at the remaining 11 schools, the I-CAMP II study concluded that a common and more comprehensive categorization scheme would be beneficial to colleges and universities. They concluded that insufficient attention was being paid to the target of IT-incidents – people, data, or systems. They recommended that a comprehensive system should encompass both the taxonomies of operating system vulnerabilities that appear in the literature and are being used by newly emerging vulnerability scanning tools, as well as, the types of interpersonal and policy violations that are also seen. The study provided the beginning of such a category system.
50
FINAL RECOMMENDATIONS The I-CAMP II study team provides the following specific recommendations for future research and best practice:
• Develop a comprehensive language and categorization scheme that encompasses both the security vulnerabilities and policy type violations and that guides individuals to analyze the focus of the incident-humans, data, or systems and then analyzes the motive of the behavior-purposeful or accidental. (The I-CAMP 11 categorization is a start at this process.)
• Gain wide spread approval for the use of this common categorization system across college and
university campuses for the categorization of IT- related incidents.
• Encourage college and university system administrators to routinely use a common cost analysis template to understand and document the institutional costs of IT-related incidents. The I-CAMP II template provides one such tool and a best practice.
• Encourage colleges and universities to create central incident reporting and cost analysis centers, which,
working with departmental system administrators, can also provide assistance in the investigation and handling of incidents.
• Encourage and gain wide acceptance for systematic reporting of information regarding incident type,
frequency, management processes, and trends to senior management to provide data for knowledgeable and data-driven IT-related risk management.
• Create, in conjunction with participants from several colleges and universities, an interactive,
comprehensive database tool, which provides the functionality desired by incident handlers.
• Study the reliability, of inter and intra institutional categorization of incidents to encourage best practices and to facilitate data comparison and sharing.
• Study the consistency of inter- and intra-institutional incident management to encourage best practices,
equitable and fair procedures, and to facilitate analysis of data trends among participating schools.
• Encourage widespread commitment for regular inter-institutional data sharing regarding incident trends, costs, types, and frequencies to allow for analysis and identification of the best and most cost-effective incident management practices.
51

Appendix A Questionnaire Template
52

IV. PEOPLE INVOLVED IN THE RESOLUTION
53
V. IMPLICATIONS FOR USERS:
54

Undergraduate Student______ Graduate Student______ (if the user is an undergrad or grad student, provide the necessary information in the table below under the student title)
55

VII. CONSEQUENCES:
56
57

APPENDIX A1 Cost Data Template
58

APPENDIX B
Conventions for Cost Variables This appendix provides information about the definition and treatment of the specific cost variables used in the study.
Costs on the Resolution Side of the Incident This factor refers to the wage costs attributed to the efforts of faculty-, staff, students, and consultants responsible for resolving an incident. Faculty, staff and student employees As in I-CAMP I, this study was conservative in accounting for the costs of employees in resolving incidents. "With deference to the possibility of error in recalling past events and protecting ourselves from reporting data with a false sense of precision, we calculate wage costs within a confidence interval of 15%. We cannot be certain of the appropriate level of confidence to use, but feel that + /- 15% is a fairly large error bound and, if anything, errs on the side of slightly underestimating costs" Following the same path as I-CAMP did, the actual calculations for the faculty, staff, and student employees was obtained by dividing an individual's wage rate by 52 weeks per year and 40 hours per week to obtain an hourly wage. This result is then multiplied by the reported logged hours, the number of IT-worker involved under the same title and with same hours logged, the wage rate varied by +/- 15% of the reported total. Then, the benefits at 28% (explained below) and the indirect cost rate were added. Finally, the total amount is rounded to the nearest hundred, where the median figure is used in the total cost figures. Our calculations are explicit in each incident summary report. Benefits In I-CAMP, we included benefits in faculty and staff costs where appropriate. We use 28% as a standardized benefits rate, knowing that it is a representative measure for the benefits rates of each institution included in the study.
Other Cost Factors Indirect Cost Rates We followed the I-CAMP indirect cost rates (ICR), which were included in faculty and staff costs where appropriate. We use 52 % as a standardized ICR, as a representative measure for the benefits rates of each institution include in the study. New Purchases Whenever the incident required a hardware or software purchase, we included the purchase price as a cost of the incident. But if the purchase of the new equipment was inevitable but not planned for at that time, we did not included it as part of the incident's cost (see assumption 4 for further explanation).
59

APPENDIX C
ICAMP II Incidents 1. The Awake System Administrator Incident The Incident and its Resolution The last day of February 1999, networking staff detected unusual network activity in a router servicing one of the campus buildings. They informed security contacts in that building, asking them to look into the activity. Around the same time, America On Line (AOL) contacted the networking staff about a DoS attack being launched from the university at their network, which turned out to be coming from the same router. The next morning, probes from a remote site were detected on central servers. The activity was reported to the remote site administrators. The system administrator in the building where the network activity was occurring also reported the probe, and that he'd found three compromised machines in the cluster he supports. One of them had been used to launch the DoS attack on AOL. The system administrator decided not to take the time to locate additional compromised machines. Instead he worked to perform a complete reinstall of all of the machines in the cluster containing the compromised computers. In total, thirteen machines were reinstalled and upgraded over the next several days. Later that day, the remote site system administrator reported back to the central site that the remote system had been compromised and had been used to run an MSCAN probe against the university domain as well as other external domains. The remote site system administrator sent the confiscated MSCAN logs to the central site with the list of vulnerable machines the probe had found. All of the systems recorded in the MSCAN logs from the remote site were checked for integrity. Sixteen systems in 11 departments were checked, in addition to the original cluster of compromised machines. No additional systems were found to be compromised. Costs and Incident Implications The total cost of this incident and its resolution is approximately $3,700. In general, the implications of the Linux crack at this university were for the users in the cluster with the 13 compromised machines, and for their system administrator. System administrators for the other machines reported with the vulnerability in the MSCAN had to check their systems for integrity and resolve the vulnerability to prevent future compromise. After the incident was resolved, central security staff sent a general bulletin about the Linux system compromises to all department security contacts. The bulletin included guidelines for checking and ensuring the integrity of such systems, information about what to report in the event of a problem, and what system release/patch level they should have installed. These guidelines were sent with instructions for contacts to distribute the bulletin to all system administrators in their department. Workers' Costs A total of four employees reported that they spent 56 hours resolving the IT incident, with a total cost of $3,700. Most of the staff's time was spent identifying, resolving, and investigating the incident. The system administrator spent approximately 40 hours resolving and fixing the hacker attack.
60
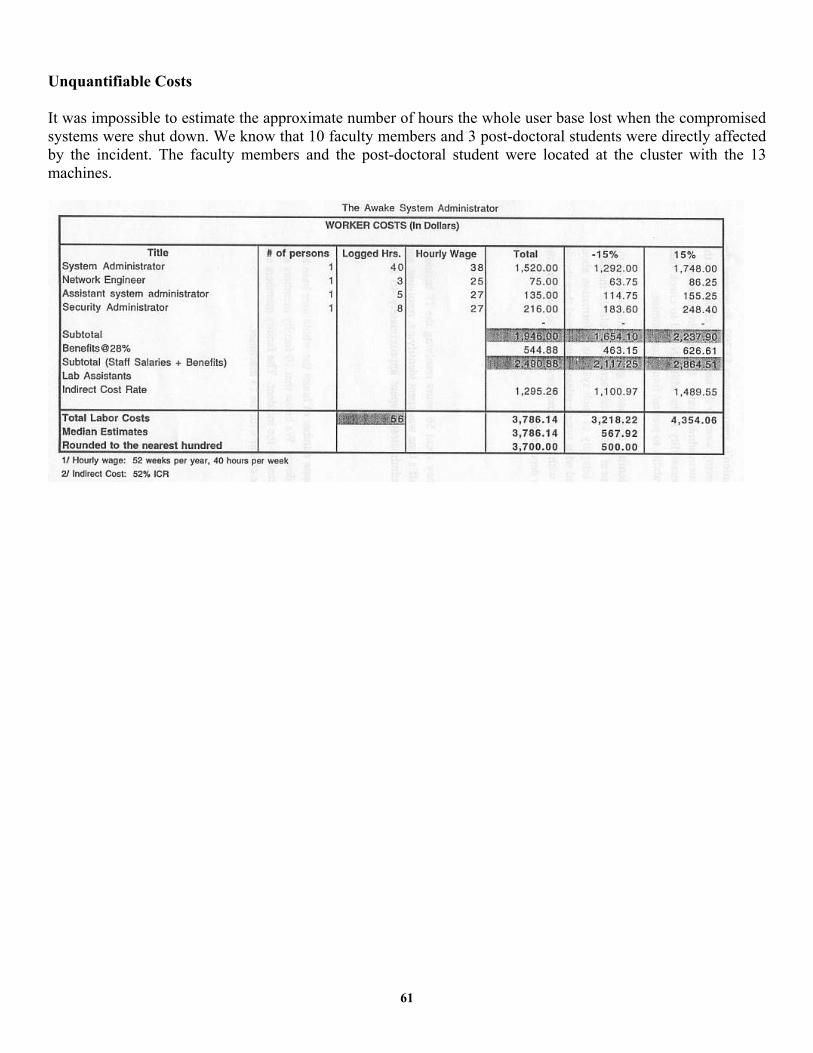
Unquantifiable Costs It was impossible to estimate the approximate number of hours the whole user base lost when the compromised systems were shut down. We know that 10 faculty members and 3 post-doctoral students were directly affected by the incident. The faculty members and the post-doctoral student were located at the cluster with the 13 machines.
61

2. Be Aware of MP3 Sites! The Incident and its Resolution Early in 1999, the Recording Industry Association of America (RIAA) contacted the computing services abuse complaint coordinator regarding a copyright violation. The RIAA explained to the coordinator that someone was illegally using an MP3 file and that they had identified it coming from one of the university's IP addresses. The coordinator at the university identified and verified the IP address given by the RIAA. The coordinator learned that it corresponded to a student on campus. Following the policy, the coordinator asked the policy advisor and director for some advice and, according to policy, forwarded the information to the judicial administrator in charge of contacting the student. The judicial administrator contacted the accused student by E-mail, asking him to remove all the material from the web page within 24 hours and to contact them as soon as possible to schedule a meeting. The student met with the judicial administrator and explained that when he designed his web page with MP3 links, he was unaware that he was violating any university policy. The judicial officer explained to the student that the punishment for using MP3 files improperly was 40 hours of community service, a disciplinary report, and a probationary period until the student graduated from the university. Once the student removed the MP3 file from his web page, he contacted the judicial administrator, who then contacted the staff technician to verify the student's action. After verification, an E-mail was sent to the RIAA. The case was closed after the student completed the community service. Before this incident occurred, and after the increased frequency of MP3 site violations, the university had developed and implemented a policy to address copyright violations. The RIAA sent its first complaint letter to the University President. Since the implementation of the policy, the RIAA and the university maintain contact by E-mail. Institutions choosing to comply with the Digital Millennium Copyright Act (DMCA) are required to provide a web page that receives and forwards copyright infringement complaints. During the ICAMP interview, the university judicial administrator explained that the homepage of the university now includes a link advising students with complaints how to notify the university of an alleged infringement. Administrators explained to ICAMP that, after the first MP3 site violation, which involved the RIAA letter to the President of the university, they developed an educational video for staff, faculty, and students so they are informed about handling MP3 violations. Costs and Incident Implications This incident and its resolution had an overall cost of $300. The implications of the incident are for the student and the judicial administrator's department. The latter handled the contact with the student and the follow-up, explaining all the implications of the student's actions and ensuring student compliance with university procedures. Workers' Costs
62

The total number of hours involved in resolving the incident was 6.5, with a total cost of $300. Existing policy minimized the amount of effort required to find a solution to the problem. It should be noted that an increased workload and reduced staff required the judicial administrator to delegate the incident to her assistant. User Costs It was difficult for the staff involved in the resolution interviewed by ICAMP to determine the number of hours the student spent in downloading the MP3 files, and in meeting with the Judicial Affairs office. For these reasons it is impossible for ICAMP to determine the number of hours lost by the student in the resolution of the incident.
Be Aware of MP3 Sites!
63

3. The Bungling Hacker The Incident and Its Resolution One evening in June 1999, a network engineer received an E-mail from a system administrator at another university notifying him that a server was being used on his campus to hack into their system. The next morning, the computer laboratory identified the compromised Sun system and how the hacker gained access to the server. Using a sniffer, the hacker gained root access to the server through stolen passwords. He then replaced the original login code to give him access in the event that his original break-in was detected. In his attempt to outfox the university network staff, however, he ended up outsmarting himself. The new login code was faulty and ended up locking him out once he exited the server. Before he logged off, though, the hacker used the server to hack into several other institutions, including several for-profit companies. The following day, engineers pulled the box for repairs. It was estimated to take 16 hours to reinstall the server software. Since root access was achieved, the system was a wash. Therefore, the largest cost component of this incident came from the time required to reload the server's software. The compromised server was an experimental machine that was used for multi-media and multicast content. Due to the timing of the attack - early summer after classes had ended-- and the experimental nature of the server, there was little impact on the university environment. Network engineers believe, however, that if the server had been online and in use by the faculty and classes, the impact of the attack would have been substantial. Costs and Incident Implications Our analysis reveals that this incident cost the university approximately $1,000. As a result of this incident, the university's system administrators recognized the need for tighter security around the compromised server and, at the time this report was written, were in the process of updating their security.
The Bungling Hacker
64

4. A Case of Mistaken (and Obstinate) Identities The Incident and Its Resolution According to this university's network security team, intellectual property copyright violations on the campus network are discovered by indirect information before contact by a copyright owner's legal representatives. In roughly half of all the copyright violations this university dealt with in the past year, students or staff outside the computer security team had tipped off security personnel. In this incident, however, computer security staff found an illegal site with pirated music. This case was trickier than usual because the student was running a web page with the musical contraband off of another student's stolen IP address. Initially, there was confusion as the network security staff and the network manager worked to sort out responsibility for the illegal web site. During this time, the web site was active for an additional ten days. They eventually traced the web address back to the originating dorm room, and once the specific address was located, the offending student's IP address was removed from the network. At this point in copyright violation cases, it is up to the students to make the next move-they either realize they have been caught, or they contact the network administrator to determine why their network access has been cut. In this instance, the student contacted the network administrator, who then referred the student to the associate provost of information technology. Eventually, copyright violation cases are passed on to the dean of students where the issue is settled and, in most instances, the student's network address is re-connected. In this case, the student was unrepentant and his or her network connection was left disabled. Costs and Incident Implications Our analysis shows that this incident cost the university an estimated $900. While the copyright violation was not unique to this incident, network security staff admitted that they had difficulty locating the actual address for the offending web site and identifying the actual guilty party. As incidents of this type-where students disguise their illicit behavior behind stolen addresses-have become more frequent within the last two years, the university has initiated a response -- all dorms on the campus network will be switched for improved tracking precision. As for the frequency of MP3 and other intellectual property copyright violations, staff purported that incidents are on the rise. Within the last academic year, network security has dealt with six violations. Finally, network security staff stated that few proactive steps could be taken to reduce copyright violations on the campus networks. They offered IT ethics education at the start of school for incoming students -hoping students who were unaware of copyright laws could be informed before they inadvertently break the law. In the end, though, staff was skeptical that an education campaign alone would dissuade the most determined violators. Workers' Costs Five staff or upper-level university administrators were involved in the resolution of this incident for a total of approximately thirteen hours. University staff averaged the hourly wage for all positions at $36 per hour. Users' Costs
65
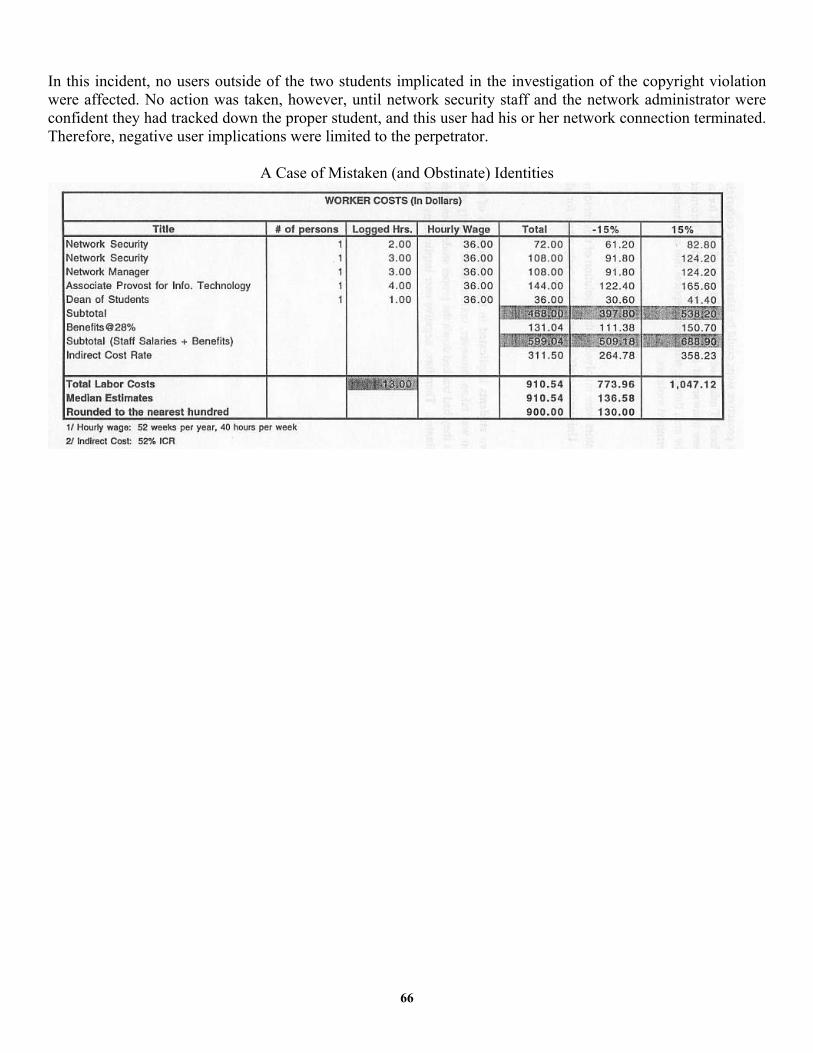
In this incident, no users outside of the two students implicated in the investigation of the copyright violation were affected. No action was taken, however, until network security staff and the network administrator were confident they had tracked down the proper student, and this user had his or her network connection terminated. Therefore, negative user implications were limited to the perpetrator.
A Case of Mistaken (and Obstinate) Identities
66

5. The Expert's Lying The Incident and Its Resolution In the winter of 1999, a student from a residence hall called the IT security division to learn if someone was running NetBus on his computer. This residence hall was located on a remote campus, far removed from the IT-security division office. The security manager remotely scanned the suspected compromised machine, searching for NetBus, and then helped the student to remove the trojan, and patch the hole. From the scanning process, the security manager learned that someone had hacked into two other machines at the remote campus. When the owners were notified, they confirmed the person who had seized remote control of these computers via NetBus had also inserted other files on the systems without permission of the owners Before cleanup began, log files from the systems were preserved. The process identified that the origin of the attacks was another student residence hall machine at yet a third campus (neither the main campus where the security manager was located nor the remote campus where the compromised machines resided). The university security process for this type of incident dictates that a search warrant must be executed in order to examine a student's residence hall machine. (A residence hall network connection can be disabled without such a step being taken, but actual physical examination of the machine requires a search warrant.) Therefore, because it appeared that criminal action might be pursued, when the security office learned about the incident, they notified campus police at the main campus. The remote campus police branch obtained the proper legal documents and a main campus police officer accompanied a security office representative to the remote campus where the search warrant was to be executed. (The travel time each way to the campus-with the suspect's machine was approximately three hours.) The machine was taken into police custody in accordance with the search warrant for any forensic examination and future action that might be needed. While at the site, the police officer and the security manager conducted a scan and learned through the scan and subsequent discussion that the campus network administrator had two students scanning for NetBus using administrative machines, allegedly without intending to create a problem. The scanning was supposedly a regular task. However, the scans being conducted extended well beyond that campus's network address space and included other campuses. The security manager was not sure whether to completely trust the campus network administrator based on past incidents involving the campus that had gone "unresolved". No known break-in or file modification was associated with the scanning by the student employees and their machines were not linked to the original NetBus reports. The security manager called a meeting with technicians and an incident response analyst to resolve and close the incident. After discussion, the group decided to remove NetBus from the two machines used by the students in the network administrator's office. The network administrator and the student employees were advised of university policy that requires specific permission of the security manager to perform any security scan of machines they did not directly administer. The residence hall student who had deliberately accessed the other remote campus students' machines and implanted files/modified system configurations without permission was ultimately prosecuted. The security manager explained that this type of incident routinely takes a few hours to resolve, but this particular incident was more complicated. It involved three campuses, conflicting and incomplete information, and possible issues involving employee misconduct. (though there was insufficient evidence to pursue the latter).
67

Costs and Incident Implications The incident's resolution cost $850. The incident was atypical for the IT security division staff members. The machines of three students and two technical support staff were compromised. It required meetings to develop a plan for investigation and eventually to decide on appropriate action. It also required time to execute and analyze scans. Workers' Costs Five university employees and two police officers were involved in the resolution of the incident; a total of 16 hours were expended at a cost of $830. The security manager spent most of their time traveling between campuses, scanning student machines, and meeting with security technicians. Other IT engineers spent time scanning the administrator's machines. Users' Costs The student from the resident hall that contacted the security manager was the most affected. The student spent approximately 4 hours for a total cost of $20. Total Costs The total cost of the NetBus incident was $850. Unquantifiable Issues Two other students were affected by the NetBus attack. They called the security director to inform them of the incident and to get advice about resolving it. However, we could not estimate how many hours these students lost in the process or how much data they lost. Another unquantifiable issue is the data lost from the student that was initially hacked. It was impossible to determine the cost of this data.
68

The Expert’s Lying
69

The Expert’s Lying
70
6. The Jumping Hacker The Incident and its Resolution Hacker activities are common in the academic environment. On the campus where this incident occurred, 70 annual attacks were average. Typically, hackers would attempt to gain access to vulnerable Linux or UNIX machines. Network engineers were performing scheduled nightly security scanning when they noticed hacker activity. Someone in an upstream domain had hacked into a desktop machine that was used as a launching pad to compromise the university's. principal campus -computer system. Though the incident happened several hours earlier, the network engineer closed the hole within 15 minutes of detection; they required an additional 15 minutes to clean up the machines. By this time 14 hours had elapsed since the original detection of the hacker activity. The hacker first logged into a single machine and from that machine compromised access on another machine. Both machines were from different university campuses; neither machine resided on the campus where the network engineers were located. Once logged into the second machine, the hacker began sniffing for academic directories, using a cover to conceal his identity. He also installed a password sniffer that consequently captured ten user passwords during the 14-hour period. The network technician required the ten users of the compromised accounts to change their passwords. Network engineers determined that the hacker was working from the domain of a non-profit organization in Southern California and was trying to connect to a government institution. The peculiarity of the incident is that the hacker used sophisticated processes by means of large server facilities. It appears that he sought root access that he had identified in advance, and then quickly launched attacks from the compromised root. The hacker studied the behavior and usage patterns of the user of the primary compromised account before the attack was launched. The hack was premeditated and well planned. Costs and Incident Implications The incident cost and its resolution was $1,800. No new procedures in the manner in which the network manages the situation were taken. The engineers were performing regular scanning; this allowed them to identify the attacker and quickly address the incident. Workers' Costs The total cost for the staff managing the network was $1,000 with 18.5 hours expended in the resolution of the incident. Two network engineers, two security computer staff, one telecom network security staff, and two senior system administrators were necessary to resolve the attack. Users' Costs Ten users' accounts were compromised: one professor's account, three graduate students' accounts and six other students' accounts. Most affected were the professor and the graduate students, who were writing academic papers and lost time and data. The three graduate students lost approximately eight hours each. The other six
71

students, who were impossible to categorize as undergraduate or graduate, lost on average 30 minutes. Overall, the users lost a total of 16.5 hours with a total cost of $813.
The Jumping Hacker
72

73

7. The "There & Back Again" Hack The Incident and its Resolution Just a few days after the new year 1999 begun, a hacker broke into two Linux systems that were in a school library. The hacker used a sniffer program to steal two passwords, both from the library system manager. The manager received a call from a network staff member advising him to look into one machine that was vulnerable to hacker attacks. The library uses a vulnerable version of NFSD. Two days later, the manager received a call from a university saying that another server was being used to attack one of his machines. The system manager and his assistant began to log activity on the two machines. The manager found that the hacker broke into the library first, then into two other universities, and finally into a private consulting firm. From one of these two universities, the hacker broke into the library again. In a peculiar twist, this was a vice versa breach. Costs and Incident Implications The cost of the incidents and its resolution was $3,500. The manager and his assistant spent two whole days scanning, cleaning and reinstalling the Redhat Linux 5.2. The system manager knew that library system was vulnerable, but never realized how important it was to change it after the incident occurred. As a consequence of the incident he had to convert the Linux operating system into a NT version. The Linux crack had implications for the library resources, for the private consulting firm, for the students who were trying to access the library system, for other users from other universities. Workers' Costs In the Linux crack three employees were involved, two from the library and one from the network security staff. Although more employees were involved from different institutions they are not counted in this cost analysis. They are not part of the university cost in the resolution of this incident. The staff from the school library and the user advocates put in a total of 80 hours of work, with a total cost of $3,500. Unquantifiable Costs Although the incident implies that students and other users could not access the library system, it was impossible to determine how many users and how much hours they lost in the process.
74

75

8. The Pinging Linux The Incident and its Resolution On March 4, 1999, at 2:30 p.m., multiple network and system administrators contacted the Network Operations Center (NOC) and a campus security discussion list claiming that hacker activity was taking place on their computers. A hacker who made several attempts to break into the university's computers used a student's computer connection to the university network as a back door. Following the initial call to the NOC, approximately eleven more campus network administrators called the NOC or posted statements to the discussion list complaining about hacker attacks on their computers. The system administrator called a network technician to report the hacker attack, so the technician could verify the incident and take steps to resolve it. Unfortunately, the weather was inclement and most of the staff members of the IT department were gone for the afternoon. It was not until 5:00 p.m. that the administrator could reach a network technician, so that he could proceed to shut down the port to avoid further attacks. The network connection was shut off approximately 1/2 hour after the reports were received, probably within the hour. It took longer to contact the student, since the staff who support the networks in the residence halls could not be reached right away. They usually handle incidents involving students. The easiest way to prevent a hacker in this situation was for the student to turn off his machine. The NOC attempted to reach the student to inform him to turn off the computer, but the student was away from his room. The administrator then reported the incident to a campus police officer. In the past months, the system administrator had been in touch with the police officer for other incidents. As such, the police officer knew that he should contact the student. The police report occurred the following day. Meanwhile, once the network technician was contacted, he had to verify the log to confirm claims of the hacker attack. By looking at the log he found that the port was being attacked from Swedish ISP. The normal procedure was to shut down the port, take the system offline, and input the patches. After doing so, the technician investigated the other eleven reports of attacks, to determine if they were related to the initial incident or if they were unrelated. He determined that the hacker first compromised a Linux machine (the machine belonging to the first student), and then the other machines. The hacker accessed the university system through the Linux machine by pinging the network with a short message to verify whether the machine was active and operating. When the student's machine received the ping, it pinged back to the 10 departmental campus systems and retransmitted the message to the Swedish account The resolution of this incident took up to six months to close. The Swedish ISP, from which the intrusion originated, did not respond in the days following the incident, rather, it took several months. The network technician explained that this type of incident normally takes just a few hours to resolve. They do not wait to contact the student that complained; they usually shut the system off and apply the fix. However, the weather impeded the communication between the campus administrator and the network technician. The delay was in getting to the student to notify him/her that the connection had been shut down. They usually try to contact the student or system owner first and advise that the system be taken off the network. If the owner or responsible person cannot be reached immediately, the port will be shut down. Recently, technicians have been able to apply access filters to restrict traffic from the offending site, eliminating the need to shut down network connections.
76

Costs and Incident Implications The cost of the incident and its resolution was $900. The implications of the Linux Crack for this university were the time lost by the IT staff members logging and responding to the incident, as well as for the students and other campus users that the hacker attacked. The campus administrator, the campus police officer, and the network technician gained a better understanding of Linux attacks. As a consequence, they are focusing on enhancing the procedures to resolve this type of incident, including how the campus police should be involved. Also, they have taken further steps to determine who should receive reports of scanning, identify sources, and block IP addresses. Workers' Costs Five university employees were required to resolve the incident, with an input of 15 hours and a total cost of approximately $900. Most of the employees' time was spent in looking at the log, investigating and contacting the users involved in the hacker activity. Unquantifiable Costs Eleven campus systems were affected in the incident: the student that initially reported the incident and the other ten departmental users that were the target of the ping attack. The initial student lost the majority of the time: he was denied service for one day, the day of the incident attack. He had to wait for the campus administrator and network technician to communicate, and for the network technician to apply a patch. The network technician explained that the other ten departments were affected marginally, but only by the pinging process.
The Pinging Linux
77
9. The Possessed Mouse The Incident and its Resolution Two female students were having trouble with their computers, but they were unable to identify the cause of the problem. Both students thought something "supernatural" was happening to their computers, perhaps some kind of "possession", they explained. According to them, whenever they accessed their computer, it behaved by itself, moving the mouse erratically, randomly opening and closing programs and files. After several days, both students asked a friend about the possible source of the problem. The friend suggested that their computer might be infected with some kind of Trojan Horse. At this juncture, a hacker began harassing the two students by making the mouse move and closing windows the users were trying to open. They became afraid and called the campus police to notify them about the incident. The campus police responded immediately, but unfortunately, they did not know what to do. Afraid, the girls decided not to use their computers in the following weeks. In addition, they avoided all computers, even those belonging to friends. This incident affected the students psychologically. Through a friend of a friend, the affected students learned that the university's incident response team could help them with their computers. The students then contacted the team. The network engineers spent two days resolving the incident. They interviewed the students to learn details about the incident. Then they proceeded to scan and clean the students' computers. After the network engineer learned about the Trojan Horse, they explained in detail exactly what had occurred. The Trojan Horse is a relatively complex program used by crackers and administrators of Windows systems, allowing them to take control of another user's system. An apparently innocent program, it is designed to circumvent the security features of a system. Such a program must be given to the user of the system in order to breach his/her security. In this instance, it was clear that the cracker was behaving maliciously and deliberately. The network engineers explained later that the students got the virus from someone's floppy disk, and suggested that, in the future, the students take further measures to prevent this type of incident (i.e., scan any floppy disk before downloading anything from it to the hard drive). Costs and Incident Implications The total cost of the incident and its resolution was $1,746. The implications of the incident were for the students and for the network engineers. Both students and network engineers learned more about the threats of viruses in the academic environment. The students learned about preventative measures such as scanning the floppy disk before downloading any information to their own computer, or to someone else's computer. The network engineers learned how to identify, solve, and proceed when a Back Orifice virus is identified. The campus police officer learned to whom they must direct IT incidents on campus. Workers' Costs Two network engineers and one campus police officer were required to resolve this incident, for a total of 29 hours and $1,300 in cost. Most of the network engineer's time was spent in learning how the Trojan Horse worked, and how to delete it.
78
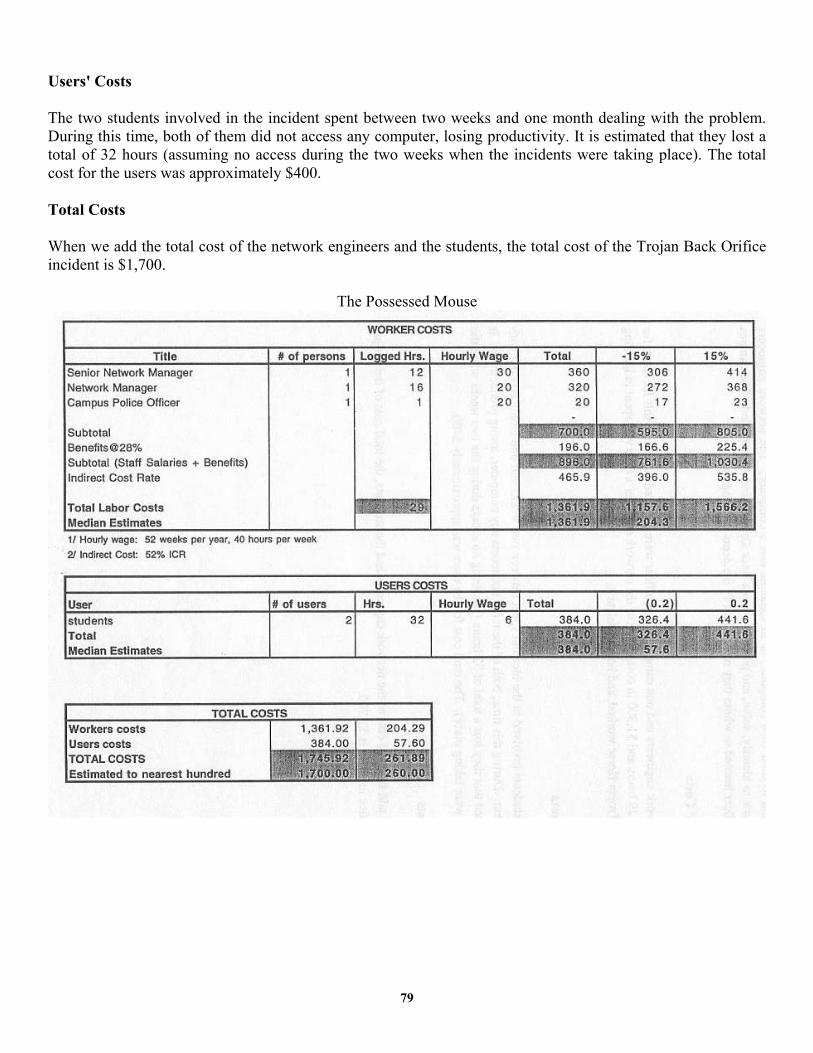
Users' Costs The two students involved in the incident spent between two weeks and one month dealing with the problem. During this time, both of them did not access any computer, losing productivity. It is estimated that they lost a total of 32 hours (assuming no access during the two weeks when the incidents were taking place). The total cost for the users was approximately $400. Total Costs When we add the total cost of the network engineers and the students, the total cost of the Trojan Back Orifice incident is $1,700.
The Possessed Mouse
79
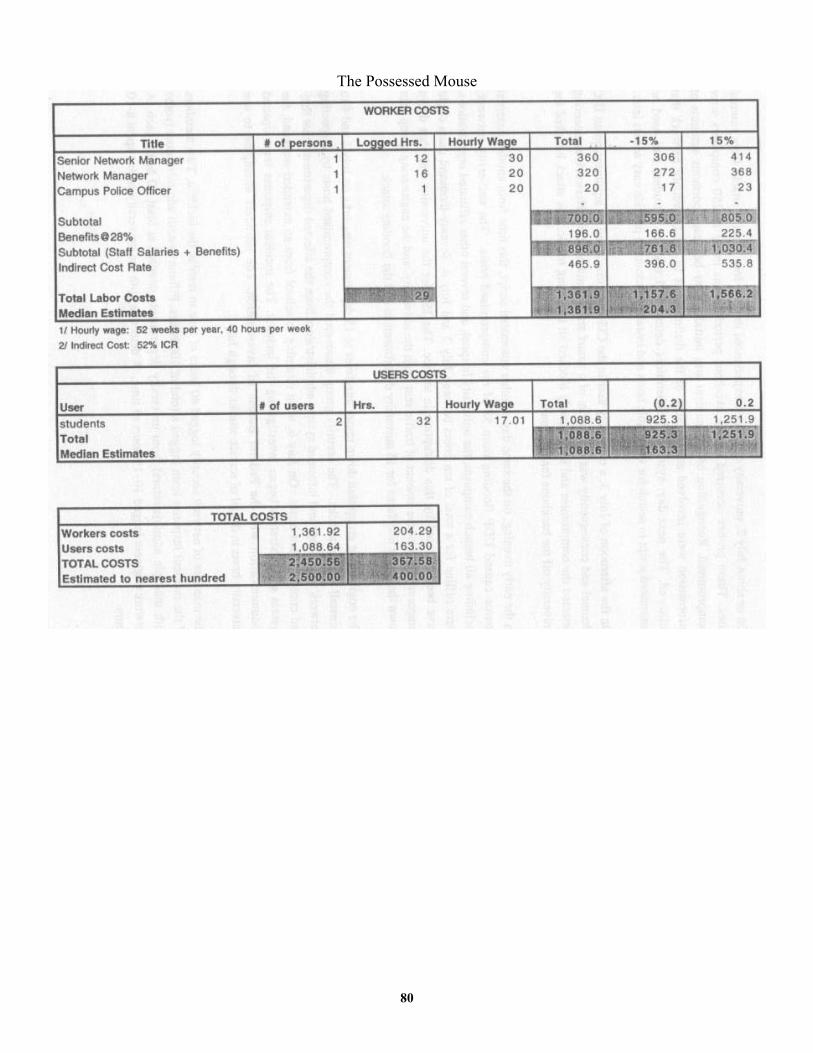
The Possessed Mouse
80

10. Post Fourth of July Fireworks The Incident and Its Resolution On or about July 2, university computers experienced three or four probing attacks from external sites. These probes occurred over a two-hour period and as many as 250 computers were compromised. Recognition of the incident was initially slow because enormous amounts of information were involved and because of the disturbances to the University network that followed. The next day, system administrators determined that the intruders had used an automated script to search for vulnerable hosts and install backdoors to provide easy access later. On the afternoon of July 3, a university user in the CIS department had an argument on an IRC channel and consequently was the victim of a smurf amplification attack. Network engineering detected the compromise and immediately blocked all incoming traffic. The attack knocked the university off the backbone for two hours. In the early evening, on the same day, another automated script, this time from another external source caused UDP flooding from 53 of the compromised hosts. The university network, including all branch campuses, the university hospital, and several other affiliated organizations, were offline for a total of ten hours between July 3 and July 4. Seventy-thousand users could have been affected by this disruption in service. The ISP for the university was shut down temporarily due to the amount of traffic sent from the university, and the engineering group shut down the router interfaces for 15 university departments to end the flooding attack. The engineering group shut down router interfaces to 15 department networks on July 3 and 4 to forestall further attacks. The security group discovered the compromised hosts by inspecting network traffic logs and informed system administrators from the affected departments that they had compromised hosts. On July 6, upon returning to school from an extended weekend, the system administrators began investigating the incident. The incident response team opened communication with the Federal Bureau of Investigation. The intruders attempted to use university hosts in denial of service attacks through July 7. The manager of network security logged 40 hours of time to resolve the incident. Two members of the incident response team logged a total of 100 hours. Fifteen system administrators (some with multiple administrators) from university departments devoted at least 40 hours each. A network engineer logged 10-15 hours of time. A detective with the university police spent 8-10 hours. Costs and Incident Implications Our analysis reveals that this incident cost the university an estimated $41,000. This figure includes the significant workers' costs. Worker's Costs Twenty-four university employees were involved in the resolution of the incident. Based on their reported log of time and wage rates, according to the director of network security, we determined that 195 hours were spent in resolution of the incident at a cost of $4 1,000. User Costs According to the director of network security, approximately 70,000 have access to the network. Since the incident occurred on a holiday weekend, during the summer break, the number of users affected by the
81

disruptions in service is impossible to quantify. It is also difficult to quantify the types of users and, as such, we are unable to consider user costs. Unquantifiable Costs The salary of the police investigator involved in the resolution of the incident is an unquantifiable amount because we were unable to obtain the amount of his salary from contacts at the university to accurately determine the amount of his salary.
The Post Fourth of July Fireworks
82
11. Searching for Warez Material The Incident and Its Resolution In May 1999, a hacker external to the university launched a scan across the campus looking for write-able FTP directories. The goal was to find sites that could be used to relay Warez. In the end, three different hosts for Warez were uncovered. Consequently, each host had several megabytes of Warez material uploaded. The following day, the university's computer security team detected the problem in the previous day's scan and notified the administrators of the three compromised hosts. The system administrators then purged the machines of the Warez material. Several days later, the security team informed both the affected ISP and the Australian Computer Emergency Response Team (AUSCERT) of the incident. Costs and Incident Implications Our analysis shows that this incident cost the university an estimated $200. Though the relative costs of this incident are small, the fact that the university's computer system was used to illegally distribute software negatively impacted the institution's reputation. Though this incident did divert staff time away from other projects in order to clean the affected machines, the most damaging aspect of this case was the impact it had on the university's reputation. In short, the hacker obtained illegal access to the institution's computers and used the university's computer system to illegally distribute software. Workers' Costs Four employees resolved the incident, for a total of 4.5 hours and total cost of $200. The employees scanned and purged the machines from the Warez site. Users' Costs In this incident, no users outside of the system administrators that had to clean their machines were affected by the uploading of Warez content. Therefore, their time has been included in the workers' cost analysis.
83

Searching for Warez Material
84

12. Server Sniffers The Incident and its Resolution In May 1999, system administrators at an East Coast university in charge of two servers received notification that accounts on their system had been compromised. A random security scan found sniffers placed on 24 of the university machines. In tracing the digital trail of the hacker, administrators were led to a remote site in Brazil. Upon further investigation by the East Coast institution's team, they also discovered the same hacker connecting via the remote site in Brazil to academic institutions in New York, Massachusetts, Maryland, Japan and Brazil, as well as private corporations. Several machines were compromised. The two university servers were among a list of 50 compromised machines that might have been "sniffed." The East Coast institution had reported 24 university student and staff accounts that had been compromised (i.e., login identification and passwords had been obtained by the hacker). Immediately, the system administrators ran multiple checks on their machines, notified other system administrators of possibly compromised machines on the campus, and contacted the campus incident response team to assist in resolution of the incident. It was estimated that many university accounts were compromised. Due to a lack of sufficient resources, the plan of action was to clean all accounts on various machines suspected of compromise and reissue new passwords. The campus incident response team immediately logged the incident and coordinated the disabling of all the compromised accounts and the issuing of new passwords. All users with compromised accounts had to be contacted by phone for the re-issue of account passwords. It is known that this type of incident happens occasionally on the campus, however, exact numbers of occurrence were difficult to obtain. Costs and Incident Implications The total cost of this incident was difficult to assess. The project team investigating this incident had difficulty gathering information. In addition to student accounts, it is suspected that a number of faculty accounts were compromised. However, given that the exact number of compromised accounts was difficult to obtain, we could not quantify this cost. We obtained an estimated annual salary for faculty of $50,000, but lacked the number of faculty compromised to calculate incident cost for them. The campus incident response team did have an incident database, but it had not evolved to the stage where it was logging the number of affected users. Also unknown is the extent to which communications or transactions were compromised as a result of the fact that someone else had access to the user ID's and passwords for several accounts; however, no further incidents or evidence of misuse were reported. Workers' Costs In analyzing the costs accrued by the university through lost wages/hours, we obtained the names of people most directly involved in the incident's resolution. We multiplied their respective wage rates by the logged hours to obtain an estimate of total worker cost. This estimate is $2,700 for 61 total hours.
85
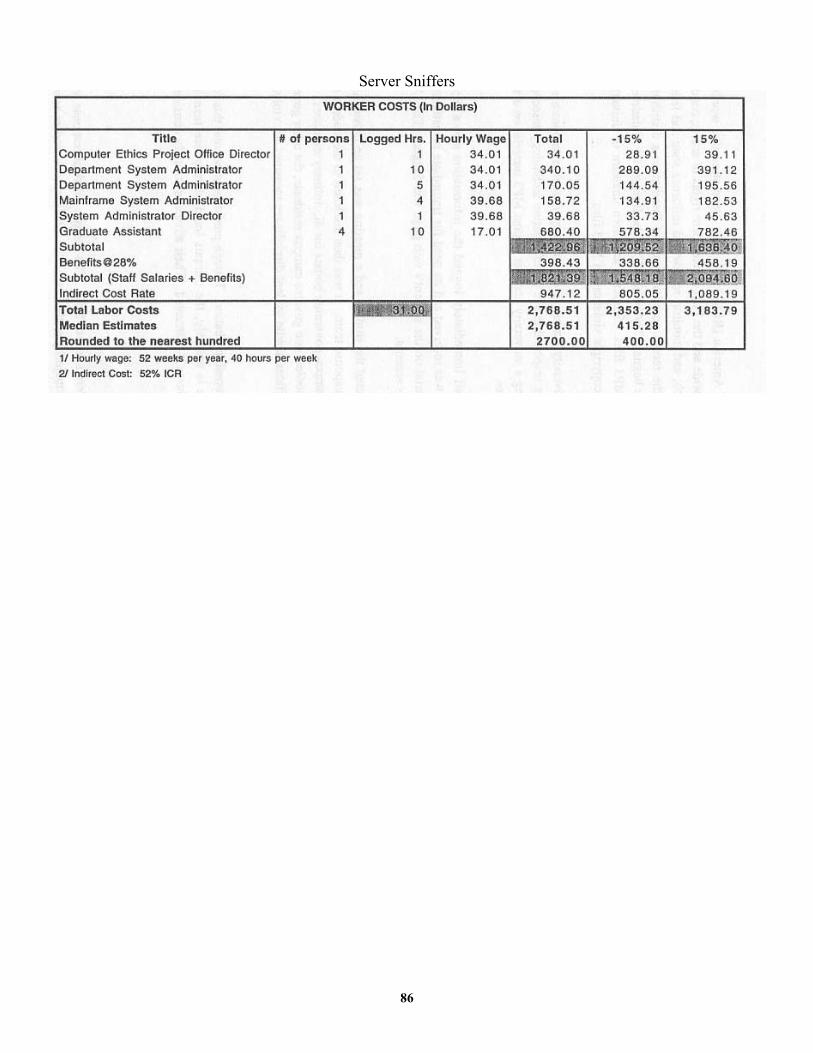
Server Sniffers
86
13. A Standard Day's MP3 The Incident and its Resolution The Recording Industry Association of America (RIAA) is a trade association that works to protect intellectual property rights worldwide and the First Amendment rights of artists; conduct consumer, industry and technical research; and monitor, review and influence state and federal laws, regulations, and policies. With the recent popularity of the Internet as a distribution channel for the music industry, they have begun a "cyber patrol" of the Internet for violations of copyrighted material, especially with MP3 files. Students are often unaware of university policies and federal guidelines regarding copyright violations of MPI files. In this incident, the RIAA contacted a university's campus incident response team responsible for the enforcement of the policies regarding responsible use of information technology resources. They informed officials of a student using a university account to post MP3 material on a web page that he had just built for public access. The campus incident response team staff immediately logged the information into a record database indicating when the complaint was received and its need for immediate investigation. The URL was investigated and the material on the student's web page was logged. The URL was traced back to the individual student's account. Shortly thereafter, a staff member contacted the student and a meeting was set up between the student and the director of the incident response team. It was then disclosed to the student that he was being referred to one of the on-campus governing bodies for disciplinary measures. (At this institution, there are two governing bodies: one governs campus residents; the other governs students who reside off-campus. Both offices handle student disciplinary measures for violation of university policies.) In this case, the student received a four-month probation. Though punishment beyond this for a first-time offender of this incident type is unlikely, the campus incident response team can recommend additional disciplinary measures if warranted. Their advice is strongly considered by the appropriate governing body. Costs and Incident Implications The incident and its resolution had an overall cost of $200. The campus incident response team and judicial affairs bodies shouldered the majority of the cost. This total includes worker as well as preventative costs. Workers' Costs Three employees were required to resolve the incident for a total of 6 hours and a cost of approximately $200. This institution has a central office to handle incidents of this category as well as an established procedure due to the frequency of MP3 incident occurrence. As a consequence of this policy, the cost of the incident is less. Users' Costs It was impossible for the staff involved in the resolution to determine the amount of hours the student spent downloading the MP3 files, editing his website to comply with University policies, and working with the Judicial Affairs office to resolve the incident. The information was simply not available to the investigative team for this specific incident, because the team never questioned the student involved in the incident.
87

A Standard Day’s MP3
88

14. A Teaching Opportunity Incident The Incident and its Resolution In the winter 1999, the security director of a university received three standard e-mail forms from the Recording Industries Association of America (RIAA) suggesting MP3 site violations at the university. These forms included information about the location of the site. The security director verified the information to be sure that the site was from the university and determined who owned the site. She found that the owner of the site was a student residing in a university residence hall. She sent an e-mail message to the office of telecommunications to shut down the student's residence hall connection, and another e-mail message to the office of judicial affairs to proceed-with student disciplinary action. One of the staff members from the office of telecommunications disabled the port from the student's resident hall connection and notified the security director that action had been taken. Once it was shut down, the security director sent an e-mail message to the office of judicial affairs, informing them which user's connection was shut down. (The Office of Telecommunication is the doorkeeper of the network. They shut down or reconnect at the request of the security director, but they are not involved in the process of investigation). When the Office of Judicial Affairs received the e-mail message from the security director, they interviewed the student to learn more about the incident. The staff member contacted a lawyer from the RIAA to inform them of the actions the university had taken and to learn more about the MP3 site violation. Depending on the gravity of the MP3 violation, the Office of Judicial Affairs will impose a disciplinary sanction on the student. In this case, the Office gave the student a warning notification of what she/he had done wrong. In addition, the student had to demonstrate that they understood the university's acceptable use policy. Once the associate director of the Office of Judicial Affairs is sure that the student has removed the web page. or FTP site with the MP3 site violation and has demonstrated successful understanding of the policy, the Office directs the security director to restore the connection. The security director, in turn, authorizes the Office of Telecommunication to restore the student's residence hall connection. The Office of Telecommunications first receives an e-mail message. Then they call the security director to verify the directive. This procedure ensures authentication. The staff then re-enables the connection of the student. Costs and Incident Implications The cost of this MP3 site violation was $120. The implications of the incident were restricted to the RIAA and to the student that used the MP3 site. The student lost time too. His connection to the network was shut down until he/she removed the web page or FTP site and demonstrated knowledge of the appropriate use policy. Workers' Costs Three staff members from different departments of the university were required to resolve the incident, for a total of 2 hours and a total cost of $120. This type of incident did not require a lot of hours from the university employees, because all the steps to resolve the incident were very clear for each department.
89

Unquantifiable Costs None of the staff members involved in the resolution knew for sure how many hours the student should input to resolve the incident. For that reason it is impossible to determine how many hours the student lost during the resolution of the incident.
A Teaching Opportunity Incident
90

15. The Virtual - Non-Virtual Intruder The Incident and its Resolution In the last week of April, a university security department received a report from a network security administrator that a Back Orifice scan had originated in one of the public computer laboratories on campus. The network engineers proceeded to trace the user ID and his/her domain account. Once the engineers traced the owner's account, the owner denied any responsibility for the scanning. The following night, another scan was reported. Again the domain name was the same. The scan came from the same computer lab. The engineers contacted the user of the domain name, but again they denied their participation in this scanning. At this point, the-engineers explored the possibility that there could be a different explanation for the scanning. The network engineers wrote a sniffer program to notify them when a scan was taking place. A few days passed. One evening their pagers went off, notifying them that the intruder was in action. Immediately, the network engineers called the campus police. When the campus police officer arrived in the computer lab, the intruder was scanning the network. The campus police officer arrested the individual, while the network engineers gathered evidence from the computer and notified users with compromised accounts. The network intruder was not a member of the university community. He was served "no trespassing" papers. This was the first time the campus police officers caught an intruder at the scene of a computer crime, on campus. Costs and Incident Implications The total cost of the incident and its resolution was $400. Most of the implications of the incident were for the university. An outsider was damaging the reputation of the institution by using its resources to break into one small and another large corporation. In addition, the intruder could have damaged the sites he was scanning when he tried to download some information from the other institutions and corporations. The network engineer knew the school's policies well and for this reason the incident was resolved quickly and effectively, lowering the cost of resolution. People outside of the university community cannot use public sites on campuses. The engineers used a sniffer program to identify the intruder and worked in coordination with the campus police. After the incident took place, the engineers developed a new tool to help them identify when an IT incident is occurring. Workers' Costs Five employees, including one campus police officer, were involved in the resolution of the incident, which took 10.25 total hours and cost approximately $400. The network staff spent most of their time scanning and sniffing the university network system searching for and waiting for the appropriate moment to apprehend the intruder. User Costs Although some student accounts were compromised in the incident, there were no reports that indicated that the students spent any time dealing with the Back Orifice. Other users, such as the corporations, were involved in
91

the IT incidents. However, the cost analysis of the university does not include the evaluation of the resolution and cost of the corporations involved.
The Virtual Non-Virtual Intruder
92

APPENDIX D Question Template 1. Questions related to the CAMP project request
a. What type of difficulties are you having in meeting our request for data?
b. What are the problems you are experiencing? 2. Questions related to management of the log and databases
a. Describe the database you use
• What are the headings /fields? • Who and how many people provide input? • How inclusive is it for the campus as a whole? • Who uses the database, technicians or policy makers? • Is the database archived? And if so, for how long?
b. Do you have privacy restrictions on your data?
• Are there attachments to incident entries? • Do you filter/expunge information before sending it to ICAMP II? • What does it take for you to get the data ready for transport?
c. Does your database have categories?
• What types of incidents are included in your categories? • What categories /fields do you use?
d. Who else on your campus handles incidents?
• How do you, or do you, hear about the incidents? • How conclusive do you think your database is? • Do you follow up with other parts of the campus during investigation of an incident? • What percentage of incidents do you feel you learn about and log?
e. Do you routinely accumulate and report incident trends, types, and frequencies?
• To campus departments? • To the chief information officer? • To senior managers? • To others?
f. Is there something that would make the reporting of these data easier?
• If so, what is it?
93

3. Questions related to how database management might be enhanced
a. Having participated in this project, what did you learn about your own system /processes?
b. What would you really like to do differently?
c. What information from I-CAMP II would really be helpful to you?
d. How realistic is it that you will ever want to, or be able to, change your system?
94

APPENDIX E
95
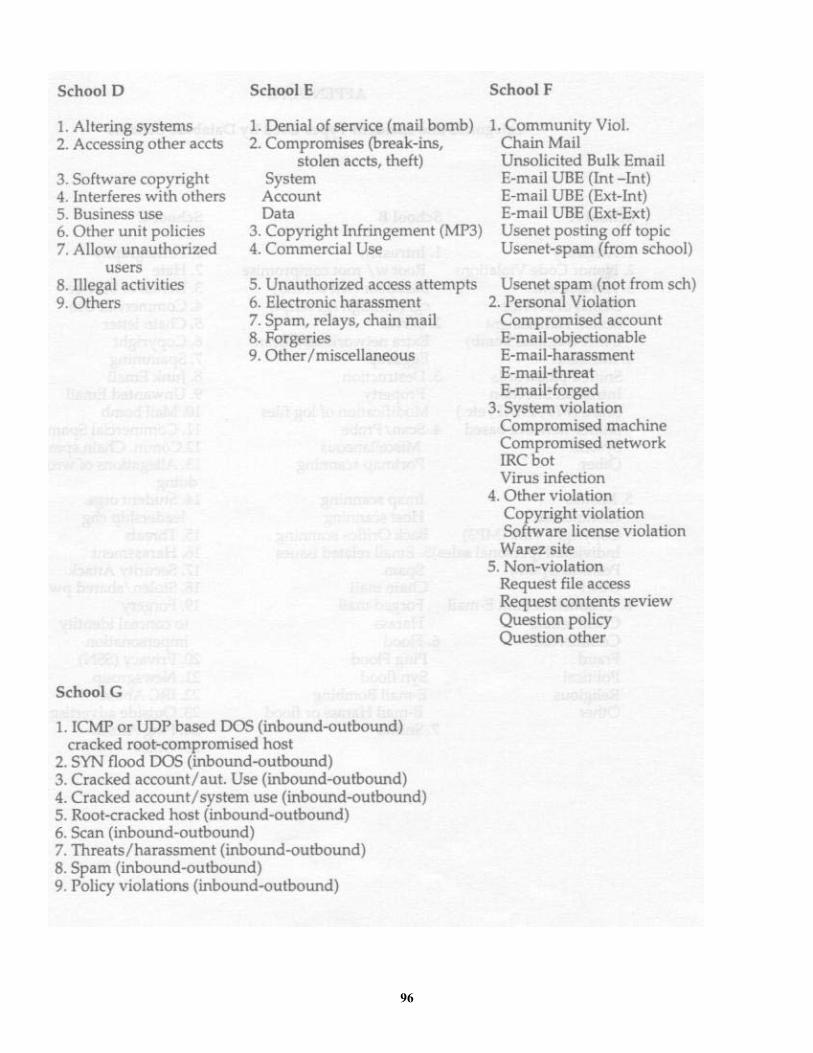
96

I-CAMP II Categorization Fusion 1. Service Interrupts Denial of Service Mail Bomb Ping attacks Multiple request attack Root compromise Packet floods IRC bots Virus infections 2. Computer Interference Port scans System mapping System probe 3. Access w/o Authorization Identity theft Unauthorized release of data Theft or modification of data 4. Malicious Communication Threats Hate mail Harassment mail IRC abuse Flaming directly to individual 5. Copyright Violation MP3 Warez: sites Video copyright Content violation 6. Theft Physical theft of hardware and peripherals Theft of software ID theft Credit card theft Password theft 7. Commercial Use Unauthorized commercial activity 8. Unsolicited Bulk Email Spam Chain mail Mass mail 9. Other Illegal Activities Child pornography
97

98
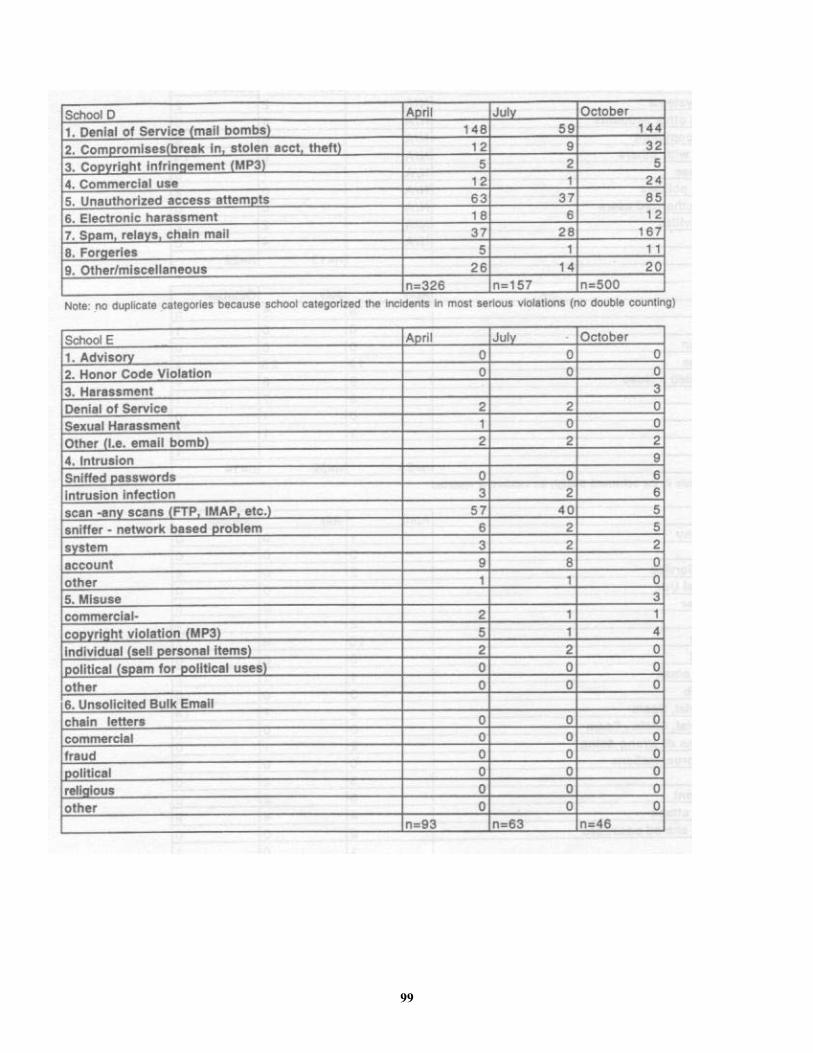
99

100

Appendix G Glossary Some definitions have been adapted from http://webopedia.intemet.com
Client A computer system that requests the service of another computer system using a protocol and accepts the other system's responses.
DoS Denial-of-service attack, a type of attack on a network that is designed to bring the network to its knees by flooding it with useless traffic
FTP File Transfer Protocol, or the protocol used on the Internet for sending files.
Hacker A slang term for an individual who tries to gain unauthorized access to a computer system. Computer enthusiasts use the term to apply to all persons who enjoy programming and exploring how to expand their programming skills. Those who use the broader definition of "hacker" call those who engage in unauthorized activities "crackers."
IMAP Internet Message Access Protocol, a protocol that allows a client to access and manipulate electronic mail messages on a server.
IP Internet Protocol, the network layer for the TCP/IP protocol suite.
IP Address An identifier for a computer or device on a TCP/IP network. The format of an IP address is a 32-bit numeric address written as four numbers separated by periods.
IRC Internet Relay Chat, a system of large networks that allow multiple users to have typed, real-time, online conversations.
ISP Internet Service Provider, an organization that provides access to the Internet.
LAN Local Area Network, a computer network that spans a relatively small area.
Linux
A freely-distributable implementation of UNIX that runs on a number of hardware platforms.
101

Mail Bomb An immense amount of electronic mail sent to a single computer system or person with the intent of disabling the recipient's computer.
MP3 The file extension for MPEG, audio layer 3. Layer 3 is one of three coding schemes (layer 1, layer 2 and layer 3) for the compression of audio signals.
Ping Packet Internet Groper, a utility to determine whether a specific IP address is accessible.
Root Compromise The top directory in a file system. The root directory is provided by the operating system and has a special name; for example, in DOS systems the root directory is called \. The root directory is sometimes referred to simply as the root.
Server A computer system that provides a service to other computer systems connected to it over a network.
Smurf Attack A type of network security breach in which a network connected to the Internet is swamped with replies to ICMP echo (PING) requests. A smurf attacker sends PING requests to an Internet broadcast address.
Sniffer A program and/or device that monitors data traveling over a network. Sniffers can be used both for legitimate network management functions and for stealing information off a network. Unauthorized sniffers can be extremely dangerous to a network's security because they are virtually impossible to detect and can be inserted almost anywhere.
TCP/IP Transmission Control Protocol /Internet Protocol, a suite of protocols developed originally by the Advanced Research Projects Agency and used on the Internet. These protocols include File Transfer Protocol and Telnet.
Trojan Horse A malicious program that is disguised as something harmless.
UDP User Datagram Protocol, a connectionless protocol offering a direct way to send and receive datagrams over an IP network. It's used primarily for broadcasting messages over a network.
UNIX An operating system designed to be a small and flexible. UNIX has become the leading operating system for workstations. The emergence of a new version called Linux is revitalizing UNIX across all platforms.
Warez Refers to commercial software that has been pirated and made available to the public via a BBS or the Internet.
102
Related Documents