1 Inbank AS Company Presentation Q2 2019

Welcome message from author
This document is posted to help you gain knowledge. Please leave a comment to let me know what you think about it! Share it to your friends and learn new things together.
Transcript

1
Inbank ASCompany Presentation Q2 2019
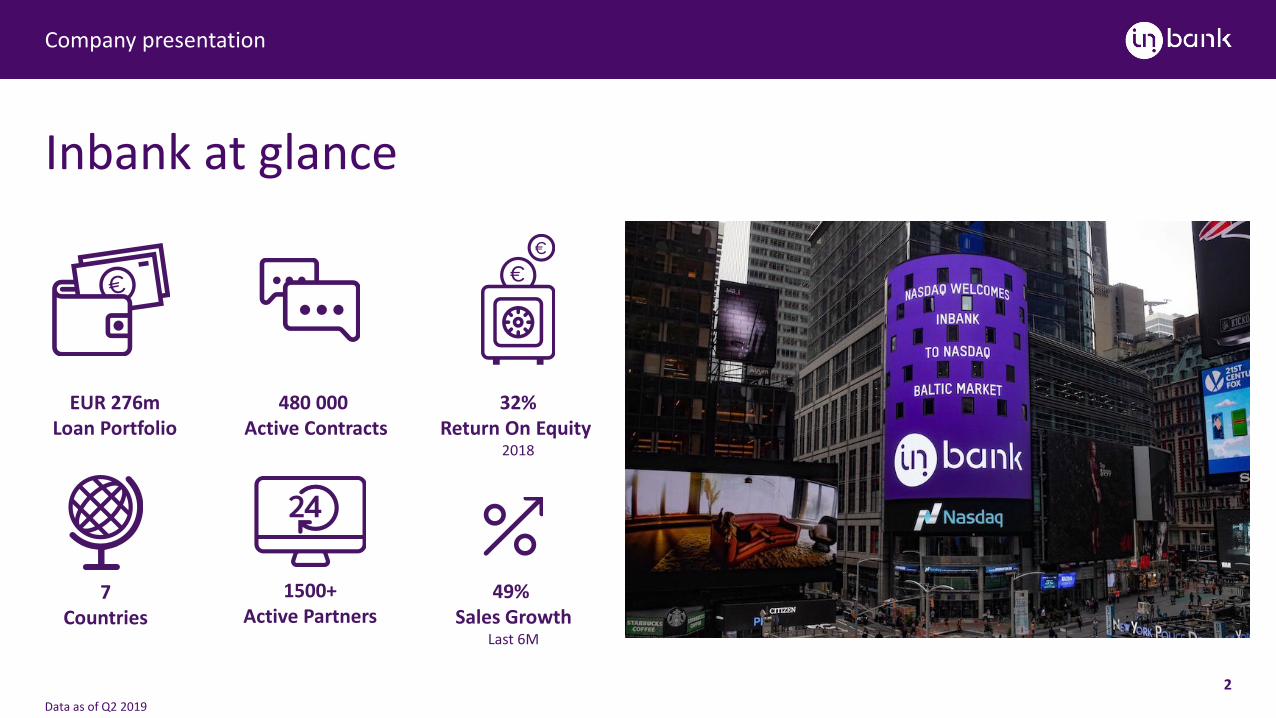
Inbank at glance
Company presentation
2
EUR 276mLoan Portfolio
480 000 Active Contracts
32%Return On Equity
2018
7Countries
1500+Active Partners
49% Sales Growth
Last 6M
Data as of Q2 2019

Group history and structure
Company presentation
3
First hire purchase contract
Co-branded credit cards with Coop retail chain
Joint venture in consumer loans with
Krediidipank
Latvianconsumer
credit market entry
Bankinglicence and rebranding
Auto24.ee partnership
Acquisition of Coop Pank
and sale of affiliates to Coop Pank
Polish branch Mokilizingasacquisition
201720152011 20182014
Financial Investors
66%
Founders & Employees
34%
Owner Shares %
Cofi Investeeringud OÜ 24 635 28,2%
Pershing Hall Holding Limited 23 858 27,3%
Other (55 shareholders) 38 901 44,5%
Group Structure
Co-operationwith Raisin
2016
Shareholder Structure

Activity highlights
Company presentation
4
Sales Finance Integrated financing options for e-commerce Co-operation with PayU in Poland and Bite in Lithuania
Personal Loans Flexible small loans to consumers Tailored conditions depending on the loan purpose
Car Loans Car Loan and Car Leasing Strategic partnership with auto24.ee in Estonia
Deposits Co-operation with deposit marketplace Raisin Term deposits offered in 5 EU countries
28%
42%
30%
PL
122017
239
EE
122018
273
96Raisin
062019
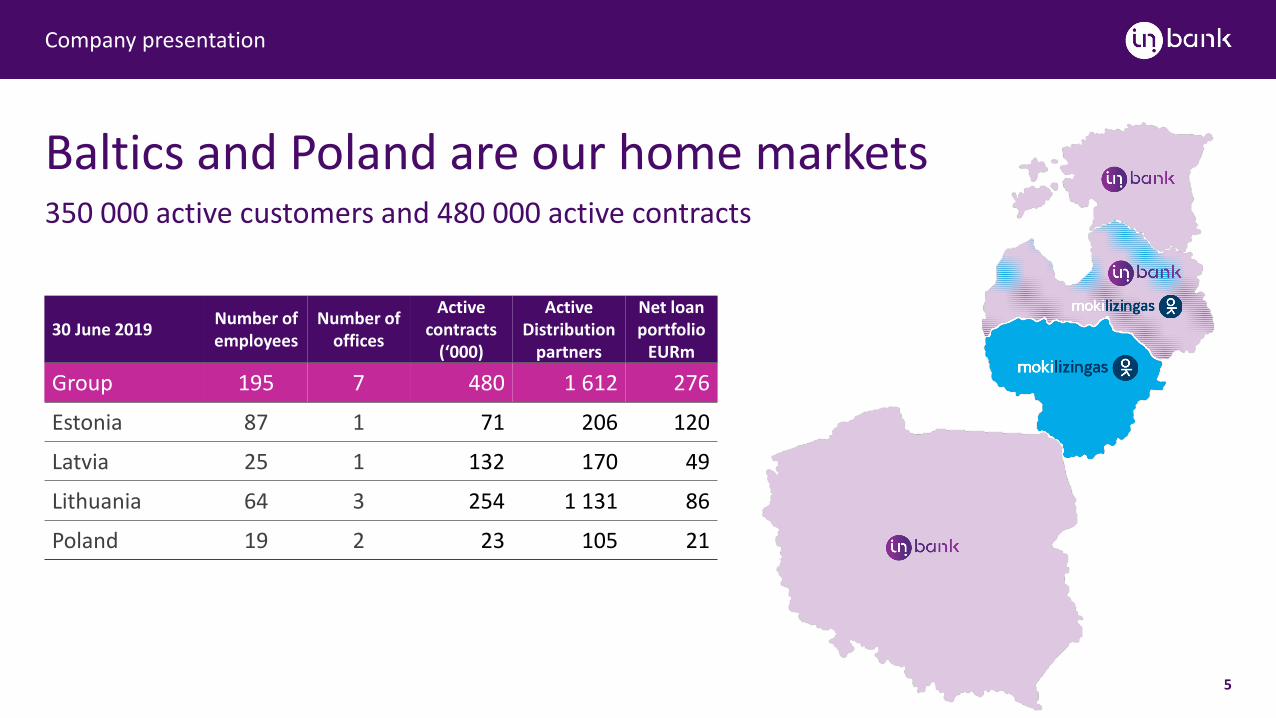
30 June 2019 Number of employees
Number of offices
Active contracts
(‘000)
Active Distribution
partners
Net loan portfolio
EURm
Group 195 7 480 1 612 276
Estonia 87 1 71 206 120
Latvia 25 1 132 170 49
Lithuania 64 3 254 1 131 86
Poland 19 2 23 105 21
Baltics and Poland are our home markets
5
Company presentation
350 000 active customers and 480 000 active contracts

Efficient and automated business model
Company presentation
6
Benefits for Partners
Partner-centric and sector-focused approach Financing solution fully integrated into
partners’ business process through flexible API Repeat sales and greater conversion rates Complementary fee income
Benefits for Partners and Customers
Quick and automated decision-making –credit decision in less than 7 seconds
90% of contracts completed automatically online or at point-of-sale
Benefits for Customers
Flexible product offering with various options for increasing customer purchasing power
All-digital experience convenient online identification and contract signing
Credit bureaus
Income data
Statistical model Digital signature
Contract
Personal data Online identification
Partner
Online
Mobile
POS
Inbank

Company presentation
7
Strategy & core competencies
We help our partners sell more by simplifying purchases and making financing more accessible to our customers
Distributionand
Marketing
ProductDevelopment,
ProcessDevelopment,
Technology
Yielding LoanPortfolio,
ROE
Partner Management
Customer Behavior
Sales Orientation
Managing Affordability
Simplifying Distribution
Enabling Credit
Profitable Business Model
Risk Management
Funding and Capital Management

Key figures
Company presentation
43,1
14,5
26,6
44,1
31,9
2015 201820162014 2017
Return on Equity (%)
16,7
12,313,7
11,19,5
20182016 20172014 2015
Net Interest Margin (%) Impairment Losses to Loan Portfolio (%) Cost Income Ratio (%)
2,4
4,0
6,4
4,5
1,7
201820172014 20162015
41,1
63,2
45,7
57,849,9
20182016 20172014 2015
1435
6593
226
20182017201620152014
Loan Portfolio (EURm)
3065
95
240
0
201720162015 20182014
Deposit Portfolio (EURm) Net Income (EURm) Net Profit (EURm)
2,44,0
9,211,7
21,4
2014 20172016 20182015
1,3 0,9
2,6
7,5
9,3
20182014 201720162015

Quarterly key figures
Company presentation
12,418,0
34,9
21,9 23,1
Q22019
Q12019
Q32018
Q42018
Q22018
Return on Equity (%)
9,310,0 9,5
8,79,4
Q12019
Q22019
Q42018
Q32018
Q22018
Net Interest Margin (%) Impairment Losses to Loan Portfolio (%) Cost Income Ratio (%)
2,92,6
-0,7
2,12,7
Q22019
Q12019
Q42018
Q32018
Q22018
55,848,3
53,348,6 50,9
Q22019
Q42018
Q32018
Q12019
Q22018
178200
226246
276
Q22019
Q42018
Q12019
Q32018
Q22018
Loan Portfolio (EURm)
159187
240276 273
Q22019
Q42018
Q22018
Q12019
Q32018
Deposit Portfolio (EURm) Net Income (EURm) Net Profit (EURm)
4,2
6,06,7 6,8
8,0
Q22019
Q12019
Q22018
Q32018
Q42018
0,9
1,5
3,1
2,02,3
Q22019
Q32018
Q42018
Q22018
Q12019

Poland is Driving New Sales
Company presentation
10
25
10
5
0
30
15
20
10.1
2.6
25.5
9.4
042019
9.8
17.617.2
2.2
8.0 8.3
9.7
5.6
2.4
8.2
8.1
2.2
2.4
122018
15.9
3.5
11.3
2.3
1.6
Latvia +64%
0.6
1.8
5.3
9.5
7.9
2.5
16.4 2.1
062019
6.36.7
22.9
052019
1.4
8.8
012019
1.1
8.2
6.3
092018
Estonia +40%
3.9
082018
Poland +877%
1.7
19.7
032019
1.1
102018
6.5
10.2
1.8
2.9
062018
112018
19.5
072018
8.3
26.0
1.7
7.4
0.5
1.2
18.9
6.3
23.8
8.1
mEU
R
Lithuania +17%
022019
5.5
1.31.7
20.6
5.9
1.6
18.0
8.4
+61% CAGR

Organisation
Company presentation
11
Priit PõldojaChairman, Founder
Jan AndresooCEO, Founder
Liina SadrakBusiness Processes
Piret PaulusBusiness Development
Erkki SaarniitProduct Development
Ivar KallastRisk
195 employees7 offices in 4 countries
Group management focuses on strategy, innovation and growth into new markets as well as meeting bank’s capital return and risk appetite targets
Finance, risk, product development and technology teams are centralised
Sales & distribution and credit underwriting is handled by local teams
Girts LedinsInbank Latvia
Maciej PieczkowskiInbank Poland
Benas PavlauskasInbank Lithuania
Margus KasteinInbank Estonia
Marko VarikFinance
GROUP MANAGEMENT
COUNTRY MANAGEMENT
Aet TooseTechnology

Key success factors
28 May 2019
Company presentation
12
Profitable and scalable consumer finance business model
Excellent proprietary technology and innovative digital solutions Focused strategy and experienced, professional team
Proven track record with strong market position in the Baltics
Second largest consumer finance provider in Estonia with 12% market share Potential to grow business in Poland and expand the business model into more countries
EU banking licence for access to sustainable funding
Strong international investor base to support the growth Tier 2 bonds listed on Nasdaq Baltic exchange, AT1 capital issued Shareholding in payment service provider Maksekeskus gives potential access to payments market

Inbank ASNiine 11, 10414 [email protected]+372 640 8080inbank.ee
Related Documents


