JARVIS: INSTRUMENTAL NEUTRON ACTIVATION ANALYSIS 3 Instrumental Neutron Activation Analysis of Onondaga Chert in the Niagara Frontier Hugh W. Jarvis A systematic and intensive sampling of a series of Onondaga chert outcrops along the Onondaga Escarpment in western New York State provides preliminary data for chemical characterization using instrumental neutron activation analysis (INAA). Concentrations of minor and trace elements generally increase eastward through the study area, providing a basis for more extensive analysis. Especially strong are the eastward elevations of bromine, chlorine, and sodium. Samples of artifacts from three western New York sites corroborate the geological data, although sodium leaching is in evidence. Discriminant analysis shows strong separation between outcrops, providing hope for future characterization. Introduction This paper discusses the chemical characterization of Onondaga chert for artifact sourcing. Data were collected through a systematic sampling strategy and analyzed by means of instrumental neutron activation analysis (INAA). Although artifacts of Onondaga chert dominate the prehistoric lithic assemblages of New York State, as well as being common in neighbouring states and provinces, no headway has yet been made at tracing the sources of this raw material. This study was in-tended to establish the feasibility of conducting large scale fingerprinting of this important prehistoric resource by using a more intensive approach and a larger data base than have ever been used before. Although Onondaga chert has been the subject of various sourcing studies, the nature of the resource itself has hindered their success. Unlike some North American raw materials, for which there are but a few easily isolated point sources, exposures of the Onondaga chert occur in parts of southwestern Ontario, regularly across New York State, and also in northern Pennsylvania. This abundance would not be a problem if it were not for the chert's physical characteristics: it is macroscopically homogeneous, which prevents easy visual dis- crimination. While there can be small differences in colour between samples from opposite ends of New York State, there can be just as much variation between strata, and even across individual nodules and lenses. On a microscopic level, the chert is both heterogeneous and extremely variable. Although inclusions such as fossil microfauna and crystalline quartz are common, the wide variability in their type and abundance hinders rather than helps petrographical characterization. No extensive chemical characterization of Onon- daga chert has yet been attempted. However, with the accomplishments made by trace element analyses worldwide, in difficult sourcing cases, it was thought appropriate to try such a method here in the Northeast. Since this chert type shows as much apparent variation inside individual outcrops as it does across the whole formation, a systematic strategy using data gathered intensively from a series of locations was designed. As Luedtke (1978, 1979, 1987a, personal communication) has advised, adequate sampling and analysis of cherts with methods such as INAA and discriminant analysis are necessary to over-ride the high levels of chemical variation that interfere with the dis- crimination of source outcrops. Naturally, the ul- timate proof of a lithic source analysis lies in the success of its results. Thus, during the fall of 1987, a systematic sample of chert specimens was taken from a stratigraphi- cally correlated series of outcrops along the Onon- daga Escarpment from Buffalo east to Akron, New York (Fig. 1). An outlier from Oaks Corners was later added to detect regional variation. In all some 150 pieces were collected from seven localities. Samples were then run through INAA. The con- centration data measured for sixteen elements were analyzed visually, and through discriminant analysis, to find patterned variation suitable for distinguishing Onondaga chert outcrops, and ul- timately to facilitate the sourcing of prehistoric artifacts. Geological background A brief discussion of the geological background will aid in understanding the problem. Onondaga chert occurs in the Onondaga Limestone, a Middle

Welcome message from author
This document is posted to help you gain knowledge. Please leave a comment to let me know what you think about it! Share it to your friends and learn new things together.
Transcript
JARVIS: INSTRUMENTAL NEUTRON ACTIVATION ANALYSIS 3
Instrumental Neutron Activation Analysis ofOnondaga Chert in the Niagara Frontier
Hugh W. Jarvis
A systematic and intensive sampling of a series of
Onondaga chert outcrops along the Onondaga Escarpment inwestern New York State provides preliminary data for chemicalcharacterization using instrumental neutron activation analysis
(INAA). Concentrations of minor and trace elements generallyincrease eastward through the study area, providing a basis formore extensive analysis. Especially strong are the eastwardelevations of bromine, chlorine, and sodium. Samples of
artifacts from three western New York sites corroborate thegeological data, although sodium leaching is in evidence.Discriminant analysis shows strong separation betweenoutcrops, providing hope for future characterization.
IntroductionThis paper discusses the chemical characterization
of Onondaga chert for artifact sourcing. Data werecollected through a systematic sampling strategyand analyzed by means of instrumental neutronactivation analysis (INAA). Although artifacts ofOnondaga chert dominate the prehistoric lithicassemblages of New York State, as well as beingcommon in neighbouring states and provinces, noheadway has yet been made at tracing the sources ofthis raw material. This study was in-tended toestablish the feasibility of conducting large scalefingerprinting of this important prehistoric resourceby using a more intensive approach and a largerdata base than have ever been used before.
Although Onondaga chert has been the subject ofvarious sourcing studies, the nature of the resourceitself has hindered their success. Unlike some NorthAmerican raw materials, for which there are but afew easily isolated point sources, exposures of theOnondaga chert occur in parts of southwesternOntario, regularly across New York State, and alsoin northern Pennsylvania. This abundance wouldnot be a problem if it were not for the chert'sphysical characteristics: it is macroscopicallyhomogeneous, which prevents easy visual dis-crimination. While there can be small differences incolour between samples from opposite ends of NewYork State, there can be just as much variationbetween strata, and even across individual nodules
and lenses. On a microscopic level, the chert is bothheterogeneous and extremely variable. Althoughinclusions such as fossil microfauna and crystallinequartz are common, the wide variability in theirtype and abundance hinders rather than helpspetrographical characterization.
No extensive chemical characterization of Onon-daga chert has yet been attempted. However, withthe accomplishments made by trace elementanalyses worldwide, in difficult sourcing cases, itwas thought appropriate to try such a method herein the Northeast. Since this chert type shows asmuch apparent variation inside individual outcropsas it does across the whole formation, a systematicstrategy using data gathered intensively from aseries of locations was designed. As Luedtke (1978,1979, 1987a, personal communication) has advised,adequate sampling and analysis of cherts withmethods such as INAA and discriminant analysisare necessary to over-ride the high levels ofchemical variation that interfere with the dis-crimination of source outcrops. Naturally, the ul-timate proof of a lithic source analysis lies in thesuccess of its results.
Thus, during the fall of 1987, a systematic sampleof chert specimens was taken from a stratigraphi-cally correlated series of outcrops along the Onon-daga Escarpment from Buffalo east to Akron, NewYork (Fig. 1). An outlier from Oaks Corners waslater added to detect regional variation. In all some150 pieces were collected from seven localities.Samples were then run through INAA. The con-centration data measured for sixteen elements wereanalyzed visually, and through discriminantanalysis, to find patterned variation suitable fordistinguishing Onondaga chert outcrops, and ul-timately to facilitate the sourcing of prehistoricartifacts.
Geological backgroundA brief discussion of the geological background
will aid in understanding the problem. Onondagachert occurs in the Onondaga Limestone, a Middle
4 ONTARIO ARCHAEOLOGY NO.51
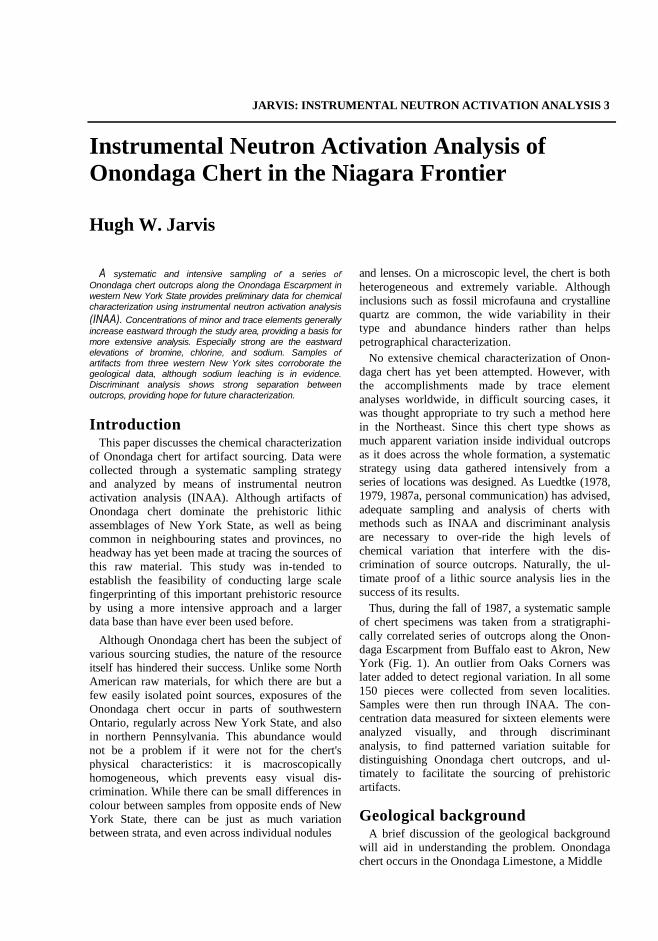
Sample locations:1. E. Amherst St. 6. Oaks Crnrs. Qu.
Rdct. 7. Centerpointe2. Williamsville 8. Guenther Site3. Goodrich Rd. 9. French 3 Site4. Akron Falls 10. H. Long Site5. E. Amherst St.
FIGURE 1Map of the study area
Devonian formation which underlies the southernhalf of New York State, parts of southwesternOntario and northern Pennsylvania (Oliver 1966).The formation has been divided into four members,in order of deposition: Edgecliffe, Clarence(Nedrow in eastern New York), Seneca, andMoorehouse. While chert is extremely common inthe Clarence member, often exceeding 50% bymass, by contrast, in the Edgecliffe member, itaverages less than 5%. The chert proportions of theSeneca and Moorehouse members lie between thesevalues (Dunn and Ozol 1963).
In the study area, glacial action eroded most ofthe Seneca and Moorehouse members, so only theClarence and Edgecliffe members remain exposedin the outcrops and stream cuts of the OnondagaEscarpment (Buehler and Tesmer 1963). This es-carpment runs east to west across New York State,and presumably provided as easy an access to thechert for prehistoric Indians as it does today forgeologists and archaeologists (Fig. 1). In thewestern part of the state, this resource is abundant,
but east of Rochester, where the scarp is lesspronounced, the chert becomes rather scarce. WhileDunn and Ozlo (1962:19) indicate strata consistingof 25% and even 40% chert in the Phelps area, atOaks Corner Quarry, where over forty metres of theOnondaga formation is exposed, only rare noduleswere observed and these were high in theMoorehouse member. East of Syracuse, the chertagain becomes plentiful.
In the study area, Onondaga chert of theClarence/Nedrow and Edgecliffe members variesfrom medium light grey to greyish black in colour(Munsell N6 to N2). The scarcer chert in the othermembers is usually darker, but can also be a tan hue(Hammer 1976; Wray 1948). Chert quality can varyconsiderably. In some deposits it is unsuitable forknapping due to frequent inclusions and stressflaws, while in others, the material has a good, eventexture and an excellent conchoidal fracture. Forthis study, no attempt was made to sample only thesources of highest quality chert, since the goal wasto characterize the whole resource, not just a few
JARVIS: INSTRUMENTAL NEUTRON ACTIVATION ANALYSIS 5
outcrops. A followup study should be made todelineate the availability of desirable chert, similar toprojects conducted by Odell (1984) and Meyers(1970) in the Illinois Valley.
Archaeological backgroundThe use of trace element analysis to establish
lithic provenance has become quite common inNorth American archaeology. For example, thereare studies of Southwestern obsidian (Findlow andBolognese 1982; Griffin et al. 1969) and turquoise(Sigleo 1975; Weigand et al. 1977), Kettle Pointchert (Janusas 1984) and quartzite (Julig et al.
1987) from Ontario, and Pennsylvania jasper (Hatchand Miller 1985; Luedtke 1987b). However, theapplication of these methods to New York Statematerials has been limited to a handful of studies(Brindle and Hancock 1987; Koffyberg 1987; Kuhnand Lanford 1987; Luedtke 1976; Pavlish et al.
1987), none of which has intensively addressed theOnondaga material.
Although studies utilizing the more traditionalmacroscopic and microscopic approaches haveshown clear distinctions between Onondaga andother Northeastern cherts (e.g. Hammer 1976; Kof-fyberg 1987; Kuhn and Lanford 1987; Lavin 1983;Parkins 1974, 1977; Wray 1948), when thesemethods have been directed solely at Onondagachert, they have only managed to distinguishsamples from opposite ends of the formation (Ham-mer 1976; Lavin and Prothero 1981; Wray 1948),and samples from different members of the forma-tion (Owl 1963). Yet despite the absence of anadequate basis for the sourcing on Onondaga chertand artifacts, there is a tendency in the literature(e.g. Ritchie 1980:8) to link artifacts to well-knownbut insufficiently studied prehistoric quarries, suchas those at Divers Lake in western New York(Prisch 1976), and at Coxsackie in the east (Parker1925; Laccetti 1989).
MethodA small series of outcrops situated along the
Onondaga Escarpment were chosen, but only loca-tions that could be correlated stratigraphically weresampled. For this study, only New York Statematerial was used. Here, the geological literatureproved valuable, particularly the New York StateGeological Association (NYSGA) annual fieldtripguidebooks. To make matters easier, the escarpmentusually exposes not only the Onondaga formation,but also its basal disconformity with the UpperSilurian Lockport dolomites. This contact is
a consistent stratigraphic horizon across the state. Itis readily visible to the eye, and thus forms a naturalreference point for controlled sampling.
The seven locations sampled were: a roadcut andadjacent old quarry on East Amherst Street, Buf-falo; the banks of Ellicott Creek at Glen Park Falls,and residual surface material from the nearbyCenterpointe Site, both in Williamsville; the cutwhich Goodrich Road makes through the escarp-ment in Clarence; the walls of Murder Creek atAkron Falls, Akron; and the active General CrushedStone Co. Quarry in Oaks Corners (Fig. 1). This lastsample was included to provide data on longerrange variations in the formation.
At each locality, a geologist's hammer was usedto take a sample of every nodule lying near anarbitrarily defined vertical line established from thepoint of Lockport dolomite contact to the top of theexposure. On average, between fifteen and twentysamples were removed from a six metre section ofthe formation. Each piece's original location in thesampling series was noted for future reference.Studies such as Janusas' (1984:82) characterizationof Kettle Point chert, have encountered problems inobtaining conclusive results because they have notanalyzed adequate sample sizes. Typically,statistical analyses require a minimum of ten casesper sample, while more are required to reducestandard error. Although several of this study'ssamples are barely over these minimum limits, theyshould prove sufficient for exploratory research.
In the lab, knapping quality was estimated for allthe samples collected, based on past experimentalobservations that the most desirable material has afine texture, an absence of inclusions, and an excel-lent conchoidal fracture. From the best materialpresent in each piece, a 200-300 milligram samplewas detached using a sandstone cobble. The outer-most material was first removed to avoid con-tamination that might be present on the surface ofthe piece.
Although a variety of techniques are available forelemental analysis of lithic materials, INAA hasmany advantages for chert sourcing. It has a highaccuracy and is the most sensitive technique formeasuring low elemental concentrations. It has thecapacity for simultaneous analysis of many ele-ments. Because it measures the whole of a sample,not just the surface, as in the X-ray fluorescence(XRF) and X-ray diffraction (XRD) techniques,INAA is also less subject to errors from any ac-cidental focus on the inclusions or other small-scalechemical heterogeneities which seem to occur fre-
6 ONTARIO ARCHAEOLOGY NO.51
quently in Onondaga chert. And it is convenientlyeasy to conduct for relatively untrained operators,such as archaeologists (Harbottle 1982).
In INAA, samples are placed in inert plasticcapsules and fired through a pneumatic tube into thereactor. There, they are exposed to a thermalneutron bombardment for a set period of timeduring which certain radioactive isotopes areformed. The samples are then removed and placedin front of a counter which detects and counts thedecay products which are emitted as the excitedatoms in the radioisotopes return to a normal state.Through knowledge of a particular element's reac-
tion habits, its concentration in a sample can bequite easily determined.
For this study, INAA was conducted at theSLOWPOKE Reactor Facility at the University ofToronto, between January and March of 1988. Thechert was irradiated for five minutes at fivekilowatts, then exposed to a germanium-lithiumdetector for gamma ray counting.
Sixteen elements were measured: uranium,dysprosium, barium, titanium, strontium, iodine,bromine, magnesium, silicon, sodium, vanadium,potassium, aluminum, manganese, chlorine, andcalcium. Their concentrations by mass were reducedfrom the raw gamma ray counts with an Apple 2ecomputer using the comparator method and in-house standards. Of the elements measured,strontium and iodine fell outside the detection limitsin over half the cases, and have thus been excludedfrom the analysis. For the final stage of analysis, thedata were. loaded on to the IBM mainframecomputer at the State University of New York atBuffalo and examined using the Statistical Packagefor the Social Sciences (Norusis, 1985).
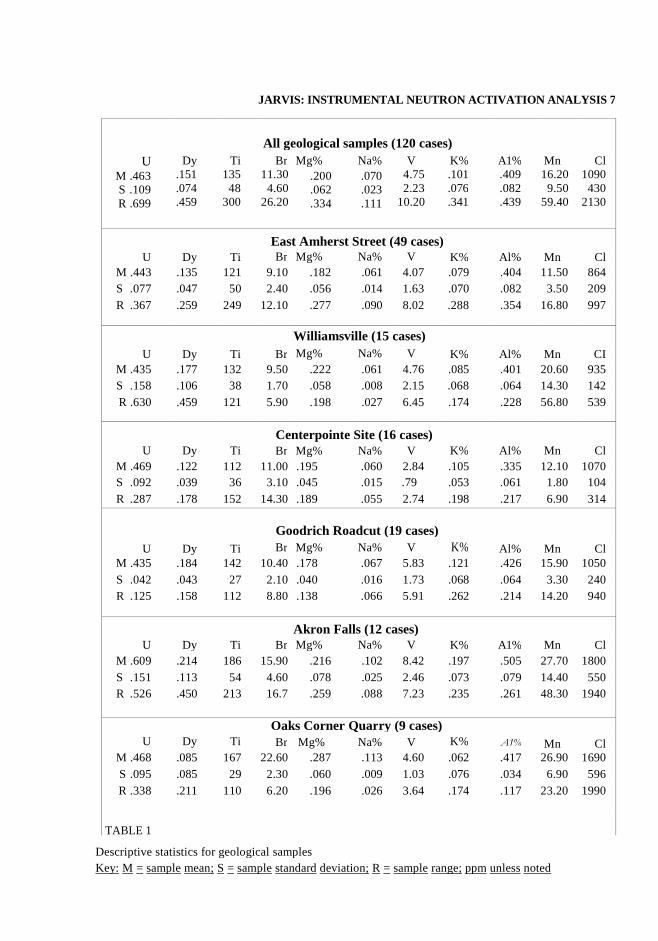
Trends in the dataThe descriptive statistics for the geological out-
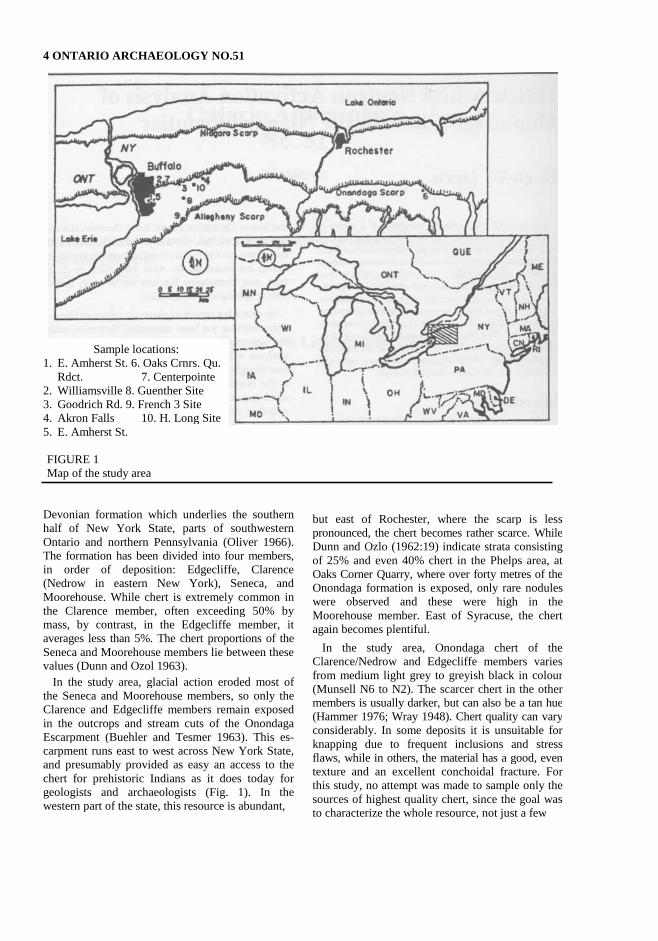
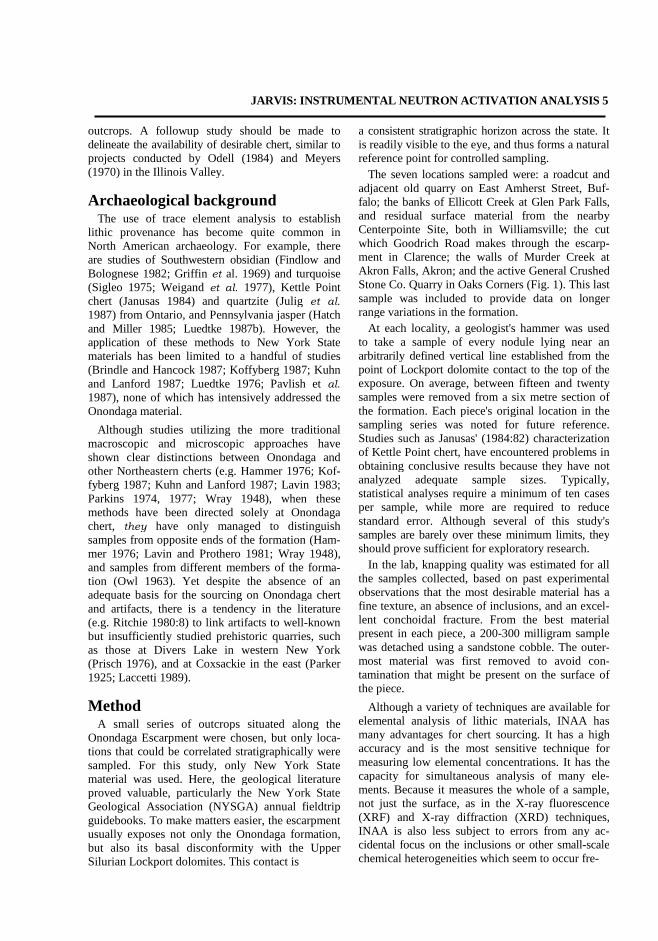
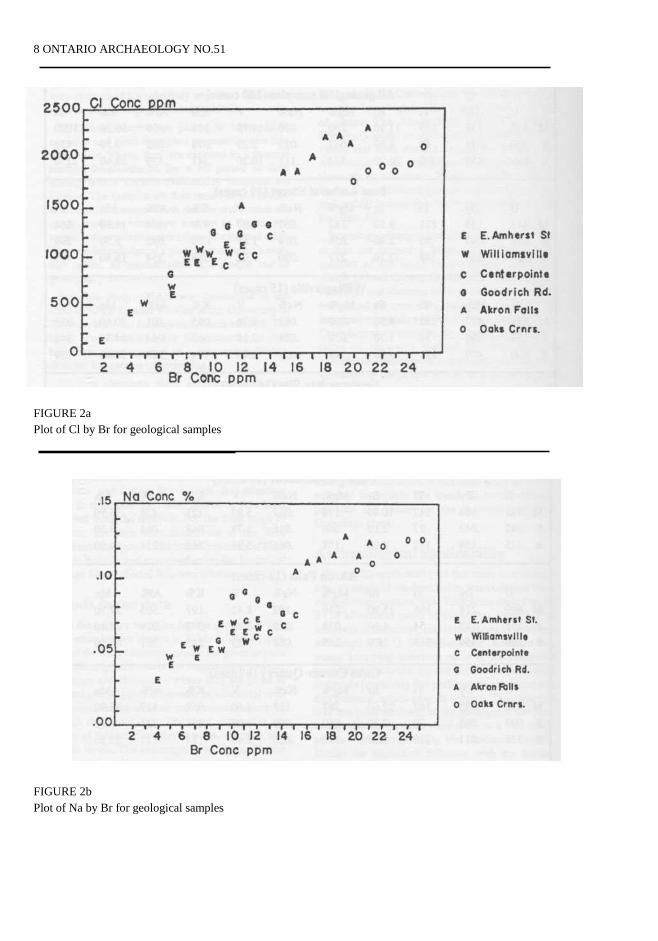
crops sampled are shown in Table 1. The propor-tions of the trace elements present are given as partsper million (ppm), except for magnesium, sodium,potassium and aluminum, where they are given aspercentages. A general increase in elemental con-centrations is apparent as one proceeds eastwardthrough the population. The most expressive ex-amples of this trend are the bromine, chlorine, andsodium levels. The scattergrams in Figure 2a (thebivariate plot of bromine by chlorine) and Figure 2b(graphing sodium by chlorine) clearly show thesetrends. The East Amherst Street (Buffalo) and GlenPark Falls (Williamsville) samples have the lowestvalues and are spread across the centre and
lower left of the scattergrams. The Goodrich Road(Clarence) and Centerpointe Site (Williamsville)samples have higher values, and cluster just right ofcentre. The Akron Falls (Akron) and Oaks Corners(Phelps) samples have the highest overall valuesand form distinct clusters to the far right. Alsovisible is the strong linear relationship among thesethree elements. Their correlations have Pearson'scoefficients greater than 0.8 (one-tailed), and arehighly significant with the probability much less than.05.
In geology, changes through the sedimentary for-mation are termed a facies shift. They are theproduct of the local environmental conditions whichexisted during deposition, such as depth, turbidity,and distance from the shore, and which influencedthe type and proportion of organic and inorganicmaterials which now form the rock. In the Onondagachert samples, the increasing concentrations ofelements typical for clay minerals (aluminum,magnesium, and potassium) suggest an elevation inthe proportion of clay in the original sediment.Since clay enters marine waters through rivers andsettles near the shore, an increasing clay contentcould correlate with a general proximity to shore, ora more specific proximity to a major fresh wateroutlet. The increasing levels of chlorine and sodiumcould reflect the depositional environment, or theymay relate to chemical processes active during chertformation. While more study would be required toexplain this trend, its very existence provides themeans for the characterization of Onondaga cherts.
Archaeological applicabilityTo test the applicability of this study to archaeol-
ogy, a sample of ten chert flakes was collected fromeach of three western New York State sites: French 3(18 kilometres south of the scarp), Guenther (6 kmsouth of the scarp), and Henry Long (1 km from thescarp) (Fig. 1). The flakes were chosen to rep-resentknapping activities early in the reduction sequenceso as to bias the samples toward site-local materials(assuming that preliminary reduction of a rawmaterial occurs near its source). This material wasanalyzed similarly to the geological samples, exceptthat steel pliers were used as a vise while pieceswere struck using the sandstone cobble. Unlike theprocedure followed with the thicker geologicalsamples, the outer surfaces of the flakes were notremoved. The archaeological artifacts are thus notsafe from the effects of any chemical reactionswhich may have occurred between the
JARVIS: INSTRUMENTAL NEUTRON ACTIVATION ANALYSIS 7
All geological samples (120 cases)
Mg% Na%UM .463S .109R .699
Dy.151.074.459
Ti135
48300
Br11.30
4.6026.20
.200
.062
.334
.070
.023
.111
V4.752.23
10.20
K%.101.076.341
A1%.409.082.439
Mn16.20
9.5059.40
Cl1090
4302130
East Amherst Street (49 cases)U Dy Ti Br Mg% Na% V K% Al% Mn Cl
M .443 .135 121 9.10 .182 .061 4.07 .079 .404 11.50 864
S .077 .047 50 2.40 .056 .014 1.63 .070 .082 3.50 209
R .367 .259 249 12.10 .277 .090 8.02 .288 .354 16.80 997
Williamsville (15 cases)
U Dy Ti Br Mg% Na% V K% Al% Mn CI
M .435 .177 132 9.50 .222 .061 4.76 .085 .401 20.60 935
S .158 .106 38 1.70 .058 .008 2.15 .068 .064 14.30 142
R .630 .459 121 5.90 .198 .027 6.45 .174 .228 56.80 539
Centerpointe Site (16 cases)U Dy Ti Br Mg% Na% V K% Al% Mn Cl
M .469 .122 112 11.00 .195 .060 2.84 .105 .335 12.10 1070
S .092 .039 36 3.10 .045 .015 .79 .053 .061 1.80 104
R .287 .178 152 14.30 .189 .055 2.74 .198 .217 6.90 314
Goodrich Roadcut (19 cases)
U Dy Ti Br Mg% Na% V K% Al% Mn ClM .435 .184 142 10.40 .178 .067 5.83 .121 .426 15.90 1050
S .042 .043 27 2.10 .040 .016 1.73 .068 .064 3.30 240
R .125 .158 112 8.80 .138 .066 5.91 .262 .214 14.20 940
Akron Falls (12 cases)U Dy Ti Br Mg% Na% V K% A1% Mn Cl
M .609 .214 186 15.90 .216 .102 8.42 .197 .505 27.70 1800
S .151 .113 54 4.60 .078 .025 2.46 .073 .079 14.40 550
R .526 .450 213 16.7 .259 .088 7.23 .235 .261 48.30 1940
Oaks Corner Quarry (9 cases)U Dy Ti Br Mg% Na% V K% A1% Mn Cl
M .468 .085 167 22.60 .287 .113 4.60 .062 .417 26.90 1690
S .095 .085 29 2.30 .060 .009 1.03 .076 .034 6.90 596
R .338 .211 110 6.20 .196 .026 3.64 .174 .117 23.20 1990
TABLE 1
Descriptive statistics for geological samples
Key: M = sample mean; S = sample standard deviation; R = sample range; ppm unless noted
8 ONTARIO ARCHAEOLOGY NO.51
FIGURE 2a
Plot of Cl by Br for geological samples
FIGURE 2b
Plot of Na by Br for geological samples
JARVIS: INSTRUMENTAL NEUTRON ACTIVATION ANALYSIS 9
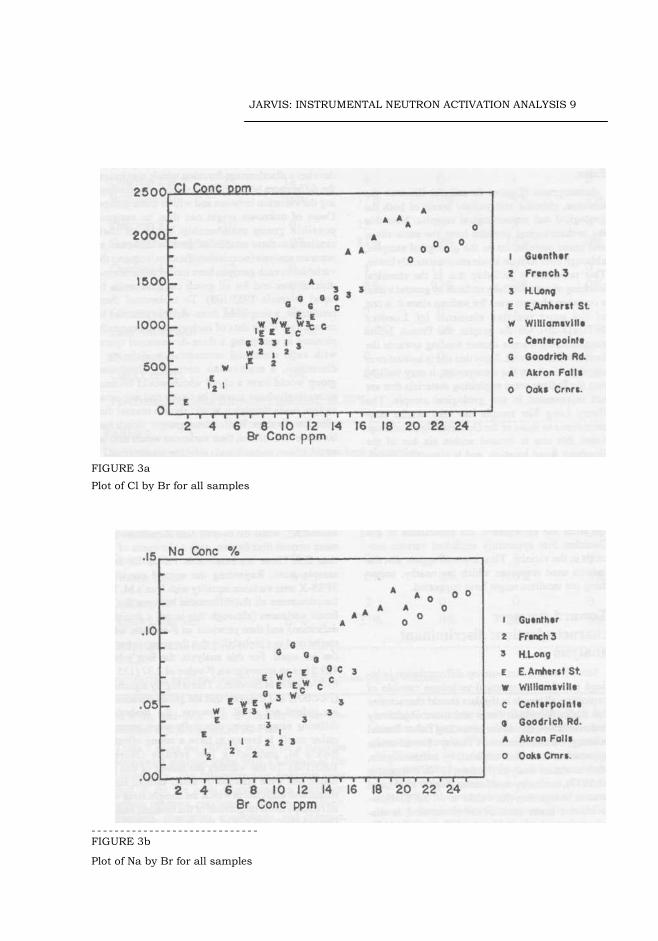
FIGURE 3a
Plot of Cl by Br for all samples
- - - - - - - - - - - - - - - - - - - - - - - - - - - - -FIGURE 3b
Plot of Na by Br for all samples
10 ONTARIO ARCHAEOLOGY NO. 51
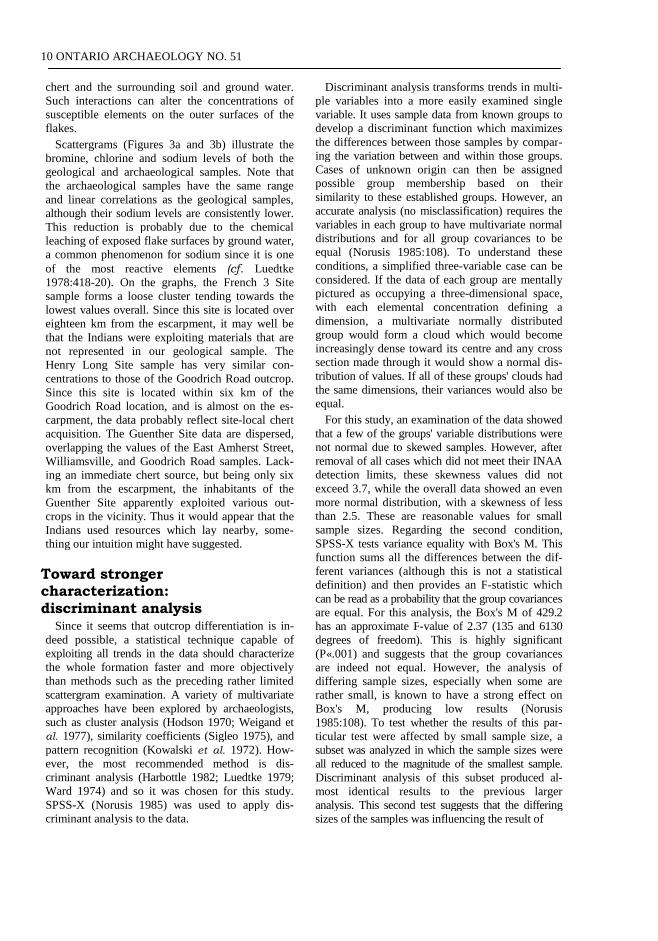
chert and the surrounding soil and ground water.Such interactions can alter the concentrations ofsusceptible elements on the outer surfaces of theflakes.
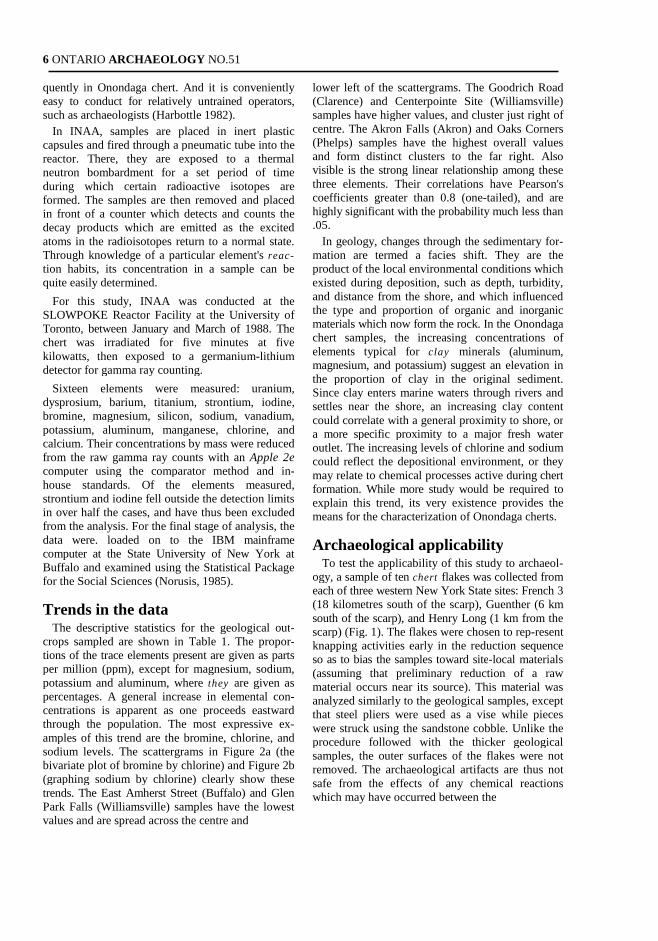
Scattergrams (Figures 3a and 3b) illustrate thebromine, chlorine and sodium levels of both thegeological and archaeological samples. Note thatthe archaeological samples have the same rangeand linear correlations as the geological samples,although their sodium levels are consistently lower.This reduction is probably due to the chemicalleaching of exposed flake surfaces by ground water,a common phenomenon for sodium since it is oneof the most reactive elements (cf. Luedtke1978:418-20). On the graphs, the French 3 Sitesample forms a loose cluster tending towards thelowest values overall. Since this site is located overeighteen km from the escarpment, it may well bethat the Indians were exploiting materials that arenot represented in our geological sample. TheHenry Long Site sample has very similar con-centrations to those of the Goodrich Road outcrop.Since this site is located within six km of theGoodrich Road location, and is almost on the es-carpment, the data probably reflect site-local chertacquisition. The Guenther Site data are dispersed,overlapping the values of the East Amherst Street,Williamsville, and Goodrich Road samples. Lack-ing an immediate chert source, but being only sixkm from the escarpment, the inhabitants of theGuenther Site apparently exploited various out-crops in the vicinity. Thus it would appear that theIndians used resources which lay nearby, some-thing our intuition might have suggested.
Toward strongercharacterization:discriminant analysis
Since it seems that outcrop differentiation is in-deed possible, a statistical technique capable ofexploiting all trends in the data should characterizethe whole formation faster and more objectivelythan methods such as the preceding rather limitedscattergram examination. A variety of multivariateapproaches have been explored by archaeologists,such as cluster analysis (Hodson 1970; Weigand etal. 1977), similarity coefficients (Sigleo 1975), andpattern recognition (Kowalski et al. 1972). How-ever, the most recommended method is dis-criminant analysis (Harbottle 1982; Luedtke 1979;Ward 1974) and so it was chosen for this study.SPSS-X (Norusis 1985) was used to apply dis-criminant analysis to the data.
Discriminant analysis transforms trends in multi-ple variables into a more easily examined singlevariable. It uses sample data from known groups todevelop a discriminant function which maximizesthe differences between those samples by compar-ing the variation between and within those groups.Cases of unknown origin can then be assignedpossible group membership based on theirsimilarity to these established groups. However, anaccurate analysis (no misclassification) requires thevariables in each group to have multivariate normaldistributions and for all group covariances to beequal (Norusis 1985:108). To understand theseconditions, a simplified three-variable case can beconsidered. If the data of each group are mentallypictured as occupying a three-dimensional space,with each elemental concentration defining adimension, a multivariate normally distributedgroup would form a cloud which would becomeincreasingly dense toward its centre and any crosssection made through it would show a normal dis-tribution of values. If all of these groups' clouds hadthe same dimensions, their variances would also beequal.
For this study, an examination of the data showedthat a few of the groups' variable distributions werenot normal due to skewed samples. However, afterremoval of all cases which did not meet their INAAdetection limits, these skewness values did notexceed 3.7, while the overall data showed an evenmore normal distribution, with a skewness of lessthan 2.5. These are reasonable values for smallsample sizes. Regarding the second condition,SPSS-X tests variance equality with Box's M. Thisfunction sums all the differences between the dif-ferent variances (although this is not a statisticaldefinition) and then provides an F-statistic whichcan be read as a probability that the group covariancesare equal. For this analysis, the Box's M of 429.2has an approximate F-value of 2.37 (135 and 6130degrees of freedom). This is highly significant(P«.001) and suggests that the group covariancesare indeed not equal. However, the analysis ofdiffering sample sizes, especially when some arerather small, is known to have a strong effect onBox's M, producing low results (Norusis1985:108). To test whether the results of this par-ticular test were affected by small sample size, asubset was analyzed in which the sample sizes wereall reduced to the magnitude of the smallest sample.Discriminant analysis of this subset produced al-most identical results to the previous largeranalysis. This second test suggests that the differingsizes of the samples was influencing the result of
JARVIS: INSTRUMENTAL NEUTRON ACTIVATION ANALYSIS 11
Predicted Membership
Actual outcrop
No. of
cases 2 & 7 3
Outcrop
4 1 & 5 6
Outcrop 2& 7 23 18 4 0 1 0
Williamsville 78% 17% 0% 4% 0%
Outcrop 3 16 0 13 0 3 0
Goodrich Roadcut 0% 81% 0% 19% 0%
Outcrop 4 12 0 1 11 0 0
Akron Falls 0% 8% 92% 0% 0%
Outcrop 1 & 5 31 2 2 0 27 0
East Amherst St 6.5% 6.5% 0% 87% 0%
Outcrop 6 4 0 0 0 0 4
Oaks Corners 0% 0% 0% 0% 100%
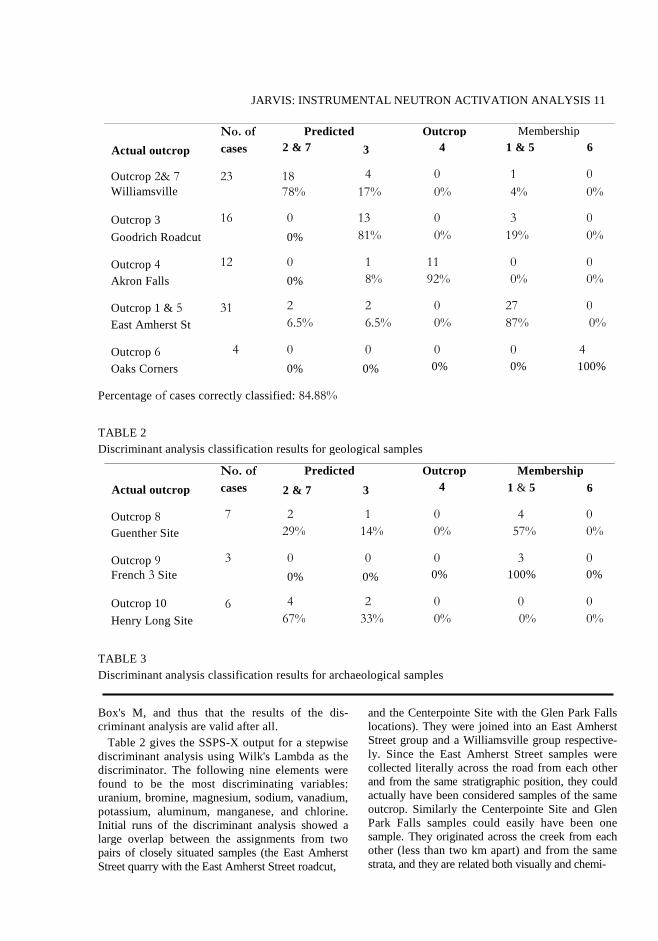
Percentage of cases correctly classified: 84.88%
TABLE 2
Discriminant analysis classification results for geological samples
Predicted Membership
Actual outcrop
No. of
cases 2 & 7 3
Outcrop
4 1 & 5 6
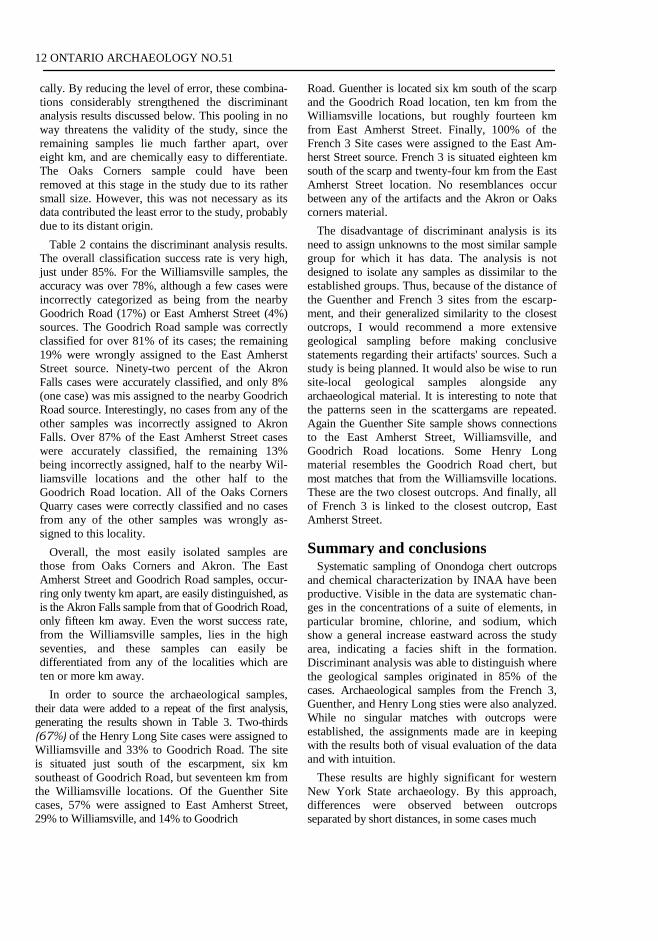
Outcrop 8 7 2 1 0 4 0
Guenther Site 29% 14% 0% 57% 0%
Outcrop 9 3 0 0 0 3 0
French 3 Site 0% 0% 0% 100% 0%
Outcrop 10 6 4 2 0 0 0
Henry Long Site 67% 33% 0% 0% 0%
TABLE 3
Discriminant analysis classification results for archaeological samples
Box's M, and thus that the results of the dis-criminant analysis are valid after all.
Table 2 gives the SSPS-X output for a stepwisediscriminant analysis using Wilk's Lambda as thediscriminator. The following nine elements werefound to be the most discriminating variables:uranium, bromine, magnesium, sodium, vanadium,potassium, aluminum, manganese, and chlorine.Initial runs of the discriminant analysis showed alarge overlap between the assignments from twopairs of closely situated samples (the East AmherstStreet quarry with the East Amherst Street roadcut,
and the Centerpointe Site with the Glen Park Fallslocations). They were joined into an East AmherstStreet group and a Williamsville group respective-ly. Since the East Amherst Street samples werecollected literally across the road from each otherand from the same stratigraphic position, they couldactually have been considered samples of the sameoutcrop. Similarly the Centerpointe Site and GlenPark Falls samples could easily have been onesample. They originated across the creek from eachother (less than two km apart) and from the samestrata, and they are related both visually and chemi-
12 ONTARIO ARCHAEOLOGY NO.51
cally. By reducing the level of error, these combina-tions considerably strengthened the discriminantanalysis results discussed below. This pooling in noway threatens the validity of the study, since theremaining samples lie much farther apart, overeight km, and are chemically easy to differentiate.The Oaks Corners sample could have beenremoved at this stage in the study due to its rathersmall size. However, this was not necessary as itsdata contributed the least error to the study, probablydue to its distant origin.
Table 2 contains the discriminant analysis results.The overall classification success rate is very high,just under 85%. For the Williamsville samples, theaccuracy was over 78%, although a few cases wereincorrectly categorized as being from the nearbyGoodrich Road (17%) or East Amherst Street (4%)sources. The Goodrich Road sample was correctlyclassified for over 81% of its cases; the remaining19% were wrongly assigned to the East AmherstStreet source. Ninety-two percent of the AkronFalls cases were accurately classified, and only 8%(one case) was mis assigned to the nearby GoodrichRoad source. Interestingly, no cases from any of theother samples was incorrectly assigned to AkronFalls. Over 87% of the East Amherst Street caseswere accurately classified, the remaining 13%being incorrectly assigned, half to the nearby Wil-liamsville locations and the other half to theGoodrich Road location. All of the Oaks CornersQuarry cases were correctly classified and no casesfrom any of the other samples was wrongly as-signed to this locality.
Overall, the most easily isolated samples arethose from Oaks Corners and Akron. The EastAmherst Street and Goodrich Road samples, occur-ring only twenty km apart, are easily distinguished, asis the Akron Falls sample from that of Goodrich Road,only fifteen km away. Even the worst success rate,from the Williamsville samples, lies in the highseventies, and these samples can easily bedifferentiated from any of the localities which areten or more km away.
In order to source the archaeological samples,their data were added to a repeat of the first analysis,generating the results shown in Table 3. Two-thirds(67%) of the Henry Long Site cases were assigned toWilliamsville and 33% to Goodrich Road. The siteis situated just south of the escarpment, six kmsoutheast of Goodrich Road, but seventeen km fromthe Williamsville locations. Of the Guenther Sitecases, 57% were assigned to East Amherst Street,29% to Williamsville, and 14% to Goodrich
Road. Guenther is located six km south of the scarpand the Goodrich Road location, ten km from theWilliamsville locations, but roughly fourteen kmfrom East Amherst Street. Finally, 100% of theFrench 3 Site cases were assigned to the East Am-herst Street source. French 3 is situated eighteen kmsouth of the scarp and twenty-four km from the EastAmherst Street location. No resemblances occurbetween any of the artifacts and the Akron or Oakscorners material.
The disadvantage of discriminant analysis is itsneed to assign unknowns to the most similar samplegroup for which it has data. The analysis is notdesigned to isolate any samples as dissimilar to theestablished groups. Thus, because of the distance ofthe Guenther and French 3 sites from the escarp-ment, and their generalized similarity to the closestoutcrops, I would recommend a more extensivegeological sampling before making conclusivestatements regarding their artifacts' sources. Such astudy is being planned. It would also be wise to runsite-local geological samples alongside anyarchaeological material. It is interesting to note thatthe patterns seen in the scattergams are repeated.Again the Guenther Site sample shows connectionsto the East Amherst Street, Williamsville, andGoodrich Road locations. Some Henry Longmaterial resembles the Goodrich Road chert, butmost matches that from the Williamsville locations.These are the two closest outcrops. And finally, allof French 3 is linked to the closest outcrop, EastAmherst Street.
Summary and conclusionsSystematic sampling of Onondoga chert outcrops
and chemical characterization by INAA have beenproductive. Visible in the data are systematic chan-ges in the concentrations of a suite of elements, inparticular bromine, chlorine, and sodium, whichshow a general increase eastward across the studyarea, indicating a facies shift in the formation.Discriminant analysis was able to distinguish wherethe geological samples originated in 85% of thecases. Archaeological samples from the French 3,Guenther, and Henry Long sties were also analyzed.While no singular matches with outcrops wereestablished, the assignments made are in keepingwith the results both of visual evaluation of the dataand with intuition.
These results are highly significant for westernNew York State archaeology. By this approach,differences were observed between outcropsseparated by short distances, in some cases much
JARVIS: INSTRUMENTAL NEUTRON ACTIVATION ANALYSIS 13
less than 10 km, where previously no measure ofOnondaga chert provenance was possible. The ex-amination of chert movement over quite small dis-tances would now appear to be possible.
In the future, however, sampling of culturalmaterial will have to be more rigorous to control forphenomena such as the chemical leaching whichwas observed in the artifacts used in this study.While the study's overall results look very promis-ing, extension of the geological data bases will benecessary to elucidate whether fingerprinting of thewhole Onondaga Formation is feasible. Currently,the data base is being expanded with material fromsouthwestern Ontario, and from New York Stateoutcrops located farther to the east, while repeatsampling of the original locations will augment andthus strengthen the original data.
AcknowledgementsThis paper summarizes the research made for my
Master's thesis. An earlier version of this paper waspresented at the North Eastern AnthropologicalAssociation annual meeting, in Montreal, Quebec,in 1989.
Many thanks are due to my advisor, SarunasMilisauskas, and the staff of the SLOWPOKEReactor Facility. The warm encouragement andhelpful advice of Ian Brindle, Barbara Calogero,Frank Cowan, Ron Hancock, Jack Holland, BarbaraLuedtke, Margaret Nelson, Bill Parkins, LarryPavlish, Kathryn Stark, Ken Tankersley, EzraZubrow (a multitude of others) and especially myfamily, were tremendously appreciated.
Funding for most of the project was contributed asa grant by the Diamond Research Fund of theGraduate Students' Association of the StateUniversity of New York at Buffalo. Archaeologicalsamples were generously donated by the Depart-ment of Anthropology's Marian E. White Museum,and by Eric Hansen of Hansen and Associates'Archaeological Consulting on behalf of the Cim-minelli Corporation (Centerpointe Site). Permissionfor geological sampling was contributed by theBuffalo Department of Public Works and by theGeneral Crushed Stone Company.
References cited
Brindle, Ian and R. G. V. Hancock1987 INAA of Cherts. Abstract in Annual
Report of the SLOWPOKE ReactorFacility, July, 1986 to June, 1987.(University of Toronto).
Buehler, Edward J. and Irving H. Tesmer1963 Geology of Erie County. Buffalo
Society of Natural SciencesBulletin 21 (3).
Dunn, James R. and Michael A. Ozol1962 Deleterious Properties of Chert.
Physical Research Report No. 12.Rensselaer Polytechnic Institute(Troy).
Findlow, Frank J. and Marisa Bolognese1982 Regional Modelling of Obsidian
Procurement in the American South-west. In: J. E. Ericson and T.K. Earle(eds.) Contexts for PrehistoricExchange. (Academic Press): 53-81.
Griffin, James B., A. A. Gordus, and G. A. Wright1969 Identification of the Sources of
Hopewellian Obsidian in the MiddleWest. American Antiquity 34 (1): 1-14.
Hammer, John1976 Identification and Distribution of
Some Lithic Raw Materials fromNew York State. Man in the North-east 11:39-62.
Harbottle, Garman1982 Chemical Characterization in Archa-
eology. In: J. E. Ericson and T. K.Earle (eds.) Contexts for PrehistoricExchange. (Academic Press):13-51.
Hatch, James, and Patricia Miller1985 Procurement, Tool Production,
Sourcing Research at the Vera CruzJasper Quarry in Pennsylvania.Journal of Field Archaeology12:219-230.
Hodson, F.R.1970 Cluster Analysis and Archaeology:
Some New Developments andApplications. World Archaeology 1(3):299-321.
Janusas, Scarlett E.1984 A Petrological Analysis of Kettle
Point Chert and its Spatial andTemporal Distribution in RegionalPrehistory. National Museum of ManMercury Series. ArchaeologicalSurvey of Canada Paper 128.
14 ONTARIO ARCHAEOLOGY NO.51
Julig, P. J., L. A. Pavlish, and R. G. V. Hancock1987 Instrumental Neutron Activation
Analysis of Archaeological Quartzitefrom Cummins Site Thunder Bay:Determination of Geological Source.Current Research in the Pleistocene4:59-61.
Koffyberg, Agnes M. J.1987 Comparison of Three Chert Types of
the Niagara Region Using Petro-graphical and Chemical Methods.Unpublished B.A. thesis, Departmentof Chemistry, Brock University.
Kowalski, B. R., F. Schatzki, and F. H. Stross1972 Classification of Archaeological
Artifacts by Applying Pattern Recog-nition to Trace Element Data. Anal-
ytical Chemistry 44 (13):2176-80.
Kuhn, Robert D. and William A. Lanford1987 Sourcing Hudson Valley Cherts from
Trace Element Analysis. MINE 34:57-69.
Laccetti, Michael F.1989 The Meier Site: A Chert-Knapping
Workshop at Flint Mine Hill,Coxsackie, New York. New YorkState Archaeological AssociationBulletin 98:25-35.
Lavin, Lucianne M.1983 Patterns of Chert Acquisition Among
Woodland Groups Within theDelaware Watershed: A LithologicApproach. Unpublished PhDDissertation. Department ofAnthropology, New York University.
Lavin, Lucianne M. and Donald R. Prothero1981 Microscopic Analysis of Cherts Within
and Adjacent to the Delaware RiverWatershed. MINE 21:3-17.
Luedtke, Barbara E.1976 Lithic Material Distributions and
Interaction Patterns During the LateWoodland Period in Michigan.Unpublished PhD Dissertation.Department of Anthropology,University of Michigan.
1978 Chert Sources and Trace ElementAnalysis. American Antiquity 43(3):413-23.
1979 The Identification of Sources ofChert Artifacts. American Antiquity44 (4):744-57.
1987b The Pennsylvania Jasper ConnectionJasper at Massachusetts Sites.Massachusetts ArchaeologicalSociety Bulletin 48 (2):37-47.
1987a Chert Source Determination: GettingDown to Basics. Paper presented atthe annual meeting of the Society forAmerican Archaeology, Toronto,Ontario.
Meyers, J. Thomas1970 Chert Resources for the Lower
Illinois Valley: A Study of ChertRaw Material Distributions and TheirImplications for Prehistoric Man.Illinois Valley ArchaeologicalProgram. Research Papers Vol. 2.Reports of Investigations No. 18(State of Illinois, Springfield).
Norusis, Marija J.1985 SPSS-X Advanced Statistics Guide
(SPSS-X, Chicago).
Odell, George1984 Chert Resource Availability in the
Lower Illinois Valley: A TransectSample. In: B. M Butler and E. E.May (eds.) Prehistoric ChertExploitation: Studies from theMidcontinent. Center for Archaeo-logical Investigations, OccasionalPaper 2. (SIU, Carbondale):45-67.
Oliver, William A. Jr.1966 Bois Blanc and Onondaga Formation
in Western New York and AdjacentOntario. In: E. J. Buehler (ed.)NYSGA Guidebook of the 38thAnnual Meeting:32-43.
Ozol, Michael A.1963 Alkali Reactivity of Cherts and
Stratigraphy and Petrology of Chert:and Associated Limestones of theOnondaga Formation of Central andWestern New York. Unpublished Ph[Dissertation. Department of GeologyRensselaer Polytechnic Institute.
Parker, Arthur C.1925 The Great Algonkin Flint Mines at
Coxsackie. Researches and

JARVIS: INSTRUMENTAL. NEUTRON ACTIVATION ANALYSIS 15
Transactions of the NYSAA L. H.Morgan Chapter 4 (4).
Parkins, William G.1977 Onondaga Chert: Geological and
Palynological Studies as Applied toArchaeology. Unpublished Master'sThesis. Department of Geology,Brock University.
1974 Source of Chert from Welland RiverArchaeological Sites. UnpublishedBachelor's Thesis. Department ofGeology, Brock University.
Pavlish, L. A., R. G. V. Hancock, P. Julig, and A.C. D'Andrea1987 Systematic, Stratified INAA of Two
Chert Outcrops in Southern Ontario.Annual Report of the SLOWPOKEReactor Facility. July '86 to June'87. (University of Toronto).
Prisch, Betty C.1976 The Divers Lake Quarry Site. New
York State Archaeological Associ-ation Bulletin 66:8-18.
Ritchie, William A.1980 The Archaeology of New York State
(Revised Edition). (Harbor HillBooks).
Sigleo, Anne C.1975 Turquoise Mine and Artifact
Correlation for Snaketown Site,Arizona. Science 189:459-60.
Ward, G.K.1974 A Systematic Approach to the
Definition of Sources of RawMaterials. Archaeometry 16(1):41-53.
Weigand, Phil C., Garman Harbottle, and EdwardV. Sayre1977 Turquoise Sources and Source
Analysis: Mesoamerica and theSouthwestern U. S. A. In: T. K. Earleand J. E. Ericson (eds.) ExchangeSystems in Prehistory (Academic Press).
Wray, Charles F.1948 Varieties and Sources of Flint Found
in New York State. PennsylvaniaArchaeologist 18 (1-2):25-43.
Hugh W. JarvisAnthropology DepartmentState University of New York at BuffaloAmherst, New York 14261
Related Documents


