IN5140 / 2019.09.16 / Slide 1 Dag Sjøberg Lecture 16 September 2019: Measurements used in process improvement Professor Dag Sjøberg email: [email protected] IN5140 – Smart processes and agile methods in software engineering

Welcome message from author
This document is posted to help you gain knowledge. Please leave a comment to let me know what you think about it! Share it to your friends and learn new things together.
Transcript

IN5140 / 2019.09.16 / Slide 1 Dag Sjøberg
Lecture 16 September 2019: Measurements used in process improvement
Professor Dag Sjøberg email: [email protected]
IN5140 – Smart processes and agile methods in software engineering

IN5140 / 2019.09.16 / Slide 2 Dag Sjøberg
You find your e-mail at mail.uio.no

IN5140 / 2019.09.16 / Slide 3 Dag Sjøberg
Structure
• Measurement theory • Concepts and Constructs • A study of Scrum versus Kanban • Group exercises this week

Why should we measure? • Measurements central in all kinds of improvement work
– including software process improvement (SPI), both traditional and agile/lean development
• The purpose is to improve processes, not to control individuals

IN5140 / 2019.09.16 / Slide 5 Dag Sjøberg
Knowledge about measurements is useful whatever the discipline
• With the enormous amount of data being available in our digital era, knowing how data has been produced and judging its quality is more important than ever

IN5140 / 2019.09.16 / Slide 6 Dag Sjøberg
Measurements are relevant to your project:
• “Identify and describe measures to be used to assess effects of process changes. Based on the improvement goal(s) in your project, use for example GQM to define a minimum of 3 measures, for each describe:
– Who will collect/report data? – When (how often) will data be corrected? – How is data collected, for example, which tools are used? – How is data quality and validity ensured, for example, who is
responsible?
• Also discuss possible challenges related to data collection and data validity. Note that you do not have to actually collect all data for all the measures if practically difficult.”

IN5140 / 2019.09.16 / Slide 7 Dag Sjøberg
Said about measurement
In God we trust, all others bring data – W. Edwards Deming
To measure is to know. If you cannot measure it, you cannot improve it. Lord Kelvin
Not everything that counts can be measured. Not everything that can be measured counts. Albert Einstein

IN5140 / 2019.09.16 / Slide 8 Dag Sjøberg
Quantitative data
• Data expresses quantity • Data expressed as
numbers • Used in statistics
Qualitative data
• Data expresses quality in some sense
• Data expressed as text, images and forms except numbers
• Can obtain quantitative data indirectly if a mapping exists from quantitative to quality data
• Not used in statistics

IN5140 / 2019.09.16 / Slide 9 Dag Sjøberg
Objective data
• Based on facts rather than feelings, opinions, prejudices, or interpretations [Merriam-Webster]
Subjective data
• Related to the way people experience things in their own mind
• Based on feelings or opinions rather than facts, modified or affected by personal views, experience or background [Merriam-Webster]

IN5140 / 2019.09.16 / Slide 10 Dag Sjøberg
Objective vs. subjective data
• We usually prefer objective data
• However, good, subjective data on something relevant is more important than objective data on less relevant aspects
• When introducing measurements in an organization, most data will often be subjective to begin with. After a while, we may be able to make more aspects objectively measurable by using better methods for data collection

IN5140 / 2019.09.16 / Slide 11 Dag Sjøberg
Objective measurement
– Usually, the measurement process can be automated
– (Almost) no random measurement error, i.e., the process is perfectly reliable
– However, imprecise definitions may cause different people to measure the phenomenon differently and thus obtain different results
Subjective measurement
– Human involvement in the measurement process
– If we repeat the measurement of the same object(s) several times, we might not get exactly the same measured value every time, i.e., the measurement process is not perfectly reliable

IN5140 / 2019.09.16 / Slide 12 Dag Sjøberg
Don’t confuse objective/subjective with quantitative/qualitative
• Although objective data is often quantitative and subjective qualitative, objective data may be qualitative and subjective quantitative
Mentimeter: What’s the temperature in this room?

IN5140 / 2019.09.16 / Slide 13 Dag Sjøberg
Scale Type Characterization Examples (generic) Examples (Softw. Eng.)
Nominal Divides the set of objects into categories, with no particular ordering among them
Labeling, classification Name of process model Defect type
Ordinal Divides the set of entities into categories that are ordered
Preference, ranking, difficulty, Likert scales
Failure severity Complexity of software
Interval Comparing the differences between values is meaningful
Calendar time, temperature (Fahrenheit, Reaumur, Celsius)
Beginning and end date of activities
Ratio There is a meaningful “zero” value, and ratios between values are meaningful
Length, weight, time intervals, absolute temperature (Kelvin)
Lines of code Lead time Number of errors Cost per function
Types of measurement scale
IN5140 / 2019.09.16 / Slide 14 Dag Sjøberg
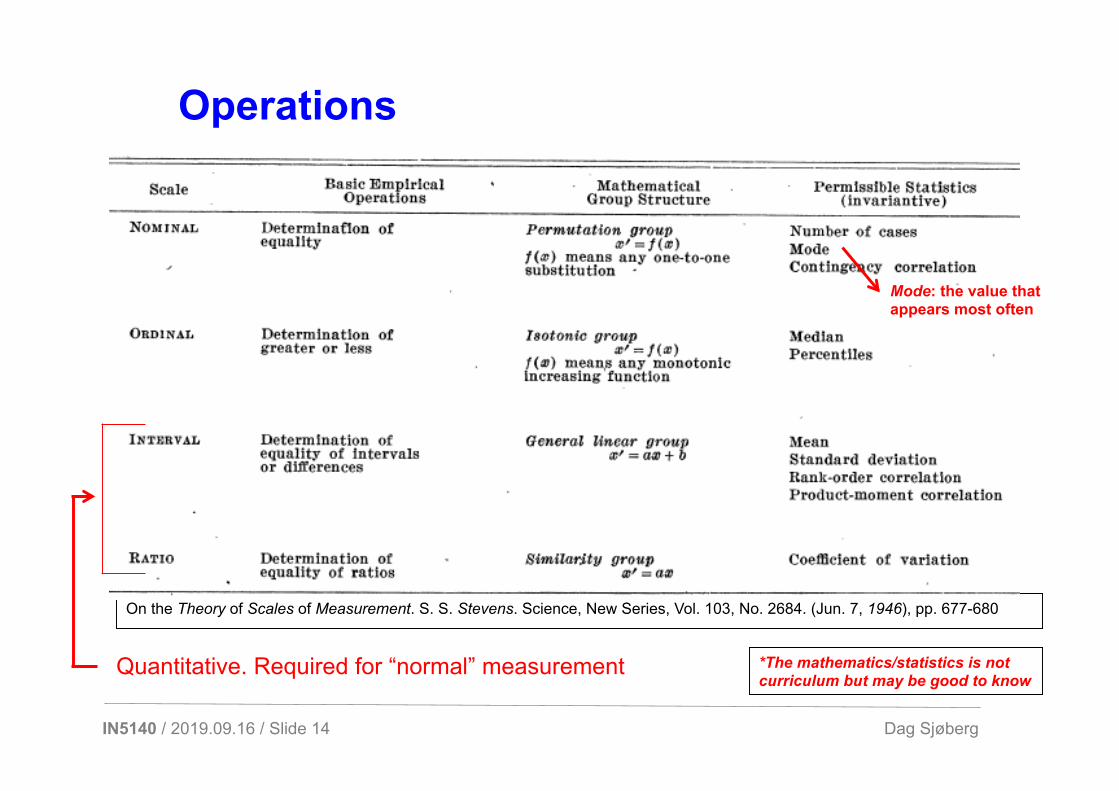
On the Theory of Scales of Measurement. S. S. Stevens. Science, New Series, Vol. 103, No. 2684. (Jun. 7, 1946), pp. 677-680
Operations
Quantitative. Required for “normal” measurement
Mode: the value that appears most often
*The mathematics/statistics is not curriculum but may be good to know

IN5140 / 2019.09.16 / Slide 15 Dag Sjøberg
• Evaluation-type Example:
“Familiarity with and comprehension of the software development environment”
q Little q Unsatisfactory q Neutral q Satisfactory q Excellent
• Frequency-type Example:
“Customers provide information to the project team about the requirements”
q Never q Rarely q Neutral q Occasionally q Most of the time
• Agreement-type Example:
“The tasks supported by the software at the customer site change frequently”
q Strongly Agree q Agree q Neutral q Disagree q Strongly Disagree
Likert type scales

IN5140 / 2019.09.16 / Slide 16 Dag Sjøberg
• Likert-Type Scales:
q Strongly Agree à 1 q Agree à 2 q Neutral à 3 q Disagree à 4 q Strongly Disagree à 5
• Ordinal Scale, but: Often the distances between the response categories are approximately (conceptually) equidistant and thus are treated like approximate interval scales
Assigning numbers to scale responses

IN5140 / 2019.09.16 / Slide 17 Dag Sjøberg
Data should be validated
• Check whether single and aggregated data is reasonable
• If single or aggregated values are outside what was expected, then you should identify the reasons. Is it due to special incidents or error in the data collection?

IN5140 / 2019.09.16 / Slide 18 Dag Sjøberg
Structure
• Measurement theory • Concepts and Constructs • A study of Scrum versus Kanban • Group exercises this week

IN5140 / 2019.09.16 / Slide 19 Dag Sjøberg
Concept
• The formation and understanding of concepts is fundamental in development and acquisition of knowledge
• Concepts categorize and generalize over particulars and abstract over details
• Concepts organize complex notions and thus increase our overall level of knowledge

IN5140 / 2019.09.16 / Slide 20 Dag Sjøberg
How do we measure a concept?
• In a scientific setting, one would often like to measure or collect data that represents a concept
• Simple concepts like time and temperature are straightforward to measure
• For complex concepts that are not directly measurable, one needs to define one or more indicators

IN5140 / 2019.09.16 / Slide 21 Dag Sjøberg
Construct = concept + indicators .
• The process of defining (measurable) indicators is called operationalization
• A construct is a concept that is operationalized into a set of indicators
• Construct validity = how well the measurements (indicators) represent the concept

IN5140 / 2019.09.16 / Slide 22 Dag Sjøberg
Conceptual level
Operational (measurable) level
Company performance
KPI 1 … KPI n

KPI (Key Performance Indicator)
A key performance indicator (KPI) is a type of performance measurement. KPIs evaluate the success of an organization or of a particular activity (such as projects, programs, products and other initiatives) in which it engages.
[Wikipedia]

Example KPIs for a software company
Z. Antolic. An Example of Using Key Performance Indicators for Software Development Process Efficiency Evaluation. Technical Report, R&D Center, Ericsson Nikola Tesla d.d., 2008.
*TR = Trouble Report

IN5140 / 2019.09.16 / Slide 25 Dag Sjøberg
– Functional suitability – Reliability – Usability – Performance efficiency – Maintainability – Portability – Compatibility – Security
System quality attributes in ISO 25010
High level concepts (e.g., quality) may be represented in subconcepts, which in turn are represented as measurable indicators

IN5140 / 2019.09.16 / Slide 26 Dag Sjøberg
Example indicators of maintainability (how easy it is to maintain a piece of software)
Conceptual level
Operational (measurable) level
Maintainability
Lines of code
Coupling Cohesion Maintainability index
…

IN5140 / 2019.09.16 / Slide 27 Dag Sjøberg
Size of source code • Lines of code without comment lines • Lines of code with comment lines • Number of classes (or files, methods, etc.)
• Lines of code • Cyclomatic complexity (McCabe) • Halstead complexity measures
Maintainability index, a formula that combines:

Cyclomatic Complexity – a measure of the number of linearly independent paths through a program's source code – you may also look at https://docs.sonarqube.org/latest/user-guide/metric-definitions/

IN5140 / 2019.09.16 / Slide 29 Dag Sjøberg
Code size versus maintainability
0 5
10 15 20 25 30 35 40 45 50 55 60
System A System B System C System D
Average effort (hours)
Java lines of code (KLOC)

IN5140 / 2019.09.16 / Slide 30 Dag Sjøberg
Structure
• Measurement theory • Concepts and Constructs • A study of Scrum versus Kanban • Group exercises this week

IN5140 / 2019.09.16 / Slide 31 Dag Sjøberg
Software Innovation (part of Tieto)
• Scandinavian software house that develops document management systems
• 350 employees, more than 400 customers • 100 developers and specialists working
document management systems • 10 development teams

IN5140 / 2019.09.16 / Slide 32 Dag Sjøberg
Study of Scrum versus Kanban
• Changed to Kanban in 2010 • Where the claimed benefits of Kanban met? • Had production, and project and product quality improved? • A study at Software Innovation was run as a research collaboration
between University of Oslo and Software Innovation
2007 2010
Scrum Kanban Waterfall

IN5140 / 2019.09.16 / Slide 33 Dag Sjøberg

IN5140 / 2019.09.16 / Slide 34 Dag Sjøberg
How to measure time?
Conceptual level
Operational (measurable) level
Lead time
Number of days from “Next” state to “Ready for release” state on the board

IN5140 / 2019.09.16 / Slide 35 Dag Sjøberg
Lead time
• Normal definition: – the time from a customer issues a request for a new or
changed feature until it is implemented and deployed in the customer’s environment
• In the context of SI, which is an in-house development company:
– The time from the team receives the request (state “Next”) until it’s ready for release (state ”Ready for release)
Even for objective data, imprecise definitions may cause different people to measure the phenomenon differently and thus obtain different results

IN5140 / 2019.09.16 / Slide 36 Dag Sjøberg
Scrum board versus Kanban board
From: Kanban and Scrum - making the most of both by Henrik Kniberg and Mattias Skarin on Dec 21, 2009
Max WIP

IN5140 / 2019.09.16 / Slide 37 Dag Sjøberg
How to measure product quality?
Conceptual level
Operational (measurable) level
Product quality
Number of weighted bugs in the severity levels: Blocking (weight 8), Critical (4), Moderate (2), and Minimal (1)
Mentimeter: Give an example of other quality attributes of software systems

IN5140 / 2019.09.16 / Slide 38 Dag Sjøberg
How to measure cost?
Conceptual level
Operational (measurable) level
Cost
Alt.1: Number of work items developed per developer per quarter
Productivity
Alt 2.:Total churn (number of lines added, deleted, or modified) per developer per quarter

Data collection
Information on 12 000 work items over 3.5 years recorded in Team Foundation Server (TFS), now called Azure DevOps Server

IN5140 / 2019.09.16 / Slide 40 Dag Sjøberg
Lead time
Bugs Features

IN5140 / 2019.09.16 / Slide 41 Dag Sjøberg
Bugs

IN5140 / 2019.09.16 / Slide 42 Dag Sjøberg
Productivity alt. 1
Bugs Features

IN5140 / 2019.09.16 / Slide 43 Dag Sjøberg
Moderator variable: Churn

IN5140 / 2019.09.16 / Slide 44 Dag Sjøberg
Productivity alt. 2
Bugs Features

IN5140 / 2019.09.16 / Slide 45 Dag Sjøberg
Qualitative evaluation • Interviewed: R&D Operations Manager, CTO, one team leader, and one
developer • The fixed timeboxes in Scrum perceived artificial • Work items frequently underestimated • Developers have to deal with ad hoc bug fixing, support, and maintenance tasks
while working on the items. Still, one was supposed to finish the items within the given timebox
• The timeline led to work items that were finished before the quality was satisfactory, that were deferred to the next iteration (which required new planning activities), or that were not finished at all. In the Kanban period, the items that had been started were finished because the developers focused on one item at a time until it was finished
• Difficult to allocate the resources optimally within the sprints. For example, the testers tended to have little to do in the beginning of a sprint and too much at the end.
• Much of the sprint start-up meetings were perceived as “waste” • Did the lack of timeboxes in Kanban lead to insufficient pressure to finish items?
The consensus stated that the combination of daily stand-up meetings and weekly status meetings, the visibility of the items’ status on the board, and the personal ambitions to complete the job constituted sufficient pressure

IN5140 / 2019.09.16 / Slide 46 Dag Sjøberg
Summary of variables in the study

IN5140 / 2019.09.16 / Slide 47 Dag Sjøberg
Summary of study
• By replacing Scrum with Kanban, SI – Almost halved the lead time – Reduced the number of bugs by 10% – Improved productivity
• SI appears to benefit from using Kanban over Scrum • Kanban should be considered by other companies that
– Difficulties with estimation – Interruptions due to ad hoc-bug fixing, support and
maintenance tasks
Full report: Dag I.K. Sjøberg, Anders Johnsen and Jørgen Solberg: Quantifying the Effect of Using Kanban versus Scrum: A Case Study. IEEE Software, Vol. 29, Nr. 5, pages 47–53, Sep./Oct. 2012

IN5140 / 2019.09.16 / Slide 48 Dag Sjøberg
Reality versus guru
Guru promise: After internal Scrum course summer 2009: ”500-800 % more productive in about a year”
500 %
800 %

IN5140 / 2019.09.16 / Slide 49 Dag Sjøberg
Structure
• Measurement theory • Concepts and Constructs • A study of Scrum versus Kanban • Group exercises this week

IN5140 / 2019.09.16 / Slide 50 Dag Sjøberg
Exercise 1 for group lecture
Select three variables (measures) that you may use in your project to measure aspects of the process, system or outcome (success). For each of them, describe whether it:
– can be measured directly (or only indirectly) – is objective or subjective – is quantitative or qualitative – is measured at the nominal, ordinal, interval or ratio scale

IN5140 / 2019.09.16 / Slide 51 Dag Sjøberg
Exercise 2 for group lecture
Complex source code is difficult to maintain • What does complexity mean? • How can we measure software complexity? • To what extent do you consider the measure Cyclomatic Complexity to
represent the concept of complexity? • How could we find out whether Cyclomatic Complexity actually
represents complexity in practice? • Would you consider software size as part (a subconcept) of
maintainability? • Is size a part of complexity? • How can we measure software size?

IN5140 / 2019.09.16 / Slide 52 Dag Sjøberg
Next week: Lean and agile software engineering
Related Documents