Welcome message from author
This document is posted to help you gain knowledge. Please leave a comment to let me know what you think about it! Share it to your friends and learn new things together.
Transcript
! "#$$#$% $
& '( $ %!% $! "%!%'$!% ")*!


Copyright © , by University of Jyväskylä

ABSTRACT Ishikawa, Masaki In vivo muscle mechanics during human locomotion Jyväskylä: University of Jyväskylä, 2005, 89 p. (Studies in Sport, Physical Education and Health, ISSN 0356-1070; 107) ISBN 951-39-2277-4Finnish summary Diss. The present series of studies were designed to examine how the interaction between muscle fibers and tendinous tissues (TT) were modulated for effective utilization of elastic energy during stretch-shortening cycle (SSC) exercises. By combining the in vivo direct recordings of tendon force with fascicle length changes by the ultrasonic techniques, the in vivo behavior of the vastus lateralis and triceps surae muscle groups was examined in several different intensity drop jumps as well as in walking and jogging. In addition, the in vivo architectural changes of fascicle-TT due to the exhausting SSC-induced fatigue were studied. The results suggest that there is intensity specific fascicle-TT interaction in the process of elastic energy utilization during SSC exercises. This intensity specificity is related to the fascicle stiffness operating to influence the power enhancement during the push-off phase of the SSC exercises. However, the efficacy of elastic recoil of TT can be limited by the drop intensity and /or contact time. In addition, the fascicles in the bi-articular (medial gastrocnemius; MG) muscle cannot necessarily show the SSC behavior in the same way as in the mono-articular muscles (VL). In comparison of the fascicle-tendon interaction between walking and jogging, the spring-like bouncing as in jogging and the catapult action as in walking were observed in the TT behavior. The process of the TT stretch-recoil can thus be different between these activities. This fascicle behavior can consequently be modified depending on the movement pattern to utilize the elasticity of TT effectively. After exhausting SSC fatigue, the time course of changes in the muscle thickness and fascicle length of the soleus muscle did not follow the biphasic pattern of changes in mechanical parameters. It can be suggested that the performance recovery after acute performance reduction can be related to the metabolic effect and increased TT compliance and that the secondary decline in MVC could be related to the increased muscle volume (thickness) and the reduction of the TT compliance. Key words: ultrasonography, tendomuscular loading, running, gait, fatigue, force-velocity relationship, catapult action, viscoelasticity

Author’s address Masaki Ishikawa Neuromuscular Research Center Department of Biology of Physical Activity University of Jyväskylä, Jyväskylä, Finland Supervisor Professor Paavo V. Komi Neuromuscular Research Center Department of Biology of Physical Activity University of Jyväskylä, Jyväskylä, Finland Reviewers Professor Marco V. Narici Institute for Biophysical and Clinical Research into Human Movement Manchester Metropolitan University, United Kingdam Professor Erik B. Simonsen Panum Institute, University of Copenhagen, Denmark Opponents Professor Roger M. Enoka Department of Integrative Physiology, University of Colorado, USA
Professor Tetsuo Fukunaga
School of Sport Sciences, Waseda University, Japan

ACKNOWLEDGEMENTS The work described in this dissertation was carried out by the author at Neuromuscular Research Center (NMRC) of the Department of Biology of Physical Activity at the University of Jyväskylä between March 2001 and May 2005. I would like to extend my sincere thanks and gratitude to: Professor Paavo V Komi, my supervisor, for first providing this opportunity and then professional and scientific guidance during my work (together with stimulating & motivating phone calls from all over the world) and for giving me the opportunities of international collaboration, and for providing the warm and confortable stay in Jyväskylä and in other places. Reviewers, Professors Marco Narici and Erik Simonsen, for their valuable comments and criticism on the manuscript of this thesis. Professors McNeill Alexander and Robert Gregor, and Drs. Boris Prilutsky and Huub Maas for providing the constructive comments on some manuscripts. Co-authors, Professor Gelt-Peter Brüggemann, Drs. Caroline Nicol, Janne Avela, Heikki Kyröläinen, Vesa Linnamo, Taija Finni, Vesa Lepola, Micheal Grey, Erick Dousset, Mr. Sami Kuitunen, Jouni Kallio, Juho Pakaslahti, and Ms. Elina Niemelä for their collaboration and useful discussions. Colleagues, Drs. Mikko Virmavirta, Jarmo Perttunen, Teemu Pullinen, Mr. Juha Isolehto, Reijo Bottas, Mika Kanervo, Jussi Peltonen, Ms. Merja Hoffrén for giving their valuable reaction to my frequent interference with questions. Professor Harri Suominen for editorial advice for the printing process of this thesis. Staff, Ms. Minna Herpola, Hellevi Labbart, Terhi Vallas, Sirpa Nykänen, Katja Pylkkänen, Sonia Hicks and the coffee-break team in the lab, for helping the paperworks and making daily life in Jyväskylä easier. I would also like to thank Mr. Aki Rautava for the great video editing and the good friendly help. Technical support staff, Ms. Marja-Liisa Romppanen, Pirkko Puttonen, Sirpa Roivas, Mr. Markku Ruuskanen and Seppo Seppälä, Risto Puurtinen, Kari Vuorinen Jouni Tukiainen, Terho Kairio-Sarja for helping and solving my problems and for providing the comfortable workplace. Mr. Juha Virenius and his staff in Alakulma, for giving good food and coffee for my daily needs. In the comfortable environment of this café. I got numerous new ideas. Professors Masahiro Kaneko, Akira Ito and Takafumi Fuchimoto at the Osaka University of Health and Sport Sciences for giving their recommendation and encouraging me to come Jyväskylä and work in Professor Komi’s team. My warmest thanks to my parents, Masakazu and Kazuko, and my brother, Yasuhiro, and sister, Naomi and her husband, Arata, and other dear

friends not only in Japan and Finland but also in other European countries for all their help and encouragements. I also gratefully acknowledge the financial supports from the University of Jyväskylä and TULES graduate school. This work has been funded by the several NMRC projects. Jyväskylä, May 2005 Masaki Ishikawa

CONTENTS ABSTRACT ACKNOWLEDGEMENTS ORIGINAL PAPERS 1 INTRODUCTION ........................................................................................ 11 2 REVIEW OF THE LITERATURE................................................................. 13
2.1 Neuromuscular basis of SSC.............................................................. 13 2.1.1 Utilization of storage and release of elastic energy during SSC................................................................................ 13 2.1.2 Pre-activation during SSC ...................................................... 14 2.1.3 Stretch reflex potentiation during SSC ................................. 15
2.2 Modification of performance potentiation in different SSC conditions...................................................................................... 15
2.2.1 Intensity specificity.................................................................. 16 2.2.2 Muscle (Joint) specificity......................................................... 17 2.2.3 Movement (task) specificity ................................................... 17
2.3 Directly measured tendon force and muscle-tendinous architecture during human movements........................................... 19
2.3.1 In vivo tendon loading measurements................................. 19 2.3.2 Tendon loading characteristics during SSC exercises ........ 19 2.3.3 Use of ultrasonography for measurement of muscle architecture.................................................................. 21 2.3.4 Fascicle-tendinous behavior during movements................ 22
2.4 Changes of the fascicle-TT architecture due to repeated SSC exercises ........................................................................................ 23
3 THE PURPOSE OF THE STUDY................................................................. 25 4 RESEARCH METHODS ............................................................................... 28
4.1 Subjects.................................................................................................. 28 4.2 Experimental design............................................................................ 28
4.2.1 Experiment 1 (I) ....................................................................... 29 4.2.2 Experiment 2 (II) ...................................................................... 30 4.2.3 Experiment 3 (III)..................................................................... 31 4.2.4 Experiment 4 (IV)..................................................................... 32 4.2.5 Experiment 5 (V) ...................................................................... 33 4.2.6 Experiment 6 (VI)..................................................................... 34 4.2.7 Experiment 7 (VII) ................................................................... 35
4.3 Measurement parameters and analyses ........................................... 36 4.3.1 Real-time ultrasonographic muscle architecture measurements (I-VII) ........................................ 36

4.3.1.1 Length measurements of fascicles............................. 36 4.3.1.2 Muscle thickness (VII)................................................. 37
4.3.2 Measurements of kinetic and kinematics parameters (I-VII) .................................................................... 38 4.3.3 Estimation of the muscle-tendon unit (MTU) and TT compartments............................................................. 38 4.3.4 Direct tendon force measurements (II, III, V) and estimated force calculations ........................................... 40 4.3.5 Electromyography (EMG) (I-VII) .......................................... 40 4.3.6 Blood sampling and analyses (VII) ....................................... 41 4.3.7 Data collection and processing .............................................. 41 4.3.8 Statistical methods................................................................... 41
5 RESULTS......................................................................................................... 43
5.1 Fascicle-TT interaction during the high intensity SSC exercises .. 43 5.1.1 Effects of different intensity conditions (I, II, III)................ 43 5.1.2 Fascicle and TT behavior in different muscles (I, III, IV, V) ............................................................................... 46 5.1.3 Fascicle-TT behavior during the short contact SSC exercises (IV) .................................................................... 47 5.1.4 Fascicle-TT behavior during the overloading SSC condition (IV) ................................................................... 49
5.2 Fascicle-TT interaction during walking and jogging on the ground (V, VI) .......................................................................... 50 5.3 Exhausting SSC fatigue effects of fascicle-TT behavior (VII) ........ 53
6 DISCUSSION.................................................................................................. 56
6.1 Characteristics of fascicle-TT interaction during the high intensity SSC exercises (I-VI) ............................................................. 57
6.1.1 Intensity specificity.................................................................. 57 6.1.2 Overloading condition............................................................ 59 6.1.3 Muscle specificity (I, IV, V) .................................................... 62 6.1.4 Movement specificity .............................................................. 63
6.1.4.1 Short contact SSC exercises ........................................ 63 6.1.4.2 Different elastic behavior between walking and jogging ................................................................... 64
6.1.4.2.1 Fascicle-TT interaction during walking and jogging.................................... 64 6.1.4.2.2 Different elastic utilization concepts......... 65 6.1.4.2.3 Advantage of catapult action during human walking.............................. 66 6.1.4.2.4 Stretch reflex activation and fascicle behavior during jogging ............................. 67
6.2 Mechanical and architectural coupling after exhausting SSC fatigue ...... 67 6.2.1 Immediate- and 2hour-after SSC fatigue effects ................. 67

6.2.2 2day-after SSC fatigue effects ................................................ 68 6.3 Methodological considerations and possible errors....................... 70
7 PRIMARY FINDINGS AND CONCLUSION.................................................. 72 YHTEENVETO............................................................................................................. 74 REFERENCES............................................................................................................... 75
ORIGINAL PAPERS This thesis is based on the following papers, which will be referred to by their Roman numerals. In addition, some data not presented in the papers are also included. I Ishikawa M, Finni T and Komi PV 2003. Behaviour of vastus lateralis
muscle-tendon during high intensity SSC exercises in vivo. Acta Physiol Scand 178: 205-213.
II Ishikawa M and Komi PV 2004. Effects of different dropping intensities
on fascicle and tendinous tissue behavior during stretch-shortening cycle exercise. J Appl Physiol 96: 848-852. Epub 2003 Oct 31
III Ishikawa M, Komi PV, Finni T and Kuitunen S. Contribution of the
tendinous tissue to force enhancement during stretch-shortening cycle exercise depends on the pre-stretch and concentric phase intensities. Submitted for publication.
IV Ishikawa M, Niemelä E and Komi PV 2005. The interaction between
fascicle and tendinous tissues in short contact stretch-shortening cycle exercise with varying eccentric intensities. J Appl Physiol Feb 10; [Epub ahead of print]
V Ishikawa M, Komi PV, Grey MJ, Lepola V and Bruggemann GP 2005.
Muscle-tendon interaction and elastic energy usage in human walking. Submitted for publication. J Appl Physiol Apr 21; [Epub ahead of print]
VI Ishikawa M, Pakaslahti J and Komi PV 2005. Elastic behavior of the
human medial gastrocnemius muscle during jogging and walking. Submitted for publication.
VII Ishikawa M, Dousset E, Avela J, Kyröläinen H, Kallio J, Linnamo V, Nicol
C and Komi PV 2005. Changes in the soleus muscle architecture after exhausting stretch-shortening cycle exercise in humans. Submitted for publication.

1 INTRODUCTION
In 1885 Marey and Demeny observed that their subjects jumped higher after a dynamic counter movement than in jumps starting from a static semi-squatting position. This potentiation phenomenon due to the counteracting movements had been first called the “wind-up” movement by Asmussen and Sorensen (1971). This combination forms a “natural” type of muscle function where the muscle undergoes active stretching prior to shortening and is now called stretch-shortening cycle (SSC) (Norman and Komi 1979). In normal locomotion, the purpose of the SSC behavior is to make the final action more powerful and effective as compared to the concentric action alone. Considerable efforts have been devoted to explain the SSC performance enhancement mechanisms performed both with isolated muscle preparations and in human experiments. The active stretch (eccentric action) enhances performance over that of isolated muscle actions of pure isometric or shortening types in experiments on isolated muscles (Cavagna et al. 1965, 1968; Cavagna and Citterio 1974; Fenn 1924; Katz 1939) and in vivo human experiments (Asmussen and Sorensen 1971; Cavagna et al. 1968; Komi 1973). They suggested that the performance potentiation of the SSC can be due to the effects of elastic potentiation. This SSC performance enhancement can also be examined from the point of view of muscle activation. Dietz et al (1979) showed that the myoelectrical activity of the leg extensor muscles could be potentiated via the reflex loops during the contact phase of the running cycle. Thus, it is likely that several factors can influence the SSC performance potentiation by interacting elastic energy utilization and/or neural potentiation. In human movements, the SSC performance enhancement has been observed during arm pull, elbow flexion, squatting with barbell, plantar flexion, running and jumping (e.g Asmussen and Sorensen 1971; Asmussen and Bonde-Petersen 1974b; Cavagna et al. 1964, 1968, 1971; Finni et al. 2001c; Komi and Bosco 1978; Svantesson et al. 1991, 1994; Takarada et al. 1997ab; Walshe et al. 1998; Yamazaki et al. 1989). Consequently, the several mechanisms have been proposed for this enhancement of power and efficiency during SSC (e.g. elastic strain energy, stretch reflex). However, the relative contribution to SSC performance enhancement of the above mechanisms across the movements is

12
still not well understood. By combining the in vivo direct recordings of tendon force with fascicle length changes by the ultrasonic techniques, we can increase our understanding of muscle mechanics in human locomotion.

2 REVIEW OF THE LITERATURE
2.1 Neuromuscular basis of SSC 2.1.1 Utilization of storage and release of elastic energy during SSC Hill (1950) and Cavagna et al. (1977) proposed that the performance potentiation in SSC may be caused by the stretch induced spring–like muscle elasticity. Consequently, the utilization of elastic energy had been discussed together with the attachment–detachment cycle of the actin-myosin cross-bridges (Bosco et al. 1981, 1982c; Huxley and Simmons 1971; Rack and Westbury 1974). This ability of muscle to store and utilize the elastic energy could be dependent on muscle factors such as the stretch velocity, muscle length (Cavagna 1977), the force attained at the end of the prestretch as well as on the coupling time between the eccentric and concentric phases of the SSC performance (Bosco et al. 1982c; Cavagna et al. 1965; Komi 1983). Alexander and Bennet-Clark (1977) argued that tendon elasticity may be much more important than muscle elasticity and estimated the elastic strain energy stored in tendons to be 5-10 times higher as compared to that stored in the muscle. In addition, the stretched tendons can recoil elastically much faster than any muscle can shorten. This return of elastic energy in tendon has been reported as approximately 93% of the work previously done when stretching it and as 7% of heat dissipation (Bennet et al. 1986). The work done in the recoil is almost independent of the shortening velocity over a wide range of speeds (Ker 1981). In line with this suggestion, Ettema (1997) have shown the minor role of work enhancement by the contractile element during shortening as compared to the elastic recoil of the serial elastic component (SEC) in the whole MTU of the rat gastrocnemius muscle. These results suggest indirectly the possible influence of tendon structure on the recoil of the SEC. In this behavior, the SSC manner of the tendon function allows the muscle fibers to contract nearly isometrically. This isometric contraction of muscle fibers during the SSC exercises can take

14
advantage of its force generating potential by the effective region of the force–length–velocity relationship, proposed as the “concerted action” by Hof et al (1983). During locomotion, tendon is stretched and energy is stored, which may be subsequently converted into kinetic energy when unloaded. However, the extent to which human aponeurosis and outer tendon can be stretched and thereby contribute to energy storage during human locomotion remains unclear. Some researchers suggested that the most of energy storage must have occurred in the aponeurosis parts (sheet-like tendon) as the majority of the outer tendon is too stiff to store significant energy (Alexander et al. 1985; Roberts et al. 1997). However, the mechanical characteristics and function of the aponeurosis and outer tendon are still under debate (Butler et al. 1984; Lieber et al. 1991, 2000; Magnusson et al. 2003; Proske and Morgan 1987; Scott and Loeb 1995; Wren et al. 2000). Therefore, the mechanisms of the utilization of elastic energy are in need of further exploration. Future work may provide predictions for the more correct mechanismic factors during the human SSC exercises. It has been suggested (van Ingen Schenau 1984; van Ingen Schenau et al. 1997) that elastic energy storage in tendon can be considered as negligible because of the heat wasting (Fenn 1930; Fenn and Marsh 1935) and small length changes in tendons (Cavagna et al. 1964; Jewell and Wilkie 1958). The storage and release of elastic energy may largely compensate for the chemical energy spent to maintain the muscle active during the stretching. On the other hand, Baratta and Solomonow (1991), Roeleveld et al (1993) and Hawkins and Bey (1997) have demonstrated that tendon stiffness remains high and within optimal levels to perform a simple force transmitting function instead of storing elastic energy. 2.1.2 Pre-activation during SSC Muscle activation prior to the ground impact (pre-activation) appears to be a preparatory necessity both for enhancement of EMG activity during the eccentric phase and for the precise timing between agonist and antagonist muscles with respect to ground contact (Gollhofer and Kyröläinen 1991, Moritani et al. 1991). This co-contraction has net effect of stiffening the joint and is most useful when precision and joint stabilization are critical. The fundamental concept for the pre-activation was first established in the 1970s by Melvill-Jones and Watt (1971) who suggested that the pre-activation is preprogrammed and executed from higher centers of the nervous system. Additional proposal is that the pre-activation may regulate the optimal fascicle length around the working ranges of the sarcomere length, where a relatively larger force can be generated during human movements (Fukunaga et al. 2002). Horita et al (1999) have also shown the possible influence of pre-activation on maintaining optimal balance between the facilitation and inhibition of peripheral system in terms of stiffness regulation after the SSC fatigue exercises.

15
2.1.3 Stretch reflex potentiation during SSC Reflex activity is used by the central nervous system in the control of posture and locomotion. When performing any task, the activity in the sensorimotor pathways is modulated to facilitate the specific demands of the task (Moritani et al. 1991; Prochazka 1989). It is commonly accepted that the short latency component of the stretch reflex is mediated by the muscle spindle group Ia afferent pathway (Matthews 1991; Taylor et al. 1985). More recently, evidence has been reported suggesting that the medium latency stretch reflex receives very likely an important contribution from the group II pathway (Grey et al. 2001). In SSC exercises, it was suggested that the reflex induced EMG activities during the braking phase (Dietz et al. 1979; Melvill-Jones and Watt 1971) can enhance the stiffness of muscle fibers (Allum and Mauritz 1984; Hoffer and Anderassen 1981; Nichols and Houk 1976; Sinkjær et al. 1988; Toft et al. 1991; Voigt et al. 1998). Although it is possible to elicit a stretch reflex in SSC action, the question arises whether the stretch reflex can contribute the force potentiation such as in rapid SSC exercises. In brief, is there time enough for reflexes to contribute to force enhancement? It has been shown (Komi and Gollhofer 1997) that the electrical latency for stretch reflex for the SOL muscle is 40-45ms after the ground contact (see also Gollhofer and Rapp 1993; Nicol and Komi 1998). As the subsequent electromechanical delay is about 10-12ms (Nicol and Komi 1999), there is time enough for stretch reflex to be elicited even during the braking phase and consequently influence the force output(Komi and Gollhofer 1997; Simonsen and Dyhre-Poulsen 1999). In line with this suggestion, the peak EMG activities during the contact of running have been shown to be almost three times higher than that measured during a maximal voluntary isometric plantar flexion test (Dietz et al. 1979). Due to the high EMG activities during the braking phase, the cross-bridge stiffness is higher than the tendon stiffness and consequently a major part of the elastic energy can be stored in TT during the braking phase of SSC (Alexander and Bennet 1977; Gollhofer et al. 1984). This observation, in which the enhanced stiffness of muscle fibers has an advantage for the storage of elastic energy in TT (Gollhofer et al. 1984; Horita et al. 1996; Kyröläinen et al. 1990), supports the concept of a “concerted contraction” for effective elastic recoil as proposed by Hof et al (1983). 2.2 Modification of performance potentiation in different SSC
conditions
As suggested by Biewener and Roberts (2000), under dynamic movements, the timing and rates of force activation and relaxation, together with the ability to sustain force at a reasonably high level during substantial fiber shortening, are
16
essential to achieve a high power output. It remains questionable, however, how the process of storage and recoil of TT behavior is modified differently by the jumping strategy. Elastic energy utilization and myoelectric potentiation have been identified as possible sources of the stretch-induced gains in muscle function (see also above). For example, Bosco et al (1982a) have estimated the relative contribution of elastic recoil (72%) and reflex potentiation (28%) to total performance potentiation in the SSC as compared to pure concentric action. Also in animal measurements, several values are reported (Biewener et al. 1998; Prilutsky et al. 1996b; Roberts et al. 1997). However, it appears that the relative contribution of each mechanism varies across movements. In line with this suggestion, efficiency of the positive work reportedly ranges widely from 20% to 80% for walking, running and other SSC exercises (Asmussen and Bonde-Petersen 1974b; Cavagna and Citterio 1974; Cavagna and Kaneko 1977; Cavagna and Franzetti 1981; Ito et al. 1983; Kyröläinen and Komi 1995; Kyröläinen et al. 1995; Margaria 1938; Pierrynowski et al. 1981). These studies have revealed that SSC performance enhancement can be induced by varying contribution from each mechanism. It has been proposed that the SSC performance enhancement depends on the rate of muscle stretch (Asmussen and Bonde-Petersen 1974a; Bosco et al. 1981), the time of transition from the stretch to shortening (Bosco et al. 1981; Komi 1983; Thys et al. 1972), the muscle properties (Dyhre-Poulsen et al. 1991; Viitasalo and Bosco 1982), muscle temperature (Asmussen et al. 1976), body-mass (Taylor et al. 1970), gender (Bosco and Komi 1980; Komi and Bosco 1978), and age (Bosco and Komi 1980). The following paragraphs review aspects that are relevant to the present research project. 2.2.1 Intensity specificity Efficiency of positive work has received a wide range of values when measured during SSC exercises. In all cases, however, the reported efficiencies exceed those of the pure concentric efficiency (Aura and Komi 1986a; Bosco et al. 1982c; Cavagna and Kaneko 1977). Cavagna (1977) suggested that the differences of these efficiency values could be affected by the prestretch and subsequent rebound phases. Under varying intensity SSC exercises, the mechanical and metabolic effects have been examined and the results showed that the elastic energy can be utilized and metabolic demands reduced when the prestretch intensity is increased (Asmussen and Bonde-Petersen 1974a; Aura and Komi 1986a, b; Bosco et al. 1982c). However, some reports suggested that the efficiency in higher running speeds is constant throughout the whole speed range (Ito et al. 1983) or that it may even decrease at very high speeds (Kaneko et al. 1985). These discrepancies may be accounted for by further examining these phenomena on muscle fiber and tendon levels during the various SSC intensity movements. It is of interest to know how the separate compartments (contractile and elastic components) change in length during SSC. Several studies tried to examine the interaction between muscle and tendon elasticity
17
during the various jumps by using indirect estimation (Belli and Bosco 1992; Hof et al. 1983; Voigt et al. 1995a,b). However, the interaction between contractile and elastic components by the prestretch and subsequent rebound phase intensities have not yet been fully explored. Recent development in ultrasonography and direct tendon force measurements can provide better tools for understanding the fascicle-TT interaction during the human locomotion. During the initial ground contact of DJs, for example, the reflexes from muscle spindles and tendon organs play important roles in adjustment to external disturbances. Primary and secondary endings in the muscle spindle are the most important receptors being sensitive to length change, while the Golgi tendon organs are sensitive to force change. The magnitude of the stretch load will then determine which of these reflexes will dominate. It is expected that in the drop jump test the stretch load can be so high that the inhibitorory influence from the Golgi tendon organs surpasses the facilitatory “potentiating” effects of the muscle spindles. Indirect evidence for this has been presented (Bosco et al. 1981). This would then explain at least partly the decrease of jumping performance with greater dropping heights. It is expected that proper training will have influence both on the viscoelastic behavior of muscle and on the thresholds for reflex activations both from the muscle spindles and Golgi tendon organs. 2.2.2 Muscle (Joint) specificity Elftman (1939) suggested that bi-articular muscles might play an important role for energy saving during human locomotion. This point has been further studied by several researchers (Bobbert and Ingen Schenau 1988; Gregoire et al. 1984; Ingen Schenau et al. 1987; Ingen Schenau et al. 1992; Ingen Schenau et al. 1995; Jacobs and Ingen Schenau 1992; Jacobs et al. 1993). They suggested that during SSC exercises, the presence of bi-articular muscles may decrease the negative and positive work required at the joints (Elftman 1940; Morrison 1970; Prilutsky et al. 1996a,b; Wells 1988) due to the opposite angle changes between joints. Consequently, the peak power in each muscle occurs at different region of the velocity-power domain bi- and mono-articular muscles (Wickiewicz et al. 1984). The question arises how these possible functional differences in the two types of muscles may be related to possible differences in the fascicle level behavior. This is especially important as, for example that the bi-articular muscle (MG) offsets the lengthening and shortening effects during the braking phase of the SSC movements. 2.2.3 Movement (task) specificity Running and hopping are commonly modeled as a spring-mass system (Cavagna et al. 1976; 1997). The stiffness of leg spring remains the same at all
18
speeds during running (Farley et al. 1993; He et al. 1991; Kuitunen et al. 2002) or varies with varying their hopping frequency in hopping (Farley et al. 1991; Farley and Morgenroth 1999). On the muscle-tendon interaction level, it is possible to modify the muscle fiber- tendon interaction due to oscillating at a natural frequency that is adjustable by muscle stiffness during SSC exercises. In agreement with this suggestion, Walse et al (1998) suggested that a potential difference in the use of elastic strain energy may be explained by the concept of resonance frequency of MTU. The question arises that it is possible to store and subsequently utilize the TT elastic energy effectively during the short contact SSC exercises. Additional important question to be asked relates to the problem of energy saving mechanism, for example, between walking and running. In human locomotion, there are two fundamental concepts for different energy conserving mechanisms. First, mechanical energy stored in the elastic elements of muscle can be recovered as both kinetic and gravitational energy (spring-like bouncing mechanism). Second, gravitational potential energy is converted to kinetic energy as the leg swings in a pendulum-like mechanism. Both of these mechanisms are important for the mechanics and energetics of locomotion (Cavagna et al. 1976, 1977). In running or jumping, it has been proposed that skeletal muscle stores energy by the active stretching due to inertial, gravitational, or any other external forces during the first half of the stance phase of the step cycle and then immediately returns this energy effectively over the latter part of the stance phase as a spring-like bouncing mechanism (for a review, see Alexander 2002; Ker et al. 1987). In walking, the pendulum mechanism provides a basis for energy saving. The muscles perform the external positive work at each step effectively just to give an additional push forward during the middle of the double-stance phase and to complete the vertical lift during the middle of single-stance phase to sustain the forward speed changes. Thus, the recovery of mechanical energy through a pendulum-like motion, in which the potential and kinetic energy exchanges are conveniently in opposite phases, can be utilized for energy saving (Cavagna et al. 1963). In human walking, however, the energy saving may not necessarily come from the pendulum type action alone. When a person walks in simulated reduced gravity condition, his/ her net metabolic cost does not decrease according to body weight (Farley and McMahon 1992; Griffin et al. 1999). These authors suggest that the relatively small decrease in metabolic cost in the reduced gravity condition cannot be explained by a mismatch of kinetic and gravitational potential energy that would compromise the pendulum energy exchange. Consequently, other mechanisms have also been proposed for the energy saving during human locomotion (Fukunaga et al. 2001; Hof 2003; Prilutsky and Zatsiorsky 1994; Prilutsky et al 1996c; Zatsiorsky et al. 1994).

19
2.3 Directly measured tendon force and muscle-tendinous architecture during human movements The classic muscle force-velocity (F-V) relationship was first established by Levin and Wyman (1927), Hill (1938) and Katz (1939). Later, the relationship has been shown in the cross-bridge (Hill 1964; Huxley 1957), single muscle fiber (Edman et al. 1978) and human muscles (Asmussen et al. 1965; Komi 1973; Tihanyi et al. 1982; Wilkie 1959). This relationship is important in neuromuscular control, but it is difficult to apply to human locomotion. These experimental evidences were obtained by the artificial situations on a maximally activated muscle under steady-state condition (c.f. a constant activation level, at a constant velocity and /or load). It is known that during natural human locomotion, activation level and frequency are usually varied and muscle length and velocity also are changing. Furthermore, the interaction between contractile and elastic components during SSC also influences the instantaneous F-V relationship. The experimental evidence for these problems was shown by the comparison of the instantaneous force-length relationship based on the work done by an isolated muscle (Cavagna and Citterio 1974), cat walking (Gregor et al. 1988), human running (Komi 1990) and human jumping (Finni et al. 2003a). Thus, information on direct tendon forces and length changes of muscle fibers and tendons during human movement can be helpful for understanding why the classical F-V relationship is not applicable to the SSC concept. 2.3.1 In vivo tendon loading measurements Since Salmon (1969) developed the in vivo tendon transducer method (buckle type) in animal experiments, a lot of animal experiments have been performed to measure tendon force during the dynamic activities. In human experiments, the first in vivo tendon force measurements was performed during slow walking by Komi et al (1984). In the series of transducer development the projects of Komi and his colleagues began with the E-form transducer (Komi et al. 1984), followed then by experiments with the buckle transducer (Komi et al. 1985) and later (Komi et al. 1995) with the novel less invasive optic fiber techniques. TABLE 1 lists various projects performed with these different transducers. 2.3.2 Tendon loading characteristics during SSC exercises The individual tendon loading is naturally dependent on how specifically the movement influence the respective joints. Fukashiro and Komi (1987) reported that the peak Achilles tendon force (ATF) of the maximal squat jump (2.2 KN) was slightly higher than that of counter movement jump (1.9 KN). In addition,

20
the peak ATF of the submaximal hopping was further higher (4.0 KN). In human running, the highest maximal ATF has been attained already at a speed of 6m· s-1, in which case the value was 9KN corresponding to 12.5 BW. The potentiation mechanism during SSC been approached from the instantaneous F-V relationship. These animal (Gregor et al. 1988) and human (Komi et al. 1992; Finni et al. 2001a) experiments suggested the potentiation during the concentric phase (shortening action phase). However, these instantaneous F-V curves cannot show the details of the force and velocity enhancement during the SSC exercises, because these measurements were done on the MTU level. It is of interest to look at the role and behavior of the contractile and elastic components in influencing the instantaneous F-V relationship. TABLE 1 In vivo tendon force measurements during natural human locomotion
Reference Year Tendon Transducer type
1) Gollhofer et al. 1984 Achilles (AT) Metal frame (Non invasive) Locomotion (1.4-3.9 m/s)
2) Komi et al. 1984 AT E-fiorm (invasive) Slow walking
3) Komi et al. 1985 AT Buckle (invasive) Walking (1.2-1.8 m/s), Running (3-9 m/s)
4) Gregor et al. 1987 AT Buckle (invasive) Cycling
5) Komi PV. 1990 AT Buckle (invasive)
6) Gregor et al. 1991 AT Buckle (invasive) Cycling
7) Komi et al. 1992 AT Buckle (invasive) SJ, CMJ, Hopping
8) Fukashiro et al. 1993 AT Buckle (invasive) SJ, CMJ
9) Fukashiro et al. 1995 AT Buckle (invasive) SJ, CMJ, Hopping
10) Nicol et al. 1995 AT Optic (invasive) Ankle dorsiflexion reflex
11) Gollhofer et al. 1995 AT Optic (invasive) Ankle dorsiflexion reflex
12) Komi et al. 1995AT, Patella,Bicepsbrachii
Optic (invasive)
13) Finni et al. 1998 AT Optic (invasive) Walking (1.1-1.8 m/s)
14) Arndt et al. 1998 AT Optic (invasive) Isometric plantarflexions
15) Nicol & Komi 1998 AT Optic (invasive) Passive dorsiflexion stretches
16) Finni et al. 2000 AT, Patella Optic (invasive) Submaximal SJ and CMJ
17) Finni et al. 2001 a AT, Patella Optic (invasive) Hopping
18) Finni et al . 2001 b Patella Optic (invasive) Submaximal SJ, CMJ and DJ
19) Finni et al. 2001 c Patella Optic (invasive) Maximal knee extension (SSC), CMJ and DJ
20) Finni & Komi 2002 Patella Optic (invasive) Submaximal SJ and DJ
21) Finni et al. 2003 Patella Optic (invasive) Knee extension (eccentric and concentric)
22) Kyröläinen et al. 2003 AT Buckle (invasive) Running (3, 5m/s), Long jump
Movement(s)
Walking (1.2-1.8 m/s), Running (3-9m/s) and Jumping
Isometric plantar flexion,Isometric knee extension,Isometric elbow flexion
21
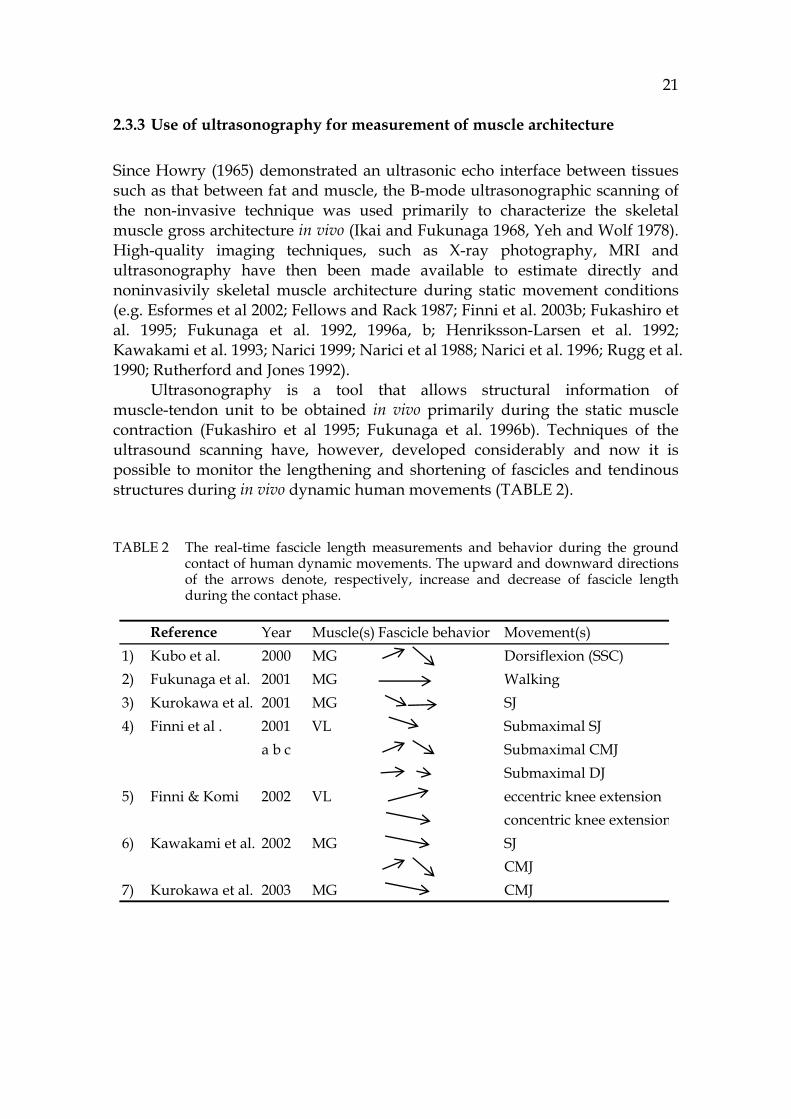
2.3.3 Use of ultrasonography for measurement of muscle architecture Since Howry (1965) demonstrated an ultrasonic echo interface between tissues such as that between fat and muscle, the B-mode ultrasonographic scanning of the non-invasive technique was used primarily to characterize the skeletal muscle gross architecture in vivo (Ikai and Fukunaga 1968, Yeh and Wolf 1978). High-quality imaging techniques, such as X-ray photography, MRI and ultrasonography have then been made available to estimate directly and noninvasivily skeletal muscle architecture during static movement conditions (e.g. Esformes et al 2002; Fellows and Rack 1987; Finni et al. 2003b; Fukashiro et al. 1995; Fukunaga et al. 1992, 1996a, b; Henriksson-Larsen et al. 1992; Kawakami et al. 1993; Narici 1999; Narici et al 1988; Narici et al. 1996; Rugg et al. 1990; Rutherford and Jones 1992). Ultrasonography is a tool that allows structural information of muscle-tendon unit to be obtained in vivo primarily during the static muscle contraction (Fukashiro et al 1995; Fukunaga et al. 1996b). Techniques of the ultrasound scanning have, however, developed considerably and now it is possible to monitor the lengthening and shortening of fascicles and tendinous structures during in vivo dynamic human movements (TABLE 2). TABLE 2 The real-time fascicle length measurements and behavior during the ground
contact of human dynamic movements. The upward and downward directions of the arrows denote, respectively, increase and decrease of fascicle length during the contact phase.
Reference Year Muscle(s) Fascicle behavior Movement(s)1) Kubo et al. 2000 MG Dorsiflexion (SSC)2) Fukunaga et al. 2001 MG Walking3) Kurokawa et al. 2001 MG SJ4) Finni et al . 2001 VL Submaximal SJ
a b c Submaximal CMJSubmaximal DJ
5) Finni & Komi 2002 VL eccentric knee extension concentric knee extension
6) Kawakami et al. 2002 MG SJCMJ
7) Kurokawa et al. 2003 MG CMJ
22
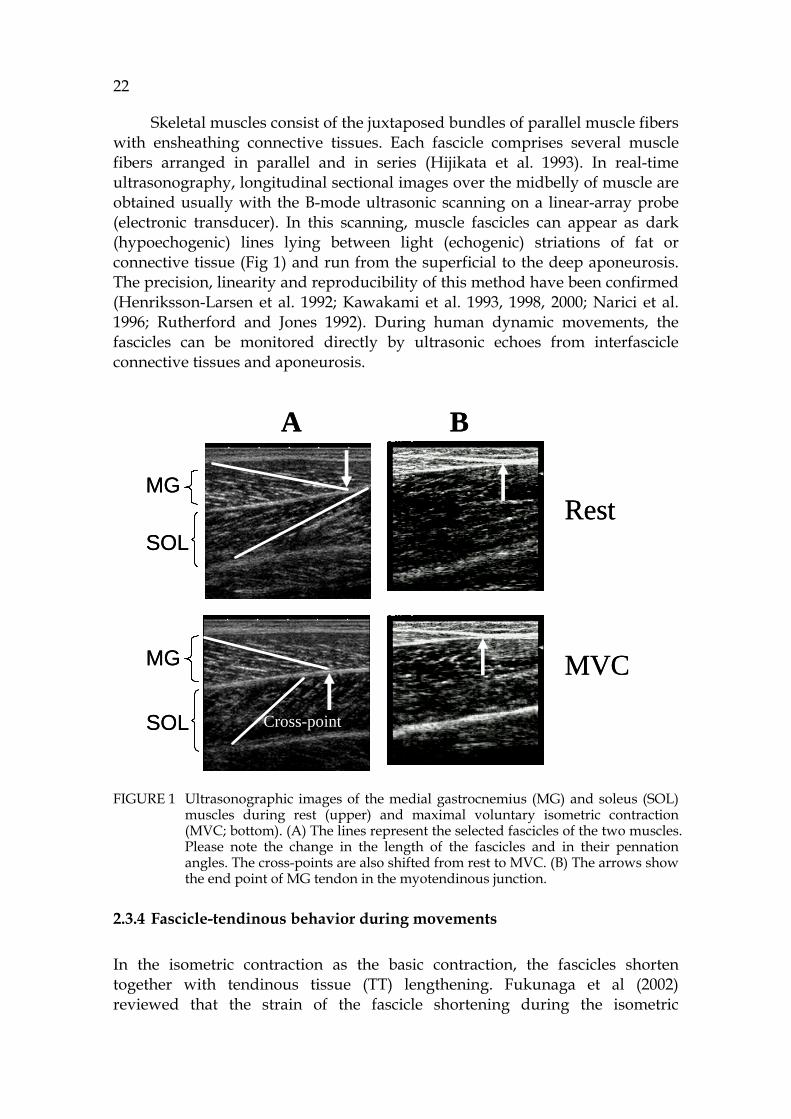
Skeletal muscles consist of the juxtaposed bundles of parallel muscle fibers with ensheathing connective tissues. Each fascicle comprises several muscle fibers arranged in parallel and in series (Hijikata et al. 1993). In real-time ultrasonography, longitudinal sectional images over the midbelly of muscle are obtained usually with the B-mode ultrasonic scanning on a linear-array probe (electronic transducer). In this scanning, muscle fascicles can appear as dark (hypoechogenic) lines lying between light (echogenic) striations of fat or connective tissue (Fig 1) and run from the superficial to the deep aponeurosis. The precision, linearity and reproducibility of this method have been confirmed (Henriksson-Larsen et al. 1992; Kawakami et al. 1993, 1998, 2000; Narici et al. 1996; Rutherford and Jones 1992). During human dynamic movements, the fascicles can be monitored directly by ultrasonic echoes from interfascicle connective tissues and aponeurosis. FIGURE 1 Ultrasonographic images of the medial gastrocnemius (MG) and soleus (SOL)
muscles during rest (upper) and maximal voluntary isometric contraction (MVC; bottom). (A) The lines represent the selected fascicles of the two muscles. Please note the change in the length of the fascicles and in their pennation angles. The cross-points are also shifted from rest to MVC. (B) The arrows show the end point of MG tendon in the myotendinous junction.
2.3.4 Fascicle-tendinous behavior during movements In the isometric contraction as the basic contraction, the fascicles shorten together with tendinous tissue (TT) lengthening. Fukunaga et al (2002) reviewed that the strain of the fascicle shortening during the isometric
MG
SOLRest
MVC
Cross-point
MG
SOL
A B
MG
SOLRest
MVC
Cross-point
MG
SOL
A B

23
contraction are different depending on muscles, suggesting the different tendon elasticity. In the eccentric and concentric contractions of the knee extension muscles (vastus lateralis), fascicles shorten in the concentric contraction and lengthen in the eccentric contraction. On the TT level, however, TT does not necessarily follow shortening and lengthening during these contractions, respectively (Finni et al. 2003a). In animal and human dynamic movements, the fascicle-TT interaction has been measured relatively low intensity movements and / or small animals. In slow treadmill walking with animals (Griffith 1991; Hoffer et al. 1989) and humans (Fukunaga et al. 2001), the gastrocnemius muscle fibers remain isometric or shorten when the foot is in contact with the ground. In human jumping movements, it was reported that TT was stretched prior to shortening during the squat and counter movement jumps (Kurokawa et al. 2001, 2003). These results suggest that tendon compliance can play an important role not only during SSC exercises but also during the static movements. 2.4 Changes of the fascicle-TT architecture due to repeated SSC exercises The exhausting SSC-induced fatigue exercise can lead to acute and delayed (secondary) reduction of neuromuscular performance, supporting the bimodal recovery concept (Faulkner et al. 1993; Komi 2000; MacIntyre et al. 1996). This includes reductions in the maximal activation of muscle and the force generated in maximal voluntary contraction (MVC) (Avela et al. 1999; Nicol et al. 1996) as well as in the performance of maximal SSC (Avela et al. 1999; Gollhofer et al. 1987; Nicol et al. 1996). These deteriorations are coupled with the complex metabolic, mechanical, and neural changes (See Nicol and Komi 2000 for a review). It seems evident that fatiguing SSC exercises can be associated with structural skeletal muscle damage and associated soreness (Horita et al. 1996; Nicol et al. 2003) in the manner observed frequently for the pure eccentric fatigue mode (see Cheung et al 2003; Jones et al. 1987 for reviews). However, literature lacks information regarding the mechanical changes of muscle fiber-tendinous tissues (outer tendon and aponeuroses; TT) following the SSC-induced fatigue. In the eccentric fatigue studies, Morgan (1990) discussed the possible non-uniform stretching of sarcomeres in series, which indicated the existence of overstretched sarcomeres in damaged muscle. These damaged sarcomeres can increase the series compliance and shift in the active tension-length relation in the direction of longer muscle lengths (Komi and Rusko 1974; Morgan 1990; Whitehead et al. 2001). On the TT level, the decrease in compliance of tendons after cyclic contraction is a well known phenomenon from in vitro studies (Abrahams 1967; Schwerdt et al. 1980; Rigby 1964). In the recent in vivo measurements, it has

24
been reported that the TT compliance can change during high intensity isometric fatigue (Kubo et al. 2001a, b; Maganaris 2003; Maganaris et al. 2002) but not if the isometric fatigue load is very submaximal (Mademli et al. 2005). In the eccentric fatiguing protocols, it was suggested that the tendon compliance may be increased due to the overstretched sarcomeres in damaged muscle (Proske and Morgan 2001). Thus, it is of interest to examine how these results can be applied for interpretation of the repeated SSC exercises. In addition, evident from the fatigue studies of either pure eccentric or more complex SSC type that muscle swelling occurs for a few days (Chleboun et al. 1998) after the intensive and exhausting fatigues. For the present protocol and project, this gives a challenge to monitor these phenomena with ultrasound techniques. It is expected that possible swelling does not only reflect the change in the muscle thickness, but it may also be related to the mechanical performance changes, such as stiffness characteristics.
3 THE PURPOSE OF THE STUDY
As has become obvious from the cited literature, the neuromuscular function has still been studied only in limited way during in vivo human SSC movements. Especially important is to look into the events related to the mechanical behavior of MTU. This challenging task is naturally dependent on tools available to capture the various components inside MTU. Recent developments in ultrasonography have made it possible to measure real-time fascicle length changes during human movements (Fukunaga et al. 1996b). It is of interest to examine how the separate compartments (contractile and elastic components) changes in length during SSC. This is particularly relevant because the length change in MTU does not necessarily coincide with the length changes experienced by muscle fascicles and TT during the low intensity SSC (Fukunaga et al. 2001). It is important to examine the interaction between muscle fibers and TT and its effects on the process of storage and subsequent recoil of elastic energy during SSC action. Therefore, in the present series of experiments, by combining the novel optic fiber transducer method for in vivo tendon loading and ultrasonography for real-time fascicle length changes, the in vivo muscle mechanics during human locomotion could be explored. The detailed purpose of the present study can therefore be outlined as follows: 1) In low intensity human movements (slow walking, SJ, submaximal CMJ
and DJ), the fascicle-TT behavior can behave differently depending on the task and exercise intensity. Therefore, the first aim of the present study was to examine the fascicle-TT behavior during high intensity SSC exercises and to observe how the fascicle-TT interaction is modulated depending on the SSC intensity. We hypothesized that there is a task dependency on the fascicle-TT interaction to utilize the elastic energy effectively during high intensity SSC exercises (I, II, III)
2) There are arguments in the literature suggesting that the fascicles can
maintain a constant length (Belli and Komi 1992; Hof et al. 1983; Robbert et

26
al. 1997), shorten (Griffiths 1991; Hoffer et al. 1989; Kurokawa et al. 2003) or lengthen (Finni et al. 2001) during the early phase of the ground contact of SSC exercises. The question arises whether the fascicle behavior during human locomotion can be generalized from one specific muscle only. Consequently, the behavior of the fascicles from different muscles was examined during varying SSC exercises. It was hypothesized that the fascicles in bi-articular muscle cannot necessarily show the SSC behavior in the same way as in mono-articular muscles during the SSC exercises (I, IV, V)
3) Recent studies have reported that the storage and recoil of elastic energy
can play important role during SSC exercises (Fukunaga et al. 2001; Kawakami et al. 2002; Kurokawa et al. 2003). However, these SSC exercises have a relatively low intensity and /or a limited movement range. The question arises whether the elastic recoil is performed at all in the short contact high intensity DJ exercises such as running and hopping. To clarify the relative contribution of elastic recoil in TT, the fascicle-TT interaction was studied during the short contact high intensity DJ exercises. It was hypothesized that the effective TT recoil can be limited during SSC exercises (IV, VI).
4) A common finding of many DJ studies is that as the height of the drop
preceding the rebound is increased, performance can initially improve (Asmussen and Bonde-Petersen 1974a; Bosco et al. 1981), but eventually will decrease (Komi and Bosco 1978; Walshe and Wilson 1997). These DJ performances may be indirectly affected by the extreme impact load and the potential of the mechanical properties of MTU. In the human muscle fiber-TT interaction behavior, however, we have not enough knowledge how this interaction occurs during extreme drop intensity load DJ exercises. Thus, a study was designed to examine the behavior of fascicle-tendinous tissue interaction during the extreme high drop intensity load DJ exercises. We hypothesized that the stretch load upon impact is so extreme that MG fascicles could neither shorten nor maintain the constant length during the braking phase. Consequently, the extreme intensity drop jump cannot utilize the elastic energy effectively (IV).
5) Compared with running, walking has rather long ground contact
associated with a relatively low braking force. This makes walking inferior with regard to the utilization of elastic energy in muscle-tendon structures. Energy can still be saved in walking through a pendulum-like mechanism. However, a recent human walking study suggests that tendon compliance can play an important role during walking (Fukunaga et al. 2002). Consequently, it is of interest to know how elastic energy can be stored and released efficiently during the stance phase of natural human walking on level ground. The purpose is to examine the fascicle-TT interaction

27
during natural human walking and jogging and to explore the different process to allow utilization of the elastic energy storage and its release. It was hypothesized that the fascicle behavior may be modified depending on the movement pattern to utilize the elasticity of TT effectively (V, VI).
6) From a number of SSC fatigue studies, it seems evident that fatiguing SSC
exercises can be associated with structural skeletal muscle damage and associated soreness (Horita et al. 1999; Nicol et al. 1996) in the manner observed frequently for the pure eccentric fatigue mode (for reviews see Cheung et al. 2003; Jones et al. 1987). Literature lacks information regarding the mechanical changes of muscle fiber-TT following the SSC-induced fatigue. The in vivo architectural changes of MTU after exhaustive SSC exercises were therefore studied. It was hypothesized that there is coupling between mechanical and architectural coupling after exhausting SSC fatigue (VII).

4 RESEARCH METHODS
4.1 Subjects Total of 62 volunteers (57 men, 6 women) participated in the series studies. The physiological characteristics of subjects in each experiment are presented in TABLE 3. The subjects were informed of the risks and benefits associated with the experiments and gave their written consent. All studies were approved by Ethics Committee of the University of Jyväskylä, Finland. The use of the optic fiber transducer in these studies (I, III, V) was approved by the ethics committee of the Central Hospital of Central Finland. TABLE 3 Physical characteristics of the subject groups (Mean±SD) 4.2 Experimental design Five separate experiments were used in this series studies. The first experiment utilized a special sledge apparatus (Fig 2) which allowed application of different intensity DJ performances (I, II, III). The second experiment was performed with the various intensity short contact DJ measurements on the ground (IV). The third experiment involved measurements of direct in vivo Achilles tendon force and muscle fascicle length changes during the walking
Experiment 1 2 3 4 5 6 7n=8 n=10 n=10 n=11 n=8 n=7 n=8
Age (yrs) 25.4±2.0 26.4±2.4 26.0±3.0 23.8±1.5 28.4±5.0 26.6±2.7 29.3±5.6Height (cm) 181±2.9 178.1±2.7 180.1±5.2 169±7.4 171.8±4.3 183.4±6.0 178.9±9.6Body mass (kg 76.7±4.5 73.2±4.0 76.1±4.1 64.3±8.0 71.7±7.2 80.9±15.2 81.4±12.8Original paper I II III IV V VI VII

29
(V). In the fourth experiment, the fascicle-TT interaction was compared between walking and jogging (VI). The fifth experiment was designed to explore the muscle-tendon interaction during the exhaustive SSC fatigue on the sledge (VII). FIGURE 2 The sledge apparatus system for the controlled jump test (for details, of the
apparatus, the reader is referred to e.g. Aura and Komi 1986b; Kaneko et al. 1984).
4.2.1 Experiment 1 (I) The subjects were fastened to a sledge apparatus (Kaneko et al. 1984; Kyröläinen and Komi 1995), having an angle of 20.3° in respect to horizontal position, and first tested for unilateral sledge jumps from a squat position (SJ; knee and ankle angle were 105° and 90°, respectively) to find their maximum squat jumping height (SJH). The subjects then performed unilateral drop jumps (DJ) from a constant dropping height (80% of SJH) to three different predetermined rebound heights in a random order. The rebound heights were designated as 80% of SJH, 90% of SJH, and 110% of SJH intensities. During jumping tasks the subjects were provided with visual feedback in order to maintain the predetermined lowest position of knee angle of 105° (180° is full extension) and the target jumping height (Fig 3). The drop and rebound heights were well practiced in advance. The sledge seat displacements were confirmed by on-line monitoring immediately after each trial. The jumps were accepted if the rebound height was within ±2 % of the target rebound height. The measured parameters included the reaction forces (Fz, perpendicular to the movement plane of the sledge seat), sledge displacement, and electromyographic activities (EMG) from vastus lateralis (VL) and gastrocnemius medialis (MG) muscles. The jumping performances were

30
recorded with a videotape at 200 Hz from the right side of the subject. Real-time ultrasound devices (SSD-2000, Aloka, Japan) were used to measure two-dimensional geometry characteristics of fascicles of VL and MG muscles (Finni et al. 2003a; Fukunaga et al. 2001; Kawakami et al. 2002) during the tasks. In addition, one subject repeated the jumping protocol with an optic fiber force transducer inserted into his patellar tendon in order to measure the in vivo patella tendon loading. FIGURE 3 Schematic presentation of the experimental protocol (I). The sledge DJs were
performed unilaterally. The subject was dropped from a constant drop height and he then immediately rebounded differently as shown with relative intensity values.
4.2.2 Experiment 2 (II) Experiment 2 was based on the same experimental design as experiment 1, but now the dropping heights varied and rebound intensity kept constant (Fig 4). After the subjects performed the maximum SJ to determine the target rebound jumping height (80% of SJH), four different dropping heights were then designated as 80% of SJH, 90% of SJH, 110% of SJH and 130% of SJH intensities (II). The subjects performed these unilateral DJs from the predetermined different dropping intensities to a constant rebound height (80% of SJH) in a random order. Under these conditions, several parameters were recorded such as EMG activity from the vastus lateralis (VL), rectus femoris (RF), MG, soleus (SOL) muscles.
Constant drop Different rebound intensities
80% SJH80% SJH
90% SJH90% SJH
110% SJH110% SJHKnee joint angle at the lowest position is constant .
80% SJH

31
FIGURE 4 Schematic presentation of the experimental protocol (II). The sledge DJs were
performed unilaterally. The subject was dropped from four different heights and then he immediately rebounded to a constant rebound height.
4.2.3 Experiment 3 (III) Experiment 3 varied the dropping and rebound heights differently from the previous experiments to explore in further detail the mechanism the fascicle-TT interaction. The reference drop and rebound heights were now predetermined as 80% of SJH (Fig 5). Two kinds of drop and rebound heights were then used for the following two ways: 1) by increasing concentric work but maintaining the preceding prestretch intensity and 2) by increasing prestretch intensity but keeping the subsequent concentric phase intensity constant. More specifically this arrangement resulted in the following three comparisons: FIGURE 5 Schematic presentation of the experimental protocol (III).
Constant reboundDifferent drop intensities
80% SJH
90% SJH
110% SJH
130% SJH
80% SJH
Constant drop height 80%SJ 110% SJ
80% SJ
DJ ref
RHigh
DJ ref vs. Rebound high (RHigh )DJ ref vs. Drop high (DHigh )
Constant rebound height80% SJ
80% SJ80% SJ
DJ ref
DHigh
110% SJ
32
i) the higher drop (110% of SJH) and reference rebound height (80% of SJH) condition (DHigh),
ii) the reference drop and rebound (both 80% of SJH) height condition (DJref), iii) the reference drop (80% of SJH) and higher rebound (110% of SJH) height
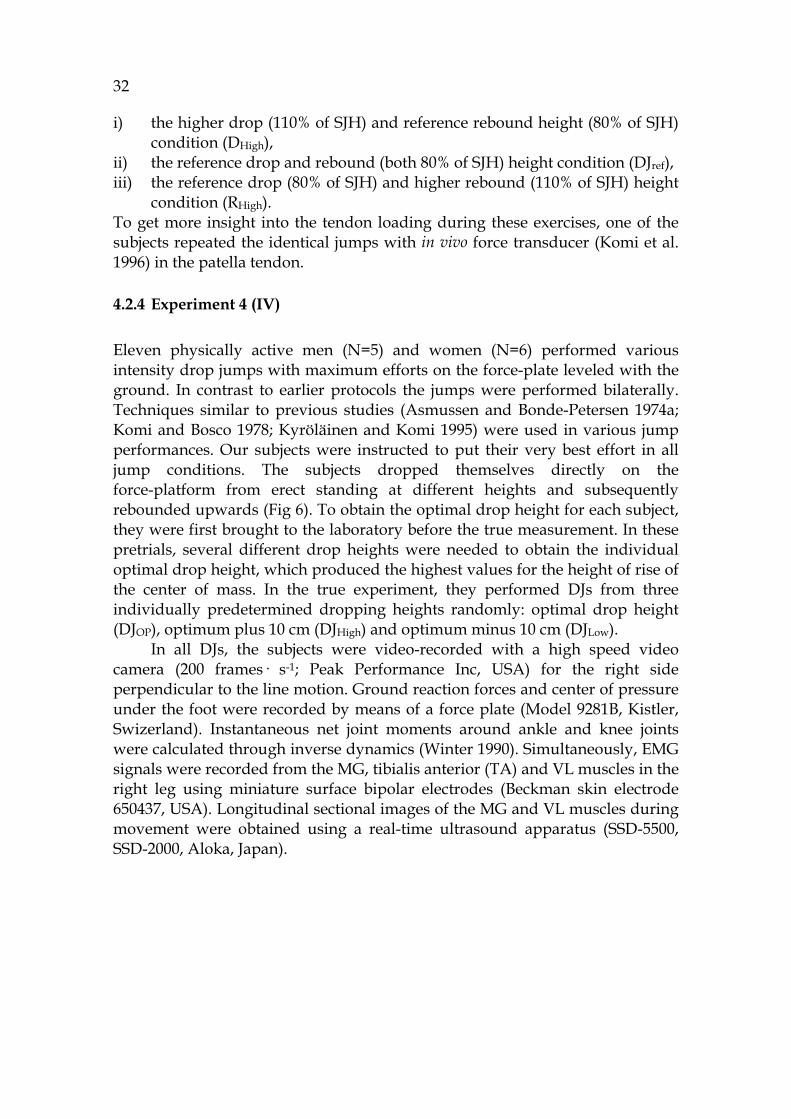
condition (RHigh). To get more insight into the tendon loading during these exercises, one of the subjects repeated the identical jumps with in vivo force transducer (Komi et al. 1996) in the patella tendon. 4.2.4 Experiment 4 (IV) Eleven physically active men (N=5) and women (N=6) performed various intensity drop jumps with maximum efforts on the force-plate leveled with the ground. In contrast to earlier protocols the jumps were performed bilaterally. Techniques similar to previous studies (Asmussen and Bonde-Petersen 1974a; Komi and Bosco 1978; Kyröläinen and Komi 1995) were used in various jump performances. Our subjects were instructed to put their very best effort in all jump conditions. The subjects dropped themselves directly on the force-platform from erect standing at different heights and subsequently rebounded upwards (Fig 6). To obtain the optimal drop height for each subject, they were first brought to the laboratory before the true measurement. In these pretrials, several different drop heights were needed to obtain the individual optimal drop height, which produced the highest values for the height of rise of the center of mass. In the true experiment, they performed DJs from three individually predetermined dropping heights randomly: optimal drop height (DJOP), optimum plus 10 cm (DJHigh) and optimum minus 10 cm (DJLow). In all DJs, the subjects were video-recorded with a high speed video camera (200 frames· s-1; Peak Performance Inc, USA) for the right side perpendicular to the line motion. Ground reaction forces and center of pressure under the foot were recorded by means of a force plate (Model 9281B, Kistler, Swizerland). Instantaneous net joint moments around ankle and knee joints were calculated through inverse dynamics (Winter 1990). Simultaneously, EMG signals were recorded from the MG, tibialis anterior (TA) and VL muscles in the right leg using miniature surface bipolar electrodes (Beckman skin electrode 650437, USA). Longitudinal sectional images of the MG and VL muscles during movement were obtained using a real-time ultrasound apparatus (SSD-5500, SSD-2000, Aloka, Japan).

33
FIGURE 6 Schematic representation of the experimental set-up. The ultrasound (US)
probes were fixed into the vastus lateralis (VL) and medial gastrocnemius (MG) muscles. Reflective marks were placed on the trochanter major, center of rotation of the knee, lateral malleolus, heel and fifth metatarsal head of the subject to record jumping motion by using the hi-speed camera.
4.2.5 Experiment 5 (V) The subjects (n=8) walked with a natural cadence (1.4±0.1 m· s-1) on a unique 10m long force platform system (Raute Inc, Finland) consisting of two separate rows of force plates for the left and right feet, respectively (Fig 7). High-speed real-time ultrasonography was used to measure the fascicle lengths of the MG and SOL muscles during human walking. The ultrasound apparatus was pushed on the side of force platform at the subjects’ walking speed. Simultaneously, an optic fibre transducer, passed transversely through Achilles tendon, was used to measure the tensile stress within the Achilles tendon. Surface bipolar EMG electrodes were used to record the TA, MG and SOL muscle activity and goniometers were used to record the angular position of the hip, knee, and ankle joints.
US US
Hi-speed cameraAnkle joint angle
Knee joint angle

34
4.2.6 Experiment 6 (VI) Seven healthy male volunteers walked (1.48±0.12 m· s-1) and jogged (2.74±0.21m· s-1) with a natural cadence on the long force platform system, as similar arrangement to Experiment V (Fig 7). Real-time ultrasound devices were used to measure two-dimensional geometry characteristics of fascicles of the MG muscle during walking and jogging. Similarly to the experiment V, the ultrasound apparatus was pushed along the force platform at the subjects’ walking and jogging speeds. Surface bipolar EMG electrodes were used to record the EMG activities in MG. Ankle and knee joint rotations were recorded by electrogoniometers, respectively. FIGURE 7 Setup for the walking experiments: muscle-tendon compartments
(gastrocnemius and soleus muscles; ultrasonography), Achilles tendon forces (ATF) and EMGs were measured simultaneously on a unique 10 meter long force plate system, composed of two rows of individual force plates. The data logger for EMG (TA, SOL, MG) and tendon transducer (optic fiber) unit was attached to the subject’s waist. The ultrasound apparatus was pushed forward at the speed of the subject outside the force plate area. The ankle, knee and hip joint angles were also measured simultaneously by using goniometers (Gonio). Similar arrangement was used also for the jogging measurements (VI).
Measured area
FORCE PLATE (10m)
Tendonforce
transducer
EMGGonio
LeftRight
Ultrasoundapparatus
FORCE PLATE (10m)
Tendonforce
transducer
EMGGonio
LeftRight
Ultrasoundapparatus
Ultrasoundapparatus

35
4.2.7 Experiment 7 (VII) In the experiment VII, the SSC fatigue exercise was performed on the sledge apparatus until exhaustion. Briefly, the fatigue protocol followed our earlier SSC fatigue studies (Kuitunen et al. 2002; Nicol et al. 1996, 2003) (Fig 8) and it included first 100 repeated maximal sledge DJs from the optimal dropping height. This series of jumps was immediately followed by a continuous rebounding exercise to a submaximal height representing 70 % of their maximal initial rebound performance. The exercise was stopped when the subjects were so exhausted that they were unable to jump at all. The primary mechanical fatigue effects were tested by the SOL muscle before (BEF), and immediately after (AFT) as well as 2 hours (2H), 2 days (2D), 8days (8D) after the SSC exercise. For these measurements, the subjects were seated on an ergometer chair with their right thighs clamped and their foot mounted on motor-driven platform (for details see Kuitunen et al. 2002; Nicol et al. 1996). Plantar flexor torque was measured from the right leg during maximum isometric voluntary contraction (MVC). The knee and ankle joint angles were set at 130 and 103 degrees, respectively. Passive lengthening action (ankle joint angle was moved from 113 to 93 degrees; 0.5 rad· s-1) was also measured on the same ergometer. The EMG was recorded from the SOL muscle using bipolar surface electrodes (Beckman 650437 miniature skin electrodes, USA) with a fixed inter-electrode distance of 20 mm. Blood was sampled from the fingertip to determine blood lactate (LA) concentration before and after the SSC exercise as well as 5min, 2H, 2D and 8D post-exercise. Muscle thickness in the SOL muscle was measured (Fig 10) to estimate the possible swelling in the follow-up period. The SOL fascicle length (LSOL_fa) in the right leg was measured using a brightness mode (B-mode) ultrasound apparatus (7.5MHz probes, 50Hz image scanning; Aloka SSD-2000, JAPAN). FIGURE 8 Schematic representation of a whole experimental protocol and test parameters
in the exhausting SSC fatigue study.
Test
Before
- 100 maximal drop jumps- Submaximal Rebound jumps until exhaustion
Test = - Blood samples- Maximal Isometric Voluntary Contraction- Passive dorsiflexion- Muscle thickness and fascicle length
Test
8 days2 days2 hoursAfter
Test Test TestTest
Before
- 100 maximal drop jumps- Submaximal Rebound jumps until exhaustion
Test = - Blood samples- Maximal Isometric Voluntary Contraction- Passive dorsiflexion- Muscle thickness and fascicle length
Test
8 days2 days2 hoursAfter
Test Test Test

36
4.3 Measurement parameters and analyses 4.3.1 Real-time ultrasonographic muscle architecture measurements (I-VII) 4.3.1.1 Length measurements of fascicles The ultrasound devices (SSD-2000, 5500, Aloka, Japan) were used to measure two-dimensional characteristics of the muscle geometry. The fascicles of SOL, MG and VL muscles were scanned during the movements (I-VII). 7.5 MHz linear-array ultrasound probes of 6cm long were firmly attached to the target muscles and fixed securely with the special polystyrene support device. In the experiment I-IV, the real-time ultrasonographic images (42-50Hz) during the movements were captured on videotape at 50 Hz and analyzed with Motus software (Peak Performance Inc, USA). The superior and inferior aponeurosis and a fascicle were identified and digitized from each image (Fig 9). For each subject, the entire length of the VL fascicle (LVL_fa) was estimated using trigonometry (Finni et al. 2001a, 2002, 2003a) to make calculation possible. This estimation was necessary because LVL could not be visualized throughout the contact phase of the jumps (Fig 9A). The error for estimating LVL with this method has been reported to be 2-7 % (Finni et al. 2001a, 2002, 2003a). To estimate if the errors in the present experiment are within the range of errors published in these earlier papers, the entire VL muscle images were constructed from recordings of adjacent images collected along the muscle length for three subjects, three trials each. Thus the real lengths of the fascicle during the contact phase of jumping were compared with those obtained by the linear method in total of nine trials. This comparison revealed that errors of the estimated length and fascicle angle were less than 5.9 and 4.5 %, respectively. Consequently, it was concluded that the linear extrapolation method could be applied reliably for the contact phase in the present study. In the experiment IV-VI, the real-time ultrasonographic images were scanned with higher speed (96-97 Hz) during movements and analyzed with Motus software (Peak Performance Inc, USA) (Fig 9B). The analyzed ultrasound data at 96-97 Hz were interpolated at 100 Hz for calculating the TT length changes.

37
FIGURE 9 (A) The entire fascicle length (LVL_fa) was estimated using a linear continuation
of aponeuroses and fascicles when the fascicle was not fully visible within the imaged area.
(B) The calculation of the fascicle length and angle from medial gastrocnemius (MG) and soleus (SOL) muscles.
4.3.1.2 Muscle thickness (VII) The thickness of the right SOL muscle was measured to estimate the possible swelling (Murayama et al. 2000; Nosaka and Clarkson 1996) by using a brightness mode (B-mode) of ultrasound apparatus (7.5MHz probes, 50Hz image scanning; Aloka SSD-2000, JAPAN) in the follow up period after the SSC fatigue (Fig 10). Miyatani et al. (2000) have shown that muscle thickness was highly correlated to the muscle volume. To obtain the muscle thickness, the probe was moved slowly by the experimenter to scan the longitudinal sections of the SOL muscle (Chow et al. 2000; Kawakami et al. 1998; Maganaris et al. 1998).
β
Estimated fascicle length
h
β
(A) Measured Estimated
Measured fascicle length Lmeas
Total fascicle length = Lmeas + h / sin β
(B)
LSOL_fa
Fascicle angle
LMG_faFascicle angle
SOLMG

38
FIGURE 10 Schematic representation of muscle thickness analysis. 4.3.2 Measurements of kinetic and kinematics parameters (I-VII) The jumping performances were recorded with a videotape at 200 Hz from the right side of the subject. Reflective markers placed the on neck, trochanter major, center of rotation of knee, lateral malleolus, heel and fifth metatarsal head were digitized using Motus software (Peak Performance Inc, USA). The transformed coordinates were filtered digitally with a butterworth 4th-order zero-lag low-pass filter (cut-off frequency: 8Hz). Instantaneous net joint moments around ankle and knee joints were calculated through inverse dynamics (Winter 1990). Net joint moments in the direction of plantar flexion and in the direction of knee extension were defined as positive and were referred to as “planter flexion moment” and “knee extension moment”, respectively. 4.3.3 Estimation of the muscle-tendon unit (MTU) and TT compartments To obtain the information of the instantaneous MTU length changes, the model of Hawkins and Hull (1990) was used to estimate the MTU length by applying the individual segment lengths from the ankle (SOL and MG) and knee joint angular (MG, VL) position (I-VI). In the experiment of Hawkins and Hull (1990), this model showed high correlation with the mueasured values (r=0.93, 0.97 and 0.82 in VL, MG and SOL, respectively). The instantaneous lengths of fascicle and tendinous structures were determined on the basis of a geometric MTU model proposed by Allinger and Herzog (1992). The length of tendinous tissues was defined as the sum of the proximal and distal tendinous structures, and aponeuroses (Fukunaga et al. 2001; Kurokawa et al. 2001, 2003; Muraoka et
Soleus
Distal Proximal
Gastrocnemius
Central

39
al. 2001) (Fig 11). The length changes in TT were calculated by subtracting the horizontal part of fascicle in the direction to the aponeurosis from the MTU length. LTT = LMTU – Lfa· cos α, where LTT is the TT length, LMTU is the muscle-tendon unit length, Lfa is the fascicle length and α is the fascicle angle in each muscle (see Fig 9, 11). FIGURE 11 Schematic models of vastus lateralis (VL; upper) and gastrocnemius (MG;
lower) muscles. The method requires that the total MTU length is recorded continuously, e.g. kinematically, during locomotion. The rest of the measurements are based on the continuous ultrasound records, such as shown in Fig 9 (Adapted from Finni et al. 2000, 2001c; Fukunaga et al. 2001; Kubo et al. 2000; Kurokawa et al. 2001; Zajac 1989).
DistalProximal
Vastus lateralis model
Distal tendon andaponeurosis (Ltd)
θ
LVL_MTU
Proximal tendon andaponeurosis (Ltp) Fascicle(L fa
)
LVL_MTU= Lfa · cosθ +Ltp +Ltd
DistalProximal
Vastus lateralis model
Distal tendon andaponeurosis (Ltd)
θ
LVL_MTU
Proximal tendon andaponeurosis (Ltp) Fascicle(L fa
)
LVL_MTU= Lfa · cosθ +Ltp +Ltd
MTU
Proximal tendon andaponeurosis (Ltp)
Distal tendon andaponeurosis (Ltd)
Fascicle (Lfa)
Pennation angle
Horizontal part of fascicle
· Total tendon length = Ltp +Ltd
= LMTU – Horizontal part of fascicle
Gastrocnemius model

40
4.3.4 Direct tendon force measurements (II, III, V) and estimated force calculations Direct tendon forces from the AT (V, VI) and patellar ligament (I, III) were measured with the optic fiber transducer techniques. Depending on the tendon or ligament, the different calibration procedures were applied. The optic fiber signal outputs from the AT and patella ligament were calibrated from the plantarflexor and knee extension forces, respectively as described earlier (Arndt et al. 1998; Finni et al. 1998, 2001; Komi et al. 1996). In agreement with earlier studies (Arndt et al. 1998; Finni et al. 1998, 2001; Komi et al. 1996), a good linear fit (r = 0.97) was observed between the external force and the fiber output. The moment arms of the patella ligament were determined from radiographs taken with contracted muscle at knee angle of approximately 180, 120, 60° (Spoor and Leeuwen 1992). It was decided to use the patella ligament force instead of the quadriceps tendon force as the patella tendon force (PTF). Because determination of the quadriceps moment arm is highly susceptible to errors and the difference between the two tendon forces can in some cases be up to 10 % (Finni et al. 2001a, 2003a). The VL, SOL and MG tendon forces (FVL, FSOL and FMG) and each fascicle forces (FVL_fa, FSOL_fa and FMG_fa) in the direction of the muscle fibers (fascicles) were then deduced from PTF and Achilles tendon force (ATF), respectively (Finni et al. 2001a, 2003a; Ichinose et al. 2000; Kurokawa et al. 2001, 2003) as follows: FVL = 0.34· PTF, FVL_fa = 0.34· PTF· (cos αVL)-1 FSOL = 0.562· ATF, FSOL_fa = 0.562· ATF· (cos αSOL)-1 FMG = 0.154· ATF, FMG_fa = 0.154· ATF· (cos αMG)-1 where α shows each angle between the aponeurosis and fascicle (Fig 9), and 0.34, 0.562, 0.154 are considered as a relative physiological cross-sectional area (PSCA) of VL, SOL and MG to the total PSCA of quadriceps femoris and plantar flexors muscles, respectively (Akima et al. 1995; Fukunaga et al. 1996a). To estimate the ATF and QTF (IV, VII), the instantaneous moment arm for the Achilles tendon and the quadriceps tendon were calculated obtained according to the previous reports (Rugg et al. 1990; Spoor and van Leeuwen 1992). The ATF and QTF were calculated as the net joint moments divided by the instantaneous tendon moment arm. FMG was estimated as noted above. 4.3.5 Electromyography (EMG) (I-VII) Electromyographic (EMG) signals were recorded from several muscles, the number of which depended on the experiments. They involved the TA, MG, SOL, VL and RF muscles in the right leg. Miniature surface bipolar electrodes (Ag/AgCL; the diameter 5mm, an interelectrode distance of 20mm; Beckman skin electrode 650437, USA) were employed according to the recommendations

41
of SENIAM (1999). EMGs were amplified (input impedance >25MΩ, common mode rejection ratio >90dB) and sent telemetrically to the recording computer (12-bit A/D converter). The midbellies of the muscles were confirmed from B-mode ultrasonographic images. Care was taken that the interelectrode resistance was below 5 kΩ. The EMG was bandpass-filtered (5-500 Hz) and amplified before sampling to a computer. In the experiments I-IV and VII, the EMG signals were full-wave rectified and then filtered (first or fourth order Butterworth low-pass filter at 40-50Hz) to extract an amplitude envelope. In the experiments V-VI, the EMG signals were full-wave rectified and then averaged separately in the each condition. The averaged EMGs (aEMG) were calculated in the following three phases; pre-activation, braking and push-off phases. The braking and push-off phases were separated from the ground force data. Pre-activation phase was defined as the 100ms preceding the ground contact (Komi et al. 1987). The aEMG for the short-latency stretch reflex (SLR) component of MG and VL muscles were identified by the duration from 30 ms to 60 ms latency after ground contact (Dietz et al. 1979; Horita et al. 1996). In experiment III, the braking and push-off phases were further divided into two phases (braking I and braking II; push-off I and push-off II). 4.3.6 Blood sampling and analyses (VII) Blood was sampled from the fingertip to determine blood lactate (LA) concentration before and after the SSC exercise as well as 5min, 2H, 2D and 8D post-exercise (VII). LA was analyzed with a commercial kit (Biochemica Boeringer GmbH, Germany). 4.3.7 Data collection and processing Ground reaction forces, ATF, EMGs and angular data were sampled at 1000 Hz, simultaneously. The out put TTL-signal triggered from the reaction force was used to synchronize the kinematic, kinetic, EMG and ultrasound data. After the ultrasound data were analyzed, the velocities of the MTU, fascicles and TT were calculated by differentiating the corresponding length change value with time; the shortening of the MTU, fascicles and TT was defined as positive. To calculate the positive mechanical power produced by the MTU and TT, tendon force was multiplied by the velocities of the MTU and TT, respectively. Similarly, the fascicle force was multiplied by the fascicle velocity to calculate the mechanical power of the fascicles. Positive mechanical power indicates the shortening direction. 4.3.8 Statistical methods Data are presented in some cases as individual values or mostly as mean± standard deviation (SD) or mean± standard error (SE). After the normality test,

42
the ANOVA for repeated measurements on one factor and post hoc least significant difference multiple comparisons were used to reveal significant difference between the different conditions. If normality test failed, one-way repeated ANOVA on Ranks were used (I, II, III, IV, VII). For walking experiment (V), statistical analysis was performed using the paired Student’s t test for the comparison between MG and SOL muscles. If normality test failed, a Wilcoxon Signed Rank test was used. In addition, a two-way ANOVA was used to analyze the difference in the averaged EMG amplitude and fascicle length changes during the Brake II and Push I phases. For the experiment VI, A two-way ANOVA was used to analyze the significance of the difference in all variables between jogging and walking. Where ANOVA was significant, a least significant difference post hoc test was used to look for significant differences between conditions (walking and jogging), and between phases. We considered P<0.05 as statistically significant difference in all experiments. Pearson’s correlation coefficients were calculated to reveal significant relationships between selected parameters (VII). The Spearman’s rank correlation coefficient for Polynomial regression analysis of variables was used for revealing the correlation between the slope of the MG fascicle length changes and average slope of the Achilles tendon force (IV).

5 RESULTS
The chapter gives the most important findings obtained from this series of experiment. For further details the original papers (I-VII) should be consulted. 5.1 Fascicle-TT interaction during the high intensity SSC exercises 5.1.1 Effects of different intensity conditions (I, II, III) As shown by the previous low intensity SSC studies (Finni et al. 2001a), the LVL_MTU was stretched prior to shortening even during the high intensity DJ (I, II, III). The fascicle and TT of the VL muscle also underwent a SSC (Fig 12, 13). With both higher drop and rebound conditions, the TT recoil increased during the push-off phase. But the fascicle-TT interaction behaved differently depending on the different intensity gains. When the rebound height increased with the constant dropping height, the braking force slope was similar but the peak reaction force was significantly (P<0.05) greater at higher rebound intensity (I, III). The VL EMG activities increased from the late braking phase to the take-off until the take-off moment (Fig 14). On the fascicle level, both the lengthening and shortening were smaller at higher rebound condition. On the TT level, the shortening amplitude was greater in the high rebound jump. Especially, the dramatic TT recoil was observed in the end of the push-off phase in the high rebound jump condition (Fig 12, I, III). When the drop intensity (height) increased with the constant rebound height, on the other hand, the peak ground reaction force and the braking force slope increased with increasing drop height (II, III, TABLE 4). The VL aEMGs in the pre-activation and early braking phases (Brake I) increased but that in the push-off phase decreased at higher drop condition (Fig 14). The less LVL_fa lengthening and greater LVL_TT stretching during the braking phase were observed with higher drop condition. During the push-off phase, the LVL_TT shortening increased but the LVL_fa shortening decreased (Fig 13) together with lower EMG activities with increasing drop intensity (Fig 14). The LVL_fa still

44
continued to lengthen during the early push-off phase in all subjects. This phenomenon was not present in the high rebound condition. FIGURE 12 The time course of parameters during the contact of DJref and RHigh (N=10).
The rectified (and filtered) EMG activities (upper left), reaction force (Fz; lower left), and the length of MTU (LVL_MTU, upper right), TT (LVL_TT, middle right) and fascicle (LVL_fa, bottom right) from the VL muscle (gray line, DJref; black line, RHigh; dashed lines, standard deviation of each parameters) are shown. The vertical line denotes the release instant from the force plate (Fz=0).
FIGURE 13 The time course of parameters during the contact of DJref and DHigh (N=10).
The rectified (and filtered) EMG activities (upper left), reaction force (Fz; lower left), and the length of MTU (LVL_MTU, upper right), TT (LVL_TT, middle right) and fascicle (LVL_fa, bottom right) from the VL muscle (gray line, DJref; black line, RHigh; dashed lines, standard deviation of each parameters) are shown.
16
20
69
242832
‐600Times (ms)
0
20.00.40.8
‐600 ‐400 ‐200 0
Reaction Force(kN)
EMG (mV)
LFascicle (cm)LFascicle (cm)
LTT (cm)LTT (cm)
LMTU (cm)LMTU (cm)
Times (ms)‐400 ‐200 0
Take‐offTake‐off
DJrefRHigh
1620
69
242832
0
2
0.0
0.4
‐600 ‐400 ‐200 0
Reaction Force(kN)
EMG (mV)
LFascicle (cm)LFascicle (cm)
LTT (cm)LTT (cm)
LMTU (cm)LMTU (cm)
Times (ms)‐600 ‐400 ‐200 0
Take‐offTake‐off
Times (ms)DJrefDHいgh

45
FIGURE 14 Averaged EMGs (+SD) of the pre-activation (Pre), braking (I, II) and push-off
(I, II) phases of the three different conditions of the sledge drop jumps (DJref, RHigh and DHigh). *, ** Significantly different from DJref at P<0.05 and at P<0.01, respectively.
In order to understand in more detail the fascicle-TT interaction under the controlled SSC conditions, the instantaneous TT force-velocity (F-V) curves of VL muscle during the contact phase was examined from the one subject (Fig 15, I, III). Although the peaks of the VL tendon force (FVL) during the contact phase did not show any difference between the conditions, the enhancement process of FVL and TT velocity was different. When rebound intensity increased with constant drop intensity, FVL and TT velocity enhancements were observed in the late push-off phase (TABLE 4), as shown by this shadowed area (Fig 15). This enhancement corresponds to the dramatic TT recoil (Fig 12). When the drop intensity increased with constant rebound condition, on the other hand, FVL and TT velocity enhancements occurred earlier during the push-off phase (Fig 15, TABLE 4). FIGURE 15 Comparison of the instantaneous F-V curves for TT from the VL muscle
during contact of three different conditions on the sledge DJ for one subject. (Left, DJref vs. RHigh; Right, DJref vs. DHigh). The shaded area indicates the potentiation during the push-off phase of contact.
0.0
0.2
0.4
0.6
0.0
0.2
0.4
0.6
0.0
0.2
0.4
0.6
DJref
RHigh
DHigh
Pre Braking Push-off
***
*
***
**
***
aEMG (mV)
Braking phaseI II
Push-off phaseI II
Tendinous tissues velocity (cm·s-1)
-20 20 40
VL force (kN)
0
1
2
Tendinous tissues velocity (cm·s-1)
-20 20 40
VL force (kN)
0
1
2
VL force (kN)
0
1
2
DJref vs. DHigh
Tendinous tissues velocity (cm·s-1)
VL force (kN)
-20 20 400
1
2
Tendinous tissues velocity (cm·s-1)
VL force (kN)
-20 20 40-20 20 400
1
2
0
1
2
DJref vs. RHigh
DJrefRHigh
DHigh
DJref

46
TABLE 4 Measured and estimated variables between the different conditions (III, N=10). 5.1.2 Fascicle and TT behavior in different muscles (I, III, IV, V) FIGURE 16 shows the fascicle-TT behavior in both MG and VL muscles during DJref and RHigh conditions (I). It was observed that TT recoil in both muscles increased similarly at the higher rebound condition. On the fascicle level, the VL fascicles in both conditions behaved as the SSC concept. But the MG fascicles at the higher rebound condition shortened throughout the contact phase. Similar observation was confirmed by the short contact DJs with the different drop height conditions on the level ground (Fig 17). During contact, MG fascicles continued to shorten or remained the same length but the VL fascicles underwent lengthening before shortening. (I, IV)
# Rebound High (RHigh) Drop High (DHigh)
Drop speed (m s-1) 1.71 ±0.17 1.72 ±0.19 1.78 ±0.17 **
Rebound speed (m s-1) 1.80 ±0.13 1.94 ±0.14 ** 1.80 ±0.19
Peak Fz (kN) 1.75 ±0.25 1.82 ±0.29 1.86 ±0.26 *
Averaged Fz slope (N s-1) 4167 ±1133 4389 ±1290 4642 ±1052 **
Lengthening amplitude (cm)MTU 3.46 ±0.78 3.42 ±0.75 3.60 ±0.75TT 2.29 ±0.83 2.48 ±0.90 * 2.57 ±0.90 *
Fascicles 2.08 ±1.24 1.80 ±0.99 * 2.26 ±1.13 *
Shortening amplitude (cm)MTU 6.38 ±0.82 6.75 ±0.81 * 6.39 ±1.03TT 3.75 ±0.92 5.25 ±1.42 * 4.98 ±1.06 *
Fascicles 3.77 ±1.01 2.85 ±0.93 * 2.76 ±0.90 *
The peak TT shortening velocity (cm s-1)24.7 ±4.3 36.4 ±6.7 * 27.9 ±7.4
Timing of peak TT shortening velocity (ms)473 ±52 470 ±53 432 ±54 *
Values are expressed as means ± S.D. *, ** Significantly different from DJref at P <0.05 and 0.01, respectively.
Reference jump (DJref)
# The reference jump denotes the condition, in which both the drop and subsequentrebound heights were the same.

47
FIGURE 16 Examples of the fascicle and TT lengths during the different intensity DJs
(DJref and Rhigh). Vertical dot lines show the contact moment and the end of the braking phase, respectively.
5.1.3 Fascicle-TT behavior during the short contact SSC exercises (IV) FIGURE 17 presents typical curves of mechanical parameters during the short contact DJs with three different drop intensities (DJLow, DJOP and DJHigh). As expected from experiment II, III, the contact times during these three conditions (TABLE 5) were shorter than the DJs on the sledge apparatus (more than 500ms). Fz peak, the slope of Fz, FMG and QTF (until OP) increased (TABLE 5) with increasing drop height. In these short contact situations, both LMG_TT and LVL_TT underwent lengthening before shortening during contact and were stretched more in DJOP than DJLow (Fig 17). As compared to DJLow, MG fascicles shortened less in DJOP during the braking and push-off phases (P<0.05). The VL lengthening and shortening amplitudes were smaller in DJOP than in DJLow (P<0.05). These results denote the same tendency of the long contact DJs (II, III), supporting the concerted contraction (Hof et al. 1983). The mean TT shortening velocities in VL are higher than the lengthening of that (P<0.05) during all three conditions (Fig 18). In MG, the mean TT shortening velocity is higher than the lengthening one in DJLow (P<0.05). In DJHigh, however, the TT behavior of MG shows the opposite result.
RHighRHigh
TT length Fascicle length
036
-200 0 200 400 600
58
11
036
-200 0 200 400 600
58
111620
40
44
-200 0 200 400 600
DJref
1620
40
44
-200 0 200 400 600
DJref
1620
40
44
-200 0 200 400 600
DJref
1620
40
44
-200 0 200 400 600
DJref
1620
40
44
-200 0 200 400 600
DJref
VL
MG
(cm) (cm)
(cm) (cm)

48
FIGURE 17 An example of the of fascicle-TT interaction in MG and VL muscles during
the contact of the short contact DJs with three different drop intensities (DJLow, DJOP, DJHigh). The vertical dotted lines indicates instant of the ground contact.
FIGURE 18 Changes in the mean TT lengthening and shortening velocities during contact
in the medial gastrocnemius (MG) and vastus lateralis (VL) muscles at the three DJ conditions (DJLow, DJOP and DJHigh) (means+S.D., n=11). *, # show significant differences at P<0.05 between conditions and phases, respectively.
-0.1 0.0 0.1 0.20
400
800
-0.1 0.0 0.1 0.2
0
1000
2000
3
4
5
6
38
40
18
21
24
Time (sec)
FMG (N) FVL (N)
LMG_TT (cm) LVL_TT (cm)
LMG_fa (cm) LVL_fa (cm)
Time (sec)
DJLOW
DJOP
DJHigh
0
5
10
0
5
10
Lengthen Shorten
MG VL
Leng
th c
hang
e sp
eed
(cm
·s-1)
**
**
##
# # #
DJLow DJOP DJHigh DJLow DJOP DJHigh

49
TABLE 5 Measured and estimated mechanical parameters in experiment IV. 5.1.4 Fascicle-TT behavior during the overloading SSC condition (IV) As shown in the previous section, the MG fascicles shortened or remained at the same length until DJOP. During the extreme high drop condition of the short contact DJs, the MG fascicles were suddenly stretched at the 30-50ms after the ground contact (Fig 17). In line with this fascicle behavior, the short latency reflex amplitude and aEMG in the braking phase decreased in DJHigh as compared to DJOP (TABLE 5). In the subsequent push-off phase, however, the MG fascicle shortening increased together with higher aEMG value as compared to DJOP. On the TT level, the LMG_TT underwent lengthening before shortening during contact, but both amplitudes decreased significantly as compared to DJOP. FIGURE 19 shows the instantaneous F-V relationship during the contact of the short DJs with different drop intensities. In the DJHigh condition, the peak FMG increased dramatically during the early braking phase,
Contact time (ms) 221 ±22 224 ±33 233 ±32 * #Braking phase (ms) 95 ±12 92 ±21 99 ±17 #Push-off phase (ms) 126 ±18 132 ±23 133 ±20Flight time (ms) 467 ±48 481 ±47 * 451 ±54 #
Peak Fz (N) 3428 ±606 3891 ±874 * 5316 ±1775 * #The slope of Fz (N s-1) 72.2 ±46.8 90.4 ±43.8 * 124.9 ±64.0 * #Peak FMG (N) 569 ±263 609 ±316 * 920 ±573 * #Peak QTF (N) 5089 ±1970 5878 ±2622 * 5510 ±3010
aEMG in MG (mV)Pre 0.20 ±0.11 0.28 ±0.12 * 0.28 ±0.14Brake 0.27 ±0.13 0.26 ±0.13 0.24 ±0.14 *Push-off 0.27 ±0.12 0.24 ±0.10 * 0.28 ±0.14 #
aEMG in VL (mV)Pre 0.08 ±0.04 0.09 ±0.05 0.11 ±0.05 *Brake 0.51 ±0.27 0.52 ±0.28 0.47 ±0.21 *, #Push-off 0.44 ±0.27 0.42 ±0.25 0.42 ±0.24
SLR amplitude (mV)MG 0.28 ±0.15 0.25 ±0.12 0.22 ±0.10 *, #VL 0.46 ±0.24 0.53 ±0.26 0.58 ±0.28 *
Elastic recoil ratio (the shortening work divided by the stretching work in TT)MG 0.8 ±0.2 0.7 ±0.2 0.5 ±0.2 *VL 2.5 ±0.8 2.3 ±0.8 2.1 ±0.7 *
DJLow DJOP DJHigh
Values are expressed as means±S.D. * Significantly different from DJLOW; # Significantlydifferent from DJOP.

50
but this force suddenly decreased. Consequently, FMG did not show any increase at the start of the shortening phase. FIGURE 19 The instantaneous F-V curves on the fascicle TT levels of MG during the short
contact DJs. 5.2 Fascicle-TT interaction during walking and jogging on the
ground (V, VI)
As expected from earlier literature (Finni et al. 1998; Komi et al. 1990), the ATF started to increase from Brake II while Fz decreased in the pendulum-like manner (Fig 20). The increased ATF from Brake II could be due to the increased EMG activity from Brake I to Brake II phases and to the ankle dorsiflexion as well as to knee flexion movements during this single support phase. The MTU lengthening in MG was relatively smaller (3.7±1.6%) than that of the SOL muscle (5.0±1.9%) (Fig 21). On the fascicular level, not only the lengthening amplitudes but also patterns of the fascicle length were different between muscles. The MG fascicles remained isometric during the Push I phase and were stretched during the Brake II phase of the step cycle. In contrast, the SOL fascicles were lengthened until the beginning of the Push II phase. Just after heel contact, the ankle joint undergoes a rapid plantar flexion and ATF reduction. Simultaneously, the TT of both MG and SOL lengthen slowly, and continue to do so throughout the Brake II and Push I phases. This is followed by a rapid recoil during the Push II phase (Fig 21). This observation supports the concept of a catapult effect for effective elastic recoil as proposed by Bennet-Clark and Lucey (1967) and Alexander and Bennet-Clark (1977).
DJOPDJHigh
0 3 6
400
800
-30 0 30
400
800
Fascicle Velocity (cm·s-1) TT Velocity (cm·s-1)
FMG (N)FMG_fa (N)
DJLow

51
FIGURE 20 Records (mean ± SE) of the vertical and horizontal ground reaction force (A;
right and left legs Fv_R, FV_L and Fh_R), Achilles tendon force (ATF) and joint angles (B), and the EMG patterns from MG (C) and SOL (D) during contact phase of walking. The contact phase was divided into four phases from the heel strike to the end of the double support phase (Brake I), from the start of single support phase to the end of the braking phase (Brake II), from the start of the acceleration phase to the end of the single support phase, and from the start of double support phase to the foot-off.
FIGURE 21 Relative length changes of MTU (Thick black line), fascicle (thin black line)
and TT (Gray line) in MG and SOL muscles during the contact of walking from the length at the heel strike (means±SE, n=8).
0 4 0 8 00
5 0
1 0 0
0 4 0 8 00
5 0
1 0 0
0 . 0
0 . 5
1 . 0
1
2
Time (% of contact)
MG SOL
EMG (% of the peak amplitude)
Time (% of contact)
Brake I Brake II Push I Push II
Fv_RFv_L
Fh_R
(kN)
A
ATF (kN)
B
C D
- 6
0
6
- 6
0
6
MG SOL
Length changes (% from heel strike)
TTFascicle
TT
MTUFascicle
MTU
Brake I Brake II Push I Push II Brake I Brake II Push I Push II
Time (% of contact) Time (% of contact)
Contact Contact
0 20 40 60 80 100

52
As compared to walking, the peak vertical ground reaction force was much higher in jogging (P<0.01) (Fig 22). Consequently, the peak MTU length was longer in jogging than in walking (P<0.01), but the MTU length at the take-off moment did not show any difference. In both jogging and walking, LMG_fa did not follow the MTU length changes. LMG_fa in jogging stretched 0.4±0.3 cm immediate-after contact and then shortened throughout the contact. In contrast, LMG_fa in walking lengthened slowly after the initial reduction due to the sudden plantar flexion until the middle of the push-off phase and then shortened. The amplitudes of the LMG_fa shortening was greater in jogging (2.0±0.6 cm) than in walking (1.0±0.4 cm) (P<0.01). On the TT level, both TT in jogging and walking showed stretching and subsequent shortening during contact. As compared to the catapult action of TT in walking, LMG_TT in jogging was stretched until the middle of contact phase and it subsequently shortened on even terms, such as “spring-like bouncing”. The amplitude of the TT lengthening was significantly greater in jogging than in walking (P<0.05), but that of the TT shortening did not show significant difference between the two conditions.
FIGURE 22 The time course data of parameters during the ground contact of jogging and
walking. Vertical (A; Fz) and horizontal (B; Fy) ground reaction forces, the length of muscle-tendon unit (C; MTU), fascicle (F) and tendinous tissues (TT; I), fascicle angle (E), knee and ankle joint angles (D, G), and EMG activities of medial gastrocnemius (MG; H) (means±S.D., n=7). The contact period is normalized as 100 %. Vertical dot lines are expressed as contact, transition from braking to push-off phases and take-off moments.
0.0
0.3
0.6
-200
0
200
0
1000
2000
0
1000
2000
0 20 40 60 80 100
4
6
-200
0
200
0 20 40 60 80 100
46
48
50
52
0 20 40 60 80 100
42
45
0.0
0.3
0.6
Time (% Contact )
Fz (N) EMG (mV)Fy (N)Jogging
Walking
0 20 40 60 80 100
46
48
50
52
0 20 40 60 80 100
4
6
0 20 40 60 80 100
42
45
A B C
TT length (cm)Fascicle length (cm)MTU length (cm)D E F
Time (% Contact ) Time (% Contact )
Jogging
Walking
0.0
0.3
0.6
-200
0
200
0
1000
2000
0
1000
2000
0 20 40 60 80 100
4
6
-200
0
200
0 20 40 60 80 100
46
48
50
52
0 20 40 60 80 100
42
45
0.0
0.3
0.6
Time (% Contact )
Fz (N) EMG (mV)Fy (N)Jogging
Walking
0 20 40 60 80 100
46
48
50
52
0 20 40 60 80 100
4
6
0 20 40 60 80 100
42
45
A B C
TT length (cm)Fascicle length (cm)MTU length (cm)D E F
Time (% Contact ) Time (% Contact )
Jogging
Walking

53
5.3 Exhausting SSC fatigue effects of fascicle-TT behavior (VII)
The performance variables (MVC and aEMG) followed the bimodal recovery patterns (Fig 23A, B). This was not the case in the changes of the LSOL_fa and in the muscle thickness (MT) (Fig 23E, 24A). The LSOL_fa increased in AFT, 2H and 2D points in passive conditions and in 2D point during MVC condition (Fig 24A). The peak passive resistance torque to the dorsiflexion movement also increased in AFT and showed the similar trend to the LSOL_fa (Fig 23C, 24A). The fascicle shortening during MVC condition was increased in 2H followed by a decrease in 2D (Fig 24C). Muscle thickness peaked dramatically at 2D (Fig 23E). The relative changes in MVC showed no correlation with the changes in the muscle thickness between BEF-2H. However, this correlation between 2H-2D was negative (P<0.05) (Fig 25). The fascicle shortening/ aEMG ratio in MVC increased at 2H, and then decreased more at 2D than 2H (Fig 26). FIGURE 23 The changes in the mechanical performance and other related parameters
during the eight day followed-up period. Relative changes during the eight day followed-up period (CTRL; control day, BEF; before fatigue, AFT; immediate-after fatigue, 2H; 2hour-after fatigue; 2D 2day-after fatigue, 8D; 8day-after fatigue) are shown for the following parameters (means±S.D., n=8): A, the MVC torque; B, the soleus aEMG during MVC; C, the peak passive resistance torque to the dorsiflexion movement; D, the estimated fascicle force during MVC; and E, the SOL muscle thickness. F gives the blood lactate concentration in absolute values. Statistical significance of the difference from BEF (*) and between the testing points (#) are expressed as P<0.05.
- 1 0
0
1 0
0
5
1 0
0
2 0
Passive resistance torque to dorsiflexion (%BEF)
- 2 0
0
2 0
MVC torque (%BEF) SOL aEMG during MVC (%BEF)
- 2 0
0
2 0
Fascicle force during MVC (%BEF)
Muscle thickness (%BEF)
**
*
*
* *
*
*
##
#
#
#
A B
DC
E
*
CTRL BEF AFT 2H 2D 8D0
5
1 0
Lactate concentration (mmol·l-1 )
*
#F
5min-after
CTRL BEF AFT 2H 2D 8D
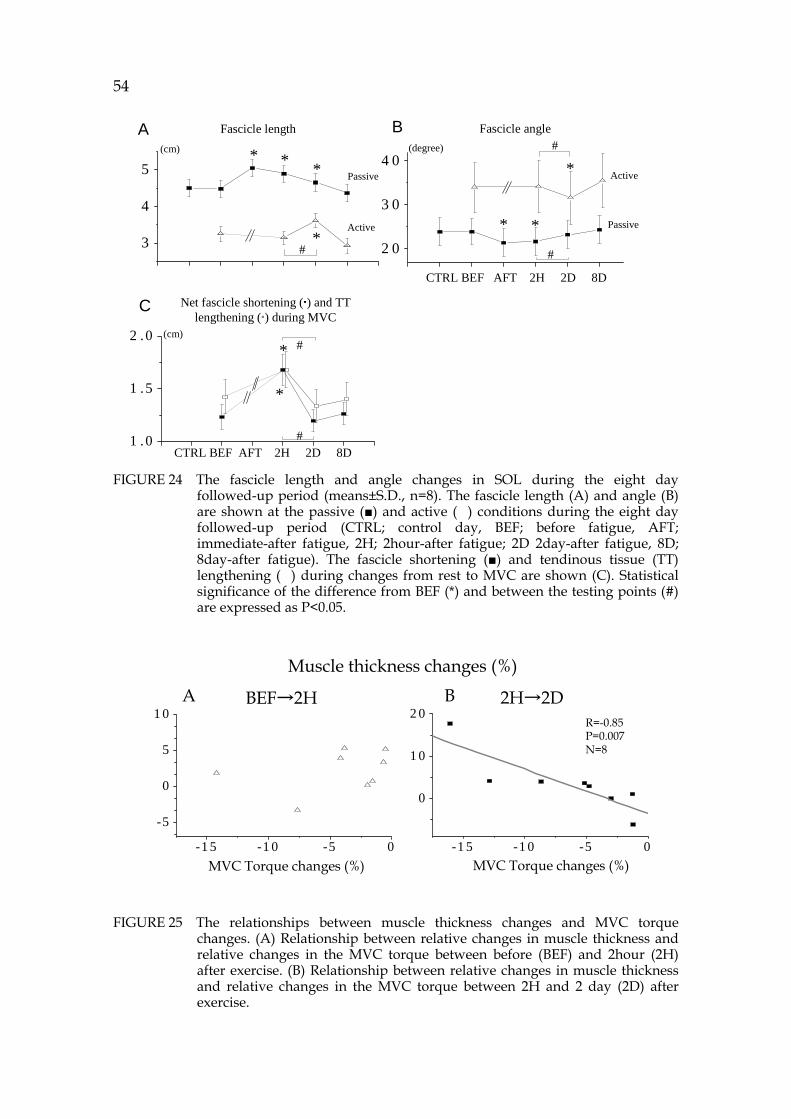
54
FIGURE 24 The fascicle length and angle changes in SOL during the eight day
followed-up period (means±S.D., n=8). The fascicle length (A) and angle (B) are shown at the passive () and active () conditions during the eight day followed-up period (CTRL; control day, BEF; before fatigue, AFT; immediate-after fatigue, 2H; 2hour-after fatigue; 2D 2day-after fatigue, 8D; 8day-after fatigue). The fascicle shortening () and tendinous tissue (TT) lengthening () during changes from rest to MVC are shown (C). Statistical significance of the difference from BEF (*) and between the testing points (#) are expressed as P<0.05.
FIGURE 25 The relationships between muscle thickness changes and MVC torque
changes. (A) Relationship between relative changes in muscle thickness and relative changes in the MVC torque between before (BEF) and 2hour (2H) after exercise. (B) Relationship between relative changes in muscle thickness and relative changes in the MVC torque between 2H and 2 day (2D) after exercise.
2 0
3 0
4 0
1 .0
1 .5
2 .0
3
4
5
Fascicle length
Net fascicle shortening () and TT lengthening () during MVC
* * *
* *
#
A B
C
CTRL BEF AFT 2H 2D 8D
(cm)
Fascicle angle(degree)
*
*
#
#
(cm)
CTRL BEF AFT 2H 2D 8D
*
*
#
#
Active
Passive Active
Passive
-1 5 -1 0 -5 0
-5
0
5
1 0
-1 5 -1 0 -5 0
0
1 0
2 0
R=-0.85P=0.007N=8
BEF→2H 2H→2D
MVC Torque changes (%) MVC Torque changes (%)
Muscle thickness changes (%)
A B

55
FIGURE 26 The ratio of the fascicle shortening to the averaged soleus EMG activity
during MVC (mean±S.D., n=8). Statistical significance of the difference between BEF and 2H, and between 2H and 2D are expressed as P<0.05 (*) and P<0.05 (#), respectively.
∆ Lfa/ SOL aEMG during MVC (A.U.)
1 0
1 5
*#
BEF AFT 2H 2D 8D

6 DISCUSSION
The main findings in the present study were as follows: 1) When the high intensity SSC exercises were performed on the sledge
apparatus, the VL fascicles and TT behaved similarly to MTU and according to the SSC concept. However, the length changes of the VL fascicles and TT were unequally distributed along the entire MTU during the SSC exercises. This interaction between VL fascicles and TT was dependent not only on the drop intensity but also on the rebound intensity. These results clearly indicated the existence of intensity specific interactions between fascicles and TT (I, II, III, IV).
2) The stretching and shortening of TT were observed during all SSC
exercises. Especially, the greater TT recoil during the high rebound intensity was clearly seen at the end of the push-off phase. These results confirm the existence of the stored elastic energy and subsequent recoil in human SSC. In addition, these results bring about additional hypothesis that the intensity specificity is related to the fascicle stiffness operating to cause the TT shortening during the push-off phase of the SSC exercises (III).
3) During the SSC exercises, the fascicle behavior depended on the muscle
that was studied. The fascicles in bi-articular muscle (MG) cannot necessarily show the SSC behavior in the same way as in mono-articular muscles (VL, SOL). The different fascicle behavior may reflect the possible difference between mono- and bi-articular muscles (I, IV, V, VI).
4) During the short contact SSC exercises, TT underwent lengthening before
shortening during contact. However, the efficacy of elastic recoil decreased with increasing drop intensity. The effective TT recoil can be limited by the drop intensity (IV).

57
5) When the drop height exceeded the optimal stretch load condition, the MG fascicles were suddenly stretched. Our estimated ATF values were 10-12 times body weight in the extreme drop intensity DJ. The stretch load upon impact was so extreme that MG fascicles could neither shorten nor maintain the constant length during the braking phase. Consequently, the sudden fascicle lengthening in MG started at 30-50 ms after contact.
6) MG fascicles during the ground contact behaved differently between
jogging and walking. The spring-like bouncing was observed for jogging, and the catapult action for walking. Consequently, the utilization process of TT stretch-recoil can be different depending on movements (V, VI).
7) After exhausting SSC fatigue, the performance variables (MVC and
maximum EMG) followed the bimodal recovery patterns. However, the time course changes of the muscle thickness and the fascicle length in the SOL muscle between passive and active situation did not follow this bimodal trend. It is very likely that the extent of the partial performance reduction can be related to the increased TT compliance at 2H and that the secondary decline in MVC could be related to the increased muscle volume and reduction of the TT compliance. In this recovery process, the mechanical changes in fascicle-TT interaction behaved differently depending on the timing after exhausting SSC fatigue (VII).
The following discussion makes efforts to clarify these observations and suggest respective mechanisms. 6.1 Characteristics of fascicle-TT interaction during the high intensity SSC exercises (I-VI) The stretching and shortening of TT were observed during all the SSC exercises measured. Especially, the greater TT recoil at higher rebound intensity condition was clearly seen during the end of the push-off phase. These results confirm the existence of the stored elastic energy and subsequent recoil in human SSC, and provide evidence that muscle may have a specific way of the fascicle-TT interaction. 6.1.1 Intensity specificity In the high intensity SSC exercise the fascicle-TT interaction can be modified by depending upon the drop and rebound intensities. The present results demonstrate that there is intensity specific fascicle-TT interaction to utilize the TT elasticity effectively during the SSC exercises (I-III).

58
When the rebound height increased with a constant drop height (I, III), the slope of reaction force and EMG activities did not show any difference in the early braking phase (Fig 27B). Thereafter, the fascicles stretched less from the late braking phase with higher EMG activation (Fig 27C). In this situation, TT can be stretched more by the tension provided by fascicles. It can be speculated that the stretch of aponeurosis may increase with increasing rebound intensity. As suggested by Ettema and Huijing (1989), the fascicle length can affect the changes of the aponeurosis length but not the outer tendon length and the length changes in the outer tendon depends on the changes in force level exerted on it. In the following push-off phase, the EMG activities were still higher with increasing rebound intensity, but the fascicle shortening did not increase (Fig 27D). This longer fascicle length together with higher EMG activation at the higher rebound condition indicates that the force on the fascicle level increased. Consequently, the rapid TT recoil was observed in the late push-off phase (Fig 27E). This rapid TT recoil may have resulted from the shortening of the aponeurosis part. Generally, elastic energy storage in tendons has been considered negligible because of the small length change in tendons (Jewell and Wilkie 1958). Baratta and Solomonow (1991), Roeleveld et al. (1993) and Hawkins and Bey (1997) have demonstrated the continuous high stiffness in tendons within optimal tension level that implies a simple force transmitting function of the tendon instead of that of storing elastic energy. We also feel that the tendon itself may not demonstrate this dramatic recoil. Instead we strongly suggest that the aponeurosis can play important role in this TT recoil as suggested by Alexander et al. (1985) and Roberts et al. (1997). In contrast, when the drop height increased with a constant rebound height (II, III), due to the higher impact against force plate, the slope of Fz development increased with higher activation during the early braking phase. Therefore, the outer tendon can be stretched more and faster with increasing drop intensity (Fig 27F). Consequently, the TT shortening can start earlier and then the power enhancement can be observed during the early push-off phase with increasing drop intensity(Fig 27H). In this condition, the rebound height was kept constant. During the early push-off phase, the fascicles still lengthened with less EMG activities. Consequently, the fascicle shortening decreased, but the TT shortening increased with increasing drop intensity (Fig 27I). This fascicle lengthening is in line with the concept of “timing of the muscle lengthening for effective release of elastic energy” by Ettema (1996). This elastic utilization behavior can support the concept of “energy saving” mechanism as introduced by Cavagna (1977) and Alexander and Bennet (1977). In both higher drop and rebound conditions, the smaller lengthening of fascicles during the braking phase can support the concept of “concerted interaction” by Hof et al (1983). Here, we can propose an additional concept of the elastic energy utilization during SSC exercises. As the elastic energy potentiation of the early push-off phase can be dependent on the drop intensity, the outer tendon can play a role for this

59
process. However, the elastic potentiation during the late push-off phase can be modified depending on the subsequent rebound intensity and it is the aponeurosis that plays an important role in this potentiation. As muscle activation increased in this phase, the F-V enhancement due to the elastic recoil of the aponeuroses may not necessarily mean any energy saving. These results may also suggest the different process of the TT recoil modification. It remains puzzling, however, how the outer tendon and aponeurosis behave differently during SSC action. FIGURE 27 Proposed schema of the modification of the VL fascicle-TT interaction during
SSC exercises depending on the jumping strategy. 6.1.2 Overloading condition A common finding of performance reduction due to the extreme drop height was observed in DJHIGH (IV). Some studies have suggested that as the eccentric load increases with greater drop heights, the inhibitory Golgi-tendon responses for the protective function can become more dominant (Schmidtbleicher et al. 1988; Walshe and Wilson 1997) or the actin-myosin interaction in cross-bridge could be detached (Flitney and Hirst 1978; Ishii et al. 1997; Sugi and Tsuchiya 1981). In support of these possibilities, we observed the sudden lengthening of
Late braking phase
Early braking phase
Early push-off phase
Late push-off phase
Before contactFascicles
Outer tendon
Aponeurosis
Tendinous tissues
DHighRHigh
DJref
DJref
A
B
C
D
E
F
G
H
I

60
the MG fascicles during the end of the braking phase of the extreme high drop condition (DJHigh) when compared to two other drop levels (DJLow and DJOP). When the drop height exceeded the optimal stretch load condition, the MG fascicles were suddenly stretched. Our estimated peak ATF values of 10-12 times body weight in the DJHigh are within the reported directly measured peak ATF loads of 10-12.5 times body weight in the hopping (Fukashiro et al. 1993) and higher than in running (7 times body weight; Ker et al. 1987). Thus in DJHigh, the stretch load upon impact was so extreme that MG fascicles could neither shorten nor maintain the constant length during the braking phase for the concerted contraction (Hof et al. 1983). The stored elastic energy increased with increasing drop intensity. However, the stored elastic energy can disappear due to the sudden fascicle stretching during the late braking phase. Consequently, the FMG did not show any increase at the begining of the push-off phase (Fig 19). Thus, the sudden MG fascicle stretch during DJHIGH can cause reduction of the storage and release of elastic energy. The sudden fascicle lengthening in MG of DJHigh started at approximately 30-50 ms after contact together with the SLR reduction. It is naturally puzzling what causes this sudden LMG_fa increase during the braking phase. One possible reason is that the stretch load is mechanically so high that the cross-bridges are simply detached or slipping. The quick stretches in the active isolated muscle fibers have been shown to demonstrate slipping (Sugi 1972; Sugi and Tsuchiya 1981). TT may readily overstretch the fascicles beyond the optimal length for force generation. The cross-bridges cannot tolerate the increased stretch which exceeds the limit of the short-range stiffness. Consequently, they are detached (Rack and Westbury 1974). As noted above the possible interference from Golgi tendon organ (GTO) during extreme impact cannot be excluded. Unfortunately, the EMG records and their analysis could not conclusively show that the reduction in the SLR amplitude was related to the reduction in mechanical behavior of the MG muscle in this DJHigh impact load. Many studies have, however, suggested that reduction of performance in the extreme load drop jump condition may be due to Ib inhibition from GTO (Pearson and Gordon 2000; Walshe and Wilson 1997). In the experiment 4, two subjects showed that the rapid fascicle lengthening in MG occurred before reaching the peak FMG_fa (Subject B, Fig 28). In all other subjects, such as Subject F in FIGURE 28, this lengthening started after the peak FMG reduction. In the latter case, the fascicle stretch may occur after the possible Ib inhibition from GTO. In the former case, the reported mechanism could be related to the situation where the detachment or slipping of cross-bridges may have reached a critical limit of force before Ib discharges from GTO. Admittedly, this is all speculation at the present stage of these studies in progress. However, one may conclude that two mechanisms, Ib inhibition and cross-bridge detachment (slipping) may be operative either together or independently during the sudden fascicle stretch of MG in DJHigh. It appears that the fascicle behavior in the MG muscle is as an over-all concept dependent on the stretch load intensity. If we draw the length changes

61
of the MG fascicle against the ATF slope measured for the same time period as the sudden stretch occurred in DJHigh, we obtain the relationship shown in FIGURE 29. This quadratic relationship may be indicative of the critical stretch load for MG (Y axis=0, Fig 29) to maintain the concerted action effectively with TT before being suddenly overstretched. On the other hand, in VL muscle, the rapid increase of the VL fascicle was not observed because the impact peak QTF did not increase in DJHigh (Fig 17). FIGURE 29 Correlation between the slope of the FMG_fa changes from 30 ms after contact
to the end of the braking phase and the averaged slope of the Achilles tendon force (ATF; 50ms after contact) (mean±S.D., n=11).
4 50
500
1000
Fascicle length (cm)
FMG_fascicle (N)
Sub. BSub. F
FIGURE 28 The typical examples of the instantaneous F-V relationship in the FMG_fa during contact of DJHigh.
0 200 400 600 800-10
-5
0
5
10The fascicle length change slope (cm s-1)
ATF slope (N s-1 kg-1)
50ms
ATFMG
50ms
ATFMG
Y =-5.452+0.002 X+2.5E-5 X2
R^2 =0.34N =11P =0.002

62
6.1.3 Muscle specificity (I, IV, V) There are arguments in the literature suggesting that the fascicles can maintain a constant length (Belli and Bosco 1992; Hof et al. 1983; Hoffer et al. 1989; Fukunaga et al. 2001), shorten (Griffiths 1991; Kurokawa et al. 2003) or lengthen (Finni et al. 2001a) during the early phase of the ground contact of SSC exercises (also TABLE 2). Majority of the previous studies have examined only one muscle. However, the mechanical behavior of muscle and tendon may be specific to a given MTU. If this is the case, it would be difficult to generalize the fascicle behavior from the results of one muscle only. In the present DJ movements and walking, the different patterns of fascicle length changes were indeed observed between muscles (I, IV, V). This muscle specificity during human walking could be also observed by the difference of the fascicle behavior related to the muscle activation from the end of the Brake II phase to the Push I phase (Fig 30). The SOL fascicles lengthened (P<0.05) with increasing muscle activation, but the MG fascicles tended to shorten. Alexander (1974) was the first one to report the different muscle behavior between hip, knee and ankle joint muscles during the dog jumping. In addition, the present study (V) shows that leg muscles which are commonly accepted as synergists do not have similar mechanical behavior of fascicles during human walking. These results highlight the fact that observations made from the fascicles of one muscle cannot necessarily be extended to other muscles during dynamic movements (I, IV, V) as well as in the static human movements (Bojsen-Moller et al. 2004). On the TT level, however, both MG and SOL muscles showed a similar length change pattern during gound contact of walking. These results can suggest that although TT elasticity depends on the length and cross-sectional area (Alexander and Ker 1990), the manner of the TT behavior may be the same between different muscles during human walking. In summary, the fascicles may be modified in order to utilize the TT elasticity effectively depending on the movements.

63
FIGURE 30 Relative changes in the fascicle length (solid squares) and corresponding
changes in the averaged EMG (aEMG) during the Brake II and Push I phases during walking (means±S.D., n=8). The open circle shows the corresponding changes in aEMG values of the MG and SOL muscles. To calculate the aEMG changes, the Brake I phase was used as a reference value to obtain the relative aEMG values for the Brake II and Push I phases.
6.1.4 Movement specificity 6.1.4.1 Short contact SSC exercises Primarily due to the resonant frequency of elastic component in human ankle extensors (3.33±0.15Hz; Bath et al. 1983), the contact time in the short contact DJs (less than 250ms; IV) may not be enough for the efficient elastic storage and recoil. The results of the present study confirm that even in these short contact DJs, TT behaved like the SSC action, i.e. the stretching and subsequent shortening. On the fascicle level, the MG fascicle shortened with increasing preactivation before contact. Also, TT started to be stretched before contact. This pre-contact action could support the storage of TT elastic energy effectively during the short contact SSC exercises. In general, the viscoelastic material is stronger and stiffer at increasing strain rates (Arnold 1974; Welsh et al. 1971). For the same maximal force, this means that less storage of elastic energy can occur at higher stretch rates. In the shorter contact SSC exercises of the present study, the mean TT stretching velocities were lower than the TT shortening velocity in DJLow and DJOP of both MG and VL muscles (Fig 18). This was, however, opposite in MG of DJHigh. In addition, the elastic recoil ratio (the shortening work divided by the stretching work in TT) in MG decreased with increasing intensity during the short contact DJs (TABLE 5). The ratio in VL (less than 2.5) in the present short contact DJ is smaller than the value (greater than 3.0) for VL in long contact sledge SSC exercises. This may suggest that the efficacy of elastic recoil in TT can decrease
∆
3
6
3
6
Brake II Push I Brake II Push I
MG SOL
P<0.01
P<0.05P<0.01
EMG
EMG
Fascicle
Fascicle
aEMG (*100%)Fascicle lengthening (∆ %)
Brake II Push I
EMG
Fascicle length
∆
Time (% of contact)0 100

64
with increasing stretch loads in the short contact SSC exercises. Consequently, the effective recoil in TT of the short contact SSC can be limited by the contact time of SSC exercises, especially for the resonant frequency of muscles. 6.1.4.2 Different elastic behavior between walking and jogging 6.1.4.2.1 Fascicle-TT interaction during walking and jogging It is generally accepted that the elasticity of TT plays an important role during SSC exercises. The TT stretching of MG during the ground contact phase was greater in jogging (7.4±2.5 %) than in walking (4.1±0.9 %). The similar difference was observed for the MTU stretching (jogging 4.3±1.7 %, walking 2.5±0.6 %). However, the MG fascicles did not behave similarly as MTU and TT. The MG fascicles in jogging shortened during the braking-phase while those in walking lengthened slowly. These results support earlier observation for other movements (Fukunaga et al 2001; Kawakami et al 2002; experiment IV). These results clearly indicate the existence of the fascicle-TT interaction that is movement specific (walking vs. jogging). Compared with running, walking has rather long ground contact times associated with a relatively low braking force. This makes walking inferior with regard to the utilization of elastic energy in muscle-tendon structures. In line with this suggestion, the TT stretching of MG during the ground contact phase was greater in jogging (7.4±2.5 %) than in walking (4.1±0.9 %). However, TT of both MG and SOL muscles recoiled rapidly during walking and consequently, the TT shortening amplitude of MG did not show any difference between jogging and walking. In jogging, TT behaved like the spring-like bouncing, in which the tendons store energy in the first half of the step, and then return this energy in the second half phase (Alexander 2002). In walking, however, it did not follow the spring-like bouncing. According to our interpretation of several studies which have examined stretch-shortening cycle in both animal (Roberts et al. 1997) and humans (Kawakami et al. 2002; Kurokawa et al. 2003), the concerted fascicle action seems to refer to favoring of the effective spring-like bouncing of TT during the ground contact. In running and jumping, for example, the elastic energy comes mainly from the initial negative work. But in walking with a natural cadence, ATF is low during the Brake I and II phases (Fig 20C). Therefore, TT cannot be stretched under the spring-like bouncing concept during the Brake I and II phases. To support this suggestion, the TT stretching curves in both MG and SOL did not follow the ATF development slope during contact of walking (Fig 20, 21). These results indicate clearly existence of an alternative way for the spring-like bouncing concept to utilize elasticity.

65
6.1.4.2.2 Different elastic utilization concepts The question may be asked which mechanism would cause utilization of elastic energy during the slow stretching and rapid recoiling of TT during the ground contact of walking. The natural candidate for this behavior is the concept of a catapult action (Alexander and Bennet-Clark 1977; Bennet-Clark 1975; Bennet-Clark and Lucey 1967), in which the spring stretches slowly and recoils rapidly. In this action, the power output can be amplified by the rapid positive work against the negative work done during the slow stretch, as demonstrated in insect jumping (Bennet-Clark 1975; Bennet-Clark and Lucey 1967). The mechanical power curves of the present study also showed a similar catapult behavior to amplify MTU power production during the end of the ground contact (Fig 31). To the best of our knowledge this has not been demonstrated earlier in human locomotion. These catapult and spring-like bouncing actions have a common feature of the dramatic TT shortening. But the catapult action is fundamentally different from the spring-like bouncing behavior of TT that is observed during running (Roberts et al. 1997; Fig 22) and in short contact jumps (Fig 17). In the catapult action which we now suggest to take place during human walking, elastic energy is not provided directly from initial negative work. Instead, it can be mainly provided by muscle action. This is in line with Alexander’s argument (1991), which is that no strain energy can be gained in the initial impact to power the push-off during human walking. The different activation pattern between jogging and walking can also support these different elastic utilization concepts. In jogging, the MG was active during the pre-activation and braking phases, but not in walking. Consequently, the stretching speed was higher in TT than in MTU during jogging (Fig 21, 22; TABLE 1 in the Paper VI).
FIGURE 31 Changes of the mechanical power (MTU, TT and MTU minus TT) in SOL during the contact of walking (mean±SE, n=8). It was assumed that relative contribution of the force developed by SOL muscle on ATF was equal to the relative physiological cross-sectional area of SOL among all plantar flexors. Mechanical power was calculated by multiplying the velocity by force in MTU and tendinous tissues (TT), respectively. The plus and minus signs refer to shortening and lengthening, respectively.
0 50 100
180
90
0
Time (% of contact)
Mechanical power (W)
MTU
TT
MTU-TT
Shortening direction
Brake I Brake II Push I Push II
++
-
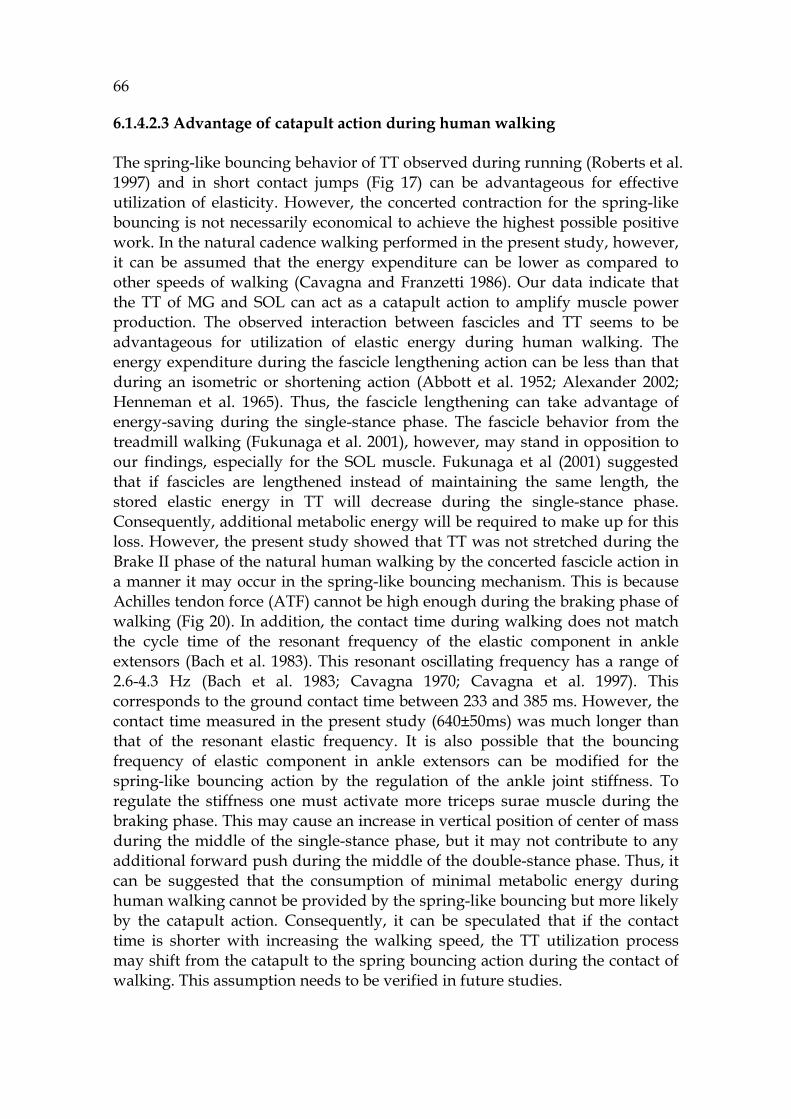
66
6.1.4.2.3 Advantage of catapult action during human walking The spring-like bouncing behavior of TT observed during running (Roberts et al. 1997) and in short contact jumps (Fig 17) can be advantageous for effective utilization of elasticity. However, the concerted contraction for the spring-like bouncing is not necessarily economical to achieve the highest possible positive work. In the natural cadence walking performed in the present study, however, it can be assumed that the energy expenditure can be lower as compared to other speeds of walking (Cavagna and Franzetti 1986). Our data indicate that the TT of MG and SOL can act as a catapult action to amplify muscle power production. The observed interaction between fascicles and TT seems to be advantageous for utilization of elastic energy during human walking. The energy expenditure during the fascicle lengthening action can be less than that during an isometric or shortening action (Abbott et al. 1952; Alexander 2002; Henneman et al. 1965). Thus, the fascicle lengthening can take advantage of energy-saving during the single-stance phase. The fascicle behavior from the treadmill walking (Fukunaga et al. 2001), however, may stand in opposition to our findings, especially for the SOL muscle. Fukunaga et al (2001) suggested that if fascicles are lengthened instead of maintaining the same length, the stored elastic energy in TT will decrease during the single-stance phase. Consequently, additional metabolic energy will be required to make up for this loss. However, the present study showed that TT was not stretched during the Brake II phase of the natural human walking by the concerted fascicle action in a manner it may occur in the spring-like bouncing mechanism. This is because Achilles tendon force (ATF) cannot be high enough during the braking phase of walking (Fig 20). In addition, the contact time during walking does not match the cycle time of the resonant frequency of the elastic component in ankle extensors (Bach et al. 1983). This resonant oscillating frequency has a range of 2.6-4.3 Hz (Bach et al. 1983; Cavagna 1970; Cavagna et al. 1997). This corresponds to the ground contact time between 233 and 385 ms. However, the contact time measured in the present study (640±50ms) was much longer than that of the resonant elastic frequency. It is also possible that the bouncing frequency of elastic component in ankle extensors can be modified for the spring-like bouncing action by the regulation of the ankle joint stiffness. To regulate the stiffness one must activate more triceps surae muscle during the braking phase. This may cause an increase in vertical position of center of mass during the middle of the single-stance phase, but it may not contribute to any additional forward push during the middle of the double-stance phase. Thus, it can be suggested that the consumption of minimal metabolic energy during human walking cannot be provided by the spring-like bouncing but more likely by the catapult action. Consequently, it can be speculated that if the contact time is shorter with increasing the walking speed, the TT utilization process may shift from the catapult to the spring bouncing action during the contact of walking. This assumption needs to be verified in future studies.

67
6.1.4.2.4 Stretch reflex activation and fascicle behavior during jogging Previous studies addressing extensor muscle activities in human hopping and running have identified a short-latency stretch-reflex (SLR) response following touch-down (Dietz et al. 1979; Melvil Jones and Watt 1971; Voigt et al. 1998). In line with these studies, the rapidly increasing EMG activity within 30-75 ms after the initial contact was observed during jogging. In SSC, performance enhancement has been attributed partly to the contribution of the stretch reflex (Komi and Gollhofer 1997). Stretch reflex induced force potentiation can be of considerable amplitudes as shown by Nicol and Komi (1998) in passive situation. On the fascicle level, it has been demonstrated that the MG fascicles contract in an isometric manner or they shorten during the contact phase of SSC exercises (Fukunaga et al. 2001; Kawakami et al. 2002; Kubo et al. 2000; Kurokawa et al. 2003; Roberts et al. 1997). However, the stretch induced reflex potentiation has not yet been confirmed together with length changes of muscle fibers during in vivo locomotion. This is primarily due to the low intensity movements and/or the low scanning frequency used. The present study used higher scanning frequency (96Hz) and the fascicle stretch was observed immediately after the ground contact of jogging (Fig 22E). This is methodologically important for identification of beginning of the stretch reflex loop in the muscle. 6.2 Mechanical and architectural coupling after exhausting SSC fatigue The results in the fatigue protocol support earlier findings (Horita et al 1996; Nicol et al. 1996, 2003) that the exhausting SSC exercise can cause acute and long-term impairments of neuromuscular performance (Fig 23A, B). In this bimodal recovery process, the architectural changes in fascicle-TT interaction behaved differently depending on the time after exhausting SSC fatigue. A clear result obtained here was that the passive LSOL_fa increased by 12.5 ± 3.1 % in AFT as compared at BEF and remained elevated until 2D (Fig 24A). The passive LSOL_fa was 9.2 ± 2.1 % longer at 2H than at BEF. This can be in line with non-uniform disruption of sarcomeres (Morgan 1990), which indicate the existence of overstretched sarcomeres in damaged muscle (Talbot and Morgan 1996). 6.2.1 Immediate- and 2hour-after SSC fatigue effects It is possible that the mechanical damage in SSC fatigue may take place not only in the fascicles but also in TT. In the present study, the MVC torque was significantly lower at 2H than at BEF but FSOL_fa did not show any changes between BEF and 2H (Fig 23A, D). Therefore, the extent of different recovery between the MTU and fascicle levels can suggest that this lower torque level

68
could be related to the change of the TT properties. It has been reported that the TT compliance increased after repeated contractions (Kubo et al. 2001b; Maganaris 2003; Maganaris et al. 2002; Vigreux et al. 1980). In the present situation, the stretched LSOL_TT in MVC increased at 2H (Fig 24C). In addition, the shortening LSOL_fa changes divided by aEMG in MVC increased significantly at 2H (Fig 26). This increased ratio and the same level of the fascicle force at 2H may reflect the increase in the TT compliance, including the increased TT slack. Thus, after the exhausting SSC fatigue, the MVC torque cannot completely recover due to the mechanical changes, especially for the increased TT stretching (compliance) at 2H (Fig 24C). This can support a shift of the active length-tension relation in the direction of the longer muscle length due to the increase in series compliance (Komi and Rusko 1974; Proske and Morgan 2001; Whitehead et al. 2001). Previous studies have reported that muscle swelling has been thought to be responsible for some of the increase in stiffness (Chleboun et al. 1998; Horowits et al. 1999). It is, however, unlikely that this notion is applicable to all situations, since stiffness may increase immediately post-exercise while swelling does not become significant until 24h later (Chleboun et al. 1998). It has been suggested that direct mechanical damage can occur in the sarcomere level (Faulkner et al. 1993, MacIntyr et al. 1996), especially for the non-contractile elements in muscle such as titin and desmin during the eccentric and SSC fatigues (Fridén and Lieber 1996; Horita et al 1996; Howell et al. 1993; Jones et al. 1987; Komi 2000). Direct evidence for these phenomena is, however, scarce. The origin of the passive tension can be attributed to elastic filaments within the sarcomeres composed of titin or connectin (Magid and Law 1985; Wang 1996). Titin forms elastic link between the thick filaments and Z-lines and strain of these links leads to a rise in passive tension (for a review see Horowits et al. 1999). In the present study, the peak passive torque increased at AFT and 2H (Fig 23C), indicating the increased passive muscle stiffness (Horita et al 1996; Howell et al. 1993; Jones et al. 1987; Nosaka and Clarkson 1996). The stiffness of a resting muscle has classically been regarded to be determined by the connective tissue elements surrounding individual fibers, bundles of fibers and whole muscles (Ramsey and Street 1940). In the present study, however, the passive fascicle angle decreased as compared to BEF (Fig 24B). The decreased fascicle angle and compliant TT can have a disadvantage for transmitting the force to fascicles. Nevertheless, the passive stiffness (passive torque) increased (Fig 23C). Although the mechanism for this phenomenon is very puzzling, one possibility might be that the increased passive stiffness and fascicle length may somehow be associated to the damaged non-contractile elements in muscle fibers (see also Howell et al. 1985; Jones et al. 1987). 6.2.2 2day-after SSC fatigue effects At 2D-after the exhausting fatigue, the observed secondary decline in MVC torque has been suggested to be associated with the inflammatory process of

69
muscle damage (Faulkner et al. 1993; Nicol et al. 1996, 2003). The delay may represent the natural time course of inflammation (Evans and Cannon 1991). The increased muscle thickness at 2D (Fig 23E), expressed also as the increase in muscle volume by Miyatani et al. (2000), can be caused by the increased internal fluid pressure due to swelling (Crenshaw et al. 1994; Nosaka and Clarkson 1996). This increase in muscle thickness was previously also reported after fatiguing eccentric exercises (Murayama et al. 2000; Nosaka et al. 2002). Similarly, the present results (Fig 25B) revealed a negative correlation between the increased muscle thickness and the magnitude of the second decline in MVC torque. The fascicle shortening during MVC, which was observed at 2H, returned to the BEF level at 2D post exercise, but the active LSOL_fa was longer and the active fascicle angle smaller at 2D (Fig 23, 24). It is likely that the increased intramuscular pressure can be associated with this mechanical behavior (Murayama et al. 2000). FIGURE 25B is in agreement with this notion by showing the negative correlation between changes in muscle thickness and MVC torque from 2H to 2D. As there was no significant correlation between SOL aEMG change and torque (force) change in MVC, the increased muscle volume (thickness) could indeed be at least partly responsible for the secondary decline of MVC performance (See “article VII” in detail). In addition, the smaller changes in the TT stretch between 2H and 2D than between BEF and 2H may also indicate the increase of the TT stiffness (See “article VII” in detail). Consequently, the secondary decline in MVC could be related to the increased muscle volume and the reduction of the TT compliance. Based on the present findings, architectural changes in SOL fascicles after exhausting SSC fatigue can be presented schematically as shown in Fig 33. The diagram suggests the time course of changes in the SOL architecture at rest and MVC conditions. After exhaustive SSC fatigue, LSOL_fa at rest increases (Fig 33a). After the metabolic recovery (2H), LSOL_fa at rest is still longer (Fig 33b) at 2H than at BEF but the fascicles can contract and their shortening is greater at 2H (Fig 33c) than at BEF. In 2day-after fatigue (2D), the muscle thickness increases by the inflammatory response (Fig 33d) and fascicles cannot shorten enough in the environment of the increased internal fluid pressure (Fig 33e). FIGURE 33 Proposed schema of the SOL fascicle length and angle changes when
followed from before to until 2-days of SSC fatigue.
BEF
Rest
MVC
AFT 2H 2D
Fascicle
Aponeuroses
(a) (b)
(c)
(d)
(e)
BEF
Rest
MVC
AFT 2H 2D
Fascicle
Aponeuroses
(a) (b)
(c)
(d)
(e)

70
6.3 Methodological considerations and possible errors Several cautions must be exercised in interpretation of the observed results. One may argue that a general methodological problem throughout the work of this thesis was the lack of individual information about muscle-skeletal dimensions (e.g. geometry, cross-sectional area) from the subjects involved in the experiments. It is unfortunate that this important aspect was considered only after the measurements were already done. Secondly, the applied MTU models for calculating the TT length might be too simplistic. Generally, the proximal end of the insertion was difficult to distinguish from the crural fascia. The same problem was often encountered in identification of the origin part of the tendinous structures of VL and SOL muscles. Therefore, in the series of these experiemts, we did not dicuss the fascicle and TT length in absolute values. Instead, relative values were compared. Thirdly, during the ATF measurements, it is possible that the skin movement during walking may cause minor artifacts to the signal. However, the ATF patterns measured with this technique (Finni et al. 1998) have been shown to be similar to those obtained with the buckle transducer method (Komi 1990) during human walking. With regard to calculation of MG and SOL forces, we did not consider the activation level and energy transfer from the knee joints. This can naturally influence our power calculation data. However, we assume that these methodological problems in our force calculation are minor and did not have a serious effect on our results and interpretation. Other important factors affecting these measurements should also be mentioned here. For example, the “fascicle angle” is defined by the angle between fascicles and the line of aponeurosis. However, the pennation angles may not be accurate vectors for predicting the effect of angulations of muscle fibers on force transfer to the tendon, when the aponeurosis lies at an angle to the line of action of the pennate muscle. Some studies used this angle as the “fascicle angle” between fascicles and the line of action on force transfer to tendon (Huijing et al. 1989; Zuurbier and Huijing 1991). However, the error in predicting the impact of fiber angulation on the force transfer from pennation angle is rather small (Gans and de Vree 1987; Spoor et al. 1991). Although the angle between aponeurosis and the line of action of the muscle is also relatively small (Kawakami et al. 1993) the future methodological development will certainly improve accuracy of these approaches. It must also be emphasized that real-time ultrasonography can be applied in dynamic movements in two dimension only. Again the future research is expected to bring developments in this regard. When comparing the fascicle-TT interaction between the different tasks and intensities, there are several factors that must be considered. Comparing the different intensity DJs, for example, it is not possible to control all the leg joint movements (ankle, knee and hip joints). For this reason, we chose to
71
perform these jumps on the sledge apparatus in which the hip and ankle joints can be controlled. Finally, it must be noted that although experiment VII adds to our understanding of the SSC-induced fatigue and provides insights into the mechanism of the of the SSC fatigue process, the general applicability of the conclusions may still be limited. For example, although SOL is an attractive model for the reasons stated above, it is difficult to generalize the obtained results to other muscles. The fascicle length behavior is reportedly muscle specific during the SSC exercises. In the presented results, the fascicle force was estimated from the cross-sectional area data. Generally, the plantar flexion torque is generated mainly by the triceps surae muscle group which has reportedly different fatigue responses, especially between SOL and gastrocnemius muscles (Moritani et al. 1990). These two muscles may have different neural mechanisms to compensate for fatigue.
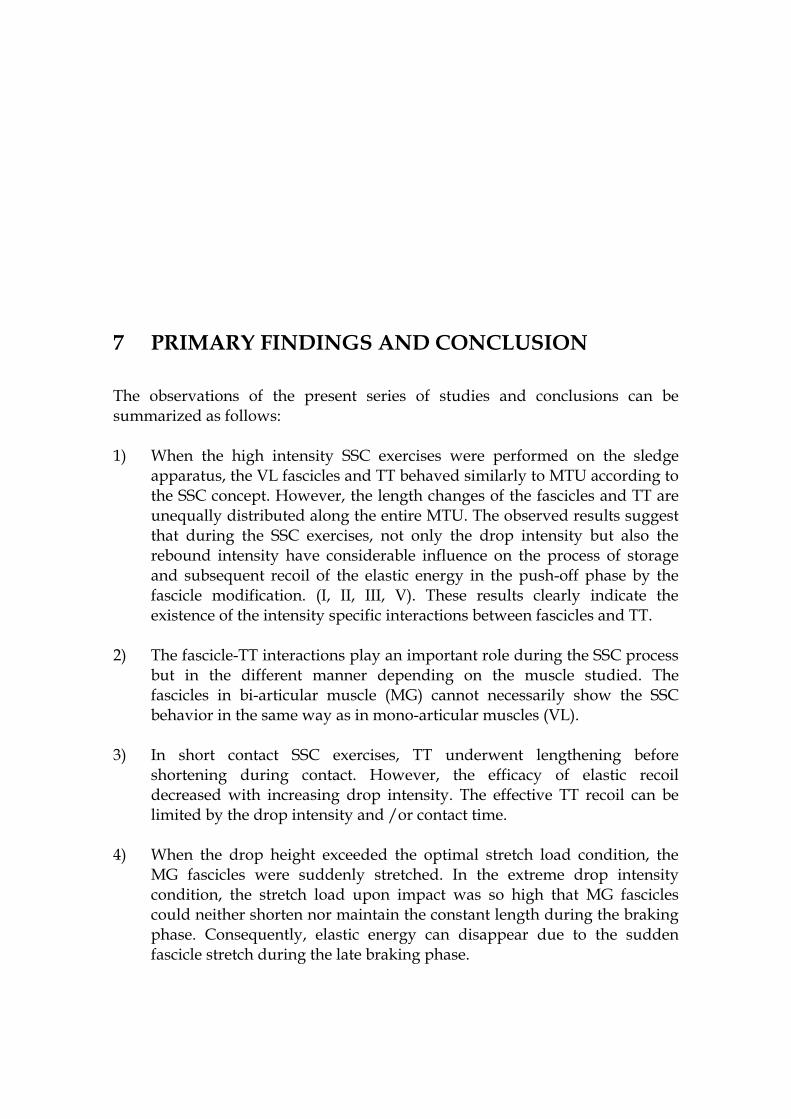
7 PRIMARY FINDINGS AND CONCLUSION
The observations of the present series of studies and conclusions can be summarized as follows: 1) When the high intensity SSC exercises were performed on the sledge
apparatus, the VL fascicles and TT behaved similarly to MTU according to the SSC concept. However, the length changes of the fascicles and TT are unequally distributed along the entire MTU. The observed results suggest that during the SSC exercises, not only the drop intensity but also the rebound intensity have considerable influence on the process of storage and subsequent recoil of the elastic energy in the push-off phase by the fascicle modification. (I, II, III, V). These results clearly indicate the existence of the intensity specific interactions between fascicles and TT.
2) The fascicle-TT interactions play an important role during the SSC process but in the different manner depending on the muscle studied. The fascicles in bi-articular muscle (MG) cannot necessarily show the SSC behavior in the same way as in mono-articular muscles (VL).
3) In short contact SSC exercises, TT underwent lengthening before shortening during contact. However, the efficacy of elastic recoil decreased with increasing drop intensity. The effective TT recoil can be limited by the drop intensity and /or contact time.
4) When the drop height exceeded the optimal stretch load condition, the MG fascicles were suddenly stretched. In the extreme drop intensity condition, the stretch load upon impact was so high that MG fascicles could neither shorten nor maintain the constant length during the braking phase. Consequently, elastic energy can disappear due to the sudden fascicle stretch during the late braking phase.

73
5) The MG fascicles behave differently between jogging and walking on the ground. This fascicle behavior can be modified by determining the choice of the movement pattern to utilize the elasticity of TT effectively. Jogging was characterized to utilize elasticity as a spring-like bouncing, whereas in walking the catapult action was more dominant.
6) After exhausting SSC fatigue, the present ultrasonography method was able to assess changes in muscle architecture. The time course changes of the muscle thickness and the LSOL_fa between passive and active situation did not follow the bimodal trend. It is very likely that the extent of the partial performance recovery after acute performance reduction can be related to the metabolic effect and increased TT compliance and that the secondary decline in MVC could be related to the increased muscle volume (thickness) and reduction of the TT compliance.

74
YHTEENVETO Venytysrefleksin muutokset liikkeessä ja väsymyksessä Tämän tutkimussarjan tarkoituksena oli selvittää kuinka lihaksen supistuvan komponentin ja jännerakenteiden yhteistoiminta vaikuttaa elastisen energian hyödyntämiseen venymis-lyhenemissyklisissä (stretch-shortening cycle, SSC) kuormitustilanteissa. Ulomman reisilihaksen ja kolmipäisen pohjelihaksen li-hassolukimppujen (fasikulusten) ja jännerakenteiden pituuden muutoksia tar-kasteltiin luonnollisten SSC-suoritusten aikana ultraäänitekniikalla yhdessä ai-nutlaatuisen jänteen voimaa mittaavan optisen kuituanturin kanssa. Ultraääni-tekniikkaa käytettiin myös selvitettäessä lihas-jännekompleksin rakenteellisia muutoksia uuvuttavan SSC-kuormituksen yhteydessä. Tutkimuksen tulokset paljastivat uusia löydöksiä lihas-jännekompleksin eri osien toiminnassa luonnollisen liikkumisen yhteydessä. Lihaksen supistu-van komponentin ja jännerakenteiden yhteistoiminnan elastisen energian hyö-dyntämisessä todettiin olevan suorituksen intensiteetistä riippuvainen. Intensi-teetillä havaittiin olevan vaikutusta fasikulusten jäykkyyden säätelyyn ja sitä kautta lihas-jännekompleksin toiminnan tehokkuuteen lyhenemisvaiheessa. Jännerakenteiden kyky hyödyntää elastista energiaa näyttäisi kuitenkin olevan rajallinen ja sitä voitiin lisätä vain tiettyyn kuormitustasoon asti. Fasikulusten toiminnassa havaittiin myös eroja lihasten välillä. Ns. kak-sinivelisen lihaksen (tässä sisempi kaksoiskantalihas) toiminta luonnollisessa liikkumisessa ei välttämättä vastaa tyypillistä SSC-toimintaa, toisin kuin ns. yk-sinivelisissä lihaksissa kuten esimerkiksi ulommassa reisilihaksessa. Jännera-kenteiden venymis-lyhenemistoiminta näyttäisi puolestaan eroavan eri tilan-teissa. Juoksussa jännerakenteet toimivat jousen tavoin kun taas kävelyssä nii-den toiminta muistuttaa katapultti-ilmiötä hitaan venymisvaiheen vuoksi. Erot fasikulusten ja jännerakenteiden yhteistoiminnassa liikkumisen aikana mahdol-listavat kuitenkin lihas-jännekompleksin tarkoituksenmukaisen toiminnan eri tilanteissa. Uuvuttavan SSC-kuormituksen jälkeisessä seurannassa havaittiin, että väsymisestä johtuvat muutokset lihasrakenteessa eivät seuraa ns. kaksivaiheista palautumismallia, mikä on tyypillistä suorituskykymuuttujille. Kuormituksen jälkeiset jännerakenteiden jäykkyyden muutokset sekä mahdollisesta lihasvau-riosta johtuva lihaksen tilavuuden kasvu ovat todennäköisesti yhteydessä kak-sivaiheisen palautumismallin hitaaseen vaiheeseen.

75
REFERENCES Abbott BC, Bigland B and Ritchie JM 1952. The physiological cost of negative work. J
Physiol 117: 380-390. Abrahams M 1967. Mechanical behaviour of tendon in vitro. A preliminary report.
Med Biol Eng 5: 433-443. Akima H, Kuno S, Fukunaga T and Katsuta S 1995. Architectural properties and
specific tension of human knee extensor and flexor muscles based on magnetic resonance imaging. Jpn J Phys Fitness Med 44: 267-278.
Alexander RM 1974. The mechanics of jumping by a dog. J Zool Lond 173: 549-573. Alexander RM and Bennet-Clark H 1977. Storage of elastic strain energy in muscle and
other tissues. Nature 265:114–117. Alexander RM, Dimery NJ and Ker RF 1985. Elastic structures in the back and their role
in galloping in some mammals. J Zool Lond A 207: 467–482. Alexander RM and Ker RF 1990. The architecture of leg muscles. In: Multiple muscle
systems, edited by Woo SL and Winters JL. New York: Springer, p 568-577. Alexander RM 2002. Tendon elasticity and muscle function. Comparative Biochemistry
and Physiology - Part A: Molecular and Integrative 133: 1001-1011. Allinger T and Herzog W 1992. Calculated fiber length in cat gastrocnemius muscle
during walking. Proc NACOB II: 81-82. Allum JH and Mauritz KH 1984. Compensation for intrinsic muscle stiffness by
short-latency reflexes in human triceps surae muscles. J Neurophysiol 52: 797-818. Arndt AN, Komi PV, Brüggemann GPand Lukkariniemi J 1998. Individual muscle
contributions to the in vivo achilles tendon force. Clin Biomech 13: 532-541. Arnold G 1974. Biomechanische und rheologische Eigenschaften menschlicher Sehnen.
Zeitschrift der Anatomischen Entwicklungsgeschichte 143: 262-300. Asmussen E, Hansen O and Lammert O 1965. the relation between isometric and
dynamic muscle strength in man. Communications from the testing and observation institute of the Danish National Association for Infantile Paralysis, No 20.
Asmussen E and Sorensen N 1971. The Wind-up” movement in athletics. Le Trav Hum 34: 147-156.
Asmussen E and Bonde-Petersen F 1974a. Storage of Elastic energy in skeletal muscle in man. Acta physiol Scand 91: 385-392.
Asmussen E and Bonde-Petersen F 1974b. Apparent efficiency and storage of elastic energy in human muscles during exercise. Acta Physiol Scand 92: 537-545.
Asmussen E and Bonde-Petersen F and Jorgensen K 1976. Mechano-elastic properties of human muscles at different temperatures. Acta Physiol Scand 96: 83-93.
Avela J, Kyröläinen H, Komi PV and Rama D 1999. Reduced reflex sensitivity persist several days after long-lasting stretch-shortening cycle exercise. J Appl Physiol 86: 1292–1300.

76
Aura O and Komi PV 1986a. Effects of prestretch intensity on mechanical efficiency of positive work and on elastic behavior of skeletal muscle in stretch-shortening cycle exercise. Int J Sports Med 7: 137-143.
Aura O and Komi PV 1986b. Mechanical efficiency of pure positive and pure negative work with special reference to the work intensity. Int J sports med 7: 44-49.
Bach TM, Chapman AE and Calvert TW 1983. Mechanical resonance of the human body during voluntary oscillations about the ankle joint. J Biomech 16: 85–90.
Baratta R and Solomonow M 1991. The effect of tendon viscoelastic stiffness on the dynamic performance of isometric muscle. J Biomech 24: 109-116.
Belli A and Bosco C 1992. Influence of stretch-shortening cycle on mechanical behaviour of triceps surae during hopping. Acta Physiol Scand 144: 401-408.
Bennett MB, Ker RF, Dimery NJ and Alexander RM 1986. Mechanical properties of various mammalian tendons. J Zool Lond A 209: 537–548.
Bennet-Clark HC and Lucey EC 1967. The jump of the flea: a study of the energetics and a model of the mechanism. J Exp Biol 47: 59–76.
Bennet-Clark HC 1975. The energetics of the jump of the locust Schistocerca gregaria. J Exp Biol 63: 53–83.
Biewener AA, Corning WT and Tobalske BW 1998. In vivo pectoralis muscle force-length behavior during level flight in pigeons (columba livia). J Exp Biol 201: 3293-3307.
Biewener AA and Roberts TJ 2000. Muscle and tendon contributions to force, work, and elastic energy savings: a comparative perspective. Exerc Sport Sci Rev 28: 99-107.
Bobbert MF and van Ingen Schenau GJ 1988. Coordination in vertical jumping. J Biomech 21: 249-262.
Bosco C and Komi PV 1980. Influence of aging on the mechanical behavior of leg extensor muscles. Eur J Appl Physiol Occup Physiol 45: 209-219.
Bosco C, Komi, PV and Ito A 1981. Prestretch potentiation of human skeletal muscle during ballistic movement. Acta Physiol Scand 111: 135-140.
Bosco C, Tarkka I and Komi PV 1982a. Effect of elastic energy and myoelectrical potentiation of triceps surae during stretch-shortening cycle exercise. Int J Sports Med 3: 137-140.
Bosco C, Tihanyi I, Komi PV, Fekete G and Apor P 1982b. Store and recoil of elastic energy in slow and fast types of human skeletal muscles. Acta Physiol Scand 116: 343-349.
Bosco C, Viitasalo JT, Komi PV and Luhtanen P 1982c. Combined effect of elastic energy and myoelectrical potentiation during stretch-shortening cycle exercise. Acta Physiol Scand 114: 557-565.
Butler DL, Grood ES, Noyes FR, Zernicke RF and Brackett K 1984. Effects of structure and strain measurement technique on the material properties of young human tendons and fascia. J Biomech 17: 579-596.
Cavagna GA, Saibene FP and Margaria R 1963. External work in walking. J Appl Physiol 18: 1-9.
Cavagna GA, Saibene FP and Margaria R 1964. Mechanical work in running. J Appl Physiol 19: 249-256.

77
Cavagna GA, Saibene FP and Margaria R 1965. Effect of negative work on the amount of positive work performed by an isolated muscle. J Appl Physiol 20: 157-158.
Cavagna GA, Dusman B and Margaria R 1968. Positive work done by a previously stretched muscle. J Appl Physiol 24: 21-32.
Cavagna GA and Citterio G 1974. Effect of stretching on the elastic characteristics and the contractile component of frog striated muscle. J Physiol. 39: 1-14.
Cavagna GA 1977. Storage and utilization of elastic energy in skeletal muscle. Exerc Sports Sci Rev 5: 89–129.
Cavagna GA, Thys H and Zamboni A 1976. The sources of external work in level walking and running. J Physiol 262: 639-657.
Cavagna GA and Kaneko M 1977. Mechanical work and efficiency in level walking and running. J Physiol 268: 467-481.
Cavagna GA, Heglund NC and Taylor CR 1977. Mechanical work in terrestrial locomotion: two basic mechanisms for minimizing energy expenditure. Am J Physiol 233: R243-261.
Cavagna GA and Franzetti P 1981. Mechanics of competition walking. J Physiol 315: 243-251.
Cavagna GA, Mantovani M, Willems PA and Musch G 1997. The resonant step frequency in human running. Pflugers Arch 434: 678-684.
Cavanagh PR and Kram R 1985. The efficiency of human movement--a statement of the problem. Med Sci Sports Exerc 17: 304-308.
Cheung K, Hume P and Maxwell L 2003. Delayed onset muscle soreness: treatment strategies and performance factors. Sports Med 33: 145-164.
Chow RS, Medri MK, Martin DC, Leekam RN, Agur AM and McKee NH 2000. Sonographic studies of human soleus and gastrocnemius muscle architecture: gender variability. Eur J Appl Physiol 82: 236-244.
Chleboun GS, Howell JN, Conatser RR and Giesey JJ 1998. Relationship between muscle swelling and stiffness after eccentric exercise. Med Sci Sports Exerc 30: 529-535.
Crenshaw AG, Thornell LE and Fridén J 1994. Intramuscular pressure, torque and swelling for the exercise-induced sore vastus lateralis muscle. Acta Physiol Scand 152: 265-277.
Dietz V, Schmidtbleicher D and Noth J 1979. Neural mechanisms of human locomotion. J Neurophysiol 42: 1212-1222.
Dyhre-Poulsen P, Simonsen EB and Voigt M 1991. Dynamic control of muscle stiffness and H reflex modulation during hopping and jumping in man. J Physiol 437: 287-304.
Edman KPA, Elzinga G and Noble MIM 1978. Enhancement of mechanical performance by stretch during tetanic contractions of vertebrate skeletal muscle fibres. J Physiol 281: 139-155.
Elftman H 1939. The function of muscles in locomotion. Am J Physiol 125: 339-356. Elftman H 1940. The work done by muscles in running. Am J Physiol 129: 672-684. Esformes JI, Narici MV and Maganaris CN 2002. Measurement of human muscle
volume using ultrasonography. Eur J Appl Physiol 87: 90-92.

78
Ettema GJ and Huijing PA 1989. Properties of the tendinous structures and series elastic component of EDL muscle-tendon complex of the rat. J Biomech 22: 1209-1215.
Ettema GJ 1996. Mechanical efficiency and efficiency of storage and release of series elastic energy in skeletal muscle during stretch-shorten cycles. J Exp Biol 199: 1983-1997.
Ettema GJ 1997. Mechanical behaviour of rat skeletal muscle during fatiguing stretch-shortening cycles. Exp Physiol 82: 107-119.
Evans WJ and Cannon JG 1991. The metabolic effects of exercise-induced muscle damage. Exerc Sport Sci Rev 19: 99-125.
Farley C, Blickhan R, Saito J and Taylor CR 1991. Hopping frequency in humans: a test how springs set stride frequency in bouncing gaits. J Appl Physiol 71: 2127–2132.
Farley CT and McMahon TA 1992. Energetics of walking and running: insights from simulated reduced-gravity experiments. J Appl Physiol 73: 2709-2712.
Farley CT, Glasheen J and McMahon TA 1993. Running springs: speed and animal size. J Exp Biol 185: 71-86.
Farley CT and Morgenroth DC 1999. Leg stiffness primarily depends on ankle stiffness during human hopping. J Biomech 32: 267-273.
Faulkner JA, Brooks SV and Opiteck JA 1993. Injury to skeletal muscle fibers during contractions: conditions of occurrence and prevention. Phys Ther 73: 911–921.
Fenn WO 1924. the relationship between the work performed and the energy liberated in muscular contraction. J Physiol 58: 373-395.
Fenn WO 1930. Work against gravity and work due to velocity changes in running. Am J Physiol 93: 433-462.
Fenn WO and Marsh BS 1935. Muscular force at different speeds of shortening. J Physiol 85: 277-297.
Fellows SJ and Rack PM 1987. Changes in the length of the human biceps brachii muscle during elbow movements. J Physiol 383: 405-412.
Finni T, Komi PV and Lukkariniemi J 1998. Achilles tendon loading during walking: application of a novel optic fiber technique. Eur J Appl Physiol 77: 289-291.
Finni T, Komi PV and Lepola V 2000. In vivo triceps surae and quadriceps femoris muscle function in a squat jump and counter movement jump. Eur J Appl Physiol 83: 416-426.
Finni T, Komi PV and Lepola V 2001a. In vivo muscle mechanics during normal locomotion is dependent on movement amplitude and contraction intensity. Eur J Appl Physiol 85: 170-176.
Finni T, Ikegawa S and Komi PV 2001b. Concentric force enhancement during human movement. Acta Physiol Scand 173: 369-377.
Finni T, Ikegawa S, Lepola V and Komi PV 2001c. In vivo behavior of vastus lateralis muscle during dynamic performances. Eur J Sci [online] 1,1. Human Kinetics and European College of Sport Science.
Finni T and Komi PV 2002. Two methods for estimating tendinous tissue elongation during human movement. J Appl Biomech 18: 180-188.
79
Finni T, Ikegawa S, Lepola V and Komi PV 2003a. Comparison of force-velocity relationships of vastus lateralis muscle in isokinetic and in stretch-shortening cycle exercises. Acta Physiol Scand 177: 483-491.
Finni T, Hodgson JA, Lai AM, Edgerton VR and Sinha S 2003b. Nonuniform strain of human soleus aponeurosis-tendon complex during submaximal voluntary contractions in vivo. J Appl Physiol 95: 829-837
Flitney FW and Hirst DG 1978. Cross-bridge detachment and sarcomere 'give' during stretch of active frog's muscle. J Physiol 276: 449-465.
Fridén J and Lieber RL 1996. Ultrastructural evidence for loss of calcium homeostasis in exercised skeletal muscle. Acta Physiol Scand 158: 381-382.
Fukashiro S and Komi PV 1987. Joint moment and mechanical power flow of the lower limb during vertical jump. Int J Sports Med 8: 15-21.
Fukashiro S, Komi PV, Järvinen M and Miyashita M 1993. Comparison between the directly measured Achilles tendon force and the tendon force calculated from the ankle joint moment during vertical jumps. Clin Biomech 8: 25-30.
Fukashiro S, Komi PV, Järvinen M and Miyashita M 1995. In vivo Achilles tendon loading during jumping in humans. Eur J Appl Physiol 71: 453-458.
Fukashiro S, Itoh M, Ichinose Y, Kawakami Y and Fukunaga T 1995. Ultrasonography gives directly but noninvasively elastic characteristic of human tendon in vivo. Eur J Applied Physiol 71: 555-557
Fukunaga T, Roy RR, Shellock FG, Hodgson JA, Day MK, Lee PL, Kwong-Fu H and Edgerton VR 1992. Physiological cross-sectional area of human leg muscles based on magnetic resonance imaging. J Orthop Res 10: 928-934.
Fukunaga T, Roy RR, Shellock FG, Hodgson JA and Edgerton VR 1996a. Specific tension of human plantar flexors and dorsiflexors. J Appl Physiol 80: 158-165.
Fukunaga T, Ito M, Ichinose Y, Kuno S, Kawakami Y, and Fukashiro S 1996b. Tendinous movement of a human muscle during voluntary contractions determined by real-time ultrasonography. J Appl Physiol 813: 1430-1433.
Fukunaga T, Kawakami Y, Kuno S, Funato K and Fukashiro S 1997. Muscle architecture and function in humans. J Biomech 30: 457-463.
Fukunaga T, Kubo K, Kawakami Y, Fukashiro S, Kanehisa H and Maganaris CN 2001. In vivo behavior of human muscle tendon during walking. Proc R Soc Lond B268: 229-233.
Fukunaga T, Kawakami Y, Kubo K and Kanehisa H 2002. Muscle and tendon interaction during human movements. Exerc Sport Sci Rev 30: 106-110.
Gans C and de Vree F 1987. Functional bases of fiber length and angulation in muscle. J Morphol 192: 63-85.
Gollhofer A, Schmidtbleicher D and Dietz V 1984. Regulation of muscle stiffness in human locomotion. Int J Sports Med 5: 19–22.
Gollhofer A, Komi PV, Miyashita M and Aura O 1987. Fatigue during stretch-shortening cycle exercises: changes in mechanical performance of human skeletal muscle. Int J Sports Med 8: 71-78.
Gollhofer A and Kyröläinen H 1991. Neuromuscular control of the human leg extensor muscles in jump exercises under various stretch-load conditions. Int J Sports Med 12: 34-40.

80
Gollhofer A and Rapp W 1993. Recovery of stretch reflex responses following mechanical stimulation. Eur J Appl Physiol Occup Physiol 66: 415-420.
Gollhofer A, Komi PV, Voigt M and Nicol C 1995. Mechanical contribution of isolated stretch evoked EMG-responses. In: Häkkinen K, Keskinen KL, Komi PV. and Mero A. (eds.) Proceedings of the Xvth ISB, Jyväskylä, Finland, pp. 330-331.
Gregoire L, Veeger HE, Huijing PA and van Ingen Schenau GJ 1984. Role of mono- and biarticular muscles in explosive movements. Int J Sports Med 5: 301-305.
Gregor RJ, Komi PV and Jarvinen M 1987. Achilles tendon forces during cycling. Int J Sports Med 8 (Suppl 1): 9-14.
Gregor RJ, Roy RR, Whiting WC, Lovely RG, Hodgson JA and Edgerton VR 1988. Mechanical output of the cat soleus during treadmill locomotion: in vivo vs. in situ characteristics. J Biomech 21: 721-732.
Gregor RJ, Komi PV, Browning RC and Järvinen M 1991. A comparison of triceps surae and residual muscle moments at the ankle during cycling. J Biomech 24: 287-297.
Grey MJ, Ladouceur M, Andersen JB, Nielsen JB and Sinkjær T 2001. Group II muscle afferents probably contribute to the medium latency soleus stretch reflex during walking in humans. J Physiol 534: 925-933.
Grieve DW, Pheasant SQ and Cavanagh PR 1978. Prediction of gastrocnemius length from knee and ankle joint posture. In: Biomechanics VI-A (eds. Asmissen E and Jörgensen K), University Park Press, Baltimore, 405-412.
Griffin TM, Tolani NA and Kram R 1999. Walking in simulated reduced gravity: mechanical energy fluctuations and exchange. J Appl Physiol 86: 383-390.
Griffiths RI 1991. Shortening of muscle fibres during stretch of the active cat medial gastrocnemius muscle: the role of tendon compliance. J Physiol 436: 219-236.
Häkkinen K and Komi PV. 1983 Electromyographic changes during strength training and detraining. Med Sci Sports Exerc 15: 455-460.
Hawkins D and Hull ML 1990. A method for determining lower extremity muscle-tendon lengths during flexion/extension movements. J Biomech 23: 487-494.
Hawkins D and Bey M 1997. Muscle and tendon force-length properties and their interactions in vivo. J Biomech 30: 63-70.
He JP, Kram R and McMahon TA 1991. Mechanics of running under simulated low gravity. J Appl Physiol 71: 863-870.
Heglund NC, Fedak MA, Taylor CR and Cavagna GA 1982. Energetics and mechanics of terrestrial locomotion. IV. Total mechanical energy changes as a function of speed and body size in birds and mammals. J exp Biol 97: 57–66.
Henneman E, Somjen G and Carpenter DO 1965. Functional significance of cell size in spinal motoneurons. J Neurophysiol 28: 560-580.
Henriksson-Larsen K, Wretling ML, Lorentzon R and Oberg L 1992. Do muscle fibre size and fibre angulation correlate in pennated human muscles? Eur J Appl Physiol Occup Physiol 64: 68-72.
Herbert RD and Gandevia SC. 1995 Changes in pennation with joint angle and muscle torque: in vivo measurements in human brachialis muscle. J Physiol 484: 523-532.

81
Hijikata T, Wakisaka H and Niida S 1993. Functional combination of tapering profiles and overlapping arrangements in nonspanning skeletal muscle fibers terminating intrafascicularly. Anat Rec 236: 602-610.
Hill AV 1938. The heat of shortening and the dynamic constants of muscle. Proceedings of Royal Society B 126: 136-195.
Hill AV 1950. The series elastic component of muscle. Proc R Soc Lond B Biol Sci 137: 273-281.
Hill AV 1964. The Effect of load on the heat of shortening of muscle. Proc R Soc Lond B Biol Sci 159: 297-318.
Hof AL, Geelen BA and Van den Berg JW 1983. Calf muscle moment, work and efficiency in level walking; role of series elasticity. J Biomech 16: 523-537.
Hoffer JA and Andreassen S 1981. Regulation of soleus muscle stiffness in premammillary cats: intrinsic and reflex components. J Neurophysiol 45: 267-285.
Hoffer JA, Caputi AA, Pose IE and Griffiths RI 1989. Roles of muscle activity and load on the relationship between muscle spindle length and whole muscle length in the freely walking cat. Prog Brain Res 80: 75-85; discussion 57-60.
Horita T, Komi PV, Nicol C and Kyröläinen H 1996. Stretch shortening cycle fatigue: interactions among joint stiffness, reflex, and muscle mechanical performance in the drop jump. Eur J Appl Physiol 73: 393–403.
Horita T, Komi PV, Nicol C and Kyröläinen H 1999. Effect of exhausting stretch-shortening cycle exercise on the time course of mechanical behavior in the drop jump: possible role of muscle damage. Eur J Appl Physiol 79: 160–167.
Horowits R, Dalakas MC and Podolsky RJ 1999. Single skinned muscle fibers in Duchenne muscular dystrophy generate normal force. Ann Neurol 27: 636-41.
Houk JC 1979. Regulation of stiffness by skeletomotor reflexes. Ann Rev Physiol 41: 99-114.
Howell JN, Chila AG, Ford G, David D and Gates T 1985. An electromyographic study of elbow motion during postexercise muscle soreness. J Appl Physiol 58: 1713-1718.
Howell JN, Chleboun G and Conatser R 1993. Muscle stiffness, strength loss, swelling and soreness following exercise-induced injury in humans. J Physiol 464: 183-196.
Howry DH 1965. A brief atlas of diagnostic ultrasonic radiologic results. Radiol Clin North Am 3: 433-452.
Hugon M 1973. Methodology of the Hoffmann reflex in man. In: Desmedt JE (ed) New developments in electromyography and clinical neurophysiology. Karger, Basel, pp 277–293.
Huijing PA, van Lookeren Campagne AA and Koper JF 1989. Muscle architecture and fibre characteristics of rat gastrocnemius and semimembranosus muscles during isometric contractions. Acta Anat (Basel) 135: 46-52.
Huijing PA 1992. Elastic potential of muscle. In Komi PV. (ed) Strength and power in sport, Blackwell Scientific Publications, Oxford. pp151-168.
Huxley AF and Simmons RM 1971. Mechanical properties of the cross-bridges of frog striated muscle. J Physiol 218: 59P-60P.
Huxley HE 1957. The double array of filaments in cross-striated muscle. J Biophys Biochem Cytol 25: 631-648.

82
Ichinose Y, Kawakami Y, Ito M, Kanehisa H and Fukunaga T 2000. In vivo estimation of contraction velocity of human vastus lateralis muscle during ”isokinetic” action. J Appl Physiol 88: 851-856.
Ikai M and Fukunaga T 1968. Calculation of muscle strength per unit cross-sectional area of human muscle by means of ultrasonic measurement. Int Z angew Physiol einschl Arbeitsphysiol 26: 26-32.
Ishii N, Tsuchiya T and Sugi S 1997. An in vitro motility assay system retaining the steady-state force-velocity characteristics of muscle fibers under positive and negative loads. Biochim Biophys Acta 1319: 155-162.
Ito A, Komi PV, Sjödin B, Bosco C and Karlsson J 1983. Mechanical efficiency of positive work in running of different speeds. Med Sci Sports 15: 299-308.
Jacobs R and van Ingen Schenau GJ 1992. Intermuscular coordination in a sprint push-off. J Biomech 25: 953-965.
Jacobs R, Bobbert MF and van Ingen Schenau GJ 1993. Function of mono- and biarticular muscles in running. Med Sci Sports Exerc 25: 1163-1173.
Jewell BR and Wilkie DR 1958. An analysis of the mechanical components in frog’s striated muscle. J Physiol 143: 515-540.
Jones DA, Newham DJ and Clarkson PM 1987. Skeletal muscle stiffness and pain following eccentric exercise of the elbow flexors. Pain 30: 233-242.
Kaneko M, Komi PV and Aura O 1984. Mechanical efficiency of concentric and eccentric exercises performed with medium to fast contraction rates. Scand J Sports Sci 6: 15-20.
Kaneko M, Ito A, Fuchimoto T, Shishikura Y and Toyooka J 1985. Influence of running speed on the mechanical efficiency of sprinters and distance runners. In Winter DA, Norman RW, Wells RP, Hayes KC and Patla AE. Boltimore, MD: University Park, pp 307-312.
Katz B 1939. The relation between force and speed in muscular contraction. J Physiol 96: 45-64.
Kawakami Y, Abe T and Fukunaga T 1993. Muscle-fiber pennation angles are greater in hypertrophied than in normal muscles. J Appl Physiol 74: 2740-2744.
Kawakami Y, Ichinose Y and Fukunaga T 1998. Architectural and functional features of human triceps surae muscles during contraction. J Appl Physiol 85: 398-404.
Kawakami Y, Ichinose M, Kubo K, Ito M, Imai M. and Fukunaga T 2000. Architecture of contracting human muscles and its functional significance. J Appl Biomech 16: 88-98.
Kawakami Y, Muraoka T, Ito S, Kanehisa H and Fukunaga T 2002. In vivo muscle fibre behaviour during counter-movement exercise in humans reveals a significant role for tendon elasticity. J Physiol 540: 635-646.
Ker RF 1981. Dynamic tensile properties of the plantaris tendon of sheep (Ovis aries). J Exp Biol 93: 283–302.
Ker RF, Bennett MB, Bibby SR, Kester RC and Alexander R McN 1987. The spring in the arch of the human foot. Nature 325: 147-149.
Komi PV 1973. Relationship between muscle tension, EMG and velocity of contraction under concentric and eccentric work. In Desmedt JE (ed.) New Developments in Electromyography and Clinical Nerophysiology, Karger, Basel. 1: pp 596-606.

83
Komi PV and Rusko H 1974. Quantitative evaluation of mechanical and electrical changes during fatigue loading of eccentric and concentric work. Scand J Rehabil Med Suppl 3: 121-126.
Komi PV and Bosco C 1978. Utilization of stored elastic energy in leg extensor muscles by men and women. Med Sci Sports 10: 261-265.
Komi PV 1983. Elastic potentiation of muscle and its influence on sport performance. In Baumann, W. (ed) Biomechanics and Performance in Sport. Schorndorf, Verlag Karl Hofman, 224-229.
Komi PV, Salonen M and Järvinen M 1984. In vivo measurements of Achilles tendon forces in man. American College of Sports Medicine, Annual Meeting, San Diego, USA.
Komi PV, Salonen M and Järvinen M 1985. Measurement of in vivo Achilles tendon forces in man and their calibration. American College of Sports Medicine, Annual Meeting, Nashville, USA.
Komi PV, Gollhofer A, Schmidtbleicher D and Frick U 1987. Interaction between man and shoe in running: considerations for a more comprehensive measurement approach. Int J Sports Med 19: 196-202.
Komi PV 1990. Relevance of in vivo force measurements to human biomechanics. J Biomech 23: 23-34.
Komi, PV, Fukashiro S and Järvinen M 1992. Biomechanical loading of Achilles tendon during normal locomotion. Clin Sports Med 11: 521-531.
Komi PV, Belli A, Huttunen V and Partio E 1995. Optic fiber as a transducer for direct in-vivo measurements of human tendomuscular forces. In: Häkkinen K, Keskinen KL, Komi PV and Mero A (eds.) Proceedings of the Xvth ISB, Jyväskylä, Finland, pp 494-495.
Komi PV, Belli A, Huttunen V, Bonnefoy R, Geyssant A and Lacour JR 1996. Optic fibre as a transducer of tendomuscular forces. Eur J Appl Physiol 72: 278-280.
Komi PV and Gollhofer A 1997. Stretch reflexes can have an important role in force enhancement during SSC exercise. J Appl Biomech 13: 451-460.
Komi PV 2000. Stretch-shortening cycle: a powerful model to study normal and fatigue muscle. J Biomech 33: 1197-1206.
Kubo K, Kawakami Y and Fukunaga T 1999. Influence of elastic properties of tendon structures on jump performance in humans. Appl Physiol 87: 2090-2096.
Kubo K, Kanehisa H, Takeshita D, Kawakami Y, Fukashiro S and Fukunaga T 2000. In vivo dynamics of human medial gastrocnemius muscle-tendon complex during stretch-shortening cycle exercise. Acta Physiol Scand 170: 127-135.
Kubo K, Kanehisa H, Ito M and Fukunaga T 2001a. Effects of isometric training on the elasticity of human tendon structures in vivo. J Appl Physiol 91: 26-32.
Kubo K, Kanehisa H, Kawakami Y and Fukunaga T 2001b. Influences of repetitive muscle contractions with different modes on tendon elasticity in vivo. J Appl Physiol 191: 277-282.
Kuitunen S, Komi PV and Kyröläinen H 2002. Knee and ankle joint stiffness in sprint running. Med Sci Sports Exerc 34: 166–173.
84
Kurokawa S, Fukunaga T and Fukashiro S 2001. Behavior of fascicles and tendinous structures of human gastrocnemius during vertical jumping. J Appl Physiol 90: 1349-1358.
Kurokawa S, Fukunaga T, Nagano A and Fukashiro S 2003. Interaction between fascicles and tendinous structures during counter movement jumping investigated in vivo. J Appl Physiol 95: 2306-2314.
Kyröläinen H, Komi PV, Oksanen P, Hakkinen K, Cheng S and Kim DH 1990. Mechanical efficiency of locomotion in females during different kinds of muscle action. Eur J Appl Physiol Occup Physiol 61: 446-452.
Kyröläinen H and Komi PV 1995. Differences in mechanical efficiency between power- and endurance- trained athletes while jumping. Eur J Appl Physiol 70: 36-44.
Kyröläinen H, Komi PV, and Belli A 1995. Mechanical efficiency in athletes during running. Scand J Med Sci Sports 5: 200-208.
Kyröläinen H, Finni T, Avela J and Komi PV 2003. Neuromuscular Behaviour of the Triceps Surae Muscle-Tendon Complex during Running and Jumping. Int J Sports Med 243: 153-155.
Levin A and Wyman J 1927. The viscous elastic properties of muscle. Proc R. Soc Lond B 101: 218-243.
Lieber RL, Leonard ME, Brown CG and Trestik CL 1991. Frog semitendinosis tendon load-strain and stress-strain properties during passive loading. Am J Physiol 261: C86-92.
Lieber RL, Brown CG. and Trestik CL 1992. Model of muscle-tendon interaction during frog semitendinosis fixed-end contractions. J Biomech 25: 421-428.
Lieber RL, Leonard ME and Brown-Maupin CG 2000. Effects of muscle contraction on the load-strain properties of frog aponeurosis and tendon. Cells Tissues Organs 66: 48-54.
MacIntyre DL, Reid WD, Lyster DM, Szasz IJ and McKenzie DC 1996. Presence of WBC, decreased strength, and delayed soreness in muscle after eccentric exercise. J Appl Physiol 80: 1006–1013.
Mademli L, Arampatzis A and Walsh M 2005. Effect of muscle fatigue on the compliance of the gastrocnemius medialis tendon and aponeurosis. J Biomech In Press, online 5 February 2005.
Maganaris CN, Baltzopoulos V and Sargeant AJ 1998. In vivo measurements of the triceps surae complex architecture in man: implications for muscle function. J Physiol 512: 603-614.
Maganaris CN, Baltzopoulos V and Sargeant AJ 2002. Repeated contractions alter the geometry of human skeletal muscle. J Appl Physiol 93: 2089-2094.
Maganaris CN 2003. Tendon conditioning: artefact or property? Proc R Soc Lond B Biol Sci 270: Suppl 1: S39-S42.
Magid A and Law DJ 1985. Myofibrils bear most of the resting tension in frog skeletal muscle. Science 230: 1280-1282.
Magnusson SP, Hansen P, Aagaard P, Brond J, Dyhre-Poulsen P, Bojsen-Moller J and Kjaer M 2003. Differential strain patterns of the human gastrocnemius aponeurosis and free tendon, in vivo. Acta Physiol Scand 177: 185-195.
85
Marey M and Demeny MG 1885. Locomotion humaine, mécanisme du saut. C.R Acad Sci (Paris) 101: 489-494.
Margaria R 1938. Physiology and energy expenditure during walking and running at different speeds and slopes of the ground. Atti Reale Accad. Naz. Lincei (Memoria) 7: 277-283.
Matthews PB 1991. The human stretch reflex and the motor cortex. Trends Neurosci 14: 87-91.
Merton PA 1954. Voluntary strength and fatigue. J Physiol 123: 553–564. Melvill-Jones G and Watt DGD 1971. Observation on the control of stepping and
hopping movements in man. J Physiol 219: 729–737. Miyatani M, Kanehisa H and Fukunaga T 2000. Validity of bioelectrical impedance and
ultrasonographic methods for estimating the muscle volume of the upper arm. Eur J Appl Physiol 82: 391-396.
Morgan DL 1990. New insights into the behavior of muscle during active lengthening. Biophys J 57: 209-221.
Moritani T, Oddson L and Thorstensson A 1990. Electromyographic evidence of selective fatigue during the eccentric phase of stretch/shortening cycles in man. Eur J Appl Physiol Occup Physiol 60: 425-429.
Moritani T, Oddsson L and Thorstensson A 1991. Phase-dependent preferential activation of the soleus and gastrocnemius muscle during hopping in humans. J Electromyogr Kinesiol 1: 34-40.
Morrison JB 1970. The mechanics of the knee joint in relation to normal walking. J Biomech 3: 51-61.
Muraoka T, Kawakami Y, Tachi M, and Fukunaga T 2001. Muscle fiber and tendon length changes in the human vastus lateralis during slow pedaling. J Appl Physiol 91: 2035-2040.
Murayama M, Nosaka K, Yoneda T and Minamitani K 2000. Changes in hardness of the human elbow flexor muscles after eccentric exercise. Eur J Appl Physiol 82: 361-367.
Narici MV, Roi GS and Landoni L 1988. Force of knee extensor and flexor muscles and cross-sectional area determined by nuclear magnetic resonance imaging. Eur J Appl Physiol Occup Physiol 57: 39-44.
Narici MV, Binzoni T, Hiltbrand E, Fasel J, Terrier F and Cerretelli P 1996. In vivo human gastrocnemius architecture with changing joint angle at rest and during graded isometric contraction. J Physiol 496: 287-297.
Narici MV 1999. Human skeletal muscle architecture studied in vivo by non-invasive imaging techniques: functional significance and applications. J Electromyogr Kinesiol 9: 97-103.
Nichols TR and Houk JC 1976. Improvement in linearity and regulation of stiffness that results from actions of stretch reflex. J Neurophysiol 39: 119-142.
Nicol C, Komi PV, Belli A, Huttunen V and Partio E 1995. Reflex contribution of achilles tendon forces: in-vivo measurements with the optic fibre technique. In: Häkkinen, K., Keskinen, K.L., Komi, P.V. and Mero, A. (eds.) Proceedings of the Xvth ISB, Jyväskylä, Finland, pp 674-675.
86
Nicol C, Komi PV, Horita T, Kyrolainen H and Takala TE 1996. Reduced stretch-reflex sensitivity after exhausting stretch-shortening cycle exercise. Eur J Appl Physiol Occup Physiol 72: 401-409.
Nicol C and Komi PV 1998. Significance of passively induced stretch reflexes on achilles tendon force enhancement. Muscle Nerve 21: 1546-1548.
Nicol C and Komi PV 1999. Quantification of Achilles tendon force enhancement by passively induced dorsiflexion stretches. J Appl Biomech 15: 221-232.
Nicol C and Komi PV 2000. Stretch-shortening Cycle Fatigue and its Influence on Force and Power Production. In: Strength and power in sport, edited by Komi PV, Blackwell Science. Oxford, UK, Chapter 11, pp 203-228.
Nicol C, Kuitunen S, Kyrolainen H, Avela J and Komi PV 2003. Effects of long- and short-term fatiguing stretch-shortening cycle exercises on reflex EMG and force of the tendon-muscle complex. Eur J Appl Physiol 90: 470-479.
Norman RW and Komi PV 1979. Electromechanical delay in skeletal muscle under normal movement conditions. Acta Physiol Scand 106: 241–248.
Nosaka K and Clarkson PM 1996. Changes in indicators of inflammation after eccentric exercise of the elbow flexors. Med Sci Sports Exerc 28: 953-961.
Nosaka K, Newton M and Sacco P 2002. Responses of human elbow flexor muscles to electrically stimulated forced lengthening exercise. Acta Physiol Scand 174: 137-145.
Pearson K and Gordon J 2000. Spinal Reflexes. In: Principles of Neural Science 4nd ed, edited by Kandel ER, Schwartz JH, and Jessell TM: McGraw-Hill, New York, chapt. 36: pp 712-735.
Pierrynowski MR, Winter DA and Norman RW 1981. Metabolic measures to ascertain the optimal load to be carried by man. Ergonomics 24: 393-399.
Prilutsky BI and Zatsiorsky VM 1994. Tendon action of two-joint muscles: transfer of mechanical energy between joints during jumping, landing, and running. J Biomech 27: 25-34.
Prilutsky BI, Herzog W and Allinger TL 1996a. Mechanical power and work of cat soleus, gastrocnemius and plantaris muscles during locomotion: possible functional significance of muscle design and force patterns. J Exp Biol 199: 801-814.
Prilutsky BI, Herzog W and Leonard T 1996b. Transfer of mechanical energy between ankle and knee joints by gastrocnemius and plantaris muscles during cat locomotion. J Biomech 29: 391-403.
Prilutsky BI, Petrova LN and Raitsin LM 1996c. Comparison of mechanical energy expenditure of joint moments and muscle forces during human locomotion. J Biomech 29: 405-415.
Prochazka A 1989. Sensorimotor gain control: a basic strategy of motor systems? Prog Neurobiol 33: 281-307.
Proske U and Morgan DL 1987. Tendon stiffness: methods of measurement and significance for the control of movement. J Biomech 20: 75-82.
Proske U and Morgan DL 2001. Muscle damage from eccentric exercise: mechanism, mechanical signs, adaptation and clinical applications. J Physiol 537: 333-345.

87
Rack PMH and Westbury DR 1974. The short range stiffness of active mammalian muscle and its effect on mechanical properties. J Physiol 240: 331-350
Ramsey RW and Street SF 1940. The isometric length-tension diagram of isolated skeletal muscle fibres of the frog. J Cell Comp Physiol 15: 11-34.
Rigby BJ 1964. Effect of cyclic extension on the physical properties of tendon collagen and its possible relation to biological ageing of collagen. Nature 202: 1072-1074.
Roberts TJ, Marsh RL, Weyand PG and Taylor CR 1997. Muscular force in running turkeys: the economy of minimizing work. Science 275: 1113-1115.
Roeleveld K, Baratta RV, Solomonow M, van Soest AG and Huijing PA 1993. Role of tendon properties on the dynamic performance of different isometric muscles. J Appl Physiol 74: 1348-1355.
Rugg SG, Gregor RJ, Mandelbaum BR and Chiu L 1990. In vivo moment arm calculations at the ankle using magnetic resonance imaging (MRI). J Biomech 23: 495-501.
Rutherford OM and Jones DA 1992. Measurement of fibre pennation using ultrasound in the human quadriceps in vivo. Eur J Appl Physiol Occup Physiol 65: 433-437.
Salmons S 1969. The 8th International Conference on Medical and Biomechanical Engineering meeting report. Bio Med Eng 4: 467-474.
Schmidtbleicher D, Gollhofer A and Frick U 1988. Effects of a stretch-shortening typed training on the performance capability and innervation chracteristics of leg extensor muscles. In: Groot G, Hollander AP, Huijing PA and Van Ingen Schenau G. (eds.): Int. Series on Biomechanics, Biomechnics XI-A. Amsterdam, Free Uni Press: pp 185-189.
Schwerdt H, Constantinesco A and Chambron J 1980. Dynamic viscoelastic behaviour of the human tendon in vitro. J Biomech 13: 913-922.
Scott SH and Loeb GE 1995. Mechanical properties of aponeurosis and tendon of the cat soleus muscle during whole-muscle isometric contractions. J Morphol 224: 73-86.
SENIAM 1999. European recommendations for surface electromyography. In: Hermens H, Freriks B, Merletti R, Stegeman D, Blok J, Rau G, Disselhorst-Klug C, Hägg D (eds) ISBN 90–75452–15–2.
Simonsen EB and Dyhre-Poulsen P 1999. Amplitude of the human soleus H reflex during walking and running. J Physiol 515: 929-939.
Sinkjær T, Toft E, Andreassen S and Hornemann BC 1988. Muscle stiffness in human ankle dorsiflexors: intrinsic and reflex components. J Neurophysiol 60: 1110-1121.
Spoor CW, van Leeuwen JL, van der Meulen WJ and Huson A 1991. Active force-length relationship of human lower-leg muscles estimated from morphological data: a comparison of geometric muscle models. Eur J Morphol 29: 137-160.
Spoor CW and van Leeuwen JL 1992. Knee muscle moment arms from MRI and from tendon travel. J Biomech 25: 201–206.
Svantesson U, Ernstoff B, Bergh P and Grimby G 1991. Use of a Kin-Com dynamometer to study the stretch-shortening cycle during plantar flexion. Eur J Appl Physiol Occup Physiol 62: 415-419.
88
Svantesson U, Grimby G and Thomee R 1994. Potentiation of concentric plantar flexion torque following eccentric and isometric muscle actions. Acta Physiol Scand 52: 287-293.
Sugi H 1972. Tension changes during and after stretch in frog muscle fibers. J Physiol 225: 237–253.
Sugi H and T Tsuchiya 1981. Enhancement of mechanical performance in frog muscle fibres after quick increases in load. J Physiol 319: 239–252.
Takarada Y, Iwamoto H, Sugi H, Hirano Y and Ishii N 1997a. Stretch-induced enhancement of mechanical work production in frog single fibers and human muscle. J Appl Physiol 83: 1741-1748.
Takarada Y, Hirano Y, Ishige Y and Ishii N 1997b. Stretch-induced enhancement of mechanical power output in human multijoint exercise with countermovement. J Appl Physiol 83: 1749-1755.
Taylor CR, Schmidt-nielsen K and Raab JL 1970. Scaling of energetic cost of running to body size in mammals. Am J Physiol 219: 1104–1107.
Taylor J, Stein RB and Murphy PR 1985. Impulse rates and sensitivity to stretch of soleus muscle spindle afferent fibers during locomotion in premammillary cats. J Neurophysiol 53: 341-360.
Thys H, Faraggiana T and Margaria R 1972. Utilization of muscle elasticity in exercise. J Appl Physiol 32: 491-494.
Tihanyi J, Apor P and Fekete G 1982. Force-velocity-power characteristics and fiber composition in human knee extensor muscles. Eur J Appl Physiol Occup Physiol 48: 331-343.
Toft E, Sinkjær T, Andreassen S and Larsen K 1991. Mechanical and Electromyographic responses to stretch of the human ankle extensors. J Neurophysiol 65: 1402-1410.
Talbot JA and Morgan DL 1996. Quantitative analysis of sarcomere non-uniformities in active muscle following a stretch. J Muscle Res Cell Motil 17: 261-268.
van Ingen Shenau GJ 1984. An alternative view of the concept of utilisation of elastic energy in human movement. Hum Mov Sci 3: 301-336.
van Ingen Schenau GJ, Bobbert MF and Rozendal RH 1987. The unique action of bi-articular muscles in complex movements. J Anat 155: 1-5.
van Ingen Schenau GJ, Boots PJ, de Groot G, Snackers RJ and van Woensel WW 1992. The constrained control of force and position in multi-joint movements. Neuroscience 46: 197-207.
van Ingen Schenau GJ, Dorssers WM, Welter TG, Beelen A, de Groot G and Jacobs R 1995. The control of mono-articular muscles in multijoint leg extensions in man. J Physiol 484: 247-254.
van Ingen Shenau GJ, Bobbert MF and de Haan A 1997. Does elastic energy enhance work and efficiency in the stretch-shortening cycle? J Appl Biomech 13: 389-415.
Vigreux B, Cnockaert JC and Pertuzon E 1980. Effects of fatigue on the series elastic component of human muscle. Eur J Appl Physiol Occup Physiol 45: 11-17.
Viitasalo JT and Bosco C 1982. Electromechanical behaviour of human muscles in vertical jumps. Eur J Appl Physiol Occup Physiol 48: 253-261.

89
Voigt M, Bojsen-Moller F, Simonsen EB and Dyhre-Poulsen P 1995a. The influence of tendon Youngs modulus, dimensions and instantaneous moment arms on the efficiency of human movement. J Biomech 28: 281-291.
Voigt M, Simonsen EB, Dyhre-Poulsen P and Klausen K 1995b. Mechanical and muscular factors influencing the performance in maximal vertical jumping after different prestretch loads. J Biomech 28: 293-307.
Voigt M, Dyhre-Poulsen P and Simonsen EB 1998. Modulation of short latency stretch reflexes during human hopping. Acta Physical Scand 163: 181-194.
Walshe AD and Wilson GJ 1997. The influence of musculotendinous stiffness on drop jump performance. Can J Appl Physiol 22: 117-132.
Walshe AD, Wilson GJ and Ettema GJ 1998. Stretch-shorten cycle compared with isometric preload: contributions to enhanced muscular performance. J Appl Physiol 84: 97-106.
Wang K 1996. Titin/connectin and nebulin: giant protein rulers of muscle structure and function. Adv Biophys 33: 123-134.
Wells RP 1988. Mechanical energy costs of human movement: an approach to evaluating the transfer possibilities of two-joint muscles. J Biomech 21: 955-964.
Welsh RP, McNab I and Riley P 1971. Biomechanical studies of rabbit tendon. Clin Orthop Relat Res 81: 171-177.
Wickiewicz TL, Roy RR, Powell PL, Perrine JJ and Edgerton VR 1984. Muscle architecture and force-velocity relationships in humans. J Appl Physiol 57: 435-443.
Wilkie DR. 1950 The relation between force and velocity in human muscle. J Physiol 110: 249.
Wilkie DR 1959. The work output of animals: flight by birds and by man-power. Nature 183: 1515-1516.
Winter DA 1990. Biomechanics and Motor Control of Human Movement. New York: Wiley.
Wren TA, Beaupre GS and Carter DR 2000. Tendon and ligament adaptation to exercise, immobilization, and remobilization. J Rehabil Res Dev 37: 217-224.
Yamazaki Y, Suzuki M and Mano T 1989. Performance of noncountermovement jump with both knee and hip joints fully extended. J Appl Physiol 66: 1976-1983.
Yeh HC and Wolf BS 1978. Asimple portable water bath for superficial ultrasonography. AJR 130: 275-278.
Zajac FE 1989. Muscle and tendon: properties, models, scaling, and application to biomechanics and motor control. Crit Rev Biomed Eng 17: 359-411.
Zatsiorsky VM, Werner SL and Kaimin MA 1994. Basic kinematics of walking. Step length and step frequency. J Sports Med Phys Fitness 34: 109-134.
Zuurbier CJ and Huijing PA 1991. Influence of muscle shortening on the geometry of gastrocnemius medialis muscle of the rat. Acta Anat 140: 297-303.
Related Documents