In Vivo, Multimodal Imaging of B Cell Distribution and Response to Antibody Immunotherapy in Mice Daniel L. J. Thorek 1 , Patricia Y. Tsao 2 , Vaishali Arora 2 , Lanlan Zhou 1 , Robert A. Eisenberg 2 , Andrew Tsourkas 1 * 1 Department of Bioengineering, School of Engineering and Applied Science, University of Pennsylvania, Philadelphia, Pennsylvania, United States of America, 2 Department of Medicine, School of Medicine, University of Pennsylvania, Philadelphia, Pennsylvania, United States of America Abstract Background: B cell depletion immunotherapy has been successfully employed to treat non-Hodgkin’s lymphoma. In recent years, increasing attention has been directed towards also using B-cell depletion therapy as a treatment option in autoimmune disorders. However, it appears that the further development of these approaches will depend on a methodology to determine the relation of B-cell depletion to clinical response and how individual patients should be dosed. Thus far, patients have generally been followed by quantification of peripheral blood B cells, but it is not apparent that this measurement accurately reflects systemic B cell dynamics. Methodology/Principal Findings: Cellular imaging of the targeted population in vivo may provide significant insight towards effective therapy and a greater understanding of underlying disease mechanics. Superparamagnetic iron oxide (SPIO) nanoparticles in concert with near infrared (NIR) fluorescent dyes were used to label and track primary C57BL/6 B cells. Following antibody mediated B cell depletion (anti-CD79), NIR-only labeled cells were expeditiously cleared from the circulation and spleen. Interestingly, B cells labeled with both SPIO and NIR were not depleted in the spleen. Conclusions/Significance: Whole body fluorescent tracking of B cells enabled noninvasive, longitudinal imaging of both the distribution and subsequent depletion of B lymphocytes in the spleen. Quantification of depletion revealed a greater than 40% decrease in splenic fluorescent signal-to-background ratio in antibody treated versus control mice. These data suggest that in vivo imaging can be used to follow B cell dynamics, but that the labeling method will need to be carefully chosen. SPIO labeling for tracking purposes, generally thought to be benign, appears to interfere with B cell functions and requires further examination. Citation: Thorek DLJ, Tsao PY, Arora V, Zhou L, Eisenberg RA, et al. (2010) In Vivo, Multimodal Imaging of B Cell Distribution and Response to Antibody Immunotherapy in Mice. PLoS ONE 5(5): e10655. doi:10.1371/journal.pone.0010655 Editor: Derya Unutmaz, New York University, United States of America Received March 25, 2010; Accepted April 26, 2010; Published May 17, 2010 Copyright: ß 2010 Thorek et al. This is an open-access article distributed under the terms of the Creative Commons Attribution License, which permits unrestricted use, distribution, and reproduction in any medium, provided the original author and source are credited. Funding: This work was supported in part by Wyeth-Ayerst Pharmaceuticals, the Transdisciplinary Program in Translational Medicine and Therapeutics, Department of Defense Office of the Congressionally Directed Medical Research Program (W81XWH-07-1-0457) and the Lupus Research Institute. The funders had no role in study design, data collection and analysis, decision to publish, or preparation of the manuscript. Competing Interests: This work was supported in part by Wyeth-Ayerst Pharmaceuticals. However, all information and materials are freely available in adherence with PLoS ONE policies on sharing data and materials. * E-mail: [email protected] Introduction Immunotherapeutic depletion of B cells is a clinically approved approach for the treatment of non-Hodgkin’s lymphoma, a type of cancer derived from lymphocytes [1]. Rituximab, an engineered anti-CD20 monoclonal antibody that targets B cells at most stages of development, functions therapeutically by specifically eradicat- ing CD20-positive lymphocytes from the patient [2]. Its success has led to its application against a range of non-malignant B cell pathogenic diseases. These include IgM-associated polyneuropa- thy [3,4,5], multiple sclerosis [6], dermatomyositis [7], rheumatoid arthritis (RA) [8,9], relapsing-remitting multiple sclerosis, and systemic lupus erythematosus (SLE) [10,11,12]. Controlled studies with rituximab have already demonstrated a reduction of disease activity in RA patients [13,14,15], resulting in its clinical approval for treatment of this autoimmune disease. However, rituximab has failed to show clinical efficacy in Phase II and III trials for treatment of primary progressive multiple sclerosis [16] and SLE [17,18,19,20]. In the clinical setting, the effectiveness of depletion is usually followed through quantification of peripheral blood B cells. However, in SLE patients this measure varies widely for a given dose [21,22], and does not seem to adequately reflect patient response [10,12]. Appreciation of the biological response to treatment within the lymphoid organs is therefore expected to be beneficial for greater understanding of underlying disease mechanisms and insight towards development of effective therapies [23]. Cellular and molecular imaging techniques can be used non- invasively, quantitatively and repetitively to visualize cell popula- tions in vivo [24]. Previous studies have utilized radioactive [25], fluorescent [26,27] and bioluminescent imaging (BLI) [28,29] approaches to investigate lymphocyte distribution. Recently, a BLI transgenic model was used to monitor the effect of rituximab depletion of a transgenic lymphoma model [30]. Cellular imaging may provide a means to assess the biological response to anti- CD20 and other immunotherapeutics, thereby providing insight into the dose-response behavior and efficacy of treatment. PLoS ONE | www.plosone.org 1 May 2010 | Volume 5 | Issue 5 | e10655

Welcome message from author
This document is posted to help you gain knowledge. Please leave a comment to let me know what you think about it! Share it to your friends and learn new things together.
Transcript
In Vivo, Multimodal Imaging of B Cell Distribution andResponse to Antibody Immunotherapy in MiceDaniel L. J. Thorek1, Patricia Y. Tsao2, Vaishali Arora2, Lanlan Zhou1, Robert A. Eisenberg2, Andrew
Tsourkas1*
1 Department of Bioengineering, School of Engineering and Applied Science, University of Pennsylvania, Philadelphia, Pennsylvania, United States of America,
2 Department of Medicine, School of Medicine, University of Pennsylvania, Philadelphia, Pennsylvania, United States of America
Abstract
Background: B cell depletion immunotherapy has been successfully employed to treat non-Hodgkin’s lymphoma. In recentyears, increasing attention has been directed towards also using B-cell depletion therapy as a treatment option inautoimmune disorders. However, it appears that the further development of these approaches will depend on amethodology to determine the relation of B-cell depletion to clinical response and how individual patients should be dosed.Thus far, patients have generally been followed by quantification of peripheral blood B cells, but it is not apparent that thismeasurement accurately reflects systemic B cell dynamics.
Methodology/Principal Findings: Cellular imaging of the targeted population in vivo may provide significant insighttowards effective therapy and a greater understanding of underlying disease mechanics. Superparamagnetic iron oxide(SPIO) nanoparticles in concert with near infrared (NIR) fluorescent dyes were used to label and track primary C57BL/6 Bcells. Following antibody mediated B cell depletion (anti-CD79), NIR-only labeled cells were expeditiously cleared from thecirculation and spleen. Interestingly, B cells labeled with both SPIO and NIR were not depleted in the spleen.
Conclusions/Significance: Whole body fluorescent tracking of B cells enabled noninvasive, longitudinal imaging of both thedistribution and subsequent depletion of B lymphocytes in the spleen. Quantification of depletion revealed a greater than 40%decrease in splenic fluorescent signal-to-background ratio in antibody treated versus control mice. These data suggest that invivo imaging can be used to follow B cell dynamics, but that the labeling method will need to be carefully chosen. SPIO labelingfor tracking purposes, generally thought to be benign, appears to interfere with B cell functions and requires further examination.
Citation: Thorek DLJ, Tsao PY, Arora V, Zhou L, Eisenberg RA, et al. (2010) In Vivo, Multimodal Imaging of B Cell Distribution and Response to AntibodyImmunotherapy in Mice. PLoS ONE 5(5): e10655. doi:10.1371/journal.pone.0010655
Editor: Derya Unutmaz, New York University, United States of America
Received March 25, 2010; Accepted April 26, 2010; Published May 17, 2010
Copyright: � 2010 Thorek et al. This is an open-access article distributed under the terms of the Creative Commons Attribution License, which permitsunrestricted use, distribution, and reproduction in any medium, provided the original author and source are credited.
Funding: This work was supported in part by Wyeth-Ayerst Pharmaceuticals, the Transdisciplinary Program in Translational Medicine and Therapeutics,Department of Defense Office of the Congressionally Directed Medical Research Program (W81XWH-07-1-0457) and the Lupus Research Institute. The funders hadno role in study design, data collection and analysis, decision to publish, or preparation of the manuscript.
Competing Interests: This work was supported in part by Wyeth-Ayerst Pharmaceuticals. However, all information and materials are freely available inadherence with PLoS ONE policies on sharing data and materials.
* E-mail: [email protected]
Introduction
Immunotherapeutic depletion of B cells is a clinically approved
approach for the treatment of non-Hodgkin’s lymphoma, a type of
cancer derived from lymphocytes [1]. Rituximab, an engineered
anti-CD20 monoclonal antibody that targets B cells at most stages
of development, functions therapeutically by specifically eradicat-
ing CD20-positive lymphocytes from the patient [2]. Its success
has led to its application against a range of non-malignant B cell
pathogenic diseases. These include IgM-associated polyneuropa-
thy [3,4,5], multiple sclerosis [6], dermatomyositis [7], rheumatoid
arthritis (RA) [8,9], relapsing-remitting multiple sclerosis, and
systemic lupus erythematosus (SLE) [10,11,12]. Controlled studies
with rituximab have already demonstrated a reduction of disease
activity in RA patients [13,14,15], resulting in its clinical approval
for treatment of this autoimmune disease. However, rituximab has
failed to show clinical efficacy in Phase II and III trials for
treatment of primary progressive multiple sclerosis [16] and SLE
[17,18,19,20].
In the clinical setting, the effectiveness of depletion is usually
followed through quantification of peripheral blood B cells.
However, in SLE patients this measure varies widely for a given
dose [21,22], and does not seem to adequately reflect patient
response [10,12]. Appreciation of the biological response to
treatment within the lymphoid organs is therefore expected to be
beneficial for greater understanding of underlying disease
mechanisms and insight towards development of effective
therapies [23].
Cellular and molecular imaging techniques can be used non-
invasively, quantitatively and repetitively to visualize cell popula-
tions in vivo [24]. Previous studies have utilized radioactive [25],
fluorescent [26,27] and bioluminescent imaging (BLI) [28,29]
approaches to investigate lymphocyte distribution. Recently, a BLI
transgenic model was used to monitor the effect of rituximab
depletion of a transgenic lymphoma model [30]. Cellular imaging
may provide a means to assess the biological response to anti-
CD20 and other immunotherapeutics, thereby providing insight
into the dose-response behavior and efficacy of treatment.
PLoS ONE | www.plosone.org 1 May 2010 | Volume 5 | Issue 5 | e10655

Magnetic resonance (MR) is a powerful diagnostic tool in
preclinical and clinical use that provides high resolution and deep
tissue anatomical information. Cell tracking via MR imaging has
been realized using superparamagnetic iron oxide (SPIO)
nanoparticle contrast agents in a variety of cell types and animal
disease models [31,32,33]. In the present work we have
implemented an ex vivo labeling strategy to load B cells with a
non-toxic SPIO configuration, previously determined to efficiently
label lymphocytes [34], in combination with a non-toxic near
infrared (NIR) cell membrane labeling dye [35]. This approach
enabled us to utilize, longitudinally, both MR and optical methods
to track contrast labeled cells in the spleen, prior to and following
administration of B cell depleting antibody.
Results
Labeling of primary murine B cellsThe loading of B cells harvested from the spleens of C57BL/6
mice was performed using a cationic 53.5 nm diameter SPIO
nanoparticle, schematically illustrated in Figure 1A, through a
previously validated procedure [34]. Cells were also labeled with a
lipophilic membrane associating dye, CellVue NIR 815 (NIR815),
to enable deep tissue fluorescent imaging (Fig. 1B). The proficient
loading of the cells was confirmed by fluorescent microscopy,
Fig. 1C. B cells from GFP-transgenic mice were employed in order
to identify injected cells histologically upon conclusion of in vivo
imaging.
Prior to animal experimentation, the expression levels of several
cell surface markers were assessed to determine whether SPIO and
NIR815-loading led to any change in the cell-activation state.
Specifically, the expression levels of CD40, CD80, CD86 and
MHC II were evaluated in unlabeled, SPIO-loaded and PMA-
activated B cells via flow cytometry, Fig. 1D. No significant change
in surface expression was observed between SPIO-labeled and
unlabeled cells. PMA, which is known to cause B cell activation
[36], resulted in the upregulation of CD40, CD86, and CD80 and
the downregulation of MHC II.
The ability of B cells to become activated 24 h after labeling
with SPIO was also assessed by monitoring whether treatment
with LPS led to cell surface expression patterns that mirrored cells
treated with LPS alone. It was found that LPS mediated a similar
increase in the expression of CD40, CD80, CD86 and MHC II for
both SPIO-labeled and unlabeled B cells (Fig. 1E). These findings
suggest that SPIO-loading does not interfere with normal B cell
function. Therefore, NIR815-labeled B cells with and without
SPIO were administered to C57BL/6 mice and imaged
longitudinally to observe the distribution of the B cell population
(Table 1).
The experimental timeline is illustrated in Fig. 1F. The specific
days in which MR and optical imaging were performed are
indicated. Animals were treated either with PBS or anti-CD79
antibodies one day following the administration of B cells
(immediately after imaging) to determine whether B cell depletion
could be directly monitored within the spleen. In addition, one
Figure 1. Labeling of B cells with fluorescent and MR tracers and evaluation of cellular response. A, SPIO nanoparticles function as MRcontrast agents and consist of dextran-coated iron oxide. The dextran has been aminated and labeled with the dye Alexa 680. B, In addition to SPIO,GFP-expressing B cells are also labeled with the membrane intercalating near infrared dye CellVue NIR815 (NIR815). C, Loading of B cells with SPIO(Alexa 680) and NIR815 was confirmed by fluorescence microscopy (406). D, SPIO loading did not cause any detectable change in the expression ofCD40, CD86, CD80, or MHC II. PMA treated B cells were used as a positive control. E, B cells that were loaded with SPIO could still be activated uponthe addition of LPS. F, The contrast labeled cells (206106) were tail vein injected into C57BL/6 mice on day 0. B cell trafficking and distribution wasmonitored by MR and optical imaging techniques at the indicated time points. Treatment of either PBS or anti-CD79 was administered following theimaging session on day 1.doi:10.1371/journal.pone.0010655.g001
Multimodal Imaging of B Cells
PLoS ONE | www.plosone.org 2 May 2010 | Volume 5 | Issue 5 | e10655
animal from each group (Table 1) was sacrificed and the organs
excised for additional analysis.
Small animal magnetic resonance imaging of celltrafficking
MR imaging was used longitudinally to monitor the trafficking
and biodistribution of B cells labeled with both SPIO and NIR815
or NIR815 only (i.e. SPIO-free). One day following the
administration of SPIO-labeled B cells, the spleen appeared
darker on T2*-weighted images (Fig. 2A, row i). This hypointen-
sity is consistent with the accumulation of SPIO. The spleen
remained hypointense for several days, but gradually returned to
near baseline over the course of two weeks. Animals that were
treated with anti-CD79 antibody one day following the adminis-
tration of SPIO-labeled B cells (Fig. 2A, row ii) exhibited a similar
pattern of contrast enhancement as the control (PBS-treated)
animals over the course of the study.
There was no apparent signal change in the spleen one day after
animals were injected with B cells labeled with just NIR815 dyes
(Fig. 2A, row iii). However, animals that were subsequently treated
with anti-CD79 antibodies did exhibit a gradual loss in T2*-
weighted signal within the spleen over the following two weeks
(Fig. 2A, row iv). No change in T2*-weighted signal was observed
in PBS-treated controls over the same time period.
Quantitative measurements of lymphocyte homing to the
spleen were determined by measuring the signal intensity within
the spleen. All measurements were normalized by the signal
intensity of the surrounding muscle to adjust for image variability.
The resulting value is referred to as the relative signal intensity
(rSI). All rSI values were further normalized by day 0
measurements. The normalized rSI was reduced ,40% one
day following injection of SPIO-loaded B cells, compared with
pre-contrast images (Fig. 2B, groups i and ii). Over the following
two weeks, the normalized signal ratio gradually increased
towards pre-contrast values. There was no statistically significant
difference (p,0.05) in normalized rSI between untreated (i) and
treated (ii) groups. These findings suggest that SPIO could
potentially interfere with the efficacy of B cell depletion therapy.
Animals that had SPIO-free B cells (i.e. NIR815 only)
administered exhibited a statistically significant difference in the
normalized rSI between treated and untreated groups (Fig. 2B, iii
and iv) at day 7. There also appeared to be some difference on
day 14, but variability of rSI was too great to achieve statistical
significance at this time point.
To confirm that B cells were actually being depleted following
the administration of anti-CD79 antibody, peripheral B cell counts
were acquired from sacrificed animals at each imaging time point.
It was found that the B cells were in fact rapidly depleted, reaching
a minimum approximately 4 days after the injection of anti-CD79
antibodies (Fig. 2C). Thereafter, the number of peripheral B cells
gradually increased, returning to baseline levels approximately 9-
14 days after treatment.
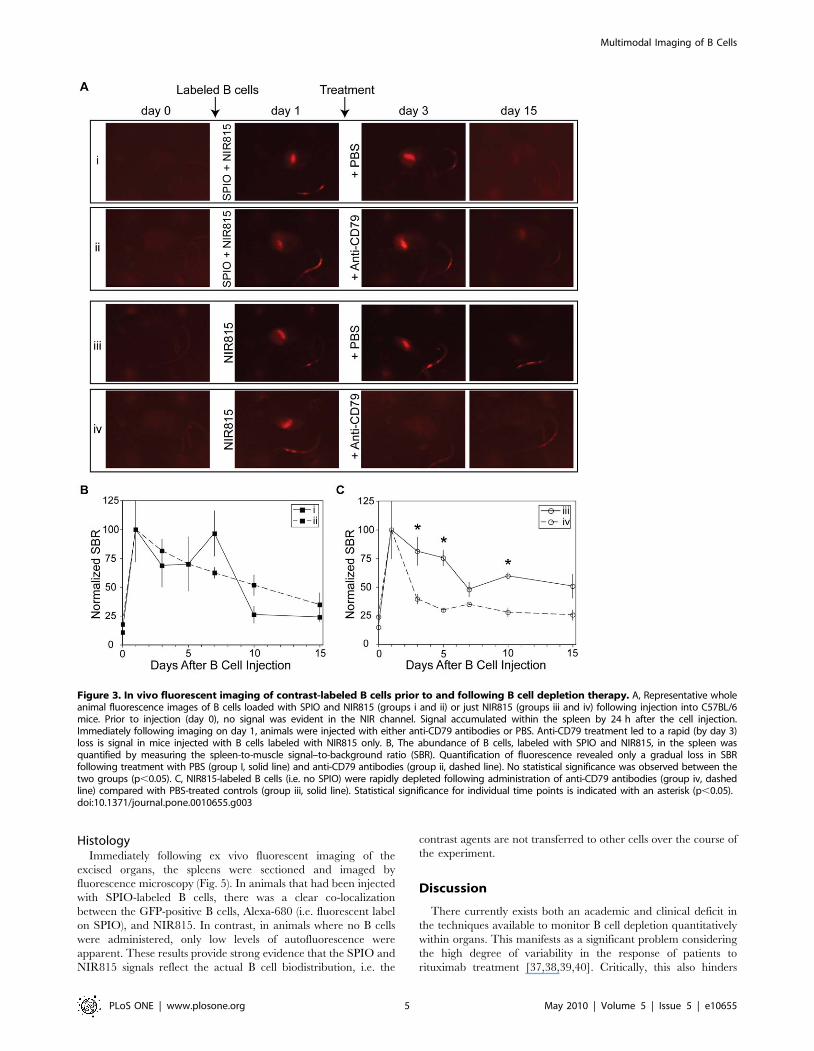
Whole body in vivo fluorescent imagingIn addition to MR imaging, it was possible to detect and
monitor the trafficking and distribution of the introduced B cell
population via NIR fluorescence imaging (Fig. 3A). Acquisitions of
both Alexa 680 (i.e. fluorescent label on SPIO) and CellVue
NIR815 (membrane dye) were obtained; however, there was
insufficient signal from the Alexa 680 dye to be detected above the
autofluorescence of living animals (not shown).
Whole body in vivo fluorescent imaging showed that the B
cells in all test groups were predominantly localized within the
spleen one day after delivery (Fig. 3A). Little fluorescence was
seen outside the spleen, except at the site of tail vein injection
where presumably a small percentage of cells had leaked
subcutaneously. Consistent with MR imaging data, B cells that
were labeled with SPIO and NIR815 did not appear depleted
following administration of anti-CD79 antibodies (Fig. 3A, row
i), compared with PBS treated controls (Fig. 3A, row ii). In both
groups, the fluorescent signal within the spleen decreased
gradually over the course of the experiment returning to near
baseline levels by day 15. In contrast, the rapid depletion of B
cells labeled with only NIR815 (i.e. SPIO-free) could be observed
via fluorescence imaging (Fig. 3A, rows iii and iv). Within two
days of administration of anti-CD79 antibody, the fluorescent
signal was reduced to near baseline levels, whereas B cells within
PBS-treated control animals exhibited a detectable, although
decreasing, fluorescent signal as late as 14 days after the
administration of PBS.
The effect of the B cell depleting antibody was quantified
through measurement of fluorescent intensity in the spleen relative
to the background (SBR), Fig. 3B. These data revealed that when
cells were labeled with SPIO and NIR815, there was no statistical
difference in the SBR between anti-CD79 antibody- and PBS-
treated subjects (Fig. 3B). Conversely, when cells were labeled with
NIR815 alone, there was a ,65% reduction in the SBR two days
following the administration of anti-CD79 antibodies compared
with only a 20% reduction of SBR in PBS-treated controls
(Fig. 3C). The difference in the SBR between treated and
untreated groups remained statistically significant for the remain-
der of the study, 14 days in total.
Ex vivo organ fluorescenceFluorescent images of the excised liver, lungs, heart and spleen
were acquired from a single animal from each group, at each time
point (Fig. 4A). The distribution of B cells as determined by ex vivo
fluorescence imaging confirmed that homing to the spleen was
rapid. One day after B cell injection a strong signal was observed
in the spleen. Significantly less fluorescence was observed in the
liver and little to no signal was detectable in the heart or lungs.
Consistent with live animals imaging studies, SPIO seemed to
interfere with the ability to deplete the transferred cells as there
was no significant difference between control and treated mice
(Fig. 4B). However, in the absence of SPIO, B cell depletion could
be readily observed through the loss of NIR815 fluorescence in the
spleen. Quantitative analysis revealed a ,80% reduction in the
mean fluorescence intensity (MFI) of NIR815 within the spleen
only two days after the administration of anti-CD79 antibodies
(Fig. 4C). Mice treated with PBS only exhibited a ,35% reduction
in MFI at the same time point.
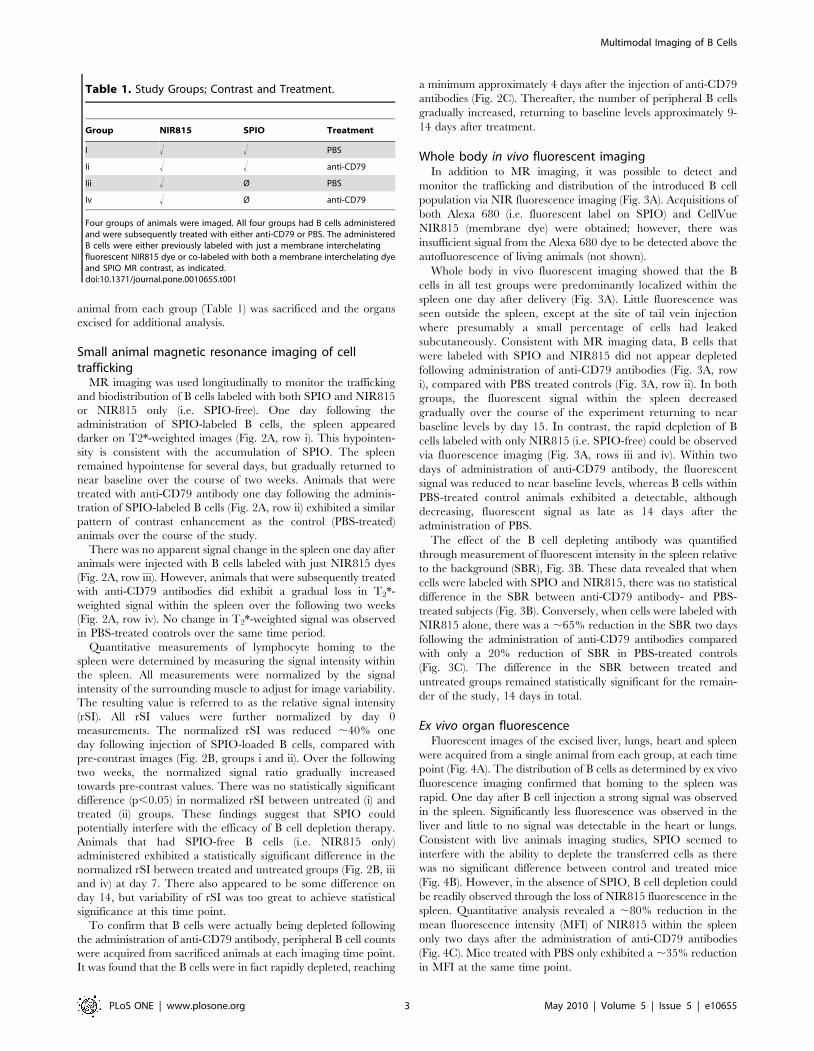
Table 1. Study Groups; Contrast and Treatment.
Group NIR815 SPIO Treatment
I ! ! PBS
Ii ! ! anti-CD79
Iii ! Ø PBS
Iv ! Ø anti-CD79
Four groups of animals were imaged. All four groups had B cells administeredand were subsequently treated with either anti-CD79 or PBS. The administeredB cells were either previously labeled with just a membrane interchelatingfluorescent NIR815 dye or co-labeled with both a membrane interchelating dyeand SPIO MR contrast, as indicated.doi:10.1371/journal.pone.0010655.t001
Multimodal Imaging of B Cells
PLoS ONE | www.plosone.org 3 May 2010 | Volume 5 | Issue 5 | e10655
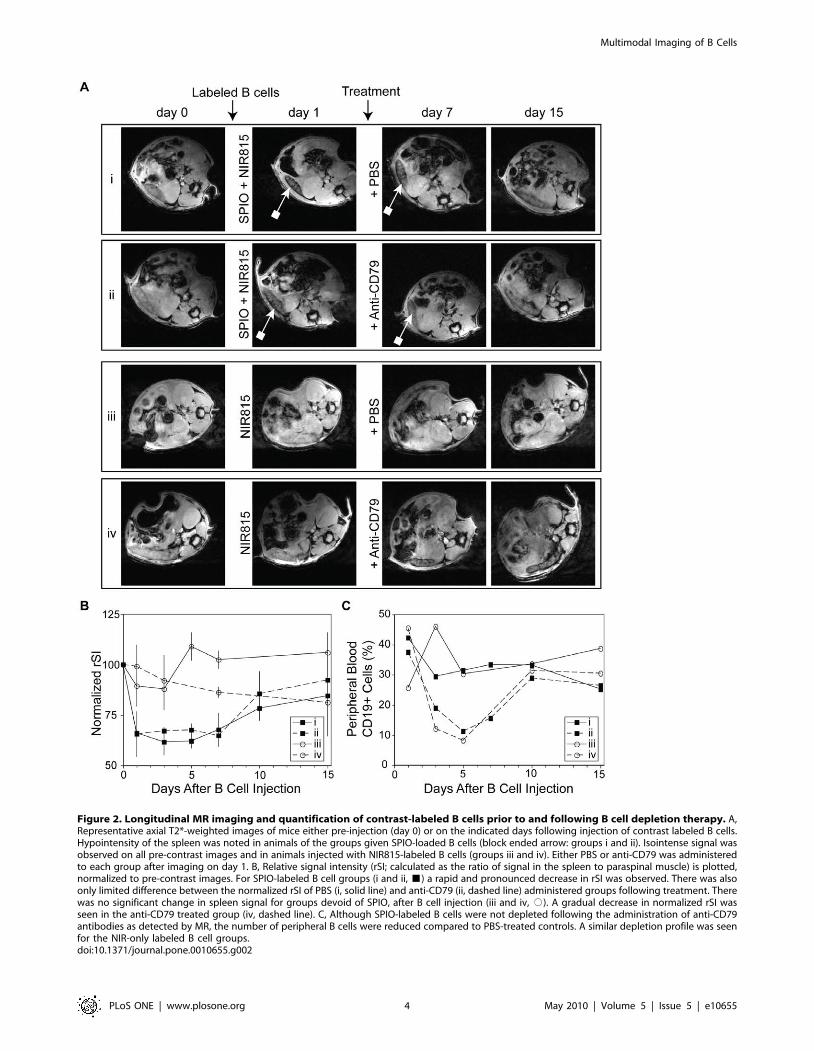
Figure 2. Longitudinal MR imaging and quantification of contrast-labeled B cells prior to and following B cell depletion therapy. A,Representative axial T2*-weighted images of mice either pre-injection (day 0) or on the indicated days following injection of contrast labeled B cells.Hypointensity of the spleen was noted in animals of the groups given SPIO-loaded B cells (block ended arrow: groups i and ii). Isointense signal wasobserved on all pre-contrast images and in animals injected with NIR815-labeled B cells (groups iii and iv). Either PBS or anti-CD79 was administeredto each group after imaging on day 1. B, Relative signal intensity (rSI; calculated as the ratio of signal in the spleen to paraspinal muscle) is plotted,normalized to pre-contrast images. For SPIO-labeled B cell groups (i and ii, &) a rapid and pronounced decrease in rSI was observed. There was alsoonly limited difference between the normalized rSI of PBS (i, solid line) and anti-CD79 (ii, dashed line) administered groups following treatment. Therewas no significant change in spleen signal for groups devoid of SPIO, after B cell injection (iii and iv, #). A gradual decrease in normalized rSI wasseen in the anti-CD79 treated group (iv, dashed line). C, Although SPIO-labeled B cells were not depleted following the administration of anti-CD79antibodies as detected by MR, the number of peripheral B cells were reduced compared to PBS-treated controls. A similar depletion profile was seenfor the NIR-only labeled B cell groups.doi:10.1371/journal.pone.0010655.g002
Multimodal Imaging of B Cells
PLoS ONE | www.plosone.org 4 May 2010 | Volume 5 | Issue 5 | e10655
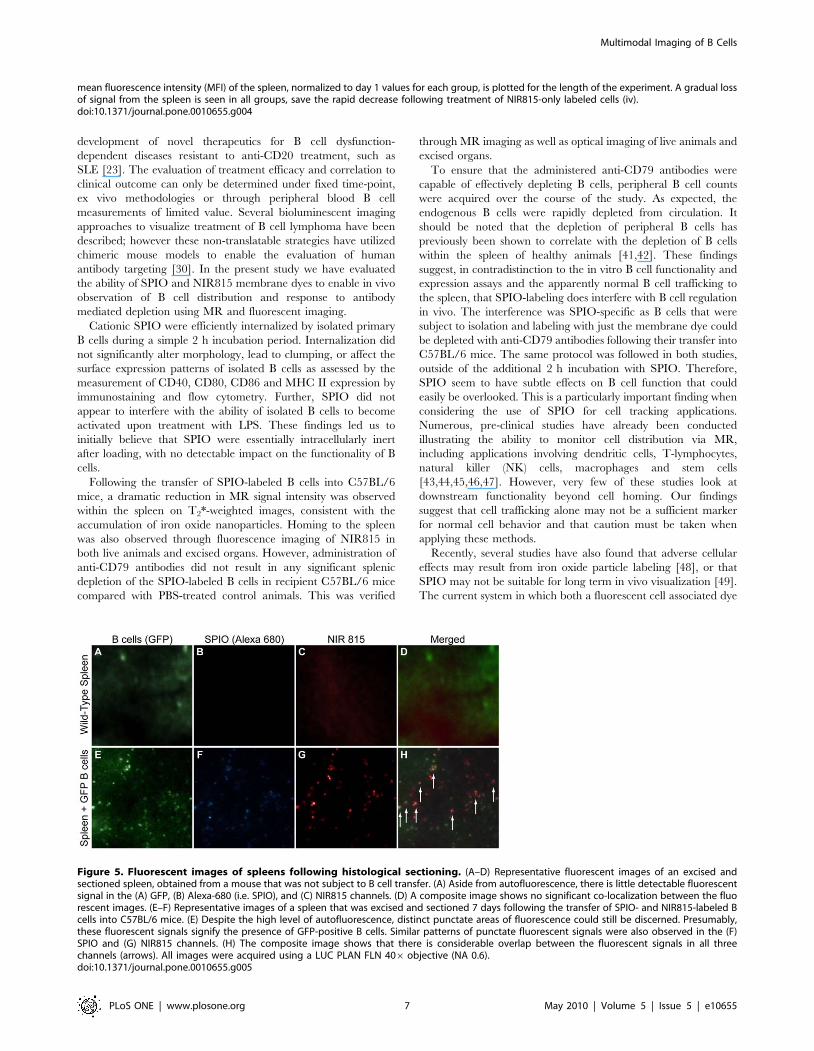
HistologyImmediately following ex vivo fluorescent imaging of the
excised organs, the spleens were sectioned and imaged by
fluorescence microscopy (Fig. 5). In animals that had been injected
with SPIO-labeled B cells, there was a clear co-localization
between the GFP-positive B cells, Alexa-680 (i.e. fluorescent label
on SPIO), and NIR815. In contrast, in animals where no B cells
were administered, only low levels of autofluorescence were
apparent. These results provide strong evidence that the SPIO and
NIR815 signals reflect the actual B cell biodistribution, i.e. the
contrast agents are not transferred to other cells over the course of
the experiment.
Discussion
There currently exists both an academic and clinical deficit in
the techniques available to monitor B cell depletion quantitatively
within organs. This manifests as a significant problem considering
the high degree of variability in the response of patients to
rituximab treatment [37,38,39,40]. Critically, this also hinders
Figure 3. In vivo fluorescent imaging of contrast-labeled B cells prior to and following B cell depletion therapy. A, Representative wholeanimal fluorescence images of B cells loaded with SPIO and NIR815 (groups i and ii) or just NIR815 (groups iii and iv) following injection into C57BL/6mice. Prior to injection (day 0), no signal was evident in the NIR channel. Signal accumulated within the spleen by 24 h after the cell injection.Immediately following imaging on day 1, animals were injected with either anti-CD79 antibodies or PBS. Anti-CD79 treatment led to a rapid (by day 3)loss is signal in mice injected with B cells labeled with NIR815 only. B, The abundance of B cells, labeled with SPIO and NIR815, in the spleen wasquantified by measuring the spleen-to-muscle signal–to-background ratio (SBR). Quantification of fluorescence revealed only a gradual loss in SBRfollowing treatment with PBS (group I, solid line) and anti-CD79 antibodies (group ii, dashed line). No statistical significance was observed between thetwo groups (p,0.05). C, NIR815-labeled B cells (i.e. no SPIO) were rapidly depleted following administration of anti-CD79 antibodies (group iv, dashedline) compared with PBS-treated controls (group iii, solid line). Statistical significance for individual time points is indicated with an asterisk (p,0.05).doi:10.1371/journal.pone.0010655.g003
Multimodal Imaging of B Cells
PLoS ONE | www.plosone.org 5 May 2010 | Volume 5 | Issue 5 | e10655
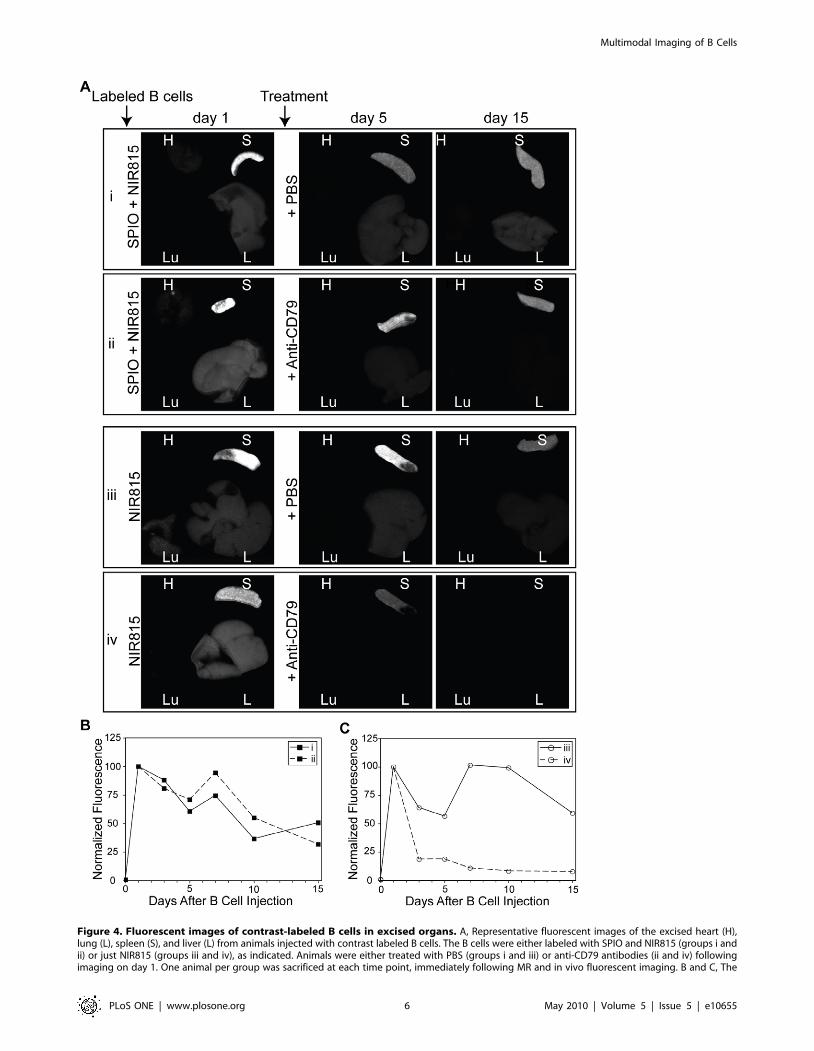
Figure 4. Fluorescent images of contrast-labeled B cells in excised organs. A, Representative fluorescent images of the excised heart (H),lung (L), spleen (S), and liver (L) from animals injected with contrast labeled B cells. The B cells were either labeled with SPIO and NIR815 (groups i andii) or just NIR815 (groups iii and iv), as indicated. Animals were either treated with PBS (groups i and iii) or anti-CD79 antibodies (ii and iv) followingimaging on day 1. One animal per group was sacrificed at each time point, immediately following MR and in vivo fluorescent imaging. B and C, The
Multimodal Imaging of B Cells
PLoS ONE | www.plosone.org 6 May 2010 | Volume 5 | Issue 5 | e10655
development of novel therapeutics for B cell dysfunction-
dependent diseases resistant to anti-CD20 treatment, such as
SLE [23]. The evaluation of treatment efficacy and correlation to
clinical outcome can only be determined under fixed time-point,
ex vivo methodologies or through peripheral blood B cell
measurements of limited value. Several bioluminescent imaging
approaches to visualize treatment of B cell lymphoma have been
described; however these non-translatable strategies have utilized
chimeric mouse models to enable the evaluation of human
antibody targeting [30]. In the present study we have evaluated
the ability of SPIO and NIR815 membrane dyes to enable in vivo
observation of B cell distribution and response to antibody
mediated depletion using MR and fluorescent imaging.
Cationic SPIO were efficiently internalized by isolated primary
B cells during a simple 2 h incubation period. Internalization did
not significantly alter morphology, lead to clumping, or affect the
surface expression patterns of isolated B cells as assessed by the
measurement of CD40, CD80, CD86 and MHC II expression by
immunostaining and flow cytometry. Further, SPIO did not
appear to interfere with the ability of isolated B cells to become
activated upon treatment with LPS. These findings led us to
initially believe that SPIO were essentially intracellularly inert
after loading, with no detectable impact on the functionality of B
cells.
Following the transfer of SPIO-labeled B cells into C57BL/6
mice, a dramatic reduction in MR signal intensity was observed
within the spleen on T2*-weighted images, consistent with the
accumulation of iron oxide nanoparticles. Homing to the spleen
was also observed through fluorescence imaging of NIR815 in
both live animals and excised organs. However, administration of
anti-CD79 antibodies did not result in any significant splenic
depletion of the SPIO-labeled B cells in recipient C57BL/6 mice
compared with PBS-treated control animals. This was verified
through MR imaging as well as optical imaging of live animals and
excised organs.
To ensure that the administered anti-CD79 antibodies were
capable of effectively depleting B cells, peripheral B cell counts
were acquired over the course of the study. As expected, the
endogenous B cells were rapidly depleted from circulation. It
should be noted that the depletion of peripheral B cells has
previously been shown to correlate with the depletion of B cells
within the spleen of healthy animals [41,42]. These findings
suggest, in contradistinction to the in vitro B cell functionality and
expression assays and the apparently normal B cell trafficking to
the spleen, that SPIO-labeling does interfere with B cell regulation
in vivo. The interference was SPIO-specific as B cells that were
subject to isolation and labeling with just the membrane dye could
be depleted with anti-CD79 antibodies following their transfer into
C57BL/6 mice. The same protocol was followed in both studies,
outside of the additional 2 h incubation with SPIO. Therefore,
SPIO seem to have subtle effects on B cell function that could
easily be overlooked. This is a particularly important finding when
considering the use of SPIO for cell tracking applications.
Numerous, pre-clinical studies have already been conducted
illustrating the ability to monitor cell distribution via MR,
including applications involving dendritic cells, T-lymphocytes,
natural killer (NK) cells, macrophages and stem cells
[43,44,45,46,47]. However, very few of these studies look at
downstream functionality beyond cell homing. Our findings
suggest that cell trafficking alone may not be a sufficient marker
for normal cell behavior and that caution must be taken when
applying these methods.
Recently, several studies have also found that adverse cellular
effects may result from iron oxide particle labeling [48], or that
SPIO may not be suitable for long term in vivo visualization [49].
The current system in which both a fluorescent cell associated dye
mean fluorescence intensity (MFI) of the spleen, normalized to day 1 values for each group, is plotted for the length of the experiment. A gradual lossof signal from the spleen is seen in all groups, save the rapid decrease following treatment of NIR815-only labeled cells (iv).doi:10.1371/journal.pone.0010655.g004
Figure 5. Fluorescent images of spleens following histological sectioning. (A–D) Representative fluorescent images of an excised andsectioned spleen, obtained from a mouse that was not subject to B cell transfer. (A) Aside from autofluorescence, there is little detectable fluorescentsignal in the (A) GFP, (B) Alexa-680 (i.e. SPIO), and (C) NIR815 channels. (D) A composite image shows no significant co-localization between the fluorescent images. (E–F) Representative images of a spleen that was excised and sectioned 7 days following the transfer of SPIO- and NIR815-labeled Bcells into C57BL/6 mice. (E) Despite the high level of autofluorescence, distinct punctate areas of fluorescence could still be discerned. Presumably,these fluorescent signals signify the presence of GFP-positive B cells. Similar patterns of punctate fluorescent signals were also observed in the (F)SPIO and (G) NIR815 channels. (H) The composite image shows that there is considerable overlap between the fluorescent signals in all threechannels (arrows). All images were acquired using a LUC PLAN FLN 406 objective (NA 0.6).doi:10.1371/journal.pone.0010655.g005
Multimodal Imaging of B Cells
PLoS ONE | www.plosone.org 7 May 2010 | Volume 5 | Issue 5 | e10655
and SPIO have been used has the potential to provide insight into
the interfering effects of nanoparticulate contrast media.
Despite the shortcomings of SPIO-labeling in this study, B cells
that were subject to labeling with just the NIR815 membrane dye
could be effectively depleted with anti-CD79 antibody following
transfer into C57BL/6 mice. The whole body fluorescent tracking
of this population of B cells enabled direct, longitudinal and
quantitative examination of both the initial accumulation and
subsequent depletion of the B lymphocytes in the spleen. We
believe that this imaging approach can be extended to animal
models of autoimmune disease and will allow greater understand
of the efficacy and physiological impact of various depletion
therapies.
Materials and Methods
All chemicals and equipment were purchased from Fisher
Scientific (Pittsburgh, PA), unless otherwise noted. Mice (Jackson
Laboratories; Bar Harbor, ME) were housed under USDA- and
AAALAC-approved conditions with free access to food and water.
The University of Pennsylvania Institutional Animal Care and Use
Committee and Small Animal Imaging Facility (SAIF) Animal
Oversight Committee approved all experimental procedures. All
in vivo imaging was conducted at the SAIF in the Department of
Radiology at the University of Pennsylvania.
Nanoparticle Synthesis and ModificationSPIO, 53.5 nm hydrodynamic diameter, R2 of 82 mM21sec21,
were produced as previously described [34]. Briefly, iron chloride
salts (4 g of FeCl3 and 1.5 g of FeCl2) were chemically co-
precipitated through base addition in inert atmosphere at 4uC in
the presence of dextran-T10 (25 g, GE Healthcare; Waukesha,
WI). The solution was heated to 90uC for 1 h and then
ultracentrifuged at 20 k RCF. SPIO were purified from reactants
via diafiltration (100 kDa MWCO; GE Healthcare) against
0.02 M citrate buffer.
The dextran coating was cross-linked in base (25% v/v 10 M
NaOH) with epichlorohydrin (33%) for 24 h. Subsequently, the
dextran was aminated by adding NH4OH to a volume fraction of
25%. The reaction was allowed to proceed for another 24 h.
Again, particles were diafiltrated from excess reactants. The
resulting particles were reacted at a 1:10 molar ratio of
SPIO:Alexa Fluor 680 (Invitrogen; Carlsbad, CA) in pH 9 sodium
bicarbonate buffer. The labeled particles were purified on a
PD10 gel filtration column in PBS to yield approximately 3 dye
molecules per particle.
Cell LabelingSplenocytes were obtained from C57BL/6 or C57BL/6-
Tg(UBC-GFP)30Scha/J mice, as required. B cells were purified
using red blood cell lysing buffer and anti-CD43 MACS beads
(Miltenyi Biotec; Hamburg, Germany) for negative selection [50].
B cells were incubated with nanoparticles (50 mg/mL) in fully
supplemented RPMI 1640 (ATCC; Manassas, VA) for 2 h. The
cells were washed of non-internalized SPIO and labeled with a 1/
50 dilution of CellVueH NIR815 dye (NIR815, Molecular
Targeting Technologies; Malvern, PA) following manufacturer
instructions. For NIR815-only labeled cells, the SPIO labeling step
was omitted.
Animal ProceduresFour groups of 8 adult (8 week old) male C57BL/6 mice were
placed on AIN-76A low-autofluorescence rodent diet (Research
Diets, Inc.; New Brunswick, NJ). Six days after food change,
animals were tail vein injected with 20 M primary B cells derived
from GFP-transgenic mice. Two groups were injected with SPIO
and NIR815-labeled cells, and two with cells that were labeled
with the NIR815 dye alone; Table 1. Three subjects per group
were imaged using MR and whole-body fluorescent imaging at
each of the following time points; prior to administration, 1, 3, 5,
7, 10 and 15 days post-injection.
Immediately following the day 1 imaging time point, an
intraperitoneal injection (IP) of either 200 mg of anti-CD79b(MH79-16, Armenian hamster IgG [42,51]) or PBS was given.
Peripheral blood lymphocytes (PBL) were measured, and the
heart, liver, lungs and spleen were removed for ex vivo fluorescent
organ imaging (Odyssey, LiCOR; Lincoln, NE) from one mouse
per group at each time point. PBL were purified of red blood cells
with ACK and stained with anti-CD19-FITC (1d3, rIgG). The
cells were subsequently fixed with 4% formaldehyde and PBL
counts were measured by flow cytometry (Easycyte, Guava
Technologies, Inc; Hayward, CA).
Cell ActivationActivation of primary C57BL/6 B cells or splenocytes by
incubation with SPIO, phorbol 12-myristate 13-acetate (PMA,
Sigma Aldrich; St. Louis, MO) and lipopolysaccharide (LPS - E.
Coli 055:B5, Sigma) was assessed by flow cytometry. B cells were
incubated with SPIO (as above), washed and maintained in culture
media for 24 h. As a positive control for activation, unlabeled B
cells were incubated with LPS (0.01 mg/mL) for 24 h. B cells were
also assessed for their ability to activate after loading with SPIO by
adding LPS to the culturing medium of SPIO-labeled cells and
incubating for 24 h. Activation was measured by changes in
surface marker expression: antibodies (1/200) against CD40 (PE),
CD86 (PE), CD80 (FITC) and MHCII (FITC) were used to label
cells after triplicate washing from culture media into 0.1% BSA in
PBS. To prevent internalization of antibody, labeling was
conducted on ice.
In Vivo Fluorescence ImagingMice were induced with inhalation anesthesia, using in a 4%
mixture of Isoflurane in oxygen. Mice were maintained at a 2%
mixture of the gas and shaved on their left side. 2-2-2
Tribromoethanol (Avertin; 500 mg/kg dose; approximately
200 mL) was administered IP 10 minutes before imaging to keep
animals motionless during acquisition. Spectral fluorescence
images of recumbent mice were acquired using a Maestro
fluorescence imaging system (CRi; Woburn, MA). The red filter
set (excitation range 615 to 665 nm; emission, 700 nm longpass)
was used to detect Alexa680-SPIO and the near infrared filter set
(excitation range 710 to 760 nm; emission, 800 nm longpass)
enabled detection of the cell membrane bound NIR815. Each
spectral image set was acquired using a 5 sec exposure with
acquisition at 10 nm steps through the emission range. The
spectral fluorescence images consisted of data from the two dyes.
The autofluorescence spectra were then unmixed based on their
spectral patterns using commercial software (Maestro software,
CRi). Line intensities were generated through the long axis of the
spleen. Mean intensities of the signal at this organ and background
were computed and averaged for each image.
In Vivo MR Imaging and AnalysisMagnetic resonance imaging was conducted using a horizontal
Varian 9.4 T small animal imaging system (Varian; Palo Alto,
CA). Gradient coils were upgraded during the course of the study,
going from a diameter of 14 to 12 cm and a gradient strength of
10 G/cm to 25 G/cm (both Varian). A dual coil, actively detuned
Multimodal Imaging of B Cells
PLoS ONE | www.plosone.org 8 May 2010 | Volume 5 | Issue 5 | e10655
system was employed; a 70 mm receiver volume coil was paired
with a 2.5 cm surface coil (InsightMRI, LLC; Worcester, MA).
Mice were induced using inhalation anesthesia, 4% isoflurane, and
maintained for the duration of image acquisition with 2%
isoflurane. The animals were placed on their right side in a split
top mouse chamber sled (m2m Imaging; Cleveland, OH) affixed
to a custom built poly-(methyl methacrylate) patient bed. The
surface coil was applied to the left side of the animal (proximal to
the spleen) and fixed in position using surgical tape to both the
mouse and bed. Temperature and electrocardiography probes
were used to monitor the mice in the 37uC environment supplied
by an air heating system (SA Instruments, Inc.; Stony Brook, NY).
Scout scans were used to identify the anatomy of interest.
Following recognition of the spleen, axial sections (1 mm thick)
were acquired in a 36636 mm field of view. Acquisition sets
consisted of np = 256, nv = 256, under T2*-weighted parameters.
A gradient echo multislice sequence was used with 2 averages, and
TR/TE 200/6 msec. Images were analyzed by defining a ROI for
the spleen and background (paraspinal) muscle. The relative
intensity of the spleen was then calculated, and statistical
significance for the image analysis was assessed using a two-tailed
parametric analysis. A p-value,0.05 was used to represent
statistical significance.
Fluorescence MicroscopyFluorescence microscopy was performed using an Olympus IX
81 motorized inverted fluorescence microscope equipped with an
Ixon (Andor Technologies; Belfast, N. Ireland) monochrome
digital camera, an X-Cite 120 excitation source (EXFO; Quebec,
PQ) and Sutter excitation and emission filter wheels (Novato, CA).
Images were acquired using a LUC PLAN FLN 406 objective
(NA 0.6) with Alexa 680 and NIR815 filter sets, (HQ665/45,
Q695LP, HQ725/50) and (HQ710/75, Q750LP, HQ810/90),
respectively (Chroma Technology Corp.; Burlington, VT).
HistologyImmediately following ex vivo fluorescent imaging of the
excised organs, spleens were embedded in Optimal Cutting
Temperature compound (Tissue-Tek, Sakura Finetek Americas,
Inc.; Torrance, CA). Fresh cut sections (8 mm thickness) were air
dried for 1 hr and then sealed under coverslips with cyanoacrylate
ester glue. Tissue was imaged for GFP (HQ480/406, Q505LP,
HQ535/50 m), Alexa 680 and NIR815 by fluorescence micros-
copy, as above.
StatisticsAll data are presented as mean 6 standard error. For statistical
evaluation, a two-tailed Student’s t-test was used, and p,0.05 was
considered significant. Calculations were performed using a
commercially available plotting and statistics software package
(GraphPad Prism; GraphPad Software, San Diego, CA).
Acknowledgments
The authors thank Dr. Yvette Liu, Dr. Steven Pickup and Dr. Weixia Liu
at the SAIF for their imaging expertise. We would also like to thank
Michael Smith (Wyeth) for his helpful suggestions and insightful comments.
Author Contributions
Conceived and designed the experiments: DLJT PT RE AT. Performed
the experiments: DLJT PT VA LZ. Analyzed the data: DLJT RE AT.
Contributed reagents/materials/analysis tools: DLJT RE AT. Wrote the
paper: DLJT RE AT.
References
1. Grillo-Lopez AJ, White CA, Dallaire BK, Varns CL, Shen CD, et al. (2000)
Rituximab: the first monoclonal antibody approved for the treatment of
lymphoma. Curr Pharm Biotechnol 1: 1–9.
2. Reff ME, Carner K, Chambers KS, Chinn PC, Leonard JE, et al. (1994)
Depletion of B cells in vivo by a chimeric mouse human monoclonal antibody to
CD20. Blood 83: 435–445.
3. Levine TD, Pestronk A (1999) IgM antibody-related polyneuropathies: B-cell
depletion chemotherapy using Rituximab. Neurology 52: 1701–1704.
4. Pestronk A, Florence J, Miller T, Choksi R, Al-Lozi MT, et al. (2003) Treatment
of IgM antibody associated polyneuropathies using rituximab. J Neurol
Neurosurg Psychiatry 74: 485–489.
5. Renaud S, Gregor M, Fuhr P, Lorenz D, Deuschl G, et al. (2003) Rituximab in
the treatment of polyneuropathy associated with anti-MAG antibodies. Muscle
Nerve 27: 611–615.
6. Hauser SL, Waubant E, Arnold DL, Vollmer T, Antel J, et al. (2008) B-cell
depletion with rituximab in relapsing-remitting multiple sclerosis. N Engl J Med
358: 676–688.
7. Levine TD (2005) Rituximab in the treatment of dermatomyositis: an open-label
pilot study. Arthritis Rheum 52: 601–607.
8. De Vita S, Zaja F, Sacco S, De Candia A, Fanin R, et al. (2002) Efficacy of
selective B cell blockade in the treatment of rheumatoid arthritis: evidence for a
pathogenetic role of B cells. Arthritis Rheum 46: 2029–2033.
9. Leandro MJ, Edwards JC, Cambridge G (2002) Clinical outcome in 22 patients
with rheumatoid arthritis treated with B lymphocyte depletion. Ann Rheum Dis
61: 883–888.
10. Looney RJ, Anolik JH, Campbell D, Felgar RE, Young F, et al. (2004) B cell
depletion as a novel treatment for systemic lupus erythematosus: a phase I/II
dose-escalation trial of rituximab. Arthritis Rheum 50: 2580–2589.
11. Leandro MJ, Edwards JC, Cambridge G, Ehrenstein MR, Isenberg DA (2002)
An open study of B lymphocyte depletion in systemic lupus erythematosus.
Arthritis Rheum 46: 2673–2677.
12. Anolik JH, Barnard J, Cappione A, Pugh-Bernard AE, Felgar RE, et al. (2004)
Rituximab improves peripheral B cell abnormalities in human systemic lupus
erythematosus. Arthritis Rheum 50: 3580–3590.
13. Cohen SB, Emery P, Greenwald MW, Dougados M, Furie RA, et al. (2006)
Rituximab for rheumatoid arthritis refractory to anti-tumor necrosis factor
therapy: Results of a multicenter, randomized, double-blind, placebo-controlled,
phase III trial evaluating primary efficacy and safety at twenty-four weeks.
Arthritis Rheum 54: 2793–2806.
14. Edwards JCW, Szczepanski L, Szechinski J, Filipowicz-Sosnowska A, Emery P,
et al. (2004) Efficacy of B-Cell-Targeted Therapy with Rituximab in Patients
with Rheumatoid Arthritis. N Engl J Med 350: 2572–2581.
15. Emery P, Fleischmann R, Filipowicz-Sosnowska A, Schechtman J,
Szczepanski L, et al. (2006) The efficacy and safety of rituximab in patients
with active rheumatoid arthritis despite methotrexate treatment: results of a
phase IIB randomized, double-blind, placebo-controlled, dose-ranging trial.
Arthritis Rheum 54: 1390–1400.
16. Hawker K, O’Connor P, Freedman MS, Calabresi PA, Antel J, et al. (2009)
Rituximab in patients with primary progressive multiple sclerosis: Results of a
randomized double-blind placebo-controlled multicenter trial. Annals of
Neurology 66: 460–471.
17. Merrill J, Neuwelt C, Wallace D, Shanahan J, Latina sK, et al. Efficacy and
safety of rituximab in patients with moderately to severely active systemic lupus
erythematosus (SLE): results from the Randomized, Double-blind Phase II/III
Study EXPLORER; 2008; Abstract L12.
18. Houssiau FA, Vasconcelos C, D’Cruz D, Sebastiani GD, Garrido Ed Ede R,
et al. (2002) Immunosuppressive therapy in lupus nephritis: the Euro-Lupus
Nephritis Trial, a randomized trial of low-dose versus high-dose intravenous
cyclophosphamide. Arthritis Rheum 46: 2121–2131.
19. Contreras G, Pardo V, Leclercq B, Lenz O, Tozman E, et al. (2004) Sequential
therapies for proliferative lupus nephritis. N Engl J Med 350: 971–980.
20. Eisenberg R (2006) Targeting B cells in SLE: the experience with rituximab
treatment (anti-CD20). Endocr Metab Immune Disord Drug Targets 6:
345–350.
21. Albert D, Dunham J, Khan S, Stansberry J, Kolasinski S, et al. (2008) Variability
in the biological response to anti-CD20 B cell depletion in systemic lupus
erythaematosus. Ann Rheum Dis 67: 1724–1731.
22. Sutter JA, Kwan-Morley J, Dunham J, Du Y-Z, Kamoun M, et al. (2008) A
longitudinal analysis of SLE patients treated with rituximab (anti-CD20): Factors
associated with B lymphocyte recovery. Clinical Immunology 126: 282–290.
23. Eisenberg R (2009) Why can’t we find a new treatment for SLE? J Autoimmun
32: 223–230.
24. Herschman HR (2003) Molecular imaging: looking at problems, seeing
solutions. Science 302: 605–608.
Multimodal Imaging of B Cells
PLoS ONE | www.plosone.org 9 May 2010 | Volume 5 | Issue 5 | e10655
25. Melder RJ, Elmaleh D, Brownell AL, Brownell GL, Jain RK (1994) A method
for labeling cells for positron emission tomography (PET) studies. Journal ofImmunological Methods 175: 79–87.
26. Fu G, Gascoigne NR (2009) Multiplexed labeling of samples with cell tracking
dyes facilitates rapid and accurate internally controlled calcium flux measure-ment by flow cytometry. J Immunol Methods 350: 194–199.
27. Parish CR (1999) Fluorescent dyes for lymphocyte migration and proliferationstudies. Immunol Cell Biol 77: 499–508.
28. Millington O, Zinselmeyer B, Brewer J, Garside P, Rush C (2007) Lymphocyte
tracking and interactions in secondary lymphoid organs. Inflammation Research56: 391–401.
29. Contag PR, Olomu IN, Stevenson DK, Contag CH (1998) Bioluminescentindicators in living mammals. Nat Med 4: 245–247.
30. Dayde D, Ternant D, Ohresser M, Lerondel S, Pesnel S, et al. (2009) Tumorburden influences exposure and response to rituximab: pharmacokinetic-
pharmacodynamic modeling using a syngeneic bioluminescent murine model
expressing human CD20. Blood 113: 3765–3772.31. Thorek DL, Chen AK, Czupryna J, Tsourkas A (2006) Superparamagnetic iron
oxide nanoparticle probes for molecular imaging. Ann Biomed Eng 34: 23–38.32. Bulte JW, Kostura L, Mackay A, Karmarkar PV, Izbudak I, et al. (2005)
Feridex-labeled mesenchymal stem cells: cellular differentiation and MR
assessment in a canine myocardial infarction model. Acad Radiol 12 Suppl 1:S2–6.
33. Bulte JW (2009) In vivo MRI cell tracking: clinical studies. AJR Am J Roentgenol193: 314–325.
34. Thorek DL, Tsourkas A (2008) Size, charge and concentration dependentuptake of iron oxide particles by non-phagocytic cells. Biomaterials 29:
3583–3590.
35. Tario JD, Gray BD, Wallace SS, Muirhead KA, Ohlsson-Wilhelm BM, et al.(2007) Novel Lipophilic Tracking Dyes for Monitoring Cell Proliferation.
Immunological Investigations 36: 861–885.36. Li YY, Yang Y, Bao M, Edwards CK, 3rd, Parnes JR (2006) Mouse splenic B
lymphocyte activation using different activation stimuli induces in vitro splicing
of tumor necrosis factor-alpha nuclear pre-mRNA. Mol Immunol 43: 613–622.37. Gordan LN, Grow WB, Pusateri A, Douglas V, Mendenhall NP, et al. (2005)
Phase II Trial of Individualized Rituximab Dosing for Patients With CD20-Positive Lymphoproliferative Disorders. J Clin Oncol 23: 1096–1102.
38. Hainsworth JD, Burris HA, III, Morrissey LH, Litchy S, Scullin DC, Jr., et al.(2000) Rituximab monoclonal antibody as initial systemic therapy for patients
with low-grade non-Hodgkin lymphoma. Blood 95: 3052–3056.
39. McLaughlin P, Grillo-Lopez A, Link B, Levy R, Czuczman M, et al. (1998)Rituximab chimeric anti-CD20 monoclonal antibody therapy for relapsed
indolent lymphoma: half of patients respond to a four-dose treatment program.
J Clin Oncol 16: 2825–2833.
40. Witzig TE, Vukov AM, Habermann TM, Geyer S, Kurtin PJ, et al. (2005)
Rituximab Therapy for Patients With Newly Diagnosed, Advanced-Stage,
Follicular Grade I Non-Hodgkin’s Lymphoma: A Phase II Trial in the North
Central Cancer Treatment Group. J Clin Oncol 23: 1103–1108.
41. Gong Q, Ou Q, Ye S, Lee WP, Cornelius J, et al. (2005) Importance of Cellular
Microenvironment and Circulatory Dynamics in B Cell Immunotherapy.
J Immunol 174: 817–826.
42. Li Y, Chen F, Putt M, Koo YK, Madaio M, et al. (2008) B Cell Depletion with
Anti-CD79 mAbs Ameliorates Autoimmune Disease in MRL/lpr Mice.
J Immunol 181: 2961–2972.
43. Daldrup-Link HE, Meier R, Rudelius M, Piontek G, Piert M, et al. (2005) In
vivo tracking of genetically engineered, anti-HER2/neu directed natural killer
cells to HER2/neu positive mammary tumors with magnetic resonance imaging.
Eur Radiol 15: 4–13.
44. de Vries IJ, Lesterhuis WJ, Barentsz JO, Verdijk P, van Krieken JH, et al. (2005)
Magnetic resonance tracking of dendritic cells in melanoma patients for
monitoring of cellular therapy. Nat Biotechnol 23: 1407–1413.
45. Lewin M, Carlesso N, Tung CH, Tang XW, Cory D, et al. (2000) Tat peptide-
derivatized magnetic nanoparticles allow in vivo tracking and recovery of
progenitor cells. Nat Biotechnol 18: 410–414.
46. Reichardt W, Durr C, von Elverfeldt D, Juttner E, Gerlach UV, et al. (2008)
Impact of mammalian target of rapamycin inhibition on lymphoid homing and
tolerogenic function of nanoparticle-labeled dendritic cells following allogeneic
hematopoietic cell transplantation. J Immunol 181: 4770–4779.
47. Valable S, Barbier EL, Bernaudin M, Roussel S, Segebarth C, et al. (2007) In
vivo MRI tracking of exogenous monocytes/macrophages targeting brain
tumors in a rat model of glioma. Neuroimage 37 Suppl 1: S47–58.
48. Bulte JW, Kraitchman DL, Mackay AM, Pittenger MF (2004) Chondrogenic
differentiation of mesenchymal stem cells is inhibited after magnetic labeling
with ferumoxides. Blood 104: 3410–3412. author reply 3412-3413.
49. Chen I, Greve J, Gheysens O, Willmann J, Rodriguez-Porcel M, et al. (2009)
Comparison of Optical Bioluminescence Reporter Gene and Superparamag-
netic Iron Oxide MR Contrast Agent as Cell Markers for Noninvasive Imaging
of Cardiac Cell Transplantation. Molecular Imaging and Biology 11: 178–187.
50. Miltenyi S, Muller W, Weichel W, Radbruch A (1990) High gradient magnetic
cell separation with MACS. Cytometry 11: 231–238.
51. Koyama M, Ishihara K, Karasuyama H, Cordell J, Iwamoto A, et al. (1997)
CD79 alpha/CD79 beta heterodimers are expressed on pro-B cell surfaces
without associated mu heavy chain. Int Immunol 9: 1767–1772.
Multimodal Imaging of B Cells
PLoS ONE | www.plosone.org 10 May 2010 | Volume 5 | Issue 5 | e10655
Related Documents