Journal of Physiology (1996), 496. 1, pp. 287-297 In vivo human gastrocnemius architecture with changing joint angle at rest and during graded isometric contraction M. V. Narici*t, T. Binzoni tt, E. Hiltbrand t, J. Fasel §, F. Terrier: and P. Cerretelli t *Reparto di Fisiologia, Istituto di Tecnologie Biomediche Avanzate, Consiglio Nazionale delle Ricerche, Milano, Italy, tDepartement de Physiologie, Centre Medical Universitaire, tDe'partement de Radiologie, H6pital Cantonal Universitaire de Geneve and § Departement de Morphologie, Centre Medical Universitaire, Universite' de Geneve, 1211 Geneve, Switzerland 1. Human gastrocnemius medialis architecture was analysed in vivo, by ultrasonography, as a function of joint angle at rest and during voluntary isometric contractions up to the maximum force (MVC). 2. At rest, as ankle joint angle increased from 90 to 150 deg, pennation increased from 15-8 to 27-7 deg, fibre length decreased from 57 0 to 34 0 mm and the physiological cross-sectional area (PCSA) increased from 42-1 to 63-5 cm2. 3. From rest to MVC, at a fixed ankle joint angle of 110 deg, pennation angle increased from 15-5 to 33-6 deg and fibre length decreased from 50-8 to 32'9 mm, with no significant change in the distance between the aponeuroses. As a result of these changes the PCSA increased by 34 8%. 4. Measurements of pennation angle, fibre length and distance between the aponeuroses of the gastrocnemius medialis were also performed by ultrasound on a cadaver leg and found to be in good agreement with direct anatomical measurements. 5. It is concluded that human gastrocnemius medialis architecture is significantly affected both by changes of joint angle at rest and by isometric contraction intensity. The remarkable shortening observed during isometric contraction suggests that, at rest, the gastrocnemius muscle and tendon are considerably slack. The extrapolation of muscle architectural data obtained from cadavers to in vivo conditions should be made only for matching muscle lengths. The architecture of human pennate muscles has been described mainly with the muscle at rest and using data obtained in preserved cadavers as reference values of fibre length and pennation angle. These values have then been commonly used to describe the mechanical properties of active muscles in the course of isometric tetani on the assumption that upon contraction, the change in length of the muscle and its tendons was small enough not to affect the results. This approach now seems to be questionable for three reasons. First of all, it is well known that preserved muscle fibres undergo shrinking during the fixing process (Yamaguchi, Sawa, Moran, Fessler & Winters, 1990). Secondly, the length of muscle fibres at rest is several millimetres shorter than that of dead fibres (Rack & Westbury, 1969) and this finding should be taken into account when considering the length-tension relation of a muscle. Thirdly, pennation angle and fibre length change both as a function of muscle length at rest (Muhl, 1982; Huijing & Woittiez, 1985), the human brachialis muscle perhaps representing an exception (Herbert & Gandevia, 1995), and as a function of isometric contraction intensity (Muhl, 1982; Huijing & Woittiez, 1985). Drastic changes in muscle architecture have indeed been shown to occur during contraction as fibres shorten, swing across their insertion point increasing their pennation angle, and pull the aponeuroses towards each other (Gans & Bock, 1965). Knowledge of these quantitative morphological changes is essential for understanding the mechanics of isometric processes of pennate muscles and the energetics thereof. This approach has been followed by Muhl (1982) on the rabbit digastric muscle by taking photographs of the rabbit digastric muscle at rest and during isometric contractions at different muscle lengths, and by Griffiths (1991) using ultrasound techniques on the cat medial gastrocnemius at rest and during isometric and lengthening contractions. Until recently, however, studies of the architecture of human muscle in vivo were scanty. Since the introduction of non-invasive techniques, such as magnetic resonance 5565 287 ) by guest on July 13, 2011 jp.physoc.org Downloaded from J Physiol (

Welcome message from author
This document is posted to help you gain knowledge. Please leave a comment to let me know what you think about it! Share it to your friends and learn new things together.
Transcript
Journal of Physiology (1996), 496. 1, pp. 287-297
In vivo human gastrocnemius architecture with changing jointangle at rest and during graded isometric contraction
M. V. Narici*t, T. Binzoni tt, E. Hiltbrand t, J. Fasel §, F. Terrier:and P. Cerretelli t
*Reparto di Fisiologia, Istituto di Tecnologie Biomediche Avanzate, Consiglio Nazionaledelle Ricerche, Milano, Italy, tDepartement de Physiologie, Centre Medical Universitaire,
tDe'partement de Radiologie, H6pital Cantonal Universitaire de Geneveand § Departement de Morphologie, Centre Medical Universitaire, Universite' de Geneve,
1211 Geneve, Switzerland
1. Human gastrocnemius medialis architecture was analysed in vivo, by ultrasonography, as afunction of joint angle at rest and during voluntary isometric contractions up to themaximum force (MVC).
2. At rest, as ankle joint angle increased from 90 to 150 deg, pennation increased from 15-8 to27-7 deg, fibre length decreased from 57 0 to 34 0 mm and the physiological cross-sectionalarea (PCSA) increased from 42-1 to 63-5 cm2.
3. From rest to MVC, at a fixed ankle joint angle of 110 deg, pennation angle increased from15-5 to 33-6 deg and fibre length decreased from 50-8 to 32'9 mm, with no significant changein the distance between the aponeuroses. As a result of these changes the PCSA increased by34 8%.
4. Measurements of pennation angle, fibre length and distance between the aponeuroses of thegastrocnemius medialis were also performed by ultrasound on a cadaver leg and found to bein good agreement with direct anatomical measurements.
5. It is concluded that human gastrocnemius medialis architecture is significantly affected bothby changes of joint angle at rest and by isometric contraction intensity. The remarkableshortening observed during isometric contraction suggests that, at rest, the gastrocnemiusmuscle and tendon are considerably slack. The extrapolation of muscle architectural dataobtained from cadavers to in vivo conditions should be made only for matching musclelengths.
The architecture of human pennate muscles has beendescribed mainly with the muscle at rest and using dataobtained in preserved cadavers as reference values of fibrelength and pennation angle. These values have then beencommonly used to describe the mechanical properties ofactive muscles in the course of isometric tetani on theassumption that upon contraction, the change in length ofthe muscle and its tendons was small enough not to affectthe results. This approach now seems to be questionable forthree reasons. First of all, it is well known that preservedmuscle fibres undergo shrinking during the fixing process(Yamaguchi, Sawa, Moran, Fessler & Winters, 1990).Secondly, the length of muscle fibres at rest is severalmillimetres shorter than that of dead fibres (Rack &Westbury, 1969) and this finding should be taken intoaccount when considering the length-tension relation of amuscle. Thirdly, pennation angle and fibre length changeboth as a function of muscle length at rest (Muhl, 1982;Huijing & Woittiez, 1985), the human brachialis muscle
perhaps representing an exception (Herbert & Gandevia,1995), and as a function of isometric contraction intensity(Muhl, 1982; Huijing & Woittiez, 1985). Drastic changes inmuscle architecture have indeed been shown to occur duringcontraction as fibres shorten, swing across their insertionpoint increasing their pennation angle, and pull theaponeuroses towards each other (Gans & Bock, 1965).Knowledge of these quantitative morphological changes isessential for understanding the mechanics of isometricprocesses of pennate muscles and the energetics thereof.This approach has been followed by Muhl (1982) on therabbit digastric muscle by taking photographs of the rabbitdigastric muscle at rest and during isometric contractions atdifferent muscle lengths, and by Griffiths (1991) usingultrasound techniques on the cat medial gastrocnemius atrest and during isometric and lengthening contractions.Until recently, however, studies of the architecture ofhuman muscle in vivo were scanty. Since the introduction ofnon-invasive techniques, such as magnetic resonance
5565 287
) by guest on July 13, 2011jp.physoc.orgDownloaded from J Physiol (
M. V Narici and others
imaging (MRI) and ultrasonography (US), it has becomepossible to describe human muscle architecture in vivo bothat rest (Narici, Landoni & Minetti, 1992; Rutherford &Jones 1992; Henrikkson-Larsen, Wretling, Lorentzon &Oberg 1992) and in the contracted state (Narici, Binzoni,Hiltbrand, Fasel & Apicella, 1994; Herbert & Gandevia,1995; Kuno & Fukunaga, 1995; Fukashiro, Itoh, Ichinose,Kawakami & Fukunaga, 1995). In a brief report of a studyusing ultrasonography, the architecture of the humangastrocnemius was described for the first time in vivo bothat rest and in the contracted state (Narici et al. 1994). Thepresent study, representing an expansion of this earlierwork, was designed to answer the following questions.(1) Does human gastrocnemius architecture change withvarying ankle joint angles at rest? (2) What are the changesof human gastrocnemius muscle architecture duringisometric contractions of increasing intensity up to the fullycontracted state? (3) How does the ultrasound techniquecompare with direct anatomical inspection in evaluatingmuscle architectural features?
METHODSSubjectsThe present investigation was conducted on the gastrocnemiusmedialis (GM) muscle of six healthy males (age, 38-0 + 8 years;height, 1P76 + 005 m; mass, 67-8 + 6-5 kg) whose musclearchitectural features were studied both at rest and during iso-metric plantar flexions of increasing intensity up to the maximumvoluntary contraction (MVC). The subjects gave their writteninformed consent to participate in this study and the protocolswere approved by the Ethical Committee of the Istituto diTecnologie Biomediche Avanzate, Consiglio Nazionale delle Ricerche.
Determination of muscle volume and muscle lengthThis was done from a series of eighty contiguous MRI axial images,5 mm thick, obtained at rest with a whole body 1.5 T scanner(Picker International, Highland Heights, OH, USA). During the
scanning, the subject lay supine with the base of the foot resting ona polystyrene block to maintain an angle of 90 deg to the tibia. A3-D, fast feed echo sequence with an echo time of 15 ms andrepetition time of 35 ms was used. The central slice was placed atthe mid-belly of the gastrocnemii. Before each scanning session theMRI signal was checked for space calibration using water-filledphantoms. For each of the eighty axial images the anatomical cross-sectional area (ACSA) of the gastrocnemius medialis (GM) wascalculated.
For GM muscle volume calculation all slices were fitted with a splinealgorithm in order to interpolate for the missing slices. The totalvolume was then calculated by adding up the individual ACSA ofeach image and multiplying the sum by the slice thickness (5 mm).The error of muscle volume estimation from MRI images haspreviously been shown to be within +3% (Narici et al. 1992) andthe repeatability of PCSA determination by MRI, tested with atest-retest analysis, was characterized by an r2 value of 0X98.
Muscle length was measured as the distance between the mostproximal and most distal images in which the GM was identifiable.
Force measurementsThe subjects sat on a couch with the back supported and the lowerlimbs fully extended. All measurements were carried out on theright leg, dominant in all the subjects, with the foot positioned at90 deg relative to a footplate. A previous MRI sagittal examinationof the ankle showed that with the foot set in this position thecorresponding ankle joint angle was 112 deg. The force exerted bythe plantar flexors was measured by connecting the footplate to aforce transducer (FN 3030; FGP Instrumentation, Les Clayes-sous-Bois, France) with a steel cable 3 mm in diameter. From thefootplate, the steel cable ran parallel to the limb of the subject tothe force transducer, which was attached to the frame of the couchjust laterally to the waist of the subject. Care was taken to maintainthe cable normal to footplate and force transducer. The complianceof this measuring system was 0 003 mm NW1, which implies that,at MVC, the maximum extension of the system was about 2 mm.The output of the force transducer was fed into an amplifier(portable indicator PR2500; Leane International, Monticelli,Parma, Italy), with a liquid crystal display visible both to thesubject and to the operator, and was displayed on paper on a chart
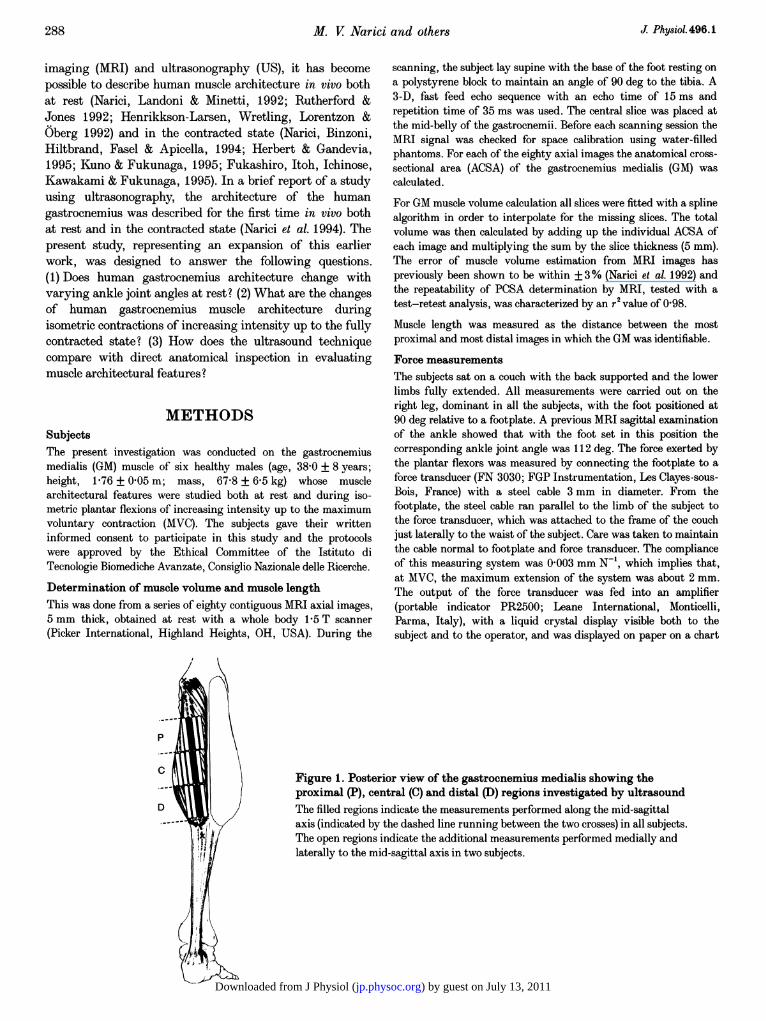
Figure 1. Posterior view of the gastrocnemius medialis showing theproximal (P), central (C) and distal (D) regions investigated by ultrasoundThe filled regions indicate the measurements performed along the mid-sagittalaxis (indicated by the dashed line running between the two crosses) in all subjects.The open regions indicate the additional measurements performed medially andlaterally to the mid-sagittal axis in two subjects.
J Physiol. 496.1288
) by guest on July 13, 2011jp.physoc.orgDownloaded from J Physiol (
Resting and contracted muscle architecture
recorder (Servogor 420; ABB Metrawatt, Niirnberg, Germany).Each subject was asked to perform eight to ten isometric plantarflexions, 4 s in duration at 30 s intervals, from rest to 100% of theMVC, and to hold each contraction steady for at least 2 s. The exactforce developed during the steady state of each contraction wasrecorded.
Pennation angle, fibre length and distance betweenaponeurosesThese architectural features of the GM were assessed from imagesobtained with a real time computerized sonograph (Acuson 128XP,Mountain View, CA, USA) using a 7-5 MHz probe 4 cm long and1 cm thick. During the scanning, the subjects sat on a couch withthe back supported at a right angle to the legs by a rigid structure.The lower limbs were fully extended over the couch and the rightankle rested on a footplate. A gap of about 50 cm was allowed inthe couch under the right leg to give free access to the calf musclewith the US probe. The probe was positioned normal to the surfaceof the right GM and oriented along the median longitudinal axis ofthe muscle (Fig. 1). This axis was determined by marking the distalend of the muscle belly and the proximal tendon, which can belocalized at the level of the knee joint, and by joining the twomarked sites. Along this axis, three adjacent regions, each 4 cm inlength, were investigated, a proximal (P), a central (C) and a distalone (D) with reference to the distal end of the GM. For each USimage of regions P, C and D, pennation angle (6) was measured atthe fibre insertions into the superficial and deep aponeuroses, andthe two values were then averaged (6mean). Fibre length (Lf) wasmeasured as the distance between the insertions of the fibre intothe superficial and deep aponeuroses. The distance (t) betweenaponeuroses was measured on either side of each image and thenaveraged. Measurements of Lf, 6 and t were performed on-lineusing a dedicated piece of software. These measurements wereperformed both at rest and during isometric plantar flexions of
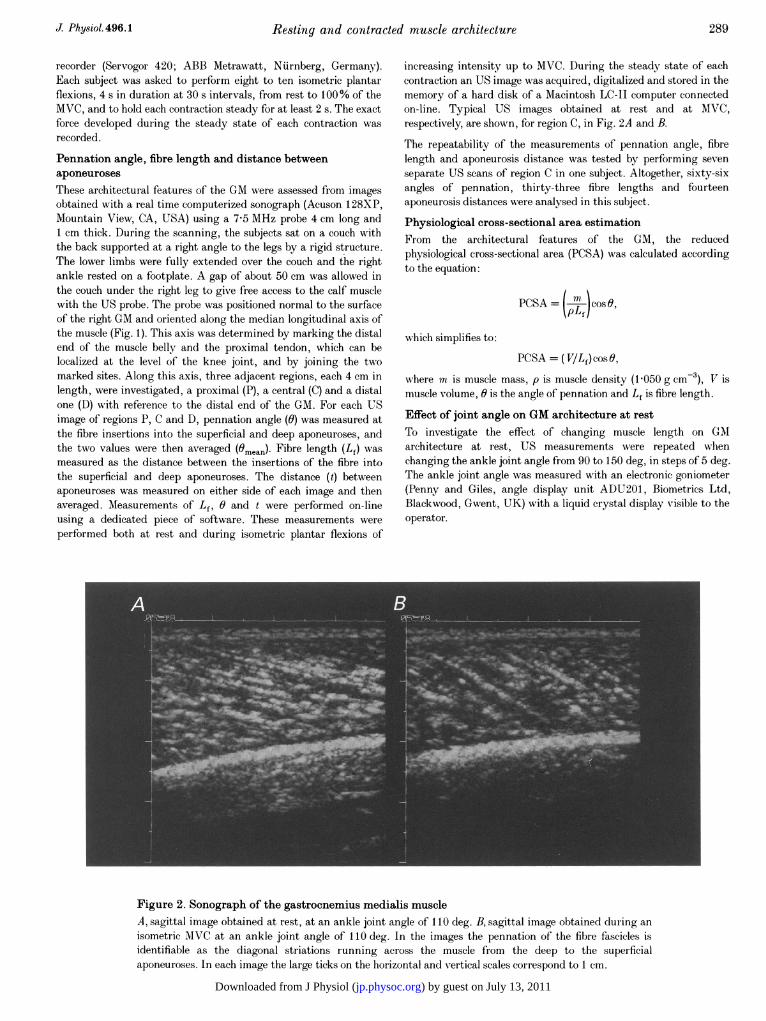
increasing intensity up to MVC. During the steady state of eachcontraction an US image was acquired, digitalized and stored in thememory of a hard disk of a Macintosh LC-II computer connectedon-line. Typical US images obtained at rest and at MVC,respectively, are shown, for region C, in Fig. 2A and B.
The repeatability of the measurements of pennation angle, fibrelength and aponeurosis distance was tested by performing sevenseparate US scans of region C in one subject. Altogether, sixty-sixangles of pennation, thirty-three fibre lengths and fourteenaponeurosis distances were analysed in this subject.
Physiological cross-sectional area estimationFrom the architectural features of the GM, the reducedphysiological cross-sectional area (PCSA) was calculated accordingto the equation:
PCSA = (jcoso,
which simplifies to:
PCSA = ( V/Lf) cos 0,
where m is muscle mass, p is muscle density (1-050 g cm-3), V ismuscle volume, 6 is the angle of pennation and Lf is fibre length.
Effect of joint angle on GM architecture at restTo investigate the effect of changing muscle length on GMIarchitecture at rest, US measurements were repeated whenchanging the ankle joint angle from 90 to 150 deg, in steps of 5 deg.The ankle joint angle was measured with an electronic goniometer(Penny and Giles, angle display unit ADU201, Biometrics Ltd,Blackwood, Gwent, UK) with a liquid crystal display visible to theoperator.
Figure 2. Sonograph of the gastrocnemius medialis muscleA, sagittal image obtained at rest, at an ankle joint angle of 110 deg. B, sagittal image obtained during anisometric AIVC at an ankle joint angle of 110 deg. In the images the pennation of the fibre fascicles isidentifiable as the diagonal striations running across the muscle from the deep to the superficialaponeuroses. In each image the large ticks on the horizontal and vertical scales correspond to 1 cm.
J. Physiol. 496.1 289
) by guest on July 13, 2011jp.physoc.orgDownloaded from J Physiol (
M. V Narici and others
Analysis of GM architecture across and along the musclebellyIn addition to the US images obtained along the medianlongitudinal axis of the GM, a series of pennation angles and fibrelengths were also measured on two subjects, at rest and at theMVC, at four or five adjacent sites positioned laterally and mediallyto the mid-sagittal axis running along the GM belly (Fig. 1). EachUS image allowed ten to twelve measurements of pennation angle,five or six measurements of fibre length and two measurements ofthe distance between the aponeuroses. These measurements wererepeated in regions P, C and D, for a total of eleven to thirteeninvestigated sites, to compare resting values of fibre length andpennation angle both along and across the muscle belly. Additionalaims of this set of experiments were to find out: (1) whether thedata obtained at rest for the three regions along the mid-sagittalaxis were comparable to those found in the medial and lateralportions of the muscle; and (2) whether the changes in pennationand fibre length observed at the fully contracted state werehomogeneous across the mediolateral axis or were affected by apossible fibre rotation.
Comparison of ultrasound-determined muscle architecturewith direct anatomical measurementsIn order to check the accuracy of the US technique, the architecturalparameters of the GM of a human cadaver were assessed both by
US and by direct measurement. The anatomical specimen used inthis study was from a 62-year-old male who placed expressis verbis,by his last will, his body at the disposal of the medical sciences. Thecorpus had been fixed according to routine embalming procedures.The leg was positioned and investigated by US as for theaforementioned in vivo measurements. The longitudinal axis andthe three regions investigated by US were marked on the skin ofthe specimen. Following the US investigation the correspondingplanes were demonstrated anatomically by vertical incisionsthrough all layers of the calf along the marked longitudinal axis(Fig. 3). In situ inspection of the slice surface corresponding to themedian longitudinal plane was performed by retraction of theadjacent lateral part of the muscle, thus maintaining the medialhalf in an unaltered position and length. On the exposed slicesurface, the parameters (superior and inferior pennation angles,fibre length, distance between the superficial and deep aponeuroses)were measured in situ. The slices were then resected, maintained atthe same length, rested on a wax plate and re-measured. Finally,the resected slices were photographed and once again theparameters were measured. These three measurements werecompared with the US findings.
The medial head of the gastrocnemius medialis, when considered asan individual muscle, can be conceived as unipennate in the sagittalplane. The fasciculi pass obliquely between the proximal superficialand the distal deep aponeuroses (Strasser, 1917). With regard to the
III I I.111111111I" I II, W il: 1-
0O1 2 3 4 5
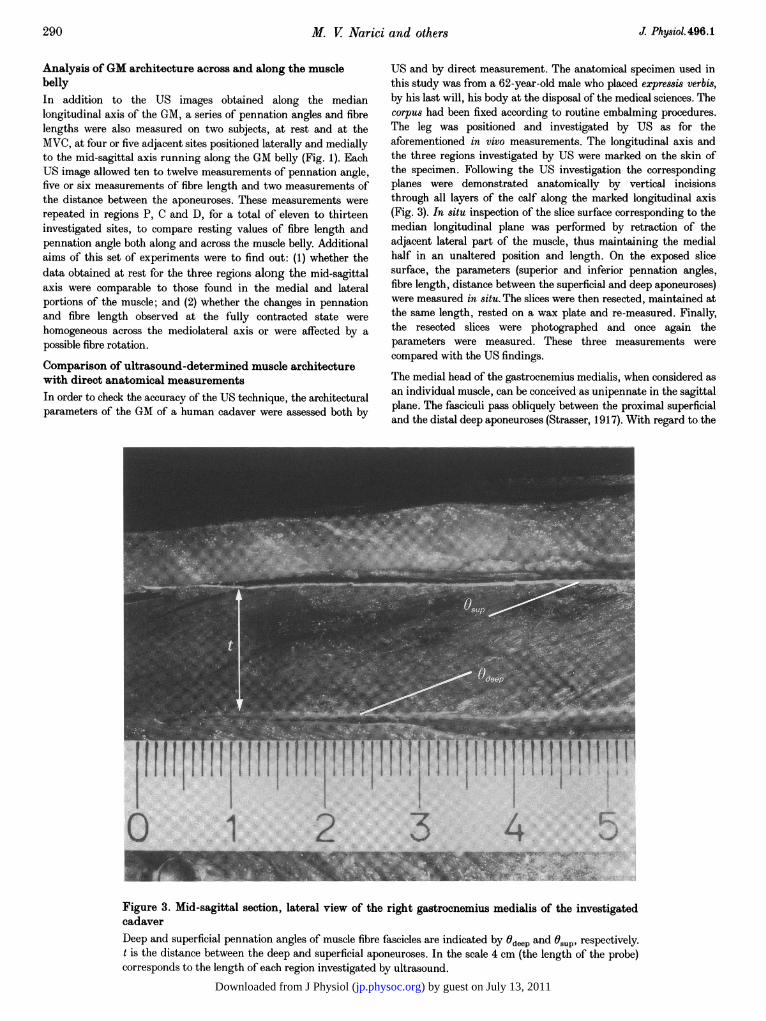
Figure 3. Mid-sagittal section, lateral view of the right gastrocnemius medialis of the investigatedcadaverDeep and superficial pennation angles of muscle fibre fascicles are indicated by 0deep and 9sup, respectively.t is the distance between the deep and superficial aponeuroses. In the scale 4 cm (the length of the probe)corresponds to the length of each region investigated by ultrasound.
290 J Physiol. 496.1
) by guest on July 13, 2011jp.physoc.orgDownloaded from J Physiol (
Resting and contracted muscle architecture
longitudinal axis of the muscle, the fasciculi take essentially aparallel course in the distal part of the muscle belly. As one movestowards the proximal region of the muscle, fibres increasinglyconverge in the direction of the proximal tendon, which is attachedto the region over the medial femoral condyle. In the longitudinalaxis itself, the fasciculi remain parallel also in the proximal portionof the muscle. In the present study the muscle was examined alongthis axis taking its course from the distal end of the muscle belly tothe proximal tendon. By this procedure it could be assumed thatwith the US procedure the fasciculi were investigated along theirlongitudinal axis.
StatisticsData are reported as mean values + S.D. Significance of differenceswas analysed by means of Student's paired t test for rest and MVCmeasurements. One-way analysis of variance (ANOVA) was usedfor comparison of t, 0 and Lf in the various sections of regions P, Cand D. In the event of significant values of F in the ANOVA, theScheff6 test of critical differences was used to locate significancebetween means. Level of significance was set for P values of lessthan 0 05. Linear regressions were used to describe the relationbetween fibre length and force, and between pennation angle andforce. Non-linear equations were used to describe the relation at restbetween pennation angle, fibre length and joint angle and betweenfibre length and pennation angle.
RESULTSMuscle volume and muscle lengthOut of the eighty contiguous MRI axial images, the GMextended over a total number of images ranging from forty-eight to fifty-seven. Summation of the volumes betweencontiguous MRI slices gave a total GM muscle volume of245'9 + 36'7 cm3. GM muscle length measured between themost proximal and most distal MRI axial images was27-0 + 1i6 cm.
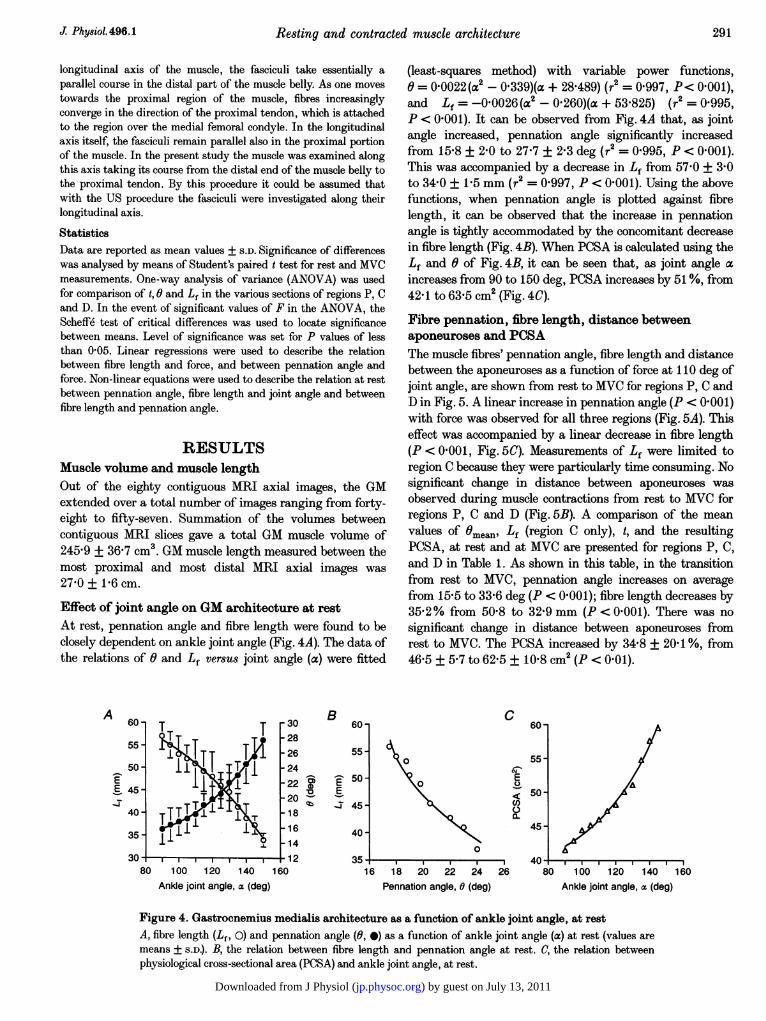
Effect of joint angle on GM architecture at restAt rest, pennation angle and fibre length were found to beclosely dependent on ankle joint angle (Fig. 4A). The data ofthe relations of 0 and Lf versus joint angle (a) were fitted
(least-squares method) with variable power functions,o = 0 0022 (a2 - 0'339)(a + 28 489) (r2 = 0997, P< 0001),and Lf = -0 0026 (a2 - 0-260)(a + 53 825) (r2 = 0.995,P < 0 001). It can be observed from Fig. 4A that, as jointangle increased, pennation angle significantly increasedfrom 15S8 + 2-0 to 27-7 + 2-3 deg (r2 = 0995, P < 0 001).This was accompanied by a decrease in Lf from 57 0 + 3 0to 34 0 + 1P5 mm (r2 = 0-997, P < 01001). Using the abovefunctions, when pennation angle is plotted against fibrelength, it can be observed that the increase in pennationangle is tightly accommodated by the concomitant decreasein fibre length (Fig. 4B). When PCSA is calculated using theLf and 0 of Fig. 4B, it can be seen that, as joint angle aincreases from 90 to 150 deg, PCSA increases by 51%, from42-1 to 63-5 cm2 (Fig. 4C).
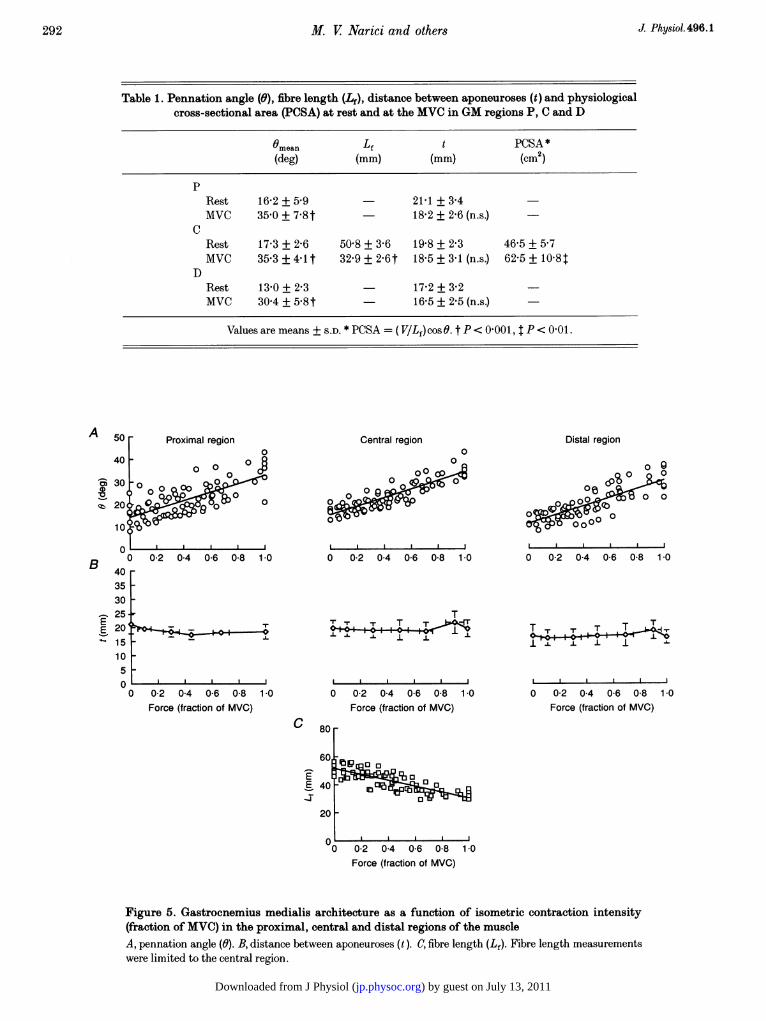
Fibre pennation, fibre length, distance betweenaponeuroses and PCSAThe muscle fibres' pennation angle, fibre length and distancebetween the aponeuroses as a function of force at 110 deg ofjoint angle, are shown from rest to MVC for regions P, C andD in Fig. 5. A linear increase in pennation angle (P < 0 001)with force was observed for all three regions (Fig. 5A). Thiseffect was accompanied by a linear decrease in fibre length(P < 0 001, Fig. 5C). Measurements of Lf were limited toregion C because they were particularly time consuming. Nosignificant change in distance between aponeuroses wasobserved during muscle contractions from rest to MVC forregions P, C and D (Fig. 5B). A comparison of the meanvalues of Omean, Lf (region C only), t, and the resultingPCSA, at rest and at MVC are presented for regions P, C,and D in Table 1. As shown in this table, in the transitionfrom rest to MVC, pennation angle increases on averagefrom 15i5 to 33-6 deg (P < 0 001); fibre length decreases by352% from 508 to 32-9 mm (P < 0001). There was nosignificant change in distance between aponeuroses fromrest to MVC. The PCSA increased by 34 8 + 201 %, from465 + 5.7 to 62-5+ 10-8 cm2 (P< 0.01).
A 60-
55 -
50 -
-x_E45.40 -
35.
80 100 120 140
30-28-26-24-22-20-18-1614
1-12160
B60 -
55 -
S-0)V); 50-E-Z 45 -
C60-
55-N
C)E
c,)045-40 -
35
Ankle joint angle, a (deg)
0
16 18 20 22 24Pennation angle, 0 (deg)
26 80 100 120 140 160Ankle joint angle, a (deg)
Figure 4. Gastrocnemius medialis architecture as a function of ankle joint angle, at restA, fibre length (Lf, 0) and pennation angle (0, 0) as a function of ankle joint angle (a) at rest (values aremeans + S.D.). B, the relation between fibre length and pennation angle at rest. C, the relation betweenphysiological cross-sectional area (PCSA) and ankle joint angle, at rest.
J. Physiol.496.1 291
) by guest on July 13, 2011jp.physoc.orgDownloaded from J Physiol (
M. V Narici and others J Physiol. 496.1
Table 1. Pennation angle (0), fibre length (Lf), distance between aponeuroses (t) and physiologicalcross-sectional area (PCSA) at rest and at the MVC in GM regions P, C and D
Omean Lf t PCSA *
(deg) (mm) (mm) (cm2)
pRest 162 + 59 211 + 3-4MVC 35 0 + 7 8t 18&2 + 2 6 (n.s.)
CRest 173 + 26 508 + 36 198 + 23 465 + 57MVC 35-3 + 4-1 t 32-9 + 2-6t 18-5 + 3'1 (n.s.) 62-5 + 10-8t
DRest 13-0 + 2-3 17-2 + 3-2MVC 30 4 + 5-8t 16-5 + 2-5 (n.s.)
Values are means + S.D. * PCSA = ( V/Lf)cost. t P < 0'001, t P < 0 01.
Central region0
1 0-2 0-4 0-6 0-8 1-0
*#1 _j
1-
0 0-2 0-4 0-6 0-8 1-0Force (fraction of MVC)
C
0 0-2 0-4 0-6 0-8 1-0
T
~~.
0 0-2 0-4 0-6 0-8 1-0Force (fraction of MVC)
80
60 °
io~~~~~~t40 10
20
I__
0 0-2 0-4 0-6 0-8 1-0Force (fraction of MVC)
Distal region
o 0
0~~~~IL
0 0-2 0-4 0-6 0-8 1-0
TT r T T T
1.L 1. 1
0 0-2 0-4 0-6 0-8 1-0Force (fraction of MVC)
Figure 5. Gastrocnemius medialis architecture as a function of isometric contraction intensity(fraction of MVC) in the proximal, central and distal regions of the muscleA, pennation angle (0). B, distance between aponeuroses (t). C, fibre length (Lf). Fibre length measurementswere limited to the central region.
292
A
0
0
BO L
04035302520151050
EE
) by guest on July 13, 2011jp.physoc.orgDownloaded from J Physiol (
Resting and contracted muscle architecture
Table 2. Analysis ofGM muscle architecture in two subjects in regions P, C and D
6 Lf t(deg) (mm) (mm)
RestP 22-3 + 3 7 (18-7-27-0) 49-2 + 4-7 (42 5-52 5) 18-6 + 1 9 (18-7-27O0)C 20-9 + 4-8 (14-6-25'2) 53 0 + 7-7 (45 2-605) 19-5 + 09 (15-5-202)D 17'2 + 1P6 (15-3-19-3) 59 0 + 7 4 (51'0-69-0) 16-9 + 19 (14 5-18 8)
MVCP 37-1 + 6-9 (28&2-45 0) 31P3 ± 3-0 (27 0-33 9) 18O0 + 2-3 (16-5-202)C 34-1 + 3-7 (29 5-38 4) 34*4 + 4-8 (304-41t7) 191 ± 1' (17'7-203)D 29-1 + 2-2 (27 0-32 3) 36-2 + 15 (34 3-37 7) 17-8 + 1 9 (16-6-20-7)
Values shown are means + S.D. (range).
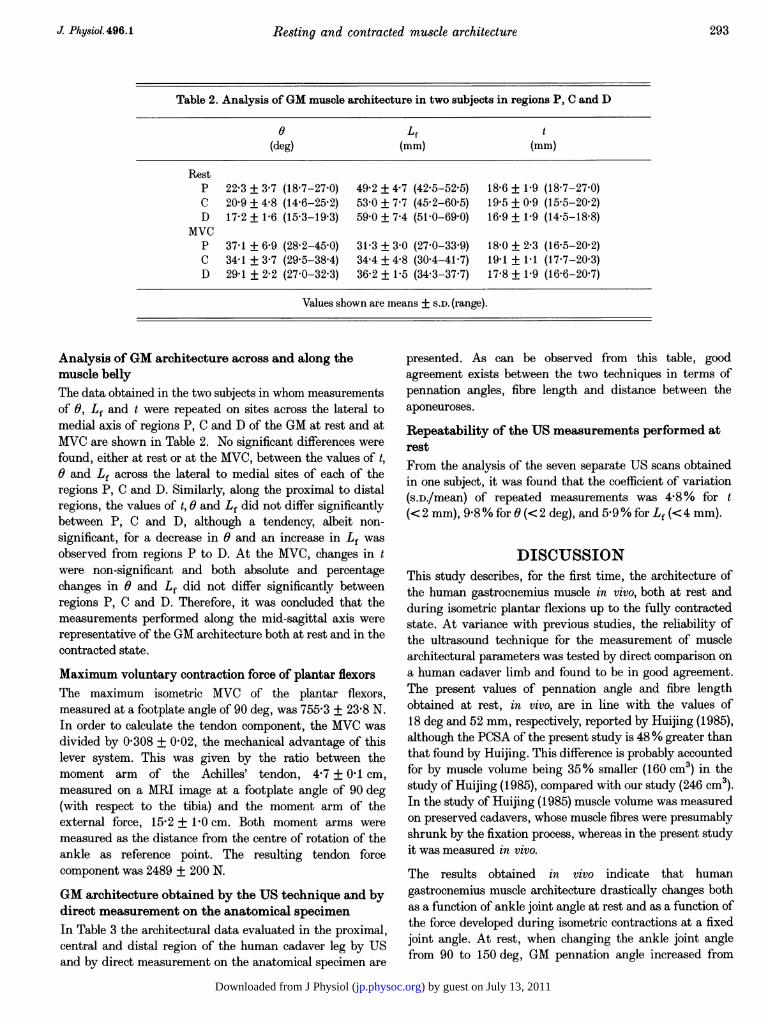
Analysis ofGM architecture across and along themuscle bellyThe data obtained in the two subjects in whom measurementsof 6, Lf and t were repeated on sites across the lateral tomedial axis of regions P, C and D of the GM at rest and atMVC are shown in Table 2. No significant differences werefound, either at rest or at the MVC, between the values of t,6 and Lf across the lateral to medial sites of each of theregions P, C and D. Similarly, along the proximal to distalregions, the values of t, 6 and Lf did not differ significantlybetween P, C and D, although a tendency, albeit non-significant, for a decrease in 6 and an increase in Lf wasobserved from regions P to D. At the MVC, changes in twere non-significant and both absolute and percentagechanges in 6 and Lf did not differ significantly betweenregions P, C and D. Therefore, it was concluded that themeasurements performed along the mid-sagittal axis wererepresentative of the GM architecture both at rest and in thecontracted state.
Maximum voluntary contraction force of plantar flexorsThe maximum isometric MVC of the plantar flexors,measured at a footplate angle of 90 deg, was 755.3 + 23 8 N.In order to calculate the tendon component, the MVC wasdivided by 0 308 + 0-02, the mechanical advantage of thislever system. This was given by the ratio between themoment arm of the Achilles' tendon, 4*7 + 0 1 cm,measured on a MRI image at a footplate angle of 90 deg(with respect to the tibia) and the moment arm of theexternal force, 15-2 + 1 0 cm. Both moment arms weremeasured as the distance from the centre of rotation of theankle as reference point. The resulting tendon forcecomponent was 2489 + 200 N.
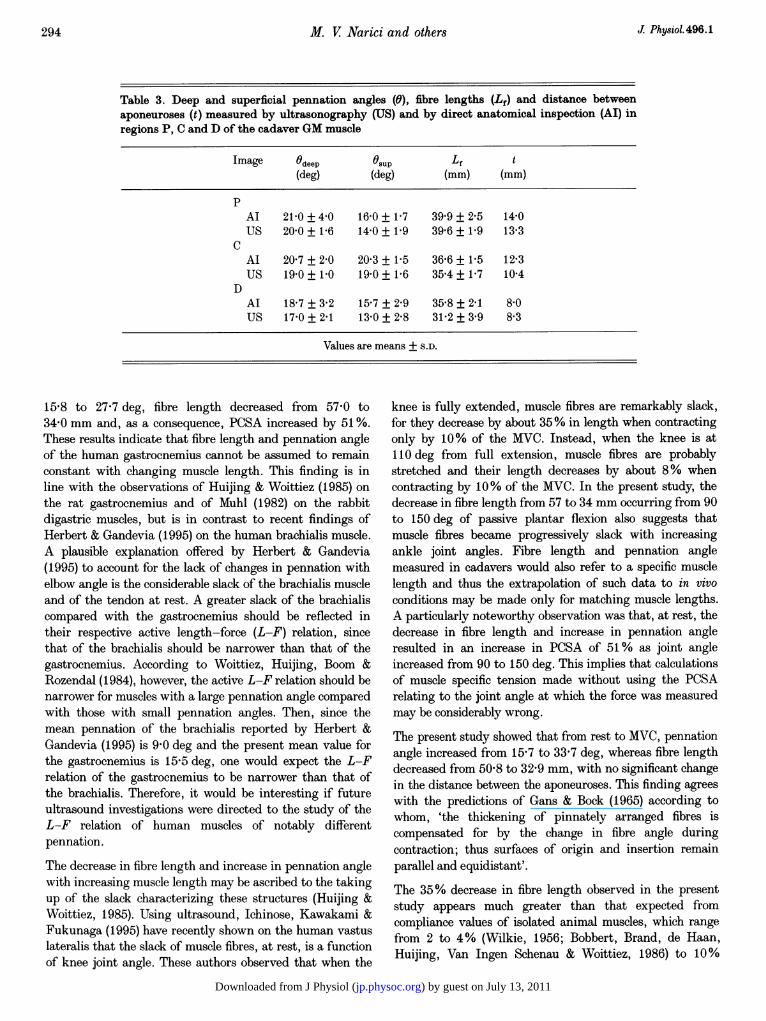
GM architecture obtained by the US technique and bydirect measurement on the anatomical specimenIn Table 3 the architectural data evaluated in the proximal,central and distal region of the human cadaver leg by USand by direct measurement on the anatomical specimen are
presented. As can be observed from this table, goodagreement exists between the two techniques in terms ofpennation angles, fibre length and distance between theaponeuroses.
Repeatability of the US measurements performed atrestFrom the analysis of the seven separate US scans obtainedin one subject, it was found that the coefficient of variation(s.D./mean) of repeated measurements was 4-8% for t(< 2 mm), 9-8% for 6 (< 2 deg), and 5-9% for Lf (< 4 mm).
DISCUSSIONThis study describes, for the first time, the architecture ofthe human gastrocnemius muscle in vivo, both at rest andduring isometric plantar flexions up to the fully contractedstate. At variance with previous studies, the reliability ofthe ultrasound technique for the measurement of musclearchitectural parameters was tested by direct comparison ona human cadaver limb and found to be in good agreement.The present values of pennation angle and fibre lengthobtained at rest, in vivo, are in line with the values of18 deg and 52 mm, respectively, reported by Huijing (1985),although the PCSA of the present study is 48% greater thanthat found by Huijing. This difference is probably accountedfor by muscle volume being 35% smaller (160 cm3) in thestudy of Huijing (1985), compared with our study (246 cm3).In the study of Huijing (1985) muscle volume was measuredon preserved cadavers, whose muscle fibres were presumablyshrunk by the fixation process, whereas in the present studyit was measured in vivo.
The results obtained in vivo indicate that humangastrocnemius muscle architecture drastically changes bothas a function of ankle joint angle at rest and as a function ofthe force developed during isometric contractions at a fixedjoint angle. At rest, when changing the ankle joint anglefrom 90 to 150 deg, GM pennation angle increased from
J Physiol.496.1 293
) by guest on July 13, 2011jp.physoc.orgDownloaded from J Physiol (
M. V Narici and others
Table 3. Deep and superficial pennation angles (0), fibre lengths (Lf) and distance betweenaponeuroses (t) measured by ultrasonography (US) and by direct anatomical inspection (AI) inregions P, C and D of the cadaver GM muscle
Image 0deep 0sup Lf t(deg) (deg) (mm) (mm)
pAl 21P0 + 40 16-0 + 17 399 + 2'5 14-0US 20-0+16 14-0+19 39-6+19 13-3
CAl 20O7 + 2-0 20-3 + 1-5 36'6+±15 12-3US 19.0+10 190+16 35-4+117 104
DAI 18-7 + 3-2 15-7 + 2-9 35-8 + 2-1 8-0US 17-0 + 21 130 + 2'8 31'2 + 39 8-3
Values are means + S.D.
15'8 to 27-7 deg, fibre length decreased from 57'0 to34'0 mm and, as a consequence, PCSA increased by 51 %.These results indicate that fibre length and pennation angleof the human gastrocnemius cannot be assumed to remainconstant with changing muscle length. This finding is inline with the observations of Huijing & Woittiez (1985) on
the rat gastrocnemius and of Muhl (1982) on the rabbitdigastric muscles, but is in contrast to recent findings ofHerbert & Gandevia (1995) on the human brachialis muscle.A plausible explanation offered by Herbert & Gandevia(1995) to account for the lack of changes in pennation withelbow angle is the considerable slack of the brachialis muscleand of the tendon at rest. A greater slack of the brachialiscompared with the gastrocnemius should be reflected intheir respective active length-force (L-F) relation, sincethat of the brachialis should be narrower than that of thegastrocnemius. According to Woittiez, Huijing, Boom &Rozendal (1984), however, the active L-F relation should benarrower for muscles with a large pennation angle comparedwith those with small pennation angles. Then, since themean pennation of the brachialis reported by Herbert &Gandevia (1995) is 9'0 deg and the present mean value forthe gastrocnemius is 15'5 deg, one would expect the L-Frelation of the gastrocnemius to be narrower than that ofthe brachialis. Therefore, it would be interesting if futureultrasound investigations were directed to the study of theL-F relation of human muscles of notably differentpennation.
The decrease in fibre length and increase in pennation anglewith increasing muscle length may be ascribed to the takingup of the slack characterizing these structures (Huijing &Woittiez, 1985). Using ultrasound, Ichinose, Kawakami &Fukunaga (1995) have recently shown on the human vastuslateralis that the slack of muscle fibres, at rest, is a functionof knee joint angle. These authors observed that when the
knee is fully extended, muscle fibres are remarkably slack,for they decrease by about 35% in length when contractingonly by 10% of the MVC. Instead, when the knee is at110 deg from full extension, muscle fibres are probablystretched and their length decreases by about 8% whencontracting by 10% of the MVC. In the present study, thedecrease in fibre length from 57 to 34 mm occurring from 90to 150 deg of passive plantar flexion also suggests thatmuscle fibres became progressively slack with increasingankle joint angles. Fibre length and pennation anglemeasured in cadavers would also refer to a specific musclelength and thus the extrapolation of such data to in vivoconditions may be made only for matching muscle lengths.A particularly noteworthy observation was that, at rest, thedecrease in fibre length and increase in pennation angleresulted in an increase in PCSA of 51 % as joint angleincreased from 90 to 150 deg. This implies that calculationsof muscle specific tension made without using the PCSArelating to the joint angle at which the force was measuredmay be considerably wrong.
The present study showed that from rest to MVC, pennationangle increased from 15-7 to 33-7 deg, whereas fibre lengthdecreased from 50-8 to 32-9 mm, with no significant changein the distance between the aponeuroses. This finding agreeswith the predictions of Gans & Bock (1965) according towhom, 'the thickening of pinnately arranged fibres iscompensated for by the change in fibre angle duringcontraction; thus surfaces of origin and insertion remainparallel and equidistant'.
The 35% decrease in fibre length observed in the presentstudy appears much greater than that expected fromcompliance values of isolated animal muscles, which rangefrom 2 to 4% (Wilkie, 1956; Bobbert, Brand, de Haan,Huijing, Van Ingen Schenau & Woittiez, 1986) to 10%
J Physiol. 496.1294
) by guest on July 13, 2011jp.physoc.orgDownloaded from J Physiol (
Resting and contracted muscle architecture
(Bahler, 1967). However, the present findings areconsistent with recent observations of R. C. Woledge(personal communication) on the human gastrocnemiusmedialis and of Ichinose et al. (1995) on the human vastuslateralis muscles. Moreover, a shortening of muscle fibrescomparable to that found in the present study has beenreported by Griffiths (1991) on the cat medial gastrocnemiusmuscle, whose fibres shorten by 28% during a maximalisometric contraction at optimal muscle length. Theseobservations suggest that the human gastrocnemiusaponeurosis and tendon are considerably compliant and addsupport to the view of Griffiths (1991) that these structuresact as mechanical buffers, protecting the muscle fromdamage during high-intensity contractions, such as occur ineccentric conditions. The observed shortening of fibre lengthfrom 50-8 to 32-9 mm, in a muscle of resting length 270 mm,with a concomitant increase in pennation from 15-5 to33-6 deg, results in an actual decrease in muscle length of21 mm, equal to 8% of resting muscle length ((cos 15X5 deg x50X8 mm - cos33-6 deg x 32-9 mm)/270 mm). Since thechange in muscle length due to the compliance of the forcetransducing apparatus was 2 mm, the effective change inmuscle length in the presence of a perfectly rigid structureshould have been 7 1%. This value is indeed in line with therange of muscle shortening reported for isolated animalmuscles (Bahler, 1967).
From the data of Fukunaga et al. (1992), it may be calculatedthat the GM PCSA is about 18% of the total PCSA of themain plantar flexors (gastrocnemius medialis and lateralis,soleus, tibialis posterior and peroneus longus). Therefore, atMVC, the force developed by the GM should be 18% of thetotal force developed by the plantar flexors (2489 N), i.e.448 N. Assuming that the stiffness of the elastic structures,24-5 N mm-, described by Cavagna (1970) reflects theAchilles' tendon stiffness, then the expected decrease inmuscle length due to stretching of the tendon and of theaponeurosis should be 18 mm (448 N/24-5 N mm-), whichis not far from the observed decrease of 21 mm. Interestingly,the stiffness of the elastic structures reported by Cavagna(1970) matches that found in the Achilles' tendon of thewallaby by Griffiths (1989); however, this similarity may bepurely coincidental, since the method used by Cavagna(1970) relied on the determination of the frequency ofnatural oscillations while that used by Griffiths (1989)referred to direct measurements on isolated free tendon.
Provided 448 N is a correct estimate of the GM contributionto the total force of the plantar flexors, the specific tensionof this muscle should then be given by 448 N/46 cm2,i.e. 9*7 N cm-2. This figure seems rather low compared withthe values of 38-3 and 25 N cm-2, respectively, reported byHaxton (1944) in the same muscle group and by Narici et al.(1992) in the human quadriceps, but is in line with the valueof 10-8 N cm-2 recently obtained by Fukunaga, Roy,Shellock, Hodgson & Edgerton (1996) in the gastrocnemius.
present study and that of Fukunaga et at. (1996) from thatof Haxton (1944) could be due to the fact that, in the firsttwo studies, PCSA calculation was based on muscle volumemeasured in vivo, whereas in the latter study it wasmeasured on preserved cadaver legs. The cadaveric musclesof Haxtons (1944) study were probably shrunk by thefixation process and were possibly atrophic because of oldage, as indicated by their 48% smaller ACSA comparedwith the control living subjects of that study. Part of thedifference between the present value of specific tension of9*7 N cm-2 and the 25 N cm-2 estimated in the human kneeextensors (Narici et al. 1992) may be explained by the factthat, in the present study, MVC was measured at a footplateangle of 90 deg. At this angle the force of the plantar flexorsis 73% of that exerted at 11O deg, which is the optimalangle for maximum plantar flexion force (Sale, Quinlan,Marsh, McComas & Belanger, 1982). Correcting for thedifference in the force at these footplate angles, the resultingspecific tension of the GM should be 13-3 N cm-2(9 7 N cm-2 x 1-37), which still leaves a considerable gapfrom the specific tension of the knee extensors. This findingsupports the view of Fukunaga et at. (1996) that there maynot be a common value of specific tension for all humanmuscles. According to these authors, the variance in specifictension among different human muscle groups may reflectan imperfect transmission of the force by any given musclefibre to the tendon, since much of the tension may betransmitted to the tendon via the interfibre matrix of amuscle. However, it cannot be excluded that when strengthtesting involves several muscles acting at a joint, activationat a specific joint angle may not be maximal for all of them.In human arm muscles, van Zuylen, Gielen & van der Gon(1988) have indeed observed that the relative activation ofthe muscles varies with elbow angle. Changing joint angleaffected the mechanical advantage of the elbow flexor andextensor muscles differently; those muscles with the greatermechanical advantage at a specific angle received the largerneural input. A similar mechanism could also exist for thehuman plantar flexors. Finally, this study has shown that atrest, PCSA considerably increases with joint angle. Therefore,a potential overestimation of specific tension may arise if thejoint angles of PCSA and force measurements do not coincide.
The present study has shown that, in the fully contractedstate, the increase in pennation angle and decrease in fibrelength, assuming changes in muscle volume to be negligible(Baskin & Paolini, 1967), result in a 34f8% increase inPCSA. This, however, will have no consequence on the forceper unit area of the GM muscle, since the force per half-sarcomere will still be the same.
The changes in muscle architecture observed from rest toMVC agreed fairly well with those predicted by a simpleplanar muscle model. Indeed, using a planar model forregion C, the value of Lf, predicted at the MVC by a 0 of35.3 deg and a constant value of t of 19-8 mm, would besin-'35 3 deg x 19-8 mm, equal to 34-2 mm. Thus the Lf
295J Physiol.496.1
The divergence between the values of specific tension in the
) by guest on July 13, 2011jp.physoc.orgDownloaded from J Physiol (
296 M. V Narici and others J Physiol.496.1
predicted by the simple planar model is only 3 9% greaterthan the observed value of 32-9 mm. Although a tendency,albeit non-significant, was observed for a greater absolutechange in Lf of the distal fibres compared with the proximalones (23 versus 18 mm), no differences were found betweenthe relative shortening of muscle fibres of regions P, C andD. Therefore, the use of simple planar models in thegastrocnemius muscle seems to predict reliably the observedchanges in architecture occurring with the contraction. Thisobservation is consistent with the findings of Otten (1988),but is in contrast to those on the human brachialis byHerbert & Gandevia (1995), who raised doubts about theapplicability of simple planar models of muscle architecture.The latter authors, however, reached this conclusion withoutmeasuring fibre length but measuring only pennation. Thedivergence between the present data on the gastrocnemiusand those on the brachialis by Herbert & Gandevia (1995)may also suggest that the applicability of planar modelsdepends on the individual muscle architecture. VanLeeuwen & Spoor (1992) developed a very comprehensiveplanar model of pennate muscle and found it to describe thearchitecture of embalmed human gastrocnemius musclereliably. Their model took into account fibre curvature,which they observed on the dissected specimen. In thepresent study, however, in which architectural parameterswere measured in the muscle in situ, no fibre curvaturecould be observed; the use of a simple planar model wasthus considered suitable for the present conditions.
Finally, in most previous human studies, the fibre forcecomponent was calculated by multiplying the tendon forcecomponent by the cosine-1 of the angle of pennationmeasured in cadavers. The present results and those ofHerbert & Gandevia (1995) demonstrate instead thatpennation angle drastically increases upon contraction andmakes the use of cadaver pennation data for the estimationof the fibre force component in vivo quite questionable.
In conclusion, this study has shown that good agreementexists between human gastrocnemius architecture obtainedby ultrasound and by direct anatomical inspection. Pennationangle, fibre length and PCSA were significantly affected bychanges of both joint angle at rest, and of contractionintensity, despite the imposed isometric conditions. Theextrapolation of muscle architectural data obtained fromcadavers to in vivo conditions should be made only formatching muscle lengths.
BAHLER, A. S. (1967). Series elastic component of mammalian skeletalmuscle. American Journal of Physiology 213, 1560-1564.
BASKIN, R. J. & PAOLINI, P. J. (1967). Volume changes and pressuredevelopment in muscle during contraction. American Journal ofPhysiology 231, 1025-1030.
BOBBERT, M. F., BRAND, C., DE HAAN, A., HUIJING, P. A., VAN INGENSCHENAU, G. J. & WOITTIEZ, R. D. (1986). Series-elasticity oftendinous structures of rat EDL. Journal of Physiology 377, 89 P.
CAVAGNA, G. (1970). Elastic bounce of the body. Journal of AppliedPhysiology 29, 279-282.
FUKASHIRO, S., ITOH, M., ICHINOSE, Y., KAWAKAMI, Y. & FUKUNAGA,T. (1995). Ultrasonography gives directly but noninvasively elasticcharacteristic of human tendon in vivo. European Journal ofApplied Physiology 71, 555-557.
FUKUNAGA, T., Roy, R. R., SHELLOCK, F. G., HODGSON, J. A., DAY,M. K., LEE, P. L., KWONG-FU, H. & EDGERTON, V. R. (1992).Physiological cross-sectional area of human leg muscles based onmagnetic resonance imaging. Journal of Orthopaedic Research 10,926-934.
FUKUNAGA, T., Roy, R. R., SHELLOCK, F. G., HoDGSON, J. A. &EDGERTON, V. R. (1996). Specific tension of human plantar flexorsand dorsiflexors. Journal of Applied Physiology 80, 158-165.
GANS, C. & BOCK, W. J. (1965). The functional significance of musclearchitecture: a theoretical analysis. Ergebnisse der Anatomie undEntwicklungsgeschichte 38, 8-142.
GRIFFITHS, R. I. (1989). The mechanics of the medial gastrocnemiusin the freely hopping wallaby. Journal of Experimental Biology147, 439-456.
GRIFFITHS, R. I. (1991). Shortening of muscle fibres during stretch ofthe active cat medial gastrocnemius muscle: the role of tendoncompliance. Journal of Physiology 436, 219-236.
HAXTON, H. A. (1944). Absolute muscle force in the ankle flexors ofman. Journal of Physiology 103, 267-273.
HENRIKSSON-LARSEN, K., WRETLING, M.-L., LORENTZON, R. &OBERG, L. (1992). Do muscle fibre size and fibre angulation correlatein pennated human muscles? European Journal of AppliedPhysiology 64, 68-72.
HERBERT, R. D. & GANDEVIA, S. C. (1995). Changes in pennation withjoint angle and muscle torque: in vivo measurements in humanbrachialis muscle. Journal of Physiology 484, 523-532.
HUIJING, P. A. (1985). Architecture of the human gastrocnemiusmuscle and some functional consequences. Acta Anatomica 123,101-107.
HUIJING, P. A. & WoITTIEZ, R. D. (1985). Length range, morphologyand mechanical behaviour of rat gastrocnemius during isometriccontraction at the level of the muscle tendon complex. NetherlandsJournal of Zoology 35, 505-516.
ICHINOSE, Y., KAWAKAMI, Y. & FUKUNAGA, T. (1995). In vivomeasurement of fascicle arrangement of human vastus lateralismuscle using ultrasound. XVth Congress of the International Societyof Biomechanics, ed. HAKKINEN, K., KESKINEN, K. L., KoMI, P. V.& MERO, A., pp. 412-413. Gummerus, Jyvaskyla, Finland.
KUNO, S. & FUKUNAGA, T. (1995). Measurement of muscle fibredisplacement during contraction by real-time ultrasonography inhumans. European Journal of Applied Physiology 70, 45-48.
MUHL, Z. F. (1982). Active length-tension relation and the effect ofmuscle pinnation on fibre lengthening. Journal of Morphology 173,285-292.
NARICI, M., LANDONI, L. & MINETTI, A. E. (1992). Assessment ofhuman knee extensor muscles stress from in vivo physiologicalcross-sectional area and strength measurements. European Journalof Applied Physiology 65, 438-444.
NARICI, M. V., BINZONI, T., HILTBRAND, M., FASEL, J. & APICELLA,A. (1994). Human gastrocnemius architecture from rest to thecontracted state. Journal of Physiology 475.P, 25P
OTTEN, E. (1988). Concepts and models on functional architecture inskeletal muscle. Exercise and Sports Sciences Reviews 16, 89-137.
RACK, P. M. H. & WESTBURY, D. R. (1969). The effiects of length andstimulus rate on tension in the isometric cat soleus muscle. Journa.lof Physiology 204, 443-460.
) by guest on July 13, 2011jp.physoc.orgDownloaded from J Physiol (
Resting and contracted muscle architecture
RUTHERFORD, 0. M. & JONES, D. A. (1992). AMeasurement of fibrepennation using ultrasound in the human quadriceps in vivo.European Journal of Applied Physiology 65, 433-437.
SALE, D., QUINLAN, J., AIARSH, E., MCCOMAS, A. J. & BELANGER,A. Y. (1982). Influence of joint position on ankle plantarflexion inhumans. Journal of Applied Physiology 52, 1636-1642.
STRASSER, H. (1917). Lehrbuch der Muskeln und Gelenkmechanik,Band III (Die untere Extremitat), p. 174. Springer, Berlin.
VAN LEEUWEN, J. L. & SPOOR, C. W. (1992). Modelling mechanicallystable muscle architectures. Philosophical Transactions of the RoyalSociety B 336, 275-292.
VAN ZUYLEN, E. J., GIELEN, C. C. A. AM. & DENIER VAN DER GON, J. J.(1988). Coordination and inhomogeneous activation of human armmuscles during isometric torques. Journal of Neurophysiology 60,1523-1548.
WILKIE, D. R. (1956). AMeasurement of the series elastic component atvarious times during a single twitch. Journal of Physiology 134,527-530.
WVOITTIEZ, R. D., HuIJING, P. A., BOOM, H. B. K. & ROZENDAL, R. H.(1984). A three-dimensional muscle model: a quantified relationbetween form and function of skeletal muscles. Journal ofMlorphology 182, 95-113.
YAMAGUCHI, G. T., SAWA, A. G. U., MIORAN, D. WV, FESSLER, M. J. &WXINTERS, J. M. (1990). A survey of human musculotendon actuatorparameters. In AMultiple AMuscle Systems: Biomechanics andMovement Organisationt, ed. WINTERS, J. M. & Woo, S. L.-Y.,pp. 717-773. Springer-Verlag, New York.
AcknowledgementsThe authors are grateful to Professor F. Saibene for helpful advice.The collaboration of Dr A. Apicella of Picker International in imageelaboration and of the Foundation Ernst and Lucie Schmidheiny,Geneva, Switzerland, for the allocation of a SPARCstation 10 andof CIGABIN, Italy were highly appreciated.
Author's email addressM. V. Narici: [email protected]
Received 12 March 1996; accepted 7 June 1996.
J Physiol.496.1 297
) by guest on July 13, 2011jp.physoc.orgDownloaded from J Physiol (
Related Documents