BIOLOGY OF REPRODUCTION (2012) 86(5):148, 1–11 Published online before print 22 February 2012. DOI 10.1095/biolreprod.111.095307 In Vitro Transformation of Mouse Testis Cells by Oncogene Transfection 1 Hiroko Morimoto, 4 Jiyoung Lee, 3,4 Takashi Tanaka, 4 Kei Ishii, 4 Shinya Toyokuni, 5 Mito Kanatsu-Shinohara, 4 and Takashi Shinohara 2,4,6 4 Department of Molecular Genetics, Graduate School of Medicine, Kyoto University, Kyoto, Japan 5 Department of Pathology and Biological Responses, Nagoya University Graduate School of Medicine, Nagoya, Japan 6 Japan Science and Technology Agency, CREST, Kyoto, Japan ABSTRACT Germ cell tumors (GCTs) are unique in that they exhibit diverse biological characteristics and pathological features. Although several in vivo GCT models are available, studies on GCTs are hampered because in vivo development of GCTs is time consuming and prevents a detailed molecular analysis of the transformation process. Here we developed a novel strategy to transform mouse testis cells in vitro. Lentivirus-mediated transfection of dominant negative Trp53, Myc, and activated Hras1 into a CD9-expressing testis cells caused tumorigenic conversion in vitro. Although these cells resembled embryonic stem (ES) cells, they were aneuploid and lacked Nanog expression, which is involved in the maintenance of the undifferentiated state in ES cells. Euploid ES-like cells were produced by transfecting the Yamanaka factors (Pou5f1, Myc, Klf4, and Sox2) into the same cell population. Although these cells expressed Nanog, they were distinct from ES cells in that they expressed CD44, a cancer stem cell antigen. Both treatments induced similar changes in the DNA methylation patterns in differentially methylated regions of imprinted genes. Moreover, despite the differences in their phenotype and karyotype, both cell types similarly produced mixed GCTs on transplantation, which were composed of teratomas, semino- mas, and embryonal carcinomas. Thus, in vitro testis cell transformation facilitates an analysis of the GCT formation process, and our results also suggest the close similarity between GCT formation and reprogramming. spermatogenesis, spermatogonia, spermatogonial stem cells, stem cell, testis INTRODUCTION Germ cell tumors (GCTs) are one of the most frequent tumors in adult males and are unique among solid tumors in that they exhibit a variety of morphological and biological properties [1, 2]. To date, analyses of GCT formation have depended on in vivo animal models. In classic experiments, ectopically transplanted fetal genital ridges produced teratomas in 129 mice [3]. More recently, in vivo transgenic overexpres- sion of glial cell line-derived neurotrophic factor (Gdnf), a self- renewal factor for spermatogonial stem cells (SSCs), caused seminomatous tumors [4]. Although the efficiency of tumor formation is relatively high (;80% in teratoma and ;90% in seminoma studies, respectively), in vivo tumor development prevents detailed analyses of transforming mechanisms and takes at least several weeks to 1 yr. Moreover, difficulties in transfecting germ cells and lack of culture systems also limit molecular-level analyses. SSCs provide the foundation for spermatogenesis, which continues throughout the life of male animals [5, 6]. Although there are few SSCs and they proliferate slowly in vivo, these cells can be expanded in vitro by GDNF stimulation. Cultured SSCs, designated as germline stem (GS) cells, proliferate for more than 2 yr and are amenable to genetic manipulations [7]. Using GS cells, we recently found that GDNF drives SSC self- renewal via activation of the Hras1-Ccnd2 pathway [8]. Our analysis showed that SRC family molecules induce Hras1 activation in response to GDNF treatment and that Ccnd2 and Ccne1 are subsequently upregulated by activated Hras1 (Hras1V12; R). GS cells transfected with the R gene (Ras- GS cells) or cotransfected with Ccnd2 and Ccne1 genes not only proliferate under cytokine-free conditions in vitro but also produce seminomatous tumors after transplantation into seminiferous tubules [8]. While these results suggest a link between excess SSC self- renewal and GCT formation, analysis of the transforming process is complicated because the seminomatous tumors from GS cells were found 3 mo after transplantation and developed only in vivo, suggesting that additional mutations occurred during long-term proliferation in the seminiferous tubules. In this study, we established a novel method for in vitro testis cell transformation. This method allowed for a transformation within ;2 wk and transformed cells produced mixed GCTs after transplantation. MATERIALS AND METHODS Cell Culture GS cells and multipotent germline stem (mGS) cells used in this study were described previously [7, 9]. The growth factors used were 10 ng/ml human FGF2 and 15 ng/ml rat GDNF (both from Peprotech, Rocky Hill, NJ). Cells were maintained on mitomycin C-treated mouse embryonic fibroblasts (MEFs). We used 7- to 10-day-old ICR mice for the primary spermatogonial culture (Japan SLC, Shizuoka, Japan). In experiments to determine the target cells, we used 7- to 10-day-old WBB6F1 wild-type (WT) or W/W v (W) mice. Induced pluripotent stem (iPS) cells were produced by collecting MEFs from ICR male embryos 13.5 days postcoitum after removing genital ridges. Testis cells were dissociated by two-step enzymatic digestion using collagenase type IV (Sigma, St. Louis, MO) and trypsin (Nacalai Tesque, Kyoto, Japan) as described previously [10]. The dissociated cells were incubated with biotin-conjugated rat anti-mouse CD9 antibody (KMC8; BD Biosciences, Franklin Lakes, NJ). In 1 Supported by the Genome Network Project, Japan Science and Technology Agency (CREST), The Cabinet Office, Government of Japan through its ‘‘Funding Program for Next Generation World-Leading Researchers,’’ and Ministry of Education, Culture, Sports, Science, and Technology (MEXT), Japan. 2 Correspondence: Takashi Shinohara, Department of Molecular Genet- ics, Graduate School of Medicine, Kyoto University, Yoshida Konoe, Sakyo-ku, Kyoto 606-8501, Japan. E-mail: [email protected] 3 Current address: Global Center of Excellence Program, Tokyo Medical and Dental University, Tokyo 113-8510, Japan. Received: 3 August 2011. First decision: 5 September 2011. Accepted: 14 February 2012. Ó 2012 by the Society for the Study of Reproduction, Inc. eISSN: 1529-7268 http://www.biolreprod.org ISSN: 0006-3363 1 Article 148 Downloaded from www.biolreprod.org.

Welcome message from author
This document is posted to help you gain knowledge. Please leave a comment to let me know what you think about it! Share it to your friends and learn new things together.
Transcript

BIOLOGY OF REPRODUCTION (2012) 86(5):148, 1–11Published online before print 22 February 2012.DOI 10.1095/biolreprod.111.095307
In Vitro Transformation of Mouse Testis Cells by Oncogene Transfection1
Hiroko Morimoto,4 Jiyoung Lee,3,4 Takashi Tanaka,4 Kei Ishii,4 Shinya Toyokuni,5 Mito Kanatsu-Shinohara,4
and Takashi Shinohara2,4,6
4Department of Molecular Genetics, Graduate School of Medicine, Kyoto University, Kyoto, Japan5Department of Pathology and Biological Responses, Nagoya University Graduate School of Medicine, Nagoya, Japan6Japan Science and Technology Agency, CREST, Kyoto, Japan
ABSTRACT
Germ cell tumors (GCTs) are unique in that they exhibitdiverse biological characteristics and pathological features.Although several in vivo GCT models are available, studies onGCTs are hampered because in vivo development of GCTs istime consuming and prevents a detailed molecular analysis ofthe transformation process. Here we developed a novel strategyto transform mouse testis cells in vitro. Lentivirus-mediatedtransfection of dominant negative Trp53, Myc, and activatedHras1 into a CD9-expressing testis cells caused tumorigenicconversion in vitro. Although these cells resembled embryonicstem (ES) cells, they were aneuploid and lacked Nanogexpression, which is involved in the maintenance of theundifferentiated state in ES cells. Euploid ES-like cells wereproduced by transfecting the Yamanaka factors (Pou5f1, Myc,Klf4, and Sox2) into the same cell population. Although thesecells expressed Nanog, they were distinct from ES cells in thatthey expressed CD44, a cancer stem cell antigen. Bothtreatments induced similar changes in the DNA methylationpatterns in differentially methylated regions of imprinted genes.Moreover, despite the differences in their phenotype andkaryotype, both cell types similarly produced mixed GCTs ontransplantation, which were composed of teratomas, semino-mas, and embryonal carcinomas. Thus, in vitro testis celltransformation facilitates an analysis of the GCT formationprocess, and our results also suggest the close similarity betweenGCT formation and reprogramming.
spermatogenesis, spermatogonia, spermatogonial stem cells, stemcell, testis
INTRODUCTION
Germ cell tumors (GCTs) are one of the most frequenttumors in adult males and are unique among solid tumors inthat they exhibit a variety of morphological and biologicalproperties [1, 2]. To date, analyses of GCT formation havedepended on in vivo animal models. In classic experiments,
ectopically transplanted fetal genital ridges produced teratomasin 129 mice [3]. More recently, in vivo transgenic overexpres-sion of glial cell line-derived neurotrophic factor (Gdnf), a self-renewal factor for spermatogonial stem cells (SSCs), causedseminomatous tumors [4]. Although the efficiency of tumorformation is relatively high (;80% in teratoma and ;90% inseminoma studies, respectively), in vivo tumor developmentprevents detailed analyses of transforming mechanisms andtakes at least several weeks to 1 yr. Moreover, difficulties intransfecting germ cells and lack of culture systems also limitmolecular-level analyses.
SSCs provide the foundation for spermatogenesis, whichcontinues throughout the life of male animals [5, 6]. Althoughthere are few SSCs and they proliferate slowly in vivo, thesecells can be expanded in vitro by GDNF stimulation. CulturedSSCs, designated as germline stem (GS) cells, proliferate formore than 2 yr and are amenable to genetic manipulations [7].Using GS cells, we recently found that GDNF drives SSC self-renewal via activation of the Hras1-Ccnd2 pathway [8]. Ouranalysis showed that SRC family molecules induce Hras1activation in response to GDNF treatment and that Ccnd2 andCcne1 are subsequently upregulated by activated Hras1(Hras1V12; R). GS cells transfected with the R gene (Ras-GS cells) or cotransfected with Ccnd2 and Ccne1 genes notonly proliferate under cytokine-free conditions in vitro but alsoproduce seminomatous tumors after transplantation intoseminiferous tubules [8].
While these results suggest a link between excess SSC self-renewal and GCT formation, analysis of the transformingprocess is complicated because the seminomatous tumors fromGS cells were found 3 mo after transplantation and developedonly in vivo, suggesting that additional mutations occurredduring long-term proliferation in the seminiferous tubules. Inthis study, we established a novel method for in vitro testis celltransformation. This method allowed for a transformationwithin ;2 wk and transformed cells produced mixed GCTsafter transplantation.
MATERIALS AND METHODS
Cell Culture
GS cells and multipotent germline stem (mGS) cells used in this study weredescribed previously [7, 9]. The growth factors used were 10 ng/ml humanFGF2 and 15 ng/ml rat GDNF (both from Peprotech, Rocky Hill, NJ). Cellswere maintained on mitomycin C-treated mouse embryonic fibroblasts (MEFs).
We used 7- to 10-day-old ICR mice for the primary spermatogonial culture(Japan SLC, Shizuoka, Japan). In experiments to determine the target cells, weused 7- to 10-day-old WBB6F1 wild-type (WT) or W/Wv (W) mice. Inducedpluripotent stem (iPS) cells were produced by collecting MEFs from ICR maleembryos 13.5 days postcoitum after removing genital ridges. Testis cells weredissociated by two-step enzymatic digestion using collagenase type IV (Sigma,St. Louis, MO) and trypsin (Nacalai Tesque, Kyoto, Japan) as describedpreviously [10]. The dissociated cells were incubated with biotin-conjugated ratanti-mouse CD9 antibody (KMC8; BD Biosciences, Franklin Lakes, NJ). In
1Supported by the Genome Network Project, Japan Science andTechnology Agency (CREST), The Cabinet Office, Government of Japanthrough its ‘‘Funding Program for Next Generation World-LeadingResearchers,’’ and Ministry of Education, Culture, Sports, Science, andTechnology (MEXT), Japan.2Correspondence: Takashi Shinohara, Department of Molecular Genet-ics, Graduate School of Medicine, Kyoto University, Yoshida Konoe,Sakyo-ku, Kyoto 606-8501, Japan. E-mail: [email protected] address: Global Center of Excellence Program, Tokyo Medicaland Dental University, Tokyo 113-8510, Japan.
Received: 3 August 2011.First decision: 5 September 2011.Accepted: 14 February 2012.� 2012 by the Society for the Study of Reproduction, Inc.eISSN: 1529-7268 http://www.biolreprod.orgISSN: 0006-3363
1 Article 148
Dow
nloaded from w
ww
.biolreprod.org.

experiments to determine the target cell population, we also used rat anti-mouseEPCAM antibody (G8.8; BioLegend, San Diego, CA). Magnet cell sorting(MACS) was then performed using Dynabeads following the manufacturer’sinstruction, as described previously (Invitrogen, Carlsbad, CA) [11]. Both GScells and primary testis cells were initially maintained in StemPro-34 SFM(Invitrogen) but were subsequently maintained on MEFs in Dubelco modifiedEagle medium supplemented with leukemia inhibitory factor (ESGRO;Invitrogen) and 15% fetal bovine serum approximately 2 wk after transfection.
Cell adhesion properties were determined by plating aliquots of 1 3 105
cells in a 12-well plate coated with gelatin (0.2%; Nacalai Tesque) or laminin(20 lg/ml; BD Biosciences). Two days after plating, the plates were washedwith phosphate-buffered saline, and the cells were recovered by treatment with0.25% trypsin. Anchorage independent growth of transformed cells wasexamined by suspending 2 3 105 cells in 1 ml of methylcellulose (R&DSystems, Minneapolis, MN), followed by culture in a 24-well plate.
Apoptosis Assay
A single cell suspension was concentrated on glass slides by centrifugationwith Cytospin 4 (Thermo Electron Corporation, Cheshire, U.K.) for TUNELstaining. After fixing the cells in 4% paraformaldehyde for 1 h, they werelabeled using a TMR red In situ Cell Death Detection kit (Roche AppliedScience, Mannheim, Germany) following the manufacturer’s protocol. Thecells were counterstained with Hoechst 33342 (2 lg/ml; Sigma) to determinethe percentage of TUNEL-positive nuclei relative to the total number of cells.Apoptotic cells were quantified by collecting images of stained cells usingPhotoshop software (Adobe Systems, San Jose, CA).
Lentivirus Transfection
For lentivirus transfection, cDNA encoding Trp53 DD (D; gift from Dr. M.Oren, Weizmann Institute of Science), Pou5f1, Sox2, and Klf4 (gifts from Dr. S.Yamanaka, Kyoto University) were cloned into the CSII-EF1a-IRES2-Venusvector, whereas Myc (M; gift from Dr. H. Saya, Keio University) andHras1V12 (R; gift from Dr. S. Yamanaka) were cloned into the CSII-EF1a-IRES2-humanized Kusabira Orange1 (hKO1) vector. Lentivirus particles wereproduced by transient transfection of 293T cells, and transfection was carriedout as described previously [12]. The virus titer was determined by transfecting293T cells, and the multiplicities of infection was adjusted to 1.0 for allexperiments. Equal volumes of each virus supernatant were mixed forexperiments using virus mixtures, and the total titer was determined. Anempty lentivirus vector was used as a control. To quantify colony numbers, 1 3105 cells were plated in a 12-well plate, and a colony was defined when thecells produced cell clusters that were larger than 0.1 mm at 6 days aftertransfection. Alkaline phosphatase staining was conducted using a VECTORAlkaline Phosphatase Staining Substrate kit (Vector Lab, Burlingame, CA).
Flow Cytometry
The primary antibodies used were biotinylated mouse anti-mouse FUT4(MC-480; eBioscience, San Diego, CA), rat anti-mouse EPCAM (G8.8,BioLegend), rat anti-human ITGA6 (GoH3; BioLegend), rat anti-mouse CD44(KM114; BD Biosciences), rat anti-mouse PROM1 (13A4; eBioscience), andbiotinylated rat anti-mouse KIT (2B8; eBioscience). The primary antibodieswere detected by allophycocyanin (APC)-conjugated goat anti-rat IgG (BDBiosciences) or APC-conjugated streptavidin (eBioscience). Cells wereanalyzed on a FACSCalibur (BD Biosciences).
Transplantation Procedure
For transplantation, cultured cells were dissociated with trypsin, andapproximately 106 cells were microinjected into the seminiferous tubules ofKSN nude mice that had been treated with 44 mg/kg busulfan at 4 wk of age(Japan SLC) [10]. Within 5 days after busulfan treatment, these mice received abone marrow transplant from syngeneic donors to prevent bone marrow failure.The animals were used for transplantation at least 4 wk after busulfan treatment.The injection was performed via an efferent duct [10]. Approximately 80–90%of the tubules were filled in each recipient testis. For subcutaneoustransplantation, approximately 2–4 3 106 cells were transplanted. In bothexperiments, the recipient mice were killed between 4 and 6 wk aftertransplantation. The Institutional Animal Care and Use Committee of KyotoUniversity approved all the animal experimentation protocols.
Histology and Immunohistochemistry
Tissue samples were fixed in 10% neutral-buffered formalin for overnightand embedded in paraffin blocks for sectioning. All sections were stained withhematoxylin and eosin. For immunohistochemistry, tissue samples were fixedin 4% paraformaldehyde for 2 h, embedded in Tissue-Tek OCT compound, andprocessed for cryosectioning. The primary antibodies used were mouse anti-human TNFRSF8 (GeneTex, Irvine, CA), goat anti-mouse PDPN (R&DSystems), mouse anti-human MAGEA4 (Santa Cruz Biotechnology, SantaCruz, CA), rabbit anti-human ALPP (Santa Cruz Biotechnology), rabbit anti-mouse NANOG (ReproCELL, Tokyo, Japan), and rabbit anti-human CHGA(Abcam, Cambridge, U.K.). The primary antibodies were detected by AlexaFluor 568-conjugated goat anti-rabbit IgG, Alexa Fluor 488-conjugated goatanti-mouse IgG, or Alexa Fluor 555-conjugated donkey anti-goat IgG(Invitrogen). Hoechst 33342 (Sigma) was used for counterstaining. Cellsexpressing GCT markers were determined by quantifying the signal intensitiesof pixels of tumors in random visual fields from five slides using Photoshopsoftware (Adobe Systems).
RT-PCR
Total RNA was isolated using Trizol reagent (Invitrogen). First-strandcDNA was produced using Superscript II (RNase H� Reverse Transcriptase,both from Invitrogen). The PCR conditions were 948C for 5 min, 30 cycles at948C for 1 min, 608C for 1 min, and 728C for 1 min, followed by 728C for 10min. The primers used for PCR were Nanog: 50-AGGGTCTGCTACTGAGATGCTCTG-30 and 50-CAACCACTGGTTTTTCTGCCACCG-30; Ddx4: 50-GGTTGATCAGTTCTCGAG-30 and 50-GCTCAAACAGGGTCTGGGAAG-30; Tdgf1: 50-CTTTGAGGTCCTGGTCCATCACGTGACCAT-3 0 and 50-ATGGACGCAACTGTGAACATGATGTTCGCA-30; Zbtb16: 50-GAGACACACAGACAGACCCATACT-30 and 50-CACACATAACACAGGTAGAGGTACG-30; Taf4b: 50-TCATTTCCTGATTCTAGTGGTCTCT-30 and 50-CAGAACTTAACTCTGATGCTGTGAA-3 0; Pou5f1: 5 0-AGCTGCTGAAGCAGAAGAGG-30 and 50-GGTTCTCATTGTTGTCGGCT-30; Neurog3: 50-CACTCAGCAAACAGCGAAGAAG-3 0 and 5 0-GCAGGGTCTCGATCTTTGTAAGTT-30; Lin28a: 50-GGTCTGGAATCCATCCGTGTCA-30
and 50-TCCTTGGCATGATGGTCTAGCC-30; Gfra1: 50-GTCAAGGTCTGTCAGCAACTGTCT-30 and 50-TTGCCACTGTTGCTGCAATC-30; H19: 50-TGTAAACCTCTTTGGCAATGCTGCC-30 and 50-TATTGATGGACCCAGGACCTCTGGT-30; and Igf2r: 50-TTAGTGGGGTATTTTTATTTGTATGG-30 and 50-AAATATCCTAAAAATACAAACTACACAA-30.
Western Blot Analysis
We used SDS-PAGE to separate cell lysates, which were transferred toHybond-P membranes (Amersham Biosciences, Little Chalfont, Buckingham-shire, U.K.). The primary antibodies used were rabbit anti-human ZBTB16,goat anti-human POU5F1 (both from Santa Cruz Biotechnology), rabbit anti-human DDX4 (Abcam), rabbit anti-mouse NANOG (ReproCELL), and mouseanti-mouse NEUROG3 (BD Biosciences). The primary antibodies weredetected by horseradish peroxidase (HRP)-conjugated goat anti-rabbit IgG,HRP-conjugated horse anti-mouse IgG (both from Cell Signaling Technology,Danvers, MA), or HRP-conjugated chicken anti-goat IgG (Santa CruzBiotechnology). Immunoreactive bands were visualized with the ECL PlusWestern blotting detection system (Amersham Biosciences).
Combined Bisulfite Restriction Analysis
Genomic DNA was treated with sodium bisulfite, which deaminatesunmethylated cytosines to uracils. Using this template, differentially methylatedregions of the indicated genes were amplified by PCR. PCR primers used werePou5f1-distal-1: 5 0-GTGATTTGAGGGATAGGATTTTAG-3 0 and 5 0-CTCAAAAATCAACCTACCCTCTAC-3 0; Pou5f1 -d is ta l -2 : 5 0-GGGTGTTAGGAATAGAATTTTAAAAGG-3 0 and 5 0-CCCAACTCATAACTTTAATCCCAACAC-3 0; Pou5f1-proximal: 5 0-GGTTTTTTAGAGGATGGTTGAGTG-3 0 and 5 0-TCCAACCCTACTAACCCATCACC-3 0;Meg3: 50-GGTTTGGTATATATGGATGTATTGTAATATAGG-3 0 and 50-ATAAAACACCAAATCTATACCAAAATATACC-3 0; Igf2r : 5 0-TTAGTGGGGTATTTTTATTTGTATGG-30 and 50-AAATATCCTAAAAATACAAACTACACAA-30; H19: 50-GGAATATTTGTGTTTTTGGAGGG-30
and 5 0-TTAAACCCCAACCTCTACTTTTATAAC-3 0; and Peg10: 5 0-GTAAAGTGATTGGTTTTGTATTTTTAAGTG-30 and 50-TTAATTACTCTCCTACAACTTTCCAAATT-3 0. PCR products were digested with theindicated restriction enzymes, which had recognition sequences containingCpG in the original unconverted DNA. The intensity of the digested bands wasassessed by ImageGauge software (Fuji Photo Film, Tokyo, Japan).
MORIMOTO ET AL.
2 Article 148
Dow
nloaded from w
ww
.biolreprod.org.

Karyotype Analysis
The cultured cells were incubated with colcemid solution (60 ng/ml;KaryoMAX, Invitrogen) for 1 h, recovered by trypsin, and treated with 75 mMKCl for 7 min. Metaphase spreads were prepared by a standard method afterfixing the cells with methanol/acetic acid (3:1). The slides were stained withHoechst 33258 (Sigma).
Statistical Analysis
Results are presented as mean 6 SEM. Data were analyzed using theStudent t-test. Results of immunohistochemistry and transformation frequencyafter EPCAM or CD9 selection were analyzed using analysis of variancefollowed by Tukey HSD.
RESULTS
Transformation of Testis Cells by Cotransfection of ThreeOncogenes
In our preliminary experiments, we examined the impact ofdominant negative Trp53 (Trp53 DD; D) and Myc (M) cDNAson GS cell transformation. Together with Hras1V12 (R), thisset of oncogenes transforms a variety of somatic cells in vitro[13]. We constructed lentiviruses that express D, M, and Rgenes and transfected GS cells with different combinations ofthese three viruses. While no apparent changes were observedafter transfecting the D and R genes, transfection of the M geneinduced rapid apoptosis of GS cells (Fig. 1, A and B). Whenthe three genes were cotransfected, transfected GS cellscontinued to proliferate without cytokines but did not showany signs of transformation (Supplemental Figure S1; allsupplemental data are available online at www.biolreprod.org).
Because of the potential difference between GS cells andSSCs in vivo [14], we hypothesized that freshly isolated SSCsare more susceptible to viral transfection and could betransformed in vitro. Spermatogonia from pup testes, whichare relatively enriched for SSCs because of the absence ofspermatids and spermatozoa [15], were collected by takingadvantage of CD9, a SSC marker [16]. MACS-selected cellswere transfected, and transformation was monitored by theappearance of foci of rapidly growing cells (Fig. 1C). Althougha single transfection of the D or R genes did not show anapparent effect, transfection of the M gene caused apoptosis ofCD9-expressing cells (Fig. 1, A and B). Cotransfection of theMR or DM genes produced small colonies, but they could notbe propagated after one or two passages, suggesting that theywere not fully transformed. In contrast, when DMR genes werecotransfected, spermatogonia changed their morphology andbegan to proliferate actively, and colonies with diversemorphology were found. Some of the colonies lacked apparentcell borders and resembled embryonic stem (ES) cells, butothers resembled GS cell colonies. Transformed cells could bemaintained in ES cell culture medium without GDNF.Moreover, while GS cells grew only on MEFs, transformedcells could grow in methylcellulose (Fig. 1D), indicating thatthey could grow in an anchorage-independent manner. UnlikeGS cells, some of the colonies were strongly positive foralkaline phosphatase (Fig 1E).
Transfection of Yamanaka Factors Produced ES-Like Cellsfrom CD9-Selected Cells
The close resemblance of some of the DMR-transfectedcells to ES cells suggested that transformed cells acquired aphenotype similar to ES cells. The recent development of iPStechnology allows for the generation of ES-like cells fromsomatic cells by transfecting the Klf4, Myc, Sox2, and Pou5f1
(KMSO) genes [17]. Therefore, we expected that transfectionof the four genes into GS cells or freshly isolated CD9-selectedcells would produce ES-like cells. We transfected both GS cellsand CD9-selected cells with lentivirus vectors that express theKMSO genes. Although KMSO gene upregulation was thoughtto be responsible for spontaneous conversion of GS cells intoES-like mGS cells [9, 18], only CD9-selected cells and not GScells produced ES-like cells on KMSO transfection (Fig. 1C).Colony formation started as soon as 6 days after transfection,and fully established colonies were found by 3 wk.Interestingly, unlike DMR transfection, we were unable toobtain colonies with GS-like morphology in the KMSO genetransfection. The KMSO-transfected cells closely resembledthose produced from MEFs and were maintained in ES cellculture medium. KMSO-transfected cells also proliferated inmethylcellulose, but they generally formed smaller coloniescompared with those in DMR-transfected cells (Fig. 1D). Thefrequency of colony development was significantly higher forKMSO transfection than for DMR transfection (Fig. 1F).
Identification of Target Cell Population
The number of colonies decreased significantly when CD9þ
cells were removed by MACS before transfection (Fig. 2A).Although this result suggested that transformation occurred bySSC transduction, several types of cells, including somaticcells, express CD9 in the testis [19], and it was possible thatsomatic cells can transform more easily than SSCs. Therefore,we carried out two sets of experiments to examine the origin ofthe transformed cells. In the first set of experiments, we used Wmice, which are infertile because of the almost total absence ofgerm cells due to mutations in the KIT receptor tyrosine kinase[15]. After MACS selection and lentivirus transfection of Wtestis cells, the number of colonies decreased significantlycompared with those generated from WT mice (Fig. 2B), whichsuggested that both DMR and KMSO genes transformed germcells. In the second set of experiments, we used anti-EPCAMantibody to examine the stage of target germ cells. We recentlyshowed that EPCAM-selected spermatogonia express KIT andhave little SSC activity, while CD9-selected cells show littleKIT expression and have higher levels of SSC activity [19]. Incontrast to the CD9-selected cells, few colonies developed aftertransduction of EPCAM-selected cells by DMR or KMSOgenes (Fig. 2C). These results suggested that spermatogoniawith little or no KIT expression are the major target of thetransformed cells.
Phenotypes of DMR- or KMSO-Transfected Clones
To examine the difference between DMR- and KMSO-transfected cells, clones of transformed colonies were picked6–18 days after transfection and subsequently expanded onMEFs. When clones were picked from DMR-transfected cells,.80% expanded successfully. In contrast, ;30% of KMSO-transfected clones were derived by the same procedure,suggesting that DMR-transfected cells underwent moreefficient self-renewal division. The established clones werepassaged every 2–3 days. The clonal origin was confirmed bySouthern blotting using virus-specific probes (SupplementalFigure S2).
We used RT-PCR to characterize these cells (Fig. 3A). Theexpression levels of spermatogonia markers (Ddx4, Zbtb16,Taf4b, and Neurog3), ES cell markers (Nanog and Tdgf1), anda common marker (Pou5f1) were examined. Although all theDMR-transfected clones expressed Taf4b and some retainedZbtb16, they completely lacked Pou5f1 or Ddx4 expression,
TESTIS CELL TRANSFORMATION
3 Article 148
Dow
nloaded from w
ww
.biolreprod.org.

suggesting that DMR-transfected cells no longer have aspermatogonia phenotype. Although Tdgf1 was weaklyexpressed, none of the DMR clones expressed Nanog, whichis an essential pluripotency marker. In contrast, Tdgf1 wasmore strongly expressed in KMSO-transfected cells, andNanog was expressed in at least four of the KMSO-transfectedclones, suggesting that they underwent reprogramming to an
ES cell-like state. However, not all the Nanog-expressing cellswere completely reprogrammed because one of these Nanog-expressing clones clearly expressed Neurog3. Western blotanalyses confirmed the expression of NANOG and POU5F1 inKMSO-transfected cells, but we could not detect spermatogo-nia markers, such as DDX4, ZBTB16, and NEUROG3, intransfected cells (Fig. 3B).
FIG. 1. Transformation of CD9-selected testis cells in vitro. A) TUNEL staining of the M-transfected GS or CD9-selected testis cells. B) Quantification ofcells that underwent apoptosis. At least 2500 cells were counted in two different experiments. C) Morphological appearance of CD9-selected cells thatwere transduced by the indicated genes. Stable colonies were found when DMR or KMSO genes were transfected. Although transfection of MR or DMgenes also produced similar colonies, they disappeared after one to two passages. The pictures were taken between 6 and 8 days after transfection. D)Colonies of DMR- or KMSO-transfected cells in methylcellulose 1 wk after plating. E) Alkaline phosphatase staining. F) Comparison of the frequency ofcolony development. Aliquots of 13 105 cells were plated in a 12-well plate and transduced with DMR or KMSO genes in two experiments (n¼20). Bar¼100 lm (A), 250 lm (C, E), and 25 lm (D).
MORIMOTO ET AL.
4 Article 148
Dow
nloaded from w
ww
.biolreprod.org.
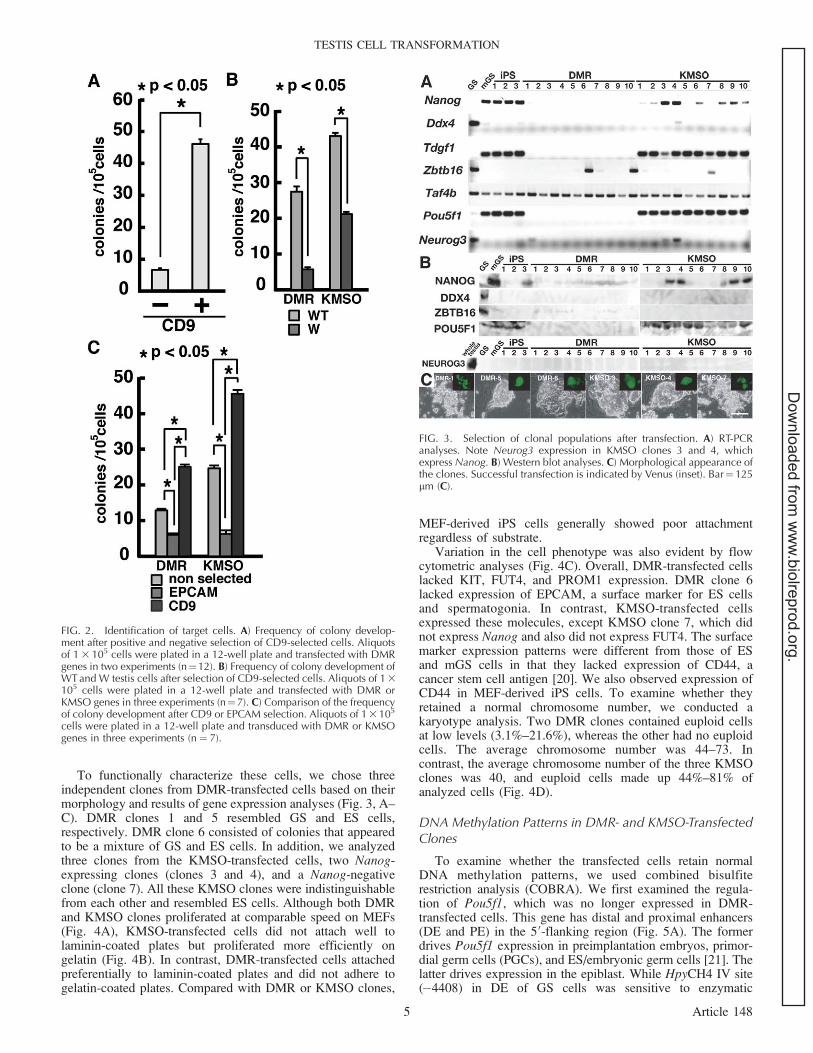
To functionally characterize these cells, we chose threeindependent clones from DMR-transfected cells based on theirmorphology and results of gene expression analyses (Fig. 3, A–C). DMR clones 1 and 5 resembled GS and ES cells,respectively. DMR clone 6 consisted of colonies that appearedto be a mixture of GS and ES cells. In addition, we analyzedthree clones from the KMSO-transfected cells, two Nanog-expressing clones (clones 3 and 4), and a Nanog-negativeclone (clone 7). All these KMSO clones were indistinguishablefrom each other and resembled ES cells. Although both DMRand KMSO clones proliferated at comparable speed on MEFs(Fig. 4A), KMSO-transfected cells did not attach well tolaminin-coated plates but proliferated more efficiently ongelatin (Fig. 4B). In contrast, DMR-transfected cells attachedpreferentially to laminin-coated plates and did not adhere togelatin-coated plates. Compared with DMR or KMSO clones,
MEF-derived iPS cells generally showed poor attachmentregardless of substrate.
Variation in the cell phenotype was also evident by flowcytometric analyses (Fig. 4C). Overall, DMR-transfected cellslacked KIT, FUT4, and PROM1 expression. DMR clone 6lacked expression of EPCAM, a surface marker for ES cellsand spermatogonia. In contrast, KMSO-transfected cellsexpressed these molecules, except KMSO clone 7, which didnot express Nanog and also did not express FUT4. The surfacemarker expression patterns were different from those of ESand mGS cells in that they lacked expression of CD44, acancer stem cell antigen [20]. We also observed expression ofCD44 in MEF-derived iPS cells. To examine whether theyretained a normal chromosome number, we conducted akaryotype analysis. Two DMR clones contained euploid cellsat low levels (3.1%–21.6%), whereas the other had no euploidcells. The average chromosome number was 44–73. Incontrast, the average chromosome number of the three KMSOclones was 40, and euploid cells made up 44%–81% ofanalyzed cells (Fig. 4D).
DNA Methylation Patterns in DMR- and KMSO-TransfectedClones
To examine whether the transfected cells retain normalDNA methylation patterns, we used combined bisulfiterestriction analysis (COBRA). We first examined the regula-tion of Pou5f1, which was no longer expressed in DMR-transfected cells. This gene has distal and proximal enhancers(DE and PE) in the 50-flanking region (Fig. 5A). The formerdrives Pou5f1 expression in preimplantation embryos, primor-dial germ cells (PGCs), and ES/embryonic germ cells [21]. Thelatter drives expression in the epiblast. While HpyCH4 IV site(�4408) in DE of GS cells was sensitive to enzymatic
FIG. 2. Identification of target cells. A) Frequency of colony develop-ment after positive and negative selection of CD9-selected cells. Aliquotsof 1 3 105 cells were plated in a 12-well plate and transfected with DMRgenes in two experiments (n¼12). B) Frequency of colony development ofWT and W testis cells after selection of CD9-selected cells. Aliquots of 1 3105 cells were plated in a 12-well plate and transfected with DMR orKMSO genes in three experiments (n¼7). C) Comparison of the frequencyof colony development after CD9 or EPCAM selection. Aliquots of 1 3 105
cells were plated in a 12-well plate and transduced with DMR or KMSOgenes in three experiments (n ¼ 7).
FIG. 3. Selection of clonal populations after transfection. A) RT-PCRanalyses. Note Neurog3 expression in KMSO clones 3 and 4, whichexpress Nanog. B) Western blot analyses. C) Morphological appearance ofthe clones. Successful transfection is indicated by Venus (inset). Bar¼ 125lm (C).
TESTIS CELL TRANSFORMATION
5 Article 148
Dow
nloaded from w
ww
.biolreprod.org.

digestion, digestion was relatively poor in mGS cells. HpyCH4IV site in DMR- and KMSO-transfected cells were notmethylated, and the methylation levels at two Taq I sites(�3037 and �2830) in DE was comparable to those in GS ormGS cells. However, Taq I site (�314) in PE of DMR-transfected cells was significantly more sensitive to restrictionenzyme digestion, which agrees with the loss of Pou5f1expression by RT-PCR analysis. In addition, one of the KMSOclones that did not express Nanog also showed high
methylation in Taq I site in PE compared with the other twoNanog-expressing clones.
We then examined the methylation levels of differentiallymethylated regions of the imprinted genes (Fig. 5B). Malegerm cells in the postnatal testis, including WT and Ras-GScells, exhibit androgenetic methylation patterns in differentiallymethylated regions of imprinted genes, including hyper-methylation of H19 and Meg3 differentially methylatedregions, and hypomethylation of Igf2r and Peg10 differentiallymethylated regions [22]. COBRA analyses showed that H19and Meg3 underwent demethylation in both DMR- andKMSO-transfected clones. In contrast, all the DMR- andKMSO-transfected clones exhibited increases in methylation ofboth Igf2r and Peg10. Analyses of the remaining clones alsoshowed a similar methylation pattern. Strikingly, one of theMEF-derived iPS cell clones showed demethylation in Meg3,but we did not observe significant changes in other imprintedgenes.
Generation of Tumors after Transplantation
In the final set of experiments, we transplanted both DMRand KMSO clones into an in vivo environment to examine theirdevelopmental potential (Fig. 6A). We chose DMR clone 1(GS-like), DMR clone 5 (ES-like), KMSO clone 3 (Nanogþ),and KMSO clone 7 (Nanog�) and compared their tumorigenicactivity. We also transplanted MEF-derived iPS cells. Cellswere microinjected into the seminiferous tubules of infertilemouse testes. The same cell populations were also injectedsubcutaneously to examine the effect of the host environment.All the recipients developed tumors within 4 wk aftertransplantation regardless of the site of transplantation.
Despite differences in gene expression patterns, histologicalanalyses revealed that both DMR- and KMSO-transfected cellsproduced mixed GCTs regardless of the transplantation site(Fig. 6B). We also found similar histology after transplantationof MEF-derived iPS cells. Some areas showed teratomatouscomponents and preferentially differentiated into a neuroendo-crine lineage, which was confirmed by CHGA expression (Fig.6C). Neural tube-like structures were observed in all tumortypes (Fig. 6B). However, we found other areas that expressedPDPN or MAGEA4, both of which are seminoma markers.Tumors also contained embryonal carcinomas because theyexpressed TNFRSF8, an embryonal carcinoma marker. ALPP,which is expressed in both seminoma and embryonalcarcinomas, were also detected (Fig. 6C). Quantitativeassessment of markers showed that PDPN is more widelyexpressed in tumors from DMR-transfected cells (Fig. 6D). Wefound no evidence of spermatogenesis despite injecting into theseminiferous tubules. This was in contrast to Ras-GS cells thatreinitiated spermatogenesis after transplantation [8].
RT-PCR analyses of the subcutaneous tumors showed thatsome of the tumors continued to express spermatogonialmarkers, such as Neurog3 (Fig. 6E). However, we also foundNanog expression in tumors developed from both DMR- andKMSO-transfected cells, which suggested a reactivation ofpluripotent genes in vivo. Consistent with this observation,clusters of NANOG-expressing cells were present in tumorsdeveloped from DMR-transfected cells by immunohistochem-istry (Fig. 6C). Although we did not find statistical signifi-cance, NANOG distributed more widely in tumors from DMR-transfected cells (Fig. 6D).
COBRA was used to examine changes in DNA methylationpatterns after transplantation. While H19 demethylation andIgf2r methylation were maintained in tumors developed fromDMR clones, KMSO clone 3 showed slight demethylation in
FIG. 4. Characterization of clones. A) Growth curves of clones on MEFs.B) Adhesive properties of the clones. Aliquots of 1 3 105 cells were platedin a 12-well plate, and the cells were recovered by trypsin 2 days afterplating in two experiments (n¼ 8). C) Flow cytometric analyses of surfacemarker antigens. Black lines indicate controls. D) Karyotype of the clones.At least 30 cells were counted for each cell type.
MORIMOTO ET AL.
6 Article 148
Dow
nloaded from w
ww
.biolreprod.org.

Igf2r (Fig. 6F), suggesting that DNA methylation pattern wasnot necessarily consistent with the original clones. H19 andIgf2r mRNA expression was confirmed by RT-PCR (Fig. 6G).
DISCUSSION
The collaboration of several oncogenes is generally requiredto transform primary somatic cells. However, very little is known
about the mechanism of GCT formation. Although somecandidate genes are discovered from human GCT studies [1,2], a lack of an in vitro transformation system has made it difficultto study the mechanism of this process. Ideally, a pure populationof SSCs would be useful for such studies because they proliferateindefinitely and can be genetically manipulated. Unfortunately,however, because SSC-specific markers have not been identi-fied, it is impossible to distinguish them from committed
FIG. 5. Epigenetic properties of clones. A) DNA methylation status of the 50-flanking region of the Pou5f1 gene. Left) A summary of the DNA methylationstatus. Right) COBRA. Proximal enhancer shows higher level of methylation in all DMR clones and in a Nanog-negative KMSO clone. B) DNAmethylation status of the differentially methylated regions of imprinted genes by COBRA. Both DMR- (top) and KMSO- (bottom) transfected clonesunderwent demethylation in H19 and Meg3 and methylation in Igf2r and Peg10. Open arrowheads indicate the sizes of the methylated DNA fragments.Closed arrowheads indicate the sizes of the unmethylated DNA fragments. PCR products were digested with the indicated enzymes. The percentmethylation is shown below the gels. U, uncleaved; C, cleaved.
TESTIS CELL TRANSFORMATION
7 Article 148
Dow
nloaded from w
ww
.biolreprod.org.
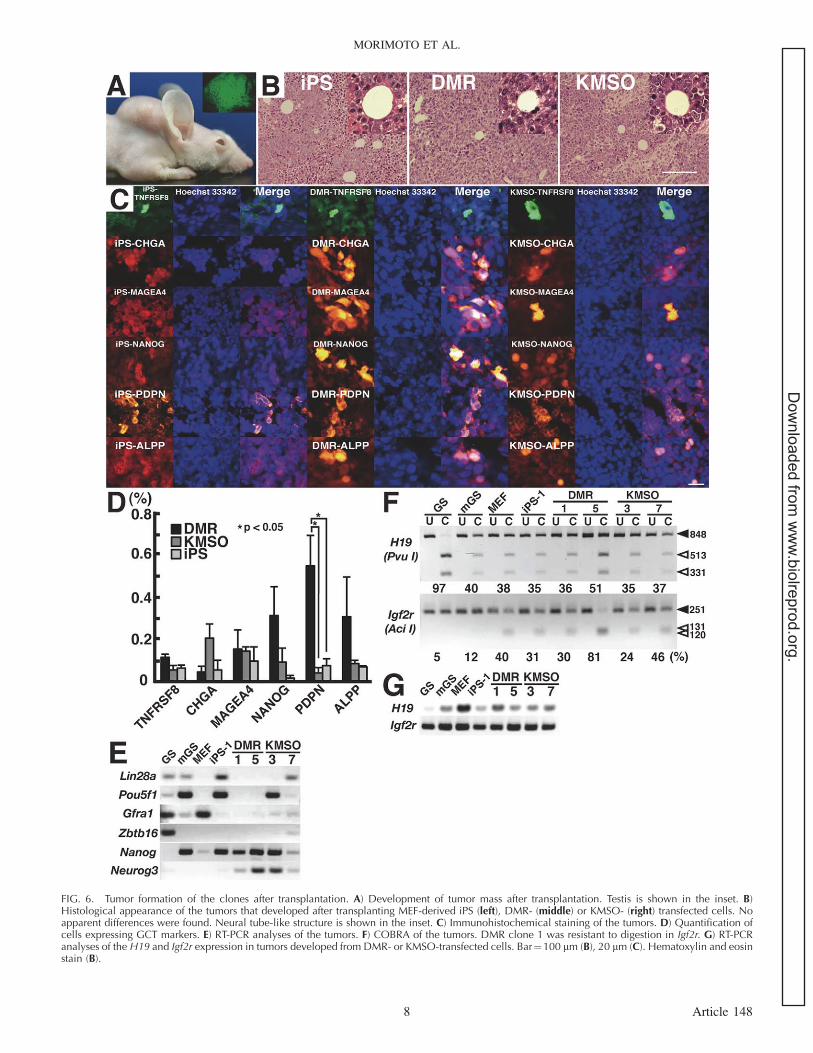
FIG. 6. Tumor formation of the clones after transplantation. A) Development of tumor mass after transplantation. Testis is shown in the inset. B)Histological appearance of the tumors that developed after transplanting MEF-derived iPS (left), DMR- (middle) or KMSO- (right) transfected cells. Noapparent differences were found. Neural tube-like structure is shown in the inset. C) Immunohistochemical staining of the tumors. D) Quantification ofcells expressing GCT markers. E) RT-PCR analyses of the tumors. F) COBRA of the tumors. DMR clone 1 was resistant to digestion in Igf2r. G) RT-PCRanalyses of the H19 and Igf2r expression in tumors developed from DMR- or KMSO-transfected cells. Bar¼100 lm (B), 20 lm (C). Hematoxylin and eosinstain (B).
MORIMOTO ET AL.
8 Article 148
Dow
nloaded from w
ww
.biolreprod.org.
progenitors or somatic cells by currently available methods. Inthis study, we took advantage of CD9 expression on SSCs,allowing us to collect an enriched population of SSCs. Althoughthis molecule is also expressed on committed progenitors andsomatic cells, tumors expressing GCT markers were successfullygenerated following lentivirus-mediated oncogene transfer intoCD9-expressing testis cells. Therefore, this system provides anew method to study GCT formation in vitro.
We previously reported that lentivirus-mediated transfectionof Hras1V12 or cotransfection of Ccnd2 and Ccne1 into GScells induces seminomatous tumors. Although these tumorswere reminiscent of those developed in GDNF transgenic mice,they developed only after transfected cells were transplantedinto the seminiferous tubules [8]. In fact, it is still under debatewhether the GDNF-induced tumors in mice resemble morespermatocytic seminomas in humans, in which Hras1 muta-tions can be found [23, 24]. To set up an in vitro system forGCTs generation, several genes were transfected usinglentivirus vectors, which showed efficient transduction of GScells [8]. Mixed GCTs were formed when either DMR orKMSO genes were cotransfected into CD9-expressing testiscells. DMR genes are commonly used to transform primarysomatic cells [13]. Similar tumors were also produced whenKMSO genes, which can ‘‘reprogram’’ somatic cells intopluripotent stem cells, were transfected. These colonies weremost likely developed from SSCs or undifferentiated sper-matogonia because the number of colonies was consistentlyfewer when we transfected W testes or EPCAM-expressingcells that were reduced in SSC concentrations. These resultssuggest that germ cells are vulnerable to the same transforma-tion protocol as somatic cells.
One of the important observations after DMR transforma-tion was the dramatic changes in cell phenotype. Thetransfected clones showed wide variations in their colonymorphology and marker expression. In addition, because someof the clones resembled ES cells, we initially thought that theyhad become pluripotent. Although they lost expression ofseveral spermatogonial markers, such as Ddx4 or Zbtb16, allthe clones did not express Pou5f1, which is expressed not onlyin ES cells but also in iPS cells [17]. Moreover, they lackedNanog, a critical regulator of pluripotency. These resultssuggested that DMR transfection does not induce bona fidepluripotent cells. Similarly, although KMSO clones resembledES cells and some expressed Nanog, even these cells retainedthe spermatogonial markers and expressed CD44, which is notexpressed in ES cells [25]. CD44 is expressed in bothseminomas and nonseminomas, including teratomas or semi-nomas from Ras-GS cells [8, 26]. Therefore, the transformedcells only partially resembled ES cells or GCTs beforetransplantation.
In addition to the phenotypic differences, we noted thatDMR-transfected cells had abnormal karyotypes, while themajority of KMSO-transfected cells remained euploid. Thiswas in contrast to Ras-GS cells, which retained normalchromosome number and reinitiated spermatogenesis afterculture [8]. Although we currently do not know how thekaryotype abnormality was caused by transfection, it is likelythat Trp53 inhibition may have played a primary role, as Trp53is involved in chromosome stability [27]. This notion issupported by the recent observation that producing iPS cells byTrp53 inhibition leads to severe karyotype abnormalities [28].It also should be noted here that human GCTs are characterizedby peri-triploid DNA content, which is similarly found inGDNF-induced tumors [23]. However, the mechanism oftriploidization is not known. Because we did not check theploidity of the tumors in the current study, we do not know the
impact of the transgenes in vivo on triploidization. However,generation of GCTs with seminoma markers from diploidKMSO-transfected cells suggests that ploidity may notnecessarily influence tumor marker expression. In this context,analyses of GCTs in this study may be useful because it mayprovide a clue to understand the relationship betweenkaryotype changes and tumor phenotype.
Despite the difference in karyotype, DMR- and KMSO-transfected cells underwent demethylation in H19 and Meg3genes and methylation in Igf2r and Peg10 genes. AlthoughRas-GS cells did not show such abnormal DNA methylation,we previously noted a similar change when GS cells wereconverted into mGS cells [9]. These results suggest thatconversion into pluripotent cells and testis cell transformationare accompanied by similar epigenetic changes in imprintedgenes. Interestingly, we also found aberrant DNA methylationin Meg3 in one of the MEF-derived iPS clones, suggestingthat other imprinted genes are also affected during reprogram-ming. GCTs generally show low levels of H19 methylation,and their level of expression is dependent on the differenti-ation lineage and maturation stage [29]. While spermatocyticseminomas show H19 hypermethylation and complete de-methylation of Igf2r, seminomas and nonseminomas showbiallelic expression of the H19 gene [30]. Interestingly,biallelic expression of H19 continues even in well-differenti-ated tissues [30].
It is generally accepted that human GCTs are representativeof PGCs from which they originate [29], as these epigeneticchanges are reminiscent of those found in PGCs. This isclearly demonstrated by patients with various forms ofdisorders of sex development. Although we cannot totallyexclude the possibility that differences in DNA methylationpatterns influenced growth rate and led to selection of biasedcell type, our results suggest that dynamic changes in DNAmethylation can occur after transformation, which raises thepossibility that some GCTs may develop from postnatal germcells and that they undergo H19 demethylation as a result oftransformation. The mechanism of GCT development maydiffer between species, as we did not observe Pou5f1expression in our transfected cells, which is observed in allcases of human GCTs [31]. Such distinct phenotype of GCTsmay be caused, in part, by the difference in the geneexpression patterns in PGCs. For example, while Sox2 is notexpressed in human PGCs, it is expressed in mouse PGCs [32].Despite its absence, many Sox2 target genes are expressed inhuman PGCs [33], and such difference in Sox2 or otherpluripotency-associated genes may contribute to the differentmode and onset of GCT production. Nevertheless, very little isknown about the difference between mouse and human germcells, and the possibility of postnatal GCT origin needs to beevaluated in future experiments.
The transplantation experiments revealed that the type oftransfected gene has little impact on differentiation patterns.We speculate that the discrepancy between molecularcharacteristics in vitro and their GCT morphology in vivomay be caused by hypoxia in tumors. It is known that oxygenpressure in solid tumors is generally lower and that thiscauses heterogeneity of tumor tissues and dedifferentiation insome cases [34]. Interestingly, unlike ES cells, DMR- andKMSO-transfected cells did not differentiate into matureteratomas. We instead found mixed GCTs that containedpredominantly neuroendocrine tissues. Biased differentiationis known to occur in testicular teratomas, and neural tissuesare found in virtually all cases of spontaneous teratomas inmice [35]. However, this biased differentiation does notappear to reflect their germ cell origin because we observed
TESTIS CELL TRANSFORMATION
9 Article 148
Dow
nloaded from w
ww
.biolreprod.org.

similar tumors after transplanting MEF-derived iPS cells. Thisis in contrast to results with iPS cells produced by retrovirusor lentivirus with inducible promoters. As previously pointedout, histology of iPS-derived tumors is influenced by thepromoter in the virus [36]. Viral promoters are generallysuppressed in iPS/ES cells, which allow for their differenti-ation by suppressing the expression of exogenous reprogram-ming factor [17]. However, constitutive strong expression oftransgenes by the internal elongation factor promoter mayhave limited differentiation into diverse tissue types in ourstudy. It will be important to test other promoters to examinewhether they can influence the developmental potential ofthese transfectants.
Another unexpected observation was that GCT formationwas successful only with freshly isolated testis cells but notwith GS cells. We originally used GS cells because Ras-GScells transformed into seminomatous tumors in vivo [8]. Inaddition, GS cells convert into mGS cells, which can produceteratomas. Therefore, we had good reason to believe that theywould provide an attractive target for GCT studies. There are atleast two possibilities. One is that SSCs may be comprised ofdifferent subclasses. SSCs are functionally defined by theirability to produce germ cell colonies in vivo, but some SSCsmay have more primitive or undifferentiated characteristics. GScells may have been derived from a particular subclass of SSCsthat are resistant to oncogenic insults. Alternatively, GS cellsmay have undergone aging after repeated in vitro passages andbecome more resistant to transformation. Because we cannotcompletely exclude the possibility that committed spermato-gonia progenitors or somatic cells converted into tumors withGCT markers, further investigation of this issue is alsoimportant in future studies.
A number of genes exhibit abnormal expression in humanGCTs, but the lack of an assay system for in vitrotransformation prevented detailed functional analyses. Gener-ating a variety of GCT tumors from in vitro dissociated testiscells will be a useful strategy to understand GCT pathogenesis.Candidate genes can now be routinely tested using a similarapproach. Very little is known about the relationship betweendifferent types of GCTs, including the origin and sequence ofevents that leads to GCTs with variable characteristics. Thedevelopment of an in vitro transformation assay will also beuseful for understanding the mechanism of reprogramming andits relationship with GCTs.
ACKNOWLEDGMENT
We thank Ms. Y. Ogata for technical assistance.
REFERENCES
1. Oosterhuis JW, Looijenga LH. Testicular germ-cell tumours in a broaderperspective. Nat Rev Cancer 2005; 5:210–222.
2. Gilbert D, Rapley E, Shipley J. Testicular germ cell tumours:predisposition genes and the male germ cell niche. Nat Rev Cancer2011; 11:278–288.
3. Stevens LC. Origin of testicular teratomas from primordial germ cells inmice. J Natl Cancer Inst 1967; 38:549–552.
4. Meng X, Lindahl M, Hyvonen ME, Parvinen M, de Rooij DG, Hess MW,Raatikainen-Ahokas A, Sainio K, Rauvala H, Lakso M, Pichel JG,Westphal H, et al. Regulation of cell fate decision of undifferentiatedspermatogonia by GDNF. Science 2000; 287:1489–1493.
5. de Rooij DG, Russell LD. All you wanted to know about spermatogoniabut were afraid to ask. J Androl 2000; 21:776–798.
6. Meistrich ML, van Beek MEAB. Spermatogonial stem cells. In:Desjardins CC, Ewing LL (eds.), Cell and Molecular Biology of theTestis. New York: Oxford University Press; 1993:266–295.
7. Kanatsu-Shinohara M, Ogonuki N, Inoue K, Miki H, Ogura A, ToyokuniS, Shinohara T. Long-term proliferation in culture and germline
transmission of mouse male germline stem cells. Biol Reprod 2003; 69:612–616.
8. Lee J, Kanatsu-Shinohara M, Morimoto H, Kazuki Y, Takashima S,Oshimura M, Toyokuni S, Shinohara T. Genetic reconstruction of mousespermatogonial stem cell self-renewal in vitro by Ras-cyclin D2 activation.Cell Stem Cell 2009; 5:76–86.
9. Kanatsu-Shinohara M, Inoue K, Lee J, Yoshimoto M, Ogonuki N, Miki H,Baba S, Kato T, Kazuki Y, Toyokuni S, Toyoshima M, Niwa O, et al.Generation of pluripotent stem cells from neonatal mouse testis. Cell 2004;119:1001–1012.
10. Ogawa T, Arechaga JM, Avarbock MR, Brinster RL. Transplantation oftestis germinal cells into mouse seminiferous tubules. Int J Dev Biol 1997;41:111–122.
11. Shinohara T, Avarbock MR, Brinster RL. b1- and a6-integrin are surfacemarkers on mouse spermatogonial stem cells. Proc Natl Acad Sci USA1999; 96:5504–5509.
12. Kanatsu-Shinohara M, Muneto T, Lee J, Takenaka M, Chuma S, NakatsujiN, Horiuchi T, Shinohara T. Long-term culture of male germline stemcells from hamster testes. Biol Reprod 2008; 78:611–617.
13. Weinberg RA. Multistep tumorigenesis. In: Weinberg RA (ed.), TheBiology of Cancer. New York: Garland Science; 2007:399–462.
14. Morimoto H, Kanatsu-Shinohara M, Takashima S, Chuma S, Nakatsuji N,Takehashi M, Shinohara T. Phenotypic plasticity of mouse spermatogonialstem cells. PLoS One 2009; 4:e7909.
15. Shinohara T, Orwig KE, Avarbock MR, Brinster RL. Remodeling of thepostnatal mouse testis is accompanied by dramatic changes in stem cellnumber and niche accessibility. Proc Natl Acad Sci USA 2001; 98:6186–6191.
16. Kanatsu-Shinohara M, Toyokuni S, Shinohara T. CD9 is a surfacemarker on mouse and rat male germline stem cells. Biol Reprod 2004;70:70–75.
17. Takahashi K, Yamanaka S. Induction of pluripotent stem cells from mouseembryonic and adult fibroblasts by defined factors. Cell 2006; 126:663–676.
18. Kanatsu-Shinohara M, Lee J, Inoue K, Ogonuki N, Miki H, Toyokuni S,Ikawa M, Nakamura T, Ogura A, Shinohara T. Pluripotency of a singlespermatogonial stem cell in mice. Biol Reprod 2008; 78:681–687.
19. Kanatsu-Shinohara M, Takashima S, Ishii K, Shinohara T. Dynamicchanges in EPCAM expression during spermatogonial stem celldifferentiation in the mouse testis. PLoS One 2011; 6:e23663.
20. Marhaba R, Klingbeil P, Nuebel T, Nazarenko I, Buechler MW, ZoellerM. CD44 and EpCAM: Cancer-initiating cell markers. Curr Mol Med2008; 8:784–804.
21. Hattori N, Nishino K, Ko YG, Hattori N, Ohgane J, Tanaka S, Shiota K.Epigenetic control of mouse Oct-4 gene expression in embryonic stemcells and trophoblast stem cells. J Biol Chem 2004; 279:17063–17069.
22. Sasaki H, Matsui Y. Epigenetic events in mammalian germ-celldevelopment: reprogramming and beyond. Nat Rev Genet 2008; 9:129–140.
23. Sariola H, Meng X. GDNF-induced seminomatous tumours in mouse-anexperimental model for human seminomas? APMIS 2003; 111:192–196.
24. Goriely A, Hansen RM, Taylor IB, Olesen IA, Jacobsen GK, McGowanSJ, Pfeifer SP, McVean GA, Rajpert-De Meyts E, Wilkie AO. Activatingmutations in FGFR3 and HRAS reveal a shared genetic origin forcongenital disorders and testicular tumors. Nat Genet 2009; 41:1247–1252.
25. Haegel H, Dierich A, Ceredig R. CD44 in differentiated embryonic stemcells: surface expression and transcripts encoding multiple variants. DevImmunol 1994; 3:239–246.
26. Miyake H, Hara I, Yamanaka K, Gohji K, Arakawa S, Kamidono S.Expression patterns of CD44 adhesion molecule in testicular germ celltumors and normal testes. Am J Pathol 1998; 152:1157–1160.
27. Ganem NJ, Storchova Z, Pellman D. Tetraploidy, aneuploidy and cancer.Curr Opin Genet Dev 2007; 7:157–162.
28. Utikal J, Polo JM, Stadtfeld M, Maherali N, Kulalert W, Walsh RM,Khalil A, Rheinwald JG, Hochedlinger K. Immortalization eliminates aroadblock during cellular reprogramming into iPS cells. Nature 2009; 460:1145–1148.
29. Looijenga LH, Verkerk AJ, Dekker MC, van Gurp RJ, Gillis AJ,Oosterhuis JW. Genomic imprinting in testicular germ cell tumours.APMIS 1998; 106:187–197.
30. Verkerk AJ, Ariel I, Dekker MC, Schneider T, van Gurp RJ, de Groot N,Gillis AJ, Oosterhuis JW, Hochberg AA, Looijenga LH. Uniqueexpression patterns of H19 in human testicular cancers of differentetiology. Oncogene 1997; 14:95–107.
MORIMOTO ET AL.
10 Article 148
Dow
nloaded from w
ww
.biolreprod.org.
31. Gidekel S, Pizov G, Bergman Y, Pikarsky E. Oct-3/4 is a dose-dependentoncogenic fate determinant. Cancer Cell 2003; 4:361–370.
32. Sonne SB, Perrett RM, Nielsen JE, Baxter MA, Kristensen DM, Leffers H,Hanley NA, Rajpert-De-Meyts E. Analysis of SOX2 expression indeveloping human testis and germ cell neoplasia. Int J Dev Biol 2010; 54:755–760.
33. Perrett RM, Turnpenny L, Eckert JJ, O’Shea M, Sonne SB, Cameron IT,Wilson DI, Rajpert-De Meyts E, Hanley NA. The early human germ celllineage does not express SOX2 during in vivo development or upon invitro culture. Biol Reprod 2008; 78:852–858.
34. Axelson H, Fredlund E, Ovenberger M, Landberg G, Pahlman S.Hypoxia-induced dedifferentiation of tumor cells—a mechanism behindheterogeneity and aggressiveness of solid tumors. Semin Cell Dev Biol2005; 16:554–563.
35. Stevens LC. Germ cell origin of testicular and ovarian teratomas.Transplant Proc 1984; 16:502–504.
36. Brambrink T, Foreman R, Weistead GG, Lengner CJ, Wernig M, SuhH, Jaenisch R. Sequential expression of pluripotency markers duringdirect reprogramming of mouse somatic cells. Cell Stem Cell 2008; 2:151–159.
TESTIS CELL TRANSFORMATION
11 Article 148
Dow
nloaded from w
ww
.biolreprod.org.
Related Documents