foods Article In Vitro Starch Digestibility and Glycaemic Index of Fried Dough and Batter Enriched with Wheat and Oat Bran Oluwatoyin O. Onipe 1 , Daniso Beswa 2 and Afam I. O. Jideani 1, * 1 Department of Food Science and Technology, School of Agriculture, University of Venda, Thohoyandou 0950, South Africa; [email protected] 2 Department of Biotechnology and Food Technology, Faculty of Science, University of Johannesburg, Doornfontein 2028, South Africa; [email protected] * Correspondence: [email protected] Received: 28 July 2020; Accepted: 3 September 2020; Published: 27 September 2020 Abstract: A deep-fried dough/batter food (magwinya) consumed across different age groups and social strata in South Africa was investigated in this study for digestibility and estimated glycaemic index (eGI). In this research, we investigated the influence of bran type—wheat bran (WB) and oat bran (OB), and concentration (0–20% w/w) on the starch digestibility and eGI of magwinya. Rapidly available glucose (RAG) of control fried dough (60.31 g/100 g) was 33% less than fried batter (90.07 g/100 g). There was a significant reduction in RAG and an increase in slowly available (SAG) and unavailable glucose (UG) content of the fried products with OB and WB addition. The highest SAG content was observed in WB fried dough. Control fried batter had the highest eGI value (80.02) and control fried dough had medium eGI value (58.11). WB fried dough, fried batter, and OB fried dough were categorised as medium GI foods at eGI range of 56.46–58.39, 65.93–68.84 and 56.34–57.27, respectively. The eGI values of OB fried batter ranged from 73.57 to 80.03 and were thus classified as high GI foods. UG showed significant correlation with eGI (r = -0.892, -0.973, p < 0.01) and fat content (r = -0.590, -0.661, p < 0.01) for WB and OB fried products. These results reveal that ingredient modification through bran enrichment is effective for the regulation of starch digestion and reduction of eGI of deep-fried dough/batter foods. Keywords: in vitro assay; glycaemic index; bran; digestible starch; fried dough; magwinya 1. Introduction Starch is the major carbohydrate found in food commodities such as maize, wheat, potato and rice [1]. It is a good source of energy for humans, however, its excessive consumption is of health concern, as it is a predisposing factor to other metabolic-related diseases like obesity, and diabetes—A projected leading cause of death by the year 2030 according to the World Health Organisation [2,3]. Moreover, the ability to predict and regulate postprandial glucose absorption of starchy food is vital to the global epidemic called diabesity [4,5]. Starch digestion (SD) is characterised by the rate and the duration of postprandial glycaemic response. Starch can be undigested, rapidly or slowly digested. Starch granule characteristics, state, size, processing methods and presence of other ingredients all influence SD [6]. Understanding the relationship between the physicochemical and physiological properties of food is a vital way to explain the value of carbohydrate in human nutrition. The glycaemic glucose fraction of food, excluding lactose, is a summation of glucose in its glycaemic carbohydrate fraction [7]. The glucose content of a carbohydrate-rich food is categorised as either rapidly (RAG) or slowly available (SAG) to signify its potential rate of release and absorption or non-absorption for unavailable glucose (UG) [6]. The rate of postprandial glucose release can be described by its in vitro RAG and Foods 2020, 9, 1374; doi:10.3390/foods9101374 www.mdpi.com/journal/foods

Welcome message from author
This document is posted to help you gain knowledge. Please leave a comment to let me know what you think about it! Share it to your friends and learn new things together.
Transcript
foods
Article
In Vitro Starch Digestibility and Glycaemic Index ofFried Dough and Batter Enriched with Wheat andOat Bran
Oluwatoyin O. Onipe 1 , Daniso Beswa 2 and Afam I. O. Jideani 1,*1 Department of Food Science and Technology, School of Agriculture, University of Venda, Thohoyandou 0950,
South Africa; [email protected] Department of Biotechnology and Food Technology, Faculty of Science, University of Johannesburg,
Doornfontein 2028, South Africa; [email protected]* Correspondence: [email protected]
Received: 28 July 2020; Accepted: 3 September 2020; Published: 27 September 2020�����������������
Abstract: A deep-fried dough/batter food (magwinya) consumed across different age groups and socialstrata in South Africa was investigated in this study for digestibility and estimated glycaemic index(eGI). In this research, we investigated the influence of bran type—wheat bran (WB) and oat bran (OB),and concentration (0–20% w/w) on the starch digestibility and eGI of magwinya. Rapidly availableglucose (RAG) of control fried dough (60.31 g/100 g) was 33% less than fried batter (90.07 g/100 g).There was a significant reduction in RAG and an increase in slowly available (SAG) and unavailableglucose (UG) content of the fried products with OB and WB addition. The highest SAG contentwas observed in WB fried dough. Control fried batter had the highest eGI value (80.02) and controlfried dough had medium eGI value (58.11). WB fried dough, fried batter, and OB fried dough werecategorised as medium GI foods at eGI range of 56.46–58.39, 65.93–68.84 and 56.34–57.27, respectively.The eGI values of OB fried batter ranged from 73.57 to 80.03 and were thus classified as high GI foods.UG showed significant correlation with eGI (r = −0.892, −0.973, p < 0.01) and fat content (r = −0.590,−0.661, p < 0.01) for WB and OB fried products. These results reveal that ingredient modificationthrough bran enrichment is effective for the regulation of starch digestion and reduction of eGI ofdeep-fried dough/batter foods.
Keywords: in vitro assay; glycaemic index; bran; digestible starch; fried dough; magwinya
1. Introduction
Starch is the major carbohydrate found in food commodities such as maize, wheat, potato andrice [1]. It is a good source of energy for humans, however, its excessive consumption is of health concern,as it is a predisposing factor to other metabolic-related diseases like obesity, and diabetes—A projectedleading cause of death by the year 2030 according to the World Health Organisation [2,3]. Moreover,the ability to predict and regulate postprandial glucose absorption of starchy food is vital to the globalepidemic called diabesity [4,5]. Starch digestion (SD) is characterised by the rate and the duration ofpostprandial glycaemic response. Starch can be undigested, rapidly or slowly digested. Starch granulecharacteristics, state, size, processing methods and presence of other ingredients all influence SD [6].
Understanding the relationship between the physicochemical and physiological properties offood is a vital way to explain the value of carbohydrate in human nutrition. The glycaemic glucosefraction of food, excluding lactose, is a summation of glucose in its glycaemic carbohydrate fraction [7].The glucose content of a carbohydrate-rich food is categorised as either rapidly (RAG) or slowlyavailable (SAG) to signify its potential rate of release and absorption or non-absorption for unavailableglucose (UG) [6]. The rate of postprandial glucose release can be described by its in vitro RAG and
Foods 2020, 9, 1374; doi:10.3390/foods9101374 www.mdpi.com/journal/foods
Foods 2020, 9, 1374 2 of 12
SAG values which are the main determinants of the glycaemic index of cereal-based foods [6,7].Glycaemic index (GI) classifies carbohydrate foods based on how they influence postprandial plasmaglucose response [8]. GI is expressed as the percentage increase in the glucose area under the curve of atest food against a standard food such as glucose or white bread [7,9]. GI is usually measured in vivo,however, because of the time and resources required, in vitro methods have been adopted over theyears as a relevant nutromic analysis tool to measure the rate of hydrolysis and assess the glycaemicindex of foods [9,10].
Factors that affect starch digestibility include starch characteristics, enzyme inhibitors,amylose/amylopectin ratio, particle size of starch granule, processing method, starch gelatinisation,retrogradation and presence of other ingredients such as lipids, proteins and fibre [4,6,11,12].Previous studies present persuasive evidence that certain dietary fibres noticeably reduced GI offoods, although the magnitude of GI reduction is dependent on the food type and processinginvolved [13,14]. Wheat (WB) and oat bran (OB) are cheap, easily accessible, fibre-rich food additiveswhich, when incorporated into starchy foods, may reduce their GI. The in vitro hypoglycaemic effectsof WB and OB include an increase in slowly digestible starch (SDS) and resistant starch (RS) contentsof foods [15–18]. The resistance of dietary fibres to amylolytic enzymes in the small intestine results intheir transformation to short-chain fatty acids in the colon. These processes result in physiologicalbenefits such as blood glucose regulation, laxative and prebiotic properties [14,19].
Magwinya is a deep-fried product made from wheat flour, sugar, salt and water. It can becategorised as fried dough or batter based on the preferences of the consumers [20]. It is popularlyconsumed by people of various age groups in sub-Saharan Africa [20] and can be categorised as ahigh-carbohydrate and food because of its major ingredient–refined wheat flour. Owing to its prevalentconsumption as the main meal amongst low-income population [20], it is essential to improve itsnutritional quality. To the best of our knowledge, in vitro starch digestion and GI of magwinya hasnot been reported. Therefore, the objectives of this paper are: (i) to quantify available glucose anddigestible starch fractions of magwinya via in vitro assay; (ii) to assess the effect of bran concentrationand initial moisture content on available glucose and digestible starch content of magwinya; and (iii) tocalculate the estimated glycaemic index of magwinya.
2. Materials and Methods
2.1. Materials
Wheat flour (carbohydrates—71%, protein—10%, moisture—12%, fibre—4%, fat—1%) wheatbran (carbohydrates—22%, protein—16%, moisture—11%, fibre—43%, fat—5%), oat bran(carbohydrate—50%, protein—13%, moisture—7% fibre—20%, fat—5%,), sucrose (Selati, RCL Foods),salt, instant yeast (Anchor Yeast), sunflower oil (Spar) sourced locally in South Africa wereused for the production of fried products. Wheat and oat bran were milled to 200 µm particlesize using an ultra-centrifugal mill (Retsch ZM 200, Haan Germany) and were stored at –20 ◦Cuntil used for magwinya production. Guar gum (G4129), amyloglucosidase (A7095–260 U/mL),pepsin (P7000–250 U/mL), invertase (I4504–300 U/mg) and pancreatin (P7545–8 x USP specification),sulfuric acid (25810-5), glucose oxidase peroxidase kit (GAGO 20) for in-vitro digestion assays weresourced from Sigma–Aldrich, (St Louis, MO, USA). Potassium hydroxide, acetic acid, hydrochloric acidand other chemicals used were of analytical grade.
2.2. Production of Fried Products (Magwinya)
Fried products were processed using the method of Onipe et al. [21]. Wheat flour was partiallysubstituted with 1, 5, 8, 10, 15 and 20% (w/w), respectively, of wheat and oat bran. All dry ingredientswere weighed as follows: composite flour (100 g), sugar (15 g), salt (1 g), yeast (1 g), into a mixingbowl at ambient temperature (24 ◦C). Lukewarm water (65 mL and 100 mL) was added graduallyuntil all ingredients were homogenously mixed to form a dough and batter, respectively. The dough
Foods 2020, 9, 1374 3 of 12
was kneaded for 10 min in a mixer (Russell Hobbs RHSB237, Failsworth, UK) and cut into a 50-gmass and formed into a ball. The dough and batter were proofed at 30 ◦C in a T7 bread proofer (withtemperature control limit of 46 ◦C and 95% humidity) and fried at 180 ◦C for 5 min in a deep fryer(Russell Hobbs RDF300, Failsworth, UK) with built-in automatic temperature and time control system.Oil was pre-heated for 1 h before frying.
2.3. Sample Preparation for Starch Digestion
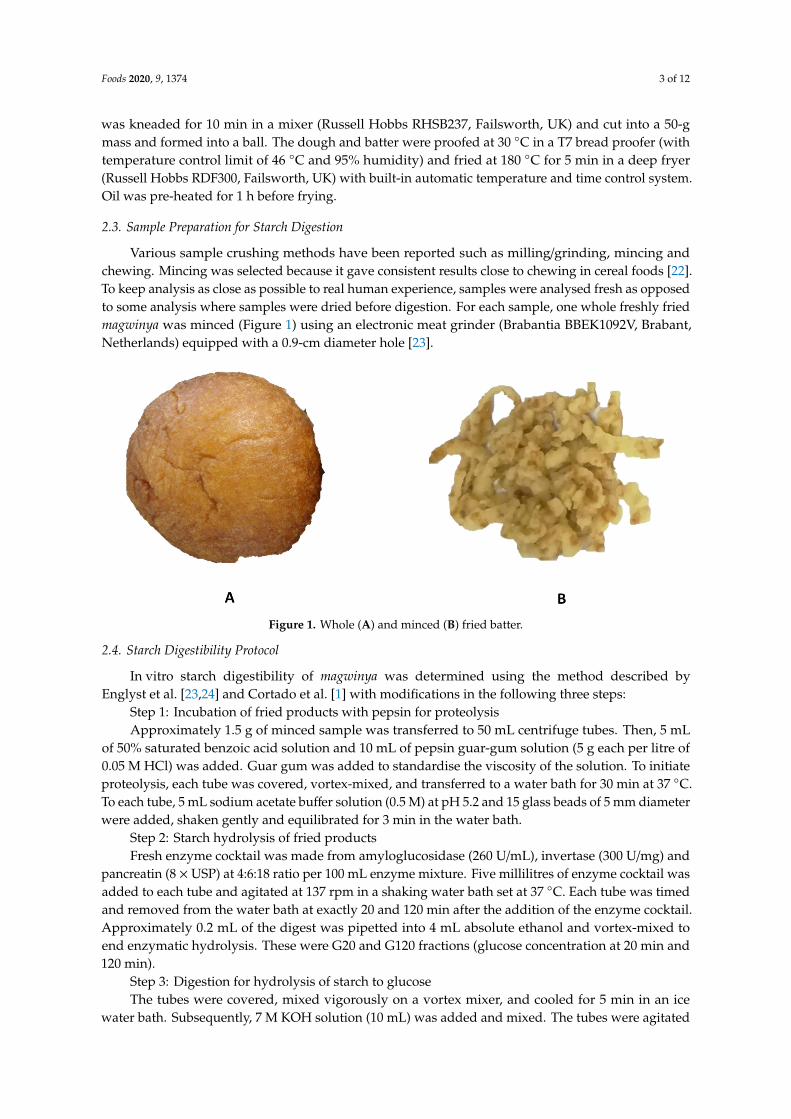
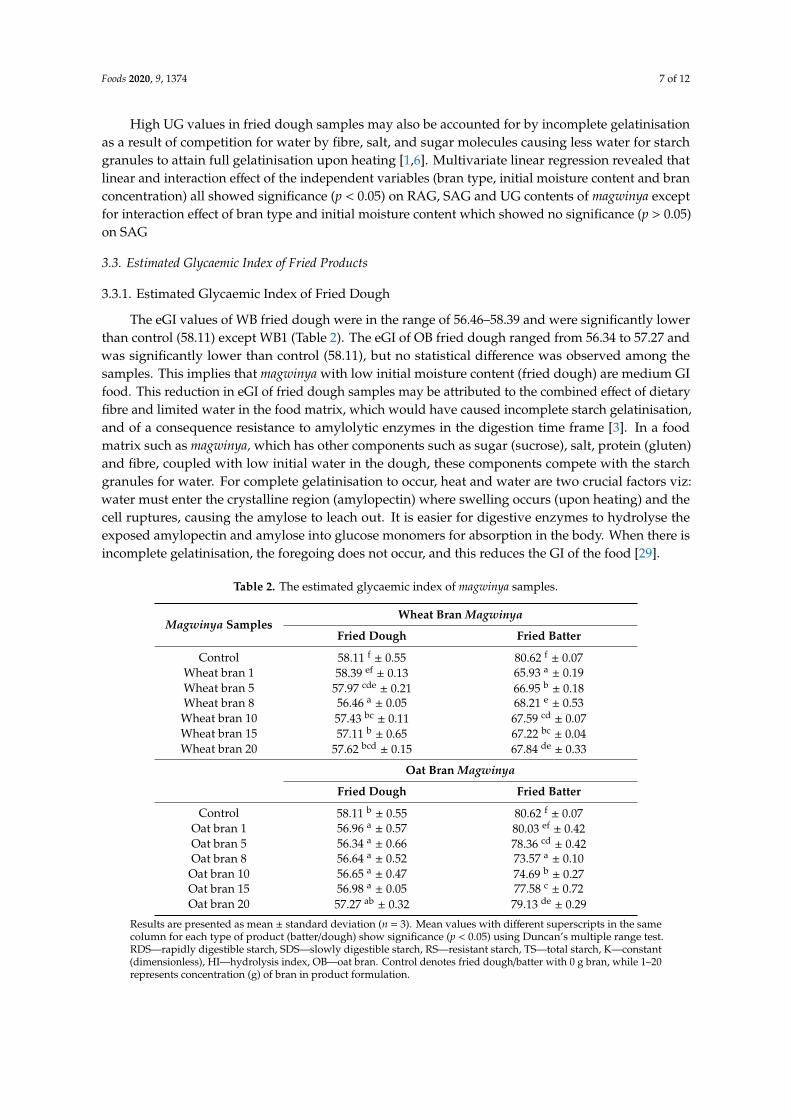
Various sample crushing methods have been reported such as milling/grinding, mincing andchewing. Mincing was selected because it gave consistent results close to chewing in cereal foods [22].To keep analysis as close as possible to real human experience, samples were analysed fresh as opposedto some analysis where samples were dried before digestion. For each sample, one whole freshly friedmagwinya was minced (Figure 1) using an electronic meat grinder (Brabantia BBEK1092V, Brabant,Netherlands) equipped with a 0.9-cm diameter hole [23].
Foods 2020, 9, x FOR PEER REVIEW 3 of 13
was kneaded for 10 min in a mixer (Russell Hobbs RHSB237, Failsworth, UK) and cut into a 50-g mass and formed into a ball. The dough and batter were proofed at 30 °C in a T7 bread proofer (with temperature control limit of 46 °C and 95% humidity) and fried at 180 °C for 5 min in a deep fryer (Russell Hobbs RDF300, Failsworth, UK) with built-in automatic temperature and time control system. Oil was pre-heated for 1 h before frying.
2.3. Sample Preparation for Starch Digestion
Various sample crushing methods have been reported such as milling/grinding, mincing and chewing. Mincing was selected because it gave consistent results close to chewing in cereal foods [22]. To keep analysis as close as possible to real human experience, samples were analysed fresh as opposed to some analysis where samples were dried before digestion. For each sample, one whole freshly fried magwinya was minced (Figure 1) using an electronic meat grinder (Brabantia BBEK1092V, Brabant, Netherlands) equipped with a 0.9-cm diameter hole [23].
Figure 1. Whole (A) and minced (B) fried batter.
2.4. Starch Digestibility Protocol
In vitro starch digestibility of magwinya was determined using the method described by Englyst et al. [23,24] and Cortado et al. [1] with modifications in the following three steps:
Step 1: Incubation of fried products with pepsin for proteolysis Approximately 1.5 g of minced sample was transferred to 50 mL centrifuge tubes. Then, 5 mL of
50% saturated benzoic acid solution and 10 mL of pepsin guar-gum solution (5 g each per litre of 0.05 M HCl) was added. Guar gum was added to standardise the viscosity of the solution. To initiate proteolysis, each tube was covered, vortex-mixed, and transferred to a water bath for 30 min at 37 °C. To each tube, 5 mL sodium acetate buffer solution (0.5 M) at pH 5.2 and 15 glass beads of 5 mm diameter were added, shaken gently and equilibrated for 3 min in the water bath.
Step 2: Starch hydrolysis of fried products Fresh enzyme cocktail was made from amyloglucosidase (260 U/mL), invertase (300 U/mg) and
pancreatin (8 × USP) at 4:6:18 ratio per 100 mL enzyme mixture. Five millilitres of enzyme cocktail was added to each tube and agitated at 137 rpm in a shaking water bath set at 37 °C. Each tube was timed and removed from the water bath at exactly 20 and 120 min after the addition of the enzyme cocktail. Approximately 0.2 mL of the digest was pipetted into 4 mL absolute ethanol and vortex-mixed to end enzymatic hydrolysis. These were G20 and G120 fractions (glucose concentration at 20 min and 120 min).
Step 3: Digestion for hydrolysis of starch to glucose The tubes were covered, mixed vigorously on a vortex mixer, and cooled for 5 min in an ice
water bath. Subsequently, 7 M KOH solution (10 mL) was added and mixed. The tubes were agitated horizontally for 30 min in an ice water bath. A 0.2-mL portion of the content was pipetted into 1 mL
Figure 1. Whole (A) and minced (B) fried batter.
2.4. Starch Digestibility Protocol
In vitro starch digestibility of magwinya was determined using the method described byEnglyst et al. [23,24] and Cortado et al. [1] with modifications in the following three steps:
Step 1: Incubation of fried products with pepsin for proteolysisApproximately 1.5 g of minced sample was transferred to 50 mL centrifuge tubes. Then, 5 mL
of 50% saturated benzoic acid solution and 10 mL of pepsin guar-gum solution (5 g each per litre of0.05 M HCl) was added. Guar gum was added to standardise the viscosity of the solution. To initiateproteolysis, each tube was covered, vortex-mixed, and transferred to a water bath for 30 min at 37 ◦C.To each tube, 5 mL sodium acetate buffer solution (0.5 M) at pH 5.2 and 15 glass beads of 5 mm diameterwere added, shaken gently and equilibrated for 3 min in the water bath.
Step 2: Starch hydrolysis of fried productsFresh enzyme cocktail was made from amyloglucosidase (260 U/mL), invertase (300 U/mg) and
pancreatin (8 × USP) at 4:6:18 ratio per 100 mL enzyme mixture. Five millilitres of enzyme cocktail wasadded to each tube and agitated at 137 rpm in a shaking water bath set at 37 ◦C. Each tube was timedand removed from the water bath at exactly 20 and 120 min after the addition of the enzyme cocktail.Approximately 0.2 mL of the digest was pipetted into 4 mL absolute ethanol and vortex-mixed toend enzymatic hydrolysis. These were G20 and G120 fractions (glucose concentration at 20 min and120 min).
Step 3: Digestion for hydrolysis of starch to glucoseThe tubes were covered, mixed vigorously on a vortex mixer, and cooled for 5 min in an ice
water bath. Subsequently, 7 M KOH solution (10 mL) was added and mixed. The tubes were agitated
Foods 2020, 9, 1374 4 of 12
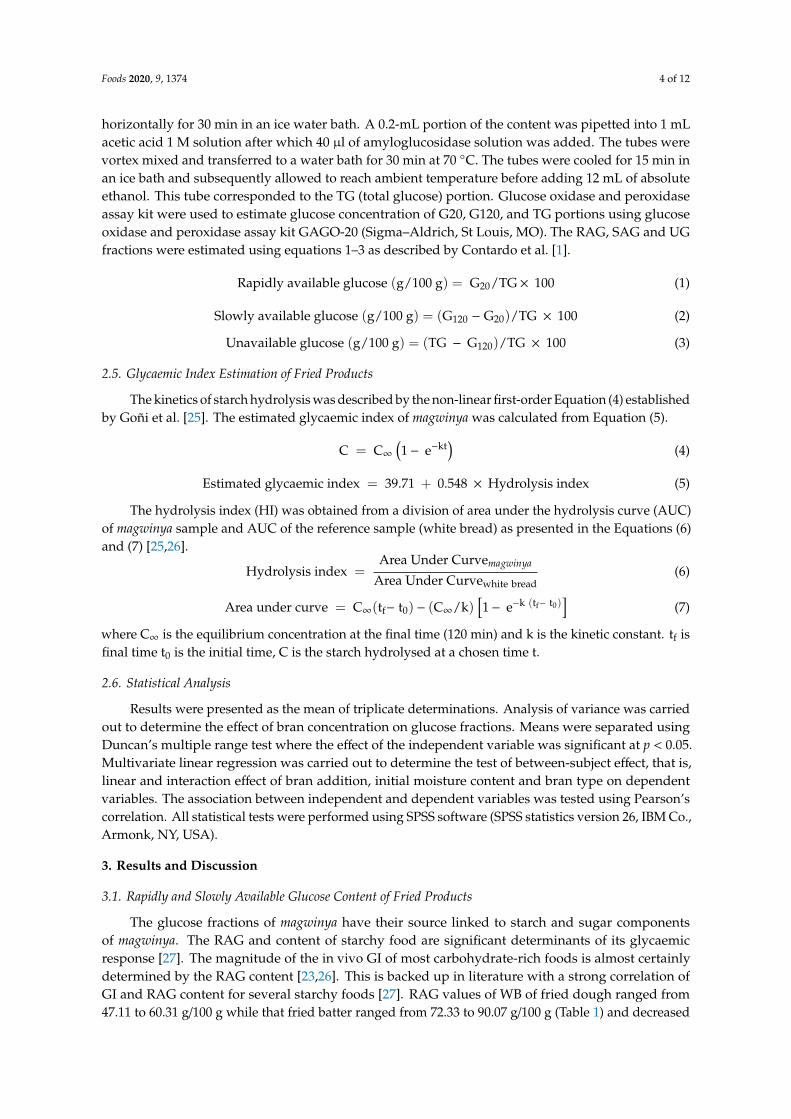
horizontally for 30 min in an ice water bath. A 0.2-mL portion of the content was pipetted into 1 mLacetic acid 1 M solution after which 40 µl of amyloglucosidase solution was added. The tubes werevortex mixed and transferred to a water bath for 30 min at 70 ◦C. The tubes were cooled for 15 min inan ice bath and subsequently allowed to reach ambient temperature before adding 12 mL of absoluteethanol. This tube corresponded to the TG (total glucose) portion. Glucose oxidase and peroxidaseassay kit were used to estimate glucose concentration of G20, G120, and TG portions using glucoseoxidase and peroxidase assay kit GAGO-20 (Sigma–Aldrich, St Louis, MO). The RAG, SAG and UGfractions were estimated using equations 1–3 as described by Contardo et al. [1].
Rapidly available glucose (g/100 g) = G20/TG× 100 (1)
Slowly available glucose (g/100 g) = (G120 − G20)/TG × 100 (2)
Unavailable glucose (g/100 g) = (TG − G120)/TG × 100 (3)
2.5. Glycaemic Index Estimation of Fried Products
The kinetics of starch hydrolysis was described by the non-linear first-order Equation (4) establishedby Goñi et al. [25]. The estimated glycaemic index of magwinya was calculated from Equation (5).
C = C∞(1− e−kt
)(4)
Estimated glycaemic index = 39.71 + 0.548 × Hydrolysis index (5)
The hydrolysis index (HI) was obtained from a division of area under the hydrolysis curve (AUC)of magwinya sample and AUC of the reference sample (white bread) as presented in the Equations (6)and (7) [25,26].
Hydrolysis index =Area Under Curvemagwinya
Area Under Curvewhite bread(6)
Area under curve = C∞(tf− t0) − (C∞/k)[1− e−k (tf− t0)
](7)
where C∞ is the equilibrium concentration at the final time (120 min) and k is the kinetic constant. tf isfinal time t0 is the initial time, C is the starch hydrolysed at a chosen time t.
2.6. Statistical Analysis
Results were presented as the mean of triplicate determinations. Analysis of variance was carriedout to determine the effect of bran concentration on glucose fractions. Means were separated usingDuncan’s multiple range test where the effect of the independent variable was significant at p < 0.05.Multivariate linear regression was carried out to determine the test of between-subject effect, that is,linear and interaction effect of bran addition, initial moisture content and bran type on dependentvariables. The association between independent and dependent variables was tested using Pearson’scorrelation. All statistical tests were performed using SPSS software (SPSS statistics version 26, IBM Co.,Armonk, NY, USA).
3. Results and Discussion
3.1. Rapidly and Slowly Available Glucose Content of Fried Products
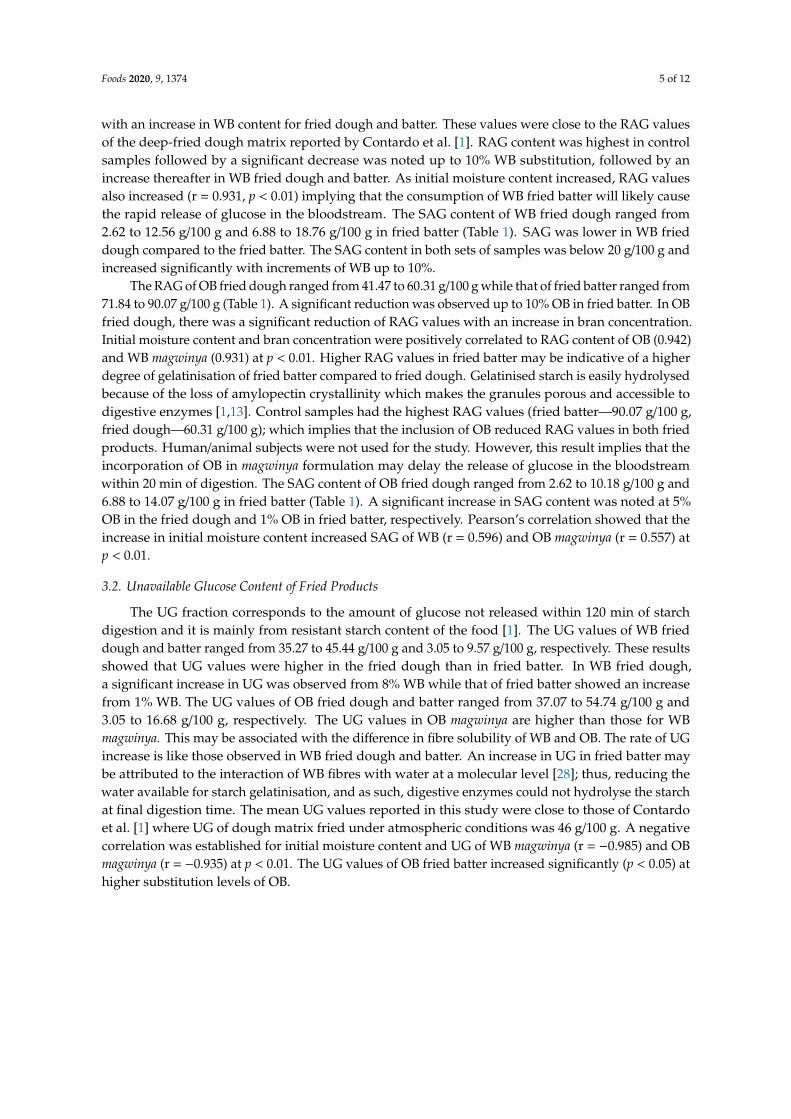
The glucose fractions of magwinya have their source linked to starch and sugar componentsof magwinya. The RAG and content of starchy food are significant determinants of its glycaemicresponse [27]. The magnitude of the in vivo GI of most carbohydrate-rich foods is almost certainlydetermined by the RAG content [23,26]. This is backed up in literature with a strong correlation ofGI and RAG content for several starchy foods [27]. RAG values of WB of fried dough ranged from47.11 to 60.31 g/100 g while that fried batter ranged from 72.33 to 90.07 g/100 g (Table 1) and decreased
Foods 2020, 9, 1374 5 of 12
with an increase in WB content for fried dough and batter. These values were close to the RAG valuesof the deep-fried dough matrix reported by Contardo et al. [1]. RAG content was highest in controlsamples followed by a significant decrease was noted up to 10% WB substitution, followed by anincrease thereafter in WB fried dough and batter. As initial moisture content increased, RAG valuesalso increased (r = 0.931, p < 0.01) implying that the consumption of WB fried batter will likely causethe rapid release of glucose in the bloodstream. The SAG content of WB fried dough ranged from2.62 to 12.56 g/100 g and 6.88 to 18.76 g/100 g in fried batter (Table 1). SAG was lower in WB frieddough compared to the fried batter. The SAG content in both sets of samples was below 20 g/100 g andincreased significantly with increments of WB up to 10%.
The RAG of OB fried dough ranged from 41.47 to 60.31 g/100 g while that of fried batter ranged from71.84 to 90.07 g/100 g (Table 1). A significant reduction was observed up to 10% OB in fried batter. In OBfried dough, there was a significant reduction of RAG values with an increase in bran concentration.Initial moisture content and bran concentration were positively correlated to RAG content of OB (0.942)and WB magwinya (0.931) at p < 0.01. Higher RAG values in fried batter may be indicative of a higherdegree of gelatinisation of fried batter compared to fried dough. Gelatinised starch is easily hydrolysedbecause of the loss of amylopectin crystallinity which makes the granules porous and accessible todigestive enzymes [1,13]. Control samples had the highest RAG values (fried batter—90.07 g/100 g,fried dough—60.31 g/100 g); which implies that the inclusion of OB reduced RAG values in both friedproducts. Human/animal subjects were not used for the study. However, this result implies that theincorporation of OB in magwinya formulation may delay the release of glucose in the bloodstreamwithin 20 min of digestion. The SAG content of OB fried dough ranged from 2.62 to 10.18 g/100 g and6.88 to 14.07 g/100 g in fried batter (Table 1). A significant increase in SAG content was noted at 5%OB in the fried dough and 1% OB in fried batter, respectively. Pearson’s correlation showed that theincrease in initial moisture content increased SAG of WB (r = 0.596) and OB magwinya (r = 0.557) atp < 0.01.
3.2. Unavailable Glucose Content of Fried Products
The UG fraction corresponds to the amount of glucose not released within 120 min of starchdigestion and it is mainly from resistant starch content of the food [1]. The UG values of WB frieddough and batter ranged from 35.27 to 45.44 g/100 g and 3.05 to 9.57 g/100 g, respectively. These resultsshowed that UG values were higher in the fried dough than in fried batter. In WB fried dough,a significant increase in UG was observed from 8% WB while that of fried batter showed an increasefrom 1% WB. The UG values of OB fried dough and batter ranged from 37.07 to 54.74 g/100 g and3.05 to 16.68 g/100 g, respectively. The UG values in OB magwinya are higher than those for WBmagwinya. This may be associated with the difference in fibre solubility of WB and OB. The rate of UGincrease is like those observed in WB fried dough and batter. An increase in UG in fried batter maybe attributed to the interaction of WB fibres with water at a molecular level [28]; thus, reducing thewater available for starch gelatinisation, and as such, digestive enzymes could not hydrolyse the starchat final digestion time. The mean UG values reported in this study were close to those of Contardoet al. [1] where UG of dough matrix fried under atmospheric conditions was 46 g/100 g. A negativecorrelation was established for initial moisture content and UG of WB magwinya (r = −0.985) and OBmagwinya (r = −0.935) at p < 0.01. The UG values of OB fried batter increased significantly (p < 0.05) athigher substitution levels of OB.
Foods 2020, 9, 1374 6 of 12
Table 1. Glucose content (g/100 g) of fried products enriched with wheat and oat bran.
Bran Concentration (g)Fried Dough Fried Batter
RAG SAG UG RAG SAG UG
Control 60.31 e± 1.51 2.62 a
± 0.03 37.07 ab± 0.24 90.07 e
± 1.80 6.88 a± 0.78 3.05 a
± 0.61WB1 56.81 d
± 0.12 4.69 b± 0.20 38.50 b
± 1.08 83.17 d± 1.13 9.45 b
± 0.43 7.39 c± 0.30
WB5 53.67 c± 1.31 11.06 de
± 0.42 35.27 a± 0.11 80.14 c
± 0.25 10.93 b± 0.62 8.93 d
± 0.36WB8 48.10 a
± 0.20 10.45 d± 0.05 41.46 c
± 0.15 76.09 b± 0.05 18.76 d
± 0.05 5.15 b± 0.01
WB10 49.18 ab± 0.85 12.56 e
± 0.12 38.26 b± 0.27 73.38 a
± 0.58 17.99 d± 0.76 8.63 d
± 0.18WB15 51.12 b
± 0.33 5.67 bc± 0.17 43.21 c
± 1.63 78.58 c± 0.18 14.77 c
± 0.68 6.65 c± 0.51
WB20 47.11 a± 0.25 7.45 c
± 0.50 45.44 d± 1.25 72.33 a
± 1.78 18.11 d± 0.85 9.57 d
± 0.07
Control 60.31 c± 1.51 2.62 a
± 0.03 37.07 a± 0.24 90.07 d
± 1.80 6.88 ab± 0.78 3.05 a
± 0.61OB1 45.70 b
± 1.77 2.48 a± 0.48 51.82 c
± 1.30 82.25 c± 0.28 14.07 c
± 0.78 3.68 a± 0.59
OB5 44.27 b± 0.11 4.35 ab
± 0.21 51.38 c± 0.11 76.46 ab
± 0.72 9.72 c± 0.59 13.82 c
± 0.13OB8 43.71 ab
± 1.03 8.45 c± 0.98 47.84 b
± 0.21 75.41 ab± 0.91 13.49 c
± 0.76 11.10 b± 0.15
OB10 41.47 a± 0.25 3.79 a
± 0.10 54.74 d± 1.15 71.84 a
± 0.75 11.30 bc± 0.71 16.86 d
± 0.96OB15 43.25 ab
± 0.40 10.18 c± 0.41 46.57 b
± 0.21 79.82 bc± 0.57 4.62 a
± 0.57 15.57 cd± 0.14
OB20 43.58 ab± 0.22 5.00 b
± 0.85 51.43 c± 0.37 80.31 bc
± 0.87 8.98 abc± 0.17 10.71 b
± 0.70
Values are presented as mean ± standard deviation (n = 3). Superscripts with different alphabets in the same column show significance (p < 0.05) using Duncan’s multiple range test.RAG—rapidly available glucose, SAG—slowly available glucose, UG—unavailable glucose. OB—oat bran, WB—wheat bran. Control denotes fried dough/batter with 0 g bran, while 1–20represents concentration (g) of bran in product formulation.
Foods 2020, 9, 1374 7 of 12
High UG values in fried dough samples may also be accounted for by incomplete gelatinisationas a result of competition for water by fibre, salt, and sugar molecules causing less water for starchgranules to attain full gelatinisation upon heating [1,6]. Multivariate linear regression revealed thatlinear and interaction effect of the independent variables (bran type, initial moisture content and branconcentration) all showed significance (p < 0.05) on RAG, SAG and UG contents of magwinya exceptfor interaction effect of bran type and initial moisture content which showed no significance (p > 0.05)on SAG
3.3. Estimated Glycaemic Index of Fried Products
3.3.1. Estimated Glycaemic Index of Fried Dough
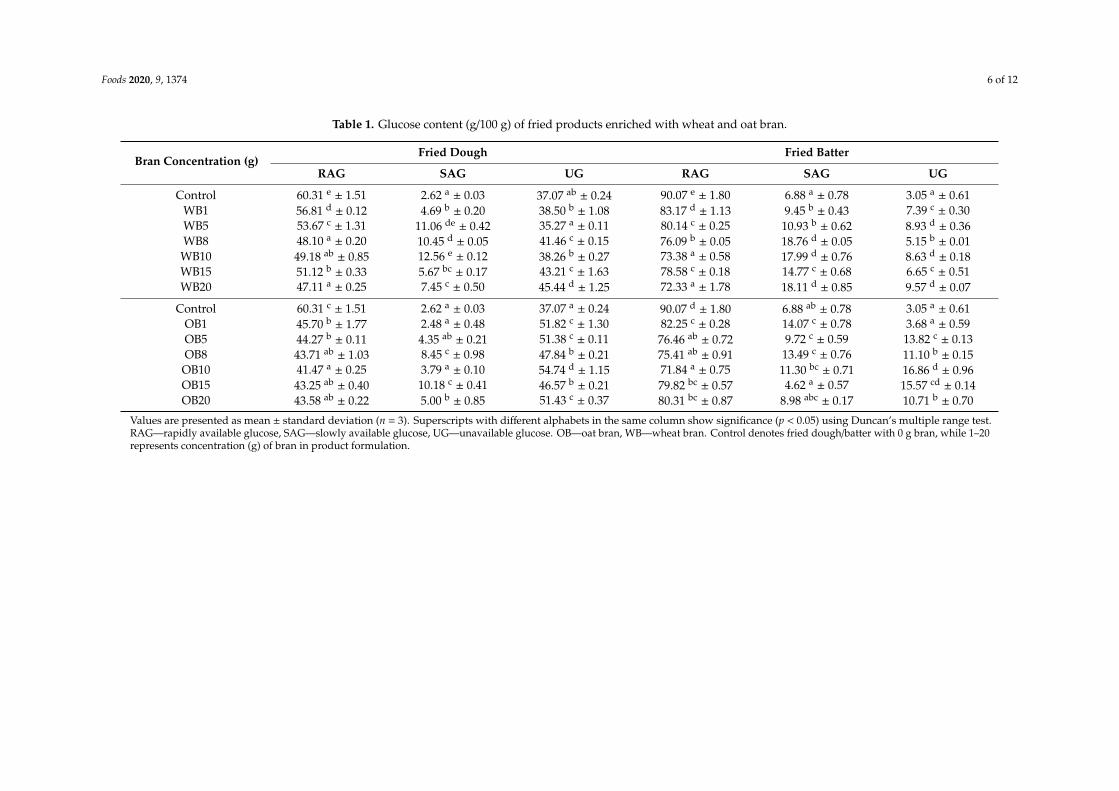
The eGI values of WB fried dough were in the range of 56.46–58.39 and were significantly lowerthan control (58.11) except WB1 (Table 2). The eGI of OB fried dough ranged from 56.34 to 57.27 andwas significantly lower than control (58.11), but no statistical difference was observed among thesamples. This implies that magwinya with low initial moisture content (fried dough) are medium GIfood. This reduction in eGI of fried dough samples may be attributed to the combined effect of dietaryfibre and limited water in the food matrix, which would have caused incomplete starch gelatinisation,and of a consequence resistance to amylolytic enzymes in the digestion time frame [3]. In a foodmatrix such as magwinya, which has other components such as sugar (sucrose), salt, protein (gluten)and fibre, coupled with low initial water in the dough, these components compete with the starchgranules for water. For complete gelatinisation to occur, heat and water are two crucial factors viz:water must enter the crystalline region (amylopectin) where swelling occurs (upon heating) and thecell ruptures, causing the amylose to leach out. It is easier for digestive enzymes to hydrolyse theexposed amylopectin and amylose into glucose monomers for absorption in the body. When there isincomplete gelatinisation, the foregoing does not occur, and this reduces the GI of the food [29].
Table 2. The estimated glycaemic index of magwinya samples.
Magwinya SamplesWheat Bran Magwinya
Fried Dough Fried Batter
Control 58.11 f± 0.55 80.62 f
± 0.07Wheat bran 1 58.39 ef
± 0.13 65.93 a± 0.19
Wheat bran 5 57.97 cde± 0.21 66.95 b
± 0.18Wheat bran 8 56.46 a
± 0.05 68.21 e± 0.53
Wheat bran 10 57.43 bc± 0.11 67.59 cd
± 0.07Wheat bran 15 57.11 b
± 0.65 67.22 bc± 0.04
Wheat bran 20 57.62 bcd± 0.15 67.84 de
± 0.33
Oat Bran Magwinya
Fried Dough Fried Batter
Control 58.11 b± 0.55 80.62 f
± 0.07Oat bran 1 56.96 a
± 0.57 80.03 ef± 0.42
Oat bran 5 56.34 a± 0.66 78.36 cd
± 0.42Oat bran 8 56.64 a
± 0.52 73.57 a± 0.10
Oat bran 10 56.65 a± 0.47 74.69 b
± 0.27Oat bran 15 56.98 a
± 0.05 77.58 c± 0.72
Oat bran 20 57.27 ab± 0.32 79.13 de
± 0.29
Results are presented as mean ± standard deviation (n = 3). Mean values with different superscripts in the samecolumn for each type of product (batter/dough) show significance (p < 0.05) using Duncan’s multiple range test.RDS—rapidly digestible starch, SDS—slowly digestible starch, RS—resistant starch, TS—total starch, K—constant(dimensionless), HI—hydrolysis index, OB—oat bran. Control denotes fried dough/batter with 0 g bran, while 1–20represents concentration (g) of bran in product formulation.
Foods 2020, 9, 1374 8 of 12
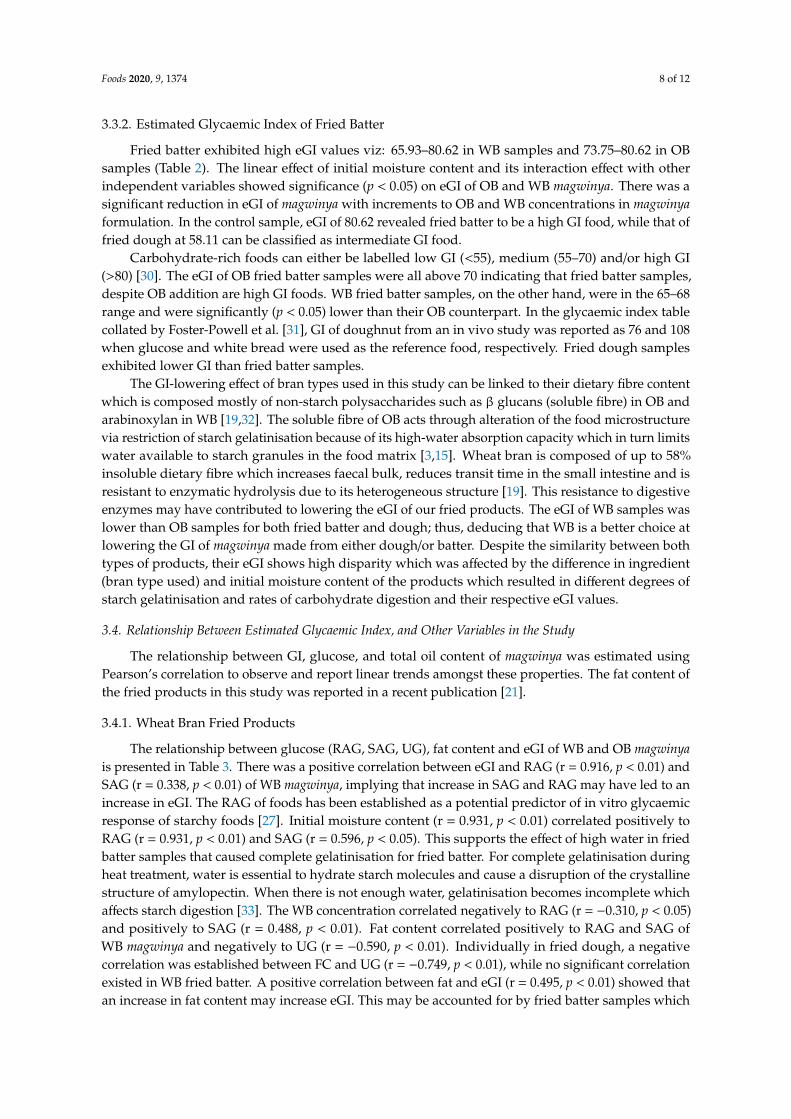
3.3.2. Estimated Glycaemic Index of Fried Batter
Fried batter exhibited high eGI values viz: 65.93–80.62 in WB samples and 73.75–80.62 in OBsamples (Table 2). The linear effect of initial moisture content and its interaction effect with otherindependent variables showed significance (p < 0.05) on eGI of OB and WB magwinya. There was asignificant reduction in eGI of magwinya with increments to OB and WB concentrations in magwinyaformulation. In the control sample, eGI of 80.62 revealed fried batter to be a high GI food, while that offried dough at 58.11 can be classified as intermediate GI food.
Carbohydrate-rich foods can either be labelled low GI (<55), medium (55–70) and/or high GI(>80) [30]. The eGI of OB fried batter samples were all above 70 indicating that fried batter samples,despite OB addition are high GI foods. WB fried batter samples, on the other hand, were in the 65–68range and were significantly (p < 0.05) lower than their OB counterpart. In the glycaemic index tablecollated by Foster-Powell et al. [31], GI of doughnut from an in vivo study was reported as 76 and 108when glucose and white bread were used as the reference food, respectively. Fried dough samplesexhibited lower GI than fried batter samples.
The GI-lowering effect of bran types used in this study can be linked to their dietary fibre contentwhich is composed mostly of non-starch polysaccharides such as β glucans (soluble fibre) in OB andarabinoxylan in WB [19,32]. The soluble fibre of OB acts through alteration of the food microstructurevia restriction of starch gelatinisation because of its high-water absorption capacity which in turn limitswater available to starch granules in the food matrix [3,15]. Wheat bran is composed of up to 58%insoluble dietary fibre which increases faecal bulk, reduces transit time in the small intestine and isresistant to enzymatic hydrolysis due to its heterogeneous structure [19]. This resistance to digestiveenzymes may have contributed to lowering the eGI of our fried products. The eGI of WB samples waslower than OB samples for both fried batter and dough; thus, deducing that WB is a better choice atlowering the GI of magwinya made from either dough/or batter. Despite the similarity between bothtypes of products, their eGI shows high disparity which was affected by the difference in ingredient(bran type used) and initial moisture content of the products which resulted in different degrees ofstarch gelatinisation and rates of carbohydrate digestion and their respective eGI values.
3.4. Relationship Between Estimated Glycaemic Index, and Other Variables in the Study
The relationship between GI, glucose, and total oil content of magwinya was estimated usingPearson’s correlation to observe and report linear trends amongst these properties. The fat content ofthe fried products in this study was reported in a recent publication [21].
3.4.1. Wheat Bran Fried Products
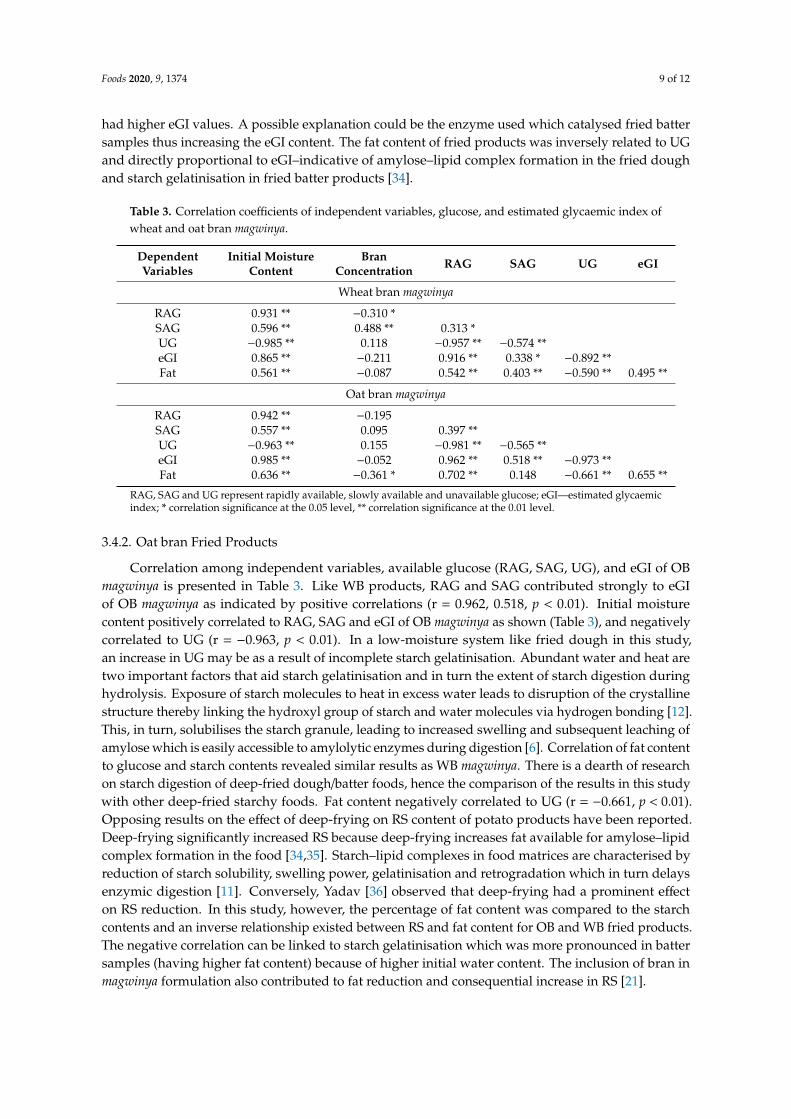
The relationship between glucose (RAG, SAG, UG), fat content and eGI of WB and OB magwinyais presented in Table 3. There was a positive correlation between eGI and RAG (r = 0.916, p < 0.01) andSAG (r = 0.338, p < 0.01) of WB magwinya, implying that increase in SAG and RAG may have led to anincrease in eGI. The RAG of foods has been established as a potential predictor of in vitro glycaemicresponse of starchy foods [27]. Initial moisture content (r = 0.931, p < 0.01) correlated positively toRAG (r = 0.931, p < 0.01) and SAG (r = 0.596, p < 0.05). This supports the effect of high water in friedbatter samples that caused complete gelatinisation for fried batter. For complete gelatinisation duringheat treatment, water is essential to hydrate starch molecules and cause a disruption of the crystallinestructure of amylopectin. When there is not enough water, gelatinisation becomes incomplete whichaffects starch digestion [33]. The WB concentration correlated negatively to RAG (r = −0.310, p < 0.05)and positively to SAG (r = 0.488, p < 0.01). Fat content correlated positively to RAG and SAG ofWB magwinya and negatively to UG (r = −0.590, p < 0.01). Individually in fried dough, a negativecorrelation was established between FC and UG (r = −0.749, p < 0.01), while no significant correlationexisted in WB fried batter. A positive correlation between fat and eGI (r = 0.495, p < 0.01) showed thatan increase in fat content may increase eGI. This may be accounted for by fried batter samples which
Foods 2020, 9, 1374 9 of 12
had higher eGI values. A possible explanation could be the enzyme used which catalysed fried battersamples thus increasing the eGI content. The fat content of fried products was inversely related to UGand directly proportional to eGI–indicative of amylose–lipid complex formation in the fried doughand starch gelatinisation in fried batter products [34].
Table 3. Correlation coefficients of independent variables, glucose, and estimated glycaemic index ofwheat and oat bran magwinya.
DependentVariables
Initial MoistureContent
BranConcentration RAG SAG UG eGI
Wheat bran magwinya
RAG 0.931 ** −0.310 *SAG 0.596 ** 0.488 ** 0.313 *UG −0.985 ** 0.118 −0.957 ** −0.574 **eGI 0.865 ** −0.211 0.916 ** 0.338 * −0.892 **Fat 0.561 ** −0.087 0.542 ** 0.403 ** −0.590 ** 0.495 **
Oat bran magwinya
RAG 0.942 ** −0.195SAG 0.557 ** 0.095 0.397 **UG −0.963 ** 0.155 −0.981 ** −0.565 **eGI 0.985 ** −0.052 0.962 ** 0.518 ** −0.973 **Fat 0.636 ** −0.361 * 0.702 ** 0.148 −0.661 ** 0.655 **
RAG, SAG and UG represent rapidly available, slowly available and unavailable glucose; eGI—estimated glycaemicindex; * correlation significance at the 0.05 level, ** correlation significance at the 0.01 level.
3.4.2. Oat bran Fried Products
Correlation among independent variables, available glucose (RAG, SAG, UG), and eGI of OBmagwinya is presented in Table 3. Like WB products, RAG and SAG contributed strongly to eGIof OB magwinya as indicated by positive correlations (r = 0.962, 0.518, p < 0.01). Initial moisturecontent positively correlated to RAG, SAG and eGI of OB magwinya as shown (Table 3), and negativelycorrelated to UG (r = −0.963, p < 0.01). In a low-moisture system like fried dough in this study,an increase in UG may be as a result of incomplete starch gelatinisation. Abundant water and heat aretwo important factors that aid starch gelatinisation and in turn the extent of starch digestion duringhydrolysis. Exposure of starch molecules to heat in excess water leads to disruption of the crystallinestructure thereby linking the hydroxyl group of starch and water molecules via hydrogen bonding [12].This, in turn, solubilises the starch granule, leading to increased swelling and subsequent leaching ofamylose which is easily accessible to amylolytic enzymes during digestion [6]. Correlation of fat contentto glucose and starch contents revealed similar results as WB magwinya. There is a dearth of researchon starch digestion of deep-fried dough/batter foods, hence the comparison of the results in this studywith other deep-fried starchy foods. Fat content negatively correlated to UG (r = −0.661, p < 0.01).Opposing results on the effect of deep-frying on RS content of potato products have been reported.Deep-frying significantly increased RS because deep-frying increases fat available for amylose–lipidcomplex formation in the food [34,35]. Starch–lipid complexes in food matrices are characterised byreduction of starch solubility, swelling power, gelatinisation and retrogradation which in turn delaysenzymic digestion [11]. Conversely, Yadav [36] observed that deep-frying had a prominent effecton RS reduction. In this study, however, the percentage of fat content was compared to the starchcontents and an inverse relationship existed between RS and fat content for OB and WB fried products.The negative correlation can be linked to starch gelatinisation which was more pronounced in battersamples (having higher fat content) because of higher initial water content. The inclusion of bran inmagwinya formulation also contributed to fat reduction and consequential increase in RS [21].
Foods 2020, 9, 1374 10 of 12
4. Conclusions
Incorporation of WB and OB in magwinya fried products caused a reduction in RAG values aswell as an increase in SAG and UG values. This points to a delay in glucose release due to the presenceof bran fibres during enzymatic hydrolysis. OB and WB had a similar effect on the reduction of RAGof fried dough while WB had improved an effect in fried batter products. There was a reduction ofeGI of all samples with addition of WB and OB. This reduction effect on the eGI of magwinya canbe attributed to the dietary fibre constituents of OB and WB. Overall, this study shows how branenrichment can be used to control the glucose contents and reduce eGI of magwinya, thereby improvingits nutritional properties. The outcomes of this study can serve as baseline information for magwinya(or fried food) processors, nutritionists, and consumers. In vitro studies only cater to an estimation ofstarch digestion and glycaemic index. To obtain magwinya GI, in vivo study using human or animalsubjects is recommended. Extraction and purification of bran dietary fibres and evaluation of theirconstituents on their molecular mechanism in starch digestion are also suggested for future studies.The results of this study indicated that WB and OB are suitable additives for the reduction of RAG andeGI of magwinya.
Author Contributions: Research conceptualisation and funding were achieved by O.O.O. and A.I.O.J., O.O.O.performed the experiments, conducted data analysis, designed and wrote the manuscript. D.B. and A.I.O.J.reviewed and edited the manuscript. All authors have read and agreed to the published version of the manuscript.
Funding: This research was funded by the Technology Innovation Agency, South Africa (SARDF/16/FST/03) theDirectorate of Research and Innovation, Univen (SARDF/17/FST/03), and DST-NRF Centre of Excellence in FoodSecurity SMART Foods Project (Project ID: 160201).
Conflicts of Interest: The authors declare no conflict of interest.
References
1. Contardo, I.; Parada, J.; Leiva, A.; Bouchon, P. The effect of vacuum frying on starch gelatinization and itsin vitro digestibility in starch–gluten matrices. Food Chem. 2016, 197, 353–358. [CrossRef] [PubMed]
2. Gourineni, V.; Stewart, M.L.; Skorge, R.; Sekula, B.C. Slowly Digestible Carbohydrate for Balanced Energy:In Vitro and In Vivo Evidence. Nutrients 2017, 9, 1230. [CrossRef] [PubMed]
3. Torres, J.D.; Dueik, V.; Carré, D.; Bouchon, P. Effect of the addition of soluble dietary fibre and green teapolyphenols on acrylamide formation and in vitro starch digestibility in baked starchy matrices. Molecules2019, 24, 3674. [CrossRef] [PubMed]
4. Parada, J.; Santos, J.L. Interactions between Starch, Lipids, and Proteins in Foods: Microstructure Control forGlycemic Response Modulation. Crit. Rev. Food Sci. Nutr. 2015, 56, 2362–2369. [CrossRef]
5. Kumar, N.; Puri, N.; Marotta, F.; Dhewa, T.; Calabrò, S.; Puniya, A.K.; Carter, J. Diabesity: An epidemicwith its causes, prevention and control with special focus on dietary regime. Funct. Foods Health Dis. 2017, 7,1–16. [CrossRef]
6. Singh, J.; Dartois, A.; Kaur, L. Starch digestibility in food matrix: A review. Trends Food Sci. Technol. 2010, 21,168–180. [CrossRef]
7. Englyst, K.; Vinoy, S.; Englyst, H.N.; Lang, V. Glycaemic index of cereal products explained by their contentof rapidly and slowly available glucose. Br. J. Nutr. 2003, 89, 329–339. [CrossRef]
8. Borczak, B.; Sikora, M.; Sikora, E.; Dobosz, A.; Kapusta-Duch, J. Glycaemic index of wheat bread. Starch Stärke2017, 70, 1700022. [CrossRef]
9. Wolever, T.; Vorster, H.H.; Björck, I.; Brand-Miller, J.; Brighenti, F.; Mann, J.I.; Ramdath, D.D.; Granfeldt, Y.;Holt, S.; Perry, T.L.; et al. Determination of the glycaemic index of foods: Interlaboratory study. Eur. J.Clin. Nutr. 2003, 57, 475–482. [CrossRef]
10. Odenigbo, A.; Rahimi, J.; Ngadi, M.; Amer, S.; Mustafa, A. Starch digestibility and predicted glycemic indexof fried sweet potato cultivars. Funct. Foods Health Dis. 2012, 2, 280. [CrossRef]
11. Wang, S.; Chao, C.; Cai, J.; Niu, B.; Copeland, L.; Wang, S. Starch–lipid and starch–lipid–protein complexes:A comprehensive review. Compr. Rev. Food Sci. Food Saf. 2020, 19, 1056–1079. [CrossRef]
Foods 2020, 9, 1374 11 of 12
12. Magallanes-Cruz, P.A.; Flores-Silva, P.C.; Bello-Pérez, L.A. Starch Structure Influences Its Digestibility:A Review. J. Food Sci. 2017, 82, 2016–2023. [CrossRef]
13. Brennan, C.S. Dietary fibre, glycaemic response, and diabetes. Mol. Nutr. Food Res. 2005, 49, 560–570.[CrossRef] [PubMed]
14. Taye, A.; Engidawork, E.; Urga, K. An in vitro estimation of glycemic index of white bread and improvementof the dietary fibre. Adv. Food Technol. Nutr. Sci. 2016, 2, 83–87.
15. Sozer, N.; Cicerelli, L.; Heiniö, R.-L.; Poutanen, K. Effect of wheat bran addition on in vitro starch digestibility,physico-mechanical and sensory properties of biscuits. J. Cereal Sci. 2014, 60, 105–113. [CrossRef]
16. Aravind, N.; Sissons, M.; Egan, N.; Fellows, C.M. Effect of insoluble dietary fibre addition on technological,sensory, and structural properties of durum wheat spaghetti. Food Chem. 2012, 130, 299–309. [CrossRef]
17. Ahmed, F.; Sairam, S.; Urooj, A. In vitro hypoglycemic effects of selected dietary fibre sources. J. FoodSci. Technol. 2011, 48, 285–289. [CrossRef]
18. Reyes-Pérez, F.; Salazar-García, M.G.; Romero-Baranzini, A.L.; Islas-Rubio, A.R.; Ramírez-Wong, B. Estimatedglycemic index and dietary fibre content of cookies elaborated with extruded wheat bran. Plant Food Hum. Nutr.2013, 68, 52–56. [CrossRef]
19. Onipe, O.O.; Jideani, A.I.O.; Beswa, D. Composition and functionality of wheat bran and its application insome cereal food products. Int. J. Food Sci. Technol. 2015, 50, 2509–2518. [CrossRef]
20. Onipe, O.O.; Beswa, D.; Jideani, A.I.O. The socioeconomic benefits, production and consumption statistics ofmagwinya in Limpopo province, South Africa. Afr. J. Food Agric. Nutr. Dev. 2019, 19, 15007–15028. [CrossRef]
21. Onipe, O.O.; Beswa, D.; Jideani, A.I.O. Confocal laser scanning microscopy and image analysis for elucidatingcrumb and crust microstructure of bran-enriched South African fried dough and batter. Foods 2020, 9, 605.[CrossRef] [PubMed]
22. Germaine, K.A.; Samman, S.; Fryirs, C.G.; Griffiths, P.J.; Johnson, S.K.; Quail, K.J. Comparison of in vitrostarch digestibility methods for predicting the glycaemic index of grain foods. J. Sci. Food Agric. 2008, 88,652–658. [CrossRef]
23. Englyst, K.N.; Englyst, H.N.; Hudson, G.J.; Cole, T.J.; Cummings, J.H. Rapidly available glucose infoods: An in vitro measurement that reflects the glycemic response. Am. J. Clin. Nutr. 1999, 69, 448–454.[CrossRef] [PubMed]
24. Englyst, K.; Goux, A.; Meynier, A.; Quigley, M.; Englyst, H.; Brack, O.; Vinoy, S. Inter-laboratory validation ofthe starch digestibility method for determination of rapidly digestible and slowly digestible starch. Food Chem.2018, 245, 1183–1189. [CrossRef] [PubMed]
25. Goñi, I.; Garcia-Alonso, A.; Saura-Calixto, F. A starch hydrolysis procedure to estimate glycemic index.Nutr. Res. 1997, 17, 427–437. [CrossRef]
26. Annor, G.A.; Marcone, M.; Corredig, M.; Bertoft, E.; Seetharaman, K. Effects of the amount and type of fattyacids present in millets on their in vitro starch digestibility and expected glycemic index (eGI). J. Cereal Sci.2015, 64, 76–81. [CrossRef]
27. Englyst, H.N.; Veenstra, J.; Hudson, G.J. Measurement of rapidly available glucose (RAG) in plant foods:A potential in vitro predictor of the glycaemic response. Br. J. Nutr. 1996, 75, 327–337. [CrossRef] [PubMed]
28. Noort, M.W.; van Haaster, D.; Hemery, Y.; Schols, H.A.; Hamer, R.J. The effect of particle size of wheat branfractions on bread quality—Evidence for fibre–protein interactions. J. Cereal Sci. 2010, 52, 59–64. [CrossRef]
29. Parada, J.; Aguilera, J. Review: Starch Matrices and the Glycemic Response. Food Sci. Technol. Int. 2011, 17,187–204. [CrossRef]
30. Lanzerstorfer, P.; Rechenmacher, E.; Lugmayr, O.; Stadlbauer, V.; Höglinger, O.; Vollmar, A. Effects of variouscommercial whole-grain breads on postprandial blood glucose response and glycemic index in healthysubjects. Austin J. Clin. Med. 2018, 5, 1031–1037.
31. Foster-Powell, K.; A Holt, S.H.; Brand-Miller, J. International table of glycemic index and glycemic loadvalues: 2002. Am. J. Clin. Nutr. 2002, 76, 5–56. [CrossRef] [PubMed]
32. Kumar, S.B.; Prabhasankar, P. Shelf stability of low glycemic index noodles: Its physicochemical evaluation.J. Food Sci. Technol. 2018, 55, 4811–4822. [CrossRef] [PubMed]
33. Dona, A.C.; Pages, G.; Gilbert, R.G.; Kuchel, P. Digestion of starch: In vivo and in vitro kinetic models usedto characterise oligosaccharide or glucose release. Carbohydr. Polym. 2010, 80, 599–617. [CrossRef]

Foods 2020, 9, 1374 12 of 12
34. Ghidurus, M.; Turtoi, M.; Boskou, G.; Niculita, P.; Stan, V. Nutritional and health aspects related to frying (I).Rom. Biotechnol. Lett. 2010, 15, 5675–5682.
35. Mangala, S.; Udayasankar, K.; Tharanathan, R. Resistant starch from processed cereals: The influence ofamylopectin and non-carbohydrate constituents in its formation. Food Chem. 1999, 64, 391–396. [CrossRef]
36. Yadav, B.S. Effect of frying, baking and storage conditions on resistant starch content of foods. Br. Food J.2011, 113, 710–719. [CrossRef]
© 2020 by the authors. Licensee MDPI, Basel, Switzerland. This article is an open accessarticle distributed under the terms and conditions of the Creative Commons Attribution(CC BY) license (http://creativecommons.org/licenses/by/4.0/).
Related Documents