IN VITRO INDUCTION OF TNF- a BY OCHRATOXIN A édition scientifique VVB LAUFERSWEILER VERLAG Lauy Mohammad Mahmood AL-Anati INAUGURAL-DISSERTATION zur Erlangung des Grades eines Dr. med. vet. beim Fachbereich Veterinärmedizin der Justus-Liebig-Universität Gießen

Welcome message from author
This document is posted to help you gain knowledge. Please leave a comment to let me know what you think about it! Share it to your friends and learn new things together.
Transcript

Y
-LA
UL
AN
ATI
A
OF-a
I
V
IT
O I
DU
TI
O
F TN
B
Y O
CR
ATO
XN
NR
NC
NH
IA
VVB
IN VITRO INDUCTION OF TNF-a
BY OCHRATOXIN A
édition scientifique
VVB LAUFERSWEILER VERLAG
Lauy Mohammad Mahmood AL-Anati
VVB LAUFERSWEILER VERLAGédition scientifique
9 7 8 3 8 3 5 9 5 0 4 3 6
ISBN 3-8359-5043-6VVB LAUFERSWEILER VERLAGS TA U F E N B E R G R I N G 1 5D - 3 5 3 9 6 G I E S S E N
Tel: 0641-5599888 Fax: -5599890redak t ion@dok to rve r lag .dew w w . d o k t o r v e r l a g . d e
INAUGURAL-DISSERTATIONzur Erlangung des Grades eines Dr. med. vet. beim Fachbereich Veterinärmedizinder Justus-Liebig-Universität Gießen
Luay M. M. Al-Anati geboren 1977 in Albqáh Camp for Palestinian Refugies, Jordanien, absolvierte 2000 seinen Bachelor of Veterinary Medicine and Surgery an der Universität von Baghdad, Iraq. Im Jahre 2002 erhielt er von der Jordan University of Science and Technology in Irbed, Jordanien den Master-Titel of Veterinary Pharmacology-Physiology. Im Mai 2006 wurde ihm durch Promotion auf dem Gebiet der Pha rmako log ie und Tox i ko log ie d ie Doktorwürde der Veterinärmedizin der Justus-Liebig-Universität Gießen, Deutschland verliehen.
C B DR DQ
Class III MHC
Class II MHCClass I MHC
NF-kB IKB
TNFR
OT
A
CD14
NF-kB
IKB
SuppressorsInducers SuppressorsTNF-á
LPX &/ or CYP-450 metabolites
A.A &/ or COX metabolites
Kupffer cell membrane
C B DR DQC B DR DQ
Class III MHC
Class II MHCClass I MHC
NF-kB IKBIKB
TNFR
OT
A
CD14
NF-kB
IKBIKB
SuppressorsInducers SuppressorsTNF-á
LPX &/ or CYP-450 metabolites
A.A &/ or COX metabolites
Kupffer cell membrane
Das Werk ist in allen seinen Teilen urheberrechtlich geschützt.
Jede Verwertung ist ohne schriftliche Zustimmung des Autors oder des Verlages unzulässig. Das gilt insbesondere für Vervielfältigungen, Übersetzungen, Mikroverfilmungen
und die Einspeicherung in und Verarbeitung durch elektronische Systeme.
1. Auflage 2006
All rights reserved. No part of this publication may be reproduced, stored in a retrieval system, or transmitted,
in any form or by any means, electronic, mechanical, photocopying, recording, or otherwise, without the prior
written permission of the Author or the Publishers.
st1 Edition 2006
© 2006 by VVB LAUFERSWEILER VERLAG, GiessenPrinted in Germany
VVB LAUFERSWEILER VERLAGédition scientifique
STAUFENBERGRING 15, D-35396 GIESSENTel: 0641-5599888 Fax: 0641-5599890
email: [email protected]
www.doktorverlag.de

Aus dem Institut für Pharmakologie und Toxikologie Fachbereich Veterinärmedizin
der Justus-Liebig-Universität Gießen
Betreuer: Prof. Dr. E. Petzinger
In Vitro Induction of TNF-α by Ochratoxin A
INAUGURAL-DISSERTATION
zur Erlangung des Grades eines Dr. med. vet.
beim Fachbereich Veterinärmedizin der Justus-Liebig-Universität Gießen
eingereicht von
Lauy Mohammad Mahmood AL-Anati Master of Veterinary Medicine from Palestine
Gießen 2006

Mit Genehmigug des Fachbereich Veterinärmedizin der Justus-Liebig-Universität Gießen
Dekan Prof. Dr. Manfred Reinacher
Gutachter:
Prof. Dr. E. Petzinger
PD Dr. T. Hübschle
Tag der Disputation: 19.05.2006

DEDICATIONS
To my homeland; Palestine

.

Contents
i
Contents
Description page
Dedications
Contents i
List of figures v
List of tables vi
List of abbreviations vii
Chapter 1. Literature Review 1
1.1 Ochratoxin A 1
1.1.1 Introduction 1
1.1.2 Ochratoxin A-producing fungi 2
1.1.3 Chemical properties of OTA 3
1.1.4 Acceptable daily intake (ADI) 5
1.1.5 Cytotoxicity and OTA-mediated cell death 7
1.1.6 Hepatotoxicity of ochratoxin A 9
1.1.7 Cytokine modulation by OTA 13
1.2 TNF-alpha 16
1.2.1 Introduction 16
1.2.2 TNF-α production and release 17
1.2.3 TNF-α receptors and signaling pathway 18
1.2.4 Biological activity of TNF-α and interference with pathological
conditions 20
1.2.5 TNF- causing apoptosis and necrosis 22
1.2.6 TNF-α regulation by immunesuppressants, phosphodiesterase
inhibitors, and adenosine receptor agonist, and non steroidal anti-
inflammatory compound
24

Contents
ii
1.2.6.1 Glucocorticoids 25
1.2.6.2 cAMP elevating agents 25
1.2.6.3 Adenosine agonist 26
1.2.6.4 Matrix metalloproteinases, TACE, and TNF- 29
1.2.6.5 CSAID Cytokine inhibitors 32
1.3 Arachidonic acid 34
Chapter 2. Research Objectives 37
Chapter 3. Materials & Methods 38
3.1 Materials 38
3.1.1 Chemicals & Reagents 38
3.1.2 Kits 41
3.1.3 Instruments 41
3.1.4 Disposable materials 42
3.1.5 Cell types 42
3.2 Animals 43
3.3 Solutions & buffers 44
3.3.1 Krebs-Henseleit buffer 44
3.3.2 Krebs-Henseleit buffer Ca2+ free 44
3.3.3 Tyrode buffer 45
3.3.4 Phosphate buffer 46
3.3.5 Modifid HANK's balanced salt solution with Ca2+ 46
3.3.6 Modifid HANK's balanced salt solution Ca2+ free 47
3.4 Methods 47
3.4.1 Ochratoxin A and tested compound preparations 47
3.4.2 Liposome preparation and administration 48
3.4.3 Rat liver preparations 49

Contents
iii
3.4.4 Isolated blood-free liver perfusion 57
3.4.5 Isolation of sinusoidal endothelial and Kupffer cells 52
3.4.6 Isolation of hepatocytes 53
3.4.7 Peritoneal rat macrophages preparation 55
3.4.8 Cell lines L929, HepG2, and J774A.1 56
3.4.9 Cell counting 56
3.4.10 Culture conditions 57
3.4.11 Sampling schedule 58
3.4.12 Cytotoxicity markers 58
3.4.13 TNF-α assay 59
3.5 Statistical analysis 61
Chapter 4. Results 62
4.1 Induction of TNF-α from blood-free perfused rat livers 62
4.2 Markers of cytotoxicity 65
4.3 The role of Kupffer cells in OTA-mediated TNF-α release 71
4.3.1 Blockade of Kupffer cells by gadolinium chloride (GdCl3) 71
4.3.2 Depletion of Kupffer cells by liposomes encapsulated clodronate 73
4.3.3 OTA-mediated TNF-α release from isolated Kupffer cells 75
4.3.4 TNF-α release from isolated sinusoidal endothelial cells 76
4.3.5 TNF-α release from isolated hepatocytes 78
4.4 TNF-α release from macrophages 79
4.4.1 OTA-mediated TNF-α release from isolated peritoneal
macrophages 80
4.4.2 OTA-mediated TNF-α release from J774A.1 cells 81
4.4.3 TNF-α release from HepG2 cells 82
4.4.4 TNF-α release from L929 cells 84
Contents
iv
4.5 The role of arachidonic acid and its metabolites on OTA-
mediated TNF- release from rat livers 85
4.5.1 Effect of PLA2 inhibitor aristolochic acid 85
4.5.2 Inhibition of pathways of arachidonic acid metabolism 86
4.5.3 Effect of exogenous arachidonic acid supplementation 90
4.6 Inhibition of OTA-induced TNF-α signaling cascade 93
4.6.1 Effect of calcium on OTA-mediated TNF-α release 93
4.6.2 Effect of NF-kB inhibitor CAPE 94
4.6.3 Involvement of CD14 in OTA mediated TNF- release from
Kupffer cells 95
Chapter 5. Discussion 97
5.1 Meaning of OTA-mediated release of TNF-α in the liver 97
5.2 Non-Liver cells and OTA: Differential sensitivity between OTA and
LPS on releasing TNF-α 107
5.3 Endogenous protection of OTA mediated TNF-α release by
prostanoids 109
Chapter 6. Conclusion 116
English abstract 118
German abstract 120
Chapter 7. References 124
Acknowledgement 169

List of Figures & Tables
v
List of Figures Fig. No. Description Page
Fig. 1 Chemical structure of OTA 4
Fig. 2 Arachidonic acid metabolic signaling cascade
36
Fig. 3A Blood-free rat liver 49
Fig. 3B Schedule of perfusion 51
Fig. 4 Induction of TNF-α by OTA
65
Fig. 5 LDH released into perfusate
68
Fig. 6 GLDH released into perfusate
69
Fig. 7 Lactate released into perfusate
69
Fig. 8 Potassium ion released into perfusate
70
Fig. 9 OTA-mediated release of TNF- from blood-free perfused rat livers under Kupffer cell blockage
74
Fig. 10 TNF-α release from Kupffer cell culture
76
Fig. 11 TNF-α release from sinusoidal endothelial cell culture
77
Fig. 12 TNF-α release from hepatocyte cell culture
79
Fig. 13 TNF-α release from rat peritoneal macrophage cell culture
81
Fig. 14 TNF-α release from J774A.1 cell line
82
Fig. 15 TNF-α release from HepG2 cell line
83
Fig. 16 TNF-α release from L929 cell line
84
List of Figures & Tables
vi
Fig. 17 Basal TNF-α release from blood-free perfused rat livers
89
Fig. 18 Effects of blocking arachidonic acid release and its major pathways on TNF-α release in the presence of OTA
90
Fig. 19 Effects of inhibition of NF-kB and addition of arachidonic acid on TNF-α release
91
Fig. 20 Effects of Ca2+ on TNF-α release from blood-free perfused rat livers
93
Fig. 21 Involvement of CD14 molecule and NF-kB in TNF-α release from Kupffer cells
95
Fig. 22 Proposed mechanism of OTA-mediated TNF-α release from Kupffer cells
117
List of Tables
Table No.
Description Page
Table 1 Summary of cytokine modulation by OTA
15
Table 2 TNF-α concentration in incubated medium of different cells at 24 hrs in the absence or presence of 2.5 µmol/l OTA or 0.1 µg/ml
85
Table 3 Percentages of TNF-α release in the absence or presence of 2.5 µmol/l OTA in the blood-free perfused rat liver model
92
Abrreviations
vii
List of abbreviations
Abbreviation Description
Ca2+ Calcium ion
cAMP Cyclic adenosine monophoshate
CAPE Caffeic acid phenylethyl ester
CO2 Carbon dioxide
COX Cyclooxygenase
CYP-450 Cytochrome P-450
DMEM Dulbeccos modified Eagles medium
FCS Fatal calf serum
GdCl3 Gadolinium chloride
GLDH Glutamate dehydrogenase
HepG2 Human hepatoma cell line
hrs Hours
IL-1,2,5,6,8,10 Interlukine-1,2,5,6,8,10
J774A.1 Mouse monocyte macrophages cell line
K+ Potassium ion
L929 Connective tissue derived cell line
LDH Lactate dehydrogenase

Abrreviations
viii
LIP-CLOD Liposome-encapsulated clodronate
LIP-PBS Liposome-encapsulated phosphate-buffered saline
LPS Lipopolysaccharide
LPX Lipoxygenase
LT-B,C Leukotrienes-B,C
NDGA Nordihydroguaiaretic acid
NF-kB Nuclear transcription factor
OTA Ochratoxin A
PGE Prostaglandin
PMN Polymorphonuclear cell
PLA2 Phospholipase A2
SEC Sinusoidal endothelial cells
TACE TNF-α-converting enzyme
TNFR1 Tumor necrosis factor receptor 1
TNF-α Tumor necrosis factor-alpha

Literature review
1
Chapter 1. Literature review
1.1 Ochratoxin A
1.1.1 Introduction
In 1920 an outbreak of porcine nephropathy occurred in Denmark and some
years later in 1928 again a hitherto unknown renal porcine nephropathy was
reported from there (Larsen, 1928). Today it is believed that the mycotoxin
ochratoxin A (OTA) caused those nephropathies in swine. Ochratoxin A was
isolated for the first time from Aspergillus ochraceus in 1965 by van der Merwe
and his coworkers under an experimental survey to identify toxogenic fungus
species. The name ochratoxin was derived from Aspergillus ochraceus and
stands for a class of several mycotoxins designated by letters A, B and C (van
der Merwe et al., 1965a; b). At the same time this toxin was detected in field
groups by Scott in 1965 (Scott, 1965). In 1957-1958 an unusual chronic kidney
disease in humans called Balkan endemic nephropathy (BEN) occurred
endemically in Yugoslavia, Rumania, and Bulgaria, mainly in rural areas where
food is home grown. The suggestion was brought up that plant toxins or
mycotoxins may be an environmental factor causing those diseases (Barnes,
1967; Hult et al., 1982). In the 1970s in Denmark, again nephritis was noted in
pigs at slaughter. Analysis of pig feed showed that 50% of samples contained

Literature review
2
ochratoxin A at levels up to 27 mg/kg. It further showed the presence of
Penicillium viridicatum in the feed (Scott et al., 1970; Krogh et al., 1973). Since
then, this toxin has occupied a major place in mycotoxin research and
meanwhile it has been found to be ubiquitously present in all kind of food and
feed. It is nowadays established that the toxin is continuously and unavoidably
ingested with food, and consequently is present in blood in most, if not all tested
people, in particular, in the USA and European populations (Jiménez et al.,
1999; Joint FAO/WHO, 2001).
1.1.2 Ochratoxin A-producing fungi
Ochratoxin A is a secondary metabolite of toxogenic species of Aspergillus and
Penicillium fungi. It is produced redundant from Aspergillus ochraceus (van der
Merwe et al., 1965b), which grows in moderate temperatures and occurrs
between 8-37 0C with optimum at 24-31 0C and 0.95-0.99 water activity (Pitt &
Hocking, 1997; Joint FAO/WHO, 2001; Bakker & Pieters, 2002). Further
studies showed the major mould responsible for ochratoxin A production is
Penicillium viridicatum (Scott et al., 1970; Krogh et al., 1973), but more
recently it has been shown to be P. verrucosum (Pitt, 1987). P. verrucosum was
reported to grow in cool temperature regions below 30 0C with an optimum of
20 0C and with 0.8 water activity (Pitt & Hocking, 1997; Joint FAO/WHO,

Literature review
3
2001; Bakker & Pieters, 2002). Recently, A. carbonarius was identified as a
third major source of ochratoxin A in high temperature region. This fungus
grows up to 40 0C with optimal temperatures of 32-35 0C (Téren et al., 1996;
Wicklow et al., 1996). Some other fungal species (Aspergillus alliaceus,
Aspergillus auricomus, Aspergillus glaucus, Aspergillus melleus, and
Aspergillus niger) (Ciegler et al., 1972; Abarca et al., 1994; Bayman et al.,
2002) are less important producers of ochratoxins. In summary, ochratoxin A is
a mycotoxin produced by several fungus species of the genera Aspergillus and
Penicillium in different geographical areas under a wide variety of climate
conditions. Thus the probability of its presence almost everywhere is very high.
This adds OTA as a newly recognized risk factor for human an animal health.
1.1.3 Chemical properties of OTA
The systematical chemical name of OTA according to IUPAC is N-[[(3R)-5-
chloro-8-hydroxy-3-methyl-1-oxo-7-isochromanyl]-carbonyl]-3-phenyl-L-
alanine; other synonyms according to IARC are L-phenylalanine-N-[(5-chloro-
3,4-dihydro-8-hydroxy-3-methyl-1-oxo-1H-2-benzopyran-7-yl)-carbonyl] or N-
[(5-chloro-8-hydroxy-3-methyl-1-oxo-7-isochromanyl)-carbonyl]-3-phenyl-
alanine. Its molecular weight is 403.8 g/mol. Ochratoxin A consists of a

Literature review
4
chlorinated dihydroisocoumarin moiety linked through a 7-carboxyl group by
an amide bond to one molecule of L-β-phenylalanine (Fig. 1).
Fig. 1: Chemical structure of ochratoxin A
OTA forms a white crystalline powder when re-crystallized from xylene. The
resoluted crystals emit green (in acid solution) and blue (in alkaline solution)
fluorescence in ultraviolet light. The melting point of crystalline OTA is 169 0C.
The free acid of ochratoxin A is soluble in organic solvents and the sodium salt
form is soluble in water (IARC, 1983; 1993). Ethanol solution of OTA is stable
for longer than a year if kept refrigerated and in the dark (USDHHS, 2002). It
was reported that a methanol solution of OTA can be stably stored at –20 0C
over a period of some years (Valenta, 1998), for at least 3 weeks at 4 0C and for
at least 5 hrs at room temperature (Jiménez et al., 1999).
Literature review
5
1.1.4 Acceptable daily intake (ADI)
Based on risk assessments and the bulk data of toxicological adverse effects of
ochratoxin A (Kuiper-Goodman & Scott, 1989; Walker, 2002), an acceptable
daily intake (ADI) of OTA was suggested by several international committees
in the last decade. In general, the Joint FAO/WHO Expert Committee on Food
Additives (JECFA) had evaluated ochratoxin A at its 37th meeting in 1991 (Joint
FAO/WHO, 1991). In its assessments the carcinogenic effect of OTA was
addressed, and the Lowest Observed Adverse Effect Level (LOAEL) of 8 µg/kg
b.w. was set, based on renal dysfunctions in pigs. A Tolerable Daily Intake
(TDI) of 16 ng/kg b.w. was established, which was converted to a Provisional
Tolerable Weekly Intake (PTWI) of 112 ng/kg b.w. and a safety factor of 500
was applied. To follow the update, the Committee in 1995 at the 44th meeting
reevaluated the toxicological profile of OTA. The evaluation was not changed
and the (PTWI) value was rounded off to 100 ng/kg b.w. (Joint FAO/WHO,
1995).
In light of new information and development of analytical methods, the JECFA
evaluated the data on OTA again in its 56th meeting in 2001. It was concluded
that the new data raised further questions about the mechanisms by which OTA
causes nephrotoxicity and renal carcinogenicity and the interdependence of
these effects. The mechanisms by which OTA causes carcinogenicity are
Literature review
6
unknown, although both genotoxic and non-genotoxic modes of action have
been proposed. The Committee retained the previously established PTWI of 100
ng/kg body weight per week, pending the results of ongoing studies on the
mechanisms of nephrotoxicity and carcinogenicity, and recommended a further
review (Joint FAO/WHO, 2001; Bakker & Pieters, 2002).
According to the carcinogenic properties of OTA, the Canadian authorities had
evaluated ochratoxin A in 1989, 1990, 1991 and 1996 (Kuiper-Goodman &
Scott, 1989; Kuiper-Goodman, 1990; 1991, 1996), and calculated a Provisional
Tolerable Daily Intake (PTDI) of 1.2-5.7 ng/kg b.w. Simultaneously in 1991 the
Nordic expert group on food toxicology considered 5 ng/kg b.w. the highest
Tolerable Daily Intake (NNT, 1991). Furthermore, the Europe Committee on
Health and Consumer Protection in its opinion in 1994, stated that OTA is a
potent nephrotoxic agent, a carcinogen, and has genotoxic properties. Therefore,
they provisionally concluded that an Acceptable Daily Intake should fall in the
range of a few ng/kg b.w./day and proposed to reconsider its opinion in the
light of new information (Scientific Committee for Food 1996). However, the
total daily intake of OTA from food in various European countries was between
0.9 ng/kg of b.w. in Germany and 4.6 ng/kg of b.w. in Italy (Wolff et al., 2000)

Literature review
7
1.1.5 Cytotoxicity and OTA-mediated cell death
Cytotoxic effects of OTA are based on the inhibition and/or activation of
enzymes, of which several use phenylalanine as a substrate because this amino
acid is part of the OTA molecule. It is believed that the penylalanine moiety in
the OTA molecule interacts as a surrogate substrate. The main targeted enzyme
is phenylalanine-tRNA synthetase which is inhibited in prokaryotes (Konrad &
Röschenthaler, 1977), eukaryotic microorganisms (Creppy et al., 1979),
mammalian cells (Creppy et al., 1983), and experimental animals in vivo
(Creppy et al., 1984). This inhibition causes a reduction in protein synthesis,
which is an important effect of acute and subacute ochratoxin A toxicity. In
addition to inhibition of protein synthesis RNA-synthesis inhibition is another
end point of OTA toxicity (Dirheimer & Creppy, 1991), and probably DNA
synthesis may be inhibited, too. An enzyme affected early by RNA inhibition is
phosphoenolpyruvate carboxykinase, the key enzyme in the gluconeogenic
pathway which depletes indirectly due to specific degradation of the mRNA
coding for this enzyme (Meisner et al., 1983). In vitro the addition of 1.0 x 10⁻⁴
M OTA to isolated rat liver mitochondria led to inhibition of succinate-
cytochrome c reductase, succinate dehydrogenase, and succinate oxidase, due to
effect on the mitochondrial respiration and oxidative phosphorylation through
the impairment of the mitochondrial membrane and inhibition of the succinate-

Literature review
8
supported electron transfer activities of the respiratory chain (Wei et al., 1985).
However, the concentrations required for these enzyme inhibitions are very high
(in range of mmol range) and unlikely to occur in vivo.
With regard to cell death, the induction of apoptosis in several cell types of the
urinary tract by OTA was reported. This organ system is a known OTA-target
and clinically the most important one. Low doses of OTA activated apoptotic
processes and oxidative damage in Wistar rat kidneys, particularly in both
proximal and distal epithelial kidney cells (Petrik et al., 2003). Apoptotic cell
alterations were found when OTA at nanomolar concentrations was incubated
with human proximal tubule-derived cells (IHKE) (Schwerdt et al., 1999), and
with dog renal collecting duct-derived cells (MDCK-C7) (Gekle et al., 2000;
Schwerdt et al., 2004). Whatever, these changes were potentiated through
inhibition and uncoupling of the mitochondrial respiratory chain (Schwerdt et
al., 2004). Interestingly OTA potentiated the apoptotic effect of TNF-α in
MDCK-C7 cells (Gekle et al., 2000). Furthermore apoptosis in hamster kidneys
(HaK) and human HeLa cells was observed albeit at higher concentrations of
OTA (Seegers et al., 1994).
OTA-induced apoptosis is not limited to the urinary tract system but is found
also in the immune system and the liver. Human peripheral blood lymphocytes
and the human lymphoid T cell line, Kit 225 cells (Assaf et al., 2004), bovine

Literature review
9
lymphocytes (Lioi et al., 2004), human hepatoma-derived cell line HepG2
(Renuzelli et al., 2004) and liver of male mice (Atroshi et al., 2000) proceed to
cell death through the apoptotic pathway. In addition, the induction of DNA
single strand breakdown and DNA adduct formation by OTA is considered as
marker or evidence for OTA-induced apoptosis (Creppy et al., 1985; Faucet et
al., 2004). Apart from apoptosis, necrosis also occurred under OTA burden.
Necrotic changes were observed in rat liver (Aydin et al., 2003), rat myocytes
(Okutan et al., 2004), and in germinal centres of the spleen and lymph nodes of
Wistar rats (Kanisawa et al., 1977), and dogs (Kitchen et al., 1977). The
parameters which determine the types of cell destruction are toxin dose and
exposure time. E.g. one week after OTA administration to male mice only
apoptotic without necrotic changes were observed in their livers, whereas
centrilobular necrosis and apoptosis were seen after two weeks (Atroshi et al.,
2000). Gekle et al., 2000, found that OTA at low dosage caused apoptosis and
at higher dosage caused necrosis in MDCK-C11 cells (Gekle et al., 2000).
Others found only apoptotic but not necrotic changes in rat kidneys, which
occurred in a dose- and time-dependent manner (Domijan et al., 2004).
1.1.6 Hepatotoxicity of ochratoxin A
The liver is among the OTA-target organs because of its food-borne exposure
via the portal vein to OTA after mycotoxin absorption from the gut and of an

Literature review
10
enterohepatic circulation of OTA reported in rats (Fuchs et al., 1988), indicating
repeated exposure of liver cells to internally circulating OTA. Hepatotoxicity of
OTA was observed previously in different species, especially in poultry. The
older geese showed smaller liver weight at slaughter to be 400g compared with
a normal weight of 600-900g. In a histopathological study the liver lesions in
geese were caused by multifocal liver necrosis, containing inflammatory cells
and sometimes bacterial colonies, while in other necrotic foci neither
inflammatory reaction nor bacterial colonies were present. The organ weight
reduction combined with gross changes was characterized by a fibrotic liver
covered with fibrinous sheets. In the same study, the authors found the livers of
broilers were enlarged and congested or, more often, shrunken. Fibrotic livers
were covered by a sheet of fibrin (Schlosberg et al., 1997). Similarly, chicks
having received OTA before coccidiosis was induced experimentally, showed
enlarged and congested livers (Stoev et al., 2002). A short study was done in
male Long-Evans and Sprague-Dawley rats given a single dose of benzene-free
ochratoxin A by gavage. One of the earliest changes observed were multifocal
hemorrhages and fibrin thrombi in the liver. The authors concluded that this
occurred due to the activation of the extrinsic and intrinsic systems of
coagulation (Albassam et al., 1987). In accordance with this study Galtier et al.,
1979, found that ochratoxin A given via gavage to male Wister rats for 14 days

Literature review
11
decreased blood coagulation factors II, VI, X, plasma fibrinogen, and
thrombocyte counts (Galtier et al., 1979).
In broilers, diffuse liver necrosis was common, usually without inflammatory
cell infiltration. A subacute to chronic portal hepatitis was frequently observed.
Some megalocytosis was often seen (Schlosberg et al., 1997). Also in livers of
fed chicks’ cloudy swelling, granular degeneration, and rarely fatty changes of
hepatic parenchymal cells were seen. Those changes usually were combined
with activation of capillary endothelium and Kupffer cells, hyperemia and
pericapillary edema as well as perivascular mononuclear cell infiltration (Steov
et al., 2002) However, at higher doses of OTA liver damage was presented in
concert with nephrotoxicity in broiler chicks (Smith & Moss, 1985).
OTA effects on liver seem to be much less pronounced and specific than those
of aflatoxins. Interestingly, OTA apparently prevented fatty degeneration of the
liver caused by aflatoxin when the two toxins were given simultaneously to
broiler chickens (Huff et al., 1984). In rats treated with OTA, the
histopathologic changes were found in the liver tissue, included granular or
vacuolated degeneration and necrosis of the liver cells, sinusoidal and central
vein dilatation, bile duct proliferation, enlargement of periportal areas with
mononuclear cell inflammatory infiltration and mild degrees of fibrous tissue
proliferation (Aydin et al., 2003). Others found in young rats decreased

Literature review
12
hepatocellular vacuolation, while in old rats hepatic erythropoiesis,
inflammation, biliary/oval cell-proliferation and multinucleated giant cell
formation (Dortant et al., 2001).
Long-term studies of toxicity and carcinogenicity of ochratoxin A in mice,
showed diets containing ochratoxin A in different doses and time exposures
induced hepatic-cell tumours. It was not clearly indicated whether the liver
tumours were benign or malignant (Kanisawa & Suzuki, 1978; Kanisawa,
1984). DNA single-strand breaks were observed in vivo in liver cells of mice
after intraperitoneal injection of ochratoxin A. DNA repair, manifested as
unscheduled DNA synthesis, was observed in most studies with primary
cultures of rat and mouse hepatocytes (Joint FAO/WHO, 2001). The conclusion
of these data was that OTA is direct genotoxic in vitro. It was also reported that
in vivo OTA causes DNA adducts supporting a direct DNA reacting activity.
However, it was never shown that OTA-derived radio activities occurred in
DNA nor were such adducts ever documented by physiochemical analysis
(Mally et al., 2005). Therefore, the genotoxicity of OTA was recently
questioned (Turesky, 2005). This means that it is likely that non-genotoxic,
epigenetic disturbance would have caused cancer.
Literature review
13
1.1.7 Cytokine modulation by OTA
The immune system is composed of very different cells, all capable of
autonomous regulation. A very challenging understanding of this fine tuning
emerged with the discovery of cytokines as new regulatory factors of the
humoral immune system. The production of cytokines is influenced by several
mycotoxins such as atranones B and E, trichodermin, 7-α-hydroxytrichodermol
(Huttunen et al., 2004) but most prominently by ochratoxin A. Ochratoxin A
causes a significant release of pro-inflammatory cytokines TNF-α and IL-6
from blood-free perfused rat livers at micromoler concentration range and this
release was comparable to that produced in rat livers by low concentration of
LPS (Weidenbach et al., 2000; Petzinger & Weidenbach, 2002). An
antagonistic effect on OTA-mediated TNF-α release from rat livers was seen if
other mycotoxins such as 3-acetoxydeoxynivalenol (3-Ac-DON), xanthomegnin
(XAN), citrinin (CIT), and viomellein (VIO) were simultaneously co-applied
(Petzinger & Weidenbach, 2002). The release was totally dependent upon
extracellular calcium and was prevented by phosphodiesterase IV blocker
rolipram (Weidenbach et al., 2000).
Others reported TNF-α release from mouse RAW264.7 macrophage cell line
upon OTA treatment (Huttunen et al., 2004). Co-exposure of these cells to
ochratoxin and Streptococcus californicus, the latter which causes TNF-α

Literature review
14
release, had opposing effects (Huttunen et al., 2004). OTA seems not to
uniformly exert cytokine release. In the monocytic cell line THP-1 crude
ochratoxin A from Aspergillus ochraceus as well as the pure toxin inhibited
secretion of TNF-α (Heller et al., 2002).
In contrast to hepatic IL-6 production, ochratoxin A failed to induce this
interleukin from the RAW264.7 macrophage cell line, neither itself alone nor by
concomitant exposure to ochratoxin A plus Streptococcus californicus
(Huttunen et al., 2004). In a thymoma cell line (EL4) which was stimulated by
phorbol 12-myristate 12-acetate (PMA) exposure to ochratoxin A showed a
marked increase of IL-2 production while IL-5 production was significantly
decreased (Marin et al., 1996). On the other hand, ochratoxin A inhibited IL-2
production from swine (Harvey et al., 1992) lymphocytes which were
stimulated by concanavalin A. Others found that OTA did not interfere with IL-
2 levels released from stimulated murine lymphocytes (Thuvander et al., 1995;
1996). In activated purified human T lymphocyte populations and
subpopulations IL-2 production and IL-2 receptor expression were severely
impaired by OTA, but pre-incubation of those cells with ochratoxin B (OTB)
prior to OTA exposure reversed these inhibitory effects. The authors concluded
that OTA abrogated the cells' ability to respond to activating stimuli in vitro
through toxic interference with essential processes in cell metabolism (Lea et

Literature review
15
al., 1989). Finally, IL-1 production from peritoneal mouse macrophages was
inhibited when mice were pretreated with OTA for long time (Dhuley, 1997).
Table 1 summarizes some of the mentioned effects of OTA on cytokine release.
Cytokine Cell type/model OTA concentration Effects Reference
Blood-free perfused rat livers 1 µg/ml Stimulated AL-Anati et al., 2005
Murine macrophages Inhibited Dhuley, 1997
RAW264.7 macrophage cell line Stimulated Huttunen et al., 2004
Blood-free perfused rat livers 0.8 µg/ml Stimulated Petzinger & Weidenbach,
2002 Blood-free perfused rat livers 0.8 µg/ml Stimulated Weidenbach et al., 2000
TNF-α
Monocytic cell line THP-1
400ng/ml pure OTA or 100ng crude OTA
Inhibited Heller et al., 2002
Blood-free perfused rat livers 0.8 µg/ml Stimulated Petzinger & Weidenbach,
2002.
Blood-free perfused rat livers 0.8 µg/ml Stimulated Weidenbach et al., 2000
IL-6
RAW264.7 macrophage cell line No effect Huttunen et al., 2004
IL-1 Murine macrophages Inhibited Dhuley, 1997
IL-5 Thymoma cell line (EL4) 5 or 10 µg/ml Stimulated Marin et al., 1996
Human T lymphocyte Inhibited Lea et al., 1989
Thymoma cell line (EL4) 5 or 10 µg/ml Stimulated Marin et al., 1996
Porcine lymphocytes Inhibited Harvey et al., 1992
Murine lymphocytes No effects Thuvander et al., 1995
IL-2
Murine lymphocytes No effects Thuvander et al., 1996
Table 1. Summary of cytokine modulation by OTA
Literature review
16
1.2 TNF-alpha
1.2.1 Introduction
The proinflammatory cytokine tumor necrosis factor alpha (TNF-) plays a
fundamental role in immune defense. It was isolated in 1984, on the basis of its
ability to kill tumor cells in vitro and to cause hemorrhagic necrosis of
transplantable tumors in mice (Carswell et al., 1975). It was described
previously as hemorrhagic necrosis factor. Later, it was identified as the
catabolic molecule cachectin in parasite-infested animals (Liz-Grana & Gomez-
Reino Carnota, 2001). It continued to be the major topic of scientific
investigation as indicated by several thousand citations in the last two decades
(Aggarwal, 2000). Most of these studies demonstrated the powerful pro-
inflammatory effects of TNF- (Dayer et al., 1985) and revealed its role as a
central endogenous mediator of endotoxic shock (Beutler et al., 1985; Tracey et
al., 1986). Furthermore, TNF-α known as pro-apoptotic cytokine was a double
edged sword of activity: on one hand it mediated physiological processes and on
the other hand promoted pathogenesis of several health disorders. Thus, TNF-α
research is ongoing and has now reached mycotoxin research groups dealing
apart from OTA with other toxins e.g. rubratoxin B (Nagashima et al., 2001)
and also fumonisins (He et al., 2002).

Literature review
17
1.2.2 TNF-α production and release
The human TNF- gene is located in human chromosome 6 within the major
histocompatibility complex (MHC), in the 6p21.3 Class III HLA zone. On both
sides of it, in the 3' and 5' position, are the genes coding for the α- and ß-
lymphotoxins, respectively. Even though the expression of these genes is
independently regulated, the gene organization is quite similar. The TNF- gene
has 3,634 base pairs distributed into four exons and three introns (intron 1, 606
bp; intron 2, 186 bp; intron 3, 300 bp) the fourth and last exon codes for over
80% of the protein. The TNF cDNA has 1,585 base pairs and translates into a
230-amino acid-protein precursor. The TNF- gene promoter contains
recognition sequences for transcription factors such as AP-1, AP-2, CREBPß,
CRE, Egr1, Ets, NF-AT, NF-kB and SP-1 (reviewed by Liz-Grana & Gomez-
Reino Carnota, 2001).
TNF- is produced by a wide variety of cell types in response to various
inflammatory stimuli, such as lipopolysaccharides (LPS), phorbol ester,
zymosan, ultraviolet light, TNF-α itself, other cytokines such as interleukin
(IL)-1, IL-2, interferone (IFN)-γ, IFN-α, Granulocyte-Macrophage Colony-
Stimulating factor (GM-CSF), the Transforming Growth Factor (TGF)-ß (Liz-
Grana & Gomez-Reino Carnota, 2001).

Literature review
18
1.2.3 TNF-α receptors and signaling pathway
In 1989, several groups independently reported the isolation of a TNF-
binding protein or TNF- inhibitor from human urine that turned out to be the
soluble form of the TNF- receptor (Seckinger et al., 1989; Lantz et al., 1990).
From the amino acid sequence of this protein the cDNA was isolated and cloned
(Loetscher et al., 1990; Nophar et al., 1990). Simultaneously, the cDNA for a
second TNF- receptor was isolated and cloned (Kohno et al., 1990; Smith et
al., 1990). It is now clear that TNF- binds with almost equal affinity to two
distinct receptors referred to as p60 (also called p55 or type I or CD120a) and
p80 (also called p75 or type II or CD120b), with an approximate molecular
mass of 60 kDa and 80 kDa, respectively (Aggarwal, 2000; Liz-Grana &
Gomez-Reino Carnota, 2001). The human p60 receptor has 426 amino acid
residues consisting of an extracellular domain (ECD) of 182 amino acids, a
transmembrane domain (TMD) of 21 amino acids and an intracellular domain
(ICD) of 221 amino acids. From this the predicted molecular mass of this
receptor was about 47.5 kDa. As the apparent molecular mass of the p60
receptor is between 55 and 60 kDa, the difference most probably is attributable
to three potential N-linked glycosylation sites present in the ECD of the
receptors. The ECD of the p60 receptor has a net charge opposite to that of the
TNF- molecule, suggesting strong electrostatic interaction. The human p80

Literature review
19
receptor is a 46 kDa protein, and it consists of 439 amino acid residues with an
ECD of 235 amino acids, a transmembrane domain (TMD) of 30 amino acid
residues, and an intracellular domain (ICD) of 174 amino acids. This receptor is
glycosylated as well (Bazzoni & Beutler, 1996; Aggarwal, 2000).
The two receptors bind TNF- with almost equal affinity. The receptors exhibit
in their ECD four cysteine-rich regions, each consisting of six cysteine residues.
These cysteines are conserved within the two receptors. In contrast the structure
of the ICD of the two receptors is quite distinct and lacks enzymatic activity.
The ICD of the p60 receptor contains a homophilic interaction region of
approximately 80 amino acid residues towards its carboxyl terminal, called the
death domain (DD) (Tartaglia et al., 1993) which is absent in the p80 receptor.
This region was found to be required for TNF- induced apoptosis, antiviral
activity, and nitric oxide synthase induction. Within the past decade, major
advances have been made in understanding how TNF- receptors transduce
their signals. A series of signaling molecules have been discovered that play a
critical part in the TNF- induced cellular responses. Some of the major TNF
induced cellular responses were reviewed by Bazzoni & Beutler, 1996 and
Aggarwal, 2000.

Literature review
20
1.2.4 Biological activity of TNF-α and interference with pathological
conditions
TNF-α has a broad spectrum of biologic activities and acts as a double-edged
sword. On the one hand, it plays a major part in many physiological processes
such as growth regulation, differentiation, viral replication, and liver
regeneration (Goeddel et al., 1986; Aggarwal & Natarajan, 1996). Furthermore,
chronic, low-levels stimulate monocyte-macrophages and contribute to
bacterial, parasitic (Liz-Grana & Gomez-Reino Carnota, 2001), and viral
elimination (Van Reeth et al., 2002; Korten et al., 2005), and lead to bone
resorption (Bezerra et al., 2005).
On the other hand TNF-α, if released systemically in large amounts all at once,
may induce tissue damage, shock and death. Whatever, a TNF-α increase in
blood plays an important role in the pathogenesis of bacterial, viral and fungal
infections, protozoa infestation, in addition to non-infectious disorders as e.g.
silicosis (Piguet et al., 1990; Ding et al., 2002). The development of
granulomatous inflammation in patients with chronic beryllium disease is
associated with the production of numerous inflammatory cytokines, in
particularly TNF-α (Maier, 2002; Maier et al., 2002). Thus, the overproduction
or inappropriate production of TNF-α should promote the pathogenesis of

Literature review
21
several health disorders in particular chronic parasitic diseases such as
trypanosomiasis caused by Trypanosoma brucei rhodesiense (Naessens et al.,
2005), Trypanosoma brucei brucei, Trypanosoma cruzi and babesiosis caused
by Babesia bovis (Shoda et al., 2001), toxoplasmosis caused by Toxoplasma
gondii and schistosomiasis caused by Schistosoma mansoni (Marshall et al.,
1999), malaria caused by Plasmodium berghei (Hirunpetcharat et al., 1999) and
Plasmodium falciparum (Ramasamy, 1998).
Nervous system disorders were also reported to be modulated by TNF-α such as
neurotoxicity induced by 1-methyl-4-phenyl-1,2,3,6-tetrahydropyridine (MPTP)
(Leng et al., 2005), experimental autoimmune encephalomyelitis (EAE) (Djerbi
et al., 2003) and cerebral injury especially in infants (Mohan et al., 2004).
Rheumatoid arthritis (Taberner et al., 2005), ankylosing spondylitis and
psoriatic arthritis (Braun & Sieper, 2003) are also influenced by TNF-α.
In cardiovascular disorders, such as systemic lupus erythematosus, multiple
sclerosis and systemic vasculitis, chronic heart failure (Dibbs et al., 1999).
TNF-α was involved as well as in chronic otitis media (Maeda et al., 2004) and
juvenile dermatomyositis (Pachman et al., 2001).
Gastrointestinal tract diseases are worsened by TNF-α such as Crohn's disease
(Brown & Abreu, 2005), pancreatitis (Kim et al., 2000), and gastritis induced

Literature review
22
by Helicobacter pylori (von Herbay & Rudi, 2000). Among the gastrointestinal
tract disorders, chronic liver disorders are particularly promoted via TNF-α as
alcoholic liver disease (Hirano et al., 2003; Song et al., 2004), septicaemia
accompanying liver cirrhosis (Byl et al., 1993; Ceydeli et al., 2003), chronic
inflammatory liver disease (Adams & Afford, 2002; McClain et al., 2004), and
primary sclerosing cholangitis (Bernal et al., 1999; Mitchell et al., 2001).
The acute diseases as well as inflammatory bowl disease, septic shock
syndrome (Bazzoni & Beutler, 1996; Liz-Grana & Gomez-Reino Carnota,
2001) and asthma (Mattoli et al., 1991; Broide et al., 1992) were influenced by
TNF-α.
1.2.5 TNF- causing apoptosis and necrosis
The major hot topic of TNF-α research is the pro-apoptotic effect of TNF-α in
primary cells or culture cell lines. Apoptotic effects of TNF-α were
demonstrated in HeLa cells (Cozzi et al., 2003), U937 cells (Misasi et al.,
2004), endometrial cells (Okazaki et al., 2005), endothelial cells of rat coronary
artery (Csiszar et al., 2004), and T-lymphocytes (Bonetti et al., 2003), neuronal
cells in the rat cerebral cortex but not in hippocampus (Montes-Rodriguez et al.,
2004).
Literature review
23
Pretreatment with TNF-α was reported to sensitize several tumor cells to
apoptosis, such as Hodgkin tumor HD-MyZ cells which were subjected to
apoptotic cell death induced by antineoplastic agents and by ceramide (Schmelz
et al., 2004). Furthermore, TNF-α treatment sensitized human thyroid cells to
apoptosis (Mezosi et al., 2005), Also pretreatment with luteolin, a plant
flavonoid, greatly sensitized TNF-α-induced apoptotic cell death in a number of
human cancer cell lines, including colorectal cancer COLO205, HCT116 cells
and cervical cancer HeLa cells (Shi et al., 2004). Aspirin sensitizes HeLa cells
to TNF-α-induced apoptosis as well (Kutuk & Basaga, 2004). These results
suggest that aspirin could be used to potentiate the effectiveness of TNF-α-
based therapeutic interventions in cancer treatment (Kutuk & Basaga, 2004).
Tubuloside B has the neuroprotective capacity to antagonize TNF-α-induced
apoptosis in SH-SY5Y cells and may be useful in treating some
neurodegenerative diseases (Deng et al., 2004).
TNF-α represents one of the first pulmonary responses to hyperoxia,
subsequently induced apoptosis in type II pneumocytes (TII cells). Eliminating
the TNF-α effect in vivo by anti-TNF-α antibodies prevents the pro-apoptotic
sensitization of TII cells pneumocytes (Guthmann et al., 2005).
Vascular endothelial and/or smooth muscle cells also express TNF-α and IL-17,
which can be up-regulated in pro-atherogenic pathophysiological conditions in

Literature review
24
the coronary arteries. TNF-α has been shown to exert pro-inflammatory
vascular effects (e.g., induction of oxidative stress, endothelial apoptosis, up-
regulation of adhesion molecules and chemokines) (Csiszar & Ungvari, 2004).
TNF-α causes apoptosis in both rat and human vascular smooth muscle cells
and is intimately involved in the atherosclerotic process. Thus, inhibition of
TNF-α is a useful approach in novel atherosclerosis therapies (Tang et al.,
2005).
1.2.6 TNF-α regulation by immunesuppressants, phosphodiesterase
inhibitors, adenosine receptor antagonist, and non steroidal anti-
inflammatory compound
The studies related with biosynthesis and cellular responses to TNF-α suggested
at least three intervention strategies to suppress TNF-α release or TNF-α action
or both (Henderson & Black, 1992): these included receptor antagonism
(Prabhakar et al., 1995), blockade of target cell signalling pathways (Ramirez et
al., 1999; Eigler et al., 2000), and biosynthesis inhibition (Lee et al., 1995).
Compounds either inhibiting activation or synthesis of TNF-α were classified in
different categories according to their mechanism of action.

Literature review
25
1.2.6.1 Glucocorticoids
Glucocorticoids are among the most potent and widely used anti-inflammatory
agents which were the earliest class of compounds identified to inhibit TNF-α
expression (Ochalski at al., 1993). Dexamethasone and hydrocortisone inhibited
LPS-stimulated TNF-α release from leukocytes (Wirtz et al., 2004).
Dexamethasone suppressed and delayed the expression of TNF-α via
downstream nuclear factor kappa B (NF-kB), signal transduction and activator
of transcription 3 (STAT3), and activation protein 1 (AP-1) activation
(Debonera et al., 2003), thus indicating that TNF- release is regulated at the
transcriptional level and/or mRNA stability. Moreover, this class of compounds
inhibited TNF-α action e.g. dexamethasone inhibited the induction of IL-8 by
TNF-α (Nyhlen et al., 2004), also dehydroepiandrosterone (DHEA) and DHEA-
sulfate (DHEAS) inhibited TNF-α-induced NF-kB activation at transcription
level (Iwasaki et al., 2004).
1.2.6.2 cAMP elevating agents
The second class of TNF-α inhibitors, that have been studied extensively, are
the cAMP elevating agents (Tannenbaum & Hamilton, 1989; Irie et al., 2001),
such as dibutyryl cAMP (Endres et al., 1991), isoproterenol (Severn et al.,

Literature review
26
1992), and prostaglandin E (Renz et al., 1988; Lee et al., 1995; Liz-Grana &
Gomez-Reino Carnota, 2001). Also first and second generations of selective and
nonselective phosphodiesterase PDE IV inhibitors such as rolipram (Brideau et
al., 1999; Hartmann et al., 2000) suppress TNF-α release, too. It has already
been shown that rolipram completely abolished OTA mediated TNF-α release
from rat liver, indicating that this release required cAMP (Weidenbach et al.,
2000). The cAMP-elevating PDE-inhibitors inhibited LPS-stimulated TNF-α
release without effects neither on TNF-α mRNA expression nor on NF-kB
activation (Shames et al., 2001). Thus the mechanisms are different from the
transcription-related mechanism provoked by glucocorticoids. However, the
cAMP elevating agents suppress TNF-α release via different mechanisms such
as inhibition of leukotrienes or through elevation of prostaglandins or IL-10
levels.
1.2.6.3 Adenosine agonist
The third group of compounds, which was reported to suppress TNF-α release
were adenosine agonists. Adenosine is an endogenous nucleoside that regulates
numerous cellular functions including anti-inflammation processes (Jacobson et
al., 1992). Adenosine acts via cell surface receptors sub-typed as A1, A2A,

Literature review
27
A2B, and A3. The A2A receptor (A2AR), in particular, has been linked to anti-
inflammatory effects of adenosine (Lappin & Whaley, 1984). Therefore, an
A2AR agonist namely 2-p-(2-carboxyethyl)phenethylamino-5'-N-
ethylcarboxamido adenosine (CGS 21680) decreased TNF-α production from
stimulated monocytes by LPS, whereas A2AR antagonism significantly
increased TNF-α and blocked the inhibitory effect of CGS 21680. This A2AR-
dependent inhibitory pathway involves the formation of cyclic adenosine
monophosphate (cAMP) to activate protein kinase A, resulting in
phosphorylation of cAMP response element-binding protein (CREB). Phospho-
CREB has been shown to inhibit NF-kB transcriptional activity (Bshesh et al.,
2002). Similarly, the non-selective adenosine receptor agonist 5'-N-
ethylcarboxamidoadenosine (NECA) inhibited LPS-induced TNF-α release
from XS-106 cells. Furthermore, treatment with the selective adenosine A3
receptor agonist 1-[2-chloro-6[[(3 iodophenyl) methyl] amino] - 9H – purine - 9
- yl]- 1- deoxy – N - methyl-beta-D-ribofuranuronamide (Cl-IB-MECA) or the
selective adenosine A2A receptor agonist 4-[2-[[-6-amino-9-(N-ethyl-beta-D-
ribofuranuronamidosyl)-9H-purin-2-yl]amino]ethyl]benzene-propanoic acid
CGS 21680 alone partially inhibited lipopolysaccharide-induced TNF-α release
(when compared to NECA), whereas a combination of both agonists resulted in
the inhibition of TNF-α release comparable to that observed with NECA alone.

Literature review
28
Thus, at least two adenosine receptors (A2A, A3), activated by different
agonists, triggered inhibition of LPS-induced TNF- release in various cell
lines. On the other hand, treatment of cells with the adenosine A2A receptor
selective antagonists 4-(2-[7-amino-2-(2-furyl)[1,2,4]triazolo[2,3-
a][1,3,5]triazin-5ylamino]ethyl)phenol (ZM 241385) and 5-amino-2-(2-furyl)-7-
phenylethyl-pyrazolo[4,3-e]-1,2,4-triazolo[1,5c]pyrimidine (SCH 58261) and
the adenosine A3 receptor selective antagonist N-[9-chloro-2-(2-furanyl)[1,2,4]-
triazolo[1,5-c]quinazolin-5-benzeneacetamide (MRS 1220) partially blocked the
inhibitory effects of NECA on lipopolysaccharide-induced TNF-α release.
Combined addition of MRS 1220 and SCH 58261 completely blocked the
inhibitory effects of NECA on lipopolysaccharide-induced TNF-α release
(Dickenson et al., 2003).
In order to clarify the mechanistic effect of adenosine agonist-mediated TNF-α
inhibition and to determine the receptor subtype involved in this effect, a study
on the human macrophage cell line U937 was carried out. In this study A1/A3
agonist N6-(4-amino-3-iodobenzyl) adenosine (I-ABA) decreased LPS-
stimulated TNF-α protein production. The mechanism was pre-translational, as
adenosine receptor stimulation caused a marked decrease in TNF-α mRNA. The
rank order of agonists as TNF-α inhibitors suggested that preferentially the A3
receptor is involved because N6-(3-iodobenzyl)-9-[5-(methylcarbamoyl)-beta-

Literature review
29
D-ribofuranosyl] adenosine > 2-chloroadenosine > I-ABA > N6-benzyl 5'-N-
ethylcarboxamidoadenosine N6-benzyl-NECA > NECA > CGS21680 > N6-
cyclohexyladenosine. This was supported by the fact that a mixed A1/A3
antagonist (xanthine amine congener) reversed the effect, whereas A1-specific
(1,3-dipropyl-8-cyclopentylxanthine) and A2-specific (3,7-dimethyl-1-
propargylxanthine) antagonists did not (Sajjadi et al., 1996).
Adenosine (ADO) and the synthetic ADO analogue MDL201112 inhibited
TNF-α production from mouse peritoneal macrophages, J774 and RAW-264
cells. MDL201112 selectively inhibited the expression of steady-state TNF-α
RNA in LPS plus IFN-gamma-activated J774 and RAW-264 cells. ADO had no
effect on RNA levels for TNF-α suggesting that ADO acts at a post-
transcriptional biosynthetic step. Furthermore, the authors found a single i.p.
injection of MDL201112 in LPS-challenged animals inhibited the appearance of
TNF-α in the serum compared with the control group (Parmely et al., 1993).
1.2.6.4 Matrix metalloproteinases, TACE, and TNF-
Matrix metalloproteinases (MMPs) are a family of structurally related proteins
with the collective capability to degrade all components of the extracellular
matrix. Although MMP-mediated degradation of the extracellular matrix occurs

Literature review
30
physiologically and under numerous pathological conditions (reviewed by
Nozell et al., 2004), a number of reports identified and characterized a
membrane-associated metalloproteinase believed to be responsible for
enzymatic processing of a membrane-bound precursor of TNF-α (Mohler et al.,
1994; Solorzano et al., 1997). In vitro experiments showed that the matrix
metalloproteinase inhibitor [4-(N-hydroxyamino)-2R-isobutyl-3S-
(phenylthiomethyl)-succinyl]-L- phenylalanine-N-methylamide (GI 129471)
inhibited in vitro the elevation of TNF-α in LPS-stimulated human and mouse
whole blood (Murakami et al., 1998). GM-6001 also inhibited the release of
TNF-α and soluble TNF receptor (p75) from peripheral blood mononuclear
cells when stimulated with endotoxin and/or exogenous TNF-α and significantly
attenuated plasma TNF-α response in endotoxin challenged C57BL/6 mice
(Solorzano et al., 1997). The other proteinase inhibitor of this group is KB-
R7785, which inhibited soluble TNF-α production in spleen cell cultures when
stimulated by heat-killed Listeria monocytogenes. It reduced serum TNF-α
level in Listeria monocytogenes infected mice (Yamada et al., 2000). In
addition, BB-2275, a synthetic inhibitor of matrix metalloproteinase activity
(MMP), significantly reduced the levels of soluble TNF-α, p55 sTNF-R, and
p75 sTNF-R released from rheumatoid synovial membrane cell cultures
(Williams et al., 1996). The piperine compound inhibits the matrix
Literature review
31
metalloproteinase production and nuclear translocation of p65, p50, c-Rel
subunits of NF-kappa B and other transcription factors such as ATF-2, c-Fos
and CREB and subsequently inhibited TNF-α production from B16F-10 cells
(Pradeep & Kuttan, 2004).
On the other hand, TNF-α and TNF-β strongly stimulated the production of
MMP-2 and MMP-9 from bovine endometrial monolayer containing both
epithelial and stromal cells (Hashizume et al., 2003). In addition, PDE4
inhibitors rolipram, cilomilast, and CI-1044 are effective inhibitors for pro-
MMP-2 and pro-MMP-1 secretion induced by TNF-α (Martin-Chouly et al.,
2004).
It was found that the Chinese medicine Reduqing (RDQ) inhibited the
transcription of TNF-α mRNA induced by LPS stimulation through inhibition
of TNF-α-converting enzyme (TACE), and subsequently inhibited sTNF-α
secretion (Wang et al., 2003). In another study Reduqing was reported to have
double inhibitory effects on sTNF-α production and on the gene expression of
TACE stimulated by LPS (Wang et al., 2001). Also GW3333, a dual inhibitor
of (TACE) and matrix metalloproteinases (MMPs), completely blocked
increases in plasma TNF- in LPS challenged mice and TNF in the pleural
cavity after intrapleural zymosan injection (Conway et al., 2001).

Literature review
32
1.2.6.5 CSAID Cytokine inhibitors
Bicyclic imidazoles are a novel class of nonsteroidal anti-inflammatory
compounds that display unique pharmacological profiles by reducing cytokine
production and arachidonic acid metabolism. Pretreatment of pigs with SK&F
86002 significantly attenuated LPS-induced increases in plasma TNF-α (Triplett
et al., 1996), and also inhibited serum TNF-α in LPS-challenged mice (Badger
et al., 1989; Spinelle-Jaegle et al., 2001) and in male Sprague-Dawley rats
(Smith et al., 1991). Similar effects of SK&F 86002 have been shown in LPS
treated human monocytes (Prabhakar et al., 1993; Prichett et al., 1995). This
inhibition didn’t effect TNF mRNA accumulation, suggesting a post-
transcriptional action (Prichett et al., 1995). Furthermore, inhibitory effects of
SK&F 86002 and related analogs of the pyridinyl imidazole class on TNF-α
production were mediated via a cAMP-dependent mechanism, although the
pyridinyl imidazole compounds were found to be generally weak
phosphodiesterase inhibitors, which did not affect cAMP levels in human
monocytes, alone or in the presence of LPS (Kassis et al., 1993).
The test compounds SK&F 105809, SK&F 105561, SK&F 104351, SK&F
104493 have been shown to inhibit the production TNF-α from human
monocytes in vitro, and in vivo they reduced the plasma level of TNF-α in LPS

Literature review
33
challenged mice (Griswold et al., 1993; Votta & Bertolini, 1994). Two
lysophosphatidylcholine acyltransferase (LPCAT) inhibitors SK&F 98625
(diethyl 7-(3,4,5-triphenyl-2-oxo2,3-dihydro-imidazole-1-yl) heptane
phosphonate) and YM 50201 (3-hydroxyethyl 5,3'-thiophenyl pyridine) strongly
inhibited TNF-α production in response to LPS in both unprimed MonoMac-6
cells and in cells primed with IFN-γ. The inhibitory effects of SK&F 98625
resulted from reduction of TNF-α mRNA levels in MonoMac-6 cells (Schmid et
al., 2003). Furthermore, SK&F 98625-induced inhibition of TNF-α production
from peritoneal macrophages incubated in medium containing thapsigargin
(Yamada et al., 1998a).
Literature review
34
1.3 Arachidonic acid Arachidonic acid is a polyunsaturated fatty acid is derived directly from
linolenic acid or is ingested as a dietary constituent. Arachidonic acid is stored
in the cell membrane of virtually all cells and is released in response to stimluli
such as histamine and platelet-derived growth factor. Arachidonic acid can be
released by three pathways: (1) conversion of phosphatidyl ethanolamine or
phosphatidyl choline to phosphatidic acid in a reaction catalysed by
phospholipase D (PLD), followed by formation of diglyceride and
monoglyceride and the release of arachidonic acid; (2) degradation of
phosphatidylinositol via a sequence of reactions beginning with PLC cleavage
of the phosphodiester bond of membrane lipids to yield diacylglycerol, followed
by the action of dilglyceride lipase and monoglyceride lipase to release
arachidonic acid and glycerol; and (3) direct action of PLA2 on a phospholipid.
Figure 2 shows the three major pathways involved in arachidonic acid
metabolism (a) The cyclooxygenase (COX) pathway results in the formation of
prostaglandin G2 (PGG2) from arachidonic acid by a cyclooxygenase reaction.
In a subsequent peroxidase reaction, PGG2 undergoes a two-electron reduction
to PGH2. Both of these reactions are catalysed by COX (prostaglandin synthase
H). PGG2 serves as a substrate for cell-specific isomerases and synthases,

Literature review
35
producing other eicosanoids such as prostacyclin (PGI2) and thromboxane A2
(TXA2). (b) The lipoxygenase pathway forms hydroperoxyeicosatetraenoic
acids (HPETEs) and dihydroxyeicosatetraenoic acid (DEA) by lipoxygenase
and subsequently converts these to (1) hydroxyeicosatetraenoic acids (HETEs)
by peroxidases, (2) leukotrienes (e.g. LTC4) by hydrase and glutathione S-
transferase (GST), and (3) lipoxins by lipoxygenases. (c) The epoxygenase
pathway forms epoxyeicosatrienoic acid (EET) and dihydroxyacids by
cytochrome P-450 epoxygenase (Holtzmann, 1992; Brash, 2001; Zeldin, 2001).
These products and the nonenzymatic transformations have well-substantiated
bioactivities. Unchanged arachidonic acid itself has biological activity and is
involved in cellular signaling as a second messenger (Brash, 2001).
However, TNF-α action (Vondracek et al., 2001), or release is modulated by
arachidonic acid (Stuhlmeier et al., 1996) and some of its metabolites (Renz et
al., 1988). On the other hand, in the presence of TNF-α arachidonic acid and its
products were released in several cell lines due to the activation of
phospholipase A2, which mediated and potentiated TNF-α toxicity (Reid et al.,
1991; Hayakawa et al., 1993; Liu and McHowat, 1998).

Literature review
36
Fig. 2 Arachidonic acid metabolic signaling cascade
GST Hydrolase Lipoxygenases
5,12,15 Lipoxygenases
Cytochrome p450
epoxygenase Dehydrase
Isomerases/synthases
Cox

Research objectives
37
Chapter 2. Research objectives
The liver is among the target organs of OTA because of its food-borne exposure
via the portal vein after mycotoxin absorption from the gut. Because an
enterohepatic circulation of OTA was reported in rat repeated exposure of liver
cells to internally circulating OTA occurs as well. Ochratoxin A is transported
from blood into hepatocytes by carrier-mediated transport. The liver is also a
major organ for systemic release of inflammatory cytokines, i.e. TNF- and IL-
6, upon exposure to gut-derived bacterial toxins i.e. lipopolysaccharides. TNF-
plays an important role in liver regeneration, and promotes the pathogenesis of
chronic liver disorders. Therefore, the aim of this study is summarized in
following questions.
1- Does experimental passage of OTA via the portal vein of blood-free
perfused rat livers induce TNF-α?
2- Does this release have significant meaning in comparison with LPS?
3- Which liver cell types in blood-free perfused rat livers serve as TNF-α
source in response to OTA?
4- Is the OTA effect restricted to the liver or do other organs contribute to
TNF-α release?

Research objectives
38
5- Are the arachidonic acid and its metabolites influenced by OTA-mediated
TNF-α release from blood-free perfused rat livers?
6- Which signaling pathway does OTA use to induce TNF-α release?

Materials & Methods
39
Chapter 3. Materials & Methods
3.1 Materials
3.1.1 Chemicals & Reagents
Chemical Name Source
Anti-CD14 (mouse IgG1) Alexis Biochemicals, Grünberg, Germany
Arachidonic acid (5, 8, 11, 14-eicosatetraenoic acid)
sodium salt
Sigma-Aldrich Co. Steinheim, Germany
Aristolochic acid sodium salt (type I & II)
(C17H10NHaO7)
Sigma-Aldrich Co. Steinheim, Germany
Caffeic acid phenylethyl ester Alexis Biochemicals, Grünberg, Germany
Calcium chloride dihydrate(CaCl2•2H2O) E. Merck Darmstadt, Germany
Collagen type VII, from rat tail Sigma-Aldrich Co. Steinheim, Germany
Collagenase type CIS, 212U/mg Biochrom AG, Berlin, Germany
Collagenase NB 4 from Cl. histolyticum 0.161 PZU/mg SERVA Electrophoresis GmbH, Heidelberg,
Germany
Dextran (Leuconostoc mesenteroides, strain No. B-512) Sigma-Aldrich Co. Steinheim, Germany
Digitonin p.A SERVA Electrophoresis GmbH, Heidelberg,
Germany
DMSO SERVA Electrophoresis GmbH, Heidelberg,
Germany
DNase I Boehringer, Germany
Dulbeccos modified Egales medium (DMEM) GIBCOTM , Paisley, Scotland, UK
Ethanol E. Merck Darmstadt, Germany

Materials & Methods
40
Gadolinium chloride hexahydrate (GdCl3) Sigma-Aldrich Co. Steinheim, Germany
Glucose anhydrous (C6H12O6) E. Merck Darmstadt, Germany
Heat inactivated fetal calf serum Sigma-Aldrich Co. Steinheim, Germany
Heparin, Liquemin® 5000 IU/ml Sigma-Aldrich Co. Steinheim, Germany
Indomethacin (C19H16CINO4) Sigma-Aldrich Co. Steinheim, Germany
Lipopolysaccharide (E. Coli serotype 0111:B4) Sigma-Aldrich Co. Steinheim, Germany
Magnesium chloride hexahydrate (MgCl2•6H2O) E. Merck Darmstadt, Germany
Magnesium sulphate heptahydrate (MgSO4•7H2O) E. Merck Darmstadt, Germany
Metyrapone (2-methyl-1, 2-di-3-pyridyl-1-propane) Sigma-Aldrich Co. Steinheim, Germany
Modified HANK's balanced salt solution Ca2+ free Sigma-Aldrich Co. Steinheim, Germany
Modified HANK's balanced salt solution with Ca2+ Sigma-Aldrich Co. Steinheim, Germany
Nordihydroguaiaretic acid (NDGA) (1, 4-bis[3,4-
Dihydroxyphenyl]-2,3-dimethylbutane), from Larrea
divaricata (creosotebush)
Sigma-Aldrich Co. Steinheim, Germany
Nycodenz® 5-(N-2,3-dihydroxypropylactemido)-2, 4,
6,tri-iodo-N,N'-bis (2,3 dihydroxypropyl)
isophthalamide
AXIS-SHIELD PoC AS, Oslo, Norway
Ochratoxin A (MT-I-161A) CSIR, Food Science and Technology, Pretoria, South
Africa
Penicillin & Streptomycin GIBCOTM , Paisley, Scotland, UK
Potassium chloride (KCl) E. Merck Darmstadt, Germany
Potassium dihydrogen phosphate (KH2PO4) E. Merck Darmstadt, Germany
Pronase E E. Merck Darmstadt, Germany
RPMI 1640 medium Biochrom AG, Berlin, Germany
Sodium chloride (NaCl) E. Merck Darmstadt, Germany
Sodium dihydrogen phosphate monohydrate
(NaH2PO4•H2O)
E. Merck Darmstadt, Germany
Sodium hydrogen carbonate (NaHCO3) E. Merck Darmstadt, Germany

Materials & Methods
41
Trypane blue Sigma-Aldrich Co. Steinheim, Germany
Trypsin/EDTA GIBCOTM , Paisley, Scotland, UK
Urethane Fluka chemie AG Switzerland
3.1.2 Kits
TNF-α Enzyme linked immunosorbant assay
(ELISA) kit Cytoscreen®
BioSource International, Camarillo, Canada, with
antibodies selective for detection of rat TNF-α
Lactate dehydrogenase (LDH) Roche Diagnostics Corporation, Indianapolis, USA
Glutamate dehydrogenase (GLDH) Roche Diagnostics Corporation, Indianapolis, USA
Lactate Roche Diagnostics Corporation, Indianapolis, USA
3.1.3 Instruments
Autoclave SANOClav, Lam-201, Geislineen, Germany
Balance CAHN Microbalance C-30. INC. Cerritos, California, USA
Balance METTLER AE 260, DeltaRange®,Gießen, Germany
Benchmark microplate reader BIO-RAD labrotories GmbH, Munch, Germany
Biohazard Laminar flow cabinet danLAF® VFR 1806, Denmark
Centrifuge Eppendorf 4515D, Eppendorf-Nether-Hinz GmbH,
Hamburg,Germany
Centrifuge BHG HERMLE Z2364, Gosheim, Germany
Gradient centrifuge Sigma 4k15, sigma international
JE-6B elutriation system and rotor Beckman Instruments, Inc. Palo Alto, USA
Freezer (-20 0C) LIEBHERR Premium, -20
Freezer (-80 0C) Nap Coil UF 400
Heating magnetic stirrer Heidolph MR82

Materials & Methods
42
Incubator New Brunswick Scientific, New Jersey USA
Light microscope ORTHOMATTM,Leitz Fluovert, Wetzlar, Germany
Microliter pipettes (10 μl – 1000 μl) Eppendorf-Nether-Hinz GmbH, Hamburg,Germany
Perfusion system House made, Gießen, Germany
pH meter CG 841, Schott, Mainz Germany
Refrigerator LIEBHERR Premium.
Surgical and anatomical set Hebu GmbH Weilheim, Germany
Vortex mixer Heidolph, REAX 1DR, Germany
Water bath Julabo SW1, Julabo Labortechnik, seelbach, Germany
3.1.4 Disposable materials:
All disposable materials were obtained from Sarstedt, Aktiengesellschaft & Co.,
Nümbrecht, Germany
1) Syringes (1ml, 5ml, 10ml and 20ml)
2) Non pyrogenic plane tubes (1.5, 15, 50 ml)
3) Tissue culture plates (different size)
4) Blue, yellow and white tips
3.1.5 Cell types
Cell name Identification Sources
L929 NCTC clone 929, clone
strain L, connective tissue,
mouse
Obtained from Dr. Ayub Darji, Institute of
Medical Microbiology, Justus-Liebig-
University Gieβen

Materials & Methods
43
J774 A.1 Mouse Monocyte
macrophage cell line
Obtained from Dr. Ayub Darji, Institute of
Medical Microbiology, Justus-Liebig-
University Gieβen
HepG2 Human hepatoma cell line Obtained from Dr. Ayub Darji, Institute of
Medical Microbiology, Justus-Liebig-
University Gieβen
Hepatocytes Primary cells Prepared in Pharmacology & Toxicology
Institute, Justus-Liebig-University Gieβen
Kupffer cells Primary cells Prepared in Clinics of Gastroenterology,
Hepatology and Infectiology. Heinrich-
Heine University Düsseldorf
Peritoneal rat macrophages Primary cells Prepared in Pharmacology & Toxicology
Institute, Justus-Liebig-University Gieβen
Sinusoidal endothelial cells Primary cells Prepared in Clinics of Gastroenterology,
Hepatology and Infectiology. Heinrich-
Heine University Düsseldorf
3.2 Animals
Male Wistar rats (200-280g) were used in all experiments. The animals were
fed ad libitum with Altromin® standard diet and received water ad libitum.
They were kept under 12-hr light-dark cycles at 22°C temperature and
ventilation under standard conditions. The health of rats was routinely tested by
sentinel animals and the animals were found to be free of chronic infections and
parasites.

Materials & Methods
44
3.3 Solutions & buffers
3.3.1 Krebs-Henseleit buffer
Component mM g/L
Glucose anhydrous 5.56 1.0
NaHCO3 25 2.1
NaCl 118 6.9
KCl 4.7 0.35
MgSO4•7H2O 1.2 0.3
KH2PO4•2H2O 1.2 0.16
CaCl2•2H2O 1.7 0.25
The volume was completed to 1000 ml by deionized water. The mixture was
dissolved well and transferred to a shaker water bath at 37 0C with continuous
gas (95% O2-5% CO2) supplement. Finally, pH was adjusted to 7.4 by 1 N HCl.
3.3.2 Krebs-Henseleit buffer Ca2+ free
Component mM g/L
Glucose anhydrous 5.56 1.0
NaHCO3 25 2.1
NaCl 118 6.9

Materials & Methods
45
KCl 4.7 0.35
MgSO4•7H2O 1.2 0.3
KH2PO4•2H2O 1.2 0.16
The volume was completed to 1000 ml by deionized water. The mixture was
dissolved well and transferred to a shaker water bath at 37 0C with continuous
gas (95% O2-5% CO2) supplement. Finally, pH was adjusted to 7.4 by 1 N HCl.
3.3.3 Tyrode buffer
Component mM g/L
Glucose anhydrous 5.56 1.0
NaHCO3 25 2.1
NaCl 219 12.8
KCl 4.7 0.35
MgSO4•7H2O 1.18 0.29
KH2PO4 1.18 0.21
The volume was completed to 1000 ml by deionized water. The mixture was
dissolved well and transferred to a shaker water bath at 37 0C with continuous
gas (95% O2-5% CO2) supplement. Finally, pH was adjusted to 7.4 by 1 N HCl.

Materials & Methods
46
3.3.4 Phosphate buffer
Component mM g/L
NaCl 137 8.0
KCl 2.68 0.28
KH2PO4 1.14 0.160
Na2PO4•7H2O 7.3 1.14
The volume was completed to 1000 ml by deionized water. The mixture was
dissolved well. Finally, pH was adjusted to 7.4 and autoclaved.
3.3.5 Modifid HANK's balanced salt solution with Ca2+
Component mM g/L
CaCl2•H2O 1.25 0.185
MgSO4 (anhydrous) 0.831 0.09767
KCl 5.37 0.4
KH2PO4 (anhydrous) 0.34 0.06
NaHCO3 4.17 0.35
NaCl 136.89 8.0
NaHPO4 (anhydrous) 0.4 0.04788

Materials & Methods
47
D-Glucose 5.55 1.0
3.3.6 Modifid HANK's balanced salt solution Ca2+ free
Component mM g/L
KCl 0.831 0.4
KH2PO4 (anhydrous) 5.37 0.06
NaHCO3 0.34 0.35
NaCl 4.17 8.0
NaHPO4 (anhydrous) 136.89 0.04788
D-Glucose 0.4 1.0
3.4 Methods
3.4.1 Ochratoxin A and tested compound preparations
Compounds were weighted using sensitive balance (CAHN Microbalance C-30.
INC. Cerritos, California, USA), then dissolved according to their chemical
properties using absolute ethanol or buffers and stored at 4 0C no longer than
one week.
Materials & Methods
48
3.4.2 Liposome preparation and administration
The multilamellar liposomes were prepared as described earlier by Van Rooijen
and coworker (Van Rooijen & Sanders, 1994). First, 11 mg cholesterol and 75
mg phosphatidylcholine were dissolved in chloroform in a 500-ml round-
bottom flask. After low-vacuum rotary evaporation a thin film was formed on
the interior of the flask. This film was dispersed by rotation for 10 min in 10ml
phosphate-buffered saline (PBS) solution in which 0.7M clodronate (a kind gift
of Roche Diagnostics, Mannheim, Germany) was dissolved. After removal of
the lipid film, the suspension was kept for 2 hrs at room temperature and
sonicated for 3 min in a water bath sonicator. This suspension remained for
another 2 hrs at room temperature for liposome swelling. The liposomes were
centrifuged for 30 min at 25,000 g to wash out the free clodronate. In order to
get the proper concentration, 6 mg clodronate per ml suspension, the liposomes
were resuspended in 4 ml PBS. During this period no perceptible leakage of
clodronate out of the liposomes can be found. Livers were prepared from rats
which received 48 hrs before liver preparation 2ml/rat liposome encapsulated
clodronate by i.p. injection and, for control, 2ml/rat liposomes encapsulated
buffer medium. Liposome-encapsulated clodronate (LIP-CLOD) and liposome-
encapsulated phosphate-buffered saline (LIP-PBS) were sent by air mail in kind
of cooperation, then stored at 4°C for no longer than 2 weeks.

Materials & Methods
49
3.4.3 Rat liver preparations
The rats were anesthetized by an intraperitoneal injection of 1-1.5 ml 20%
urethane solution, and heparinized with 0.3 ml/kg of b.w. Liquemin® 5000
IU/ml i.v. into the femoral vein. After laparotomy a catheter was inserted into
the portal vein and another catheter inserted in the cranial vena cava. By
perfusion with Krebs-Henseleit solution the rats were killed by exsanguination.
Then, the liver was excarporated and perfused with Krebs-Henseleit solution
about 10-15 min to completely remove the blood (Fig. 3A).
Fig. 3A: Blood-free rat liver
The liver of a male Wistar rat was placed on a support and was washed with Krebs-Henseleit solution for about 10-15 minutes to completely remove the blood. One catheter (A) was inserted into the cranial vena cava and the other catheter (not shown) was inserted into the portal vein.
A
Materials & Methods
50
3.4.4 Isolated blood-free liver perfusion
Isolated blood-free rat livers were perfused as described previously by AL-
Anati et al., 2005. Briefly, blood-free rat livers were placed in an experimental
perfusion setup, installed in a temperature-controlled hood. Livers were re-
circulated with 75 ml of 2% dextran Krebs-Henseleit solution via the portal vein
catheter at 37°C. The system was supplemented by 95% O2- 5% CO2 gassing,
the flow rate and the pH of perfusate were monitored and controlled during the
experiments (Fig. 3B). The livers were equilibrated with the perfusion buffer
(without tested compound) during a pre-experimental period of 10 min. After
that zero-samples from the perfusate were taken. Then, the corresponding
substances were injected via a portal vein inlet to the perfusion medium and 10
min later ochratoxin A, 1μg/ml (2.5μmol/L), or 0.1 µg/ml LPS were added at
t=20min after zero-time.
For controls, each tested compound was given alone and then tested for TNF-α
in combination with ochratoxin A under identical experimental conditions.
Basal TNF-α release was measured on isolated perfused rat livers without
treatment.

Materials & Methods
51
Fig. 3B: Schedule of perfusion
The figure shows the flow of gas and perfusion fluid in the experimental perfusion setup. The flow of O2\Co2 gas comes from (A) a carbogen gas bottle through a water bottle, then moves through a tube (B, C, D, and E) to enter the artificial lung (F and G) and then leaves the lung through tube (H and I) to reach the perfusion fluid (J). The perfusion fluid starts from the artificial heart (1 and 2) by the action of a roller pump, then passes (3 and 4) a filter on the top of the lung. The fluid accumulates in the basis of the lung and passes (6) to the liver via the cranial vena cava catheter. The fluid leaves the liver through the portal vein catheter from where the samples are taken and circulates back to the heart (7). From the maximum fluid level in the basal part of the lung, the extra fluid returns back to the heart as shown by label (8).
Materials & Methods
52
3.4.5 Isolation of sinusoidal endothelial and Kupffer cells
Kupffer cells and sinusoidal endothelial cells were isolated according to the
collagenase/pronase digestion method of Eyhorn et al. 1988. Briefly, blood-free
isolated rats livers were perfused via the portal vein with a modified HANK's
balanced salt solution Ca2+ free at 7.5 ml/min for 5-10 min. Then livers were re-
perfused with 80 ml RPMI 1640 medium containing 34.4 mg/ml pronase E for
10 min at a flow rate of 10 ml/min. The medium was replaced by 100 ml RPMI
1640 medium containing 40 mg collagenase type CIS and 22.6 mg pronase E
and livers were re-circulated for 30 min at 20 ml/min with gassing with air
containing 5% CO2. After that livers were dissected and tissues digested for 15-
30 min in 120 ml RPMI 1640 medium containing 20mg collagenase type CIS,
5.3 mg/ml pronase E and 5 mg/ml DNase. During the incubation, the pH was
carefully controlled to 7.4-7.6 by gassing with air containing 5% CO2 and
adding small amounts of 0.1 M NaOH. Subsequently, the cell suspension was
filtered through sterile mesh 300 µm into 3 tubes and centrifuged (1800 rpm, 10
min at 40C) (Sigma 4k15). The pellets were re-suspended in 10 ml HANK's
balanced salt solution with Ca2+, then centrifuged (1800 rpm, 10 min at 40C)
(Sigma 4k15) again. The cell pellets were re-suspended by HANK's balanced
salt solution with Ca2+ in 10 ml maximum when 14 ml of Nycodenz® was
added to this suspension, then divided to 2 tube's. 1ml of fresh HANK's
Materials & Methods
53
balanced salt solution with Ca2+ was dropped carefully on the tubes wall to form
a clear layer above the suspension surface. The tubes were subjected to a
density centrifugation at 3500 rpm for 20 min (Sigma 4k15). Afterwards, the
upper 3 of 4 formed layers from each tube were collected and the volume was
completed to be 10 ml by cold RPMI 1640 medium, mixed and injected into the
JE-6B elutriation system & rotor (Beckman Instruments). The speed was
gradually raised from 4.4 (19ml/min) to 6.7 (27ml/min). The outlets were
collected in tubes, which contained pure sinusoidal endothelial cells. The outlets
starting from 8 to 14 (32-51ml/min) contained pure Kupffer cells. The cells
were collected separately and centrifuged at 1800 rpm for 10 min at 4 0C. The
pellets finally were re-suspended in RPMI 1640 medium containing 10% heat-
inactivated fetal calf serum and penicillin (100 IU/ml) and streptomycin (100
µg/ml). The cells were counted by Bürker-Türk counter and adjusted to be 2x
106 cells/ml which were seeded in tissue culture plats. Experiments were carried
out under culture conditions.
3.4.6 Isolation of hepatocytes
Hepatocytes were isolated by a collagenase perfusion method as already
described by Petzinger et al., 1989. Briefly, isolated blood-free rat livers
prepared as above were placed in an experimental perfusion setup, installed in a

Materials & Methods
54
temperature controlled hood. Livers were perfused with 75 ml of Ca2+ free
Krebs-Henseleit solution containing 60mg collagenase type NB 4 for 15 min in
temperature-controlled hood at 37°C under 95% O2 -5% CO2 gassing. After that
livers were carefully dissected and tissue digested for 5 min in the perfusate
solutions by bubbling gas. The cell suspensions were filtered through double
layers sterile gauze into 4 tubes. The volume was adjusted by Krebs-Henseleit
solution Ca2+ and centrifuged at 300-400 rpm for 10 min (BHG HERMLE
Z2364). The pellets were re-suspended by Tyrode buffer 5.5 mM glucose
without albumin then washed 3 times. The cell suspensions were filtered
through 4-6 layers gauze into 4 tubes. The cells regenerated through incubation
these suspensions in shaker water bath (Julabo SW1) adjusted at 37oC and
provided by 95% O2 -5% CO2 gas for 30 min, then centrifuged again (BHG
HERMLE Z2364). Finally, cells were suspended in Dulbeccos Modified Eagles
medium (DMEM) containing 10% heat-inactivated fetal calf serum, penicillin
(100 IU/ml), and streptomycin (100 µg/ml). The cells were counted under
microscope by Bürker-Türk counter and adjusted to be 2x 10⁶ cells/ml, then
were seeded in collagen pre-coated tissue culture plates. Experiments were
carried out under culture conditions.

Materials & Methods
55
3.4.7 Peritoneal rat macrophages preparation
Peritoneal macrophages were prepared as described previously by Renz et al.,
1988 with some modification. Rats received 5µg concavalin A in 1ml buffer i.p.
5 days before being killed by carbon dioxide gas. The abdominal skin was
removed and sterile phosphate buffer 50-60 ml containing 50 IU heparin and
5% glucose was injected into the abdominal cavity. After 5 min fluid was
aspirated (about 50ml) and transfered to sterile tubes. Tubes were centrifuged at
1200 rpm about 10-15 min (BHG HERMLE Z2364), the supernatant aspirated
and cells were washed with phosphate buffer 3 times, then resuspended by
Dulbeccos modified Eagles medium (DMEM) supplemented with 10% fetal
calf serum, 100 IU/ml penicillin and 100 mg/ml streptomycin. Cell suspensions
were seeded in culture plates and incubated at 37 °C with humidified 5% CO2
atmosphere for 2 hr to allow macrophages to adhere on flask bottom. Culture
medium with flooded cells was aspirated and adhered cells harvested by trypsin,
then re-suspended by culture medium and 5 ml of 2x10⁶ cells/ml again seeded
in culture plates and incubated at 37 °C with humidified 5% CO2 atmosphere
for 2 hr to allow macrophages to adhere on flask bottom again. Experiments
were carried out under culture conditions.

Materials & Methods
56
3.4.8 Cell lines L929, HepG2, and J774A.1
Connective tissue derived cell line (L929), human hepatoma cell line (HepG2)
and mouse monocyte macrophages (J774A.1) cell line were cultured under
routine techniques. Briefly, the cells were taken out from liquid nitrogen and
were thawed at 37 °C in water bath, then were suspended in Dulbeccos
modified Eagles medium (DMEM) supplemented with 10% fetal calf serum,
100 IU/ml penicillin and 100 mg/ml streptomycin. Cells were seeded in tissue
culture plates, and incubated at 37 °C with humidified 5% CO2 atmosphere. The
cells were monitored during the growth with replacement of culture medium
each 72 hrs until the plates became overcrowded with cells. Then the cells were
harvested by trypsin and the cells resuspended by culture medium and finally
transferred to several culture flasks. When these became full of cells (about 10x
106 cells), then 5 ml of new medium were added and experiments were carried
out under culture conditions.
3.4.9 Cell counting
1) 400 µl Tyrode buffer
2) 50 µl cell suspension
3) 50 µl trypan blue stain

Materials & Methods
57
From this mixture 10 µl were counted in a Bürker-Türk counter chamber. The
mean of alive cells in four large counted squares was taken and multiplied by
0.1625 to get the number of cells/ml of original suspension. Then the cell
number was adjusted to 2x10⁶ cells/ml into the particular cell medium.
3.4.10 Culture conditions
5 ml of each single cell suspension, each at 2 x 10⁶ cells/ml, were incubated in
media supplemented with 10% heat-inactivated fetal calf serum and
penicillin/streptomycin (100IU & 100µg/ml respectively), at 37°C in a
humidified atmosphere of 5% CO2 air. Freshly prepared hepatocytes and
sinusoidal endothelial cells were transferred to tissue culture plates pre-coated
with collagen, while Kupffer cells, peritoneal macrophages, and cell lines L929,
J774A.1, and HepG2 were seeded in uncoated tissue culture plates. Primary
cells and cell lines were incubated without OTA or LPS during a pre-
experimental period of 2 hrs. After that zero-culture medium samples were
taken. The tested substances were added to Kupffer cells culture only after 30
min of zero time before 1μg/ml (2.5μmol/L) OTA or 0.1 µg/ml of LPS were
added to culture media after 1 hr after zero sample.
Materials & Methods
58
For controls each compound was given alone and then tested for TNF-α in
combination with ochratoxin A under similar experimental conditions. Basal
TNF-α release was measured in culture media without treatments.
3.4.11 Sampling schedule
Perfusate samples were collected directly from perfused liver outlets according
to the following time schedule at 0, 20, 30, 50, 70, and 90 min (end point).
Culture samples were collected under sterile laminar flow at 0, 0.5, 1, 1.5, 2, 4
and 24 hrs (the end point). Samples were stored at -70 °C until analysis by a rat
TNF-α ELISA test system according to the company’s instruction (see TNF-α
assay section). Samples for cytotoxicity studies were analyzed in the Institute of
Clinical Chemistry and Pathochemistry, Justus-Liebig-University Gieβen, in
kind of cooperation.
3.4.12 Cytotoxicity markers
According to Guillouzo, 1998, the vitality of the liver was determined by
assaying leakages to perfusate of lactate dehydrogenase (LDH), glutamate
dehydrogenase (GLDH), lactate and potassium ion (K+). In the same way direct
cytotoxicity of 1μg/ml OTA (2.5μmol/L) or 0.1µg/ml LPS were investigated

Materials & Methods
59
and compared with cytotoxicity exerted by 0.01% digitonin in the perfusion
system. OTA and digitonin were added 20 min after zero time.
3.4.13 TNF-α assay
1- The number of 8-well strips needed for the assay were determined and
inserted in the frame for current use (the extra strips and frame re-bagged
and stored in refrigerator for another use).
2- 50 µl of Incubation Buffer was added to all wells. Wells reserved for
chromogen blank were left empty.
3- 100 µl of Standard Diluent Buffer was added to zero wells. Wells
reserved for chromogen blank were left empty.
4- 100 µl of Standards were added to the appropriate microtiter wells.
(Standard was reconstituted according to the labeled vial, to be 1000
pg/ml, then two fold dilution was done to reach 15.6 pg/ml). 50 µl of
Standard Diluent Buffer was added to each well followed by 50 µl of
diluted samples. Samples were diluted to be within the range of
determination, then the plate was taped gently on the side and thoroughly
mixed.

Materials & Methods
60
5- 50 µl of biotinylated anti-TNF-α (Biotin Conjugate) solution was pipetted
into each well except the chromogen blank, then the plate was taped
gently on the side and thoroughly mixed.
6- The plate was covered with plastic plate cover (provided in kit) and
incubated for 1 hour and 30 minutes at room temperature.
7- The solution was thoroughly aspirated from each well and discarded.
Wells were washed 4 times with 250 µl, each time using washing buffer
(25ml of the provided washing buffer was diluted in 1.25 L of deionized
water).
8- 100 µl of Streptavidin-HRP Working Solution was added to each well
except the chromogen blank. (Streptavidin-HRP Working Solution was
prepared by mixing of 120 µl 100x concentrated solution with 12 ml of
Streptavidin-HRP Diluent).
9- The plate was covered with plastic plate cover (provided in kit) and
incubated for 45 minutes at room temperature.
10- The solution was thoroughly aspirated from each well and the liquid was
discarded. Wells were washed 4 times with 250 µl each time using
washing buffer (25 ml of the provided washing buffer was diluted in
1.25L of deionized water).

Materials & Methods
61
11- 100 µl of Stabilized chromogen was added to each well. The liquid in the
wells turned to colorize blue.
12- The plate was covered with plastic plate cover (provided in kit) and
incubated for 30 minutes at room temperature in dark place.
13- 100 µl of Stop Solution was added to each well, then the plate was taped
gently on the side and thoroughly mixed. The solutions in each well were
changed from blue to yellow.
14- The absorbance of each well was registered at 450 nm having blanked the
plate reader against a chromogen blank composed of 100 µl each of
Stabilized Chromogen and Stop Solution.
15- Absorbances of the standards were plotted against the standard
concentrations to obtain the best fitted curve.
16- The concentrations of unknown samples were calculated from the
standard curve plotted in step 15. The concentration was multiplied by a
dilution factor used during samples preparation.
3.5 Statistical analysis
Data are presented as mean ± SEM for at least three separated trials for each
experiment. An unpaired student's t-test was used for comparison of TNF-α
release under the tested compounds with basal TNF-α release, while the

Materials & Methods
62
experiments of concurrently administered compounds with ochratoxin A were
compared with ochratoxin A alone. For multiple group comparisons two way
ANOVA used for analysis of variance followed by Bonferroni t test. A P value
*<0.05, **< 0.01, ***< 0.001 compared with control values was considered
statistically significant. Data were analyzed by Graphpad Prism software
version 4.0 (San Diego, California, USA).
Results
63
Chapter 4. Results
4.1 Induction of TNF-α from blood free perfused rat livers
The isolated perfused liver represents an in vitro model copying the in vivo liver
situation. Major advantages are that the three-dimensional architecture and bile
flow are preserved and that bile can be collected and analyzed separately. It is
also the only in vitro model that allows consideration of issues related to
hemodynamics (Conway et al, 1983). Therefore, in our study we used blood-
free perfused rat livers to investigate the effects of OTA on cytokine release, in
particular of TNF-α. Blood-free rat livers were perfused with 75 ml Krebs-
Henseleit buffer containing 2% dextran 90 min and buffer samples were
collected and tested for TNF-α at indicated time points. Figure 4 shows TNF-α
concentrations in perfusates increasing gradually from 35 pg/ml at zero time to
265 pg/ml at 90 min. These basal TNF-α concentrations were detected in
perfusate samples, which were obtained from untreated livers.
Figure 4 also shows experiments after adding OTA in different concentrations
at the time point 20 min. The addition of 0.5 µmol OTA/l to the perfusion
system almost doubled TNF-α concentrations and an almost 2-fold TNF-α
(P<0.001) elevation was seen at 90 min to be about 500 pg TNF-α/ml. When
OTA was added into the perfusion system at 2.5 µmol/l, TNF-α concentration
Results
64
sharply increased 30 min after its application and reached 2600 pg/ml at 90 min.
The increase was ten times of the basal level at this time end point. The
differences in TNF-α concentrations are statistically significant at P<0.001 from
50 min until the end of perfusion (Fig. 4). Higher OTA concentration at 12.5
µmol OTA/l caused amplification of TNF-α concentration in the perfusate to be
3000 pg/ml at 90 min. Livers responded ten min after this dosage and elevation
in TNF-α levels was significant at P<0.001 starting from 30 min to the end of
perfusion (Fig. 4).
In order to have a positive control, the livers were perfused with 0.1µg/ml LPS,
the known TNF-α inducer. Re-circulation of LPS in the perfusate caused
significant (P<0.001) release of TNF-α from 50 min to 3017 pg/ml at 90 min
(Fig. 4).
TNF-α released by 2.5 µmol OTA/l was significantly (P<0.001) higher than that
released by 0.5 µmol OTA/l at all tested time points. However, it was less than
that released by 12.5 µmol OTA/l in particular at 50 and 70 min (P<0.001). At
90 min TNF-α released by two doses (2.5 & 12.5 µmol OTA/l) showed similar
perfusate levels.
TNF-α released by 0.1 µg/ml LPS was significantly (P<0.01) higher at 50 min
and (P<0.001) at 70 min than that released by 2.5 µmol OTA/l. At 90 min no
significant difference was observed between 0.1 µg/ml LPS and 2.5 µmol

Results
65
A B C D E0
1000
2000
3000
4000
5000
***
***
1 2 43
5 6
1= 0 min2= 20 min3= 30 min4= 50 min5= 70 min6= 90 min
***
***
***
***
***
***
***
***
***
TNF-
con
cent
ratio
n pg
/ml
OTA/l. OTA at 12.5 µmol/l had stronger effects than 0.1 µg/ml LPS at 30 min
(P<0.05) and at 50 min (P<0.01), then became similar at the end of perfusion.
Fig. 4: Induction of TNF-α by OTA TNF-α concentrations were measured in perfusate samples at 1) 0, 2) 20, 3) 30, 4) 50, 5) 70 and 6) 90 min. Samples obtained from blood-free rat livers perfused with: A) 2% dextran Krebs-Henseleit buffer medium alone (untreated); B) 0.5µmol/L OTA; C) 2.5 µmol/L OTA; D) 12.5 µmol/L OTA; E) 0.1µg/ml LPS. OTA and LPS were applied at 20 min into the perfusate. Values represent the mean ± SEM of 3 livers for each group (* P<0.05, ** P<0.01, *** P<0.001).
4.2 Markers of cytotoxicity
In order to exclude direct cytotoxicity of ochratoxin A as the cause of TNF-α
release, lactate dehydrogenase (LDH) (Fig. 5), glutamate dehydrogenase
(GLDH) (Fig. 6), lactate (Fig. 7) and potassium ions (Fig. 8) were measured at
parallel times. Whereas TNF-α release was stimulated 10 fold during 90 min of
Results
66
perfusion in the presence of 2.5µmol/L OTA, the cytotoxic markers in the
perfusate changed only slightly but not significantly at the indicated time points
(Fig. 5B, 6B, 7B, 8B).
A five-fold higher OTA concentration (12.5µmol/L OTA) didn’t cause
significant alteration in the potassium ion concentrations in perfusate (Fig. 8C),
but caused slight release of GLDH (Fig. 6C), which became significant
(P<0.05) at 90 min. At 30 and 50 min LDH increased significantly at P<0.001,
but at 70 and 90 min the difference were significant at P<0.01 (Fig. 5C). Lactate
increased starting from 30 to the end of perfusion. It was significant at 30, 50,
70, and 90 min at (P<0.001, P<0.001, P<0.05, P<0.01, respectively) (Fig. 7C).
The effects of 12.5µmol/L OTA compared with 2.5µmol/L OTA on potassium
ion concentrations in perfusate were comparable (Fig. 8B, 8C). The GLDH
concentration in perfusate after adding of 12.5µmol/L OTA was higher at 90
min than that released by 2.5µmol/L OTA, but statistically not significant (Fig.
6B, 6C). 12.5µmol/L OTA released significant amounts of LDH (Fig. 5B, 5C),
and lactate (Fig. 7B, 7C) comparing with 2.5µmol/L OTA induced level
(P<0.001). These results indicate that 2.5µmol OTA /L in contrast to 12.5µmol
OTA /L didn’t alter the liver vitality criteria LDH and lactate release.
Under the same conditions, these markers were measured when 0.1 µg/ml LPS
was present in perfusate. We found significant release of LDH at 70 and 90 min

Results
67
(P<0.05 and P<0.001, respectively) (Fig. 5D), and even more obvious of 0.1
µg/ml LPS effects were seen on GLDH levels, which increased from 30 min
(P<0.05) to reach the highest level at 50 min (P<0.001) (Fig. 6D). These levels
returned back at 90 min to be still higher than control group (untreated livers),
but this was statistically not significant (Fig. 6A, 6D). The potassium ion (Fig.
8D) and lactate (Fig. 7D) concentrations were still comparable at indicated time
points with control group (untreated livers).
GLDH released into perfusate at 50 min in presence of 0.1 µg/ml LPS was more
than twic of that released by OTA at 2.5µmol/L OTA or 12.5µmol/L OTA.
LDH released by 0.1 µg/ml LPS at 70 and 90 min were higher than that released
by 2.5µmol/L OTA but equaled 12.5µmol/L OTA. With respect to lactate
release LPS had similar effects to 2.5 µmol/L OTA but was less toxic than 12.5
µmol/L OTA.
The direct cell destruction was measured by 0.01% digitonin in perfusate.
0.01% digitonin in comparison to the control liver group caused significant
(P<0.001) increase in LDH beginning from 30 min until the end of perfusion
(Fig. 5E). Lactate released by 0.01% digitonin was significantly (P<0.01) higher
than untreated livers at 30 and 50 min, then the difference became significant
(P<0.05) at 70 and 90 min (Fig. 7E). While potassium ion was still unaltered
(Fig. 8E), the GLDH release was significant at 50 min (P<0.05), and even more
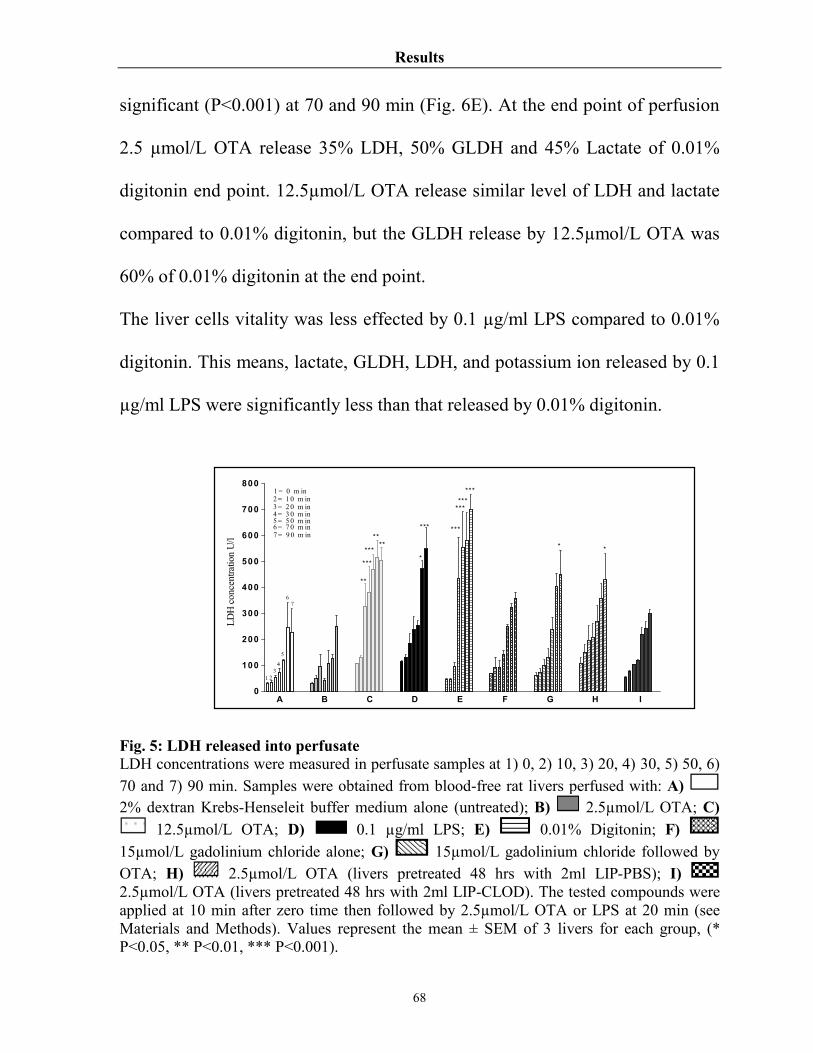
Results
68
significant (P<0.001) at 70 and 90 min (Fig. 6E). At the end point of perfusion
2.5 µmol/L OTA release 35% LDH, 50% GLDH and 45% Lactate of 0.01%
digitonin end point. 12.5µmol/L OTA release similar level of LDH and lactate
compared to 0.01% digitonin, but the GLDH release by 12.5µmol/L OTA was
60% of 0.01% digitonin at the end point.
The liver cells vitality was less effected by 0.1 µg/ml LPS compared to 0.01%
digitonin. This means, lactate, GLDH, LDH, and potassium ion released by 0.1
µg/ml LPS were significantly less than that released by 0.01% digitonin.
Fig. 5: LDH released into perfusate LDH concentrations were measured in perfusate samples at 1) 0, 2) 10, 3) 20, 4) 30, 5) 50, 6) 70 and 7) 90 min. Samples were obtained from blood-free rat livers perfused with: A) 2% dextran Krebs-Henseleit buffer medium alone (untreated); B) 2.5µmol/L OTA; C)
12.5µmol/L OTA; D) 0.1 µg/ml LPS; E) 0.01% Digitonin; F) 15µmol/L gadolinium chloride alone; G) 15µmol/L gadolinium chloride followed by OTA; H) 2.5µmol/L OTA (livers pretreated 48 hrs with 2ml LIP-PBS); I) 2.5µmol/L OTA (livers pretreated 48 hrs with 2ml LIP-CLOD). The tested compounds were applied at 10 min after zero time then followed by 2.5µmol/L OTA or LPS at 20 min (see Materials and Methods). Values represent the mean ± SEM of 3 livers for each group, (* P<0.05, ** P<0.01, *** P<0.001).
A B C D E F G H I0
100
200
300
400
500
600
700
800
6
5
1
7
43
2
2 = 1 0 m in
***
**
***
**
**
*
*** ***
***
******
* *
1 = 0 m in
3 = 2 0 m in4 = 3 0 m in5 = 5 0 m in6 = 7 0 m in7 = 9 0 m in
LDH
con
cent
ratio
n U
/l

Results
69
Fig. 6: GLDH released into perfusate GLDH concentrations were measured in perfusate samples at 1) 0, 2) 10, 3) 20, 4) 30, 5) 50, 6) 70 and 7) 90 min. Samples were obtained from blood-free rat livers perfused with: A) 2% dextran Krebs-Henseleit buffer medium alone (untreated); B) 2.5µmol/L OTA; C)
12.5µmol/L OTA; D) 0.1 µg/ml LPS; E) 0.01% Digitonin; F) 15µmol/L gadolinium chloride alone; G) 15µmol/L gadolinium chloride followed by OTA; H) 2.5µmol/L OTA (livers pretreated 48 hrs with 2ml LIP-PBS); I) 2.5µmol/L OTA (livers pretreated 48 hrs with 2ml LIP-CLOD). The tested compounds were applied at 10 min after zero time then followed by 2.5µmol/L OTA or LPS at 20 min (see Materials and Methods). Values represent the mean ± SEM of 3 livers for each group, (* P<0.05, ** P<0.01, *** P<0.001). Fig. 7: Lactate released into perfusate Lactate concentrations were measured in perfusate samples at 1) 0, 2) 20, 3) 30, 4) 50, 5) 70 and 6) 90 min. Samples were obtained from blood-free rat livers perfused with: A) 2%
A B C D E F G H I0 .0
2 .5
5 .0
7 .5
10.0
12.5
15.0
17.5
7
4
65
32
1
K+ c
once
ntra
tion
mM
ol/l
2 = 10 m in1 = 0 m in
3 = 20 m in4 = 30 m in5 = 50 m in6 = 70 m in7= 90 m in

Results
70
dextran Krebs-Henseleit buffer medium alone (untreated); B) 2.5µmol/L OTA; C) 12.5µmol/L OTA; D) 0.1 µg/ml LPS; E) 0.01% Digitonin; The tested compounds were applied at 10 min after zero time then followed by 2.5µmol/L OTA or LPS at 20 min (see Materials and Methods). Values represent the mean ± SEM of 3 livers for each group, (* P<0.05, ** P<0.01, *** P<0.001). Fig. 8: Potassium ion released into perfusate K+ concentrations were measured in perfusate samples at 1) 0, 2) 10, 3) 20, 4) 30, 5) 50, 6) 70 and 7) 90 min. Samples were obtained from blood-free rat livers perfused with: A) 2% dextran Krebs-Henseleit buffer medium alone (untreated); B) 2.5µmol/L OTA; C) 12.5µmol/L OTA; D) 0.1 µg/ml LPS; E) 0.01% Digitonin; F) 15µmol/L gadolinium chloride alone; G) 15µmol/L gadolinium chloride followed by OTA; H)
2.5µmol/L OTA (livers pretreated 48 hrs with 2ml LIP-PBS); I) 2.5µmol/L OTA (livers pretreated 48 hrs with 2ml LIP-CLOD). The tested compounds were applied at 10 min after zero time then followed by 2.5µmol/L OTA or LPS at 20 min (see Materials and Methods). Values represent the mean ± SEM of 3 livers for each group, (* P<0.05, ** P<0.01, *** P<0.001).
According to these findings OTA at 2.5µmol/L and LPS at 0.1µg/ml caused
significant release of TNF-α with minor changes of liver cell vitality. Therefore,
these doses were selected in the further experiments.
A B C D E0.0
2.5
5.0
7.5
10.0
12.5
15.0
1
2 3
4
5 6 ***
***
**
*
**
**
**
1= 0 min2= 20 min3= 30 min4= 50 min5= 70 min6= 90 min
Lact
ate
conc
entra
tion
mM
ol/l
Results
71
4.3 The role of Kupffer cells in OTA-mediated TNF-α release
In the perfused liver different cell types may serve as a source of TNF-α. Most
likely are Kupffer cells, since TNF-α is typically released by macrophages and
TNF-α release by OTA was reported from a mouse macrophage cell line
(Huttunen et al., 2004). Therefore, the aim of this part of the study was to
elucidate which liver cell type respond to OTA by releasing TNF-α into the
perfusate of blood-free perfused rat livers. For this reason, Kupffer cells were
blocked in vitro by addition of the heavy metal gadolinium chloride to the
perfusate, and in vivo by the Kupffer-cell poisoning toxin clodronate. Isolated
livers taken from these animals were taken as livers depleted in this responding
cell type. In addition Kupffer cells, sinusoidal endothelial cells, and hepatocytes
were isolated from rat livers and were exposed in single cell culture to 2.5
µmol/ml OTA for 24 hours. The positive control LPS at 0.1 µg/ml was used in
this cell culture model in addition.
4.3.1 Blockade of Kupffer cells by gadolinium chloride (GdCl3)
The rare earth metal salt gadolinium chloride (GdCl3) was reported to depress
reticuluendothelial (RES) activity (Lazar, 1973), and selectively depresses
phagocytic activity (Brown et al., 1997, Yang et al., 1999). It abolished the
hepatic expression of certain Kupffer cell specific antigens (Klein et al., 1994;

Results
72
Kim & Choi, 1997), without effecting the number of Kupffer cells (Rai et al.,
1996).
For this study we blocked Kupffer cells in vitro by adding 15µmol/l gadolinium
chloride into the perfusion system at 10 min after the starting point. GdCl3 alone
or when it was applied 10 min prior to 2.5µmol/L OTA didn’t cause significant
changes in LDH (Fig. 5G), GLDH (Fig. 6G) and potassium ion (Fig. 8G)
concentrations in perfusate compared to the control group (untreated livers).
These findings indicate the tested dose of GdCl3 was not toxic for liver cells.
Our findings correlated with Lee et al., 2004, who found that gadolinium
chloride didn’t alter the Kupffer cells vitality in vitro up to 27 µmol/l (Lee et al.,
2004).
On control livers 15 µmol/l GdCl3 caused slight but not significant reduction in
TNF- basal levels, i.e. TNF- was 176 pg/ml in comparison to 265 pg/ml in
untreated livers at 90 min (Fig. 9). However, when 15 µmol/l GdCl3 was co-
applied 10 min prior to 2.5 µmol/l of OTA to the perfusion system, it
completely abolished OTA-mediated TNF- release over 90 min (Fig. 9). TNF-
levels were significantly (P<0.001) lower than OTA induced levels from 50
min to the end of perfusion. These results correlate with findings that GdCl3
reduced TNF- concentration in the livers (Lazar et al., 1995), and in plasma
(Yee et al., 2003) of LPS challenged mice.

Results
73
4.3.2 Depletion of Kupffer cells by liposomes-encapsulated clodronate
Another physical method to eliminate Kupffer cells is by using
dichlorometheline biphosphonate. The compound was particularly effective
against macrophages when it was encapsulated into liposomes, enabling its cell
selective uptake (Van Rooijen & Sanders; 1994, Bautista et al., 1994). The
compound selectively induced cell death in macrophages of the liver and the
spleen (Meijer et al., 2000; Alves-Rosa et al., 2003).
Accordingly, we depleted Kupffer cells by in vivo i.p. administration of 2ml/rat
liposome-encapsulated clodronate (LIP-CLOD) 48 hrs prior to liver
preparations. Livers pre-treated with LIP-CLOD and perfused with 2.5 µmol/l
OTA didn’t release significant effects on LDH (Fig. 5I), or potassium ion (Fig.
8I), comparing with OTA induced levels. The main effect of LIP-CLOD was
seen on GLDH levels, which increased significantly at 50, 70 and 90 min
(P<0.05, P<0.001 and P<0.001, respectively) (Fig. 6I). These results indicate
LIP-CLOD added harmful effects to livers perfused with 2.5 µmol/l OTA. For
control, clodronate vehicle (liposomes suspended in phosphate buffer) was used
in the same fashion. LIP-PBS had no effects on potassium ion concentrations in
comparison with control (untreated livers) (Fig. 8H) or with OTA released
potassium levels, but increased slightly LDH concentration at 90 min (P<0.05)
(Fig. 5H). The significant changes took place in GLDH from 30 to 90 min
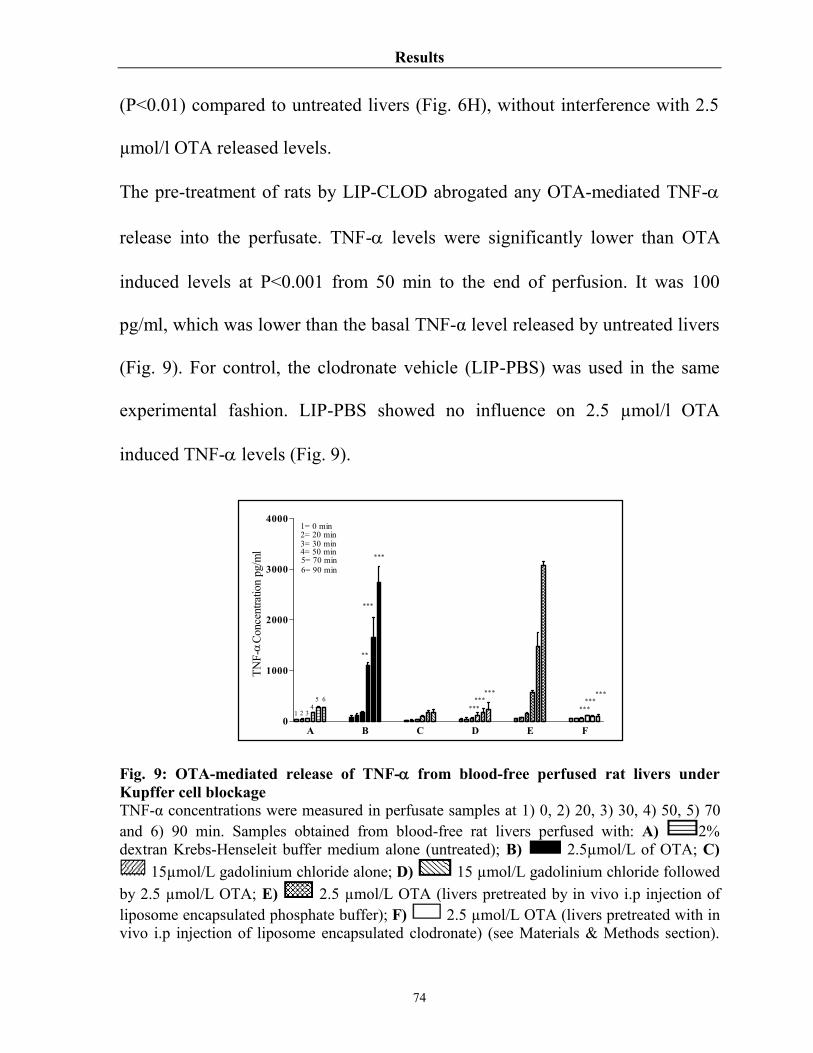
Results
74
(P<0.01) compared to untreated livers (Fig. 6H), without interference with 2.5
µmol/l OTA released levels.
The pre-treatment of rats by LIP-CLOD abrogated any OTA-mediated TNF-
release into the perfusate. TNF- levels were significantly lower than OTA
induced levels at P<0.001 from 50 min to the end of perfusion. It was 100
pg/ml, which was lower than the basal TNF-α level released by untreated livers
(Fig. 9). For control, the clodronate vehicle (LIP-PBS) was used in the same
experimental fashion. LIP-PBS showed no influence on 2.5 µmol/l OTA
induced TNF- levels (Fig. 9).
Fig. 9: OTA-mediated release of TNF- from blood-free perfused rat livers under Kupffer cell blockage TNF-α concentrations were measured in perfusate samples at 1) 0, 2) 20, 3) 30, 4) 50, 5) 70 and 6) 90 min. Samples obtained from blood-free rat livers perfused with: A) 2% dextran Krebs-Henseleit buffer medium alone (untreated); B) 2.5µmol/L of OTA; C)
15µmol/L gadolinium chloride alone; D) 15 µmol/L gadolinium chloride followed by 2.5 µmol/L OTA; E) 2.5 µmol/L OTA (livers pretreated by in vivo i.p injection of liposome encapsulated phosphate buffer); F) 2.5 µmol/L OTA (livers pretreated with in vivo i.p injection of liposome encapsulated clodronate) (see Materials & Methods section).
A B C D E F0
1000
2000
3000
4000
***
1 2 34
5 6
***
******
***
******
***
**
TNF-
Conc
entra
tion
pg/m
l
1= 0 min2= 20 min3= 30 min4= 50 min5= 70 min6= 90 min

Results
75
Values represent the mean ± SEM of 3 livers for each group, (* P<0.05, ** P<0.01, *** P<0.001). 4.3.3 OTA-mediated TNF-α release from isolated Kupffer cells In order to analyze in more details the cellular target of OTA in the perfused rat
liver model, the direct contact of OTA with Kupffer cells in cell culture was
carried out. The change in TNF- level was monitored in OTA-free Kupffer
cell culture, which slightly increased from 50 pg/ml at zero time to 110 pg/ml
after 24 hrs (Fig. 10). A significant amount of TNF- was released into
incubation medium of isolated Kupffer cells when 2.5µmol/l OTA was added
1hr after starting the experiments up to 24 hrs. OTA caused slight release of
TNF- after 4 hrs, but this release was statistically significant (P<0.001) at the
end of incubation. Here, TNF- reached 1000 pg/ml in the incubation medium.
This increase was 10 times the basal TNF- release from control culture (Fig.
10 & Table 2).
For a positive control, Kupffer cells culture was exposed to 0.1 µg of LPS/ml.
LPS caused significant (P<0.001) release of TNF- into the incubation medium
1 hr after its addition. It was 3000 pg/ml after 24hrs (Fig. 10 & Table 2). In
comparison OTA required more than 3 hrs to release TNF-α from Kupffer cells,
while LPS needed about 1 hr to yield a comparable effect. The LPS effects were
stronger than the OTA effects, i.e. TNF-α released by LPS was significantly

Results
76
(P<0.001) higher than that released by OTA from the time point 2 hrs up to the
end of incubation at 24 hrs.
Fig. 10: TNF-α release from Kupffer cell culture TNF-α concentrations were measured in incubated media of isolated cell in single cell culture at 1) 0, 2) 0.5, 3) 1, 4) 1.5, 5) 2, 6) 4 and 7) 24 hrs indicated by single columns. A) Kupffer cells without treatment; B) Kupffer cells exposed to 2.5 µmol/L OTA. C) Kupffer cells exposed to 0.1 µg/ml LPS. OTA and LPS were added 1hr after zero samples, (see Materials & Methods section). Values represent the mean ± SEM of 3 cell preparations for each group, (* P<0.05, ** P<0.01, *** P<0.001). 4.3.4 TNF-α release from isolated sinusoidal endothelial cells
To study the role of sinusoidal endothelial cells in OTA-mediated TNF-α
release from blood-free perfused rat livers, isolated sinusoidal endothelial cells
were freshly prepared from rat livers and subjected in single cell cultures to
OTA exposure.
In the incubation medium TNF- basal level was increased from 45 pg/ml at
zero time to 220 pg/ml after 24 hrs (Fig. 11). When the culture was exposed to
A B C0
1000
2000
3000***
1 2 34
65
1= 0 min2= 0.5 hr3= 1 hr4= 1.5 hr5= 2 hr6= 4 hr
7
7= 24 hr
***
***
***
TNF-
con
cent
ratio
n pg
/ml

Results
77
2.5 µmol/l OTA, the TNF- level was increased to the same extent from 49
pg/ml to 230 pg/ml up to 24 hrs (Fig. 11). This means that sinusoidal
endothelial cells didn’t respond to OTA. However, after adding 0.1 µg of
LPS/ml to the incubation medium at 1 hr a significant (P<0.001) release of
TNF- to the incubation medium starting from 4 hrs to be 2000 pg/ml after 24
hrs was seen (Fig. 11 & Table 2). These data show that whereas sinusoidal
endothelial cells respond to LPS they were insensitive to OTA.
Fig. 11: TNF-α release from sinusoidal endothelial cell culture TNF-α concentrations were measured in incubated media of isolated cell in single cell culture at 1) 0, 2) 0.5, 3) 1, 4) 1.5, 5) 2, 6) 4 and 7) 24 hrs indicated by single columns. A) Sinusoidal endothelial cells without treatment; B) Sinusoidal endothelial cells exposed to 2.5 µmol/L OTA. C) Sinusoidal endothelial cells exposed to 0.1 µg/ml LPS. OTA and LPS were added 1hr after zero samples, (see Materials & Methods section). Values represent the mean ± SEM of 3 cell preparations for each group, (* P<0.05, ** P<0.01, *** P<0.001).
A B C0
500
1000
1500
2000
2500***
1 2 3 4 65
7
***1= 0 min2= 0.5 hr3= 1 hr4= 1.5 hr5= 2 hr6= 4 hr7= 24 hr
TNF-
con
cent
ratio
n pg
/ml
Results
78
4.3.5 TNF-α release from isolated hepatocytes
To elicit the possibility of hepatocyte participation in OTA-mediated TNF-α
release from blood-free perfused rat liver, primary rat hepatocytes were
prepared in single cell cultures. The basal levels of TNF-α release from the
hepatocyte cell culture were higher than those released from sinusoidal
endothelial cells and Kupffer cells. This level decreased with time from
295pg/ml to 47 pg/ml at 24 hrs (Fig. 12). The presence of 2.5µmol/l OTA at 1
hr didn’t cause significant changes in TNF- levels at indicated time points
(Fig. 12). This means that hepatocytes didn’t participate in OTA-mediated TNF-
release from blood-free perfused rat livers.
On the other hand, a positive result was obtained if 0.1 µg/ml LPS was added to
the culture medium under similar experimental conditions. This caused a slight
release of TNF-, which was significant at p<0.5 at 1.5 and 2 hrs, then became
significant at P<0.01 at 4 hrs, which later at the end of the incubation period
became significant at P<0.001 in comparison with treated or with untreated
cultures (Fig. 12 & Table 2).

Results
79
Fig. 12: TNF-α release from hepatocytes cell culture TNF-α concentrations were measured in incubated media of isolated cell in single cell culture at 1) 0, 2) 0.5, 3) 1, 4) 1.5, 5) 2, 6) 4 and 7) 24 hrs indicated by single columns. A) Hepatocyte cells without treatment; B) Hepatocyte cells exposed to 2.5 µmol/L OTA. C) Hepatocyte cells exposed to 0.1 µg/ml LPS. OTA and LPS were added 1hr after zero samples, (see Materials & Methods section). Values represent the mean ± SEM of 3 cell preparations for each group, (* P<0.05, ** P<0.01, *** P<0.001).
4.4 TNF-α release from macrophages
The aim of this part of the study was to extent and generalize the OTA effect on
the liver cells to various other cell types. For this reason, primary rat peritoneal
macrophages and the mouse macrophages cell line J774A.1 were used and also
the HepG2 and L929 cell line. All cell types were adjusted to 2x10⁶ cells/ml and
exposed to 2.5µmol/l OTA 1hr after zero time up to 24 hrs. Furthermore, under
similar experimental conditions these cells were incubated with 0.1 µg/ml LPS,
the known inducer of TNF-α, as the positive control.
A B C0
250
500
750
1000***
1 2 3
4 6
5
3= 1 hr
7
**
*
*
1= 0 min2= 0.5 hr
4= 1.5 hr5= 2 hr6= 4 hr7= 24 hr
TNF-
con
cent
ratio
n pg
/ml
Results
80
4.4.1 OTA-mediated TNF-α release from isolated peritoneal macrophages
Macrophages were collected from rats by peritoneal lavage and brought in
culture. TNF- levels increased in the incubation medium of control cells to be
160 pg/ml after 24 hrs (Fig. 13). 2.5µmol/l OTA stimulated these cells to
release significant amounts of TNF- during 24 hrs of exposure time. About
1560 pg TNF-/ml of culture medium was detected at the end of incubation.
The response of these cells started after 1 hr of OTA contact. The elevation had
statistical meaning (P<0.01) at 4 hrs, then became significant (P<0.001) at the
end of incubation, when it was 10 times the basal TNF- release from control
culture (Fig. 13 & Table 2).
Similar stimulation took place in response to 0.1 µg of LPS/ml after 1 hr of LPS
addition. LPS caused significant (P<0.001) release of TNF- to the culture
medium starting from 4 hrs up to the end of incubation. TNF- concentrations
in the incubated medium reached 2600 pg/ml after 24 hrs of LPS exposure (Fig.
13 & Table 2). TNF-α release by OTA was significantly lower than by LPS
indicating that LPS is more powerful than OTA for TNF-α release.

Results
81
Fig. 13: TNF-α release from rat peritoneal macrophages cell culture TNF-α concentrations were measured in incubated media of isolated cell in single cell culture at 1) 0, 2) 0.5, 3) 1, 4) 1.5, 5) 2, 6) 4 and 7) 24 hrs indicated by single columns. A) Peritoneal macrophages without treatment; B) Peritoneal macrophages exposed to 2.5 µmol/L OTA. C) Peritoneal macrophages exposed to 0.1 µg/ml LPS. OTA and LPS were added 1hr after zero samples, (see Materials & Methods section). Values represent the mean ± SEM of 3 cell preparations for each group, (* P<0.05, ** P<0.01, *** P<0.001).
4.4.2 OTA-mediated TNF-α release from J774A.1 cells
The mouse macrophages cell line J774.A1 was used to confirm the effects of
OTA on rat peritoneal macrophages. We observed an increase in TNF- levels
in the culture medium of J774.A1 cells from 32 pg/ml at zero time to 111 pg/ml
after 24 hrs in the absence of OTA (Fig. 14). In it's presence (2.5µmol/l OTA)
release of TNF- was 635 pg/ml after 24 hrs (Fig. 14 & Table 2). This increase
was significant (P<0.05) at 4 hrs, and even more (P<0.001) at 24 hrs. At the end
point this increase was 6 times the basal TNF- release of the control culture.
Similarly the cells exposed to 0.1 µg of LPS/ml released significant (P<0.05)
amounts of TNF- into the incubation medium at 2 hrs. From then TNF-
A B C0
1000
2000
3000 ***
1 2 3 4 65 7
***
***
**
3= 1 hr
1= 0 min2= 0.5 hr
4= 1.5 hr5= 2 hr6= 4 hr7= 24 hr
TNF-
con
cent
ratio
n pg
/ml

Results
82
concentrations were significant at P<0.001 from 4 hrs to the end of incubation,
when it reached about 2115 pg/ml (Fig. 14 & Table 2).
The amount of TNF-α released by OTA was significantly lower than by LPS at
P<0.001 from the time point of 4 hrs up to the end of incubation. Our data
suggest that the effect of LPS on J774A.1 is faster and greater than that
promoted by OTA.
Fig. 14: TNF-α release from J774A.1 cell line TNF-α concentrations were measured in incubated media of isolated cell in single cell culture at 1) 0, 2) 0.5, 3) 1, 4) 1.5, 5) 2, 6) 4 and 7) 24 hrs indicated by single columns. A) J774A.1 cell line without treatment; B) J774A.1 cell line exposed to 2.5 µmol/L OTA. C) J774A.1 cell line exposed to 0.1 µg/ml LPS. OTA and LPS were added 1hr after zero samples, (see Materials & Methods section). Values represent the mean ± SEM of 3 cell preparations for each group, (* P<0.05, ** P<0.01, *** P<0.001). 4.4.3 TNF-α release from HepG2 cells The human HepG2 cell is a suitable model for in vitro studies of hepatocyte
cytotoxicity in particular the ethanol-induced hepatocyte toxicity and/or
apoptosis (Cameron et al., 1998; Nakayama et al., 2001). Human HepG2
A B C0
500
1000
1500
2000
2500***
1 2 3 4 65 7
***
***
****TN
F-
con
cent
ratio
n pg
/ml
3= 1 hr
1= 0 min2= 0.5 hr
4= 1.5 hr5= 2 hr6= 4 hr7= 24 hr

Results
83
responded to ethanol at 80mmol/l and released TNF-, which subsequently
mediated apoptotic processes (Neuman et al., 1998). Ethanol at 50 mmol/l
stimulated expression of TNFR1 in HepG2 which promoted the effects of TNF-
(Rodriguez et al., 2004).
In this study TNF- basal levels increased in the culture medium from 30 pg/ml
to only 36 pg/ml after 24 hrs. Neither 2.5µmol/l OTA nor 0.1 µg/ml LPS
changed TNF- concentrations in comparison with control (untreated cells) at
any indicated time points (Fig. 15 & Table 2).
Fig. 15: TNF-α release from HepG2 cell line TNF-α concentrations were measured in incubated media of isolated cell in single cell culture at 1) 0, 2) 0.5, 3) 1, 4) 1.5, 5) 2, 6) 4 and 7) 24 hrs indicated by single columns. A) HepG2 cell line without treatment; B) HepG2 cell line exposed to 2.5 µmol/L OTA. C)
HepG2 cell line exposed to 0.1 µg/ml LPS. OTA and LPS were added 1hr after zero samples, (see Materials & Methods section). Values represent the mean ± SEM of 3 cell preparations for each group, (* P<0.05, ** P<0.01, *** P<0.001).
A B C0
10
20
30
40
50
60
70
1 2 3 4
6
5
7
3= 1 hr
1= 0 min2= 0.5 hr
4= 1.5 hr5= 2 hr6= 4 hr7= 24 hr
TNF-
con
cent
ratio
n pg
/ml

Results
84
4.4.4 TNF-α release from L929 cells
The L929 cell line is a sensitive cell line for TNF- apoptotic action (Hayakawa
et al., 1991; 1993). The cells may be used as a marker to measure TNF-
mediated cytotoxic effects of TNF- inducers. In our hands, however the cells
showed no response to OTA. Again the TNF- basal level was measured in the
incubation medium during culture in the absence of OTA. This level increased
from 30 pg/ml to 36 pg/ml after 24 hrs (Fig. 16). 2.5µmol/l OTA added to the
incubation medium at 1 hr didn’t change TNF- concentrations in incubation
medium at indicated time points compared with control group (Fig. 16).
0.1 µg/ml LPS, however, caused a slight release at 24 hrs, when TNF-
concentrations were 91 pg/ml. This was significant in comparison to the control
group or to the OTA treated group at P<0.001 (Fig. 16 & Table 2). Apparently
L929 cells responded although slightly only to LPS.
Fig. 16: TNF-α release from L929 cell line
A B C0
25
50
75
100***
1 2 3 4
6
5
7
TNF-
con
cent
ratio
n pg
/ml
3= 1 hr
1= 0 min2= 0.5 hr
4= 1.5 hr5= 2 hr6= 4 hr7= 24 hr
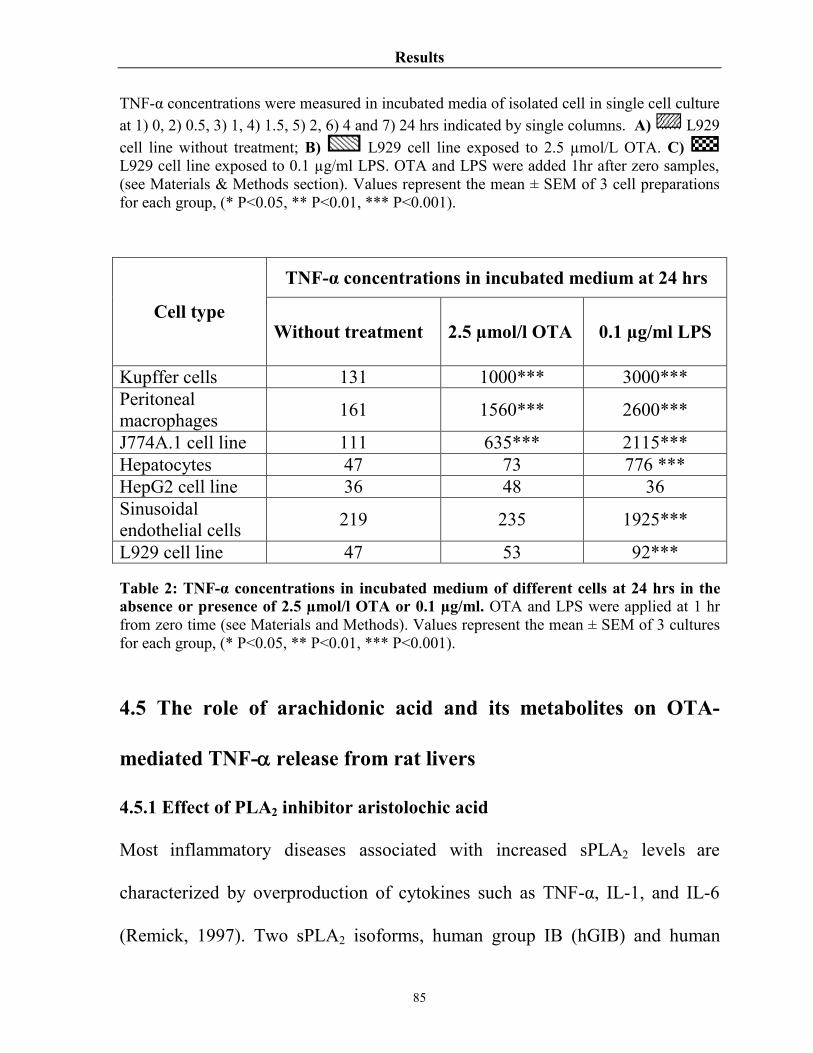
Results
85
TNF-α concentrations were measured in incubated media of isolated cell in single cell culture at 1) 0, 2) 0.5, 3) 1, 4) 1.5, 5) 2, 6) 4 and 7) 24 hrs indicated by single columns. A) L929 cell line without treatment; B) L929 cell line exposed to 2.5 µmol/L OTA. C) L929 cell line exposed to 0.1 µg/ml LPS. OTA and LPS were added 1hr after zero samples, (see Materials & Methods section). Values represent the mean ± SEM of 3 cell preparations for each group, (* P<0.05, ** P<0.01, *** P<0.001).
TNF-α concentrations in incubated medium at 24 hrs
Cell type Without treatment 2.5 µmol/l OTA 0.1 µg/ml LPS
Kupffer cells 131 1000*** 3000*** Peritoneal macrophages 161 1560*** 2600***
J774A.1 cell line 111 635*** 2115*** Hepatocytes 47 73 776 *** HepG2 cell line 36 48 36 Sinusoidal endothelial cells 219 235 1925***
L929 cell line 47 53 92*** Table 2: TNF-α concentrations in incubated medium of different cells at 24 hrs in the absence or presence of 2.5 µmol/l OTA or 0.1 µg/ml. OTA and LPS were applied at 1 hr from zero time (see Materials and Methods). Values represent the mean ± SEM of 3 cultures for each group, (* P<0.05, ** P<0.01, *** P<0.001).
4.5 The role of arachidonic acid and its metabolites on OTA-
mediated TNF- release from rat livers
4.5.1 Effect of PLA2 inhibitor aristolochic acid
Most inflammatory diseases associated with increased sPLA2 levels are
characterized by overproduction of cytokines such as TNF-α, IL-1, and IL-6
(Remick, 1997). Two sPLA2 isoforms, human group IB (hGIB) and human

Results
86
group X (hGX) sPLA2 were reported to induce TNF-α and IL-6 from human
lung macrophages (Granata et al., 2005).
In order to inhibit enzymatic activity of phospholipase A2 in liver tissue,
50µmol/L of aristolochic acid, a potent PLA2 enzyme inhibitor (Rosenthal et al.,
1992) was applied 10 min prior to 2.5µmol/l OTA in the perfusion system.
Under these conditions aristolochic acid markedly reduced TNF-α
concentrations beginning from the time point 50 min to be 188 pg/ml at 90 min
(Fig. 17). This is below basal secretions in untreated controls. This reduction
was significant at P<0.001 compared to OTA induced levels but not for basal
levels. Aristolochic acid alone also reduced the basal TNF-α concentration to
139 pg/ml at 90 min but this reduction was not significant versus controls (Fig.
18 & Table 3). Our results indicate that the induction of TNF-α by 2.5µmol/l
OTA from blood-free perfused rats livers required phospholipase A2 or,
subsequently, one of its metabolic products, in particular arachidonic acid
derivatives.
4.5.2 Inhibition of pathways of arachidonic acid metabolism
In order to clarify which metabolic pathway of arachidonic acid could interfere
with TNF-α release by 2.5µmol/l OTA, we blocked each individual pathway.
Then, concurrent inhibitions were carried out. However, blocking the

Results
87
cyclooxygenases pathways by 10µmol/L of indomethacin slightly elevated
TNF-α concentrations compared with untreated controls, i.e. 467 pg/ml versus
256 pg/ml at 90 min. This elevation was not significant in comparison with
basal release and/or with OTA induced levels (Fig. 17). Indomethacin, applied
10 min prior to OTA, however, provoked additional TNF-α release in the
perfusate starting to be significant (P<0.001) at 70 min, then ending at two-fold
higher concentrations over the OTA induced level at 90 min. I.e. TNF-α
concentration was elevated by indomethcin from 2600 pg/ml (OTA alone) to
5500 pg/ml at the end of perfusion (Fig. 18 & Table 3).
In order to block lipoxygenases pathways, nordihydroguaiaretic acid (NDGA)
was used at 30µmol/L to inhibit the production of leukotrienes. In the presence
of (NDGA) alone the TNF-α level increased to be 330 pg/ml at 90 min (Fig.
17), which was not significant compared with TNF-α basal release.
Administration of nordihydroguaiaretic acid 10 min before OTA diminished the
TNF-α level in the perfusate at 90 min to be 6% of OTA-induced level, i.e.
TNF-α concentration was 175 pg/ml versus 2600 pg/ml at 90 min (Fig. 18 &
Table 3). Our findings suggest that the induction of TNF-α by OTA from blood-
free rat livers requires some of the lipoxygenases metabolites.
Finally, inhibition of the third major pathway of arachidonic acid metabolites,
the CYP-450 pathway by 100µmol/L metyrapone, was performed. In the

Results
88
presence of metyrapone alone no significant interference with TNF-α basal
release occurred. However, TNF-α concentrations in perfusate were
significantly (P<0.001) lower than the levels released by OTA in particular at
50, 70 and 90 min, namely 233 pg/ml at 90 min (Fig. 17). Administration of
metyrapone 10 min before OTA reduced TNF-α level in the perfusate to 7% of
the OTA induced level at 90 min, i.e. TNF-α concentration was 200 pg/ml
versus 2600 pg/ml at 90 min (Fig. 18 & Table 3). Our finding indicate that the
induction of TNF-α by OTA from blood-free rat livers requires some of the
CYP-450 metabolites.
Blocking of cyclooxygenases by indomethacin in combination with blockage of
lipoxygenases by NDGA caused significant (P<0.001) reduction in TNF-α
levels beginning from 50 min to 90 min. At this end point only 5% of OTA
induced levels at 90 min were reached, i.e. TNF-α concentration at the end of
perfusion was 135 pg/ml (Fig. 18 & Table 3). Blockage of cyclooxygenases
plus CYP-450 pathways also significantly (P<0.001) reduced TNF-α
concentrations from 50 min to 90 min, to 8% of the OTA induced levels at 90
min, i.e. TNF-α concentration was 220 pg/ml (Fig. 18 & Table 3). Finally,
blockage of lipoxygenases and CYP-450 pathways, significantly reduced TNF-
α concentrations from 50 min to 90 min, i.e. TNF-α concentration was 151
pg/ml at 90 min (Fig. 18 & Table 3). The reduction in TNF-α concentrations in

Results
89
each combination was lower than in OTA-free perfused control livers
(statistically not significant). The results indicated so far that in the absence of
arachidonic acid metabolites, generated in the lipoxygenase and CYP-450
pathway, OTA-mediated TNF-α released from blood-free perfused rat livers got
lost.
Fig. 17: Basal TNF-α release from blood-free rat livers TNF-α concentrations were measured in perfusate samples at 1) 0, 2) 20, 3) 30, 4) 50, 5) 70 and 6) 90 min, indicated by single columns. Samples obtained from blood-free rat livers perfused with: A) 2% dextran Krebs-Henseleit buffer medium alone (untreated); B)
50µmol/L aristolochic acid; C) 10µmol/L indomethacin; D) 30µmol/L of nordihydroguaiaretic acid; E) 100µmol/L of metyrapone; F) 2.5µmol/L of OTA. The tested compounds were applied at 10 min while OTA was applied at 20 min from zero time (see Materials and Methods). Values represent the mean ± SEM of 3 livers for each group, (* P<0.05, ** P<0.01, *** P<0.001).
A B C D E F0
1000
2000
3000
4000
* * *
* * *
* *
1 32
4 5 6
1 = 0 m in2 = 2 0 m in3 = 3 0 m in4 = 5 0 m in5 = 7 0 m in6 = 9 0 m in
TNF-
Con
cent
ratio
n pg
/ml

Results
90
Fig. 18: Effects of blocking arachidonic acid release and its major pathways on TNF-α release in the presence of OTA TNF-α concentrations were measured in perfusate samples at 1) 0, 2) 20, 3) 30, 4) 50, 5) 70 and 6) 90 min. Samples were obtained from blood-free rat livers perfused with: A) 2.5µmol/L OTA; B) 50µmol/L aristolochic acid followed by OTA; C) 10µmol/L indomethacin followed by OTA; D) 30µmol/L nordihydroguaiaretic acid followed by OTA; E) 100µmol/L metyrapone followed by OTA; F) 100µmol/L metyrapone and 30µmol/L nordihydroguaiaretic acid followed by OTA; G) 10µmol/L indomethacin and 30µmol/L nordihydroguaiaretic acid followed by OTA; H) 10µmol/L indomethacin and 10µmol/L metyrapone followed by OTA. The tested compounds were applied at 10 min after zero time then followed by 2.5µmol/L OTA at 20 min (see Materials and Methods). Values represent the mean ± SEM of 3 livers for each group, (* P<0.05, ** P<0.01, *** P<0.001). 4.5.3 Effect of exogenous arachidonic acid supplementation
The results so far let the question open how arachidonic acid itself inferes with
OTA-mediated TNF-α release. To test this, 10µmol/L of exogenous arachidonic
acid sodium salt was added to the perfusate at 10 min after zero time. The
exogenous arachidonic acid alone didn’t show significant interference with
basal TNF-α release, which was 300 pg/ml at 90 min (Fig. 19). When it was
applied 10 min prior to OTA, it caused a complete blockage of TNF-α release
A B C D E F G H0
1000
2000
3000
4000
5000
6000
7000
******
***
****** ****** ******
*************
*
*** * *
1 = 0 m in2 = 2 0 m in3 = 3 0 m in4 = 5 0 m in5 = 7 0 m in6 = 9 0 m in
TNF-
Con
cent
ratio
n pg
/ml
1 2 3
4
5
6

Results
91
into perfusate starting from 50 min to 90 min (P<0.001). At the end of perfusion
TNF-α concentration was 196 pg/ml (Fig. 19 & Table 3). This was even lower
than TNF-α release exerted by arachidonic acid alone and also lower than basal
release from untreated controls. Our data suggest an important controller
function for arachidonic acid and its metabolites on this mycotoxin provoked
TNF-α release from rat livers, namely a stimulation by LPX and CYP-450
metabolites and inhibition by COX metabolites and arachidonic acid itself.
Fig. 19: Effects of inhibition of NF-kB and addition of arachidonic acid on TNF-α release TNF-α concentrations were measured in perfusate samples at 1) 0, 2) 20, 3) 30, 4) 50, 5) 70 and 6) 90 min. Samples obtained from blood-free rat livers perfused with: A) 2% dextran Krebs-Henseleit buffer medium alone (untreated); B) 2.5µmol/L OTA; C) 10µmol/L exogenous arachidonic acid; D) 10µmol/L exogenous arachidonic acid followed by OTA; E) 10µmol/L caffeic acid phenylethyl ester (CAPE); F) 10µmol/L caffeic acid phenylethyl ester (CAPE) followed by OTA. The tested compounds were applied at 10 min while 2.5µmol/L OTA was applied at 20 min into the perfusate after zero time (see Materials and Methods). Values represent the mean ± SEM of 3 livers for each group, (* P<0.05, ** P<0.01, *** P<0.001).
A B C D E F0
1000
2000
3000
4000
****** ******
***
***
**
** **
1= 0 min2= 20 min3= 30 min4= 50 min5= 70 min6= 90 min
1
TNF-
Con
cent
ratio
n pg
/ml
2 34 56

Results
92
Inhibitor Inhibitee Without OTA
Ø medium Ø TNF-α change
Δt=90 min (100%=265pg/ml)
50µmol/L aristolochic acid Phospholipase A2 52%
10µmol/L indomethacin Cyclooxygenase 182%
30µmol/L nordihydroguaiaretic acid Lipoxygenase 91%
100µmol/L metyrapone CYP-450 128% 10µmol/L caffeic acid phenylethyl ester (CAPE) NF-kB 76%
10µmol/L arachidonic acid Exogenous arachidonic acid 117%
With 2.5µmol OTA/l Ø medium Ø
(100%=2600 pg/ml)
50µmol/L aristolochic acid Phospholipase A2 7%
10µmol/L indomethacin Cyclooxygenase 211%
30µmol/L nordihydroguaiaretic acid Lipoxygenase 6%
100µmol/L metyrapone CYP-450 7% 10µmol/L caffeic acid phenylethyl ester (CAPE) NF-kB 7%
10µmol/L arachidonic acid Exogenous arachidonic acid 10%
10µmol/L indomethacin and 30µmol/L nordihydroguaiaretic acid
Cyclooxygenase and Lipoxygenase 5%
10µmol/L indomethacin and 100µmol/L metyrapone
Cyclooxygenase and CYP-450 8%
30µmol/L nordihydroguaiaretic acid and 100µmol/L metyrapone
Lipoxygenase and CYP-450 5%
Table 3: Percentages of TNF-α release in the absence or presence of 2.5 µmol/l OTA in the blood-free perfused rat liver model.

Results
93
4.6 Inhibition of OTA-induced TNF-α signaling cascade
4.6.1 Effect of calcium on OTA-mediated TNF-α release
To study the effects of calcium on TNF-α release by OTA, blood-free rat livers
were perfused with 75 ml Krebs-Henseleit calcium-free buffer containing 2%
dextran under the same experimental conditions. In control livers TNF-α levels
were less than basal release. Under these conditions livers didn’t respond to
OTA effects indicating that calcium is required in the perfusion medium (Fig.
20).
Fig. 20: Effect of calcium on OTA-mediated TNF-α release from blood-free perfused rat liver TNF-α concentrations were measured in perfusate samples at 1) 0, 2) 20, 3) 30, 4) 50, 5) 70 and 6) 90 min. Samples obtained from blood-free rat livers perfused with: A) 2% dextran Krebs-Henseleit buffer medium alone (untreated); B) 2.5µmol/L OTA; C) 2% dextran Krebs-Henseleit Ca+2 buffer medium alone (untreated); D) 2.5µmol/L OTA in 2% dextran Krebs-Henseleit buffer medium. OTA was applied at 20 min into the perfusate after zero time (see Materials and Methods). Values represent the mean ± SEM of 3 livers for each group, (* P<0.05, ** P<0.01, *** P<0.001).
A B C D0
1000
2000
3000
4000
***
***
******
***
1= 0 min2= 20 min3= 30 min4= 50 min5= 70 min6= 90 min
314
25 6
***
TNF-
Con
cent
ratio
n in
per
fusa
te
Results
94
4.6.2 Effect of NF-kB inhibitor CAPE
TNF-α synthesis is under strong control of the transcription factor NF-kB
(Aggarwal, 2000; Denk et al., 2001; Liz-Grana and Gomez-Reino Carnota,
2001; Ye et al., 2003). To estimate the influence of NF-kB on OTA-mediated
TNF-α release, 10µmol/L caffeic acid phenylethyl ester (CAPE) which
potentially inhibits NF-kB activation (Natarajan et al., 1996) was added to
Kupffer cell cultures or to isolated perfused rat livers.
CAPE alone had no effects on basal TNF-α levels released by Kupffer cells in
the incubation medium, but when it was added 30 min prior to OTA, a
significant reduction in TNF-α concentration (P<0.001) was observed to be 200
pg/ml at 24 hrs (Fig. 21). Similarly, in the presence of CAPE the basal
concentration of TNF-α in the perfusate of perfused rat livers didn’t change.
When it was added 10 min prior to OTA to the perfusion medium a significant
reduction in TNF-α concentration (P<0.001) was observed in the perfusate to be
277 pg/ml at 90 min (Fig. 19 & Table 3). This indicates that NF-kB is required
for OTA-mediated release of TNF-α from perfused rat livers and from isolated
Kupffer cells in culture.

Results
95
4.6.3 Involvement of CD14 in OTA-mediated TNF- release from Kupffer
cells
Induction of TNF- in response to LPS required the CD14 molecule to be a
binding bridge between LPS and the Toll-like receptor 4. To test the influence
of the CD14 molecule in OTA-mediated TNF-α release, 3ng/ml of Anti-CD14
was added to the incubation medium of Kupffer cells 30 min prior to OTA,
which decreased the TNF-α level in the incubation medium from over 1000 to
375 pg/ml after 24 hrs (Fig. 21). These results indicated the signal cascade
leading to TNF- release requires CD14 molecules, which probably acts as a
connecting signal between OTA and TNFR.
Fig. 21: Involvement of CD14 and NF-kB in TNF-α release from Kupffer cells TNF-α concentrations were measured in incubated media of isolated cell in single culture at 1) 0, 2) 0.5, 3) 1, 4) 1.5, 5) 2, 6) 4 and 7) 24 hrs indicated by single columns. A) medium alone (untreated); B) 2.5µmol/L of OTA; C) 3ng/ml AntiCD14 antibody followed by 2.5 µmol/L OTA; D) 10µmol/L caffeic acid phenylethyl ester (CAPE); E) 10µmol/L caffeic acid phenylethyl ester (CAPE) followed by OTA. The tested compounds were applied at 30 min while 2.5µmol/L OTA was applied at 1 hr into the incubation medium
A B C D E0
250
500
750
1000
1250***
4
21
6
35
1= 0 min2= 0.5 hr3= 1 hr4= 1.5 hr5= 2 hr6= 4 hr
7
7= 24 hr
****
***
TNF-
con
cent
ratio
n pg
/ml

Results
96
after zero time (see Materials & Methods section). Values represent the mean ± SEM of 3 culturs for each group, (* P<0.05, ** P<0.01, *** P<0.001).

Discussion
97
Chapter 5. Discussion
5.1 Meaning of OTA-mediated release of TNF-α in the liver
Because the liver is placed between the digestive tract and the systemic
circulation, the liver occupies a central role in metabolism of nutrients and
drugs. It receives via the portal vein large amounts of nutrients and noxious
compounds from the digestive tract. The liver is the principal organ involved in
the biotransformation of exogenous substances and converts hydrophobic
substances into water-soluble products. However, potentially hepatotoxic
chemicals may produce liver damage in vivo due to an interaction with complex
cellular processes that follow their uptake, biotransformation, and elimination.
Such a hepatotoxin may react with fundamental cellular constituents; i.e.
proteins, lipids, RNA, and DNA and may induce lesions of the liver which often
cause steatosis (Guillouzo, 1998).
The liver is also a major organ for systemic release of inflammatory cytokines,
e.g. TNF- and IL-6, upon exposure to gut-derived bacterial toxins, i.e.
lipopolysaccharides (LPS). The release of cytokines from livers, in particular
TNF-α, had two sword edges. On the one hand, it mediates the physiological
processes of liver regeneration, and also plays an important role in the defense
mechanisms against bacteria, viruses, fungi and parasitic infections. On the
other hand it promotes the pathogenesis of several liver disorders, in particular

Discussion
98
chronic disorders, such as alcoholic liver disease (Hirano et al., 2003; Song et
al., 2004), liver-cirrhosis accompanying septicaemia (Byl et al., 1993, Ceydeli
et al., 2003), chronic inflammatory liver disease (Adams & Afford 2002;
McClain et al., 2004) and primary sclerosing cholangitis (Bernal et al., 1999;
Mitchell et al., 2001).
The liver functions are under the influence of various endogenous and
exogenous factors. Therefore, in vivo it is difficult to distinguish between the
primary effects of a compound on liver functions from those induced
secondarily, that result in complex interactions with other organs. In vitro liver
models represent an experimental approach to screen potential hepatotoxic
compounds and to investigate mechanism(s) by which chemicals induce liver
lesions. For this reason the isolated perfused liver preparation, liver tissue slices,
isolated and cultured hepatocytes, and subcellular fractions have been used
(Conway et al., 1983; Guillouzo, 1998).
In vitro, the isolated perfused liver appear to be the nearest to the in vivo
situation. This model has been used for investigating drug- and chemical-
induced hepatotoxicity (Plaa, 1993) and represents a useful tool to study
toxicokinetics. In our experiments we used isolated blood-free perfused rat
livers to investigate the effect of OTA on TNF-α release in comparison to LPS,
the known inducer of TNF-α.

Discussion
99
Because of the ubiquitous presence of ochratoxin A in almost every kind of
food (Gareis & Scheuer, 2000), it is reasonable that following absorption from
the gut, this toxin may exert effects first in the liver. OTA is clearly a potent
nephrotoxin and is the most important agent causing Balkan Endemic
Nephropathy (BEN) (Pfohl-Leszkowicz et al., 2002). However, the liver is also
among the OTA-target organs because of its food-borne exposure via the portal
vein after absorption from the gut. Furthermore, an enterohepatic circulation of
OTA was reported (Fuchs et al., 1988), providing repeated exposure of liver
cells to internally circulating OTA. OTA is transported from blood into
hepatocytes by carrier-mediated transport (Kontaxi et al., 1996). These reasons
may explain why the liver is exposed to the highest peak concentration of OTA
following the oral route and may cause damage to the liver as indicated by the
detoriation of liver DNA by OTA (Pfohl-Leszkowicz et al., 1993) and liver
tumors (Boorman, 1989). In contrast to subchronic and chronic effects, acute
toxic OTA effects to the liver are not clear. In previous studies with isolated
liver cell cultures direct cytotoxicity occured on hepatocytes at concentrations
as low as 1 µM OTA (Dörrenhaus & Föllmann, 1997).
A new effect of OTA is the release of TNF-α from blood-free perfused rat
livers (Weidenbach et al., 2000). This release was not observed with several
other mycotoxins such as 3-acetoxydeoxynivalenol (3-Ac-DON), xanthomegnin

Discussion
100
(XAN), citrinin (CIT), and viomellein (VIO) and was regarded specific for
OTA (Petzinger & Weidenbach, 2002).
In experiments shown in this thesis, the release of the proinflammatory cytokine
TNF- was observed during an ongoing toxin passage through an isolated
perfused rat liver at concentrations as low as 0.5 µM. The release of TNF-
increased ten fold at 2.5 µmol/L OTA without observing signs of general
cytotoxicity as assayed by LDH, GLDH, lactate and K+ ion release. The highest
tested dose of OTA (12.5 µmol/L) caused somewhat higher elevations of TNF-
concentration in the perfusate compared with 2.5 µmol/L but also caused
alterations in the liver cells' vitality, indicated by the release of high amounts of
LDH, GLDH and lactate. The increase of cytotoxic markers by the highest
tested dose of OTA correlated with released TNF-. This could mean that TNF-
probably promotes the cytotoxic effects of OTA at this dose. The known
inducer of TNF-, LPS, was used in our experiments as a positive control to
estimate the efficacy of the perfused liver model. If used at 0.1 µg/ml LPS
under similar experimental conditions, LPS in a previous study induced a
similar TNF- release from blood-free perfused rat livers as with 2.5 µmol/l
OTA (Weidenbach et al., 2000).
The liver lobule is formed by parenchymal cells, i.e. hepatocytes and non-
parenchymal cells. In contrast to hepatocytes that occupy almost 80% of the

Discussion
101
total liver volume and cell mass and perform the majority of numerous liver
functions, non-parenchymal liver cells contribute ca. 6.5% to the liver volume,
but 40% to the total number of liver cells. These cells are localized in the
sinusoidal cell fraction of the liver tissue. The walls of hepatic sinusoids are
lined by three different cell types: sinusoidal endothelial cells (SEC), Kupffer
cells (KC), and hepatic stellate cells (HSC, formerly known as fat-storing cells,
Ito cells, lipocytes, perisinusoidal cells, or vitamin A-rich cells). Additionally,
intrahepatic lymphocytes (IHL), including pit cells, i.e. liver-specific natural
killer cells, are often present in the sinusoidal lumen. It has been increasingly
recognized that both under normal and pathological conditions, many
hepatocyte functions are regulated by substances released from neighbouring
nonparenchymal cells (Milosevic, et al., 1999; Khetani et al., 2004). That
means mediators released from non-parenchymal liver cells may evidently
regulate functions of neighbouring hepatocytes and non-hepatocytes,
respectively. Key mediators involved in the intercellular communication in the
liver are prostanoids, nitric oxide, endothelin-1, TNF-, interleukins, and
chemokines, growth factors (TGF-beta, PDGF, IGF-I, HGF), and reactive
oxygen species (ROS). Paradoxically, the cooperation among liver cells is better
understood under some pathological conditions (i.e. in experimental models of
liver injury) than under normal conditions (Kmiec, 2001).

Discussion
102
The intact liver has a complex structure and function. This means, it is difficult
(in the isolated organ) to distinguish the primary site of OTA effects from those
resulting from cross-talk interactions between liver cells. Accordingly, many
cells may serve as a TNF-α source in response to OTA in the isolated organ. To
elucidate which liver cell type responds to OTA by releasing TNF-α into the
perfusate of blood-free perfused rat livers, Kupffer cells were blocked in vitro
by the heavy metal gadolinium chloride and in vivo by i.p. injection of the
Kupffer cells toxin clodronate. Furthermore, the major liver cell populations
were isolated in single cell cultures and exposed to OTA or to LPS separately
for 24 hrs.
Kupffer cells, the resident macrophages of the liver, are localized in the lumen
of the sinusoids and anchored to the endothelium by cytoplasmic protrusions
(Laskin, 1990). They are in constant contact with gut-derived particulate
materials and soluble bacterial products so that a subthreshold level of their
activation in the normal liver may be anticipated. Hepatic macrophages secrete
potent mediators of the inflammatory response (reactive oxygen species,
eicosanoids, nitric oxide, carbon monoxide, TNF- and other cytokines), and
thus control the early phase of liver inflammation, playing an important part in
the innate immune defense system. Exposure of Kupffer cells to bacterial
products, especially endotoxins (lipopolysaccharides, LPS), can lead to the

Discussion
103
intensive production of inflammatory mediators, and ultimately to liver injury.
Besides typical macrophage activities, Kupffer cells play an important role in
the clearance of senescent and damaged erythrocytes. Liver macrophages
modulate immune responses via antigen presentation (Knolle & Gerken, 2000;
Kmiec, 2001), and suppression of T-cell activation by antigen-presenting
sinusoidal endothelial cells via paracrine actions (Knolle & Gerken, 2000).
They also participate in the development of oral tolerance to bacterial
superantigens (Kmiec, 2001). Moreover, during liver injury and inflammation,
Kupffer cells secrete enzymes and cytokines that may damage hepatocytes, and
are active in the remodelling of extracellular matrix. However, much evidence
has accumulated in support of a role for Kupffer cells in various models of liver
diseases (Iimuro et al., 1994; Sarphie et al., 1996).
We blocked Kupffer cells in vitro by the rare earth metal salt gadolinium
chloride (GdCl3), as this compound was reported to depress the
reticuloendothelial (RES) activity (Lazar, 1973), and phagocytic activity
(Brown et al., 1997, Yang et al., 1999). It abolishes the hepatic expression of
some Kupffer cells' specific antigens (Klein et al., 1994; Kim & Choi, 1997),
without affecting the number of Kupffer cells (Rai et al., 1996). GdCl3 reduces
superoxide production and TNF-α mRNA expression by Kupffer cells in
response to injury (Iimuro et al., 1994; Lazar et al., 1994). Alternatively,

Discussion
104
Kupffer cells isolated from GdCl3-treated animals produced more superoxide
and TNF-α compared with control cells (Ahmad et al., 1999). Furthermore, total
hepatic TNF- mRNA levels were reduced to approximately 60% up to 5 days
in rats pre-treated with gadolinium chloride and challenged with LPS 4 hrs
before being scarified. In that study the authors found the LPS responses
reversed to normal on day 8 (Lee et al., 2004). This contradiction in the action
of GdCl3 in vivo was explained by the survival of a subpopulation of Kupffer
cells which remain viable after systemic GdCl3 administration. In our
experiments, GdCl3 at 15µmol/l added to the perfusion medium didn’t produce
specific toxicity of the liver, i.e. no leakage of cytotoxicity markers occurred
into the perfusate. However, it achieved complete blockage of OTA-mediated
TNF-α release from blood-free perfused rat livers.
Apart from in vitro blockage, we also blocked Kupffer cells in vivo by
clodronate. Clodronate was encapsulated into liposomes and was injected
intaperitoneally. This was reported to enhance its efficacy against macrophages.
Clodronate requires rather a long time to block Kupffer cells via induction of
apoptosis, too long for an application to perfused rat livers in vitro. Therefore,
liposome encapsulated clodronate, LIP-CLOD, was injected i.p. into rats 48 hrs
before liver preparation. The livers isolated from LIP-CLOD pre-treated rats
showed slight release of cytotoxicity markers (in the absence of OTA). This
Discussion
105
indicated LIP-CLOD at the recommended dose may produce harmful effects on
the liver. However, LIP-CLOD successfully blocked the effect of OTA by
completely inhibiting TNF- release. The inhibitory effect of LIP-CLOD on
OTA-mediated TNF- release could result from the preceeding death of
Kupffer cells. Consequently, OTA would not be able to find the target cell for
TNF-α release. Kupffer cells depletion by LIP-CLOD caused delayed liver
regeneration after partial hepatectomy in rats due to the reduction of TNF-α
mRNA (Meijer et al., 2000). The vehicle of clodronate in our experiments was
used under similar experimental conditions and didn’t significantly modify
OTA actions. This means, the effects produced by liposome-encapsulated LIP-
CLOD resulted from clodronate action.
The data obtained from the above experiments suggest that Kupffer cells are the
target for OTA mediated TNF- release. This was confirmed with cell
preparations from rat liver containing isolated hepatocytes, or sinusoidal
endothelial cells, respectively. A non-toxic dose of OTA or LPS was used
which already had produced significant release of TNF- from the blood-free
perfused liver. From the single cells preparations neither sinusoidal endothelial
cell nor hepatocytes showed any response during OTA exposure. However, in
contrast to OTA, all cells responded to LPS, albeit not with equal efficacy. This

Discussion
106
discrepancy in TNF-α release could indicate separate signalling mechanisms of
OTA versus LPS on the different cell types.
Liver parenchymal cells were reported already as a minor source for TNF-
release (Hunt et al., 1992). E.g. Hasmall et al., 2000, found that basal level of
TNF- in pure hepatocytes cultures was higher than that detected from non-
parenchymal liver cells and only non-parenchymal liver cells responded to
nafenopin by releasing TNF-. On the other hand, the parenchymal cell was
reported to produce TNF-α four times more upon LPS stimulation than without
LPS. Furthermore, rat hepatocytes released TNF-α after 1 hr of exposure to
Listeria monocytogenes. This response was time-dose- and density-dependent
(Santos et al., 2005).
TNF-α was also released from a human liver sinusoidal endothelial cell line
during hypoxia re-oxygenation injury. It increased significantly in a time-
dependent manner, while sinusoidal cell function decreased (Wang et al., 2002).
Sinusoidal cells expressed TNF-α mRNA when rat liver was chronically
cannulated and subjected to haemorrhage (Yamashita, et al., 2002), or when rats
were stimulated i.v. by plasmid DNA-cationic liposome complex (lipoplex)
(Sakurai et al., 2002). From this data we conclude that in principle the release of
TNF-α from hepatocytes or sinusoidal endothelial cells is feasible, but that
hepatocytes and sinusoidal endothelial cells lack any response to release TNF-α

Discussion
107
upon OTA binding. It seems that OTA could trigger this specific signalling
cascade only in Kupffer cells.
The primary targets for the OTA mediated cytokine release in rat livers were
Kupffer cells, whereas TNF- release in response to LPS is a summation of the
outcome of liver parenchymal and non-parenchymal cells.
5.2 Non-Liver cells and OTA: Differential sensitivity between OTA and
LPS on releasing TNF-α
Kupffer cells represent the liver macrophage, which produces a number of
mediators, including cytokines and chemokines (Lewis & McGee, 1992). Apart
from liver tissue macrophages are widely present in the lung, bone marrow, and
synovia (Lewis & McGee, 1992), possibly indicating that in vivo this cytokine
response to OTA is likely not restricted to the liver and may include many other
organs as well. Accordingly, the observed phenomenon of TNF- release
indicates a general, previously unconsidered, toxicological property of this
mycotoxin. For this reason, the ability of other cell types to release TNF-α by
ochratoxin A or by LPS was investigated. A preparation of primary rat
peritoneal macrophages and also the mouse monocyte macrophage cell line
(J774A.1) were used as were the human hepatoma cell line (HepG2) and the
connective tissue cell line (L929) culture. All cell types were exposed to

Discussion
108
2.5µmol/l OTA for 1-24 hrs. Furthermore, under similar experimental
conditions these cells were incubated with 0.1 µg/ml LPS as the positive
control.
We found rat peritoneal macrophages, and mouse macrophages J774A.1
released TNF- in respond to OTA, but the HepG2 and the L929 cell line didn’t
respond to OTA at any indicated time points. OTA-mediated TNF- release
was 10 times that of basal levels in peritoneal macrophages, whereas the
elevation was 6 times in the case of the J774A.1 cell line. On the other hand, all
cell types exposed in our experiments to LPS showed significant release of
TNF- except HepG2 which even didn’t respond to LPS. Hong et al., 2004
found 10µg/ml LPS expressed TNF- protein from HepG2. The contradiction
to our findings could be explained by the Gutierrez-Ruiz et al., 1999 finding.
When they found TNF- released from HepG2 by 1µg/ml LPS as well as other
stimulators. The authors concluded HepG2 cells participated in a differential
cytokine release, which differs according to the toxic agent and the time of
exposure (Gutierrez-Ruiz et al., 1999).
Our data suggest different kind of macrophages (Kupffer cells, peritoneal
macrophages, J774A.1 cell line) as a general source for TNF- release upon
OTA exposure. In contrast, LPS induces TNF- from a wide variety of cell
types. In addition, the LPS reaction was more pronounced than that by OTA.

Discussion
109
5.3 Endogenous protection of OTA mediated TNF-α release by prostanoids
TNF- also potently stimulates apoptosis in many cell types (Aggarwal, 2000;
Gupta, 2002). This mechanism may convey another type of cell toxicity of
OTA. However, in liver parenchymal cells promotion of liver cell regeneration
has also been reported (Yamada et al., 1998b; Diehl, 1999). The regenerating
effects on hepatocytes require a primary stimulus such as tissue destruction
which was performed experimentally by a partial hepatectomy (Webber et al.,
1994). Also TNF- can promote liver injury in a number of ways. For example,
in vitro TNF- renders hepatocytes more susceptible to toxicity (Admson &
Billings, 1992; Hoek & Pastorino, 2002), TNF- also can prime PMNs to
release toxic products (i.e. ROS and proteases) that can damage nearby cells
(Kushimoto et al., 1996). In non-injured, “normal” livers OTA mediated strong
release of TNF-. This could, however, cause a disaster to the liver if other
effects did not provide protection. The protective effect provided by other liver
cells could be the release of other inflammatory mediators i.e. PLA2, or PLA2
derived metabolic prostanoid products (AL-Anati et al., 2005), or the release of
other cytokines, which have antagonistic effects with TNF- such as IL-10.
However, this mechanistic concept requires further studies.
The extracellular phospholipase A2 (sPLA2) levels are increased in various
Discussion
110
systemic inflammatory diseases such as adult respiratory distress syndrome,
septic shock, and acute pancreatitis (Vadas, 1984; Kim et al., 1995),
autoimmune diseases like rheumatoid arthritis, Crohn’s disease, and ulcerative
colitis (Haapamaki et al., 1998; Haapamaki et al., 1999), and allergic disorders
such as bronchial asthma and allergic rhinitis (Stadel et al., 1994; Chilton et al.,
1996). In these diseases, sPLA2 levels increase in plasma and inflammatory
fluids like synovial fluid, bronchoalveolar lavage, and nasal lavage, indicating
that sPLA2s are released systemically as well as at sites of tissue inflammation.
These observations implicate sPLA2 in inflammation. Interestingly, most
inflammatory diseases associated with increased sPLA2 levels are characterized
by overproduction of cytokines such as TNF-α, IL-1, and IL-6 (Remick, 1997).
Others found two sPLA2 isoforms, human group IB (hGIB) and human group X
(hGX) induced TNF-α and IL-6 from human lung macrophage (Granata et al.,
2005). This data could explain why the phospholipase A2 inhibitor aristolochic
acid prevented TNF-α release from blood-free perfused liver in our
experiments.
sPLA2 has different biological activity and is implicated in the occurrence of
diseases by different mechanisms. One important mechanism is the release of
arachidonic acid (AA), the precursor of eicosanoids, from cell membranes or
extracellular phospholipids (Murakami & Kudo, 2002). In the presence of TNF-

Discussion
111
α arachidonic acid and its metabolic products were released in several cell lines
due to the activation of phospholipase A2, they mediated and potentiated TNF-α
toxicity (Reid et al., 1991; Hayakawa et al., 1993). we expected that
arachidonic acid may contribute to toxic effects observed with OTA. In this
study the interference with TNF-α release by arachidonic acid and also by major
metabolites derived from arachidonic acid was observed.
Our results clearly showed that arachidonic acid itself markedly suppressed
OTA-mediated TNF- cytokine release. The effect is probably not mediated by
arachidonic acid alone but in addition by its cyclooxygenase metabolites, i.e.
prostaglandins. These metabolites prevail over an opposing effect seen by
arachidonic acid metabolites formed by lipoxygenase or P450 enzymes. If the
cyclooxygenase/arachidonic acid shelter is blocked by indomethacin an
excessive 2-fold higher release of TNF- under OTA was observed, likely
because arachidonic acid was shifted in the opposing lipoxygenase and/or P450
pathway. This situation may have clinical relevance as it sheds some doubts on
the usefulness of clinical treatment with non-steroidal anti-inflammatory drugs
under circumstances of ongoing mycotoxin burden.
In endothelial cells, arachidonic acid suppresses TNF- release at the
transcription level (Stuhlmeier et al., 1996). This occurs by stabilization of
IkB/NF-kB complex, which lead to the inhibition of the transcription factor
Discussion
112
NF-kB (Stuhlmeier et al., 1997). The stabilization of the transcription factor
complex forced NF-kB to reside in the cytosol, and this is why the activation of
TNF- and other genes ceases (Denk et al., 2001; Ye et al., 2003). Although the
effect of OTA on the level of NF-kB is unknown, our results obtained from
CAPE, an NF-kB blocker, would support this concept.
The effect of prostaglandin on TNF-α released from LPS-stimulated peritoneal
rat macrophage was studied by Renz et al., 1988. They found low
concentrations of PGE2 (0.1 to 10 ng/ml) stimulated, whereas higher
concentrations (greater than 10 ng/ml) suppressed TNF-α release. The authors
found PGE2-stimulated TNF-α production was dependent on de novo protein
synthesis and was associated with an intracellular rise of cGMP, because low
PGE2 concentrations preferentially increased cGMP but not cAMP. In tumor
cytotoxicity assays, PGE2-activated macrophages were active only against TNF-
α-sensitive target cells. These findings demonstrate that TNF-α synthesis in
macrophages is up-regulated by cGMP and down-regulated by cAMP, which
indicates that cyclic nucleotides act as intracellular messengers for extracellular
signals of macrophage activation (Renz et al., 1988). Others found that the
inhibitory effect of PGE2 on TNF-α and IL-6 production by lipopolysaccharide
(LPS)-stimulated murine peritoneal macrophages resulted from induction of IL-
10 (Strassmann et al., 1994). In vivo, the administration of PGE2 before LPS

Discussion
113
challenge significantly reduces circulating TNF-α and IL-6 levels. Anti-IL-10
antibody substantially enhanced the LPS-induced TNF-α and IL-6 levels in
mice that received either LPS alone or LPS plus PGE2 (Strassmann et al., 1994).
Similar findings were observed by Dooper et al., 2002, when they found with
LPS-stimulated freshly isolated human peripheral blood mononuclear cells
(PBMC) that PGE1, PGE2, and PGE3 caused inhibition of TNF-α production
whereas IL-6 was unaffected but IL-10 increased (Dooper et al., 2002). We
conclude that PGs inhibited TNF-α release by different mechanisms and
through an autocrine feedback mechanism. The elevation of TNF-α levels in our
experiments in the presence of indomethacin is in accordance with this
conclusion.
Cytochrome P4502E1 (CYP2E1) is up-regulated in Kupffer cells after ethanol
treatment, this effect primes Kupffer cells, sensitizing them to increase TNF-α
production in response to LPS. LPS caused overproduction of TNF-α from
RAW 264.7 macrophages which were transfected with CYP2E1 (E2) (Cao et
al., 2005). The inhibition of Cytochrome P450 (CYP2J2) protected carcinoma
cells from apoptosis induced by TNF-α (Jiang et al., 2005). Fantuzzi et al., 1993
found intraperitoneal administration of 100mg/kg of metyrapone suppressed
serum TNF-α in LPS-challenged mice. Also in vitro production of TNF-α by
endotoxin-stimulated human monocytes was also inhibited by metyrapone. The

Discussion
114
author suggested the inhibition of TNF-α by metytrapone was resulted from
cytochrome P450 inhibition (Fantuzzi et al., 1993). However, these data could
explain the effect of CYP-450 inhibitor metyrapone in our experiments, which
caused blocking of OTA effects and the absence of TNF-α from perfusate.
Leukotrienes (LT), in particular LTB4, are potent inflammatory mediators and
immunomodulators (Gagnon et al., 1989). In their interactions with leukocytes,
LTB4 can activate numerous functions of neutrophils and modulate the activities
of various lymphocyte subsets. LTB4 can also augment macrophage and
monocyte cytotoxic activities and enhance their production of hydrogen
peroxide and the monokines interleukin 1 and TNF-α (Gagnon et al., 1989).
Stimulated macrophages metabolize some protein of their membrane-derived
arachidonic acid via the 5-lipooxygenase pathway, resulting primarily in the
production of leukotrienes B4 and C4. It has been reported that the inhibition of
5-lipooxygenase by nordihydroguaiaretic acid (NDGA) and AA861 reduced
asbestos- or silica-stimulated TNF-α release from rat alveolar macrophages.
This inhibitory effect was partially restored by added exogenous LTB4 (Dubois
et al., 1989). 15-HPETE regulates the production of the proinflammatory
cytokine TNF-α posttranscriptionally by promoting degradation of LPS-induced
TNFmRNA in a human monocytic cell line (Ferrante & Ferrante 2005).
Blocking production of LTC4 also caused reduction of LPS-induced synthesis of

Discussion
115
TNF-α from murine peritoneal macrophages (Schade et al., 1989). These results
are similar to our observation in the perfused liver model. Others found that the
5-lipoxygenase inhibitors VZ 65 and AA-861 as well as methylxanthine
pentoxyfilline (PTX) inhibited TNF-α production from LPS-stimulated murine
macrophage line RAW264, independent of the simultaneously administration of
LPS or 30 min after LPS treatment (Lin et al., 2004). All these results indicate a
substantial stimulation of TNF-α release by leukotrienes, irrespective which
initiating trigger (OTA or LPS) is used.

Conclusions
116
Chapter 6. Conclusions 1-The experimental passages of OTA via portal vein induce TNF-α release in
dose- and time-dependent fashion.
2-OTA at 2.5µmol/L releases significant amounts of TNF-α without influencing
the liver cell's vitality.
3-Similar amounts of TNF-α are released by OTA at 2.5µmol/L and by LPS
0.1µg/ml.
4-Among liver cell populations only Kupffer cells are the source of OTA-
mediated TNF-α release from blood-free perfused rat livers. In contrast, TNF-α
release by LPS is a summation of release by Kupffer cells, hepatocytes, and
sinusoidal endothelial cells.
5-Macrophages are the only source for TNF- release upon OTA exposure,
whereas LPS induces TNF- from a wide variety of cell types.
6-LPS reaction was more pronounced than that by OTA in isolated cells.
7-Arachidonic acid and its cyclooxygenase metabolites are suppressors of OTA-
mediated TNF-α release from blood-free perfused rat livers, whereas
lipooxygenase -and CYP-450- metabolites have the opposite effect. (Fig. 22)

Conclusions
117
8-OTA-induced TNF-α release is likely to occur via the NF-kB transcription
factor pathway. In addition, OTA apparently requires the expression of CD14
antigen in Kupffer cells probably for OTA binding to TNF receptors. (Fig. 22)
9-The in vivo cytokine response to OTA is likely not restricted to the liver and
may include many other organs as well. Therefore, the observed phenomenon of
TNF- release indicates a general, previously unconsidered, toxicological
property of this mycotoxin.
Fig. 22: Proposed mechanism of OTA-mediated TNF- release from Kupffer cells: The binding of OTA with TNFR via CD14 on Kupffer cell membrane leads to activation of NF-kB followed by subsequent expression of major histocompatibility complex (MHC) Class III gene, which is modulated by lipoxygenase (LPX) and or Cytochrome P-450 (CYP-450) metabolites (inducer) and by arachidonic acid (A.A.) and or cyclooxygenase metaboiltes (COX) (suppressors).

Abstract
118
Abstract Introduction: Tumor necrosis factor alpha TNF-α is a pro-apoptotic cytokine
which is produced by a wide variety of cell types in response to various
inflammatory stimuli. It promotes the pathogenesis of several health disorders,
in particular those related with chronic liver diseases. TNF-α is produced
mainly by macrophages. That is why liver is considered a major source of
whole body TNF-, particularly if exposed to gut derived bacterial endotoxins
(LPS). Also the liver is continuously exposed to the highest concentration of
OTA via portal vein, and considered one of the important OTA-target organs.
Aim: We studied the mechanism of induction of TNF-α release from rat liver
by OTA in comparison with 0.1 µg/ml lipopolysaccharide (LPS). For this
purpose we used isolated blood free-perfused rat livers, isolated pure rat
hepatocytes, sinusoidal endothelial and Kupffer cells. Furthermore, peritoneal
rat macrophages, mouse macrophages J774A.1, HepG2, and L929 cell line were
exposed to 2.5 µmol/L OTA or 0.1 µg/ml LPS. The primary cell preparations or
cell lines were incubated for 24 hrs at 370C with 5% CO2 in a culture medium
containing 10% of FCS and penicillin/ streptomycin (100 IU & 100µg/ml
respectively).
Results: In the perfusion model OTA induced TNF-α release in a time- and
dose dependent fashion. OTA at 2.5µmol/L released 2600 pg/ml and similar
amount of TNF-α was released by 0.1 µg/ml LPS (3017 pg/ml) after 90 min

Abstract
119
without concomitant significant increase of cytotoxicity markers (LDH, GLDH,
lactate and K+ ion). Under similar experimental conditions blockade of Kupffer
cells in vitro by 15µmol/L gadolinium chloride or in vivo cell depletion by 2ml
of liposome encapsulated clodronate per rat abrogated all OTA-mediated TNF-α
release from perfused rat livers. Further experiments were done to determine the
target cells of OTA in the liver. Only isolated Kupffer cells released TNF-α
when exposed separately to the same concentration of OTA, whereas isolated
hepatocytes and sinusoidal endothelial cells remained unaltered. However, all
these cells respond to LPS by releasing significant amounts of TNF-α into the
culture media for up to 24 hrs. In further experiments peritoneal rat
macrophages and mouse macrophages J774A.1 released TNF-α upon OTA or
LPS exposure, whereas the L929 cell line responded to LPS only. In contrast,
HepG2 was not affected by OTA or LPS.
We further investigated the role of arachidonic acid and its metabolites on
OTA-mediated TNF-α release from blood free-perfused rat liver. Aristolochic
acid, 50µmol/L, a phospholipase A2 inhibitor, and 10µmol/L of exogenous
arachidonic acid blocked OTA-induced TNF-α release even below basal levels.
Indomethacin, 10µmol/L, a potent inhibitor of the cyclooxygenase (COX)
pathway, almost doubled TNF-α concentrations in the perfusate yielding 5500
pg/ml after 90 min. On the other hand, inhibition of lipoxgenase (LPX) by

Abstract
120
30µmol/L nordihydroguaiaretic acid (NDGA) and of the cytochrome P-450
(CYP) pathway by 100µmol/L metyrapone also decreased TNF-α below basal
levels. Finally 10μmol/L caffeic acid phenylethyl ester, a NF-kB inhibitor,
blocked OTA-mediated TNF-α release from perfused livers and also when
applied to Kupffer cell suspensions. The addition of a monoclonal anti-CD14
antibody to Kupffer cells in suspension 30 min prior to OTA-treatment reduced
TNF-α in the culture medium from 1000 pg/ml to 375pg/ml. OTA-mediated
TNF-α release from blood free-perfused rat liver required Ca+2 ions.
Conclusion: OTA induces TNF-α from Kupffer cells. This release is
suppressed by arachidonic acid and its cyclooxygenase metabolites, whereas
LPX and CYP-450- metabolites have the opposite effect. OTA-induced TNF-α
release is likely to occur via the NF-kB transcription factor pathway. In
addition, OTA probably requires the expression of CD14 antigen in Kupffer
cells probably for OTA-binding to TNF-α receptors. Our data suggest
macrophages as a main source for TNF- release upon OTA exposure. In
contrast, LPS induced TNF- from a wide variety of cell types. In addition, the
LPS reaction was more pronounced than that by OTA. OTA-mediated TNF-
release from macrophages could explain general unconsidered immuno
toxicological phenomena of OTA.
Zusammenfassung
121
Zusammenfassung
Einleitung: Tumornekrosefaktor alpha (TNF-α) ist ein pro-apoptotisches
Cytokin, das von einer großen Anzahl von Zelltypen als Antwort auf
Entzündungsreize gebildet wird. Es fördert die Pathogenese mehrerer
Krankheiten, vor allem solcher, die mit chronischen Lebererkrankungen
einhergehen. TNF-α wird überwiegend von Makrophagen gebildet. Die Leber
ist dann eine Hauptquelle, wenn aus dem Darm resorbierte bakterielle
Endotoxine (LPS) auf sie einwirken. Allerdings ist die Leber auch einer
ständigen Belastung mit hohen Konzentrationen von Ochratoxin A (OTA) über
die Pfortader ausgesetzt und stellt daher ein wichtiges Zielorgan dieses
Mycotoxins dar.
Ziel: Wir untersuchten den Mechanismus der Freisetzung von TNF- α aus der
Leber durch OTA im Vergleich zu einer Freisetzung durch 0,1 µg/ml
Lipopolysaccharid (LPS). Aus diesem Grund verwendeten wir die isolierte,
Blutfrei-perfundierte Rattenleber sowie daraus isolierte Hepatozyten,
sinusoidale Endothelzellen und Kupffer´sche Sternzellen. Weiterhin wurden
peritoneale Rattenmakrophagen, Mausmakrophagenzellen J774A.1, HepG2-
Zellen (humane Hepatozytentumorzellen) und die L929 Zelllinie mit 2,5µmol/L
OTA oder 0,1µmol/L LPS inkubiert. Die Primärzellpäparationen bzw.
Zelllinien wurden über 24 Stunden bei 37 oC unter 5% CO2 in einem

Zusammenfassung
122
Kulturmedium mit 10% fetalem Kälberserum (FKS) sowie
Penicillin/Streptomycin (100 IU & 100µg/ml) kultiviert.
Ergebnisse: Im Perfusionsmodell induzierte OTA eine Zeit- und Dosis-
abhängige Freisetzung von TNF-α. Unter 2,5µmol/L OTA wurden nach 90
Minuten 2600 pg/ml TNF-α gemessen, fast gleich viel wie unter 0,1µg/ml LPS
(3017 pg/ml). Dabei stiegen die Zytotoxizitätsmarker LDH, GLDH, Laktat und
Kalium-Ionen nicht nennenswert an.
Unter den gleichen experimentellen Bedingungen führte eine Blockade der
Kupffer-Zellen in vitro durch 15µmol/L Gadoliniumchlorid oder eine in vivo
Kupfferzellabnahme unter Einfluss von 2 ml/Ratte liposomalem Clodronat zu
einem völligen Verschwinden der OTA-induzierten TNF-α Freisetzung aus der
perfundierten Rattenleber. Weitere Experimente wurden unternommen, um die
Zielzellen der OTA-Wirkung in der Leber zu ermitteln. Nur isolierte Kupffer-
Zellen setzten TNF-α nach OTA-Exposition frei, während isolierte Hepatozyten
und Sinusendothelzellen unverändert blieben. Allerdings reagierten alle
Zellarten auf LPS, indem sie signifikante Mengen von TNF-α in die
Kulturmedien innerhalb von 24 Stunden abgaben. In weiteren Experimenten
setzten Ratten-Makrophagen sowie Maus-Makrophagen J774A.1 TNF-α unter
OTA und LPS Einwirkung frei, während die L929-Zellen nur auf LPS reagierten.
Im Unterschied dazu reagierten HepG2-Zellen weder auf OTA noch auf LPS.
Zusammenfassung
123
Wir untersuchten weiterhin die Bedeutung von Arachidonsäure und ihren
Metaboliten auf die OTA-vermittelte TNF-α Abgabe aus der blutfrei-
perfundierten Rattenleber. Aristolochiasäure, 50µmol/L, ein Phospholipase A2-
Inhibitor, und 10µmol/L von exogen zugesetzter Arachidonsäure verminderten
die OTA-induzierte TNF- α Freisetzung noch unter die basalen Spiegel.
Indomethacin, 10µmol/L, eine potenter Hemmstoff des Cyclooxygenase-
(COX)-Weges, verdoppelte beinahe die TNF-α Konzentration im Perfusat auf
5500 pg/ml nach 90 Minuten. Auf der anderen Seite bewirkte eine Hemmung
der Lipoxigenase (LPX) durch 30µmol/L Nordihydroguairetinsäure (NDGA)
und des Cytochrom P450- (CYP)- Weges durch 100µmol/L Metyrapone einen
Abfall von TNF-α unter basale Konzentrationsspiegel. Schließlich blockierte
10µmol/L Coffeinsäurephenylester, ein NF-kB Hemmstoff, die OTA-
vermittelte Freisetzung von TNF-α aus isolierten Kupffer-Zellen und
perfundierten Lebern. Ein Zusatz des monoklonalen CD14-Antikörpers zu
Kupffer-Zellen in Suspension 30 Minuten vor Zugabe von OTA verminderte
den TNF-α Gehalt im Kulturmedium von 1000 pg/ml auf 375 pg/ml. Die OTA
vermittelte TNF-α Abgabe aus der blutfrei-perfundierten Rattenleber benötigte
Ca++-Ionen.
Schlussfolgerungen: OTA induziert eine TNF-α Abgabe aus Kupffer´schen
Sternzellen. Diese Freisetzung wird durch Arachidonsäure und ihre
Zusammenfassung
124
Cyclooxygenase-Metabolite unterdrückt, während die LPX- und CYP450-
gebildeten Metabolite den gegenteiligen Effekt haben. Die OTA-vermittelte
TNF-α Freisetzung erfolgt wahrscheinlich mittels des NF-kB
Transkriptionsweges. Zusätzlich benötigt OTA die Expression von CD14
Antigen auf Kupffer-Zellen, vermutlich für eine Bindung von OTA an TNF-α
Rezeptoren. Unsere Ergebnisse legen dar, dass Makrophagen eine Hauptquelle
des TNF-α unter OTA sind. Im Unterschied dazu induziert LPS TNF-α aus
einer Vielzahl von Zelltypen. Zusätzlich ist aber die LPS Antwort stärker als
unter OTA. Die OTA-vermittelte TNF-α Freisetzung aus Makrophagen könnte
bisher nicht beachtete immuntoxikologische Eigenschaften des OTA erklären.

References
125
Chapter 7. References
Abarca, M.L., Bragulat, M.R., Castella, G., Cabanes, F.J. (1994)
Ochratoxin A production by strains of Aspergillus niger var. niger. Appl
Environ Microbiol 60: 2650-2652
Adams, D.H., Afford, S.C. (2002) The role of cholangiocytes in the
development of chronic inflammatory liver disease. Front Biosci 7: 276-285
Adamson, G.M., Billings, R.E. (1992) Tumor necrosis factor induced
oxidative stress in isolated mouse hepatocytes. Arch Biochem Biophys 294:
223-229
Aggarwal, B.B. (2000) Tumor Necrosis Factor receptor associated signaling
molecules and their role in activation of apoptosis, JNK and NF-kB. Ann
Rheum Dis 59: i6-i16
Aggarwal, B.B., Natarajan, K. (1996) Tumor necrosis factors:
developments during last decade. Eur Cytokine Netw 7:93-124
Ahmad, N., Gardner, C. R., Yurkow, E.J., Laskin, D.L. (1999) Inhibition
of macrophages with gadolinium chloride alters intercellular adhesion
molecule-1 expression in the liver during acute endotoxemia in rats. Hepatol
29: 728-736

References
126
AL-Anati, L., Katz, N,. Petzinger, E. (2005) Interference of arachidonic
acid and its metabolites with TNF-α release by ochratoxin A from rat liver.
Toxicol 208: 335-346
Albassam, M.A., Yong, S.I., Bhatnagar, R., Sharma, A.K., Prior, M.G.
(1987) Histopathologic and electron microscopic studies on the acute
toxicity of ochratoxin A in rats. Vet Pathol 424: 427-435
Alves-Rosa, F., Vermeulen, M., Cabrera, J., Stanganelli, C., Capozzo,
A., Narbaitz, M., van Rooijen, N., Palermo, M., Isturiz, M.A. (2003)
Macrophage depletion following liposomal-encapsulated clodronate (LIP-
CLOD) injection enhances megakaryocytopoietic and thrombopoietic
activities in mice. Br J Haematol 121: 130-138
Assaf, H., Azouri, H., Pallardy, M. (2004) Ochratoxin A induces apoptosis
in human lymphocytes through downregulation of Bcl-xL. Toxicol Sci 79:
335-344
Atroshi, F., Biese, I., Saloniemi, H., Ali-Vehmas, T., Saari, S., Rizzo, A.,
Veijalainen, P. (2000) Significance of apoptosis and its relationship to
antioxidants after ochratoxin A administration in mice. J Pharm Pharm Sci
3: 281-291
Aydin, G., Ozcelik, N., Cicek, E., Soyoz, M. (2003) Histopathologic
changes in liver and renal tissues induced by Ochratoxin A and melatonin in
rats. Hum Exp Toxicol 22: 383-391

References
127
Badger, A.M., Olivera, D., Talmadge, J.E., Hanna, N. (1989) Protective
effect of SK&F 86002, a novel dual inhibitor of arachidonic acid
metabolism, in murine models of endotoxin shock: inhibition of tumor
necrosis factor as a possible mechanism of action. Circ Shock 27: 51-61
Bakker, M., Pieters, M.N. (2002) Risk Assessment of Ochratoxin A in the
Netherlands RIVM report 388802025/2002
Barnes, J.M. (1967) Possible nephrotoxic agents, in The Balkan
Nephropathy, Wolstenholme, G.E.W. and Knight, J. Eds. Churchill, London,
p-110
Bautista, A.P., Skrepnik, N., Niesman, M.R., Bagby, G.J. (1994)
Elimination of macrophages by liposome-encapsulated dichloromethylene
diphosphonate suppresses the endotoxin-induced priming of Kupffer cells. J
Leukoc Biol 55: 321-327
Bayman, P., Baker, J.L., Doster, M.A., Michailides, T.J., Mahoney, N.E.
(2002) Ochratoxin production by the Aspergillus ochraceus group and
Aspergillus alliaceus. Appl Environ Microbiol 68: 2326-2329
Bazzoni, F., Beutler, B. (1996) The tumor necrosis factor ligand and
receptor families. N Engl J Med 334: 1717-1724
Bernal, W., Moloney, M., Underhill, J., Donaldson, P.T. (1999)
Association of tumor necrosis factor polymorphism with primary sclerosing
cholangitis. J Hepatol 30: 237-241

References
128
Beutler, B., Milsark, I.W., Cerami, A.C. (1985) Passive immunization
against cachectin/tumor necrosis factor protects mice from lethal effect of
endotoxin. Science 229: 869-871
Bezerra, M.C., Carvalho, J.F., Prokopowitsch, A.S., Pereira R.M. (2005)
RANK, RANKL and osteoprotegerin in arthritic bone loss. Braz J Med Biol
Res 38: 161-170
Bonetti, B., Valdo, P., Ossi, G., De Toni, L., Masotto, B., Marconi, S.,
Rizzuto, N., Nardelli, E., Moretto, G. (2003) T-cell cytotoxicity of human
Schwann cells: TNFalpha promotes fasL-mediated apoptosis and IFN
gamma perforin-mediated lysis. Glia 43: 141-148
Boorman, G. (1989) NTP Technical Report on the Toxicology and
Carcinogenesis Studies of Ochratoxin A (CAS No 303-47-9) in F344/N Rats
(Gavage Studies). NTP TR 358, NIH Publication no. 89-2813. Ed. G.
Boorman. U.S. Department of Health and Human Services. National
Institute of Health, Research Triangle Park, NC
Brash, A.R. (2001) Arachidonic acid as bioactive molecule. J Clin Invest
107: 1339-1345
Braun, J., Sieper, J. (2003) Overview of the use of the anti-TNF agent
infliximab in chronic inflammatory diseases. Expert Opin Biol Ther 3: 141-
168
Brideau, C., Van Staden, C., Styhler, A., Rodger, W.I., Chan, C. (1999)
The effects of phosodiesterase type 4 on tumor necrosis factor-α and

References
129
leukotriene B4 in a novel human whole blood assay. Br J Pharmacol 126:
979-988
Broide, D.H., Lotz, M., Cuomo, A.J., Coburn, D.A., Frederman, E.C.,
Wasserman, S.I. (1992) Cytokines in symptomatic asthma airways. J
Allergy Clin Immunol 89: 958-967
Brown, A.P., Harkema, J.R., Schultze, A.E., Roth, R.A., Ganey, P. E.
(1997) Gadolinium chloride pretreatment protects against hepatic injury but
predisposes the lungs to alveolitis after lipopolysaccharide administration.
Shock 7: 186-192
Brown, S.J., Abreu, M.T. (2005) Antibodies to tumor necrosis factor-α in
the treatment of Crohn's disease. Curr Opin Drug Discov Devel 8: 160-168
Bshesh, K., Zhao, B., Spight, D., Biaggioni, I., Feokistov, I., Denenberg,
A., Wong, H.R., Shanley, T.P. (2002) The A2A receptor mediates an
endogenous regulatory pathway of cytokine expression in THP-1 cells. J
Leukoc Biol 72: 1027-1036
Byl, B., Roucloux, I., Crusiaux, A., Dupont, E., Deviere, J. (1993) Tumor
necrosis factor- and interleukin-6 plasma levels in infected cirrhotic
patients. Gastroenterology 104: 1492-1497
Cameron, R.G., Neuman, M.G., Shear, N.H., Katz, G., Bellentani, S,
Tiribelli, C. (1998) Modulation of liver-specific cellular response to ethanol
in vitro in HepG2 cells. In Vitro Toxicol 12: 1-29
References
130
Cao, Q., Mak, K.M., Lieber, C.S. (2005) Cytochrome P4502E1 primes
macrophages to increase TNF-α production in response to
lipopolysaccharide. Am J Physiol Gastrointest Liver Physiol 289: G95-G107
Carswell, E.A., Old, L.J., Kassel, R.L., Green, S., Fiore, N., Williamson,
B. (1975) An endotoxin-induced serum factor that causes necrosis of tumors.
Proc Natl Acad Sci USA 72: 3666-3670
Ceydeli, A., Condon, M.R., Siegel J.H. (2003) The septic abscess wall: a
cytokine-generating organ associated with portal venous cytokinemia,
hepatic outflow fibrosis, sinusoidal congestion, inflammatory cell
sequestration, hepatocellular lipid deposition, and focal cell death. Shock 20:
74-84
Chilton, F.H., Averill, F.J., Hubbard, W.C., Fonteh, A.N., Triggiani, M.,
Liu, M.C. (1996) Antigen-induced generation of lyso-phospholipids in
human airways. J Exp Med 183: 2235-2245
Ciegler, A., Fennell, D.J., Mintzlaff, H.J., Leistner, L. (1972) Ochratoxin
synthesis by Penicillium species. Naturwissenschaften 59: 365-366
Conway, J.G., Andrews, R.C., Beaudet, B., Bickett, D.M., Boncek, V.,
Brodie, T.A., Clark, R.L., Crumrine, R.C., Leenitzer, M.A., McDougald,
D.L., Han, B., Hedeen, K., Lin, P., Milla, M., Moss, M., Pink, H.,
Rabinowitz, M.H., Tippin, T., Scates, P.W., Selph, J., Stimpson, S.A.,
Warner, J., Becherer, J.D. (2001) Inhibition of tumor necrosis factor-alpha

References
131
(TNF-α) production and arthritis in the rat by GW3333, a dual inhibitor of
TNF-alpha-converting enzyme and matrix metalloproteinases. J Pharmacol
Exp Ther 298: 900-908
Conway, J.P., Popp, J.A., Thurman, R.G. (1983) The effect of size on the
portal circulation of hepatic nodules from carcinogen treated rats. Cancer
Res 43: 3374-3379
Cozzi, A., Levi, S., Corsi, B., Santambrogio, P., Campanella, A.,
Gerardi, G., Arosio, P. (2003) Role of iron and ferritin in TNFalpha-
induced apoptosis in HeLa cells. FEBS Lett 537: 187-192
Creppy, E.E., Kane, A., Dirheimer, G., Lafarge-Frayssinet, C., Mousset,
S., Frayssinet, C. (1985) Genotoxicity of ochratoxin A in mice: DNA
single-strand break evaluation in spleen, liver and kidney. Toxicol Lett 28:
29-35
Creppy, E.E., Lugnier, A.A.J., Fasolo, F., Heller, K., Röschenthaler, R.,
Dirheimer, G. (1979) In vitro inhibition of yeast phenylalanyl–tRNA
synthetase by ochratoxin A. Chemo Biol Interact 24: 257-262
Creppy, E.E., Röschenthaler, R., Dirheimer, G. (1984) Inhibition of
protein synthesis in mice by ochratoxin A and its prevention by
phenylalanine. Food Chem Toxicol 22: 883-886
Creppy, E.E., Størmer, F.C., Kern, D., Röschenthaler, R., Dirheimer, G.
(1983) Effect of ochratoxin A metabolites on yeast phenylalanyl–tRNA

References
132
synthetase and on the growth and in vivo protein synthesis of hepatoma cells.
Chemo Biol Interact 47: 239-247
Csiszar, A., Ungvari Z. (2004) Synergistic effects of vascular IL-17 and
TNF-α may promote coronary artery disease. Med Hypotheses 63: 696-698
Csiszar, A., Ungvari, Z., Koller, A., Edwards, J.G., Kaley, G. (2004)
Proinflammatory phenotype of coronary arteries promotes endothelial
apoptosis in aging. Physiol Genomics 17: 21-30
Dayer, J.M, Beutler, B., Cerami, A. (1985) Cachectin/tumor necrosis
factor stimulates collagenase and prostaglandin E2 production by human
synovial cells and dermal fibroblasts. J Exp Med 162: 2163-2168
Debonera, F., Krasinkas, A.M., Gelman, A.E., Aldeguer, X., Que, X.,
Shaked, A., Olthoff, K.M. (2003) Dexamethasone inhibits early
regenerative response of rat liver after cold preservation and transplantation.
Hepatol 38: 1563-1572
Deng, M., Zhao, J.Y., Ju, X.D., Tu, P.F., Jiang, Y., Li, Z.B. (2004)
Protective effect of tubuloside B on TNF-α-induced apoptosis in neuronal
cells. Acta Pharmacol Sin 25: 1276-1284
Denk, A., Goebelers, M., Schmid, S., Berbrich, I., Ritz, O., Lindemann,
D., Ludwig, S., Wirth, T. (2001) Activation of NF-kB via the IkB kinase
complex is both essential and sufficient for proinflammatory gene expression
in primary endothelial cells. J Biol Chem 276: 28451-28458

References
133
Dhuley, J.N. (1997) Effect of some Indian herbs on macrophage functions in
ochratoxin A treated mice. J Ethnopharmacol 58: 15-20
Dibbs, Z., Kurrelmeyer, K., Kalra, D., Seta, Y., Wang, F., Bozkurt, B.,
Baumgarten, G., Sivasubramanian, N., Mann, D.L. (1999) Cytokines in
heart failure: pathogenetic mechanisms and potential treatment. Proc Assoc
Am Physicians 111: 423-428
Dickenson, J.M., Reeder, S., Rees, B., Alexander, S., Kendall, D. (2003)
Functional expression of adenosine A2A and A3 receptors in the mouse
dendritic cell line XS-106. Eur J Pharmacol 474: 43-51
Diehl, A.M. (1999) Cytokine regulation of liver regeneration. In: Normal
and Malignant Liver Cell Growth, WE Fleig (ed)., Kluwer Academic
Publisher, Lancaster Pp 47-55
Ding, M., Chen, F., Shi, X., Yucesoy, B., Mossman, B., Vallyathan, V.
(2002) Diseases caused by silica: mechanisms of injury and disease
development. Int Immunopharmacol 2: 173-182
Dirheimer, G., Creppy, E.E. (1991) Mechanism of action of ochratoxin A.
IARC Sci Publ 115: 171-186
Djerbi, M., Abdul-Majid, K.B., Abedi-Valugerdi, M., Olsson, T., Harris.
R.A., Grandien, A. (2003) Expression of the long form of human FLIP by

References
134
retroviral gene transfer of hemopoietic stem cells exacerbates experimental
autoimmune encephalomyelitis. J Immunol 170: 2064-2073
Domijan, A.M., Peraica, M., Ferencic, Z., Cuzic, S., Fuchs, R., Lucic, A.,
Radic, B. (2004) Ochratoxin A-induced apoptosis in rat kidney tissue. Arh
Hig Rada Toksikol 55: 243-248
Dooper, M.M., Wassink, L., M'Rabet, L., Graus, Y.M. (2002) The
modulatory effects of prostaglandin-E on cytokine production by human
peripheral blood mononuclear cells are independent of the prostaglandin
subtype. Immunol 107: 152-159
Dörrenhaus, A., Föllmann, W. (1997) Effects of ochratoxin A on DNA
repair in cultures of rat hepatocytes and porcine urinary bladder epithelial
cells. Arch Toxicol 71: 709-713
Dortant, P.M., Peters-Volleberg, G.W.M., Van Loveren, H., Marquardt
R.R. (2001) Age-related differences in toxicity of ochratoxin A in female
rats. Food Chem Toxicol 39: 55-65
Dubois, C.M., Bissonnette, E., Rola-Pleszczynski, M. (1989) Asbestos
fibers and silica particles stimulate rat alveolar macrophages to release tumor
necrosis factor. Autoregulatory role of leukotriene B4. Am Rev Respir Dis
139: 1257-1264

References
135
Eigler, A., Matschke, V., Hartmann, G., Erhardt, S., Boyle, D., Firestein,
G.S., Endres, S. (2000) Suppression of TNF-α production in human
mononuclear cells by an adenosine kinase inhibitor. J Leuk Biol 68: 97-103
Endres, S., Fulle, B., Sinha, B., Stoll, D., Dinarello, C.A., Gerzer, P.,
Weber, C. (1991) Cyclic nucleotides differentially regulate the synthesis of
tumor necrosis factor α and interleukin-1β by human mononucelear cells.
Immunol 72: 56-60
Eyhorn, S., Schlayer, H.J., Henninger, H.P., Dieter, P., Hermann, R.,
Woort-Menker, M., Becker, H., Schaefer, H.E., Decker, K. (1988) Rat
hepatic siniusiodal endothelial cells in monolayer culture. Biochemical and
ultrastructural characteristics. J Hepatol 6: 23-35
Fantuzzi, G., Cantoni, L., Sironi, M., Ghezzi, P. (1993) Inhibitors of
cytochrome P450 suppress tumor necrosis factor production. Cell Immunol
150:417-24
Faucet, V., Pfohl-Leszkowicz, A., Dai, J., Castegnaro, M., Manderville,
R.A. (2004) Evidence for covalent DNA adduction by ochratoxin A
following chronic exposure to rat and subacute exposure to pig. Chem Res
Toxicol 17: 1289-1296
Ferrante, J.V., Ferrante, A. (2005) Novel role of lipoxygenases in the
inflammatory response:.promotion of TNF mRNA decay by 15
hydroperoxyeicosatetraenoic acid in a monocytic cell line. J Immunol 174:
3169-3172
References
136
Fuchs, R., Radic, B., Peraica, M., Hult, K., Plestina, R. (1988)
Enterohepatic circulation of ochratoxin A in rats. Period Biol 90: 39-42
Gagnon, L., Filion, L.G., Dubois, C., Rola-Pleszczynski, M. (1989)
Leukotrienes and macrophage activation: augmented cytotoxic activity and
enhanced interleukin 1, tumor necrosis factor and hydrogen peroxide
production. Agents Actions 26: 141-147
Galtier, P., Charpenteau, J.L., Alvinerie, M., Labouche, C. (1979) The
pharmacokinetic profile of ochratoxin A in the rat after oral and intravenous
administration. Drug Metabo Dispos 7: 429-434
Gareis, M., Scheuer, R. (2000) Ochratoxin A in meat and meat products.
Arch Lebensmittelhyg 51: 102-104
Gekle, M., Schwerdt, G., Freudinger, R., Mildenberger, S.,
Wilflingseder, D., Pollack, V., Dander, M., Schramek, H. (2000)
Ochratoxin A induces JNK activiation and apoptosis in MDCK-C7 cells at
nanomolar concentrations. J Pharmacol Exp Ther 293: 837-844
Goeddel, D.V., Aggarwal, B.B., Gray, P.W., et al. (1986) Tumor necrosis
factors: gene structure and biological activities. Cold Spring Harb Symp
Quant Biol 51: 597-609
Granata, F., Petraroli, A., Boilard, E., Bezzine, S., Bollinger, J., Del
Vecchio, L., Gelb, M.H., Lambeau, G., Marone, G., Triggiani, M. (2005)

References
137
Activation of cytokine production by secreted phospholipase A2 in human
lung macrophages expressing the M-type receptor. J Immunol 174: 464-474
Griswold, D.E., Hillegass, L.M., Breton, J.J., Esser, K.M., Adams, J.L.
(1993) Differentiation in vivo of classical non-steroidal antiinflammatory
drugs from cytokine suppressive antiinflammatory drugs and other
pharmacological classes using mouse tumour necrosis factor-α production.
Drugs Exp Clin Res 19: 243-248
Guillouzo, A. (1998) Liver cell models in in vitro toxicology. Environ
Health Perspect 106: 511-532
Gupta, S. (2002) Tumor necrosis factor-α-induced apoptosis in T cells from
aged humans: a role of TNFR-I and downsteam signaling molecules. Exp
Gerontol 37: 293-299
Guthmann, F., Wissel, H., Schachtrup, C., Tolle, A., Rudiger, M.,
Spener, F., Rustow, B. (2005) Inhibition of TNF-α in vivo prevents
hyperoxia-mediated activation of caspase 3 in type II cells. Respir Res 6: 10
Gutierrez-Ruiz, M.C., Quiroz, S.C., Souza, V., Bucio, L., Hernandez, E.,
Olivares, I.P., Llorente, L., Vargas-Vorackova, F., Kershenobich, D.
(1999) Cytokines, growth factors, and oxidative stress in HepG2 cells treated
with ethanol, acetaldehyde, and LPS. Toxicol 134: 197-207

References
138
Haapamaki, M.M., Gronroos, J.M., Nurmi, H., Irjala, K., Alanen, K.A.,
Nevalainen, T.J. (1999) Phospholipase A2 in serum and colonic mucosa in
ulcerative colitis. Scand J Clin Lab Invest 59: 279-287
Haapamaki, M.M., Gronroos, J.M., Nurmi, H., Irjala, K., Soderlund,
K., Peuravuori, H., Alanen, K.A., Nevalainen, T.J. (1998) Elevated group
II phospholipase A2 mass concentration in serum and colonic mucosa in
Crohn’s disease. Clin Chem Lab Med 36:751-755
Hartmann, G., Bidlingmaier, C., Siegmund, B., Albrich, S., Schulze, J.,
Tschoep, K., Eigler, A., Lehr, H.A., Endres, S. (2000) Specific type IV
phosphodiesterase inhibitor rolipram mitigates experimental colitis in mice.
J Pharmacol Exp Ther 292: 22-30
Harvey, R.B., Elissalde, M.H., Kubena, L.F., Weaver, E.A., Corrier,
D.E., Clement, B.A. (1992) Immunotoxicity of ochratoxin A to growing
gilts. Am J Vet Res 53: 1966-1970
Hashizume, K., Takahashi, T., Shimizu, M., Todoroki, J., Shimada, A.,
Hirata, M., Sato, T., Ito, A. (2003) Matrix-metalloproteinases-2 and -9
production in bovine endometrial cell culture. J Reprod Dev 49: 45-53
Hasmall, S.C., West, D.A., Olsen, K., Roberts, R.A. (2000) Role of
hepatic non-parenchymal cells in the response of rat hepatocytes to the
peroxisome proliferator nafenopin in vitro. Carcinogenesis 21: 2159-2165

References
139
Hayakawa, M., Ishida, N., Takeuchi, K., Shibamoto, S., Hori, T., Oku,
N., Ito, F., Tsujimoto, M. (1993) Arachidonic acid-selective cytosolic
phospholipase A2 is crucial in the cytotoxic action of tumor necrosis factor. J
Biol Chem 268: 11290-11295
Hayakawa, M., Oku, N., Takagi, T., Hori, T., Shibamoto, S., Yamanaka,
Y., Takeuchi, K., Tsujimoto, M., Ito, F. (1991) Involvement of
prostaglandin-producing pathway in the cytotoxic action of tumor necrosis
factor. Cell Struct Funct 16: 333-340
He, Q., Riley, R.T., Sharma, R.P. (2002) Pharmacological antagonism of
fumonisin B1 cytotoxicity in porcine renal epithelial cells (LLC-PK1): a
model for reducing fumonisin-induced nephrotoxicity in vivo. Pharmacol
Toxicol 90: 268-277
Heller, M., Rosner, H., Burkert, B., Moller, U., Hinsching, A.,
Rohrmann, B., Thierbach, S., Kohler, H. (2002) In vitro studies into the
influence of ochratoxin A on the production of tumor necrosis factor-α by
the human monocytic cell line THP-1. Deutsche Tierärztliche Wochenschrift
109: 200-205
Henderson, B., Black, S. (1992) Therapeutic potential of cytokine
manipulation. Trends Pharm Sci 13: 145-153
Hirano, F., Kobayashi, A., Makino, I. (2003) Inhibition of TNF--induced
RANTES expression in human hepatocyte-derived cells by fibrates, the
hypolipidemic drugs. Int Immunopharmacol 3: 225-232
References
140
Hirunpetcharat, C., Finkelman, F., Clark, I.A., Good, M.F. (1999)
Malaria parasite-specific Th1-like T cells simultaneously reduce parasitemia
and promote disease. Parasite Immunol 21: 319-329
Hoek, J.B., Pastorino, J.G. (2002) Ethanol, oxidative stress, and cytokine-
induced liver cell injury. Alcohol 27: 63-68
Holtzmann, M.J. (1992) Arachidonic acid metabolism in airway epithelial
cells. Annu Rev Physiol 54: 303
Hong, S.H., Seo, S.H., Lee, J.H., Choi, B.T.(2004) The aqueous extract
from Artemisia capillaris Thunb. inhibits lipopolysaccharide-induced
inflammatory response through preventing NF-kappaB activation in human
hepatoma cell line and rat liver. Int J Mol Med 13:717-720
Huff, W.E., Doerr, J.A., Wabeck, C.J., Chaloupka, G.W., May, J.D.,
Merkley, J.W. (1984) The individual and combined effects of aflatoxin and
ochratoxin A on various processing parameters of broiler chickens. Poult Sci
63: 2153-2161
Hult, K., Plestina, R., Habazin-Novak, V., Radic, B., Ceovic, S. (1982)
Ochratoxin A in human blood and Balkan endemic nephropathy. Arch
Toxicol 51: 313-321
Hunt, J.S., Chen, H.L., Hu, X.L., Chen, T.Y., Morrison, D.C. (1992)
Tumor necrosis factor-alpha gene expression in the tissues of normal mice.
Cytokine 4: 340-346

References
141
Huttunen, K., Pelkonen, J., Nielsen, K.F., Nuutinen, U., Jussila, J.,
Hirvonen, M.R. (2004) Synergistic interaction in simultaneous exposure to
Streptomyces californicus and Stachybotrys chartarum. Environ Health
Perspect 112: 659-665
IARC (1983) Ochratoxin A. In: IARC Monographs on the Evaluation of
Carcinogenic Risks to Humans, Some Food Additives, Feed Aditives and
Naturally Occurring Substances, Lyon: France: IARC, Vol. 31.pp. 191-206
IARC (1993) Ochratoxin A. In: IARC Monographs on the Evaluation of
Carcinogenic Risks to Humans, Some Naturally Occurring Substances: Food
Items and Constituents, Hetrocyclic Aromatic Amines and Mycotoxins. Vol.
56, Lyon: IARC, pp. 489-521
Iimuro, Y., Yamamoto, M., Kohno, H., Itakura, J., Fujii, H.,
Matsumoto, Y. (1994). Blockade of liver macrophages by gadolinium
chloride reduces lethality in endotoxaemic rats-Analysis of mechanism of
lethality in endotoxaemia. J Leukoc Biol 55: 723-728
Irie, K., Fujii, E., Ishida, H., Wada, K., Suganuma, T., Nishikori, T.,
Yoshioka, T., Muraki, T. (2001) Br Inhibitory effects of cyclic AMP
elevating agents on lipopolysaccharide (LPS)-induced microvascular
permeability change in mouse skin. J Pharmacol 133: 237-242
Iwasaki, Y., Asai, M., Yoshida, M., Nigawara, T., Kambayashi, M.,
Nakashima, N. (2004) Dehydroepiandrosterone-sulfate inhibits nuclear
References
142
factor-kappaB-dependent transcription in hepatocytes, possibly through
antioxidant effect. J Clin Endocrinol Metab 89: 3449-3454
Jacobson, K.A., van Galen, P.J., Williams, M. (1992) Adenosine
receptors: pharmacology, structure-activity relationships, and therapeutic
potential. J Med Chem 35: 407-422
Joint FAO/WHO (1991). Evaluation of certain food additives and
contaminants. Thirty-seventh report. WHO Technical Report Series No. 806,
p. 29-31
Joint FAO/WHO (1995). Evaluation of certain food additives and
contaminants. Forty-fourth report. WHO Technical Report Series No. 859, p.
35-36
Joint FAO/WHO (2001). Safety evaluation of certain mycotoxins in food.
Prepared by the 56th Meeting of the Joint FAO/WHO Expert Committee on
Food Additives (JECFA). WHO Food Additives SeriesL:46. Ochratoxin A.
World Health Organization, Geneva, 2001. International Programme on
Food Safety. pp. 281-415
Jiang, J.G., Chen, C.L., Card, J.W., Yang, S., Chen, J.X., Fu, X.N.,
Ning, Y.G., Xiao, X., Zeldin, D.C., Wang, D.W. (2005) Cytochrome P450
2J2 promotes the neoplastic phenotype of carcinoma cells and is up-
regulated in human tumors. Cancer Res 65: 4707-4715
References
143
Jiménez, A.M., Lopez de Cerain, A., Gonzales-Peñaz, E., Bello, J. (1999)
A high-performance liquid-chromatographic method for the determination of
ochratoxin A in human plasma. Chromatographia 50: 457-460
Kanisawa, M. (1984) Synergistic effect of citrinin on hepatorenal
carcinogenesis of OA in mice. In: Kurata, H. & Ueno, Y., eds, Toxigenic
Fungi-Their Toxins and Health Hazard, Tokyo: Kodansha and Amsterdam:
Elsevier, pp. 245-254
Kanisawa, M., Suzuki, S. (1978) Induction of renal and hepatic tumors in
mice by ochratoxin A; a mycotoxin. Gann 69: 599-600
Kanisawa, M., Suzuki, S., Kozuka, Y., Yamazaki, M. (1977)
Histopathological studies on the toxicity of ochratoxin A in rats 1. Acute oral
toxicity. Toxicol Appl Pharmacol 41: 55-64
Kassis, S., Prabhakar, U., Lee, J.C. (1993) Inhibition of interleukin-1 (IL-
1) and tumor necrosis factor (TNF) production by pyridinyl imidazole
compounds is independent of cAMP elevating mechanisms. Agents Actions
39: C64-C66
Khetani, S.R., Szulgit, G., Del Rio, J.A., Barlow, C., Bhatia, S.N. (2004)
Exploring interactions between rat hepatocytes and nonparenchymal cells
using gene expression profiling. Hepatol 40: 545-554
Kim, D.K., Fukuda, T., Thompson, B.T., Cockrill, B., Hales, C.,
Bonventre, J.V. (1995) Bronchoalveolar lavage fluid phospholipase A2

References
144
activities are increased in human adult respiratory distress syndrome. Am J
Physiol 269: L109-L118
Kim, H., Seo, J.Y., Kim, K.H. (2000) NF-kappaB and cytokines in
pancreatic acinar cells. J Korean Med Sci 15: S53-S54
Kim, S.G., Choi, S.H. (1997) Gadolinium chloride inhibition of rat hepatic
microsomal epoxide hydrolase and glutathione S-transferase gene
expression. Drug Metab Dispos 25: 1416-1423
Kitchen, D.N., Carlton, W.W., Tuite, J. (1977) Ochratoxin A and citrinin-
induced nephrosis in beagle dogs. II. Pathology. Vet Pathol 14: 261-272
Klein, A., Zhadkewich, M., Margolick, J., Winkelstein, J., Bulkley, G.
(1994) Quantitative discrimination of hepatic reticuloendothelial clearance
and phagocytic killing. J Leukoc Biol 55: 248-252
Kmiec, K. (2001) Cooperation of liver cells in health and disease. Adv Anat
Embryol Cell Biol 161: 1-151
Knolle, P.A., Gerken, G. (2000) Local control of the immune response in
the liver. Immunol Rev 174: 21-34
Kohno, T., Brewer, M.T., Baker, S.L., Schwartz, P.E., King, M.W.,
Hale, K.K., Squires, C.H., Thompson, R.C., Vannice, J.L. (1990) Second
tumor necrosis factor receptor gene product can shed a naturally occurring
tumor necrosis factor inhibitor. Proc Natl Acad Sci USA 87: 8331-8335

References
145
Konrad, I., Röschenthaler, R. (1977) Inhibition of phenylalanine tRNA
synthetase from Bacillus subtilis by ochratoxin A. FEBS Lett 83: 341-347
Kontaxi, M., Echkardt, U., Hagenbuch, B., Stieger, B., Meier, P.J.,
Petzinger, E. (1996) Uptake of the mycotoxin ochratoxin A in liver cells
occurs via the cloned organic anion transporting polypeptide. J Pharmacol
Exp Ther 279: 1507-1513
Korten, S., Anderson, R.J., Hannan, C.M., Sheu, E.G., Sinden, R.,
Gadola, S., Taniguchi, M., Hill, A.V. (2005) Invariant Valpha14 chain
NKT cells promote Plasmodium berghei circumsporozoite protein-specific
gamma interferon- and tumor necrosis factor alpha-producing CD8+ T cells
in the liver after poxvirus vaccination of mice. Infect Immun 73: 849-858
Krogh, P., Hald, B., Pedersen, E.J. (1973) Occurrence of ochratoxin A and
citrinin in cereals associated with mycotoxic porcine nephropathy. Acta
Pathol Microbiol Scand Sect. B, 81: 689-695
Kuiper-Goodman, T. (1990) Uncertainties in the risk assessment of three
mycotoxins: aflatoxin, ochratoxin and zearalenone. Can J Physiol
Pharmacol 68: 1017-1024
Kuiper-Goodman, T. (1991) Risk assessment of ochratoxin A residues in
food. IARC Sci Publ 115: 307-320

References
146
Kuiper-Goodman, T. (1996) Risk assessment of ochratoxin A: an update.
Food Addit Contam 13: 53-57
Kuiper-Goodman, T., Scott, P.M. (1989) Risk assessment of the
mycotoxin ochratoxin A. Biomed Environ Sci 2: 179-248
Kushimoto, S., Okajima, K., Uchiba, M., Murakami, K., Harada, N.,
Okabe, H., Takatsuki, K. (1996) Role of granulocyte elastase in
ischemia/reperfusion injury of rat liver. Crit Care Med 24: 1908-1912
Kutuk, O., Basaga, H. (2004) Aspirin inhibits TNF-α and IL-1-induced NF-
kappaB activation and sensitizes HeLa cells to apoptosis. Cytokine 25: 229-
237
Lantz, M., Gullberg, U., Nilsson, E., Olsson, I. (1990) Characterization in
vitro of a human tumor necrosis factor-binding protein. A soluble form of a
tumor necrosis factor receptor. J Clin Inv 86: 1396-1402
Lappin, D., Whaley, K. (1984) Adenosine A2 receptors on human
monocytes modulate C2 production. Clin Exp Immunol 57: 454-460
Larsen, S. (1928) On chronic degeneration of the kidneys caused by mouldy
rye. Maanadsskr Dyrl 40: 259-284, 289-300
Laskin, D.L. (1990) Nonparenchymal cells and hepatotoxicity. Semin Liver
Dis 10: 293-304
References
147
Lazar, G. (1973) The reticuloendothelial-blocking effect of rare earth metals
in rats. J Reticuloendothel Soc 13: 231-237
Lazar, G.Jr., Lazar, G., Kaszaki, J. Olah, J., Kiss, I., Husztik, E. (1994).
Inhibition of anaphylactic shock by gadolinium chloride-induced Kupffer
cell blockade. Agents Actions 41: C97-C98
Lazar, G.Jr., Lazar, G., Olah, J., Husztik, E., Duda, E. (1995) Effect of
kupffer cell phagocytosis blockade induced by gadolinium chloride and
carrageenan on endotoxin sensitivity. Tissue localization of endotoxin and
TNF production. J Alloys Comp 225: 623-625
Lea, T., Steien, K., Stormer, F.C. (1989) Mechanism of ochratoxin A-
induced immunosuppression. Mycopathologia 107: 153-159
Lee, C.M., Yeoh, G.C., Olynk J.K. (2004) Differential effects of
gadolinium chloride on Kupffer cells in vivo and in vitro. Int J Biochem Cell
Biol 36: 481-488
Lee, J.C., Prabhakar, U., Griswold, D.E., Dunnington, D., Young, P.R.,
Badger, A. (1995) Low-Molecular-Weight TNF-α biosynthesis inhibitors:
Strategies and prospectives. Circul Shock 44: 97-103
Leng, A., Mura, A., Feldon, J., Ferger, B. (2005) Tumor necrosis factor-α
receptor ablation in a chronic MPTP mouse model of Parkinson's disease.
Neurosci Lett 375: 107-111
References
148
Lewis, C.E., McGee, J. (1992) The Macrophage IRL Press, Oxford.
Lin, H.I., Chu, S.J., Wang, D., Feng, N.H. (2004) Pharmacological
modulation of TNF production in macrophages. J Microbiol Immunol Infect
37: 8-15
Lioi, M.B., Santoro, A., Barbieri, R., Saizano, S., Ursini, M.V. (2004)
Ochratoxin A and Zearalenone: a comparative study on genotoxic effects
and cell death induced in bovine lymphocytes. Mutat Res 557: 19-27
Liu, S.J., McHowat, J. (1998) Stimulation of different phospholipase A2
isoforms by TNF-α and IL-1β in adult rat ventricular myocytes. Am J
Physiol Heart Circ Physiol 275: H1462-H1472
Liz-Grana, M., Gomez-Reino Carnota, J.J. (2001) Tumour Necrosis
Factor. Genetics, cell action mechanism and involvement in inflammation.
Allergol Inmunol Clin 16: 140-149
Loetscher, H.Y., Pan, C.E., Lahm, H.W., Brockhaus, M., Tabuchi, H.,
Lesslauer, W. (1990) Molecular cloning and expression of the human 55kd
tumor necrosis factor receptor. Cell 61: 351-359
Maeda, K., Hirano, T., Ichimiya, I., Kurono, Y., Suzuki, M., Mogi, G.
(2004) Cytokine expression in experimental chronic otitis media with
effusion in mice. Laryngoscope 114: 1967-1972

References
149
Maier, L., Martyny, J., Mroz, M., McGrath, D., Lympany, P., duBois,
R., Zhang, L., Murphy, J., Newman, L.S. (2002) Genetic and
environmental risk factors in beryllium sensitization and chronic beryllium
disease. Chest 121: 81S
Maier, L.A. (2002) Genetic and exposure risks for chronic beryllium
disease. Clin Chest Med 23: 827-839
Mally, A., Pepe, G., Ravoori, S., Fiore, M., Gupta, R.C., Dekant, W.,
Mosesso, P. (2005) Ochratoxin A causes DNA damage and cytogenetic
effects but no DNA adducts in rats. Chem Res Toxicol 18: 1253-1261
Marin, M.L., Murtha, J., Dong, W., Pestka, J.J. (1996) Effects of
mycotoxins on cytokine production and proliferation in EL-4 thymoma cells.
J Toxicol Environ Health 48: 379-396
Marshall, A.J., Brunet, L.R., van Gessel, Y., Alcaraz, A., Bliss, S.K.,
Pearce, E.J., Denkers, E.Y. (1999) Toxoplasma gondii and Schistosoma
mansoni synergize to promote hepatocyte dysfunction associated with high
levels of plasma TNF-α and early death in C57BL/6 mice. J Immunol 163:
2089-2097
Martin-Chouly, C.A., Astier, A., Jacob, C., Pruniaux, M.P., Bertrand,
C., Lagente, V. (2004) Modulation of matrix metalloproteinase production
from human lung fibroblasts by type 4 phosphodiesterase inhibitors. Life Sci
75: 823-840
References
150
Mattoli, S., Mattoso, V. L., Solopertro, M., Allegra, L., Fasoli, A. (1991)
A. Cellular and biochemical characteristics of bronchoalveolar lavage fluid
in symptomatic non-allergic asthma. J Allergy Clin Immunol 87: 794-802
McClain, C.J., Song, Z., Barve, S.S., Hill, D.B., Deaciuc, I. (2004) Recent
advances in alcoholic liver disease. IV. Dysregulated cytokine metabolism in
alcoholic liver disease. Am J Physiol Gastrointest Liver Physiol 287: G497-
G502
Meijer, C., Wiezer, M.J., Diehl, A.M., Schouten, H.J., Schouten, H.J.,
Meijer, S., van Rooijen, N., van Lambalgen, A.A., Dijkstra, C. D., van
Leeuwen, P.A. (2000) Kupffer cell depletion by CI2MDP-liposomes alters
hepatic cytokine expression and delays liver regeneration after partial
hepatectomy. Liver 20: 66-77
Meisner, H., Cimbala, M.A., Hanson, R.W. (1983) Decrease of renal
phosphoenolpyruvate carboxykinase RNA and poly (A) RNA level by
ochratoxin A. Arch Biochem Biophys 223: 264-270
Mezosi, E., Wang, S.H., Utsugi, S., Bajnok, L., Bretz, J.D., Gauger, P.G.,
Thompson, N.W., Baker, J.R. Jr. (2005) Induction and regulation of Fas-
mediated apoptosis in human thyroid epithelial cells. Mol Endocrinol 19:
804-811
Milosevic, N., Schawalder, H., Maier, P. (1999) Kupffer cell-mediated
differential down-regulation of cytochrome P450 metabolism in rat
hepatocytes. Eur J Pharmacol 368: 75-87

References
151
Misasi, R., Garofalo, T., Di Marzio, L., Mattei, V., Gizzi, C., Hiraiwa,
M., Pavan, A., Grazia Cifone, M., Sorice, M. (2004) Prosaposin: a new
player in cell death prevention of U937 monocytic cells. Exp Cell Res 298:
38-47
Mitchell, S.A., Grove, J., Spurkland. A., Boberg, K.M., Fleming, K.A.,
Day, C.P., Schrumpf, E., Chapman, R.W. (2001) European Study Group
of Primary Sclerosing Cholangitis. Association of the tumour necrosis factor
alpha -308 but not the interleukin 10 -627 promoter polymorphism with
genetic susceptibility to primary sclerosing cholangitis. Gut 49: 288-294
Mohan, P.V., Tarnow-Mordi, W., Stenson, B., Brocklehurst, P., Haque,
K., Cavendish, V., Cust, A. (2004) Can polyclonal intravenous
immunoglobulin limit cytokine mediated cerebral damage and chronic lung
disease in preterm infants?. Arch Dis Child Fetal Neonatal Ed 89: F5-F8
Mohler, K.M., Sleath, P.R., Fitzner, J.N., Cerretti, D.P., Alderson, M.,
Kerwar, S.S., Torrance, D.S., Otten-Evans, C., Greenstreet, T.,
Weerawarna, K., et al. (1994) Protection against a lethal dose of endotoxin
by an inhibitor of tumour necrosis factor processing. Nature 370: 218-220
Montes-Rodriguez, C.J., Alavez, S., Elder, J.H., Haro, R., Moran, J.,
Prospero-Garcia, O. (2004) Prolonged waking reduces human
immunodeficiency virus glycoprotein 120- or tumor necrosis factor alpha-
induced apoptosis in the cerebral cortex of rats. Neurosci Lett 360: 133-136

References
152
Murakami, K., Kobayashi, F., Ikegawa, R., Koyama, M., Shintani, N.,
Yoshida, T., Nakamura, N., Kondo, T. (1998) Metalloproteinase inhibitor
prevents hepatic injury in endotoxemic mice. Eur J Pharmacol 341: 105-110
Murakami, M., Kudo, I. (2002) Phospholipase A2. J Biochem 131: 285-292
Naessens, J., Kitani, H., Nakamura, Y., Yagi, Y., Sekikawa, K., Iraqi, F.
(2005) TNF-α mediates the development of anaemia in a murine
Trypanosoma brucei rhodesiense infection, but not the anaemia associated
with a murine Trypanosoma congolense infection. Clin Exp Immunol 139:
405-410
Nagashima, H., Nakamura, K., Goto, T. (2001) Hepatotoxin rubratoxin B
induced the secretion of TNF-α, IL-8, and MCP-1 in HL60 cells. Biochem
Biophys Res Commun 287: 829-832
Nakayama, N., Eichhorst, S.T., Muller, M., Krammer, P.H. (2001)
Ethanol-induced apoptosis in hepatoma cells proceeds via intracellular Ca2+
elevation, activation of TLCK-sensitive proteases, and cytochrome c release.
Exp Cell Res 269: 202-213
Natarajan, K., Singh, S., Burke, T.R.J.R., Grunberger, D., Aggrwal,
B.B. (1996) Caffeic acid phenethyl ester is a potent and specific inhibitor of
activation of nuclear transcription factor NF-kB. Proc Natl Acad Sci USA
93: 9090-9095

References
153
Neuman, M.G., Shear, N.H., Bellentani, S., Tiribelli, C. (1998) Role of
cytokines in ethanol-induced cytotoxicity in vitro in HepG2 cells.
Gastroenterology 115: 157-166
NNT (1991) Nordiske Seminar- og Arbejdsrapporter 1991:545. Nordic
Council of Ministers, Copenhagen
Nophar, Y., Kemper, O., Brakebusch, C., Englemann, H., Zwang, R.,
Aderka, D., Holtmann, H., Wallach, D. (1990) Soluble forms of tumor
necrosis factor receptors (TNF-Rs). The cDNA for the type I TNF-R, cloned
using amino acid sequence data of its soluble form, encodes both the cell
surface and a soluble form of the receptor. EMBO J 9: 3269-3278
Nozell, S., Ma, Z., Wilson, C., Shah, R., Benveniste, E.N. (2004) Class II
major histocompatibility complex transactivator (CIITA) inhibits matrix
metalloproteinase-9 gene expression. J Biol Chem 279: 38577-38589
Nyhlen, K., Gautam, C., Andersson, R., Srinivas, U. (2004) Modulation
of cytokine-induced production of IL-8 in vitro by interferons and
glucocorticosteroids. Inflammation 28: 77-88
Ochalski, S.J., Hartman, D.A., Belfest, T.M., Walter, T.L., Glaser, K.B.,
Carlson, R.P. (1993) Inhibition of endotoxin-induced hypothermia and
serum TNF-α levels in CD-1 mice by various pharmacological agents.
Agents Action 39: C52-C54

References
154
Okazaki, M., Matsuyama, T., Kohno, T., Shindo, H., Koji, T.,
Morimoto, Y., Ishimaru, T. (2005) Induction of epithelial cell apoptosis in
the uterus by a mouse uterine ischemia-reperfusion model: possible
involvement of tumor necrosis factor-alpha. Biol Reprod 72: 1282-1288
Okutan, H., Aydin, G., Ozcelik, N. (2004) Protective role of melatonin in
ochratoxin a toxicity in rat heart and lung. J Appl Toxicol 24: 505-512
Pachman, L.M., Fedczyna, T.O., Lechman, T.S., Lutz, J. (2001) Juvenile
dermatomyositis: the association of the TNF-α-308A allele and disease
chronicity. Curr Rheumatol Rep 3: 379-386
Parmely, M.J., Zhou, W.W., Edwards, C.K. 3rd, Borcherding, D.R.,
Silverstein, R., Morrison, D.C. (1993) Adenosine and a related carbocyclic
nucleoside analogue selectively inhibit TNF-α production and protect mice
against endotoxin challenge. J Immunol 151: 389-396
Petrik, J., Zanic-Grubisic, T., Barisic, K., Pepeljnjak, S., Radic, B.,
Ferencic, Z., Cepelak, I. (2003) Apoptosis and oxidative stress induced by
ochratoxin A in rat kidney. Arch Toxicol 77: 685-693
Petzinger, E., Müller, N., Föllmann, W., Deutscher, J., Kinne, R.K.
(1989) Uptake of bumetanide into isolated rat hepatocytes and primary liver
cell cultures. Am J Physiol 256: G78-G86
Petzinger, E., Weidenbach, A. (2002) Mycotoxins in the food chain: The
role of ochratoxins. Livestock Prod Sci 76: 245-250

References
155
Pfohl-Leszkowicz, A., Grosse, Y., Kane, A., Creppy, E.E., Dirheimer, G.
(1993) Differential DNA adduct formation and disappearance in three mouse
tissues after treatment with the mycotoxin ochratoxin A. Mut Res 289: 265-
273
Pfohl-Leszkowicz, A., Petkova-Bocharova, T., Chernozemsky, I.N.,
Castegnaro, M. (2002) Balkan endemic nephropathy and associated urinary
tract tumours: a review on aetiological causes and the potential role of
mycotoxins. Food Addit Contam 19: 282-302
Piguet, P.F., Collart, M.A., Grau, G.E., Sappino, A.P., Vassalli, A.P.
(1990) Requirement of tumor necrosis factor for development of silica-
induced pulmonary fibrosis. Nature 344: 245-247
Pitt, J.I. (1987) Penicillium viridicatum, Penicillium verrucosum and
production of ochratoxin A. Appl Environ Microbiol 53: 266-269
Pitt, J.I., Hocking, A.D. (1997) Fungi and Food Spoilage, 2nd Ed.,
Gaitherburg, MD: Aspen Publishers
Plaa, G.L. (1993) Mécanismes des atteintes hépatiques d'origine chimique.
In: Foie isolé perfusé (Ballet F, Thurman RG, eds). Paris:Les Editions
INSERM and John Libbey, Eurotext, 1993;411-426

References
156
Prabhakar, U., Brooks, D.P., Lipshlitz, D., Esser, K.M. (1995) Inhibition
of LPS-induced TNF-α production in human monocyte by adenosine (A2)
receptor selective agonists. Int J Immunopharmacol 17: 221-224
Prabhakar, U., Lipshutz, D., Truneh, A. (1993) Inhibition of CD44, CD45
and LFA-3 mediated cytokine release from human monocytes by SK&F
86002 and pentoxifylline. Int J Immunopharmacol 15: 205-209
Pradeep, C.R., Kuttan, G. (2004) Piperine is a potent inhibitor of nuclear
factor-kappaB (NF-kappaB), c-Fos, CREB, ATF-2 and proinflammatory
cytokine gene expression in B16F-10 melanoma cells. Int Immunopharmacol
4: 1795-1803
Prichett, W., Hand, A., Sheilds, J., Dunnington, D. (1995) Mechanism of
action of bicyclic imidazoles defines a translational regulatory pathway for
tumor necrosis factor-α. J Inflamm 45: 97-105
Rai, R.M., Zhang, J.X., Clemens, M.G., Diehl, A.M. (1996) Gadolinium
chloride alters the acinar distribution of phagocytosis and balance between
pro- and anti-inflammatory cytokines. Shock 6: 243-247
Ramasamy, R. (1998) Molecular basis for evasion of host immunity and
pathogenesis in malaria. Biochim Biophys Acta 1406: 10-27
Ramirez, M., Fernandez-Troy, N., Buxade, M., Casaroli-Marano, R.P.,
Benitez, D., Perez-Maldonado, C., Espel, E. (1999) Wortmannin inhibits

References
157
translation of tumor necrosis factor-α in superantigen-activated T cells. Int
Immunol 11: 1479-1489
Reid, T., Ramesha, C.S., Ringold, G.M. (1991) Resistance to killing by
tumor necrosis factor in an adipocyte cell line caused by a defect in
arachidonic acid biosynthesis. J Biol Chem 266: 16580-16586
Remick, D. (1997) Cytokines in Health and Disease Marcel Dekker, New
York. P.678
Renz, H., Gong, J.H., Schmidt, A., Nain, M., Gemsa, D. (1988) Release of
tumor necrosis factors-α from macrophages enhancement and suppression
are dose-dependantly regulated by prostaglandin E2 and cyclic nucleotides. J
Immunol 141: 2388-2393
Renzulli, C., Galvano, F., Pierdomenico, L., Speroni, E., Guerra, M.C.
(2004) Effects of rosmarinic acid against aflatoxin B1 and ochratoxin-A-
induced cell damage in a human hepatoma cell line (HepG2). J Appl Toxicol
24: 289-296
Rodriguez, D.A., Moncada, C., Nunez, M.T., Lavandero, S., Ponnappa,
B.C., Israel, Y. (2004) Ethanol increases tumor necrosis factor-α receptor-1
(TNF-R1) levels in hepatic, intestinal, and cardiac cells. Alcohol 33: 9-15
Rosenthal, M.D., Vishwanath, B.S., Franson, R.C. (1992) Effects of
aristolochic acid on phospholipase A2 activity and arachidonate metabolism
of human neutrophils. Biochim Biophys Acta 26: 319-326
References
158
Sajjadi, F.G., Takabayashi, K., Foster, A.C., Domingo, R.C., Firestein,
G.S. (1996) Inhibition of TNF-α expression by adenosine: role of A3
adenosine receptors. J Immunol 156: 3435-3442
Sakurai, F., Terada, T., Yasuda, K., Yamashita, F., Takakura, Y.,
Hashida, M. (2002) The role of tissue macrophages in the induction of
proinflammatory cytokine production following intravenous injection of
lipoplexes. Gene Ther 9: 1120-1126
Santos, S.A., Andrade, D.R., Andrade Junior, D.R. (2005) Rat hepatocyte
invasion by Listeria monocytogenes and analysis of TNF-α role in apoptosis.
Rev Inst Med Trop Sao Paulo 47: 73-80
Sarphie, T.G., D’Souza, N.B., Deaciuc, I.V. (1996) Kupffer cell
inactivation prevents lipopolysaccharide-induced structural changes in the
rat liver sinusoid: An electron-microscopic study. Hepatol 23: 788-796
Schade, U.F., Burmeister, I., Engel, R., Reinke, M., Wolter, D.T. (1989)
Lipoxygenase inhibitors suppress formation of tumor necrosis factor in vitro
and in vivo. Lymphokine Res 3: 245-250
Schlosberg, A., Elkin, N., Malkinson, M., Orgad, U., Hanji, V., Bogin,
E., Weisman, Y., Meroz, M., Bock, R. (1997) Severe hepatopathy in geese
and broilers associated with ochratoxin in their feed. Mycopathologia 138:
71-76
References
159
Schmelz, K., Wieder, T., Tamm, I., Muller, A., Essmann, F., Geilen,
C.C., Schulze-Osthoff, K., Dorken, B., Daniel, P.T. (2004) Tumor necrosis
factor alpha sensitizes malignant cells to chemotherapeutic drugs via the
mitochondrial apoptosis pathway independently of caspase-8 and NF-kB.
Oncogene 23: 6743-6759
Schmid, B., Finnen, M.J., Harwood, J.L., Jackson, S.K. (2003) Acylation
of lysophosphatidylcholine plays a key role in the response of monocytes to
lipopolysaccharide. Eur J Biochem 270: 2782-2788
Schwerdt, G., Freudinger, R., Mildenberger, S., Silbernagl, S., Gekle,
M. (1999) The nephrotoxin ochratoxin A induces apoptosis in cultured
human proximal tubule cells. Cell Biol Toxicol 15: 405-415
Schwerdt, G., Freudinger, R., Schuster, C., Silbernagl, S., Gekle, M.
(2004) Inhibition of mitochondria and extracellular acidification enhance
achratoxin A-induced apoptosis in renal collecting duct-derived MDCK-C7
cells. Cell Physiol Biochem 14: 47-56
Scientific Committee for Food (1996) Opinion on aflatoxin, ochratoxin A
and patulin, expressed on 23rd September 1994. Reports of the Scientific
Committee for Food. 35th series. Luxembourg
Scott, D.B. (1965) Toxigenic fungi isolated from cereal and legume
products. Mycopathol Mycol Appl 14: 213-222

References
160
Scott, P.M., Lawrence, J.W., van Walbeek, W. (1970) Detection of
mycotoxins by thin-layer chromatography: Application to screening of
fungal extracts. Appl Microbiol 20: 839-842
Seckinger, P., Isaaz, S., Dayer, J.M. (1989) Purification and biologic
characterization of a specific tumor necrosis factor alpha inhibitor. J Biol
Chem 264: 11966-11973
Seegers, J.C., Bohmer, L.H., Kruger, M.C., Lottering, M.L., de Kock,
M. (1994) A comparative study of ochratoxin A-induced apoptosis in
hamster kidney and HeLa cells. Toxicol Appl Pharmacol 129: 1-11
Severn, A., Rapson, N.T., Hunter, C.A., Liew, F.Z. (1992) Regulation of
tumor necrosis factor production by adrenaline and beta adrenergic agonist. J
Immunol 148: 3441-3445
Shames, B.D., McIntyre, R.C.Jr., Bensard, D.D., Pulido, E.J., Selzman,
C.H., Reznikov, L.L., Harken, A.H., Meng, X. (2001) Suppression of
tumor necrosis factor alpha production by cAMP in human monocytes:
dissociation with mRNA level and independent of interleukin-10. J Surg Res
99: 187-193
Shi, R.X., Ong, C.N., Shen, H.M. (2004) Luteolin sensitizes tumor necrosis
factor-alpha-induced apoptosis in human tumor cells. Oncogene 23: 7712-
7721
References
161
Shoda, L.K., Kegerreis, K.A., Suarez, C.E., Roditi, I., Corral, R.S.,
Bertot, G.M., Norimine, J., Brown, W.C. (2001) DNA from protozoan
parasites Babesia bovis, Trypanosoma cruzi, and T. brucei is mitogenic for B
lymphocytes and stimulates macrophage expression of interleukin-12, tumor
necrosis factor alpha, and nitric oxide. Infect Immun 69: 2162-2171
Smith, C.A., Davis, T., Anderson, D., Solam, L., Beckmann, M.P., Jerzy,
R., Dower, S.K., Cosman, D., Goodwin, R.G. (1990) A receptor for tumor
necrosis factor defines an unusual family of cellular and viral proteins.
Science 248: 1019-1023
Smith, E.F.3rd., Slivjak, M.J., Bartus, J.O., Esser, K.M. (1991) SK&F
86002 inhibits tumor necrosis factor formation and improves survival in
endotoxemic rats. J Cardiovasc Pharmacol 18: 721-728
Smith, J.E., Moss, M.O. (1985) Mycotoxins: formation, Analysis, and
Significance. John Wiley and Sons, New York.
Solorzano, C.C., Ksontini, R., Pruitt, J.H., Auffenberg, T., Tannahill, C.,
Galardy, R.E., Schultz, G.P., MacKay, S.L., Copeland, E.M.3rd.,
Moldawer, L.L. (1997) A matrix metalloproteinase inhibitor prevents
processing of tumor necrosis factor alpha (TNF-α) and abrogates endotoxin-
induced lethality. Shock 7: 427-431
Song, Z., Zhou, Z., Uriarte, S., Wang, L., Kang, Y.J., Chen, T., Barve,
S., and McClain, C.J. (2004) S-adenosylhomocysteine sensitizes to TNF-α

References
162
hepatotoxicity in mice and liver cells: a possible etiological factor in
alcoholic liver disease. Hepatol 40: 989-997
Spinelle-Jaegle, S., Devillier, P., Doucet, S., Millet, S., Banissi, C., Diu-
Hercend, A., Ruuth, E. (2001) Inflammatory cytokine production in
interferon-gamma-primed mice, challenged with lipopolysaccharide.
Inhibition by SK&F 86002 and interleukin-1 beta-converting enzyme
inhibitor. Eur Cytokine Netw 12: 280-389
Stadel, J.M., Hoyle, K., Naclerio, R.M., Roshak, A., Chilton, F.H. (1994)
Characterization of phospholipase A2 from human nasal lavage. Am J Respir
Cell Mol Biol 11: 108-113
Stoev, S.D., Koynarsky, V., Mantle, P.G. (2002) Clinicomorphological
studies in chicks fed ochratoxin A while simultaneously developing
coccidiosis. Vet Res commun 26: 189-204
Strassmann, G., Patil-Koota, V., Finkelman, F., Fong, M., Kambayashi,
T. (1994) Evidence for the involvement of interleukin 10 in the differential
deactivation of murine peritoneal macrophages by prostaglandin E2. J Exp
Med 180: 2365-2370
Stuhlmeier, K.M., Kao, J.J., Bach, F.H. (1997) Arachidonic acid influnces
proinflammatory induction by stabilizing the inhibitory-kBα/ nuclear factor-
kB (NF-kB) complex, thus suppressing the nuclear translocation of NF-kB.
J Biol Chem 272: 24679-24683

References
163
Stuhlmeier, K.M., Tarn, C., Csizmadia, V., Bach, F.H. (1996) Selective
suppression of endothelial cell activation by arachidonic acid. Eur J
Immunol 26: 1417-1423
Taberner, M., Scott, K.F., Weininger, L., Mackay, C.R., Rolph, M.S.
(2005) Overlapping gene expression profiles in rheumatoid fibroblast-like
synoviocytes induced by the proinflammatory cytokines interleukin-1 beta
and tumor necrosis factor. Inflamm Res 54: 10-16
Tang, V., Dhirapong, A., Yabes, A.P., Weiss, R.H. (2005) TNF-α-
mediated apoptosis in vascular smooth muscle cells requires p73. Am J
Physiol Cell Physiol 289: C199-C206
Tannenbaum, C.S., Hamilton, T.A. (1989) Lipopolysaccharide-induced
gene expression in murine peritoneal macrophages is selectively suppressed
by agents that elevate intracellular cAMP. J Immunol 142: 1274-1280
Tartaglia, L.A., Goeddel, D.V., Reynolds, C., Figari, I.S., Weber, R.F.,
Fendly, B.M., Palladino, M.A.Jr. (1993) Stimulation of human T-cell
proliferation by specific activation of the 75-kDa tumor necrosis factor
receptor. J Immunol 151: 4637-4641
Téren, J., Varga, J., Hamari, Z., Rinyu, E., Kevei, F. (1996)
Immunochemical detection of ochratoxin A in black Aspergillus strains.
Mycopathologia 134: 171-176

References
164
Thuvander, A., Breitholty-Emanuelsson, A., Olesen, M. (1995) The
effects of ochratoxin A on mouse immune system after subchronic exposure.
Food Chem Toxicol 33: 1005-1011
Thuvander, A., Breitholtz-Emanuelsson, A., Brabencova, D.,
Gadhasson, I. (1996) Prenatal exposure of Balb/c mice to ochratoxin A:
Effects on the immune system in the offspring. Food Chem Toxicol 34: 547-
554
Tracey, K.J., Beutler, B., Lowry, S.F., Merryweather, J., Wolpe, S.,
Milsark, I.W., Hariri, R.J., Fahey, T.J.3ed., Zentella, A., Albert, J.D., et
al. (1986) Shock and tissue injury induced by recombinant human cachectin.
Science 234: 470-474
Triplett, E.A., Kruse-Elliott, K.T., Hart, A.P., Schram, B.R.,
MacWilliams, P.S., Cooley, A.J., Clayton, M.K., Darien, B.J. (1996)
SK&F 86002, a dual cytokine and eicosanoid inhibitor, attenuates
endotoxin-induced cardiopulmonary dysfunction in the pig. Shock 6: 357-
364
Turesky, R.J. (2005) Perspective: ochratoxin A is not a genotoxic
carcinogen. Chem Res Toxicol 18: 1082-1090
USDHHS (2002). Ochratoxin A, CAS No. 303-47-9. In Report on
Carcinogens, Tenth Edition, Carcinogen Profiles 2002 (Research Triangle
Park, NC, U.S. Department of Health and Human Services, Public Health
Service, and the National Toxicology Program), pp. 189-190

References
165
Vadas, P. (1984) Elevated plasma phospholipase A2 levels: correlation with
the hemodynamic and pulmonary changes in gram-negative septic shock. J
Lab Clin Med 104: 873-881
Valenta, H. (1998) Chromatographic methedods for determination of
ochratoxin A in animal and human tissues and fluids. J Chromatogra A 815:
75-92
Van der Merwe, K.J., Steyn, P.S., Fourie, L.F. (1965a) Mycotoxins. Part
II. The constitution of ochratoxin A, B and C metabolites of Aspergillus
ochraceus Wilh. J Chem Soc 7083-7088
Van der Merwe, K.J., Steyn, P.S., Fourie, L.F., Scott, D.B., Theron, J.J.
(1965b) Ochratoxin A, a toxic metabolite produced by Aspergillus ochraceus
Wilh. Nature 205: 1112-1113
Van Reeth, K., Van Gucht, S., Pensaert, M. (2002) Correlations between
lung proinflammatory cytokine levels, virus replication, and disease after
swine influenza virus challenge of vaccination-immune pigs. Viral Immunol
15: 583-594
Van Rooijen, N., Sanders, A. (1994) Liposome mediated depletion of
macrophages: mechanism of action, preparation of liposomes and
applications. J Immunol Methods 174: 83-93

References
166
Vondracek, J., Stika, J.V., Soucek, K., Minksova, K., Blaha, L.,
Hofmanova, J., Kozubik, A. (2001). Inhibitors of arachidonic acid
metabolism potentiate tumour necrosis factor-alpha-induced apoptosis in
HL-60 cells. Eur J Pharmacol 424: 1-11
Von Herbay, A., Rudi, J. (2000) Role of apoptosis in gastric epithelial
turnover. Microsc Res Tech 48: 303-311
Votta, B.J., Bertolini, D.R. (1994) Cytokine suppressive anti-inflammatory
compounds inhibit bone resorption in vitro. Bone 15:533-538
Walker, R. (2002) Risk assessment of ochratoxin A: Current views of the
European Scientific Committee on Food, the JECFA and the Codex
Committee on Food Additives and Contamination. Adv Exp Med Biol 504:
249-255
Wang, H.C., Zhang, H., Zhou, T.L. (2002) Protective effect of hydrophilic
Salvia monomer on liver ischemia/reperfusion injury induced by pro-
inflammatory cytokines. Zhongguo Zhong Xi Yi Jie He Za Zhi 22: 207-210
Wang, K.F., Li, M.Z., Yang, Y.Z. (2001) Effect of reduqing on HL-60 cells
in secreting tumor necrosis factor alpha production and on TNF-α converting
enzyme mRNA expression. Zhongguo Zhong Xi Yi Jie He Za Zhi 21: 283-
285

References
167
Wang, Z., Wang, Y., Zhu, K., Guo, L., Yang, Y. (2003) Mechanism of
three inhibitors of TACE in blocking the converting of pro-TNF-α into
sTNF-α. J Huazhong Univ Sci Technolog Med Sci 23: 116-120
Webber, E.M., Godowski, P.J., Fausto, N. (1994) In vivo response of
hepatocytes to growth factors requires an initial priming stimulus. Hepatol
19: 489-497
Wei, Y.H., Lu, C.Y., Lin, T.N., Wei, R.D. (1985) Effect of ochratoxin A on
rat liver mitochondrial respiration and oxidative phosphorylation. Toxicol
36: 119-130
Weidenbach, A., Schuh, K., Failing, K., Petzinger, E. (2000) Ochratoxin
A induced TNF-α release from the isolated and blood-free perfused rat liver.
Mycotoxin Res 16A: 189-193
Wicklow, D.T., Dowd, P.F., Alfatafta, A.A., Gloer, J.B. (1996) Ochratoxin
A: An antiinsectan metabolite from the sclerotia of Aspergillus carbonarius
NRRL 369. Can J Microbiol 42: 1100-1103
Williams, L.M., Gibbons, D.L., Gearing, A., Maini, R.N., Feldmann, M.,
Brennan, F.M. (1996) Paradoxical effects of a synthetic metalloproteinase
inhibitor that blocks both p55 and p75 TNF receptor shedding and TNF-α
processing in RA synovial membrane cell cultures. J Clin Invest 97: 2833-
2841
References
168
Wirtz, P.H., von Kanel, R., Rohleder, N., Fischer, J.E. (2004) Monocyte
proinflammatory cytokine release is higher and glucocorticoid sensitivity is
lower in middle aged men than in women independent of cardiovascular risk
factors. Heart 90: 853-858
Wolff, J., Bresch, H., Cholmakov-Bodechtel, C., Engel, G., Gareis, M.,
Majerus, P., Rosner, H., Scheuer, R. (2000) Ochratoxin A: contamination
of food and consumer exposure, Final evaluation. Arch Lebensmittelhygiene
52: 115-117
Yamada, K., Yoshino, K., Sekikawa, K., Madarame, H., Yagita, H.,
Nakane, A. (2000) Effect of a matrix metalloproteinase inhibitor on host
resistance against Listeria monocytogenes infection. FEMS Immunol Med
Microbiol 29: 187-194
Yamada, M., Ichinowatari, G., Tanimoto, A., Yaginuma, H., Ohuchi, K.
(1998a) Inhibition of TNF-α production by SK&F 98625, a CoA-
independent transacylase inhibitor, in cultured rat peritoneal macrophages.
Life Sci 62: PL 297-302
Yamada, Y., Webber, E.M., Kirillova, I., Peschon, J.J., Fausto, N.
(1998b) Analysis of liver regeneration in mice lacking type 1 or type 2 tumor
necrosis factor receptor: requirement for type 1 but not type 2 receptor.
Hepatol 28: 959-970

References
169
Yamashita, M., Taniyama, M., Tamai, M. (2002) Cellular localization of
TNF-α mRNA and IL-6 mRNA in the rat liver after hemorrhagic shock.
Surg Today 32: 701-706
Yang, J.M., Kim, S.S., Kim, J.I., Ahn, B.M., Choi, S.W., Kim, J.K., Lee,
C.D., Chung, K.W., Sun, H.S., Park, D.H., Thurman, R.G. (1999) The
metabolic effects of estriol in female rat liver. J Korean Med Sci 14: 277-285
Ye, J., Wang, L., Zhang, X., Tantishaiyakul, V., Rojanasakul, Y. (2003)
Inhibition of TNF-α gene expression and bioactivity by site-specific
transcription factor-binding oligonucleotides. Am J Physiol Lung Cell Mol
Physiol 284: L386-L394
Yee, S.B., Ganey, P.E., Roth, R.A. (2003) The role of Kupffer cells and
TNF-α in monocrotaline and bacterial lipopolysaccharide-induced liver
injury. Toxicol Sci 71: 124-132
Zeldin, D.C. (2001) Epoxygenase pathways of Arachidonic acid
metabolism. J Biol Chem 276: 36059-3662

Acknowledgments
170
Acknowledgments
I wish to offer my gratitude to:
Prof. Dr. E. Petzinger for his close supervision, guidance and constant
encouragement during the course of this study.
Prof. Dr. N. Katz for his advice and support throughout the study.
I would like to thank my examining committee for their time and sincere efforts.
Special appreciation in this dedication goes to Mr. Klaus Schuh, Mr. Kurt
Stumpf, Mr. Ernst Balser and Mrs. Claudia Ruprecht for their technical
assistance. A special mention to Mrs Evelyn Wilson for her English language
support of this thesis. Also, a special thank you to my family for their support in
obtaining this degree.
My appreciation to all those who helped me in my study who have not been
recorded here.

171
„Ich erkläre: Ich habe die vorgelegte Dissertation selbstständig und ohne
unerlaubte fremde Hilfe und nur mit den Hilfen angefertigt, die ich in der
Dissertation angegeben habe. Alle Textstellen, die wörtlich oder sinngemäß aus
veröffentlichten oder nicht veröffentlichten Schriften entnommen sind, und alle
Angaben, die auf mündlichen Auskünften beruhen, sind als solche kenntlich
gemacht. Bei den von mir durchgeführten und in der Dissertation erwähnten
Untersuchungen habe ich die Grundsätze guter wissenschaftlicher Praxis, wie
sie in der „Satzung der Justus-Liebig-Universität Gießen zur Sicherung guter
wissenschaftlicher Praxis“ niedergelegt sind, eingehalten.“
Lauy AL-Anati

Y
-LA
UL
AN
ATI
A
OF-a
I
V
IT
O I
DU
TI
O
F TN
B
Y O
CR
ATO
XN
NR
NC
NH
IA
VVB
IN VITRO INDUCTION OF TNF-a
BY OCHRATOXIN A
édition scientifique
VVB LAUFERSWEILER VERLAG
Lauy Mohammad Mahmood AL-Anati
VVB LAUFERSWEILER VERLAGédition scientifique
9 7 8 3 8 3 5 9 5 0 4 3 6
ISBN 3-8359-5043-6VVB LAUFERSWEILER VERLAGS TA U F E N B E R G R I N G 1 5D - 3 5 3 9 6 G I E S S E N
Tel: 0641-5599888 Fax: -5599890redak t ion@dok to rve r lag .dew w w . d o k t o r v e r l a g . d e
INAUGURAL-DISSERTATIONzur Erlangung des Grades eines Dr. med. vet. beim Fachbereich Veterinärmedizinder Justus-Liebig-Universität Gießen
Luay M. M. Al-Anati geboren 1977 in Albqáh Camp for Palestinian Refugies, Jordanien, absolvierte 2000 seinen Bachelor of Veterinary Medicine and Surgery an der Universität von Baghdad, Iraq. Im Jahre 2002 erhielt er von der Jordan University of Science and Technology in Irbed, Jordanien den Master-Titel of Veterinary Pharmacology-Physiology. Im Mai 2006 wurde ihm durch Promotion auf dem Gebiet der Pha rmako log ie und Tox i ko log ie d ie Doktorwürde der Veterinärmedizin der Justus-Liebig-Universität Gießen, Deutschland verliehen.
C B DR DQ
Class III MHC
Class II MHCClass I MHC
NF-kB IKB
TNFR
OT
A
CD14
NF-kB
IKB
SuppressorsInducers SuppressorsTNF-á
LPX &/ or CYP-450 metabolites
A.A &/ or COX metabolites
Kupffer cell membrane
C B DR DQC B DR DQ
Class III MHC
Class II MHCClass I MHC
NF-kB IKBIKB
TNFR
OT
A
CD14
NF-kB
IKBIKB
SuppressorsInducers SuppressorsTNF-á
LPX &/ or CYP-450 metabolites
A.A &/ or COX metabolites
Kupffer cell membrane
Related Documents


