Pergamon Ultrasound in Med. & Biol., Vol. 20, No. 2, pp. 157-165, 1994 Copyright © 1994 Elsevier Science Ltd Printed in the USA. All rights reserved 0301-5629/94 $6.00 + .00 OOriginal Contribution IN VITRO EVALUATION OF THREE-DIMENSIONAL ULTRASONOGRAPHY IN VOLUME ESTIMATION OF ABDOMINAL ORGANS ODD HELGE GILJA, t NILS THUNE,* KNUT MATRE, t TRYGVE HAUSKEN, t SVEIN ODEGAARD t and ARNOLD BERSTADt *Medical Department A, Haukeland Hospital, University of Bergen and *Christian Michelsen Research, Bergen, Norway (Received 11 May 1993; in final form 23 August 1993) Abstract--The purpose of this study was to evaluate the accuracy and precision of a three-dimensional (3D) ultrasound system in volume estimation of abdominal organs in vitro. A mechanical sector scanner coupled to a stepping motor recorded images of porcine stomach and kidneys. The transducer was tilted through 88" yielding 81 frames, and volume estimation was performed digitally after interactive manual contour indication and organ reconstruction in 3 dimensions. This 3D system showed good correlation (r = 0.998) between estimated and true volumes. Volume estimation of stomach and kidneys using 3.25 MHz probe demonstrated limits of agreement of 0.877 to 1.146 and 1.007 to 1.125, respectively, depicting estimated volumes as a proportion of true volumes in 95% of the examinations. Intra- and interobserver variation of the tracing procedure revealed low values. We conclude that this 31) ultrasound system performs high accuracy and precision in volume estimation. Key Words: Abdominal organs, Kidney, Stomach, Three-dimensional reconstruction, Volume measurements, Ultrasonic imaging, Ultrasonography. INTRODUCTION Volume estimation of organs and pathologic tissue, like neoplasms, may be of significance in diagnostic procedures and follow up of diseases. Two-dimen- sional (2D) ultrasound has proven to be a valuable, noninvasive method in volume calculation of both pa- renchymal and hollow organs. However, volume calcu- lation performed with 2D ultrasound imaging is based on geometric assumptions (Szebeni and Beleznay 1992), which may introduce significant errors. Previ- ous studies on bladder volume measurements have demonstrated errors from 15% to 95% using 2D ultra- sound (Griffiths et al. 1986). Scanning systems for three-dimensional (3D) ul- trasound imaging have been developed and applied for volume estimation. An in vitro trial on six kidneys demonstrated worst error of -8.3% and no systematic bias in volume estimation (Brinkley et al. 1982). Other authors computed volumes in vitro on phantoms with a mean error of 1.6% using a phased-array transducer, Address correspondence to: Odd Helge Gilja, Medical Depart- ment A, Haukeland Hospital, University of Bergen, N-5021 Bergen, Norway. 157 and indicated that 3D ultrasound did not introduce sig- nificant new errors compared to 2D ultrasound (King et al. 1991, 1992). They argue that evaluation of one specific 3D ultrasound system should not be regarded as true for other 3D systems. In a previous study on phantoms with the present mechanical 3D ultrasound scanner, we found a mean error of 0.78 mL ___2.65 mL in the volume range 1- 45 mL, and an interobserver error of 0.6% ___ 5.0%. Ongoing clinical research on the stomach, the gallblad- der and liver tumors emphasize the need for method- validation on organs. The purpose of this study was to evaluate the accuracy and precision of a mechanical 3D ultrasound scanner for volume estimation on paren- chymal and hollow organs in vitro. MATERIALS AND METHODS Fresh animal organs were acquired from a local slaughterhouse, and both sheep and pig kidneys were harvested in order to obtain a wide range of sizes. Porcine stomachs were required for measurements of a fluid filled hollow organ. The layers of the porcine stomach wall have proven to resemble human layers

Welcome message from author
This document is posted to help you gain knowledge. Please leave a comment to let me know what you think about it! Share it to your friends and learn new things together.
Transcript

Pergamon
Ultrasound in Med. & Biol., Vol. 20, No. 2, pp. 157-165, 1994 Copyright © 1994 Elsevier Science Ltd Printed in the USA. All rights reserved
0301-5629/94 $6.00 + .00
OOriginal Contribution
IN VITRO EVALUATION OF THREE-DIMENSIONAL ULTRASONOGRAPHY IN VOLUME ESTIMATION
OF ABDOMINAL ORGANS
ODD HELGE GILJA, t NILS THUNE,* KNUT MATRE, t TRYGVE HAUSKEN, t
SVEIN ODEGAARD t and ARNOLD BERSTAD t *Medical Department A, Haukeland Hospital, University of Bergen and
*Christian Michelsen Research, Bergen, Norway
(Received 11 May 1993; in final form 23 August 1993)
Abstract--The purpose of this study was to evaluate the accuracy and precision of a three-dimensional (3D) ultrasound system in volume estimation of abdominal organs in vitro. A mechanical sector scanner coupled to a stepping motor recorded images of porcine stomach and kidneys. The transducer was tilted through 88" yielding 81 frames, and volume estimation was performed digitally after interactive manual contour indication and organ reconstruction in 3 dimensions. This 3D system showed good correlation (r = 0.998) between estimated and true volumes. Volume estimation of stomach and kidneys using 3.25 MHz probe demonstrated limits of agreement of 0.877 to 1.146 and 1.007 to 1.125, respectively, depicting estimated volumes as a proportion of true volumes in 95% of the examinations. Intra- and interobserver variation of the tracing procedure revealed low values. We conclude that this 31) ultrasound system performs high accuracy and precision in volume estimation.
Key Words: Abdominal organs, Kidney, Stomach, Three-dimensional reconstruction, Volume measurements, Ultrasonic imaging, Ultrasonography.
I N T R O D U C T I O N
Volume estimation of organs and pathologic tissue, like neoplasms, may be of significance in diagnostic procedures and follow up of diseases. Two-dimen- sional (2D) ultrasound has proven to be a valuable, noninvasive method in volume calculation of both pa- renchymal and hollow organs. However, volume calcu- lation performed with 2D ultrasound imaging is based on geometric assumptions (Szebeni and Beleznay 1992), which may introduce significant errors. Previ- ous studies on bladder volume measurements have demonstrated errors from 15% to 95% using 2D ultra- sound (Griffiths et al. 1986).
Scanning systems for three-dimensional (3D) ul- trasound imaging have been developed and applied for volume estimation. An in vitro trial on six kidneys demonstrated worst error of -8 .3% and no systematic bias in volume estimation (Brinkley et al. 1982). Other authors computed volumes in vitro on phantoms with a mean error of 1.6% using a phased-array transducer,
Address correspondence to: Odd Helge Gilja, Medical Depart- ment A, Haukeland Hospital, University of Bergen, N-5021 Bergen, Norway.
157
and indicated that 3D ultrasound did not introduce sig- nificant new errors compared to 2D ultrasound (King et al. 1991, 1992). They argue that evaluation of one specific 3D ultrasound system should not be regarded as true for other 3D systems.
In a previous study on phantoms with the present mechanical 3D ultrasound scanner, we found a mean error of 0.78 mL ___ 2.65 mL in the volume range 1- 45 mL, and an interobserver error of 0.6% ___ 5.0%. Ongoing clinical research on the stomach, the gallblad- der and liver tumors emphasize the need for method- validation on organs. The purpose of this study was to evaluate the accuracy and precision of a mechanical 3D ultrasound scanner for volume estimation on paren- chymal and hollow organs in vitro.
M A T E R I A L S A N D M E T H O D S
Fresh animal organs were acquired from a local slaughterhouse, and both sheep and pig kidneys were harvested in order to obtain a wide range of sizes. Porcine stomachs were required for measurements of a fluid filled hollow organ. The layers of the porcine stomach wall have proven to resemble human layers
158 Ultrasound in Medicine and Biology Volume 20, Number 2, 1994
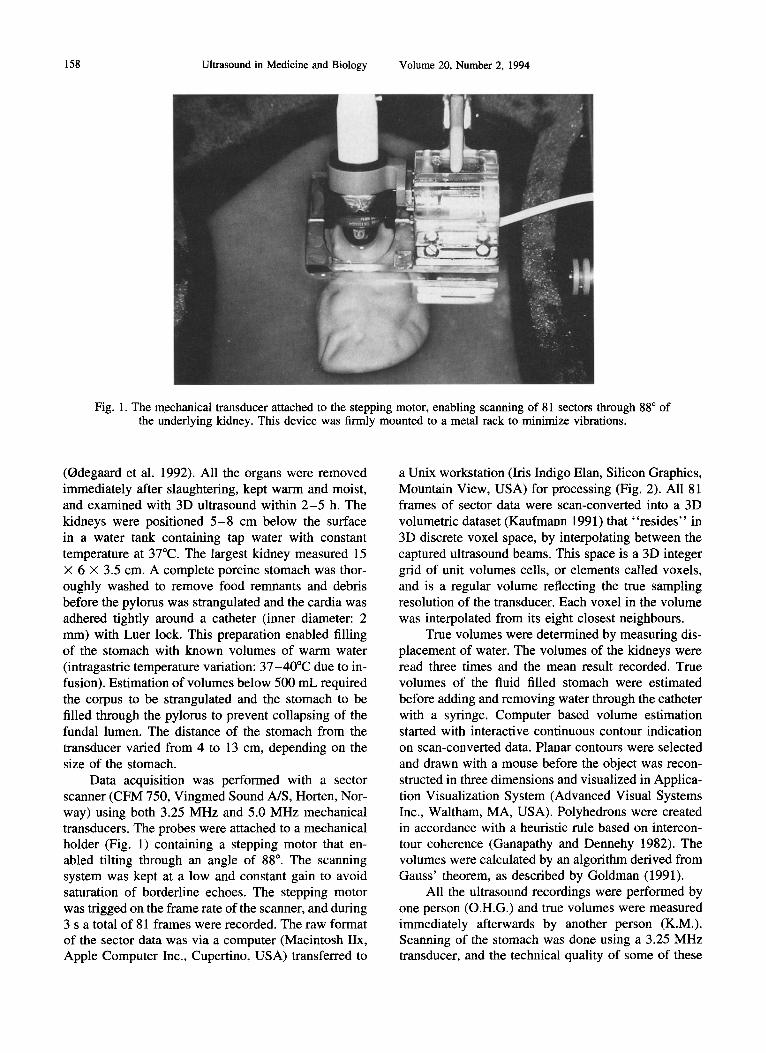
Fig. 1. The mechanical transducer attached to the stepping motor, enabling scanning of 81 sectors through 88 ° of the underlying kidney. This device was firmly mounted to a metal rack to minimize vibrations.
(Odegaard et al. 1992). All the organs were removed immediately after slaughtering, kept warm and moist, and examined with 3D ultrasound within 2 - 5 h. The kidneys were positioned 5 - 8 cm below the surface in a water tank containing tap water with constant temperature at 37°C. The largest kidney measured 15 x 6 x 3.5 cm. A complete porcine stomach was thor- oughly washed to remove food remnants and debris before the pylorus was strangulated and the cardia was adhered tightly around a catheter (inner diameter: 2 mm) with Luer lock. This preparation enabled filling of the stomach with known volumes of warm water (intragastric temperature variation: 37-40°C due to in- fusion). Estimation of volumes below 500 mL required the corpus to be strangulated and the stomach to be filled through the pylorus to prevent collapsing of the fundal lumen. The distance of the stomach from the transducer varied from 4 to 13 cm, depending on the size of the stomach.
Data acquisition was performed with a sector scanner (CFM 750, Vingmed Sound A/S, Horten, Nor- way) using both 3.25 MHz and 5.0 MHz mechanical transducers. The probes were attached to a mechanical holder (Fig. 1) containing a stepping motor that en- abled tilting through an angle of 88 ° . The scanning system was kept at a low and constant gain to avoid saturation of borderline echoes. The stepping motor was trigged on the frame rate of the scanner, and during 3 s a total of 81 frames were recorded. The raw format of the sector data was via a computer (Macintosh IIx, Apple Computer Inc., Cupertino, USA) transferred to
a Unix workstation (Iris Indigo Elan, Silicon Graphics, Mountain View, USA) for processing (Fig. 2). All 81 frames of sector data were scan-converted into a 3D volumetric dataset (Kaufmann 1991) that "resides" in 3D discrete voxel space, by interpolating between the captured ultrasound beams. This space is a 3D integer grid of unit volumes cells, or elements called voxels, and is a regular volume reflecting the true sampling resolution of the transducer. Each voxel in the volume was interpolated from its eight closest neighbours.
True volumes were determined by measuring dis- placement of water. The volumes of the kidneys were read three times and the mean result recorded. True volumes of the fluid filled stomach were estimated before adding and removing water through the catheter with a syringe. Computer based volume estimation started with interactive continuous contour indication on scan-converted data. Planar contours were selected and drawn with a mouse before the object was recon- structed in three dimensions and visualized in Applica- tion Visualization System (Advanced Visual Systems Inc., Waltham, MA, USA). Polyhedrons were created in accordance with a heuristic rule based on intercon- tour coherence (Ganapathy and Dennehy 1982). The volumes were calculated by an algorithm derived from Gauss' theorem, as described by Goldman (1991).
All the ultrasound recordings were performed by one person (O.H.G.) and true volumes were measured immediately afterwards by another person (K.M.). Scanning of the stomach was done using a 3.25 MHz transducer, and the technical quality of some of these
Volume estimation of abdominal organs • O. H. GILJA et al. 159
/
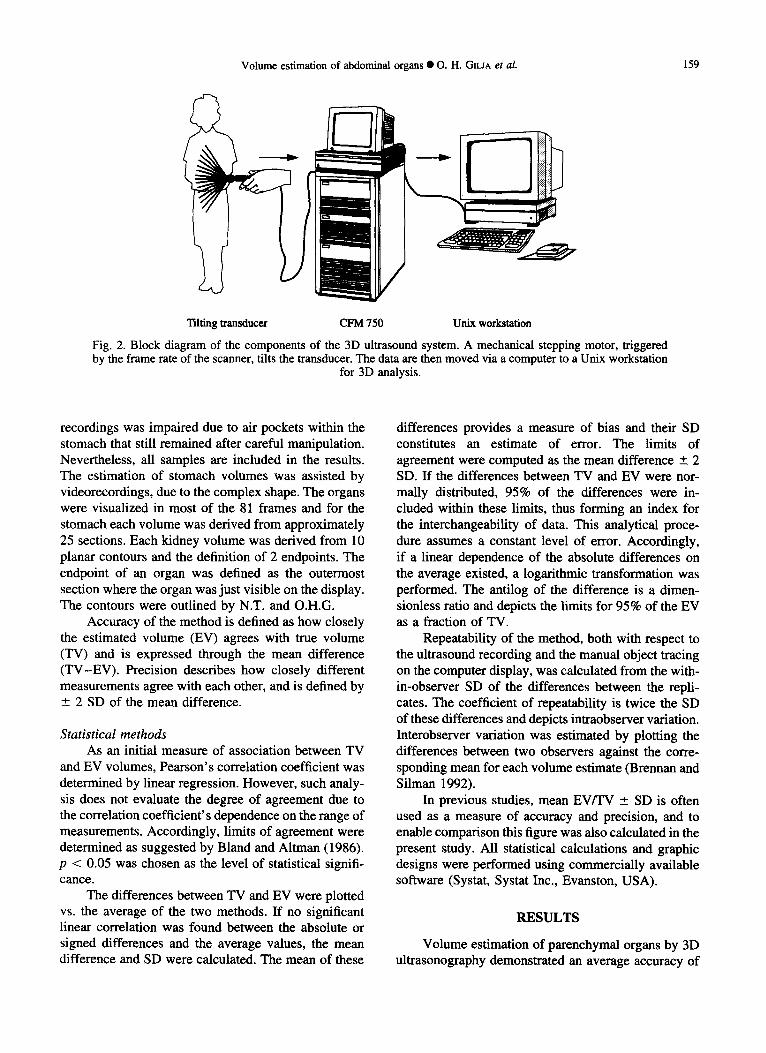
Tilting transducer CFM 750 Unix workstation
Fig. 2. Block diagram of the components of the 3D ultrasound system. A mechanical stepping motor, triggered by the frame rate of the scanner, tilts the transducer. The data are then moved via a computer to a Unix workstation
for 3D analysis.
recordings was impaired due to air pockets within the stomach that still remained after careful manipulation. Nevertheless, all samples are included in the results. The estimation of stomach volumes was assisted by videorecordings, due to the complex shape. The organs were visualized in most of the 81 frames and for the stomach each volume was derived from approximately 25 sections. Each kidney volume was derived from 10 planar contours and the definition of 2 endpoints. The endpoint of an organ was defined as the outermost section where the organ was just visible on the display. The contours were outlined by N.T. and O.H.G.
Accuracy of the method is defined as how closely the estimated volume (EV) agrees with true volume (TV) and is expressed through the mean difference (TV-EV) . Precision describes how closely different measurements agree with each other, and is defined by +_ 2 SD of the mean difference.
Stat is t ical me thods
As an initial measure of association between TV and EV volumes, Pearson's correlation coefficient was determined by linear regression. However, such analy- sis does not evaluate the degree of agreement due to the correlation coefficient's dependence on the range of measurements. Accordingly, limits of agreement were determined as suggested by Bland and Altman (1986). p < 0.05 was chosen as the level of statistical signifi- cance.
The differences between TV and EV were plotted vs. the average of the two methods. If no significant linear correlation was found between the absolute or signed differences and the average values, the mean difference and SD were calculated. The mean of these
differences provides a measure of bias and their SD constitutes an estimate of error. The limits of agreement were computed as the mean difference +__ 2 SD. If the differences between TV and EV were nor- maUy distributed, 95% of the differences were in- cluded within these limits, thus forming an index for the interchangeability of data. This analytical proce- dure assumes a constant level of error. Accordingly, if a linear dependence of the absolute differences on the average existed, a logarithmic transformation was performed. The antilog of the difference is a dimen- sionless ratio and depicts the limits for 95% of the EV as a fraction of TV.
Repeatability of the method, both with respect to the ultrasound recording and the manual object tracing on the computer display, was calculated from the with- in-observer SD of the differences between the repli- cates. The coefficient of repeatability is twice the SD of these differences and depicts intraobserver variation. Interobserver variation was estimated by plotting the differences between two observers against the corre- sponding mean for each volume estimate (Brennan and Silman 1992).
In previous studies, mean EV/TV ___ SD is often used as a measure of accuracy and precision, and to enable comparison this figure was also calculated in the present study. All statistical calculations and graphic designs were performed using commercially available software (Systat, Systat Inc., Evanston, USA).
RESULTS
Volume estimation of parenchymal organs by 3D ultrasonography demonstrated an average accuracy of
Ultrasound in Medicine and Biology Volume 20, Number 2, 1994
3 . 2 5 MHz probe 8 0 0 , , ,
i 200
= 1 0 0
0
3 0 0
0
n : 1 1 r : 0 . 9 9 8
I I
1 O0 200 True volume (mL)
(a)
5 .0 M H z probe ! I
O
300
i 200
= 1 0 0
n : 1 1 r = 0 . 9 9 8
,I,0
. /
0
@
0 i / I I 0 1 O0 200 300
True volume (mL)
(b)
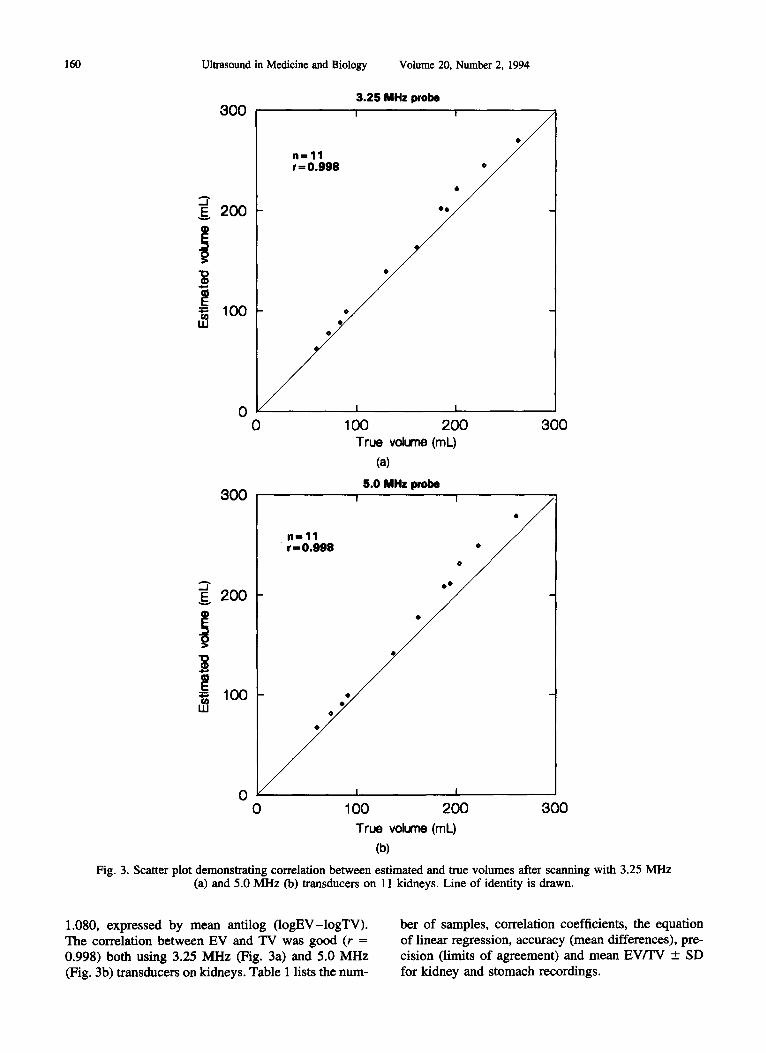
Fig. 3. Scatter plot demonstrating correlation between estimated and true volumes after scanning with 3.25 MHz (a) and 5.0 MHz (b) transducers on 11 kidneys. Line of identity is drawn.
1.080, expressed by mean antilog ( logEV-logTV). The correlation between EV and TV was good (r = 0.998) both using 3.25 MHz (Fig. 3a) and 5.0 MHz (Fig. 3b) transducers on kidneys. Table 1 lists the hum-
ber of samples, correlation coefficients, the equation of linear regression, accuracy (mean differences), pre- cision (limits of agreement) and mean EV/TV _+ SD for kidney and stomach recordings.

Volume estimation of abdominal organs • O. H. GILJA et al.
Table 1. Accuracy and precision of 3D ultrasound in volume estimation of organs.
161
Samples g/
Accuracy (bias) Precision (error) Linear regression Mean (EV-TV) +_ SD Limits of agreement EV = b TV + a Logarithms Antilogs
Mean EV/TV × 100% _+ 1 SD%
Kidney 3.25 MHz 11 5.00 MHz 11
Stomach 3.25 MHz 14
0.998 EV = 1.05 TV + 1.58 0.027 +__ 0.012 1.007, 1.125 0.998 EV = 1.10 TV - 0.80 0.040 ___ 0.012 1.038, 1.159
0.998 EV = 1.00 TV - 2.02 0.001 +__ 0.029 0.877, 1.146
106.5 ___ 2.9 109.8 _+ 3.1
100.4 +_ 6.9
EV: Estimated volume; TV: True volume.
The data from kidney samples showed increasing differences between EV and TV with increasing vol- umes. The significant correlation between differences and mean volumes, r = -0 .65 (p = 0.032) and r = 0.83 (p = 0.001) utilizing 3.25 MHz and 5.0 MHz probes, respectively, made logarithmic transformation of the data necessary. The transformation removed the linear dependence yielding r = -0 .008 (p = 0.98) and r = 0.005 (p = 0.99) for logEV - logTV vs. (logEV + logTV)/2. Figure 4 visualizes the limits of agreement for the 3.25 MHz transducer after logarithmic transfor- marion of the data. Precision of the method was 1.007 to 1.125 for 3.25 MHz probe, and 1.038 to 1.159 for 5.0 MHz probe expressing identical SD (0.028).
Volume estimation of the stomach also revealed a linear dependence between the absolute differences and mean volumes (r = 0.789,p = 0.001). Logarithmic transformation removed the dependence (r = -0.230, p = 0.429), and antilog of the limits of agreement proved to be -0 .877 to 1.146, as illustrated in Fig. 5.
Computing the repeatability of the interactive
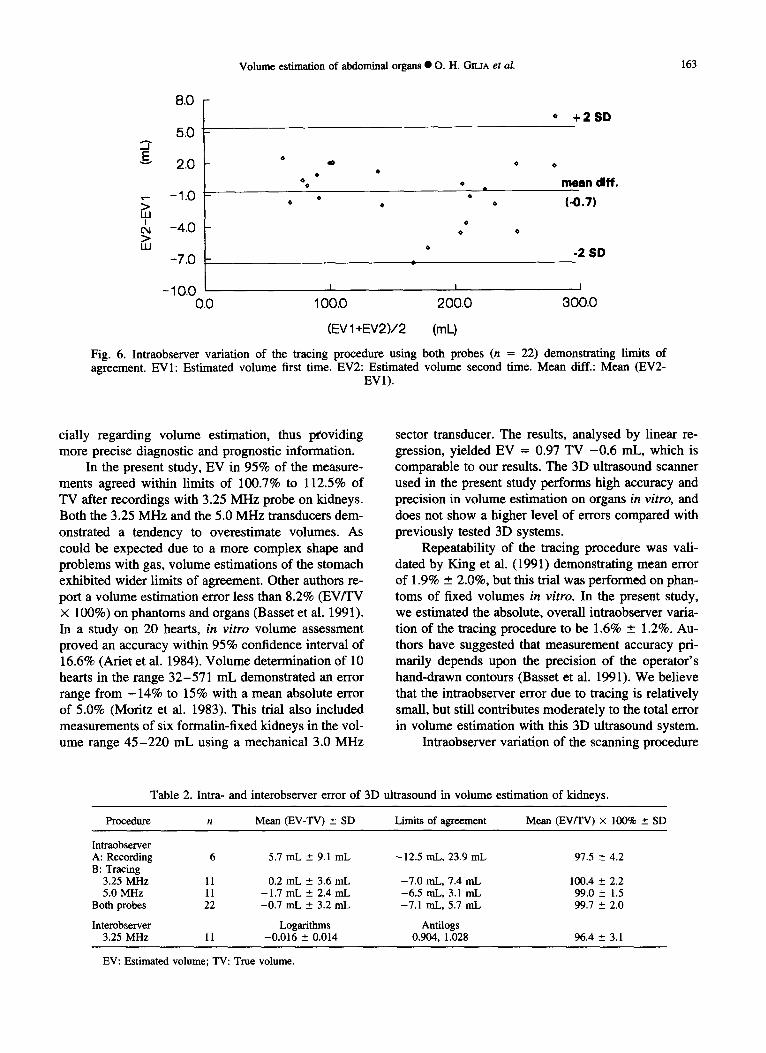
tracing procedure, we found a constant level of error (r = 0.35 and p = 0.11 for the absolute differences vs. mean volumes) and the overall limits of agreement, as shown in Fig. 6 and Table 2, were -7 .1 mL to 5.7 mL (n = 22). The coefficient of repeatability was 6.4 mL. Repeatability of the ultrasound recording proce- dure is based on two series on six kidneys with 3.25 MHz probe revealing limits of agreement of -12 .5 mL to 23.9 mL (Table 2). The coefficient of repeatabil- ity was calculated to 18.2 mL. Interobserver agreement revealed that the first observer in 95% of measurements performed the tracing procedure with readings between 90.4% and 102.8% of the second observer's readings, as illustrated in Table 2.
DISCUSSION
In previous studies, volume estimation based on 2D ultrasound has demonstrated relatively low accu- racy and precision. In a summary of published results of bladder volume measurements, Griffiths et al.
0.060
0.050
0.040
> 0.030
0.020 o
0.010
0.000
-0.010 1J600
I I
1.800 2,000
+2 SD
m e a n d i f f .
(0.027)
-2 SD
I I I
2.200 2.400 2.600
(IogEV+IogTV)/2
Fig. 4. Accuracy and precision of 3.25 MH z probe in volume est imation of kidneys, depict ing limits of agreement after logari thmic t ransformat ion of the data. LogEV: Logar i thm to est imated volume. LogTV: Logar i thm to true
volume. Mean diff.: Mean ( l ogEV- logTV) .

162 Ultrasound in Medicine and Biology Volume 20, Number 2, 1994
1500
1000
I 500
0
I I
n=14 ,
I I
5 0 0 1000 0 1500 True volume (mL)
Line of identity is drawn. (a)
0.080
.• 0.0,30
~ -0.020
+ 2 S D
• • m e a n diff. • ( 0 . 0 0 1 )
-2 SD
-0.070 i i J 1.000 2.000 3,000 4.000
(IogEV+logTV)/2 (b)
Fig. 5. (a) Scatterplot illustrating correlation between estimated and true volumes (mL) after scanning with 3.25 MHz transducer on fluid-filled stomach. Line of identity is drawn. (b) Accuracy and precision in volume estimation demonstrating limits of agreement. LogEV: Logarithm to estimated volume. LogTV: Logarithm to true volume.
Mean diff.: Mean (logEV-logTV).
(1986) quote errors from 15% to 95%. Prostate vol- umes in the range 20-130 mL measured by transab- dominal and transrectal ultrasound showed limits of agreement from 4-112 mL and 6-114 mL, respec- tively (Styles et al. 1988), and there was high interob- server variation. Volume computation of the complex
anatomy of the thyroid gland is often based on the ellipsoid model, which has shown considerable mea- surement error, occasionally exceeding 100% (Szebeni and Beleznay 1992). On this background, the introduc- tion of 3D ultrasound systems has a potential of in- creasing the sensitivity of ultrasound recordings, espe-
Volume estimation of abdominal organs • O. H. GILIA et al. 163
E
LU I
0,1 > UJ
8 . 0 -
5.0
2,0
-1.0
-4.0
-7.0
-IO.O 0.0
* + 2 SD
g ' •
0
0
0 • •
0
I I
100.0 200.0
(EV 1 +EV2)/2 (mL)
0
mean diff.
(-0.7)
-2 SD
I
300.0
Fig. 6. Intraobserver variation of the tracing procedure using both probes (n = 22) demonstrating limits of agreement. EVI: Estimated volume first time. EV2: Estimated volume second time. Mean diff.: Mean (EV2-
EV1).
cially regarding volume estimation, thus pCoviding more precise diagnostic and prognostic information.
In the present study, EV in 95% of the measure- ments agreed within limits of 100.7% to 112.5% of TV after recordings with 3.25 MHz probe on kidneys. Both the 3.25 MHz and the 5.0 MHz transducers dem- onstrated a tendency to overestimate volumes. As could be expected due to a more complex shape and problems with gas, volume estimations of the stomach exhibited wider limits of agreement. Other authors re- port a volume estimation error less than 8.2% (EV/TV × 100%) on phantoms and organs (Basset et al. 1991). In a study on 20 hearts, in vitro volume assessment proved an accuracy within 95% confidence interval of 16.6% (Ariet et al. 1984). Volume determination of 10 hearts in the range 32-571 mL demonstrated an error range from - 1 4 % to 15% with a mean absolute error of 5.0% (Moritz et al. 1983). This trial also included measurements of six formalin-fixed kidneys in the vol- ume range 45 -220 mL using a mechanical 3.0 MHz
sector transducer. The results, analysed by linear re- gression, yielded EV = 0.97 TV -0 .6 mL, which is comparable to our results. The 3D ultrasound scanner used in the present study performs high accuracy and precision in volume estimation on organs in vitro, and does not show a higher level of errors compared with previously tested 3D systems.
Repeatability of the tracing procedure was vali- dated by King et al. (1991) demonstrating mean error of 1.9% ___ 2.0%, but this trial was performed on phan- toms of fixed volumes in vitro. In the present study, we estimated the absolute, overall intraobserver varia- tion of the tracing procedure to be 1.6% +_ 1.2%. Au- thors have suggested that measurement accuracy pri- marily depends upon the precision of the operator's hand-drawn contours (Basset et al. 1991). We believe that the intraobserver error due to tracing is relatively small, but still contributes moderately to the total error in volume estimation with this 3D ultrasound system.
Intraobserver variation of the scanning procedure
Table 2. Intra- and interobserver error of 3D ultrasound in volume estimation of kidneys.
Procedure n Mean (EV-TV) ___ SD Limits of agreement Mean (EV/TV) × 100% ___ SD
Intraobserver A: Recording 6 5.7 mL ___ 9.1 mL -12.5 mL, 23.9 mL 97.5 _ 4.2 B: Tracing
3.25 MHz 11 0.2 mL ___ 3.6 mL -7 .0 mL, 7.4 mL 100.4 _ 2.2 5.0 MHz 11 -1 .7 mL ___ 2.4 mL -6 .5 mL, 3.1 mL 99.0 __ 1.5
Both probes 22 -0 .7 mL _ 3.2 mL -7.1 mL, 5.7 mL 99.7 ~ 2.0
Interobserver Logarithms Antilogs 3.25 MHz 11 -0.016 ± 0.014 0.904, 1.028 96.4 +_ 3.1
EV: Estimated volume; TV: True volume.

164 Ultrasound in Medicine and Biology Volume 20, Number 2, 1994
revealed a higher level of error compared with the tracing procedure in this study. Recording ultrasound images implies sources of errors related to general ul- trasound physics also included in 2D scanning, and some errors unique to 3D ultrasound systems. Possible systematic errors specific for the present 3D system are related to the stepping motor, data recording and transformation and the application of the actual algo- rithm. The stepping motor is a mechanical device sus- ceptible to vibrations during scanning time, thus reduc- ing image quality and the accuracy of edge detection. The angle error due to tilting of the transducer peaks to a maximum of 2%, according to the manufacturer of the stepping motor. The tilting system also intro- duces error of refraction, caused by the velocity mis- match between the coupling water and the organ. The deviation of the beam increases with the angle of tilt, and this implies increasing error with increasing vol- umes. In the present study, a maximum angle from 28 ° to 45 ° was noted with increasing volumes of kidneys, and 37 ° to 53 ° was experienced with increasing vol- umes of the stomach. This observation provides an explanation for the increasing differences between EV and TV with increasing volumes. Errors caused by data recording, scanconverting and use of the actual algorithm in volume estimation, are considered to be insignificant. Regarding random errors, interobserver variation was determined to 4.3% in a previous volume study on phantoms (Gopal et al. 1992). In this trial, interobserver error of the tracing procedure was as- sessed to be 3.6% ___ 3.1%, indicating a tolerable level of error utilizing this 3D ultrasound system.
The principal source of error in volume estimation by means of ultrasonography is poor lateral resolution (King et al. 1991). Lateral resolution depends mostly on beam dimensions, and an annular array as used in this study has the advantage of focusing the beam in both lateral directions. To avoid reduction of lateral resolution, echo amplification was minimized to the lowest possible level. This procedure may have intro- duced a subjective error, particularly if the gain was adjusted after each recording. However, in this study gain was set at the beginning of sampling and then kept constant throughout the sampling series.
For image construction, this sector scanner is cali- brated to 1560 m/s as the mean velocity of ultrasound propagation in tissues. The ultrasound velocity in kid- neys at 37°C is 1560 m/s corresponding to the actual scanner. The speed of ultrasound waves at 37°C in distilled water is approximately 1530 m/s. It is difficult to assess ultrasound velocity of tap water enclosed by a newly sacrified stomach; we expect it to be close to that of distilled water. Accordingly, we assume that
the calculations of stomach volumes are slightly over- estimated.
In the present study, organ volumes were obtained following manual, interactive tracing procedure, which is a tedious, time-consuming process. Automatic edge detection software for volume computation has, due to noise-problems in ultrasound scanning, mostly been limited to Computer Tomography and Magnetic Reso- nance Imaging. Current research may provide such au- tomatic programs for ultrasound scanners, making 3D systems more accessible to the clinician performing volume estimation. Another limitation with this 3D ultrasound system is the time required for recording and transferring data to the computer. This process consumed approximately 1.5 min before the next ultra- sound sample could be obtained. This limitation, also noted in other trials (Fine et al. 1991; Pretorius et al. 1992), prevents the achievement of real-time 3D ultrasound images. However, reducing the data acqui- sition time by perfecting the software and hardware components is within reach, thus enabling real-time 3D imaging.
Realizing that volume estimation is significant in several medical aspects, we are confident that 3D ultra- sonography will constitute a valuable supplement to ordinary 2D ultrasound examinations. However, in vivo studies on humans are preferable to validate 3D ultrasound systems prior to widespread clinical appli- cation.
S U M M A R Y
In this study we evaluated the accuracy and preci- sion of a mechanical 3D ultrasound system for volume estimation on abdominal organs in vitro. We conclude that accuracy and precision in volume estimation by means of this 3D ultrasound system are good and that intra- and interobserver error is low. 3D ultrasonogra- phy may constitute a valid tool in medical research, and system errors do not seem to contradict clinical implementations.
Acknowledgements--This study was supported by the Norwegian Research Council for Science and Technology (NTNF). We thank the Institute of Biomedical Engineering, Faculty of Medicine, Uni- versity of Trondheim, for designing and constructing the 3D trans- ducer equipment we used. We are grateful for the support of Vin- greed Sound A/S, Horten, Norway.
R E F E R E N C E S
Ariet, M.; Geiser, E. A.; Lupkiewicz, S. M.; Conetta, D. A.; Conti, C. R. Evaluation of a three-dimensional reconstruction to com- pute left ventricular volume and mass. Am. J. Cardiol. 54:415- 420; 1984.
Basset, O.; Gimenez, G., Mestas, J. L4 Cathignol, D.; Devonec, M. Volume measurement by ultrasonic transverse or sagittai cross- sectional scanning. Ultrasound Med. Biol. 17:291-296, 1991.
Bland, J. M.; Altmann, D. G. Statistical methods for assessing

Volume estimation of abdominal organs • O. H. GR.JA et al. 165
agreement between two methods of clinical measurements. Lan- cet i:307-310; 1986.
Brennan, P.; Silman, A. Statistical methods for assessing observer variability in clinical measures. B. M. J. 304:1491-1494; 1992.
Brinldey, J. F.; Muramatsu, S. K.; McCallum, W. D.; Popp, R. L. In vitro evaluation of an ultrasonic three-dimensional imaging and volume system. Ultrason. Imaging 4:126-139; 1982.
Fine, D.; Perring, M. A.; Herbetko, J.; Hacking, C. N.; Fleming, J. S.; Dewbury, K. J. Three-dimensional (3D) ultrasound imaging of the gallbladder and dilated biliary tree: Reconstruction from real-time B-scans. Brit. J. Radiol. 64:1056-1057; 1991.
Ganapathy, S.; Dennehy, T. G. A new general triangulation method for planar contours. Comput. Graph. 16:69-75; 1982.
Goldman, R. N. Area of planar polygons and volume of polyhedra. In: Arvo, J., ed. Graphics gems II. New York: Academic Press; 1991:170-171.
Gopal, A. S.; King, D. L.; Katz, J.; Boxt, L. M.; King, D. L., Jr.; Shao, M. Y-C. Three-dimensional echocardiographic volume computation by polyhedral surface reconstruction: In vitro vali- dation and comparison to Magnetic Resonance Imaging. J. Am. Soc. Echocardiogr. 5:115 - 124; 1992.
Griffiths, C. J4 Murray, A.; Ramsden, P. D. Accuracy and repeatabil- ity of bladder volume measurement using ultrasonic imaging. J. Urol. 136:808-812; 1986.
Kaufman, A. Introduction to volume visualization. In: Kaufman, A.,
ed. Volume visualization. IEEE Computer Society Press Tutorial; 1991:1-18.
King, D. L.; King, D. L., Jr.; Shao, M. Y-C. Evaluation of in vitro measurement accuracy of a three-dimansional ultrasound scan- ner. J. Ultrasound Med. 10:77-82; 1991.
King, D. L.; Harrison, M. R.; King, D. L., Jr.; Gopal, A. S.; Martin, R. P.; DeMaria, A. N. Improved reproducibility of left atrial and left ventricular measurements by guided three dimensional echocardiography. J. Am. Coll. Cardiol. 20:1238-1245; 1992.
Moritz, W. E.; Pearlman, A. S.; McCabe, D. H.; Medema, D. K.; Ainsworth, M. E.; Boles, M. S. An ultrasonic technique for im- aging the ventricle in three dimensions and calculating its vol- ume. IEEE Trans. Biomed. Eng. 30:482-492; 1983.
Odegaard, S.; Kimmey, M. B.; Martin, R. W.; Yee, H. C.; Cheung, A. H. S.; Silverstein, F. E. The effect of applied pressure on the thickness, layers, and cchogenicity of gastrointestinal wall ultrasound images. Gastrointest, Endoscopy 38:351-356; 1992.
Prctorius, D. H.; Nelson, T. R.; Jaffe, J. S. 3-dimensional sono- graphic analysis based on color flow doppler and gray scale image data: A preliminary report. J. Ultrasound Med. I 1:225- 232; 1992.
Styles, R. A.; Neal, D. E.; Powell, P. H. Reproducibility of measure- ments of prostatic volume by ultrasound. Comparison of transrec- tal and transabdominal methods. Eur. Urol. 14:266-269; 1988.
Szebeni, A.; Beleznay, E. New simple method for thyroid volume determination by uitrasonography. J. Clin. Ultrasound. 20:329- 337; 1992.
Related Documents