In Vitro Chromosomal Radiosensitivity and Cell Cycle Progression in Cancer Survivors Kevin Keith Cadwell A thesis submitted in partial fulfilment for the requirements for the degree of MSc (by Research) at the University of Central Lancashire in collaboration with Westlakes Research Institute. April 2009

Welcome message from author
This document is posted to help you gain knowledge. Please leave a comment to let me know what you think about it! Share it to your friends and learn new things together.
Transcript

In Vitro Chromosomal Radiosensitivity and Cell Cycle Progression in Cancer Survivors
Kevin Keith Cadwell
A thesis submitted in partial fulfilment for the requirements for the degree of MSc (by Research) at the University of Central Lancashire in collaboration with Westlakes Research Institute.
April 2009

uclan University of Central Lancashire
Student Declaration
Concurrent registration for two or more academic awards
I declare that while registered as a candidate for the research degree, I have not been a registered candidate or enrolled student for another award of the University or other academic or professional institution.
Material submitted for another award
I declare that no material contained in the thesis has been used in any other submission for an academic award and is solely my own work.
Collaboration
Where a candidate's research programme is part of a collaborative project, the thesis must indicate in addition clearly the candidate's individual contribution and the extent of the collaboration. Please state below:
This project formed a subsection of the blood studies carried out as part of the genetic consequences of cancer treatment study www.pcct.org .
Dr Gillian Curwen completed 50% of the chromatid aberration scoring in line with the Westlakes Research Institute procedure for the C2 chromosomal radiosensitivity assay and I scored the other 50%. I completed all the scoring for the cell cycle delay section.
Signature of Candidate - - AA
Type of Award: MSc (by Research)
School: School of Pharmacy and Pharmaceutical Sciences

ABSTRACT
The in vitro 02 chromosomal radiosensitivity assay is a technique used to investigate
variation in the cellular response to radiation. In brief, lymphocytes are irradiated in the
02 phase of the cell cycle to induce DNA damage, which is exhibited at the subsequent
metaphase as chromatid gaps and breaks. Radiation-induced arrest at the end of (32 is
believed to allow time for adequate DNA repair before the onset of mitosis. Therefore,
variation in the level of aberrations observed at metaphase is likely to be driven in part
by 02 checkpoint control. This led to an investigation into whether variation in in vitro
G2 chromosomal radiosensitivity is related to 02 checkpoint efficacy.
A modified version of the 02 chromosomal radiosensitivity assay was validated with
samples from staff at Westlakes Research Institute. The standard 02 assay protocol was
altered by the addition of the chemical calyculin A which induces Premature
Chromosome Condensation (PCC) in interphase cells enabling visualisation and
classification of all cell cycle stages ((ii, S, 02 and metaphase). Initial attempts at
assessing 02 to metaphase transition by visualising and scoring damage directly in 02
cells failed. However, by measuring changes in the ratio of PCC-02 and metaphase
cells before and after irradiation, it was possible to measure 02 checkpoint delay.
Following validation of the PCC technique, both the 02 assay and the modified assay
were applied to a group of 29 cancer survivors and the extent of any individual 02
checkpoint delay was compared to the radiation-induced chromatid aberration
frequency.
No significant relationship between chromatid aberration frequency and (32 checkpoint
delay was observed. Providing that the PCC technique is accurately assessing 02 delay,
Ill

the results suggest that variation in 02 chromosomal radiosensitivity is more likely to be
driven by variation in DNA repair pathways than variation in 02 checkpoint delay.
iv

TABLE OF CONTENTS ACOEDGEMENTS........................................................................................................................ i
LIST OF TABLES AND FIGURES..........................................................................................................2
CHAPTER1: INTRODUCTION..............................................................................................................6
SCOPEOF STUDY ....................................................................................................................................7
1.1 CHROMOSOMAL RADIOSENSITIVITY .......................................................................................8
1.1.1 Human Genetic Syndromes ........................................................................................................... S
1.1.2 The Cell Cycle Based G, Chromosomal Radiosensitivity Assay..................................................9
1.1.3 G2 Chromosomal Radiosensitivity and Cancer ...........................................................................13
1.1.4 Early-Onset Cancer .....................................................................................................................19
1.2 THE INFLUENCE OF RADIATION ON CELL CYCLE KINETICS ............................................22
1.2.1 Cell Cycle Control .......................................................................................................................22
1.2.2 The Effect of Radiation upon the Cell Cycle ............................................................................... 22
1.2.3 ATM Function in Cell Cycle Checkpoints ..................................................................................23
1.2.4 Measuring G, Arrest....................................................................................................................23
1.2.5 PCC (Premature Chromosome Condensation) ............................................................................25
1.3 SCOPE AND AIMS OF THIS PROJECT ........................................................................................28
CHAPTER 2: VALIDATION OF THE PREMATURE CHROMOSOME CONDENSATION
(7CC) TECHNIQUE ................................................................................................................................29
2.1 INTRODUCTION...........................................................................
2.2 METHODS .....................................................................................
2.2.1 Validation Study Population......................................................
2.2.2 Sample Collection .....................................................................
2.2.3 Cell Culture ...............................................................................
2.2.4 X-ray Irradiation........................................................................
2.2.5 PCC Induction ...........................................................................
2.2.6 Cell Harvesting..........................................................................
2.2.7 Slide Preparation and Staining . ..................................................
III]
30

2.2.8 MicmoDy .36
2.3RESULTS ......................................................................................................................................... 38
2.3.1 The Effect of Calyculin A upon Chromosome Morphology ....................................................... 38
2.3.2 Differentiation of PCC-G 2 and Metaphase Cells ......................................................................... 46
2.4 DISCUSSION ................................................................................................................................... 51
2.4.1 Timing of Calyculin A Incubation ............................................................................................... 51
2.4.2 Scoring Chromatid Aberrations in the G, Phase of the Cell Cycle ............................................. 52
2.5 CONCLUSIONS ............................................................................................................................... 55
CHAPTER 3: EXAMINING G, CHROMOSOMAL RADIOSENSITIVITY AND CELL CYCLE
PROGRESSION IN CHILDHOOD AND YOUNG ADULTHOOD CANCER SURVIVORS .........56
3.1 INTRODUCTION ............................................................................................................................. 57
3.2 METHODS ....................................................................................................................................... 57
3.2.1 The Cancer Survivor Group ........................................................................................................ 57
3.2.2 Transport and Internal Assay Controls ........................................................................................ 58
3.2.3 Sampling and Transport .............................................................................................................. 59
3.2.4 The Ci, Chromosomal Radiosensitivity Assay ............................................................................. 62
3.2.5 Scoring Metaphase Cells ............................................................................................................. 62
3.2.6 Assessment of Chromatid Damage .............................................................................................. 63
3.2.7TheG2 +PCCAssay ................................................................................................................... 68
3.2.8 Measuring Cl Checkpoint Delay ................................................................................................. 70
3.2.9 Statistical Methods ...................................................................................................................... 71
3.3 RESULTS ......................................................................................................................................... 73
3.3.1 G7 Chromosomal Radiosensitivity in Internal Assay and Transport Controls ............................ 73
3.3.2 The Relationship between G, Checkpoint Delay and G 2 Chromosomal Radiosensitivity in the
InternalAssay Control .......................................................................................................................... 75
3.3.3 The Relationship between G, Chromosomal Radiosensitivity and Gi Checkpoint Delay in the
CancerSurvivor Group. ....................................................................................................................... 78
3.3.4 The Influence of Age. Gender and Cancer Type upon G, Chromosomal Radiosensitivity and G,
CheckpointDelay ................................................................................................................................. 82
3.4 DISCUSSION ................................................................................................................................... 90
3.4.1 G, Chromosomal Radiosensitivity in Internal Assay and Transport Controls ............................ 90
vi

3.4.2 The Relationship between G, Checkpoint Delay and 0 7 Chromosomal Radiosensitivity in the
Internal Assay Control. ......................................................................................................................... 94
3.4.3 The Relationship between 0 3 Chromosomal Radiosensitivity and G2 Checkpoint Delay in the
CancerSurvivor Group ........................................................................................................................ 94
3.4.4 The Influence of Cancer Type on G 2 Chromosomal Radiosensitivity and G 1 Checkpoint Delay.
......................................................................................................................... 97
3.4.5 The Influence of Age and Gender upon G, Chromosomal Radiosensitivity and G3 Checkpoint
Delay. ................................................................................................................................................... 98
3.4.6 Conclusion ................................................................................................................................. 100
3.4.7 Limitations ................................................................................................................................ 100
3.4.8 Scope for Future Work .............................................................................................................. 101
REFERENCES...................................................................................................................................... 102
APPENDIX A: WRI CONSENT FORM................................................................................................ Al
APPENDIX B: ZEISS AXIOPLAN 2 IMAGING MICROSCOPE WITH A MARZHAUSER
MOTORIZED SCANNING STAGE ...................................................................................................... BI
APPENDIX C: OUESTIONNAIRE FOR DANISH FAMILIES (MODIFIED TO liT PAGE LAYOUT) ....... Cl
APPENDIX D: CONSENT FORM AND INFORMATION FOR DANISH FAMILIES ..................... Dl
APPENDIX E: THE WRI G, RADIOSENSITIVITY SCORE SKEET ................................................. El
APPENDIX F: THE WRI PCC SCORE SHEET .................................................................................... Fl
vu

ACKNOWLEDGEMENTS
The work reported in this thesis was funded by The National Institute of Health, U.S.A.
(Grant Number I ROl CA 104666 to Vanderbilt University, U.S.A.). I am grateful for
the opportunity provided by Westlakes Research Institute (WRI) and for providing the
course fee funding. I would like to thank all staff at WRI and UCLan for their help and
encouragement throughout this project. Thanks go to Dr Craig Wilding for advice in
the early stages, Ms Leanne Hodgson for help with sample processing and my
supervisory team of Dr Bob Lea, Professor Jan lawn and Ms Caroline Whitehouse for
their invaluable input, patience and time. In addition, I would like to thank my
international collaborators especially Dr Jeanette Falck-Winther. Special thanks to Ms
Pat Jonas for collection of samples from WRI volunteers, Dr Gillian Curwen for
chromatid aberration scoring and the Danish families who donated blood samples,
without whom this study would not have been possible.

LIST OF TABLES AND FIGURES
Figure 1.1 The 02 chromosomal radiosensitivity assay.
Table 1.1 02 chromosomal radiosensitivity in cells from cancer patients
Figure 1.2 02 chromosomal radiosensitivity of a group of normal donors and a group of
breast cancer patients.
Figure 1.3 Distributions of 02 chromatid aberration frequencies in WRI controls,
partner controls, cancer survivors and offspring of cancer survivors.
Figure 2.1 The protocol for evaluating PCC induction.
Figure 2.2 Chromosome spread with characteristics of PCC-01 phase.
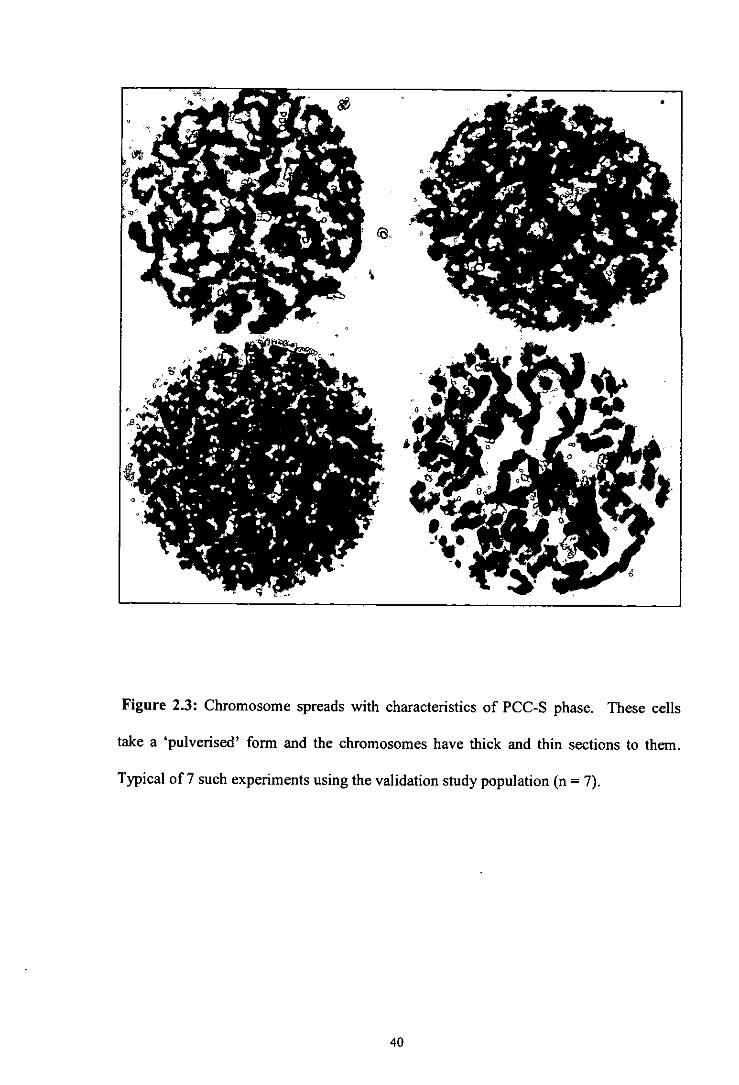
Figure 2.3 Chromosome spreads with characteristics of PCC-S phase.
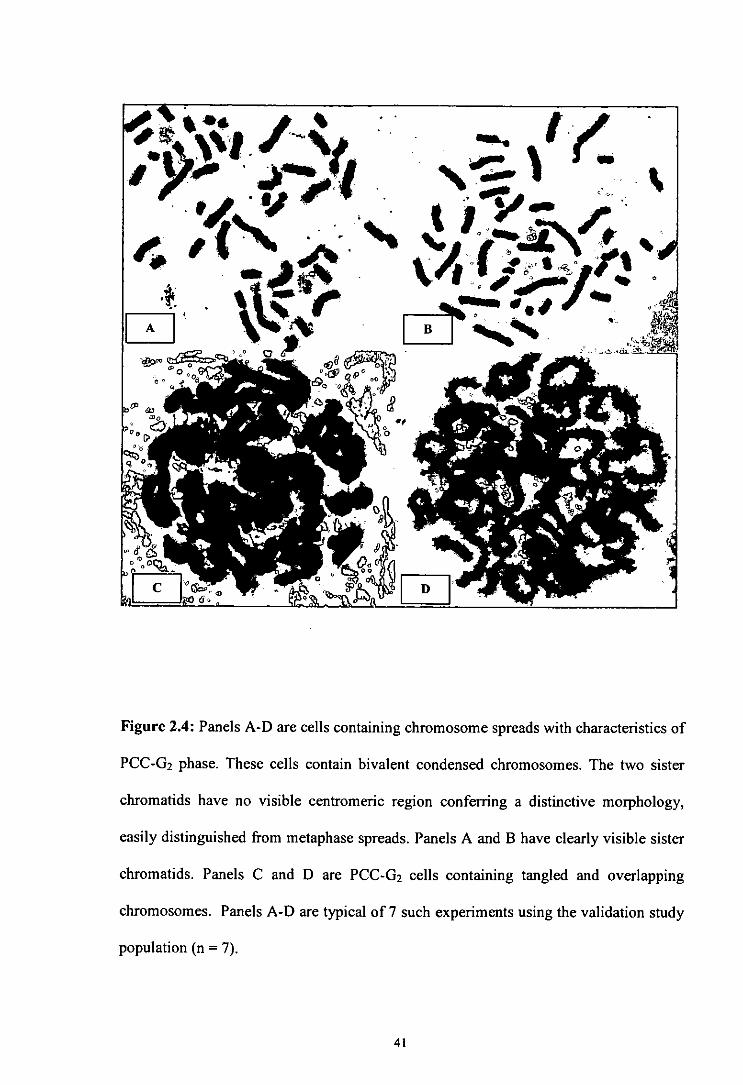
Figure 2.4 Chromosome spreads with characteristics of PCC-G2 phase.
Figure 2.5 Chromosome spreads with characteristics of metaphase.
Figure 2.6 Miscellaneous chromosome spreads.
Figure 2.7 Late PCC-S phase cells.
Figure 2.8 Premature Centromere Division (PCD).
Figure 2.9 PCC-02 cell from an unirradiated sample with good spreading, two clearly
visible sister chromatids and no visible centromeric region.
Figure 2.10 Cells with characteristics of both PCC-S and PCC-G2 phase.
Figure 2.11 PCC-02 cell.
Figure 2.12 Cells with characteristics of both PCC-02 and metaphase.
Figure 2.13 Aberrations observed in a PCC-02 cell following 0.50y X-ray irradiation.
Table 3.1 Information on transport and internal assay controls.
Table 3.2 Details of the cancer survivor group
Figure 3.1 Chromatid aberrations observed in metaphase following 0.50y X-ray
irradiation.
2

Figure 3.2 Metaphase from an irradiated peripheral blood culture containing a
chromosome aberration.
Figure 3.3 The procedure for both the 02 assay and the 02 + PCC assay.
Table 3.3 Radiation-induced chromatid aberration frequencies in internal assay and
transport control donors.
Table 3.4 The 02 chromatid aberration frequencies and the corresponding value of 02
checkpoint delay for the internal assay control.
Figure 3.4 Correlation between 02 checkpoint delay (A), as measured by the 02 + PCC
assay, and chromatid aberration frequencies for the internal assay control.
Table 3.5 Details of the cancer survivor group including radiation-induced 02
aberration frequencies and the corresponding level of 02 checkpoint delay.
Figure 3.5 Radiation-induced chromatid aberration frequencies in the cancer survivor
group.
Figure 3.6 Correlation between 02 checkpoint delay (A), as measured by the 02 + PCC
assay, and chromatid aberration frequencies for the cancer survivor group.
Figure 3.7 Correlation between age at sampling and radiation-induced chromatid
aberration frequencies for the cancer survivor group.
Figure 3.8 Correlation between age at sampling and 02 checkpoint delay (A) for the
cancer survivor group.
Table 3.6 02 chromosomal radiosensitivity and 02 checkpoint delay according to
gender and cancer type.
Figure 3.9 Distribution of radiation-induced chromatid aberrations according to gender
in the cancer survivor group.
Figure 3.10 The relationship between 02 chromosomal radiosensitivity and 02
checkpoint delay according to gender in the cancer survivor group.
3

Figure 3.11 Distribution of radiation-induced chromatid aberrations according to cancer
type in the cancer survivor group.
Figure 3.12 The relationship between (32 chromosomal radiosensitivity and G2
checkpoint delay according to cancer type in the cancer survivor group.
ABBREVIATIONS
AT Ataxia Telangiectasia A TM Ataxia Telangiectasia Mutated gene BRCAI Breast cancer 1 gene BRCA2 Breast cancer 2 gene BrDU 5-bromo 2'-deoxyuridine BS Bloom's syndrome CUK Cyclin Dependent Kinase CPR Central Population Register CV Coefficient of Variation DSBs Double-Strand Breaks FA Fanconi's anemia FACS Fluorescence-activated cell-sorting G0 GapO C1 Gap I C2 Gap2 !CRP International Commission on Radiological Protection IKAROS Interactive KARy-Otyping System KCI Potassium Chloride MI Mitotic Index MIn Mitotic Inhibition NBS Nijmegan breakage syndrome NC! National Cancer Institute PCC Premature Chromosome Condensation PCI) Premature Centromere Division PICR Paterson Institute for Cancer Research S Synthesis WRI Westlakes Research Institute
5

CHAPTER 1
INTRODUCTION

Scope of Study
In vitro assays have demonstrated that cells from cancer prone human genetic
syndromes and, indeed, cancer itself exhibit elevated sensitivity to the DNA-damaging
agent radiation. One such assay is the in vitro chromosomal radiosensitivity technique,
in which the amount of radiation-induced chromosome damage observed in metaphase
cells is used as a measure of radiosensitivity. In addition to cellular sensitivity,
exposure to ionising radiation is known to cause delay in the cell replication cycle.
Such checkpoint delay is thought to allow time for genome repair before the onset of
replication or mitosis i.e. at G/S borders and 02/M transition, respectively. Therefore,
variation in the level of chromosome damage observed at metaphase is likely to be
driven in part by checkpoint control (Scott et al 2003; Terzoudi and Pantelias 1997;
Terzoudi et al 2005; Zampetti-Bosseler and Scott 1981).
This thesis describes the application of a technique called Premature Chromosome
Condensation (PCC), which can be used to directly enumerate cell cycle perturbation
following radiation exposure, in conjunction with the established in vitro chromosomal
radiosensitivity assay (Scott et a!, 1996; Smart et a!, 2003). The hypothesis tested by
this work was that an increase in delay before the onset of mitosis (G2IM checkpoint) is
directly correlated with a visible reduction of chromosome damage in metaphase. The
work herein discusses the initial attempts at using the PCC technique in the Westlakes
Research Institute (WRI) laboratory and then goes on to describe the application of this
methodology to a Danish population of 30 survivors of childhood and young adulthood
cancer.
7

The results failed to provide evidence that checkpoint delay is associated with
chromosomal radiosensitivity, at least in this particular cancer survivor cohort. The
thesis concludes with a discussion of the possible reasons for these findings, limitations
of the assays employed, the importance of intra-individual variation, further work which
may be useful and the influence of age, gender and cancer type.
1 INTRODUCTION
1.1 CHROMOSOMAL RADIOSENSITIVITY
1.1.1 Human Genetic Syndromes
A number of human genetic disorders with diverse clinical outcomes have been
identified that predispose the individual to a high risk of developing cancer and which
exhibit chromosomal instability e.g. Ataxia telangiectasia (AT), Bloom's syndrome
(BS) and Fanconi's anemia (PA). Collectively, they have been termed chromosome
breakage syndromes (Carney 1999; Futaki and Liu 2001).
AT is an autosomal recessive disorder estimated to occur in approximately I in 100,000
live births in the USA (Swift eta! 1986) and 1 in 300,000 in Great Britain (Woods eta!
1990). Clinical manifestations of this childhood disease include progressive
immunodeficiency, neurological degeneration (ataxia) and dilated blood vessels
(telangiectasia) in the corners of the eyes or on the surface of the ears and cheeks
(reviewed by Chun and Gatti 2004). Approximately, 25% of those with AT develop
cancer, most frequently acute lymphocytic leukaemia or lymphoma; this high cancer
predisposition may be linked to a decreased capacity to repair DNA damage.
Radiosensitivity in AT was first described in two young individuals treated for cancer
by means of radiotherapy (Gotoff et a! 1967; Morgan eta! 1968). Two boys aged 9 and
10 years suffered severe adverse reactions to radiation treatment, including dermatitis,
8

necrosis, dysphagia, and progressive respiratory collapse. The unexpected tissue
responses ultimately led to death within four and eight months, respectively. This
abnormal sensitivity to radiation leading to enhanced cell killing was confirmed in vitro
by exposing AT fibroblast cells lines to y-radiation (Taylor et al 1975). Further studies
demonstrated an enhanced sensitivity to X-ray irradiation which manifests itself as
increased chromosomal damage compared to controls (Bender et al 1985; Nagasawa et
al 1985; Natarajan and Meyers 1979; Taylor 1978). An enhanced sensitivity to
radiation, using the endpoint of chromosomal aberrations, has also been observed in BS
(Aurias et a! 1985; Kuhn 1980; Parshad et al 1983) and FA (Bigelow et al 1979;
Higurashi and Conen 1973; Parshad et a! 1983). However, the results of many
investigations into the chromosomal radiosensitivity of chromosome breakage
syndromes were inconclusive and difficult to reproduce with only AT patients
consistently demonstrating radiosensitivity outside of any control population (reviewed
by Murnane and Kapp 1993).
1.1.2 The Cell Cycle Based 62 Chromosomal Radiosensitivity Assay
In vitro cellular radiosensitivity of cultured cells can be detennined using a variety of
assays which test for endpoints such as cell death, mutagenicity, cell cycle perturbation,
chromosome damage, and DNA damage/repair. The cell cycle based in vitro G2
chromosomal radiosensitivity assay has been one of the most commonly used protocols
for the last 30 years and has provided good discrimination in radiation response between
individuals. The cell cycle consists of four distinct phases termed gap 1 (C1), synthesis
(S), gap 2 (02) and mitosis. In G1. a high level of protein synthesis occurs and the
chromosomes are prepared for S phase, in which duplication of cellular DNA occurs.
Following successful DNA replication a short 02 phase of 4 - 5 hours exists to allow
preparation for mitosis, in which cells divide.

The in vitro 02 chromosomal radiosensitivity assay can be performed on any dividing
cell population, i.e. either cell lines or on stimulated blood lymphocytes. In brief, the
assay involves irradiating PHA-stimulated peripheral blood lymphocytes or fibroblast
cell lines in vitro to induce DNA damage. A short time for normal repair processes is
allowed, before the extent of unrepaired damage, in the form of chromatid gaps and
breaks, is measured at metaphase (Figure 1.1). Thus, only cells that were in the 02
phase at the time of irradiation are sampled by this protocol. The earliest applications of
the assay were used to demonstrate that AT cells are abnormally radiosensitive in the 02
phase of the cell cycle (Rary et a! 1974). In the late 1970's this cytogenetic assay was
further developed and utilised in a number of studies at the National Cancer Institute
(NC!), Bethesda, USA by Katherine Sanford and colleagues. Many early studies
sampled skin fibroblasts, but difficulties such as bacterial contamination and long pre-
culture growth times (Sanford et a! 1989), led to the 02 assay being adapted for
lymphocytes obtained from a peripheral blood sample (Sanford et a! 1990). Between
1983 and 1997 the NC! group demonstrated elevated 02 chromosomal radiosensitivity
in a large number of cancer-prone syndromes including FA, familial polyposis coli and
BS (Parshad et a! 1983); chronic ulcerative colitis (Sanford et a! 1997b); Down's
syndrome (Sanford et at 1993); familial dysplastic naevus syndrome (Sanford et a!
1997a); Gardner's syndrome (Parshad et a! 1983; Takai et a! 1990); xeroderma
pigmentosum (Parshad et at 1983; Price et a! 1991), Li-Fraumeni syndrome (Parshad et
al1993) and AT homozygotes (Sanford et at 1990).
Many studies have attempted to discriminate between AT heterozygotes, AT patients
and normal controls using radiation-induced chromatid aberrations as their endpoint
(Bender eta! 1985; Parshad eta! 1985; Sanford eta! 1990; Shiloh eta! 1986; Shiloh et
FE
al 1989; Tchirkov et a! 1997). These studies produced conflicting results and the
present consensus is that radiosensitivity, as measured by induced chromatid
aberrations, is an unsuitable endpoint for carrier detection due to considerable overlap
between AT heterozygotes and the normal populations. Despite the findings of some
groups, the International Commission on Radiological Protection (ICRP 1998) advise
that the only cancer-prone syndromes with definitive elevated G2 radiosensitivity are
AT homozygotes and Nijmegan breakage syndrome (NBS) (Weemaes et a! 1981),
which was originally thought to be a variant of AT.
David Scott and colleagues at the Paterson Institute for Cancer Research (PICR) in
Manchester applied the NCI assay to control and cancer-prone individuals in an attempt
to confirm the clear discrimination previously found at the NCI between the two groups
(Scott et a! 1996). A comparison of control donors at the NCI and PICR uncovered
more inter-experiment variability in the PICR control group coupled to clear differences
in aberration yields, kinetics of aberration decline and mitotic inhibition. The
experimental variability demonstrated by the PICR group when applying the NC! assay
was eventually resolved. Scott and colleagues (1996) were able to demonstrate that a
centrifligation step prior to irradiation was slowing the progression of some cells into
metaphase and the harvesting of cells at 37°C was allowing chromosomal repair
thi-oughout the harvesting procedure. By omitting the centrifugation step and harvesting
cells at 0°C to stop repair, experimental variability was reduced. Even with these
changes, PICR researchers were unable to repeat the results of the NCI group in being
able to discriminate between cancer predisposed groups and controls, with complete
discrimination only found between controls and AT homozygotes (Scott ci a! 1996).
Having established the assay, the PICR laboratory began large-scale investigations into
radiosensitivity and predisposition to common cancers.
Synthesis
Irradiation A cell in m:taPhase
Gap 1
Gap2
e VL
ito S Proøhase
etaphase left AnaDhase ,a'"
Telophase
Gap 0 Chromosome
preparation
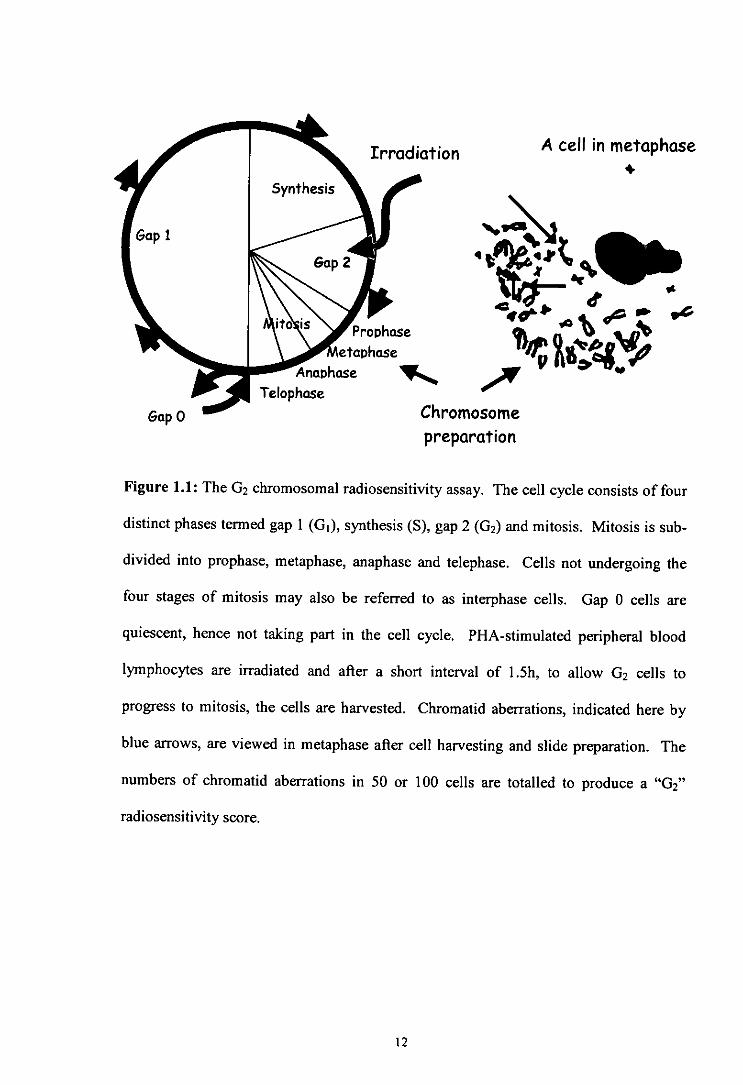
Figure 1.1: The G2 chromosomal radiosensitivity assay. The cell cycle consists of four
distinct phases termed gap 1 (Gi). synthesis (S), gap 2 (02) and mitosis. Mitosis is sub-
divided into prophase, metaphase, anaphase and telephase. Cells not undergoing the
four stages of mitosis may also be referred to as interphase cells. Gap 0 cells are
quiescent, hence not taking part in the cell cycle. PHA-stimulated peripheral blood
lymphocytes are irradiated and after a short interval of I .5h, to allow (32 cells to
progress to mitosis, the cells are harvested. Chromatid aberrations, indicated here by
blue arrows, are viewed in metaphase after cell harvesting and slide preparation. The
numbers of chromatid aberrations in 50 or 100 cells are totalled to produce a "02"
radiosensitivity score.
12

1.1.3 C2 Chromosomal Radiosensitivity and Cancer
Although many early 02 chromosomal radiosensitivity studies concentrated on cancer-
prone families, there was a clear interest to research cancer predisposition in
conjunction with 02 chromosomal radiosensitivity in sporadic cancer patients (without a
strong family history) with the aim of uncovering genetic markers and evaluating
predictive tests. Significantly elevated radiosensitivity has been reported in cells from
patients with a diverse range of cancers although results have conflicted between
laboratories. A list of the studies undertaken to date is provided in Table 1.1.
To investigate whether individuals with sporadic breast cancer exhibit enhanced 02
chromosomal radiosensitivity, the 02 assay was applied to a population of sporadic
breast cancer patients in two studies at the PICR (Scott eta! 1994a; Scott eta! 1999). A
comparison of 02 scores between a control population of 105 donors and 135 breast
cancer patients revealed that approximately 40% (53/135) of breast cancer patients
exhibit an elevated chromosomal radiosensitivity compared to 6% of control individuals
(Scott et a! 1999) (Figure 1.2). To discriminate between a sensitive and normal
response Scott and colleagues utilised a cut-off value at the 90th percentile in the control
distribution and applied this value to the breast cancer patients. Although, this 90 th
percentile value was, to some extent, arbitrary, it resulted in good discrimination
between populations and has since been adopted in the majority of 02 chromosomal
radiosensitivity studies. Earlier studies using fibroblasts utilised a variety of techniques
and often sampled only small numbers of individuals. The work of Scott and colleagues
was significant in that it was the largest study of its type at the time and the 02 assay
had been standardised for use with peripheral blood lymphocytes to give more
reproducible results.
13

Table 1.1 G2 chromosomal radiosensitivity in cells from cancer patients.
Cancer Type Normal sensitivity' Elevated sensitivity2
Breast Docherty eta! 2007 Baria et a! 2001; Baeyens et a! 2002; Howe et a! 2005b; Parshad et a! 1996; Patel et a! 1997; Riches et a! 2001; Scott et a! 1 994a; Scott et a! 1999; Terzoudi et a! 2000
Brain Terzoudi et a! 2000
Bladder Terzoudi et a! 2000
Head and Neck Papworth eta! 2001 Papworth eta! 2001 (age of diagnosis? 45) (age of diagnosis S 45)
De Ruyck eta! 2008; Terzoudi et a! 2000
Colorectal Baria eta! 2001; Darroudi et a! 1995
Cervical Baria eta! 2001 Terzoudi eta! 2000
Lung Baria eta! 2001 Terzoudi eta! 2000
Prostate Howe et a! 2005a
Paediatric and Adolescent Curwen et a! 2005 3 Baria et a! 2002; Curwen et
(treated S 20 years). a! 2005 Includes Hodgkin's disease, non-Hodgkin's lymphoma, osteosarcoma, Wilms' tumour, Rhabdomyosarcoma.
Retinoblastoma Darroudi eta! 1995 Sanford eta! 1996
Skin Terzoudi et a! 2000
Leukaemia Terzoudi et a! 2000
Lymphoma Darroudi et a! 1995
Wilms' tumour Darroudi eta! 1995
1,2 Normal and elevated sensitivity designated on the basis of standards defined within individual studies.
on control group used as comparison.
14

35
30
25
20
15
10 0
5 C
(4
o 0 I.- 0.)
1 z 30
25
20
15
10
5
0
50 60 70 80 90 100 110 120 130 140 150 160 170 180 190 200
Aberrations per 100 cells
Figure 1.2: ( 2 chromosomal radiosensitivity of a group of normal donors (top) and a
group of breast cancer patients (bottom). The solid line is at the 90th percentile value of
the control group and indicates the cut-off point between sensitive and non-sensitive
individuals. Adapted from Scott eta! (1999) and Scott (2004).
15

Epidemiological data suggest that 4 - 13% of breast cancer patients could be carriers of
the mutated AT gene (Easton, 1994) and this may contribute to the enhanced sensitivity
seen in a population profile. However, the enhanced radiosensitivity observed in over
40% of breast cancer patients could not be attributed to the small percentage of AT
heterozygotes within the sporadic breast cancer population studied. For this reason, it
was postulated that genetic predisposition to breast cancer may be the result of
mutations in genes of a low penetrance involved in the processing of DNA damage, and
is not confined to those with a strong family history such as carriers of the ATM gene
and individuals with BRCAJI BRCA2 mutations (Scott et a! 1999; Scott et a! 2000;
Scott 2004). As further evidence, the University of (ihent (Belgium) laboratory failed
to demonstrate a role for either BRCA] or BRCA2 (heterozygous carriers) in conferring
G2 chromosomal radiosensitivity (Baeyens et a! 2004). This suggests that the
contribution of BRCA1/2 towards sporadic breast cancer is perhaps minimal, although a
more recent report showed that healthy BRCA 1 carriers had significantly more
radiation-induced chromatid aberrations compared to controls matched for age, sex and
ethnicity (Barwell et a! 2007). Epidemiological evidence supporting the hypothesis of
Scott includes studies of cancer incidence in twins (Lichtenstein et a! 2000; Peto and
Mack 2000) which indicate that breast cancer, in the majority of cases, arises in
genetically predisposed females and cannot be accounted for by relatively rare
mutations in BRCAJ or BRCA2. This finding further supports the concept that other low
penetrance genes, as yet unidentified, confer an enhanced radiosensitivity. Candidates
for low penetrance cancer-predisposition genes include CHEK2 (Meijers-Heijboer et a!
2002) and polymorphisms in microsatellites associated with DNA repair genes such as
XRCCJ, XRCC2 and XRCC3 (Price eta! 1997).
Since the breast cancer study of Scott was published in 1994, a number of independent
studies have reported significantly elevated G2 chromosomal radiosensitivity in breast
nm

cancer (Baeyens et a! 2002; Baria et a! 2001; Howe et a! 2005b; Parshad et a! 1996;
Patel et a! 1997; Riches et a! 2001; Terzoudi et a! 2000). However, a more recent study
of 211 newly diagnosed breast cancer patients in conjunction with 170 age, sex and
ethnically matched controls revealed no significant difference in levels of chromatid
breaks between patients and controls (Docherty et al 2007). The fact that this study
failed to replicate the findings of David Scott's group, as well as other groups, was
surprising but may be explained in part by the choice of assay employed. Docherty et a!
(2007) modified the method of Howell and Taylor (1992) which is routinely used at
Guy's Hospital to aid the diagnosis of radiosensitivity in patients with phenotypic
features of AT and NBS. The Howell and Taylor technique has some differences to the
method developed by Scott and colleagues. For example, cell harvesting was carried
out at room temperature which may facilitate further rejoining of chromatid gaps and
there were minor differences in scoring criteria.
Encouraged by the promising findings of the breast cancer studies, a number of studies
investigated whether chromosomal radiosensitivity was associated with other cancer
types (Baria et a! 2001; Baria et a! 2002; Curwen et a! 2005; De Ruyck et al 2008;
Howe et a! 2005a; Papworth et a! 2001; Terzoudi et a! 2000). A large-scale study
compared G2 chromosomal radiosensitivity in 25 normal individuals with a group of
185 cancer patients containing a variety of malignancies including breast, cervix,
prostate, larynx, lung, brain, bladder, skin and leukaemia (Terzoudi et a! 2000). For all
cancer types, the mean radiation-induced chromatid aberration yields were higber than
in the normal individuals and the average sensitivity of the cancer patients, taken as a
whole, was significantly greater than the control group (P = 0.001). An examination by
the PICR group into colorectal cancer, lung cancer and cancer of the cervix as well as in
chronic disease (diabetes mellitus and non-malignant lung disease) revealed that 30%
17
(12/37) of colorectal cancer patients exhibited an enhanced sensitivity, which was
statistically significant (P = 0.01), when compared to the control population (Baria eta!
2001). Unlike the study of Tcrzoudi et a! (2000), elevated 02 chromosomal
radiosensitivity was not found in lung and cervical cancer. Again adopting the 90th
percentile cut-off, the proportion of radiosensitive cases in lung cancer was only 23%
(8/35) and in cancer of the cervix 11% (3/27) of patients were sensitive, values that
were not significantly different. Both lung cancer and cancer of the cervix have a well
established environmental aetiology with lung cancer strongly linked to tobacco
smoking and cervical cancer linked to infection with human papilloma virus. The lack
of a significant elevated radiosensitivity in these malignancies could be explained by the
strong environmental aetiology and a far weaker inherited component in comparison
with breast cancer. The existence of a genetic predisposition to cancer which is not
linked to the repair of radiation induced damage, for example carcinogen metabolism,
would not be detectable by the 02 assay and may provide an alternative explanation.
There is some epidemiological evidence of an inherited component in colorectal cancer
(Cannon-Albriglit a' a! 1988; Lichtenstein et a! 2000) and an elevated chromosomal
radiosensitivity of 30%, may well be a marker of low penetrance genes. Another
important finding was that patients with chronic disease (diabetes mellitus and non-
malignant lung disease) did not exhibit an enhanced radiosensitivity with only 12%
sensitive compared to 9% in normals (Baria a' a! 2001). This indicates that elevated
radiosensitivity may not be conferred by a diseased state itself.
Continuing their work on cancer patients, the PICR group applied the 02 assay to a
cohort of patients with head and neck cancer (Papworth et a! 2001). Using the 90th
percentile cut-off, 31% (13/42) of patients were sensitive compared to 15% of normals
but this was not statistically significant. However, when the patients were divided into
18
early onset cases (age of diagnosis 45) and normal onset (age of diagnosis ~ 45) the
difference between the normal and the early-onset group was statistically significant
with enhanced radiosensitivity in the early-onset group. The authors suggest that for
early-onset cases there is a genetic predisposition which is not present in older patients.
A more recent study revealed that 26% of head and neck cancer patients (age range 33 -
91) were significantly radiosensitive compared with only 9% of healthy controls (De
Ruyck et al 2008). The results of Papworth et a! (2001), were corroborated by the
finding that head and neck cancer patients aged S50 years had the highest mean 02
scores with a mean aberration frequency of 1.32 breaks per cell compared to 1.18 breaks
per cell in patients aged >70 (De Ruyck et a! 2008). Environmental risk factors such as
smoking and alcohol consumption are thought to predominate in older patients. Early-
onset cases represent less than 5% of all head and neck cancers (Camiol and Fried 1982;
Decroix and Ohossein 1981; Son and Kapp 1985), so taken as a whole these studies
suggest that head and neck cancer has a smaller genetic component in terms of
predisposition, than breast cancer.
1.1.4 Early-Onset Cancer
The early onset of malignancy is thought to be a common feature in cancers that have a
high inherited risk. Elevated radiosensitivity has been demonstrated in a mixed group
of paediatric cancer patients when compared to age-matched controls (Baria et al 2002).
When 32 early-onset cases, diagnosed before the age of 20 (age range 0.5 - 19), were
compared to 41 young controls (age range 0.25 - 19) and 32 adult normals (age range 20
- 60) the authors found that 44% of patients were sensitive compared to 15% in young
controls and 10% in adult controls. The results of this study hinted that a proportion of
early-onset cancers may be driven by mutations in genes of low penetrance.
19

The 02 assay developed at the PICR was applied, with some minor changes, in our
laboratory at WRI to investigate the association of 02 radiosensitivity with cancer
predisposition and the heritability of the trait in a population of Danish survivors of
childhood and adolescent cancer and their offspring (Curwen et a! 2005). In total, four
groups were scored for G2 chromosomal radiosensitivity; 23 survivors of childhood and
adolescent cancer, a control group comprising their 23 partners, 38 offspring and an
internal control group consisting of 27 volunteers collected at WRI. When the 90th
percentile cut-off of the WRI control group was implemented, the proportion of
radiosensitive cases was 35% for the partners, 52% for the survivors and 53% for the
offspring. There were no significant differences between WRI controls and Danish
controls but significant differences between WRI controls and Danish cancer survivors
(P = 0.002) and WRI controls compared with offspring (P c 0.001). However, when
the 90' percentile cut-off for the Danish partner control group was applied, no
significant differences were observed between the three Danish groups, with only 4% of
cancer survivors and 18% of offspring found to be sensitive (Figure 1.3). The higher
than expected proportion of radiosensitive individuals seen in the partner control group
in comparison with the WRI control group could not be easily explained. Although the
authors suggested there was a possibility that partners of cancer survivors may not be an
appropriate control group, they concluded it was unlikely that the partners would form a
distinct group with elevated radiosensitivity. The inability to distinguish between
cancer survivors and their partner controls suggests that any association between
elevated G2 chromosomal radiosensitivity and childhood cancer predisposition should
be regarded with caution. Moreover, the WRI controls may not be an appropriate group
for comparison with childhood and adolescent cancer. That being the case, the inability
of the study to distinguish between cancer survivors and cancer partners seems to
contradict the earlier findings by Baria et a! (2002).
20

8
6
4
2
0
8
6
4
2
0
8
6
4
2
0
8
6
4
2
0
r c = 23
ontrols
r Survivors 1 = 23
Ispring i = 38
F controls = 27
Aberration frequency per 100 cells
Figure 1.3: Distributions of G2 chromatid aberration frequencies in WRI controls,
partner controls, cancer survivors and offspring of cancer survivors. The vertical lines
represent the cut-off points for a nonnal and radiosensitive response, based on the 90th
percentile of the WRI control (red-dotted line) and partner control (solid black line)
groups. Figure adapted from Curwen et al (2005) and reproduced with kind permission.
21
U,
Ct
0
•0 C
4-C s-I a)
-o
ri

1.2 THE INFLUENCE OF RADIATION ON CELL CYCLE KINETICS
1.2.1 Cell Cycle Control
Cell cycle control is maintained by checkpoints at (i1/S transition and G2/Mitosis
transition and is regulated by key proteins such as p53, ATM, BRCAI and various
Cyclin Dependent Kinase (CDK) molecules. The G checkpoint exists to prevent cells
from entering DNA synthesis with DNA damage which can then become 'fixed' in the
genome. At this stage cells may be temporarily stopped from dividing and enter a state
of quiescence called Go phase. The G2 checkpoint prevents the proliferation of
damaged cells and allows time for DNA repair before transition to metaphase. Efficient
cell cycle control is crucial for maintaining genomic integrity and stability, thereby
preventing unregulated cell proliferation which leads to cancer.
1.2.2 The Effect of Radiation upon the Cell Cycle
Since the 1920's it has been recognised that radiation can affect cellular growth
(Mottram et a! 1926). By 1953 an accurate representation of cell cycle progression was
established using radiolabelling of S phase cells with 32P (Howard and Pelc 1953).
Howard and PeIc discovered that X-ray irradiation prolonged both the Gi and 02 phases
and later work utilising HeLa cells revealed this delay to be dose-dependent (Yamada
and Puck 1961). Such cell cycle delays are now thought to represent a co-ordinated
cellular response to radiation in order to prevent damaged cells from progressing
through the cell cycle. Investigations into 02 checkpoint delay utilising mutant cells of
Saccharomyces cerevisiae that are unable to arrest in response to irradiation revealed
that the observed cell cycle defect was also coupled to an increased radiosensitivity
(Weinert and Hartwell 1988; Weinert 1992; Weinert et a! 1994). The authors postulated
that cells contain checkpoints which arrest in response to DNA damage and that these
checkpoints exist to allow time for DNA repair.
22

1.2.3 ATM Function in Cell Cycle Checkpoints
ATM kinases are vital components of the pathway which controls DNA repair (Jeggo et
cii 1998) and the length of the 02 phase (Shackelford et a! 1999). Due to the lack of
functional ATM kinase in cells from AT patients, this group is a vital source for
enabling a thorough exploration of the role of ATM kinase in DNA repair and cell cycle
checkpoint processes. Investigations into the role of ATM in checkpoint function have
produced a range of apparently conflicting results. For example, some studies have
shown that AT cells fail to arrest at the 02 checkpoint after irradiation and progress
immediately into metaphase (Beamish et al 1996; Scott et cii I 994b; Zampetti-Bosseler
and Scott 1981), whilst other studies suggest a prolonged 02 arrest compared to normal
cells (Beamish et a! 1994; Beamish and Lavin 1994; Scott et cii 1994b). These
apparently opposing viewpoints may be explained by the existence of two distinct G2
arrest mechanisms (Xu et cii 2002). Utilising a variety of cell cycle assays the authors
demonstrated that a transient ATM-dependent checkpoint is activated shortly after
irradiation to prevent damaged cells, irradiated in the 02 stage of the cell cycle, from
progressing to metaphase. The second mechanism is measurable several hours after
irradiation and is represented by the accumulation of cells in 02 phase that were
irradiated in the S or G phase of the cell cycle. Crucially, this mechanism appears to be
ATM independent, hence the accumulation of both AT and normal cells irradiated in the
earlier stages of the cell cycle.
1.2.4 Measuring G2 Arrest
The total length of the 02 phase in irradiated lymphocytes and controls can be estimated
using a number of techniques such as [ 3H]TdR labelling (Pincheira eta! 1994; Pincheira
et a! 2001), fluorescence-activated cell-sorting (FACS) (Bates and Lavin 1989;
Herzenberg eta! 2002; Hong eta! 1994; Hues a! 2001; Hu eta! 2002) and 5-bromo 2'-
23

deoxyuridine (BrDU) incorporation (Palitti et cii 1999). 02 checkpoint delay has been
considered from a chromosomal radiosensitivity perspective using the mitotic index
(MI) as a measure of the proportion of cells reaching mitosis. Mitotic inhibition (Mm)
is calculated as the percentage reduction in the MI in irradiated cell cultures compared
to non-irradiated cultures. It is postulated that Mln could be used as a reliable indicator
of 02 checkpoint efficacy providing that MIn values are truly representative of mitotic
delay. Lymphocytes from 20 donors were used to investigate the presence of an X-ray
induced adaptive response, sensitivity to X-ray irradiation in 02 phase and 02
checkpoint response (Pretazzoli et al 2000). Checkpoint activation was tested at both
0.020y and 0.30y and was measured by MI (as a % of control) and labelling with
[31-I]TdR. One donor in particular consistently exhibited a strong reduction in MI in
combination with low breakage frequency. The reduction in MI may represent a longer
period of 02 delay allowing more time for the repair of damage and thus, fewer
aberrations are observed at metaphase. When the data for all twenty donors was
analysed an increase in chromatid breaks was associated with a decrease in mitotic
delay induced at 0.020y but not at 0.30y.
To evaluate the 02 checkpoint efficacy of cells with a known checkpoint defect, Mm
was used to determine the extent of cell cycle delay induced by X-ray irradiation in 02
phase in a selection of AT homozygotes, AT heterozygotes and a control population
(Scott et cii I 994b). The mean inhibition for control samples was calculated at 88.1%
compared to 44.2% in AT homozygotes whilst heterozygotes demonstrated similar
levels of inhibition (88.5%) to controls. These results suggest that AT cells, on average,
have lower levels of 02 checkpoint delay compared to normal healthy individuals
following radiation exposure in the 02 phase of the cell cycle. These findings were
consistent with earlier studies based upon MI measurements, all of which demonstrate
24
that irradiation in 02 results in less delay in AT cells than controls (Hansson et al 1984;
Mozdarani and Bryant 1989; Scott and Zampetti-Bosseler 1982). The group of Scott et
a! (2003) also calculated Mln in 129 breast cancer patients and 105 normal controls,
which were originally processed for the 02 assay (chromatid aberrations reported in
Scott et a! 1999). Inhibition in the breast cancer patients was significantly lower
compared to female controls (P = 0.009) suggesting decreased 02 checkpoint efficacy in
patients compared to female controls. The authors suggest that this reduction in MIn
may contribute to the enhanced chromosomal radiosensitivity of these patients, by
allowing less time for the repair of chromatid damage before it is fixed and viewed in
metaphase.
1.2.5 PCC (Premature Chromosome Condensation)
Chromatin condenses during the mitotic phase of the cell cycle in a highly ordered pre-
determined fashion. However, using molecular techniques, chromosome condensation
can be uncoupled from mitotic events and be induced prematurely in cells in the
interphase stage of the cell cycle. Originally, this was achieved by the deliberate fusion
of interphase cells to mitotic cells using Sendai virus (Johnson and Rao 1970), later
improved using polyethylene glycol (PEO)-mediated fusion (Pantelias and Maillie
1983), and can now be achieved by the addition of the phosphatase inhibitors calyculin
A or okadaic acid (Ootoh et a! 1995). PCC enables categorisation of each cell cycle
phase due to the visualisation of distinct morphologies: O phase chromosomes are
univalent, S phase cells are pulverised in appearance and 02 phase chromosomes are of
similar appearance to those in metaphase in that they contain bivalent condensed
chromosomes but can be distinguished due to the absence of a visible centromeric
region (Ootoh et al 1995; Hatzi eta! 2007; Hatzi eta! 2008; Terzoudi et a! 2005).
25

Early application of the PCC technique revealed that arrested 02 cells repair many of
their DNA breaks before mitosis (Hittelman and Rao 1974) indicating that one of the
purposes of 02 delay is to allow time for the repair of DNA damage. Therefore, the
efficacy of the 02 to metaphase checkpoint could influence the 02 radiosensitivity score
measured at metaphase. The PCC technique has recently been combined with a version
of the 02 radiosensitivity assay to investigate the role of the 02 checkpoint in the repair
of DNA double-strand breaks (DSBs), in normal and AT cells (Terzoudi et al 2005). In
this protocol the effect of complete checkpoint abrogation upon chromatid aberration
burden was directly measured by comparing aberration levels in both normal and AT
lymphocytes before and after 02 to mitosis transition. The key finding of this work was
that there was no discernable difference in the number of chromatid breaks scored
directly in artificially condensed 02 phase AT and normal cells prompting the authors to
suggest that DNA DSBs are repaired in AT and normal cells with similar kinetics, and
that the differences in frequencies of chromatid breaks in normal and AT cells is
primarily due to the 02 checkpoint difference. Analysis of normal cells at metaphase
revealed a two- to three-fold reduction in the number of breaks in comparison to 02
phase whilst AT cells did not exhibit any strong reduction in chromatid aberration level.
To confirm that normal cells exhibit a two- to three-fold reduction in chromatid damage
following checkpoint transition, the 02 checkpoint was artificially abolished using
caffeine, which acts as an ATM inhibitor. Following caffeine addition the number of
chromatid aberrations in metaphase in normal cells was similar to that observed in AT
cells. These investigations provided direct evidence that activation of the ATM-
dependent 02 checkpoint following irradiation is a key event in the reduction of
chromatid damage observed at metaphase. In addition to analysing chromatid damage,
this group calculated the ratio of cells in 02 to cells in 02 and metaphase in an attempt
to measure the level of 02 delay following irradiation. An increase in this ratio was
26

observed in normal and AT heterozygote cells whereas there was no change in this ratio
for AT homozygotes following irradiation. This was further proof that AT cells are
unable to undergo checkpoint activation in response to irradiation in G2 phase. This
laboratory has also used PCC methodology to evaluate the combined effects of radiation
and the potential mutagens hydroquinone (Hatzi et cii 2007) and glutaraldehyde (Hatzi
et al 2008) upon cell cycle progression and chromosomal radiosensitivity. These
studies suggest that the direct enumeration of each cell cycle phase is a promising
indicator of G2 checkpoint delay.
27

1.3 SCOPE AND AIMS OF THIS PROJECT
The Genetic Consequences of Cancer Treatment study is a multi-national collaboration
between research groups in the U.S.A, U.K., Denmark and Finland which utilise
epidemiology, molecular genetic techniques and cytogenetics. The objective is to
investigate whether preconception radiotherapy and chemotherapy received by children
and young adults contribute to adverse pregnancy outcomes (Boice et al 2003)
(http://www.gcct.org/) . Pilot studies using blood of Danish trios (cancer survivor,
partner and offspring) attempted to elucidate whether minisatellite mutations are
indicative of transmissible radiation-induced damage (Rees et al 2006) and if
chromosomal radiosensitivity is a marker of cancer predisposition (Curwen et a! 2005).
The initial pilot study using blood has now been extended to further samples received
from Danish families. This provided an opportunity to explore 02 chromosomal
radiosensitivity in relation to 02 checkpoint function.
In the first instance, development work to investigate the project viability using the PCC
technique was undertaken employing samples from WRI staff. Once the methodology
was fully developed, the technique was applied to a Danish population of 30 survivors
of childhood and young adulthood cancer. The aim of this study was to apply PCC
methodology in combination with the 02 radiosensitivity assay and to use this technique
to investigate cell cycle perturbation following irradiation in relation to the frequency of
chromatid aberrations observed at metaphase. Samples were cultured for the 02 and the
02 + PCC assay to determine the 02 radiosensitivity score and 02 checkpoint delay,
respectively. Any correlations between the two sets of data were investigated in the
hope of illuminating the relationship between 02 checkpoint control and 02
chromosomal radiosensitivity.
28

CHAPTER 2
VALIDATION OF THE PREMATURE
CHROMOSOME CONDENSATION
(PCC) TECHNIQUE
29

2.1 INTRODUCTION
Initial experiments were performed employing a group of healthy volunteers to ensure
that the technique described in the literature could be performed in the WRI laboratory
before commencing a study of cell cycle perturbation in cancer survivors (see Section
3). The initial goal was to observe chemically-induced PCC in peripheral blood
lymphocytes, to study chromosome morphology, assign cell cycle stage and to score
chromatid aberrations directly in 02 phase as achieved by Terzoudi et al (2005) and
Febrer et at (2008).
2.2 METHODS
2.2.1 Validation Study Population
Samples were taken from WRI staff willing to volunteer blood. One individual donated
blood on more than one occasion. All volunteers gave written informed consent before
a blood sample was taken (see Appendix A for copy of consent form) and blood
samples were coded to ensure anonymity. Slides made from these blood cultures were
further coded by a member of staff not directly involved in the study to prevent scorer
bias. As the majority of the volunteers also gave blood as part of the WRI 02 assay
validation study (Smart et at 2003) or the Danish Trio Pilot study (Curwen et at 2005)
the same coding system was adopted. In total seven donors participated, comprising of
four males and three females.
2.2.2 Sample Collection
All samples were collected at WRI by a principal genetic counsellor. Blood was drawn
into 5 ml lithium heparin vacutainers (BD Vacutainer Systems, Ref. 367684) and
allowed to stand overnight at room temperature.
30

2.2.3 Cell Culture
For each blood sample two 125 cm 3 culture flasks (VWR International Ltd, Catalogue
No. 734-0031) were set up. The day before culturing, the volume of RPMI- 1640
medium (Sigma®, Catalogue No. R8758) which was required for the particular sample
size was supplemented with 15% foetal calf serum (Invitrogen Corporation, Catalogue
No. 10099-133), 1% phytohaemagglutinin (M-form) (GibcoTM, supplied by Invitrogen
Corporation, Catalogue No. 10576-015) and 1% L-glutamine (Invitrogen Corporation,
Catalogue No. 25030-032). A single foetal calf serum batch (Lot. 495 5944s) was used
for all samples throughout the validation work and the Danish cancer survivor study.
The culture medium was placed in a 37°C, 5% CO2/95% air incubator and left overnight
to pre-warm and undergo gaseous exchange. For each culture flask, 1 ml of blood was
added to 9 ml of complete culture medium in a T25 cm 3 culture flask. All culture flasks
were mixed gently and then placed upright in the incubator with the caps loose. The
time of culture set up was then noted to keep to the strict timings required for this
procedure. After exactly 48 hours of culturing 7 ml of the spent medium was removed
using pre-warmed pipettes, taking care not to disrupt the cell layer. This medium was
replaced with 7 ml of fresh pre-warmed, pre-gassed medium and the flasks were mixed
by gentle inversion before been placed back into the incubator with the caps loose.
2.2.4 X-ray Irradiation
At 15 min prior to irradiation, flasks were gently mixed and placed in a 37°C portable
incubator and transported by car to the X-ray facility (Siefert), located on the Westlakes
Science Park in the Geoffrey Schofield Laboratories a short distance away
(approximately ¼ mile). The X-ray set was maintained by regular warm-up operations
and tested to ensure safety and the correct dose delivery. Before sample irradiation the
31
X-ray room was pre-wanned using a radiator and the set itself was warmed-up using a
pre-programmed procedure. After exactly 72 hours total culture time, the flasks were
either irradiated with 0.5 Gy 300kV X-rays or 'mock-irradiated' i.e. treated in an
identical manner to the irradiated culture flasks apart from receiving X-rays. The dose
received varied marginally between irradiated culture flasks with all exposures in the
range 0.49-0.51 Gy. The exact dose was recorded for each sample. 'Mock-irradiated'
control flasks were simultaneously removed and returned to the incubator with the
corresponding irradiated flasks, but were not irradiated. This 'mock-irradiation'
ensured identical treatment of both control and irradiated cultures. Each culture flask
was outside the portable incubator for the shortest period possible to minimise any drop
in temperature. Following irradiation, flasks were transported back to the laboratory
and placed back in the incubator. After a recovery period of exactly 30 mm, lOOpl of
pre-warmed KaryoMax colcemid ® (10 pgmU') (Invitrogen Corporation, Catalogue No.
15210-057) was added to the culture flasks, which were then mixed gently by inversion
and returned to the incubator. Colcemid enabled the collection and visualisation of
chromosome spreads at metaphase by blocking mitosis via inhibition of spindle
formation.
2.2.5 PCC Induction
The 02 assay was combined with PCC methodology in a protocol based on the study by
Terzoudi et al (2005) (see Figure 2.1). The protocol adopted for PCC induction
followed the methodology of the 02 assay with the exception that calyculin A (Sigma®,
Catalogue No. C5552-10UG) was added in addition to colcemid. Three time points for
the addition of calyculin A were tested to establish optimum conditions for PCC
induction, visualisation of chromatid damage and good discrimination between 02 and
metaphase spreads. At either 30 mm, 60 min or 75 min post-irradiation, 5i.il of

calyculin A (0.1 mM) was added to the culture flasks, which were then mixed and
returned to the incubator as before.
33

Blood Media Add Add I Harvest Culture Change 0.5Gycolcemid calyculin A Cells Setup (48hr)
72hrs 30mm ?
Figure 2.1: The protocol for evaluating PCC induction. PHA-stimulated peripheral
blood lymphocytes were cultured for 72 hours using standard techniques with a media
change at 48 hours. At 72 hours cultures were irradiated with 0.50y X-rays, colcemid
was added at 30 miii post-irradiation which was 1 hour prior to cell harvesting. The
time point of calyculin A addition was attempted at 3 time-points: 30 mm, 60 min and
75 min post-irradiation.
34

2.2.6 Cell Harvesting
Almost 90 min after irradiation, the contents of each culture flask were transferred to
centrifuge tubes (Barloworid Scientific Limited, Catalogue No. 144A5) before being
plunged into ice chippings at exactly 90 min post-irradiation. The tubes were left for 2-3
min to facilitate rapid cooling to approximately 0°C to prevent further DNA repair.
Tubes were then spun at 400 g in a pre-cooled centrifuge (0°C-4°C) for 5 mm.
Following centrifugation, the supernatant was aspirated within 1.5 ml of the pellet and
the cells were then vortexed before treatment with cold potassium chloride (KCI)
solution (VWR International Ltd, Catalogue No. 101984L) for 20 min with regular
inversion of tubes. After 5 min of centrifligation at 400 g cells were fixed slowly with a
mixture of methanol (VWR International Ltd, Catalogue No. 10158 613) and acetic acid
(VWR International Ltd, Catalogue No. 10001 CU) in the ratio 3:1, respectively. After a
further centrifugation and fix, cells were stored at -20°C. The following week, these
cell pellets were washed and fixed a further four times (six in total) and stored for a
minimum period of 24 hours before making slides.
2.2.7 Slide Preparation and Staining
SuperFrost® Slides (Scientific Laboratory Supplies, Catalogue No. M1C3024 and
M1C3022) were cleaned with methanol, washed briefly under tap water and plunged
into ice chippings for 30-60 min prior to preparing cell suspension. Meanwhile,
centrifuge tubes containing cell pellets and fixative were removed from the -20°C
freezer and left on the laboratory bench to equilibrate to room temperature for 30-60
mm. To prepare the cell suspension, fixed cells were centrifuged at 400 g for 5 mm.
After centrifugation, cells were re-fixed once as described in Section 2.2.6. The
supernatant was completely aspirated making sure not to remove any cellular material
and a further 0.5-1 ml of fresh fixative was added to create a milky suspension. Next,
40 gI of cell suspension was dropped from a height of approximately 30-50 cm onto
35

cold, wet slides which were immediately passed through a flame. This technique of
edge flaming was vital in producing evenly distributed chromosome spreads throughout
the slide, which also had good quality morphology. Low humidity had been shown
previously to adversely effect chromosome spreading and thus slides were often made
over a sink of steaming water, no slide making was attempted when the humidity of the
laboratory was below 40%, and the air conditioning was switched off. When dry, slides
were arranged in glass troughs and stained with Giemsa stain solution (improved R66),
(VWR International Ltd, Catalogue No. 350864X) diluted 1:19 with Gun ® buffer (1
tablet supplied by BDH Limited dissolved in 11 H20) and air-dried. Once completely
dry, slides were mounted by applying DPX mountant (VWR International Ltd,
Catalogue No. 360294H) onto coverslips (20 x 50mm) (VWR International Ltd,
Catalogue No. 631/0137) and firmly placing the slides on top ensuring air bubbles were
eradicated.
2.2.8 Microscopy
Prior to scoring, all slides were scanned using the Metasystems Metafer4 scanning
system which comprises a Zeiss Axioplan 2 imaging microscope with a Marzhauser
motorized scanning stage connected to Metafer 4.MSearch software (Metasystems,
Germany. www.metasystems.de ), (see Appendix B for photograph). This software and
microscope package enabled the user to search an entire slide, to record and
subsequently capture images of any cells which appeared to have 'metaphase-like'
morphology. For automated pinpointing of each metaphase, mounted and coded slides
were fixed into the microscope bays to allow for scanning at xlO magnification. This
automated system had a few key advantages over standard light microscopy. Slides
with low numbers of chromosome spreads could be identified immediately following
scanning and discarded in favour of superior slides or more slides could be made if

required. The speed of cytogenetic analysis was increased approximately two-fold
because thumbnail images of poor quality spreads could be discarded prior to scoring
and the user could move from cell to cell immediately with a mouse click instead of
manually scrolling through an entire slide.
To greatly improve the correct identification of cells that have visible chromosome
spreads, as opposed to intact cells or non-nuclear material, the image capturing
mechanism was trained using built-in software. This classifier training was used to set
parameters for future scans and make the scanning process more efficient. In brief, the
Metafer4 scanning system was used to capture a large number of images, which were
then used to define objects, in this case metaphase spreads. A number of slides were
scanned using a default classifier and a number of image fields were captured. At this
stage, the computer was not used to do any automated analysis to recognise metaphase
spreads. Instead, these training fields were reviewed manually. If a metaphase was
present, the field was marked as 'Positive' and a green circle was drawn around the
metaphase; everything not marked was recorded as 'Negative'. Objects that showed
some characteristics of metaphase but were incomplete metaphases or non-cellular
material such as 'dirt' were rejected by drawing a red circle around them. More than
600 metaphases from several slides were required to fully train the software and create a
fully functional classifier. A new classifier called 'G2 metaphases' was created and the
command 'Compute Classifier' was initiated. The computer was left overnight to
compute the classifier to complete the training. This new classifier was selected when
scanning all the Danish trio slides. Following training, the number and quality of
spreads identified increased greatly.
37

2.3 RESULTS
2.3.1 The Effect of Calyculin A upon Chromosome Morphology
The number, morphology and distribution of chromosome spreads varied substantially
between samples for a variety of reasons, which may include intrinsic cellular
characteristics, thickness of cell suspension used and slide making technique. Using the
definitions and photos provided by others (Febrer et a! 2008; (Jotoh et al 1995;
Terzoudi et al 2005; Hatzi et a! 2007; Hatzi et a! 2008) an attempt was made to
distinguish between cells in G, S, 02 and metaphase. Examples of the types of cell
morphology visualised are shown in Figures 2.2, 2.3, 2.4, 2.5 and 2.6. 01 phase cells
often take the form of a condensed metaphase-like shape containing univalent
chromosomes, whilst S phase cells take a 'pulverised' form and the chromosomes have
thick and thin sections to them (Gotoh et a!, 1995). 02 phase PCC cells contain bivalent
condensed chromosomes which are similar in shape to metaphase chromosomes.
However, the key difference is that the two sister chromatids have no visible
centromeric region conferring a distinctive morphology, easily distinguished from
metaphase spreads (Flatzi et a! 2007; Hatzi et a! 2008; Terzoudi et a! 2005).
38

Figure 2.2: Chromosome spread with characteristics of PCC-G1 phase. These cells
often take the form of a condensed metaphase-like shape containing 46 univalent
chromosomes. In this and subsequent figures in Chapter 2, the photographs are of cells
from the 7 different subjects used in the validation study population (n = 7).
39
r€ r4l. ihr.;..eTlff 4"j W'.'•s•' cc'
t# SW
•roil
t
C4 ' - I ' •'
1 a
rt42
• ,, •
4P; IC' • • r" #•
iw
Ae
•_• à- S
at
•tt\i. tH%i
ix- 'r6tj. ,, yr
6 4 1%
HI
'a
S..
C
.4 •0,,.'
;#
3 M r &r
C
Figure 2.4: Panels A-D are cells containing chromosome spreads with characteristics of
PCC-G2 phase. These cells contain bivalent condensed chromosomes. The two sister
chromatids have no visible centromeric region conferring a distinctive morphology,
easily distinguished from metaphase spreads. Panels A and B have clearly visible sister
chromatids. Panels C and D are PCC-G 2 cells containing tangled and overlapping
chromosomes. Panels A-D are typical of 7 such experiments using the validation study
population (n = 7).
41

t
Poo & 4D!f
at •0
S
r'
ic 0 tr
t
NZ
• 'Ita• 'Si
I
Figure 2.5: Chromosome spreads with characteristics of metaphase. These cells
contain bivalent condensed chromosomes with a visible centromeric region conferring a
distinctive morphology. Typical of 7 such experiments using the validation study
population (n = 7).
42

A
- - -t -
A#yTh2a*R°r
*.,, ait wiaoa 'a P G SaAMW
ø cC*Aa tflAWflS
flF
fl! sas*tzy -
I '-ayn çi
B
J%
-. -p -
A' flos: J'
C
<V
I
Figure 2.6: Miscellaneous chromosome spreads. Typical of 7 such experiments using
the validation study population (n = 7).
Panel A and B: Spreads contain more than 46 chromosomes, which are often smaller
than seen in other spreads. Panel C: Chromosome spread showing the typical features
of endoreduplication, a cell cycle defect found in cells released from 02 arrest in order
to undergo mitotic catastrophe. Chromosome duplication without mitotic cell division
results in multiple chromosomes. Panel U: Non-dividing Go cell.
43
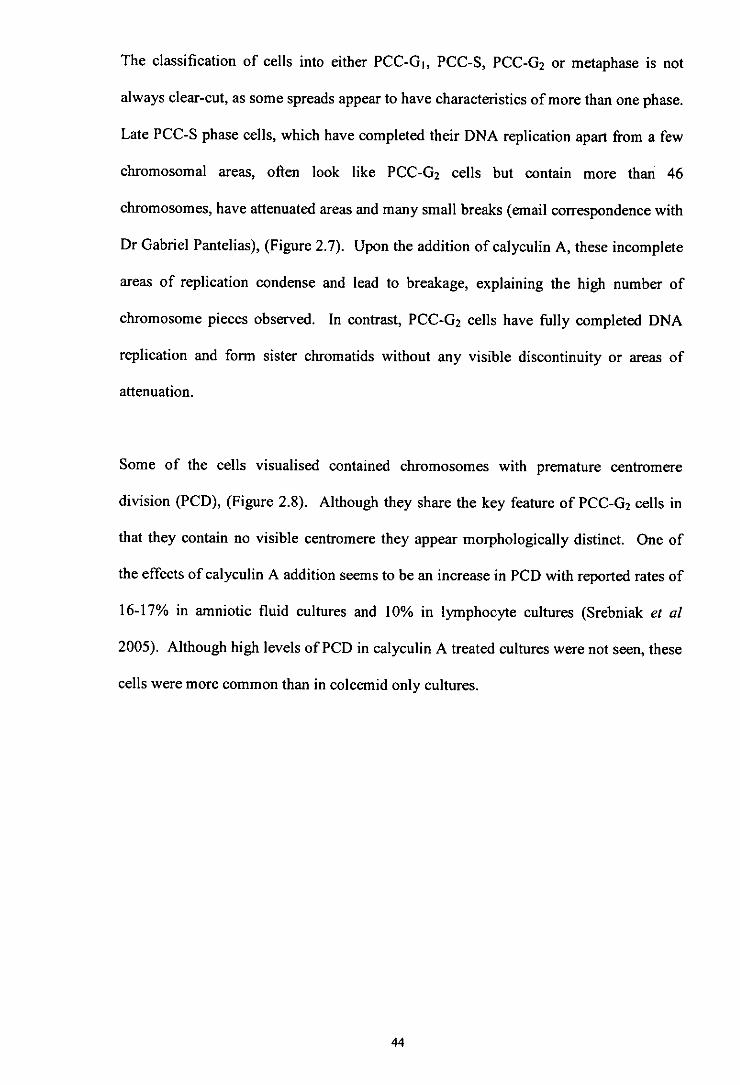
The classification of cells into either PCC-01, PCC-S, PCC-G2 or metaphase is not
always clear-cut, as some spreads appear to have characteristics of more than one phase.
Late PCC-S phase cells, which have completed their DNA replication apart from a few
chromosomal areas, often look like PCC-02 cells but contain more than 46
chromosomes, have attenuated areas and many small breaks (email correspondence with
Dr Gabriel Pantelias), (Figure 2.7). Upon the addition of calyculin A, these incomplete
areas of replication condense and lead to breakage, explaining the high number of
chromosome pieces observed. In contrast, PCC-G2 cells have thlly completed DNA
replication and form sister chromatids without any visible discontinuity or areas of
attenuation.
Some of the cells visualised contained chromosomes with premature centromere
division (PCD), (Figure 2.8). Although they share the key feature of PCC-G2 cells in
that they contain no visible centromere they appear morphologically distinct. One of
the effects of calyculin A addition seems to be an increase in PCD with reported rates of
16-17% in amniotic fluid cultures and 10% in lymphocyte cultures (Srebniak et al
2005). Although high levels of PCD in calyculin A treated cultures were not seen, these
cells were more common than in colcemid only cultures.
44
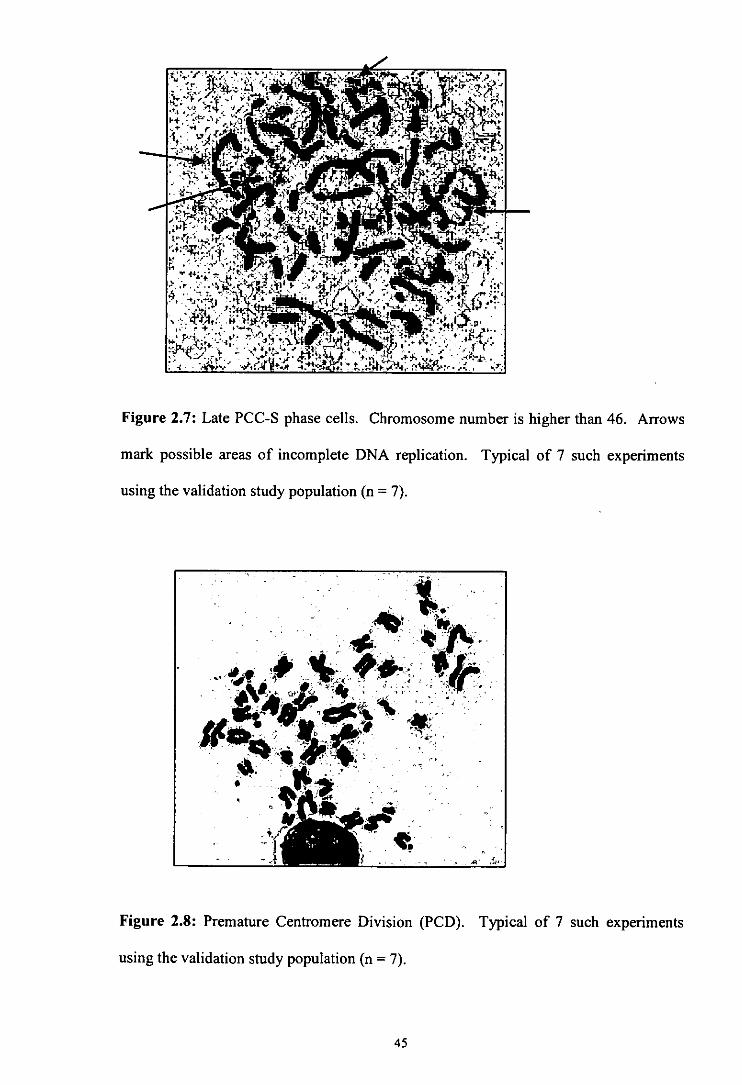
Figure 2.7: Late PCC-S phase cells. Chromosome number is higher than 46. Arrows
mark possible areas of incomplete DNA replication. Typical of 7 such experiments
using the validation study population (n = 7).
lb
-
its
Figure 2.8: Premature Centromere Division (PCD). Typical of 7 such experiments
using the validation study population (n = 7).
45

2.3.2 Differentiation of PCC-G 2 and Metaphase Cells
In initial attempts at differentiating between PCC-0 2 and metaphase, only cells with
well spread chromosomes were included to maintain integrity in the scoring procedure
(Figure 2.9). However, by leaving out many tight, unclear spreads which were most
likely PCC-02 cells there may have been a danger of underestimating the number of
cells in 02 phase in comparison to metaphase cells, which have, on the whole, an
unambiguous morphology. The cell cycle is a continuous process and some cells,
which are likely to be close to transition points, display characteristics of both S and 02
phase or both 02 and metaphase. Due to the presence of such cells in combination with
tight overlapping chromosomes, the classification of cell cycle stage was more difficult
than at first anticipated. Crucially, the definition of what comprised a PCC-0 2 phase
cell was decided upon before embarking on the Danish cancer survivor samples and
strict criteria were applied throughout that part of the study to both control and
irradiated cultures. Examples of cells included and excluded in analysis are shown in
Figures 2.10, 2.11 and 2.12.
46

lull
Ar
Figure 2.9: PCC-G2 cell from an unirradiated sample with good spreading, two clearly
visible sister chromatids and no visible centromerie region. Typical of 7 such
experiments using the validation study population (n = 7).
47

•4 4a&4 .. Ta '
-cv •-'
C_Qt6 ,s
- .c'r - -ir •t'df
-
('-\ '..j. • 6k
' ,•,a..r'
I.l. 410. • • \. --4'
'C It •. • _rd
- \ • 1
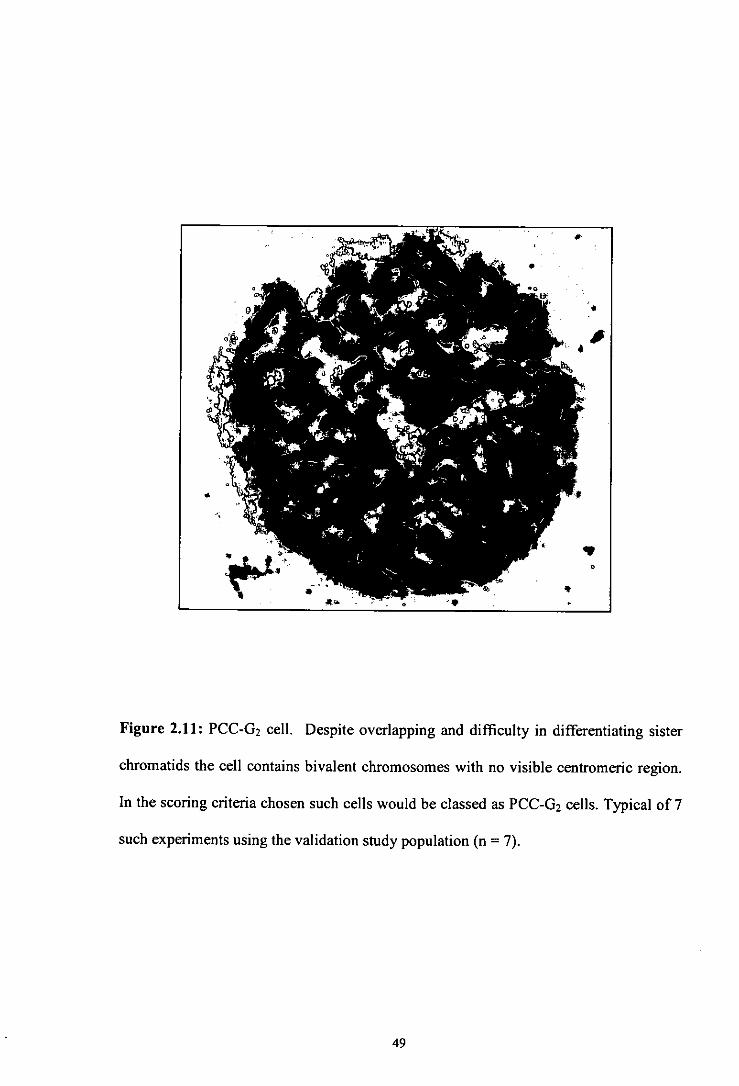
Figure 2.11: PCC-0 2 cell. Despite overlapping and difficulty in differentiating sister
chromatids the cell contains bivalent chromosomes with no visible centromeric region.
In the scoring criteria chosen such cells would be classed as PCC-G 2 cells. Typical of 7
such experiments using the validation study population (n = 7).
49
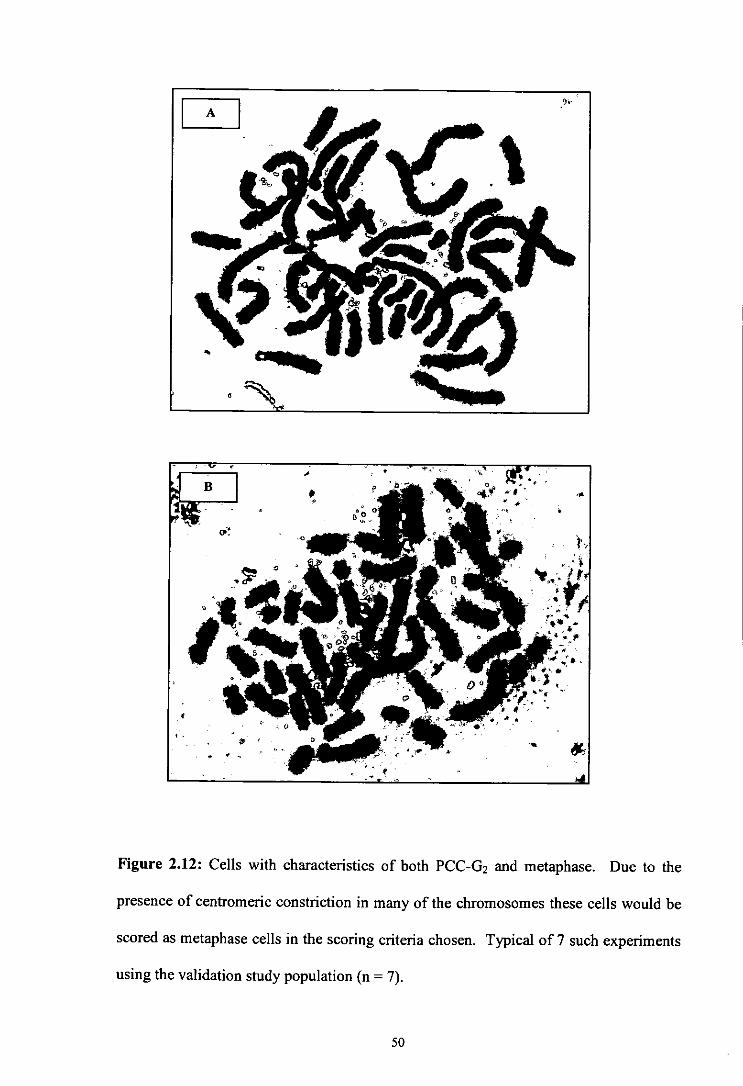
Figure 2.12: Cells with characteristics of both PCC-Ci 2 and metaphase. Due to the
presence of centromeric constriction in many of the chromosomes these cells would be
scored as metaphase cells in the scoring criteria chosen. Typical of 7 such experiments
using the validation study population (n = 7).
50

2.4 DISCUSSION
2.4.1 Timing of Calyculin A Incubation
Studies which have used the chemically-induced PCC technique in conjunction with the
02 chromosomal radiosensitivity assay have added calyculin A at either 60 mm (Febrer
et al 2008; Terzoudi et al 2005) or at 75 mm (Shovman et al 2008) post-irradiation.
This current study undertook a small number of experiments to assess three prospective
time points at 30 mm, 60 min and 75 min post-irradiation. Addition of calyculin A at
75 min post-irradiation failed to produce many discernible PCC-G2 cells in the slides
examined. The addition of calyculin A at 75 min post-irradiation i.e. 15 min pre-
harvest, has recently been combined with 02 assay methodology in an attempt to
improve the traditional colcemid-only assay (Shovman et a! 2008). The authors
describe a substantial decrease in cells with split centromeres in comparison with longer
calyculin A incubation times. In addition, the mitotic index was higher and thus, an
increase in scorable condensed chromosome figures was observed. However, to assess
the 02 checkpoint in the first few hours after irradiation it is vital that the assay
employed can distinguish mitotic cells from 02 cells (Xu et al 2002). For this study,
differences in centromeric constriction, as applied by Terzoudi et a! (2005), were used
to distinguish between metaphase and G2 cells. Based on the limited data, the 75 mm
post-irradiation time did not allow visualisation of such morphological differences and
therefore was not suitable for this specific project.
The addition of colcemid and calyculin A together at 30 min post-irradiation resulted in
the vast majority of cells resembling PCC-G2 spreads making a comparison of PCC-02
to metaphase ratio difficult. By delaying the addition of calyculin A for another 30 mm
and instead adding at 60 min post-irradiation, more 02 cells are allowed to pass into
metaphase before artificial condensation of the entire cell population. Therefore, the 60
51

min post-irradiation time enables visualisation of a substantial number of both PCC-G 2
and metaphase cells and thus, an accurate evaluation of any change in the ratio of PCC-
02 to metaphase cells can be calculated. In addition, the 60 minute post-irradiation
timing enabled visualisation of chromatid damage within a proportion of these
irradiated cells. In line with the protocol of other groups (Febrer et al 2008; Terzoudi et
al 2005) the 60 min post-irradiation timepoint was adopted.
2.4.2 Scoring Chromatid Aberrations in the G2 Phase of the Cell Cycle
One of the original aims was to score chromatid aberrations in PCC-G 2 cells.
Unfortunately, there was limited success. Few PCC-G 2 cells with good spreading in
combination with clear sister chromatids were observed which made scoring gaps and
breaks far more difficult than in cells routinely seen in metaphase. When scoring was
attempted extra care was taken when analysing PCC-G 2 cells. Only PCC-G 2 cells which
had good quality morphology comparable to metaphase cells were analysed (Figure
2.13). Chromatid aberrations were only recorded if visible as sharp breaks which were
almost certainly caused by X-irradiation rather than unclear areas of attenuation, faded
bands or scratches produced by coverslip damage, incomplete DNA replication or any
other disruption to cell morphology. By obtaining a digital image of individual cells
using a microscope mounted camera in conjunction with an image analysis software
package called Interactive KARy-Otyping System (IKAROS), (Metasystems,
Germany) and applying sharpening filters, it is possible to improve the visualisation of
damage. However, this is a time consuming process and the morphology must still be
of a reasonable standard. To maintain integrity, the analysis of manipulated images, as
opposed to the scoring of actual cell damage visualised using microscopy, should be
undertaken with caution.
52
A number of laboratories employing the PCC technique for the study of chromatid gaps
and breaks before the onset of mitosis have utilised cell lines or isolated lymphocytes
rather than peripheral blood cultures (Bryant et a! 2008; Gotoh et a! 1995; Gotoh eta!
1999; Hittelman and Rao 1974; Terzoudi et a! 2000; Terzoudi and Pantelias 1997;
Wang et a! 2006). However, there have been some recent successes in scoring
chromatid damage directly in (32 phase by adding calyculin A to peripheral blood
cultures (Febrer et a! 2008; Terzoudi et a! 2005). Further work would be useful to
assess the visualisation of damage in both cell lines and in blood cultured lymphocytes
to confirm which cell type allows accurate analysis.
53

•i. I:tV
Figure 2.13: Aberrations observed in a PCC-0 2 cell following 0.5Gy X-ray irradiation.
Red arrows show chromatid gaps and breaks. Typical of 7 such experiments using the
validation study population (n = 7).
0
S
54

2.5 CONCLUSIONS
The results have shown that the methodology implemented enabled chemically-induced
PCC to be observed in peripheral blood lymphocytes. PCC was investigated as a
technique for studying perturbation in the (32 cell cycle checkpoint in a group of healthy
volunteers. Unfortunately, direct analysis of chromatid aberrations in the 02 phase
proved unreliable. Following a number of failed attempts to visualise and accurately
score damage directly in PCC-0 2 cells the decision was taken to instead score the ratio
of cells in each cell cycle stage before and after irradiation. By calculating the ratio of
PCC-G2 cells versus PCC-0 2 + metaphase cells before and after the 02 to mitosis
transition point, it was possible to measure the extent of any radiation-induced 02
checkpoint delay. The next stage was to apply the PCC technique to a group of Danish
cancer survivors to assay radiation-induced G2/mitosis cell cycle perturbation and make
direct comparisons to 02 chromosomal radiosensitivity measured in metaphase.
14.1
CHAPTER 3
EXAMINING G2 CHROMOSOMAL RADIOSENSITIVITY AND CELL CYCLE PROGRESSION IN CHILDHOOD AND YOUNG ADULTHOOD CANCER SURVIVORS
56

3.1 INTRODUCTION
Following the establishment of optimum conditions for PCC induction in the WRI
laboratory and the determination of practical scoring criteria, the 02 assay and the 02 +
PCC assay were applied to survivors of childhood and young adulthood cancer. The
relationship between chromatid aberration frequency, as determined by the (32 assay,
and cell cycle perturbation, as determined by the 02 + PCC assay, was investigated.
The UCLan Faculty Ethics Committee was able to register as an approved Institutional
Review Board who reviewed and approved the overall project. In addition, ethical
permission was obtained in Denmark from the Danish Scientific Ethical Committee and
the Danish Data Protection Agency, as well as, the Westlakes Ethics Committee.
3.2 METHODS
3.2.1 The Cancer Survivor Group
Dr Jeanette Falck-Winther (Institute of Cancer Epidemiology, Danish Cancer Society,
Copenhagen, Denmark. http://www.cancer.dk/epi%20research/) was the co-ordinator
for family selection, sample collection and transport for the Danish blood studies
section of the Genetic Consequences of Cancer Treatment project (www.gcct.org ).
In Denmark, a national Central Population Register (CPR) was established in 1968
based upon a personal identification number for each citizen. This information can be
linked to population-based health registries including the Danish Cancer Registry, the
Danish Central Cytogenetic Registry, the Danish Medical Birth Registry and the
Abortion Registry. Dr Jeanette Falck-Winther used these databases to target a suitable
cohort of eligible survivors, spouses and offspring. Inclusion criteria required that
patients were alive on, or born after, April 1968 when the national Central Population
57

Register (CPR) was established, were diagnosed with cancer at age <35 years between
1943 and 2002, had survived until a fertile age of 15, had received moderate to high
doses of scattered radiation to the gonads, had live offspring and were treated at either
the Rigshospitalet (State Hospital) in Copenhagen or the Aarhus Kommunehospital
(Community Hospital) in Jutland. Dr Faick-Winther contacted eligible survivors by
letter to determine willing participants which produced a final study group of 30 Danish
survivors of cancer. Information on cancer in relatives, cancer type, medical treatment,
radiation exposure and aspects of lifestyle was obtained from a questionnaire and family
health portrait completed by each survivor (see Appendix C for copy of questionnaire).
To ensure anonymity each family was assigned a study number (T29 - T59) and the
blood samples were labelled accordingly before being sent to WRI. This study
continued the numbering system adopted for the pilot study of 28 Danish cancer trios
(cancer survivor, partner and offspring) labelled TI to T28 (Curwen et al 2005). Blood
samples from the partners and the offspring of the cancer survivors were also
transported to WRI along with the survivors, as part of the over-arching study into the
Genetic Consequences of Cancer Treatment (www.gcct.org ) but were not used in this
project.
3.2.2 Transport and Internal Assay Controls
To monitor any intra-sample variability and provide data on any transportation effect
two volunteers were sampled in Denmark on the same day as the family blood samples
were drawn and set-up in culture for the (32 chromosomal radiosensitivity assay. The
two volunteers were not related to the participating families and had no previous
incidence of cancer or radiation exposure. In addition, one volunteer acted as an
internal assay control and was sampled at WRI and cultured in parallel to the Danish
transport controls and the Danish trios for both the 02 chromosomal radiosensitivity
58

assay and the (i2 + PCC assay. Details of sample collection for all three control samples
are provided in Table 3.1.
3.2.3 Sampling and Transport
The WRI internal assay control, the two Danish transport controls, and the 30 cancer
survivors together with their families provided written informed consent before a blood
sample was taken (see Appendix A for copy of internal consent form and Appendix D
for copies of Danish consent form and information leaflet).
All Danish families and the two transport controls had peripheral blood drawn into
lithium-heparin vacutainers at the State Hospital, Rigshospitalet, Copenhagen or the
Skejby Hospital, Aarhus during the Monday of the sampling week. Blood was kept at
room temperature prior to being shipped to WRI via courier. The internal WRI control
was also sampled on the Monday of the sampling week and allowed to stand overnight
at room temperature. The inclusion of a piece of dental X-ray film with each shipment,
subsequently analysed by the Dosimetry Department at the Sellafield Nuclear
Reprocessing Plant, Cumbria, U.K., revealed no evidence of radiation exposure during
flight. All shipments were received by 8 am on Tuesday and cultures were set up in
family groups at two or three time-points (depending on shipment volume) throughout
the day to allow for manageable sample processing. Where possible, blood samples
were set up in culture within 24 hours, with some samples set up between 24 and 28
hours of being drawn. In total, 8 shipments containing 122 blood samples were
transported to WRI between June and December 2006. Due to one of the survivor
blood samples failing to culture the final analysed study group comprised a total of 29
cancer survivors. Details of the cancer survivor group are provided in Table 3.2.
59

a
U
Ct
en C
t
Ct
6 V
C
C
t
a
C
Ct
C
a
C
a
C
vi
.0 a
a
C)
t —
n
0
0
0.
. E
0
en
o
I—
cc in
0
0
0
'0
0
0
en
.2
'o
—
U
0
C
U
.2 0
C.
0
en 0
J '
'
Ct
Z
<N
'5 0
00
—
('4
I. •
t
t o
C
0
0
0
0

Table 3.2: Details of the cancer survivor group.
Cancer Survivor ID Shipment Sex Age Age
Date at sampling at diagnosis Cancer diagnosis
(years) (years) 2901 19/06106 M 41 26 Hodgkin's disease
3001 19/06/06 M 45 13 Hodgkin's disease
3101 26/06/06 F 47 17 Hodgkin's disease
3201 26/06/06 F 32 1 Neuroblastoma
3301 11/12/06 F 62 9 Non-Hodgkin's lymphoma
3401 03/07/06 F 41 8 Non-Hodgkin's lymphoma
3501 03/07/06 F 44 9 Non-Hodgkin's lymphoma
3601 03/07/06 M 46 17 Non-Hodgkin's lymphoma
3701 03/07/06 F 34 13 Hodgkin's disease
3801 03/07/06 F 41 15 Hodgkin's disease
3901 30/10/06 F 61 9 Non-Hodgkin's lymphoma
4001 30/10/06 M 43 9 Non-Hodgkin's lymphoma
4101 06/11/06 F 61 15 Hodgkin's disease
4201 06/11/06 M 48 27 Hodgkin's disease
4301 13/11/06 M 41 28 Hodgkin's disease
4401 06/11/06 M 56 17 Non-Hodgkin's lymphoma
4501 06/11/06 F 55 16 Non-Hodgkin's lymphoma
4601 06/11/06 F 32 3 Wilms' tumour
4701 13/11/06 M 43 30 Hodgkin's disease
4801 13/I 1/06 M 52 19 Hodgkin's disease
4901 13/11/06 M 47 28 Hodgkin's disease
5001 13/11/06 M 38 3 Hodgkin's disease
5101 13/1 1/06 M 60 10 Non-Hodgkin's lymphoma
5201 04/12/06 M 50 14 Hodgkin's disease
5301 04/12/06 M 68 32 Testis (seminoma)
5401 04/12/06 F 54 16 Hodgkin's disease
5501 04/12/06 M 61 24 Testis (teratoma)
5601 04/12/06 M 55 28 Testis (seminoma)
5701 11/12/06 M 58 30 Testis (teratoma)
5801 11/12/06 M 52 24 Testis (seminoma)
Mean 48.9± 1.74 17.0± 1.62
61

3.2.4 The 62 Chromosomal Radiosensitivity Assay
The assay described herein, was based upon the method described by Scott et al (1996).
Cell culture was carried out as described in Section 2.2.3 but with the following
changes: For each cancer survivor two culture flasks were set up and labelled as
assay irradiated' and 'G2 assay control'. For each culture flask 2 ml of blood was added
to 18 ml of culture medium and the flasks were placed in the 37°C CO2 incubator for 72
hours culture. After exactly 48 hours of culturing 15 ml of the spent medium was
removed using pre-warmed pipettes, and this medium was replaced with 15 ml of fresh
pre-warmed, pre-gassed medium. The flasks were mixed by gentle inversion before
been placed back into the incubator with the caps loose.
Samples were irradiated as described in Section 2.2.4. Following irradiation flasks were
transported back to the laboratory and placed back in the incubator. After a recovery
period of exactly 30 mm, 200 gI of pre-warmed KaryoMax colcemid ® was added to the
culture flasks, which were then mixed gently by inversion and returned to the incubator.
Cell harvesting and slide preparation and staining were carried out as detailed in
sections 2.2.6 and 2.2.7, respectively.
3.2.5 Scoring Metaphase Cells
Prior to any actual sample analysis, each microscope user scored the same 50 cells from
a sample collected for an earlier study. This scoring check ensured that the same
scoring criteria were applied throughout the study and eliminated any scorer bias. Two
Cytogeneticists, using either the Zeiss Axioplan 2 imaging microscope linked to image
analysis equipment or a conventional Nikon ° halogen microscope, scored 50 cells per
irradiated sample using different slides, giving a total of 100 scored cells. A Student t-
62

test was utilised to measure variation in the number of aberrations for each set of 50
cells scored per sample. This monitoring method revealed that any fluctuation between
analysts was non-significant (P = 0.86).
Upon identif'ing a metaphase, an assessment was made on whether the cell was suitable
for scoring. Cells were checked for reasonably well spread morphology and the absence
of scratches. Cells that were discarded contained obviously fewer than 46
chromosomes, had extremely compact morphology or contained many overlapping
chromosomes. For the remaining cells, all chromosome pieces were counted and
checked for one centromere per chromosome. If 46 chromosome pieces with only one
centromere per chromosome were present, these cells were marked as normal and
assessed for chromatid damage. Metafer 4.MSearch software was used to improve the
efficiency of the manual microscope analysis by calculating the co-ordinates of each
cell relevant to the user's microscope. Therefore, there was no need for the user to
manually scroll through the whole slide for good quality chromosome spreads, which
can be a time-consuming process.
3.2.6 Assessment of Chromatid Damage
Chromatid aberrations were scored using previously outlined criteria (ISCN, 1995) that
have been applied in a number of studies (Curwen ci -il 2005; Scott ci al 1996; Scott ci
al 1999; Smart ci al 2003). Chromatid gaps were defined as single aligned
discontinuities larger than the width of a chromatid and chromatid breaks were defined
as distinct dislocation and mis-alignment of the broken segments (Figure 3.1). For each
sample, the number of gaps and breaks were combined to produce a total chromatid
aberration yield. The other type of aberrations noted but not used to determine the G2
radiosensitivity score were chromosome gaps and breaks defined as a break through
63

both chromatid arms (Figure 3.2). Gaps which were smaller than the width of a
chromatid were also recorded but did not contribute to the overall aberration score.
There has was some conifision in the classification of 'gaps' and 'breaks' with different
laboratories using slightly different criteria. The scoring of chromatid aberrations was
discussed in detail at a 02 assay workshop in 2001 (Bryant ci al 2002). Although some
groups did score aberrations smaller than the width of a chsomatid, it was used as a
measure of radiosensitivity (Vral ci a! 2002). It is likely that all types of discontinuities
in a single chromatid arm were derived from DNA DSBs (Bryant 1984) and evidence
obtained from correlating chromatid aberrations with the comet assay suggests that
'small gaps' are indicative of DNA damage (Paz-y-Mino ci a! 2002). For this reason it
was likely that these 'small gaps' were biologically significant and some laboratories
believed that all visible discontinuities should compose the final 02 score (Bryant ci a!
2002). It was demonstrated that the results obtained when scoring with and without
small gaps were comparable although the variability was increased when gaps smaller
than the width of a chromatid were included (Adema ci a! 2003). The authors
speculated that the inclusion of small gaps might be less suitable for discriminating
between individuals with small differences in chromosomal radiosensitivity (Adema ci
a! 2003). The standard procedure at the WRI laboratory was to record data on 'small
gaps' but to only publish 02 scores which comprised of clearly defined breaks and gaps
larger than the width of a chromatid.
It was common practice for induced aberration yields to be calculated by subtracting the
number of chromatid breaks and gaps in control samples from those in the
corresponding irradiated sample. Following a review of current data on spontaneous
yields and data cited in many other studies, that laboratory at WRI stopped scoring
64

unirradiated samples. In control samples the number of chromatid aberrations was
usually low (0 - 4 per 100 cells) and did not correspond to the sensitivity of an
individual. This decision had substantially decreased the amount of time taken to
analyse the cohort. Control cultures were still processed and are available for scoring if
necessary.
All results were recorded on the 'G2 Radiosensitivity Score Sheet' (Appendix E) either
by hand or using the image analysis electronic form. On completion of sample analysis,
all score sheets were audited to ensure that all additions were correct.
65

Break
Gap
Gap
Small Gap Gap
Figure 3.1: Chromatid aberrations observed in metaphase following 0.5Gy X-ray
irradiation. The total aberration yield for this cell is four. (The small gap did not
contribute to the G2 radiosensitivity score). Typical of 29 such experiments using the
cancer survivor population (n = 29).
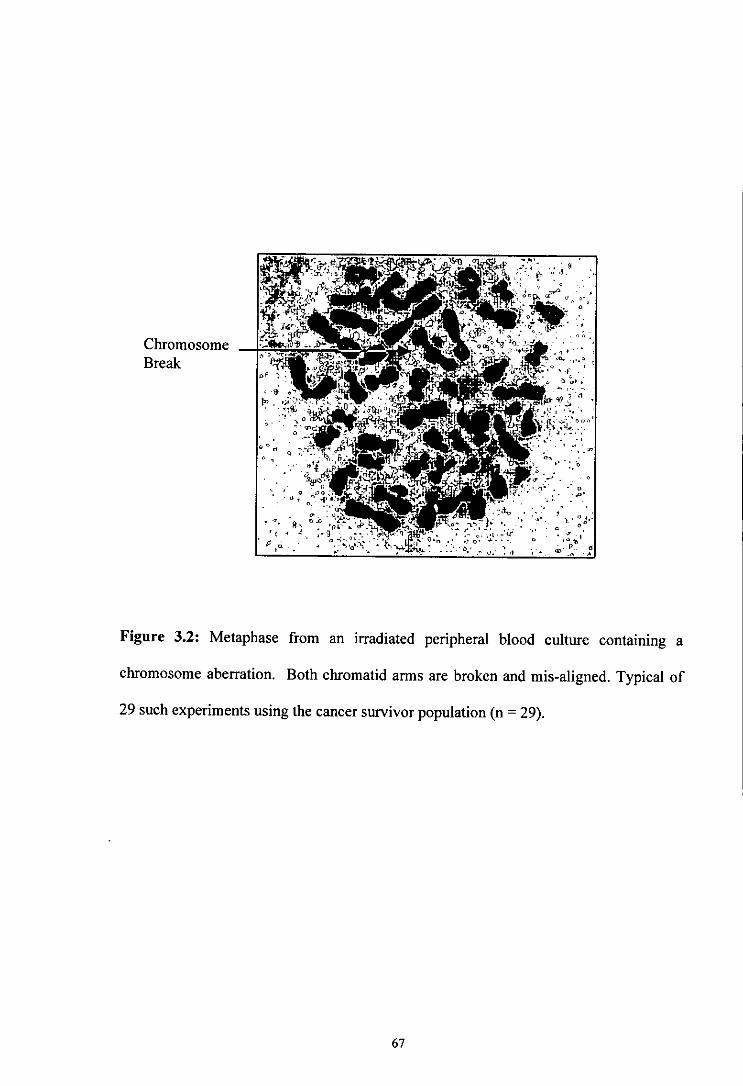
Chromosome Break
klf
•at :fl4naw ,: • ____
- -
•ø •, c;L1i. .-•
- -
;
4 4,
• --U-_____ 44 .tt - - - - 4
_.. 1
• .
"-- :.:: ô. • 4 0
Figure 3.2: Metaphase from an irradiated peripheral blood culture containing a
chromosome aberration. Both cluomatid arms are broken and mis-aligned. Typical of
29 such experiments using the cancer survivor population (n = 29).
67

3.2.7 The G2 + PCC Assay
The protocol adopted was a minor modification of the G2 chromosomal radiosensitivity
assay which differed only by the addition of calyculin A. For this reason it was referred
to as the G2 + FCC assay. For each of the 29 cancer survivors two culture flasks were
set up and labelled as 'G2 + FCC assay irradiated' and 'G2 + PCC assay control'. The
protocol followed was detailed in sections 2.2.3, 2.2.4, 2.2.5, 2.2.6 and 2.2.7. The
chosen time point for calyculin A addition was at 60 minutes post-irradiation (see
Section 2.3.3). A flow diagram in Figure 3.3 summarised the protocols for the G2 assay
and the G2 + PCC assay.
68

Peripheral blood from cancer
survivor in lithium-heparin tubes
G2 ASSAY
Control Irradiated
G
G2+PCC ASSAY
Control Irradiated
02+G2+
FCC FCC
2 x 2 ml blood in 18 ml RPMJ 2 x 1 ml blood in 9 ml RPMI
72hrs 4 72hrs 4 O.SGy
One culture flask
0.5Gy
irradiated I
G2 X-irradiation One culture flask I G2 + I FCC X-irradiation
'mock-irradiated' ______
4
4 Addition of colcemid
Addition of colcemid
4 Addition of calyculin A
60mm
3Omir
Chromatid aberration analysis Cell cycle analysis
S
}
'1 ~ @a -~ C I
'wi- G
Metaphase
a.
Figure 3.3: The procedure for the G2 assay and the G2 + PCC assay. n = 29 for cancer
patients and n = 3 for healthy controls.
69

3.2.8 Measuring G2 Checkpoint Delay
The automated image analysis machine was used to scan slides and pinpoint
chiomosome spreads. All detected spreads were analysed sequentially under a xl 00
lens. PCC-G2 cells, metaphase cells, PCC-G 1 phase cells, PCC-S phase cells and cells
of an unknown origin were marked on the score sheet but only the PCC-G 2 and
metaphase cells were used in the ratio calculation. For each sample, a combined total of
at least 500 PCC-G2 and metaphase cells were recorded and used to calculate the ratio
of PCC-G2 to metaphase cells before and after irradiation.
The effect of irradiation on G2 checkpoint delay (A) was assessed by calculating the
proportion of cells in G2 phase in irradiated cultures vs unirradiated cultures:
]Un Ir
I I A=
I I I-I
G2 +M G2 +M
Where 02 is the number of PCC-G 2 cells, M is the number of metaphase cells, Jr is the
proportion of PCC-G2 cells relative to metaphase cells in the irradiated culture and Un is
the proportion of PCC-G 2 cells relative to metaphase cells in the unirradiated culture.
In contrast to the scoring of chromatid aberrations, all chromosome pieces were not
counted, although it was still vital to check whether the cell appeared intact and had no
obvious loss of chromosomes. For each sample, the ratio was recorded and calculated
on an electronic form generated by the image analysis machine (see Appendix F). The
extent of 02 checkpoint delay was compared to the 02 chromosomal radiosensitivity
scores to examine any correlation. A strong correlation would suggest that cell cycle
70

delay, as measured by this technique, directly affects the level of chromatid aberrations
at metaphase.
3.2.9 Statistical Methods
The distributions of chromatid gaps and breaks amongst metaphase cells were analysed
for approximation to the Poisson distribution and standard errors were calculated taking
into account overdispersion as described by Savage (1970) and applied previously at
WRI (Smart et al 2003). The mean numbers of aberrations, the standard deviation,
variance and the ratio of variance to mean were calculated for each donor. A ratio of
variance to mean of one would be expected for a Poisson distribution which indicated
that every cell had an equal chance of developing an aberration. A value of greater than
one indicated that the distribution of aberrations in all samples was overdispersed.
Inter-individual and intra-individual variation in aberration frequencies were examined
by chi-squared (x2) analysis using the formula (2 = (O—E) 2/EZ) where 0 was the
observed value of aberrations, E was the expected value of aberrations and Z was the
overdispersion factor calculated as the average value of ratio of variance to mean. This
analysis was carried out using Microsoft® Excel and a P value was obtained using the
CHIDIST command =CHIDIST(SUM, DF), where SUM is the sum total of all chi-
squared values for the population and DF was the total degrees of freedom. Percentage
coefficients of variation (CV) were calculated by dividing the standard deviation by the
mean.
Standard errors were calculated by adjusting for overdispersion of chromatid-type
aberrations using the appropriate overdispersion factor. The standard error for the
cancer survivors was calculated according to the formula 'I(Total number of aberrations
x Z)/Total number of samples taken. For internal and transport controls, where repeat
71

sampling had occurred, any additional intra-individual variation introduced was also
compensated for. Standard errors for control samples were calculated according to the
formula 'J(Mean no. of aberrations per sample x Z x Y)/ Total number of samples
taken. Y was the sum of all the values of chi-squared divided by the total degrees of
freedom.
The Maim-Whitney U test was used to examine whether the probability distributions
were equal in the two sets of data. The null hypothesis that observations in one group
tend to be larger than observations in the other group was tested and a P value
generated. In this project, the Mann-Whitney U test was used to compare the data sets
for males and females and to examine differences in cancer types. Spearman's rank
correlation analysis was used to test the null hypothesis that there were no relationships
between data sets. Two columns of data were inputted into columns and ranked before
analysis. A correlation coefficient (R) which falls between +1 and -1 was calculated
which indicates the direction of correlation and its strength. An R value of -1 would
indicate a strong negative correlation and an R value of +1 would indicate a strong
positive correlation. A P value was then calculated to determine the significance level.
For this project, Spearman's rank correlation analysis was used to examine the
relationship between G2 chromosomal radiosensitivity and G2 checkpoint delay as
measured by the G2 + PCC assay, as well as any influence of age. All analyses were
performed using the Minitab statistical software package (www.minitab.cpp) andlor
Microsoft® Excel.
72

3.3 RESULTS
33.1 G2 Chromosomal Radiosensitivity in Internal Assay and Transport Controls
Table 3.3 displays the frequencies of radiation-induced chromatid aberrations for all
collected samples from the internal assay control and the two transport controls, in
addition to their corresponding coefficient of variation. The average ratio of variance to
mean for each control was 1.55 for the internal assay control, 1.78 for transport control
1 and 1.45 for transport control 2. These results indicate that the distribution of
aberrations in all the control samples is overdispersed. This result is consistent with the
pilot Danish trio study carried out at the WRI which gave a ratio of variance to mean
which was, on average, 1.5 (Smart et al 2003). To take into account any overdispersion
the expected values for the yields of chromatid gaps and breaks per 100 metaphases
were adjusted by a factor of 1.55, 1.78 and 1.45 for the internal assay control, transport
control I and transport control 2, respectively. The mean radiation-induced chromatid
aberration frequencies per 100 cells ± standard error were 113.57 ± 3.35, 131.29 ± 5.85
and 124.80 ± 7.47 for the internal assay control, transport control 1 and transport control
2, respectively. The coefficients of variation (CV) were calculated as 20.65%, 31.17%
and 29.94% for the internal assay control, transport control 1 and transport control 2,
respectively. Chi-squared analysis revealed statistically significant intra-individual
variation for the internal assay control ()?6 = 18.74, P = 0.005), transport control 1 (y3 =
42.95, P <0.001), and transport control 2 (x24 = 30.85, P <0.001).
73

I-
en
C
C
Ct
C
C
5-
en C
0
Ct
-C
S
E
U
C
V
Ct
0.
S.. V
C
) C
co U
ON
eq
C
en S.. C
C
C
C
C
C
C)
t
0
0.
en C
'C
C
Ct
Ct
en en co
Ct
E C)
C
C
en V
C
) C
C
)
a.
C
C
Ct
V
.0
Ct
'V
Ct
C
I- 'C
C
)
'O
V
C)
'C
C
C
-C
—
2 C
fi
en Q
—
C
t C
t C
) -C
CM
en
CM
C
-
en oc
tcI1 e'
In
1%Z
;t 00
2
tie'
2
—
en CM —
Ce
C.- 0
C
.9
00
.
.2
—
0
C)
cq
U
en 2'
Ct C
a0
C
.9
a
E
In
I
I en
* 0
2
0
C)
C
en *
I
C, en
'.0 en
CM N
CM
r4
In
C
.2
CM 0'
00 .9
—
en
C.- 0
C .2
C)
4) 0
C)
>
t
U
I-. -.
—
CM c
C
g
o
—
a
• U
I. —
4)
C
=
Ct C
0
en en
C) C)
a
CC
E
en C
C
o
C
t S
t
.5
N

33.2 The Relationship between C2 Checkpoint Delay and C2 Chromosomal
Radiosensitivity in the Internal Assay Control
This individual was sampled on seven occasions for the 02 assay and blood was
cultured for both the 02 assay and the 02 + PCC assay on four of those occasions. Even
though significant intra-individual variation was found for all seven samples, as shown
in Section 3.3.1, when the four samples cultured for both the 02 assay and the 02 + PCC
assay were analysed in isolation no significant intra-individual variation for 02
chromosomal radiosensitivity was revealed ( = 4.70, P = 0.195), although a CV of
14.67 was calculated. A scatter plot of the radiation-induced chromatid aberration
frequencies and the corresponding 02 checkpoint delay for the four samples is
illustrated in Figure 3.4. Although only four samples were taken a trend is suggested.
1-lowever, Spearman's rank correlation analysis revealed there was no significant
relationship between 02 checkpoint delay and radiation-induced chromatid aberrations
in this individual (r = -0.800, P = 0.200).
75

Table 3.4: The radiation-induced chromatid aberration frequencies and the
corresponding value of G2 checkpoint delay for the internal assay control.
Sample Aberration (%) G2 delay2 yield per (A) 100 cells
Spearman's rank
correlation P4
G2NN-1 132 -0.02
G2NN-2 126
0.16 14.67 -0.80 0.20
G2NN-7 111
0.14
G2NN-8 94 0.40
'Coefficient of variation for G 2 radiosensitivity, 'G 2 delay (A) was determined by subtracting the proportion of PCC-G 2 cells relative to metaphase cells in the unirradiated culture from the proportion in the irradiated culture, 3Correlation coefficient for G 2 delay, 4Significance level achieved when using Spearman's rank correlation analysis.
76

0.5
'C 0.4
I a Q. 0.1 U
0 C) N o -o.i a -
C C) I-
< -0.3
!ir 80 90 100 110 120 130 140
Radiation-induced chromatid aberrations per 100 cells
Figure 3.4: Correlation between G2 checkpoint delay (A), as measured by the G2 +
PCC assay, and chromatid aberration frequencies for the internal assay control. A is
calculated by subtracting the proportion of PCC-G2 cells relative to metaphase cells in
the unirradiated culture from the proportion in the irradiated culture.
77

3.3.3 The Relationship between G2 Chromosomal Radiosensitivity and G2
Checkpoint Delay in the Cancer Survivor Group.
Table 3.5 illustrates the radiation-induced chromatid aberration frequencies and the
corresponding level of G2 checkpoint delay for the cancer survivor group. The average
ratio of variance to mean for the cancer survivor samples was 1.73 indicating that the
distribution of aberrations in all the cancer survivors is overdispersed. The mean
aberration frequency was 137.21 ± 2.86 per 100 cells and a CV of 25.3% was
determined for inter-individual variability. In addition, chi-squared analysis revealed a
statistically significant difference between the samples at the 0.05 significance level
0X228 =142.09, P c 0.001). The distribution of the radiation-induced chromatid
aberration frequencies is in Figure 3.5.
A scatter plot of the radiation-induced chromatid aberration frequencies and the
corresponding G2 checkpoint delay for each sample is illustrated in Figure 3.6. No
significant relationship was observed between G2 checkpoint delay and chromatid
aberration frequency (r = -0.206, P = 0.284).
78

Table 3.5: Details of the cancer survivor group including radiation-induced 02
aberration frequencies and the corresponding level of 02 checkpoint delay.
Cancer Survivor
ID Sex
Age at sampling
(years) Cancer diagnosis
Aberration Yield per 100 cells
C2 delay
2901 M 41 Hodgkin's disease 147 -0.20
3001 M 45 Hodgkin's disease 102 -0.29
3101 F 47 Hodgkin's disease 153 -0.10
3201 F 32 Neuroblastoma 123 0.09
3301 F 62 Non-Hodgkin's lymphoma 123 0.33
3401 F 41 Non-Hodgkin's lymphoma 74 0.20
3501 F 44 Non-Hodgkin's lymphoma 110 0.32
3701 F 34 Hodgkin's disease 170 0.12
3801 F 41 Hodgkin's disease 142 0.06
3901 F 61 Non-Hodgkin's lymphoma 95 0.16
4001 M 43 Non-Hodgkin's lymphoma 172 -0.25
4101 F 61 Hodgkin's disease 114 -0.16
4201 M 48 Hodgkin's disease 135 -0.19
4301 M 41 Hodgkin's disease 127 0.08
4401 M 56 Non-Hodgkin's lymphoma 107 0.10
4501 F 55 Non-Hodgkin's lymphoma lOS -0.20
4601 F 32 Wilms' tumour 183 0.27
4701 M 43 Hodgkin's disease 98 0.32
4801 M 52 Hodgkin's disease 204 -0.05
4901 M 47 Hodgkin's disease 187 -0.08
5001 M 38 Hodgkin's disease 124 0.05
5101 M 60 Non-Hodgkin's lymphoma 180 -0.12
5201 M 50 Hodgkin's disease 206 0.32
5301 M 68 Testis (seminoma) 101 0.39
5401 F 54 Hodgkin's disease 133 -0.18
5501 M 61 Testis (teratoma) 113 0.06
5601 M 55 Testis (seminoma) 134 0.20
5701 M 58 Testis (teratoma) 165 0.04
5801 M 52 Testis (seminoma) 152 0.26
Median - 48 - 133 0.05
'G 2 delay (A) was determined by subtracting the proportion of PCC-G2 cells relative to metaphase cells in the unirradiated culture from the proportion in the irradiated culture.
79

en eli
:
C 9-
0 I- ) 2 ,0
5
4
Ed
0
50 60 70 80 90 100 110 120 130 140 150 160 170 180 190 200 210 220
Radiation-induced chromatid aberrations per 100 cells
Figure 3.5: Radiation-induced chromatid aberration frequencies in the cancer survivor
group. Mean level of chromatid aberrations = 137.21 ± 2.86 per 100 cells, n = 29.
80

03
0.4
.03
4- C 0
0.1 U V
0.0 N a 0
-0.4
40 60 80 100 120 140 160 180 200 220
Radiation-induced chromatid aberrations per 100 cells
Figure 3.6: Correlation between 02 checkpoint delay (A), as measured by the 02 +
PCC assay, and chromatid aberration frequencies in the cancer survivor group. A is
calculated by subtracting the proportion of PCC-G2 cells relative to .metaphase cells in
the unirradiated culture from the proportion in the irradiated culture, n = 29.
81

3.3.4 The Influence of Age, Gender and Cancer Type upon G2 Chromosomal
Radiosensitivity and 62 Checkpoint Delay
Spearman's rank correlation analysis revealed that there was no significant correlation
between 02 chromosomal radiosensitivity and age (r = -0.207, P = 0.282) and no
significant correlation between 02 checkpoint delay and age (r = 0.057, P = 0.767). A
scatter plot of the age of each survivor at sampling and the corresponding chromatid
aberration score is illustrated in Figure 3.7 and a scatter plot of the age of each survivor
and the corresponding G2 delay value is shown in Figure 3.8.
Comparison of data sets using Mann-Whitney U test revealed that there were no
significant differences between genders for either 02 chromosomal radiosensitivity (P =
0.241) or G2 checkpoint delay (P = 0.479) (Table 3.6). The distribution of radiation-
induced chromatid aberrations according to gender is illustrated in Figure 3.9. Figure
3.10 shows a scatter plot of the relationship between 02 chromosomal radiosensitivity
and 02 checkpoint delay according to gender.
Dividing the cancer type into two groups as follows: haematological (Hodgkin's/non-
Hodgkin's) versus other cancers (testis/wilms'/neuroblastoma) resulted in no significant
differences between the two groups for either G2 chromosomal radiosensitivity (P =
0.879) or 02 checkpoint delay (P = 0.067) when using the Mann-Whitney U test (Table
3.6). The distribution of radiation-induced chromatid aberrations according to cancer
type is illustrated in Figure 3.11. Figure 3.12 shows a scatter plot of the relationship
between 02 chromosomal radiosensitivity and 02 checkpoint delay according to cancer
type.
82

0
0
0
0
0
0
In
0
In
0
in
sjao
00
1 n
d su
ou
tnaq
P
!12
W0
R3
paaflpUi-U
OflE
ipflJ
0
tiC
C,
kn
cc
to
Pi 0
en
0
N
C'
to
to
ca
en N
C
C,
2
tin I- a
en 0
0
4.

0
N
S
C
o
It) cn
U
0
en
0
N
000
00
(v) Xjap T
U!O
d)paqa Zrj
U
'C
bO
C
C) C
t C
' .0
C
.0
11 U
-U
- U
o
-I
'U
E •o
• U
-c U
o C V
C
t U
bO
C
=
C,
C,
Ct
I-—
co
C)
Ct
U
•-' b
D U
C
t
U
U,
o
= .0
C
U
o -0
C
t I
0
C)
o n.,
00 C
r;
.9 C?
t
1_ o
z S 2
C,
00

I)
— N
00
0
d
d
0
C
0
00
N
N
00
r
r,
r,
R
oo en d
en en
en
00
C
N
N
00 N
O
\ —
00 N
0
0
0
9
tfl N
en
en IL
I
0
N
— —
0
o
o
0
N
d
a
0 E
I-. — v_
0
0
t
0
ci, ci,
00
C
t I-. 0
C
. .
9
i C
)
E rt.E
E
CtC
Q_
v
E •
-v to
1J 0
0O
J_
0
•t
0
•t
— '—
—
5: :9
C)
0
Ct
'0
E—
C
0)
C
C
C.
- o
C)
5-
C)
-C
0
0
C,
ç51
N
C
C)
It; 00

0)
V
0)
It
Cfl
N
-
0
0
N
N
0
N
0
0
N
0
C"
-
0)
0
00
Cc
N -
- I-
0)
0
'C
- C
0
In I-
Ct
at
. ..
- C
t
E o
C
C.)
0
N
C)
-
t
0
-
- C
0 t
- C
t
0
0
00
0
N
0
'.0
0
In
N
ft 2
C
en I-V
C
) C
C
t C
)
'0
00
SIE
flP1M
PU
! Jo iaq
wnj

0)
Ct
o
• .
J
0
00
0) C
) C
0
I- V
o
o.
CD
I
C
C) '0
V
C)
N
—
C
C
o
0
St
2 C
V
C)
C
Cd C
) V
C
I- V
C
0)
C
C
'C
I- C
C
)
Cd V
•0
C
C
C)
V
-c C)
N
C,
- N
C
Cd
U,
C
V
U,
C
I Cd
E C
U,
C
E 2 -C
C
)
N
C,
C
00000
dd
I I
I
(v) Aap julocljooqo t0

N
—
0
C)
00
0
0
SJE
flp!A
IpU
IJO
nq
urn
0
N
N
0
N
0
0
0< N
N
II
0
ON
0.
—
2 tAD
0
00
0
s-I
C
'-0 —
0
o
0
0
In
—
I- 0
—
V
—
C
Ct
0)
I rz
kn
00 00

0
N
N
0
0
N
0
\0
C)
C)
0
0
I-C)
C.
C
I - 0
Tn
I-
C)
C)
C
Cd
C)
C)
C
C)
C.
I-
C)
C)
C
cc C.)
0
C
0
C)
C)
Ct
Ct
C)
-C
C
S
p
a
0
C.
C.) C
) -c C
) r1
a 'C
C
Ct
en C
C
) en
I 0
00
0
0
S
VtcflN
.-0
Nm
0
00
00
0000
I I
I
Aap 2
uio
rnpoq3 Z
rj
I.- C
) C
) C
C-) I- C)
rol
-C
en C
0
Ct
C)
I-.
C)
-c F
—.
- II
C)
D. 0
- I-

3.4 DISCUSSION
3.4.1 G2 Chromosomal Radiosensitivity in Internal Assay and Transport Controls
Investigations into the effect of in vitro radiation exposure on cells from patients with
cancer prone syndromes suggested that elevated G2 chromosomal radiosensitivity is
associated with cancer predisposition (Bender ci al 1985; Parshad ci al 1983; Parshad ci
al 1993; Rary ci' al 1974; Sanford ci al 1987; Sanford et al 1989; Sanford ci a! 1990;
Shiloh ci a! 1989; Taylor ci al 1975; Taylor 1978). More recent studies have revealed
elevated levels of chromatid damage in a variety of cancer types in comparison to
healthy control groups (Baeyens ci al 2002; Baria ci a! 2001; Baria ci a! 2002; De
Ruyck ci a! 2008; Howe ci a! 2005b; Papworth ci a! 2001; Parshad cia/1 996; Riches ci
a! 2001; Scoff ci a! I 994a; Scoff ci a! 1999; Terzoudi et a! 2000). Regarding assessment
of cancer risk, the G2 chromosomal radiosensitivity assay has proved less useful in the
clinical setting due to considerable overlap between patients and normal individuals in
the vast majority of studies. This overlap, coupled to doubts regarding reproducibility
of repeat samples, signifies that it may not be useful in determining risk at the individual
level especially after only one blood sample (Vral ci a! 2002; Vral ci a! 2004).
However, providing that the inter-individual variation exceeds the intra—individual
variation, as shown by Scoff ci a! (1999), the G2 chromosomal radiosensitivity assay is
still useful for providing quantification of risk in population based studies.
It is widely recognised that the G2 chromosomal radiosensitivity assay is technically
exacting and requires validating before setting up in the laboratory. In the WRI
laboratory, G2 assay reproducibility of separate samples from the same donor was
confirmed and revealed that intra-individual variation was non-significant for seven out
of the nine healthy donors sampled (Smart ci a! 2003). However, x2 analysis revealed
statistically significant variation in two of the donors, although removal of the highest
90

02 score sampling point for each of these donors resulted in non-significant variation
(Smart et a! 2003). Similarly, in the 2005 Danish trio study that was undertaken at the
WRJ laboratory, the intra-individual variation in the internal assay control was found to
be non-significant and a CV of 13.56% was reported (Curwen et cii 2005). However,
when this individual was sampled a further seven times, as part of this project, an
increased CV of 20.65% was calculated for these seven samples which was confirmed
as statistically significant using / squared analysis. Moreover, results for the two
transport controls also showed statistically significant intra-individual variation.
Relatively stable intra-individual variation, with CVs in the range of 7 —10%, has been
reported by the PICR group in four separate studies (Baria et al 2001; Papworth et cii
2001; Roberts et a! 1999; Scoff et cii 1999), as well as in other laboratories (Riches et cii
2001). Validation of the technique at the Dublin Institute of Technology also revealed
reproducible G2 assay scores in three out of four healthy donors producing CVs between
4.61% and 5.1%. However, one donor had a CV of 22.9%, which was statistically
significant (Howe et a! 2005b). An investigation at Ohent University, Belgium, in
which two individuals gave blood on nine separate occasions over a period of one year
revealed that intra-individual variability was not significantly different from the inter-
individual variability (Vral et a! 2002) corroborating the findings of other studies
(Baeyens et cii 2002; Baria et cii 2002). In addition, an individual previously determined
to be radiosensitive using the 90th percentile cut-off gave radiosensitivity scores in the
normal range at two subsequent repeat sampling points. A follow-up study conducted
over a period of three years in which 14 donors were repeatedly sampled, revealed non-
significant variation in three out of the four donors that had multiple sampling (5 - 15
repeat samples) (Vral et a! 2004). This suggests that there is good reproducibility for
three out of four of these individuals.
91

Many laboratories have now reached the consensus that a single sample is insufficient
to ascertain the 02 chromosomal radiosensitivity of an individual and that multiple
blood sampling of the same individual may be required to make definitive conclusions
(Bryant et al 2002; Vral et al 2002; Vral et al 2004). Vral et al (2004) speculate that a
blood sample taken on a single occasion may not be reproducible because the ratio of
lymphocyte subsets may change with time and blood composition is influenced by
hormone levels, diet and immune status. Support for this comes from a number of in
vivo and in vitro studies which demonstrate that hormone levels influence
radiosensitivity (Kanda and Hayata 1999; Ricoul and Dutrillaux 1991; Ricoul et al
1997; Roberts et al 1997). In the WRI 2005 Danish trio study, it was suggested that the
significant intra-individual variation observed in the transport control was caused by
hormonal changes due to the donor becoming pregnant during the study (Curwen et a!
2005). Interestingly, analysis of the first five samples received pre-pregnancy revealed
no significant variation hinting at a hormonal effect due to pregnancy (Curwen et al
2005). This individual acted as transport control 1 in this study. Subsequent re-
sampling of transport control 1 for this current project, who was not pregnant at any
stage, revealed statistically significant variation between the seven samples indicating
that intra-individual variation is more likely to be an intrinsic characteristic of transport
control 1 and not linked to pregnancy.
There have been some suggestions that 02 score may be influenced by a transport effect
(Bryant et al 2002; Roberts et a! 1999; Scott et a! 1999). Although a transportation
effect cannot be completely discounted, the significant variability of the WRI internal
assay control, in which blood did not leave the laboratory, suggests that variability may
be an intrinsic characteristic of all three of the control donors used for this project.
Further support for the intrinsic nature of intra-individual variation in aberration yields
92

comes from studies which have investigated inter-experimental parameters. When
multiple cultures are set up from the same blood sample, high levels of assay
reproducibility have been observed at WRI (Smart et al 2003) and in other laboratories
(Vral et al 2002). Moreover, multiple sampling of an individual throughout a single day
has not revealed significant variation (Docherty et a! 2007). Thus, it seems unlikely that
experimental factors such as irradiation conditions, medium and minor timing
differences influence variability in chromatid aberration yields observed when an
individual is sampled on separate occasions. Although there is a paucity of available
data on individuals with multiple sampling, it is not always the case that when more
samples are taken the more likely it is that variation becomes significant. For example,
good reproducibility has been demonstrated in two separate donors following 13 (Smart
et a! 2003) and 15 samples (Vral et a! 2004).
As demonstrated in the majority of studies, significant intra-individual variability only
occurs in a proportion of donors (Smart a a! 2003; Yral et a! 2002; Vral et a! 2004).
Thus, providing the cohort consists of sufficient numbers then population-based assays
can still provide valuable information on the relationship between 02 radiosensitivity,
cancer predisposition and heritability of the G2 radiosensitivity phenotype. In addition,
02 radiosensitivity scores have been shown to correlate with gene expression level
(Sims a a! 2007) and adverse radiotherapy response (De Ruyck a a! 2005) which
demonstrates that the 02 radiosensitivity assay is reliable enough for comparison with
other endpoints. However, due to the high intra-individual variability observed in all
three control samples used in this study, the reproducibility of the 02 radiosensitivity
scores for each of the cancer survivors is open to conjecture.
93

3.4.2 The Relationship between G2 Checkpoint Delay and C2 Chromosomal
Radiosensitivity in the Internal Assay Control
Although only four samples were taken from the internal assay control there is a hint
that 02 to metaphase progression in response to radiation varies within an individual.
The suggested trend, although not statistically significant, indicates that an increase in
02 checkpoint delay correlates with a decrease in chromatid aberrations at metaphase.
This is an interesting finding and multiple sampling of a single individual could confirm
whether this was a statistical anomaly. It has been postulated that heterogeneity of cell
cycle progression rather than DNA repair capacity is responsible for the variation in 02
chromosomal radiosensitivity observed in normal individuals (Palitti et al 1999). These
limited data set of four samples provide some evidence for this hypothesis.
3.4.3 The Relationship between G2 Chromosomal Radiosensitivity and G2
Checkpoint Delay in the Cancer Survivor Group
It is known that cells have checkpoints which arrest in response to DNA damage and it
has been postulated that these checkpoints exist to allow time for DNA repair (Weinert
et al 1994). lonising radiation delivered in the 02 phase of the cell cycle can cause a
transient ATM-dependent cell cycle arrest which allows time for repair and prevents the
progression of damaged cells from 02 phase into mitosis (Xu et al 2002). Studies
employing radiation-induced MIn have revealed that the arrest in 02 is much less
pronounced in cells from patients with AT than in normal cells (Scott et a! 1 994b; Scott
and Zampetti-Bosseler 1982; Zampetti-Bosseler and Scott 1981). The hypothesis was
that a low MIn value represents a deficient checkpoint in which less time is allowed for
the repair of chromosome damage before the onset of mitosis and thus, higher
aberration yields would be observed at metaphase (Scoff et a! 2003; Terzoudi and
Pantelias 1997; Zampetti-Bosseler and Scoff 1981). More recent studies utilising PCC
94

methodology support this idea. The enumeration and classification of 02 and
metaphase cells following irradiation have revealed that a less efficient 02 checkpoint is
responsible for the enhanced G2 chromosomal radiosensitivity observed in AT cells
(Terzoudi et a! 2005) and in normal lymphocytes pre-treated with the benzene
metabolite hydroquinone (Hatzi et a! 2007). However, investigations of prostate cancer
(Howe a al 2005a) and BCRA 1 heterozygotes (Febrer a al 2008) have revealed that an
increase in G2 checkpoint delay is related to increased chromatid gaps and breaks at
metaphase. Heterozygous females (BRCAJj underwent significantly more delay in 02
than control females and yet had more chromatid damage at metaphase (Febrer et al
2008). The authors suggest that the increased levels of chromatid aberrations observed
in BRCA 1' females may be a result of reduced repair capability but they do not rule out
the possibility that the 02 checkpoint is less proficient despite the increase in 02 delay
observed. For example, a key finding of this work was that the number of chromatid
breaks observed directly in 02 did not differ between BRCA and BRCA' females but
the reduction of ehromatid damage following G2 to metaphase transition was 32-63% in
BRCA' females compared to only 13-28% in BRCA' females. The authors propose
that the reduction in damage from 02 to metaphase is a better endpoint for
differentiating between radiosensitive and non-radiosensitive groups rather than the
conventional 02 assay method of observing chromatid aberrations in metaphase which
show considerable overlap between patient and control populations in most studies.
Investigations into well characterised mutations in genes such as ATM and BRCA enable
a fully controlled examination of the role of 02 to metaphase transition in the reduction
of chromatid damage at metaphase. Although a 02 checkpoint defect has been clearly
detected in AT patients and linked to their inherent elevated radiosensitivity, less
substantial evidence exists for a relationship between 02 checkpoint delay and 02
95
chromosomal radiosensitivity in sporadic cancer patients. An increase in the extent of
MIn has been associated with a decrease in the amount of chromatid damage in a mixed
population of breast cancer patients and nonnal females following an acute dose of 0.5
Gy (Scott et al 2003). Moreover, this study revealed less 02 arrest in breast cancer
patients in comparison to healthy female controls suggesting a putative 02 checkpoint
defect which may contribute to the enhanced 02 chromosomal radiosensitivity seen in
approximately 40% of cases. However, the authors proposed that only a very small
proportion of radiosensitive patients may have a 02 checkpoint deficiency and conclude
that chromatid aberration frequency and the extent of mitotic inhibition may not be
causally related.
Prior to using PCC, an earlier study at WRI investigated the relationship between 02
checkpoint delay and 02 chromosomal radiosensitivity in survivors of early-onset
cancer, their spouses and offspring using mitotic inhibition (Curwen, PhD thesis 2007).
There was no significant correlation between 02 checkpoint delay and chromatid
aberration frequency. In the present project, chemically-induced PCC was applied to a
group of 29 childhood and young-adulthood cancer survivors in an attempt to
investigate any relationship between 02 checkpoint delay and 02 chromosomal
radiosensitivity. Again, there was no significant correlation between 02 checkpoint
delay and chromatid aberration frequency. Examination of alternative radiosensitivity
endpoints such as clonogenic survival have also demonstrated that defective 02
checkpoints, such as those found in BRCA] mutated cell lines, are not linked to
radiosensitivity (Xu et a! 2002). The exact causes of the large inter-individual variation
observed when using the 02 chromosomal radiosensitivity assay have not yet been
elucidated. Such variation may be a consequence of disparity between individuals in
the initial yield of chromatid aberrations, differences in DNA repair capacity, and
96
variation in cell cycle control during G2 to M transition, although other explanations and
influencing factors cannot be ruled out. For example, a recent study at the University of
St. Andrews provides evidence that inter-individual variation in chromatid break
frequency may result from differences in the level of topoisomerase Ilci expression
(Terry ci al 2008).
An unexpected finding in the Danish cancer survivor cohort, which was not observed in
the initial attempts at applying the PCC technique, was that a number of samples
displayed negative 02 checkpoint delay values indicating a greater proportion of
'metaphase-like' cells in the irradiated sample than in the control sample. A possible
explanation is that differentiating between 02 and metaphase cells based upon a lack of
centromeric constriction as seen in other studies (Febrer ei al 2008; Gotoh ci al 1995;
1-latzi ci al 2007; 1-latzi ci al 2008; Terzoudi ci al 2005) is an imperfect technique. A
shorter calyculin A incubation of 15 minutes has recently been used to improve the 02
assay by increasing the mitotic index of blood cultures whilst still resulting in a majority
of cells with clear centromeric constriction (Shovman el a! 2008). The authors
suggested that a proportion of cells with 'metaphase-like' morphology and centromeric
constriction are in fact cells in 02 phase which have been artificially condensed.
3.4.4 The Influence of Cancer Type on 62 Chromosomal Radiosensitivity and 62
Checkpoint Delay.
The effect of cancer type on G2 chromosomal radiosensitivity and 02 checkpoint delay
was not a key aim of this MSc project. Moreoyer, early-onset cancer accounts for less
than 2% of all cancers diagnosed in the U.K (Baria ci a! 2002) and thus, comparisons
between groups of patients with a specific type of early-onset cancer would have, in
practice, proved difficult. Nonetheless, for the purpose of analysis, cancer type was
97

divided into haematological (Hodgkin's/non-Hodgkin's) and other cancers
(testis/wilms'/neuroblastoma). As perhaps might be expected, no significant differences
between the two groups were observed for either 02 Chromosomal Radiosensitivity or
02 Checkpoint Delay.
The aim of the over-arching study into the genetic consequences of cancer treatment
was to investigate the contribution of radiotherapy and/or chemotherapy towards
adverse health outcomes in the offspring of survivors of cancer (www.gcct.org ). The
cancer survivors were primarily recruited based on the likelihood of high doses received
to the gonads, hence, the large proportion of Hodgkin's disease and Non-Hodgkin's
lymphoma patients in this study. These two malignancies both have a different
aetiology to breast, colorectal and lung cancer and crucially, are more likely to be
caused by defects other than DNA damage/repair or cell cycle checkpoint deficiency.
For example, Hodgkin's lymphoma is caused by a combination of infection with
Epstein-Barr Virus (Kapatai and Murray 2007), re-arrangement defects in the
immunological system (Mathas 2007) and genomic alterations (Weniger et al 2006).
Thus, it is possible that low-penetrance cancer predisposition genes, putatively manifest
in breast cancer patients as elevated 02 chromosomal radiosensitivity (Scott et al 1999)
or to a lesser extent decreased 02 delay (Scott et a! 2003), are not discernible in the
Danish cancer survivor cohort.
3.4.5 The Influence of Age and Gender upon 02 Chromosomal Radiosensitivity
and G2 Checkpoint Delay.
Radiation-induced MIn studies by the PICR group have revealed significant age and
gender influences. For example, Mln was shown to be significantly greater in female
than in male controls (Scott et a! 2003) and Mln has been shown to decrease with age
98
(Scott et al I 994b; Scoff et al 2003). Despite MIn declining with age, no relationship
between age and chromatid aberration frequency has been uncovered (Scott et al 1999).
Moreover, sex and/or age differences have not been observed when considering 02
chromosomal radiosensitivity in breast cancer in other laboratories (Baeyens eta! 2005;
Riches et a! 2001; Scott et a! 1999), other cancers (Baria et a! 2001; De Ruyck et al
2008; Sanford eta! 1996), common variable immune deficiency (Aghamohammadi et a!
2008) or in clinically normal donors (Borgmann et a! 2007; Cadwell a a! 2008;
Papworth eta! 2001). Interestingly, Docherty a a! (2007) found that G2 chromosomal
radiosensitivity decreased with age but only when chromatid gaps smaller than the
width of a chromatid were included in the analysis. When breaks (discontinuities larger
than the width of a chromatid) were considered alone, as is the case in many
laboratories, no significant correlation was observed (Docherty a a! 2007). The
influence of age has become apparent in head and neck cancer studies with patients in
the youngest age groups showing enhanced sensitivity over control groups (De Ruyck et
a! 2008; Papworth a a! 2001), although no significant correlation between age and
chromatid aberration frequency has been established (De Ruyck et a! 2008).
Environmental influences, such as smoking and alcohol, predominate in the older group
indicating a lower genetic component compared to the youngest patients. Hence, late-
onset cases had similar G2 scores to controls within the 45 and over age group
(Papworth eta! 2001). In this study of childhood and young-adulthood cancer survivors
no significant age or gender effects were found when comparing (12 checkpoint delay
between different sub-groups or when investigating the relationship between radiation-
induced G2 checkpoint delay and 02 chromatid aberration frequency.

3.4.6 Conclusion
In conclusion, the results of this study have shown that inter-individual variation in 02
chromosomal radiosensitivity is not driven by variation in 02 checkpoint delay, at least
in this group of cancer survivors. In addition, the results have demonstrated that age,
gender and cancer type have no significant influence upon either cell cycle delay or G2
chromosomal radiosensitivity.
3.4.7 Limitations
As applied in this study, the PCC technique appears to have a number of limitations
including difficulty in scoring damage directly in PCC-G2 cells, doubts over the
accuracy and validity of cell cycle categorisation and limitations due to intra-individual
variability in both 02 chromosomal radiosensitivity and G2 checkpoint delay. For these
reasons it was difficult to establish whether the PCC technique has provided useful
information on the impact of 02 to metaphase transition upon the levels of chromatid
damage observed in metaphase. However, other studies have shown that the PCC
technique can add considerable value to the G2 radiosensitivity assay with only a minor
change to the already established protocol (Febrer et al 2008; Shovman et a! 2008;
Terzoudi et al 2005).
In normal donors, an increased chromatid aberration frequency was associated with a
decrease in mitotic delay induced by 0.02 Gy but not when a dose of 0.3 Gy was used to
induce delay (Pretazzoli et a! 2000). The authors speculate that a saturation effect exists
at higher doses. Further evidence for a saturation effect at even higher doses is that the
extent of 02 delay is independent of dose in the range 1 - 10 Gy (Xu et a! 2002). One
possible explanation for the negative results of this study is that the X-ray dose
100

employed in the 02 chromosomal assay is too high to uncover subtle differences in 02
checkpoint delay.
3.4.8 Scope for Future Work
Further experiments could be used to obtain a dose response curve to pinpoint the dose
that provides best discrimination for uncovering a possible relationship between 02
chromosomal radiosensitivity and 02 checkpoint delay. Results from this study make it
difficult to ascertain whether the PCC technique has any advantages over MIn in
measuring the extent of 02 checkpoint delay. The technique of MIn can be carried out
quickly without any modification to the 02 assay and uses the same slides which are
used for chromatid aberration analysis making it less expensive and more efficient than
PCC analysis. In addition, it is possible to train the Metafer software to automatically
scan and score mitotic indices. It would be of interest to compare 02 checkpoint delay
values obtained using PCC with the conventional method of Mm. In this cohort, the
intra-individual variation was too variable to assign a definitive score of 02
chromosomal radiosensitivity on an individual basis and the same level of caution
should be applied when assigning a score of 02 checkpoint delay, especially after a
single sample. A well-controlled study on a small number of normal individuals with
repeated sampling for both G2 checkpoint delay and 02 chromosomal radiosensitivity
may be needed to tease out any causative relationship.
101

REFERENCES
Adema AD, Cloos J, Verheijen RH, Braakhuis BJ and Bryant PE (2003). Comparison
of bleomycin and radiation in the G2 assay of chromatid breaks. International Journal
of Radiation Biology 79, 655-661.
Aghamohammadi A, Moin M, Kouhi A, Mohagheghi MA, Shirazi A, Rezaei N,
Tavassoli 5, Esfahani M, Cheraghi T, Dastan J, Nersesian J and Ohaffari SR (2008).
Chromosomal radiosensitivity in patients with common variable immunodeficiency.
Immunobiology 213, 447-454.
Aurias A, Antoine JL, Assathiany R, Odievre M and Dutrillaux B (1985). Radiation
sensitivity of Blooms syndrome lymphocytes during S and G2 phases. Cancer Genetics
and Cytogenetics 16, 13 1-136.
Baeyens A, Thierens H, Claes K, Poppe B, Messiaen L, De Ridder L and Vral A (2002).
Chromosomal radiosensitivity in breast cancer patients with a known or putative genetic
predisposition. British Journal of Cancer 87, 1379-1385.
Baeyens A, Thierens H, Claes K, Poppe B, de Ridder L and Vral A (2004).
Chromosomal radiosensitivity in BRCA1 and BRCA2 mutation carriers. International
Journal of Radiation Biology 80, 745-756.
Baeyens A, Van Den Broecke R, Makar A, Thierens H, De Ridder L and Vral A (2005).
Chromosomal radiosensitivity in breast cancer patients: influence of age of onset of the
disease. Oncology Reports 13, 347-353.

Baria K, Warren C, Roberts SA, West CM and Scott D (2001). Chromosomal
radiosensitivity as a marker of predisposition to common cancers? British Journal of
Cancer 84, 892-896.
Baria K, Warren C, Eden OB, Roberts SA, West CM and Scott D (2002). Chromosomal
radiosensitivity in young cancer patients: possible evidence of genetic predisposition.
International Journal of Radiation Biology 78, 341-346.
Barwell J, Pangon L, Georgiou A, Kesterton I, Langman C, Arden-Jones A, Bancroft E,
Salmon A, Locke I, Kote-Jarai Z, Morris JR, Solomon E, Berg J, Docherty Z,
Camplejoim R, Eeles R and Hodgson SV (2007). Lymphocyte radiosensitivity in
BRCAI and BRCA2 mutation carriers and implications for breast cancer susceptibility.
International Journal of Cancer 121, 1631-1636.
Bates PR and Lavin MF (1989). Comparison of gamma-radiation-induced accumulation
of ataxia telangiectasia and control cells in G2 phase. Mutation Research 218, 165-170.
Beamish H, Khanna KK and Lavin MF (1994). Ionizing radiation and cell cycle
progression in ataxia telangiectasia. Radiation Research 138, S 130-133.
Beamish H and Lavin MF (1994). Radiosensitivity in ataxia-telangiectasia: anomalies in
radiation-induced cell cycle delay. International Journal of Radiation Biology 65, 175-
184.
103

Beamish I-I, Williams R, Chen P and Lavin MF (1996). Defect in multiple cell cycle
checkpoints in ataxia-telangiectasia postirradiation. Journal of Biological Chemistry
271, 20486-20493.
Bender MA, Rary TM and Kale RP (1985). G2 chromosomal radiosensitivity in ataxia
telangiectasia lymphocytes. Mutation Research 152, 39-47.
Bigelow SB, Rary JM and Bender MA (1979). G2 chromosomal radiosensitivity in
Fanconi's anemia. Mutation Research 63, 189-199.
Boice JD, Jr., Tawn EJ, Winther JF, Donaldson SS, Green DM, Mertens AC, Mulvihill
JJ, Olsen JH, Robison LL and Stovall M (2003). Genetic effects of radiotherapy for
childhood cancer. Health Physics 85, 65-80.
Borgmann K, Haeberle D, Doerk T, Busjahn A, Stephan 0 and Dikomey E (2007).
Genetic determination of chromosomal radiosensitivities in GO- and G2-phase human
lymphocytes. Radiotherapy and Oncology 83, 196-202.
Bryant PE (1984). Enzymatic restriction of mammalian cell DNA using Pvu II and Bam
HI: evidence for the double-strand break origin of chromosomal aberrations.
International Journal of Radiation Biology & Related Studies in Physics, Chemistry &
Medicine 46, 5 7-65.
Bryant PE, Gray L, Riches AC, Steel CM, Finnon P, Howe 0, Kesterton I, Vral A,
Curwen GB, Smart V, lawn EJ and Whitehouse CA (2002). The 02 chromosomal
radiosensitivity assay. International Journal of Radiation Biology 78, 863-866.
104

Bryant PE, Mozdarani H and Man C (2008). G2-phase chromatid break kinetics in
irradiated DNA repair mutant hamster cell lines using calyculin-induced PCC and
colcemid-block. Mutation Research 657, 8-12.
Cadwell KK, Whitehouse CA, Tarone RE and Janet lawn E (2008). Comparison of in
vivo translocation frequencies with in vitro G2 radiosensitivity in radiation workers
occupationally exposed to external radiation. Journal of Radiological Protection 28,
101-106.
Cannon-Albright LA, Skolnick MH, Bishop Dl, Lee RG and Burt RW (1988).
Common inheritance of susceptibility to colonic adenomatous polyps and associated
colorectal cancers. New England Journal of Medicine 319, 533-537.
Carney JP (1999). Chromosomal breakage syndromes. Current Opinion in Immunology
11,443-447.
Carniol PJ and Fried MP (1982). Head and neck carcinoma in patients under 40 years of
age. Annals of Otology Rhinology andLaryngology 91, 152-155.
Chun HH and Gatti RA (2004). Ataxia-telangiectasia, an evolving phenotype. DNA
Repair (Amst) 3, 1187-1196.
Curwen GB, Winther JF, Tawn EJ, Smart V, Whitehouse CA, Rees OS, Olsen JH,
Guldberg P, Rechnitzer C, Schroder H, Bryant PE, Sheng X, Lee HS, Chakraborty R
and Boice JD (2005). 0(2) chromosomal radiosensitivity in Danish survivors of
105

childhood and adolescent cancer and their offspring. British Journal of Cancer 93,
1038-1045.
Curwen GB (2007). G2 chromosomal radiosensitivity in childhood and adolescent
cancer survivors and their offspring. Ph.D. University of St. Andrews, Scotland.
Darroudi F, Vyas RC, Vermeulen S and Natarajan AT (1995). G2 radiosensitivity of
cells derived from cancer-prone individuals. Mutation Research 328, 83-90.
De Ruyck K, Van Eijkeren M, Claes K, Morthier R, De Paepe A, Vral A, De Ridder L
and Thierens H (2005). Radiation-induced damage to normaltissues after radiotherapy
in patients treated for gynecologic tumors: association with single nucleotide
polymorphisms in XRCCI, XRCC3, and OGG1 genes and in vitro chromosomal
radiosensitivity in lymphocytes. International Journal of Radiation
Oncology *Biology *Physics 62, 1140-1149.
De Ruyck K, de Gelder V, Van Eijkeren M, Boterberg T, De Neve W, Vral A and
Thierens H (2008). Chromosomal radiosensitivity in head and neck cancer patients:
evidence for genetic predisposition? British Journal of Cancer 98, 1723-1738.
Decroix Y and Ghossein NA (1981). Experience of the Curie Institute in treatment of
cancer of the mobile tongue: I. Treatment policies and result. Cancer 47, 496-502.
Docherty Z, Georgiou A, Langman C, Kesterton I, Rose S, Camplejohn R, Ball J,
Barwell J, Gilchz-ist R, Pangon L, Berg J and Hodgson S (2007). Is chromosome
106

radiosensitivity and apoptotic response to irradiation correlated with cancer
susceptibility? International Journal of Radiation Biology 83, 1-12.
Easton DF (1994). Cancer risks in A-T heterozygotes. International Journal of
Radiation Biology 66, SI 77-182.
Febrer E, Mestres M, Caballin MR, Barrios L, Ribas M, Gutierrez-Enriquez 5, Alonso
C, Ramon y Cajal T and Francesc Barquinero J (2008). Mitotic delay in lymphocytes
from BRCA1 heterozygotes unable to reduce the radiation-induced chromosomal
damage. DNA Repair (Amst) 7, 1907-1911.
Futaki M and Liu JM (2001). Chromosomal breakage syndromes and the BRCA1
genome surveillance complex. Trends in Molecular Medicine 7, 560-565.
Gotoff SP, Amirmokri E and Liebner EJ (1967). Ataxia telangiectasia. Neoplasia,
untoward response to x-irradiation, and tuberous sclerosis. American Journal of
Diseases of Children 114, 617-625.
Gotoh E, Asakawa Y and Kosaka H (1995). Inhibition of Protein-Serine Threonine
Phosphatases Directly Induces Premature Chromosome Condensation in Mammalian
Somatic-Cells. Biomedical Research-Tokyo 16, 63-68.
Gotoh E, Kawata T and Durante M (1999). Chromatid break rejoining and exchange
aberration formation following gamma-ray exposure: analysis in G2 human fibroblasts
by chemically induced premature chromosome condensation. International Journal of
Radiation Biology 75, 1129-1135.
11116

Hatzi VI, Terzoudi GI, Pantelias GE, Spiliopoulou C and Makropoulos V (2007). The
benzene metabolite hydroquinone enhances G2-chromosomal radiosensitivity by
inducing a less-efficient G2-M-checkpoint in irradiated lymphocytes. International
Journal of Oncology 31, 145-152.
Hatzi VI, Terzoudi GI, Makropoulos V, Maravelias C and Pantelias GE (2008). Pre-
irradiation exposure of peripheral blood lymphocytes to glutaraldehyde induces
radiosensitization by increasing the initial yield of radiation-induced chromosomal
aberrations. Mutagenesis 23, 101-109.
Hansson K, Natarajan AT and Kihlman BA (1984). Effect of caffeine in G2 on X-ray-
induced chromosomal aberrations and mitotic inhibition in ataxia telangiectasia
fibroblast and lymphoblastoid cells. Human Genetics 67, 329-335.
Herzenberg LA, Parks D, Sahaf B, Perez 0 and Roederer M (2002). The history and
future of the fluorescence activated cell sorter and flow cytometry: a view from
Stanford. Clinical Chemistry 48, 1819-1827.
Higurashi M and Conen PE (1973). In vitro chromosomal radiosensitivity in
"chromosomal breakage syndromes". Cancer 32, 380-383.
Hittelman WN and Rao PN (1974). Premature chromosome condensation. I.
Visualization of x-ray-induced chromosome damage in interphase cells. Mutation
Research 23, 25 1-258.
108

Hong JH, Gatti RA, Huo YK, Chiang CS and McBride WH (1994). G2IM-phase arrest
and release in ataxia telangiectasia and normal cells after exposure to ionizing radiation.
Radiation Research 140, 17-23.
Howard A and PeIc SR (1953). Synthesis of desoxyribonucleic acid in normal and
irradiated cells and its relation to chromosome breakage. Hereditary Suppt 6, 261.
Howe 0, O'Malley K, Lavin M, Gardner RA, Seymour C, Lyng F, Mulvin D, Quinlan
DM and Mothersill C (2005a). Cell death mechanisms associated with G2
radiosensitivity in patients with prostate cancer and benign prostatic hyperplasia.
Radiation Research 164, 627-634.
Howe OL, Daly PA, Seymour C, Ormiston W, Nolan C and Mothersill C (2005b).
Elevated G2 chromosomal radiosensitivity in Irish breast cancer patients: a comparison
with other studies. International Journal of Radiation Biology 81, 373-378.
Howell RT and Taylor AMR (1992). In Human Cytogenetics. A Practical Approach
(Eds, Rooney, D. E. and Czepulkowski, B. H.). Oxford University Press, pp. 204-234.
Hu JJ, Smith TR, Miller MS, Mohrenweiser HW, Golden A and Case LD (2001).
Amino acid substitution variants of APE! and XRCC1 genes associated with ionizing
radiation sensitivity. Carcinogenesis 22, 917-922.
Hu JJ, Smith TR, Miller MS, Lohman K and Case LD (2002). Genetic regulation of
ionizing radiation sensitivity and breast cancer risk. Environmental and Molecular
Mutagenesis 39, 208-2 15.
109
ICRP (1998). Genetic susceptibility to cancer. Vol 28, No 1/2: Publication 79, ed J
Valentin (Pergamon)
ISCN (1995). An International System for Human Cytogenetic Nomenclature ed F
Mitelman (Basel, Switzerland: Karger). Recommendations of the International Standing
Committee on Human Cytogenetic Nomenclature, Memphis, Tenn., October 1994
Jeggo PA, Car AM and Lehmami AR (1998). Splitting the ATM: distinct repair and
checkpoint defects in ataxia-telangiectasia. Trends in Genetics 14, 312-316.
Johnson RT and Rao PN (1970). Mammalian cell fusion: induction of premature
chromosome condensation in interphase nuclei. Nature 226, 717-722.
Kanda R and Hayata I (1999). Effect of estradiol on radiation-induced chromosome
aberrations in human lymphocytes. Journal of Radiation Research (Tokyo) 40, 95-100.
Kapatai G and Murray P (2007). Contribution of the Epstein Barr virus to the molecular
pathogenesis of Hodgkin lymphoma. Journal of Clinical Pathology 60, 1342-1349.
Kuhn EM (1980). Effects of X-irradiation in Gl and 02 on Bloom's Syndrome and
normal chromosomes. Human Genetics 54, 335-341.
Lichtenstein P, Hoim NV, Verkasalo PK, Iliadou A, Kaprio J, Koskenvuo M, Pukkala
E, Skytthe A and Hemminki K (2000). Environmental and heritable factors in the

causation of cancer--analyses of cohorts of twins from Sweden, Denmark, and Finland.
New England Journal of Medicine 343, 78-85.
Mathas S (2007). The pathogenesis of classical Hodgkin's lymphoma: a model for B-
cell plasticity. Hematology/Oncology Clinics of North America 21, 787-804
Meijers-Heijboer H, van den Ouweland A, Klijn J, Wasielewski M, de Snoo A,
Oldenburg R, Hollestelle A, Houben M, Crepin E, van Veghel-Plandsoen M, Elstrodt F,
van Duijn C, Bartels C, Meijers C, Schutte M, McGuffog L, Thompson D, Easton D,
Sodha N, Seal 5, Barfoot R, Mangion J, Chang-Claude J, Eccles D, Eeles R, Evans DG,
Houlston R, Murday V, Narod 5, Peretz T, Peto J, Phelan C, Zhang HX, Szabo C,
Devilee P, Goldgar D, Futreal PA, Nathanson KL, Weber B, Rahman N and Stratton
MR (2002). Low-penetrance susceptibility to breast cancer due to CHEK2(*)1 lOOdeIC
in noncarriers of BRCAI or BRCA2 mutations. Nature Genetics 31, 55-59.
Morgan JL, 1-lolcomb TM and Morrissey RW (1968). Radiation reaction in ataxia
telangiectasia. American Journal of Diseases of Children 116, 557-558.
Mottram JC, Scoff GM and Russ S (1926). Effects of beta-rays upon division and
growth in cancer cells. Proceedings of the Royal Society B 100, 326-224.
Mozdarani H and Bryant PE (1989). Kinetics of chromatid aberrations in G2 ataxia-
telangiectasia cells exposed to X-rays and ara A. International Journal of Radiation
Biology 55, 71-84.
Murnane JP and Kapp LN (1993). A critical look at the association of human genetic
syndromes with sensitivity to ionizing radiation. Seminars in Cancer Biology 4, 93-104.
Nagasawa H, Latt SA, Lalande ME and Little JB (1985). Effects of X-irradiation on
cell-cycle progression, induction of chromosomal aberrations and cell killing in ataxia
telangiectasia (AT) fibroblasts. Mutation Research 148, 71-82.
Natarajan AT and Meyers M (1979). Chromosomal radiosensitivity of ataxia
telangiectasia cells at different cell cycle stages. Human Genetics 52, 127-132.
Palitti F, Pichierri P, Franchitto A, Proietti De Santis L and Mosesso p (1999).
Chromosome radiosensitivity in human G2 lymphocytes and cell-cycle progression.
International Journal of Radiation Biology 75, 621-627.
Pantelias GE and Maillie HD (1983). A simple method for premature chromosome
condensation induction in primary human and rodent cells using polyethylene glycol.
Somatic Cell Genetics 9, 533-547.
Papworth R, Slevin N, Roberts SA and Scoff D (2001). Sensitivity to radiation-induced
chromosome damage may be a marker of genetic predisposition in young head and neck
cancer patients. British Journal of Cancer 84, 776-782.
Parshad R, Sanford KK and Jones GM (1983). Chromatid damage after G2 phase x-
irradiation of cells from cancer-prone individuals implicates deficiency in DNA repair.
The Proceedings of the National Academy of Sciences of the United States of America
80, 5612-5616.
112
Parshad R, Sanford KK, Jones GM and Tarone RE (1985). G2 chromosomal
radiosensitivity of ataxia-telangiectasia heterozygotes. Cancer Genetics and
Cytogenetics 14, 163-168.
Parshad R, Price FM, Pirollo KF, Chang EH and Sanford KK (1993). Cytogenetic
response to G2-phase X irradiation in relation to DNA repair and radiosensitivity in a
cancer-prone family with Li-Fraumeni syndrome. Radiation Research 136, 236-240.
Parshad R, Price FM, Bohr VA, Cowans KH, Zujewski JA and Sanford KK (1996).
Deficient DNA repair capacity, a predisposing factor in breast cancer. British Journal of
Cancer 74, 1-5.
Patel RK, Trivcdi AH, Arora DC, Bhatavdekar JM and Patel DD (1997). DNA repair
proficiency in breast cancer patients and their first-degree relatives. International
Journal of Cancer 73, 20-24.
Paz-y-Mino C, Davalos MV, Sanchez ME, Arevalo M and Leone PE (2002). Should
gaps be included in chromosomal aberration analysis? Evidence based on the comet
assay. Mutation Research 516, 57-61.
Peto J and Mack TM (2000). High constant incidence in twins and other relatives of
women with breast cancer. Nature Genetics 26,411-414.
Pincheira J, Rodriguez M, Bravo M, Navarrete MH and Lopez-Saez JF (1994).
Defective G2 repair in Down syndrome: effect of caffeine, adenosine and niacinamide
in control and X-ray irradiated lymphocytes. Clinical Genetics 45, 25-31.
113
Pincheira J, Bravo M, Navarrete MH, Marcelain K, Lopez-Saez JF and de Ia Tone C
(2001). Ataxia telangiectasia: 02 checkpoint and chromosomal damage in proliferating
lymphocytes. Mutagenesis 16, 419-422.
Pretazzoli V, Salone B, Bosi A and Olivieri G (2000). Variability of G(2) checkpoint
sensitivity to low doses of X-rays (2 cGy): correlation with G(2) chromatid aberrations
but not with an adaptive response. Mutagenesis 15, 531-535.
Price FM, Parshad R, Tarone RE and Sanford KK (1991). Radiation-induced chromatid
aberrations in Cockayne syndrome and xeroderma pigmentosum group C fibroblasts in
relation to cancer predisposition. Cancer Genetics and Cytogenetics 57, 1-10.
Price EA, Boume SL, Radbourne R, Lawton PA, Lamerdin J, Thompson LH and
Arrand JE (1997). Rare microsatellite polymorphisms in the DNA repair genes XRCC 1,
XRCC3 and XRCC5 associated with cancer in patients of varying radiosensitivity.
Somatic Cell and Molecular Genetics 23, 237-247.
Rary JM, Bender MA and Kelly it (1974). Cytogenetic status of ataxia telangiectasia.
Cancer 32, 70-73.
Rees OS, Trikic MZ, Winther JF, Tawn EJ, Stovall M, Olsen JH, Rechnitzer C,
Schroder U, Guldberg P and Boice JD, Jr. (2006). A pilot study examining germline
minisatellite mutations in the offspring of Danish childhood and adolescent cancer
survivors treated with radiotherapy. international Journal of Radiation Biology 82, 153-
160.
114
Riches AC, Bryant PE, Steel CM, Gleig A, Robertson AJ, Preece PE and Thompson
AM (2001). Chromosomal radiosensitivity in G2-phase lymphocytes identifies breast
cancer patients with distinctive tumour characteristics. British Journal of Cancer 85,
1157- 1 161.
Ricoul M and Dutrillaux B (1991). Variations of chromosome radiation sensitivity in
fetal and adult mice during gestation. Mutation Research 250, 33 1-335.
Ricoul M, Sabatier L and Dutrillaux B (1997). Increased chromosome radiosensitivity
during pregnancy. Mutation Research 374, 73-78.
Roberts Ci, Morgan GR and Danford N (1997). Effect of hormones on the variation of
radiosensitivity in females as measured by induction of chromosomal aberrations.
Environmental Health Perspectives 105, Suppl 6, 1467-1471.
Roberts SA, Spreadborough AR, Bulman B, Barber JB, Evans DG and Scott D (1999).
Heritability of cellular radiosensitivity: a marker of low-penetrance predisposition genes
in breast cancer? The American Journal of Human Genetics 65, 784-794.
Sanford KK, Tarone RE, Parshad R, Tucker MA, Greene MH and Jones GM (1987).
Hypersensitivity to 02 chromatid radiation damage in familial dysplastic naevus
syndrome. Lancet 2, 1111-1116.
115

Sanford KK, Parshad R, Gantt R, Tarone RE, Jones GM and Price FM (1989). Factors
affecting and significance of G2 chromatin radiosensitivity in predisposition to cancer.
International Journal ofRadiation Biology 55, 963-981
Sanford KK, Parshad R, Price FM, Jones GM, Tarone RE, Eierman L, Hale P and
Waldmann TA (1990). Enhanced chromatid damage in blood lymphocytes after G2
phase x irradiation, a marker of the ataxia-telangiectasia gene. Journal of the National
Cancer Institute 82, 1050-1054.
Sanford KK, Parshad R, Price FM, Tarone RE and Schapiro MB (1993). X-ray-induced
chromatid damage in cells from Down syndrome and Alzheimer disease patients in
relation to DNA repair and cancer proneness. Cancer Genetics and Cytogenetics 70, 25-
30.
Sanford KK, Parshad R, Price FM, Tarone RE and Benedict WF (1996). Cytogenetic
responses to G2 phase x-irradiation of cells from retinoblastoma patients. Cancer
Genetics and Cytogenetics 88, 43-48
Sanford KK, Parshad R, Price FM, Tarone RE, Thompson J and Guerry D (1997a).
Radiation-induced chromatid breaks and DNA repair in blood lymphocytes of patients
with dysplastic nevi and/or cutaneous melanoma. Journal of Investigative Dermatology
109, 546-549.
Sanford KK, Price FM, Brodeur C, Makrauer FL and Parshad R (1997b). Deficient
DNA repair in chronic ulcerative colitis. Cancer Detection and Prevention 21, 540-545.
116

Savage JRK (1970). Sites of radiation induced chromosome exchanges. Current Topics
in Radiation Research 6, 129-194.
Scott D and Zampetti-Bosseler F (1982). Cell cycle dependence of mitotic delay in X-
irradiated normal and ataxia-telangiectasia fibroblasts. International Journal of
Radiation Biology & Related Studies in Physics, Chemistry & Medicine 42, 679-683.
Scoff D, Spreadborough A, Levine E and Roberts SA (1994a). Genetic predisposition in
breast cancer. Lancet 344, 1444.
Scott D, Spreadborough AR and Roberts SA (1994b). Radiation-induced G2 delay and
spontaneous chromosome aberrations in ataxia-telangiectasia homozygotes and
heterozygotes. International Journal of Radiation Biology 66, S 157-163.
Scoff D, Spreadborough AR, Jones LA, Roberts SA and Moore CJ (1996).
Chromosomal radiosensitivity in G2-phase lymphocytes as an indicator of cancer
predisposition. Radiation Research 145, 3-16.
Scott D, Barber JB, Spreadborough AR, Burrill W and Roberts SA (1999). Increased
chromosomal radiosensitivity in breast cancer patients: a comparison of two assays.
International Journal of Radiation Biology 75, 1-10.
Scott D, Roberts SA, Spreadborough A, Bulman B, Barber JB and Evans DG (2000).
Chromosomal radiosensitivity and cancer predisposition. Proceedings of the 11th
International Congress of Radiation Research 2, 470.
117
Scott D, Spreadborough AR and Roberts SA (2003). Less 0(2) arrest in irradiated cells
of breast cancer patients than in female controls: a contribution to their enhanced
chromosomal radiosensitivity? international Journal of Radiation Biology 79, 405-411.
Scott D (2004). Chromosomal Radiosensitivity and low penetrance predisposition to
cancer. Cytogenetic and Genome Research 104, 365-370.
Shackelford RE, Kaufmann WK and Paules RS (1999). Cell cycle control, checkpoint
mechanisms, and genotoxic stress. Environmental Health Perspectives 107, Suppl 1, 5-
24.
Shiloh Y, Parshad R, Sanford KK and Jones GM (1986). Carrier detection in ataxia-
telangiectasia. Lancet 1, 689-690.
Shiloh Y, Parshad R, Frydman M, Sanford KK, Portnoi S, Ziv Y and Jones GM (1989).
02 chromosomal radiosensitivity in families with ataxia-telangiectasia. Human
Genetics 84, 15-18.
Shovman 0, Riches AC, Adamson D and Bryant PE (2008). An improved assay for
radiation-induced chromatid breaks using a colcemid block and calyculin-induced PCC
combination. Mutagenesis 23, 267-270.
Sims AH, Finnon P, Miller CJ, Boutuier SD, Howell A, Scott D and Clarke RB (2007).
TPD52 and NFKB I gene expression levels correlate with 02 chromosomal
radiosensitivity in lymphocytes of women with and at risk of hereditary breast cancer.
international Journal of Radiation Biology 83, 409-420.
118

Smart V, Curwen GB, Whitehouse CA, Edwards A and lawn EJ (2003). Chromosomal
radiosensitivity: a study of the chromosomal G(2) assay in human blood lymphocytes
indicating significant inter-individual variability. Mutation Research 528, 105-110.
Son YH and Kapp DS (1985). Oral cavity and oropharyngeal cancer in a younger
population. Review of literature and experience at Yale. Cancer 55, 441-444.
Srebniak MI, lrapp GG, Wawrzkiewicz AK, Kazmierczak W and Wiczkowski AK
(2005). The usefulness of calyculin a for cytogenetic prenatal diagnosis. Journal of
Histochemistry and Cytochemistry 53, 391-394.
Swift M, Morrell D, Cromartie E, Chamberlin AR, Skolnick MH and Bishop DT
(1986). The incidence and gene frequency of ataxia-telangiectasia in the United States.
The American Journal of Human Genetics 39, 573-583.
Takai 5, Price FM, Sanford KK, Tarone RE and Parshad R (1990). Persistence of
chromatid damage after G2 phase X-irradiation in lymphoblastoid cells from Gardner's
syndrome. Carcinogenesis 11, 1425-1428.
Taylor AM, Harnden DG, Arlett CF, Harcourt SA, Lehmann AR, Stevens S and
Bridges BA (1975). Ataxia telangiectasia: a human mutation with abnormal radiation
sensitivity. Nature 258, 427-429.
Taylor AM (1978). Unrepaired DNA strand breaks in irradiated ataxia telangiectasia
lymphocytes suggested from cytogenetic observations. Mutation Research 50, 407-4 18.
'U

Tchirkov A, Bay JO, Pernin D, Bignon YJ, Rio P, Grancho M, Kwiatkowski F, Giollant
M, Malet P and Verrelle P (1997). Detection of heterozygous carriers of the ataxia-
telangiectasia (ATM) gene by G2 phase chromosomal radiosensitivity of peripheral
blood lymphocytes. Human Genetics 101, 312-316.
Terry SY, Riches AC and Bryant PE (2008). A role for topoisomerase II alpha in the
formation of radiation-induced chromatid breaks. British Journal of Cancer 99, 670-
674.
Terzoudi GI and Pantelias GE (1997). Conversion of DNA damage into chromosome
damage in response to cell cycle regulation of chromatin condensation after irradiation.
Mutagenesis 12, 27 1-276.
Terzoudi UI, Jung T, Hain J, Vrouvas J, Margaritis K, Donta-Bakoyianni C,
Makropoulos V, Angelakis P and Pantelias GE (2000). Increased G2 chromosomal
radiosensitivity in cancer patients: the role of cdkl/cyclin-B activity level in the
mechanisms involved. International Journal of Radiation Biology 76, 607-615.
Terzoudi GI, Manola KN, Pantelias GE and Iliakis G (2005). Checkpoint abrogation in
G2 compromises repair of chromosomal breaks in ataxia telangiectasia cells. Cancer
Research 65, 11292-11296.
Vral A, Thierens H, Baeyens A and De Ridder L (2002). The micronucleus and G2-
phase assays for human blood lymphocytes as biomarkers of individual sensitivity to
ionizing radiation: limitations imposed by intraindividual variability. Radiation
Research 157, 472-477.
120

Vral A, Thierens H, Baeyens A and De Ridder L (2004). Chromosomal aberrations and
in vitro radiosensitivity: intra-individual versus inter-individual variability. Toxicology
Letters 149, 345-352.
Wang ZZ, Li WJ, Zhang H, Yang JS, Qiu R and Wang X (2006). Comparison of
clonogenic assay with premature chromosome condensation assay in prediction of
human cell radiosensitivity. World Journal of Gastroenterology 12, 2601-2605.
Weemaes CM, Hustinx 1W, Scheres JM, van Munster PJ, Bakkeren JA and Taalman
RD (1981). A new chromosomal instability disorder: the Nijmegen breakage syndrome.
Ada paediatrica Scandinavica 70, 557-564.
Weinert TA and Hartwell LH (1988). The RAD9 gene controls the cell cycle response
to DNA damage in Saccharomyces cerevisiae. Science 241, 317-322.
Weinert TA (1992). Dual cell cycle checkpoints sensitive to chromosome replication
and DNA damage in the budding yeast Saccharomyces cerevisiae. Radiation Research
132, 141-143.
Weinert TA, Kiser GL and Hartwell LH (1994). Mitotic checkpoint genes in budding
yeast and the dependence of mitosis on DNA replication and repair. Genes &
Development 8, 652-665.
Weniger MA, Barth TF and Moller p (2006). Genomic alterations in Hodgkin's
lymphoma. International Journal of Hematology 83, 379-384.
121
Woods CO, Bundey SE and Taylor AM (1990). Unusual features in the inheritance of
ataxia telangiectasia. Human Genetics 84, 555-562.
Xu B, Kim ST, Lim DS and Kastan MB (2002). Two molecularly distinct G(2)/M
checkpoints are induced by ionizing irradiation. Molecular and Cellular Biology 22,
1049- 1059.
Yamada M and Puck TI (1961). Action of radiation on mammalian cells. IV.
Reversible mitotic lag in the S3 HeLa cell produced by low doses of x-rays. The
Proceedings of the National Academy of Sciences of the United States of America 47,
1181-1191.
Zampetti-Bosseler F and Scott D (1981). Cell death, chromosome damage and mitotic
delay in normal human, ataxia telangiectasia and retinoblastoma fibroblasts after x-
irradiation. International Journal of Radiation Biology & Related Studies in Physics,
Chemistry & Medicine 39, 547-558.
122

APPENDICES
APPENDIX A: WRI CONSENT FORM
Form: GENL4B-óvI Jan 2007
Firsi Issue
CONSENT FORM FOR BLOOD SAMPLES FOR IN VITRO STUDIES OF EXPOSURE TO RADIATION
I am willing to provide a blood sample.
I understand that the sample will be used for research studies associated with in vitro exposure to radiation. I understand any information pertaining to the sample will be protected by the principles of confidentiality and will conform to the Data Protection Act (1998) and the Human Tissue Act (2004).
Signed - ....................................................Date- .......................................
Name - .................................(first name) .................................(family name) (please print)
Dateof Birth - .......................................................Gender ..................................
Are you a smoker? Yes No Ex-snioker
Have you ever had any radiotherapy/chemotherapy?
Yes No
Comments
Al

APPENDIX B: ZEISS AXIOPLAN 2 IMAGING MICROSCOPE WITH A MARZHAUSER MOTORIZED SCANNING STAGE
I-ti'

I,. ft
APPENDIX C: QUESTIONNAIRE FOR DANISH FAMILIES (modified to fit page layout)
QUESTIONNAIRE
Indication of Genetic Damage Transmitted to Children of Danish Survivors of Childhood Cancer - A Feasibility Blood Collection Study
[cI Institute of Cancer Epidemiology
Danish Cancer Society Strandboulevarden 49 DK-2100 Copenhagen 0
Study no.: Date of interview:
CI

1. Basic information
MF 1.lSex 1-1-1
Year 1.2 Age I_I_I
2. Cancer in the family
Yes No Not sure
2.1 Has anyone in your nearest biological family had cancer?
(Parents, grandparents, siblings, children, parent's siblings; i.e. aunts and uncles, but not adopted children, stepfamily or family in-laws)
2.2 If yes, please specifr
Family member I Type of cancer/Not sure lCD-S
C2

3. Smoking habits
Yes No
Yes No
I-I-I
Age
Age
Year
I-I-I
3.1 Are you a current smoker? (at least 1 cigarette per day in 6 months or cigar/pipe)
3.2 Have you previously been a current smoker? (defined as above)
3.3 How much do/did you smoke in average per day/weekImontb? Number of cigarettes
Per day
Per week
Per month
3.4 Age at start of smoking?
3.5 Age at quitting, if former smoker?
3.6 Total years of daily smoking?
[*1

4. Medications
4.1 Do you currently use any form of medication? We ask you about prescription and over-the counter drugs as well as alternative medicine. Yes No
I_Li If yes, please specify the name of the drug(s), duration of use as well as the indication
Drug name Duration of use in Indication
months (m)/years (y)
4.2 Have you previously received large doses of chemotherapy or similar drugs due to serious illness? Yes No
Drug name Duration of use in Indication
months (m)/years (y)
C4

5. Use of Hormones (women only)
Yes No
5.1 Do you use oral contraceptives? I_I__I If yes, please speci' the name of the drug(s) and duration of use
Drug name Duration of use in months (m)Iyears (y)
Yes No
5.2 Do you use any other type of hormones, such as estrogens and/or progesterones?
If yes, please specify the name of the drug(s), duration of use and type of hormones
Drug name Duration of use in Type of hormones
months (m)/years (y)
Estrogen only, progesterone only, combination pills, others (please specif')
C5

APPENDIX D: CONSENT FORM AND INFORMATION FOR DANISH FAMILIES
Informed Consent
Indication of Genetic Damage Transmitted to the Children of Danish Survivors of Childhood Cancer - A Feasibility Blood Collection Study
I have read the information brochure, and I hereby confirm that I agree to participate in the study.
Furthermore, I give permission to having my and my child/children's blood drawn
I understand that participation in the study is entirely voluntary and that I can withdraw my and my child/children's commitment without giving any explanation.
Do you allow your blood sample to be at stored at the Institute of Cancer Biology, Danish Cancer Society, Copenhagen, and to be used in future studies on childhood cancer after renewed approval from the Danish Ethical Committee?
O Yes ONo
Do you allow your child/children's blood sample to be at stored at the Institute of Cancer Biology, Danish Cancer Society, Copenhagen, and to be used in future studies on childhood cancer after renewed approval from the Danish Ethical Committee?
O Yes ONo
Date:
Name:
Signature:
ra
Institute of Cancer Epidemiology
banish Cancer Society
Strandboulevarden 49
bK-2100 Copenhagen, benniark
DI

OC
nC
°
v .2
C
t C
).t
co
• C
C
O't
°I..Z
S
i .c
00
b
b
.CC
t
0.9
C
'5
C) J>A
ctI
..0
.0
0) .0
-
C) - 90
0
0
'C-
C)
,C)
CtE
Ct
C
•.2c.
C)
' 0
0
.0
X.2
C
C
'CO
'C
)C
I
Ct
t 0
C
C
L
CtC
0
—
5cto
0.9
•1
.o
>.g
bO
....
2
c2
'.9
E
5 0
o
'5C
C
tEC
)
O
E&
t
CC
00
.Q
E
oo
t5
C)
ct f-C
C
00
o
o:22
C
a
no S
S N
rr
P
tt.tc
-'
1 -
-. ..-
-
C
wi
rA
S
1 crh
: r
b.c - •
e
rM
r
• -
Is
•--
j•
a
- •!K
—C —
=hu1

E
a
a-a
rt0
18
ca
rw
4- Ct
;- -
C
o
00_a
•0
QO
ct
-
CtC
t.._a
o.-_oo
oC
tCt
=0
.C
a
•t,:.at_
-o
-aS
't 0
. 0
C
: C
rfl E
C
t
ta
0
Ct O
0
a -
-a
C-a
'a8c
E2
Ct 0
-o
a
00
C.
.?P
't
-.
-58
'-'t
0010oQ
Et-c
Ct •-
4- -
--
C .C
tCt
-
CIS -=
4- _ C)
4_
V' >
.0t0
l-1-1- —v
Ec•s
-8.E
N'tO
4
-•'
o
Ct C
bO
- E
O2
2E
''
0C
Io
_C
n
't
a a
0
Ct
-a0
-a
r.
—..°
0
010
CtN
tC
0p
-fl cc
'4
cn
ct
CC
0'
.a aE
ctE
co
-°E
''O
t010.
C>
__
..•
VC
ta1-
Catc2
s.u2'
0
:--
01
E-
aS
E
o01
0.t
-a
a
1.-ao
gE
a.-g
.0 C
' _C
O'&
EE
.E?
EI
Eø
,1-ao
o
2
at
Ct a
l- -
0
ot
2co
ç' -a
t
CtL
I U
CC
t u
--a
.- •o.5
tE.E
Ctk
. O
Q
1-.C
C
-._
Ct
,C
Ct
- 0
-a taO
aC
> Ct
0
.0
0 •
'aIm
tco
vo
t
CtaC
OO
ct
tC
t4
ti-
Cth
.C)O
I-
t
C..s
—a)
C0
0
..0
C
_C
a
p.0
QO
.
Cd
•T t
io
Ct2
Ct
1-.
a
tlOC
tk.
00
C
t p
.o
E
E o
I O
OC
c.E
6C
a'4
E'°
t
U
.E'Z
m
-° a-a
l-C
t
EO
'tC
Ct
°!
t
C
o1 •_ià
0Q
°
alU
t
C
°C
C
_C
0Q
°C
I.001-Q
_Z
Q
Oj -a'
a0
U)
_co
56z
2E
tao
O
Q
0
-a-aC
C
C#
)00
00
z..
u
0
c-act
•C
t0
;o
•__
Co
C
o'a
•OC
.-.
._iC
Ct
:•-ct
>.t
a
-=
0
'aC
'a
ct°cE
oE
.-
E
DC
nC+.
cC
Ct C
a
C -
8 flU
flfl ©
-0
l-.
U) 0
4-
0
-O
o
a
fl
••..
0
Ct a
<F
-vu
-a.c
u
en a

APPENDIX E: THE WRI G2 RADIOSENSITIVITY SCORE SHEET
Code:- Irradiated Control Microscope no.:- Scorer:- Date:-
a
-
- -
- -
El.
a
- -
El

APPENDIX F: THE Will PCC SCORE SHEET
24 PCC/PCC kC TEST G2 & PCC II
won. On P_1v1
Ang 3005
flr.t Z..ne
PCC cell proportions
rwatsated
24
Slidename erchoy Ctngfly Chngnat. NCelle Undefined Rejected XC TEST 02 & P Adan AUiu 23/09/05 460 432 4
floC.111fl 02 Slat 01 S Xntflnlaa 1 1 1 0 0 0 0 0 2 2 0 1 0 0 0 0 3 3 0 1 0 0 0 0 4 4 0 1 0 0 0 0 5 5 0 1 0 0 0 0 6 6 0 1 0 0 0 0 7 7 0 1 0 0 0 0 0 8 1 0 0 0 0 0 9 9 0 1 0 0 o 0
10 10 0 1 0 0 0 0 11 13 1 0 0 0 0 0 12 14 1 0 0 0 0 0 13 15 0 1 0 0 0 0 14 16 0 1 0 0 0 0 15 11 0 1 0 0 0 0 16 18 0 1 0 0 0 0 17 19 0 1 0 0 0 0 18 21 0 1 0 0 0 0 19 22 0 1 0 0 0 0 20 23 0 1 0 0 0 0 21 24 0 1 0 0 0 0 22 25 0 1 0 0 0 0 23 27 0 1 0 0 0 0 24 28 0 1 0 0 0 0
4 20 0 0 0 0
Signatare of Scorer ------------------------------------ Date ...............
M.tasysten.s Metafert MSearcIWTL I 0W02100 00:10:22 1W TEST 02 & PCC II
Fl
Related Documents