econstor Make Your Publications Visible. A Service of zbw Leibniz-Informationszentrum Wirtschaft Leibniz Information Centre for Economics Blumkin, Tomer; Margalioth, Yoram; Strawczynski, Michel Working Paper The Effects of Permanent Income Tax Cuts on Emigration from Israel CESifo Working Paper, No. 6095 Provided in Cooperation with: Ifo Institute – Leibniz Institute for Economic Research at the University of Munich Suggested Citation: Blumkin, Tomer; Margalioth, Yoram; Strawczynski, Michel (2016) : The Effects of Permanent Income Tax Cuts on Emigration from Israel, CESifo Working Paper, No. 6095, Center for Economic Studies and ifo Institute (CESifo), Munich This Version is available at: http://hdl.handle.net/10419/147349 Standard-Nutzungsbedingungen: Die Dokumente auf EconStor dürfen zu eigenen wissenschaftlichen Zwecken und zum Privatgebrauch gespeichert und kopiert werden. Sie dürfen die Dokumente nicht für öffentliche oder kommerzielle Zwecke vervielfältigen, öffentlich ausstellen, öffentlich zugänglich machen, vertreiben oder anderweitig nutzen. Sofern die Verfasser die Dokumente unter Open-Content-Lizenzen (insbesondere CC-Lizenzen) zur Verfügung gestellt haben sollten, gelten abweichend von diesen Nutzungsbedingungen die in der dort genannten Lizenz gewährten Nutzungsrechte. Terms of use: Documents in EconStor may be saved and copied for your personal and scholarly purposes. You are not to copy documents for public or commercial purposes, to exhibit the documents publicly, to make them publicly available on the internet, or to distribute or otherwise use the documents in public. If the documents have been made available under an Open Content Licence (especially Creative Commons Licences), you may exercise further usage rights as specified in the indicated licence. www.econstor.eu

Welcome message from author
This document is posted to help you gain knowledge. Please leave a comment to let me know what you think about it! Share it to your friends and learn new things together.
Transcript
econstorMake Your Publications Visible.
A Service of
zbwLeibniz-InformationszentrumWirtschaftLeibniz Information Centrefor Economics
Blumkin, Tomer; Margalioth, Yoram; Strawczynski, Michel
Working Paper
The Effects of Permanent Income Tax Cuts onEmigration from Israel
CESifo Working Paper, No. 6095
Provided in Cooperation with:Ifo Institute – Leibniz Institute for Economic Research at the University of Munich
Suggested Citation: Blumkin, Tomer; Margalioth, Yoram; Strawczynski, Michel (2016) : TheEffects of Permanent Income Tax Cuts on Emigration from Israel, CESifo Working Paper, No.6095, Center for Economic Studies and ifo Institute (CESifo), Munich
This Version is available at:http://hdl.handle.net/10419/147349
Standard-Nutzungsbedingungen:
Die Dokumente auf EconStor dürfen zu eigenen wissenschaftlichenZwecken und zum Privatgebrauch gespeichert und kopiert werden.
Sie dürfen die Dokumente nicht für öffentliche oder kommerzielleZwecke vervielfältigen, öffentlich ausstellen, öffentlich zugänglichmachen, vertreiben oder anderweitig nutzen.
Sofern die Verfasser die Dokumente unter Open-Content-Lizenzen(insbesondere CC-Lizenzen) zur Verfügung gestellt haben sollten,gelten abweichend von diesen Nutzungsbedingungen die in der dortgenannten Lizenz gewährten Nutzungsrechte.
Terms of use:
Documents in EconStor may be saved and copied for yourpersonal and scholarly purposes.
You are not to copy documents for public or commercialpurposes, to exhibit the documents publicly, to make thempublicly available on the internet, or to distribute or otherwiseuse the documents in public.
If the documents have been made available under an OpenContent Licence (especially Creative Commons Licences), youmay exercise further usage rights as specified in the indicatedlicence.
www.econstor.eu
The Effects of Permanent Income Tax Cuts on Emigration from Israel
Tomer Blumkin Yoram Margalioth
Michel Strawczynski
CESIFO WORKING PAPER NO. 6095 CATEGORY 1: PUBLIC FINANCE
SEPTEMBER 2016
An electronic version of the paper may be downloaded • from the SSRN website: www.SSRN.com • from the RePEc website: www.RePEc.org
• from the CESifo website: Twww.CESifo-group.org/wp T
ISSN 2364-1428
CESifo Working Paper No. 6095
The Effects of Permanent Income Tax Cuts on Emigration from Israel
Abstract In this paper we introduce an analytical framework for analyzing the effect of permanent income tax reductions on emigration and conduct an empirical analysis of their impact, based on the Israeli tax reductions during 2004-2010. We find that permanent tax reductions reduce the emigration flows from Israel. According to our findings, this effect is stronger for workers in the low-tech sector than for their high-tech counterparts, as the former appear to be more sensitive to changes in net wages. Moreover, the effect is stronger for younger workers who benefit from permanent tax reductions for a longer period during their careers, relative to older workers.
JEL-Codes: H200, J380, J610.
Keywords: permanent tax cut, emigration.
Tomer Blumkin
Department of Economics Ben Gurion University of the Negev
Israel - 84105 Beer-Sheva [email protected]
Yoram Margalioth
Faculty of Law Tel Aviv University
Tel Aviv / Israel [email protected]
Michel Strawczynski Department of Economics & School of Public Policy / Hebrew University of
Jerusalem / Israel [email protected]
September 2016 We are grateful to Oren Tirosh for his superb research assistance, and to Adi Finkelstein for preparing the data set during the first stage of the research; thanks are also due to Yotam Shem‐Tov for helpful remarks. We are grateful to Sapir Center at Tel Aviv University for its generous financial support. We received helpful remarks from participants in seminars at: The Federman School of Public Policy of the Hebrew University of Jerusalem, The Israeli Economic Association and The Bank of Israel.

2
1. Introduction A well-‐established theoretical and empirical finding in Public Economics is that high-‐income
earners strongly respond to income taxation (Gruber and Saez, 2002). The literature stresses
migration as one of the key channels of response (Slemrod, Saez and Giertz, 2012). Two
recent influential empirical studies by Kleven, Landais and Saez (2013) and Kleven, Landais,
Saez and Schultz (2014) found indeed that migration decisions were significantly affected by
tax incentives, attesting to the importance of the migration margin for the design of the
optimal tax-‐and-‐transfer system.
In light of growing earnings inequality, suggestions to increase the top marginal tax rates are
widely discussed by policymakers and in academic circles as an effective means to promote
redistributive goals. The effectiveness of such reforms depends to a large extent on the
migration opportunities (overseas job prospects) available to high-‐income earners, which
are likely to vary within the pool of top earners.
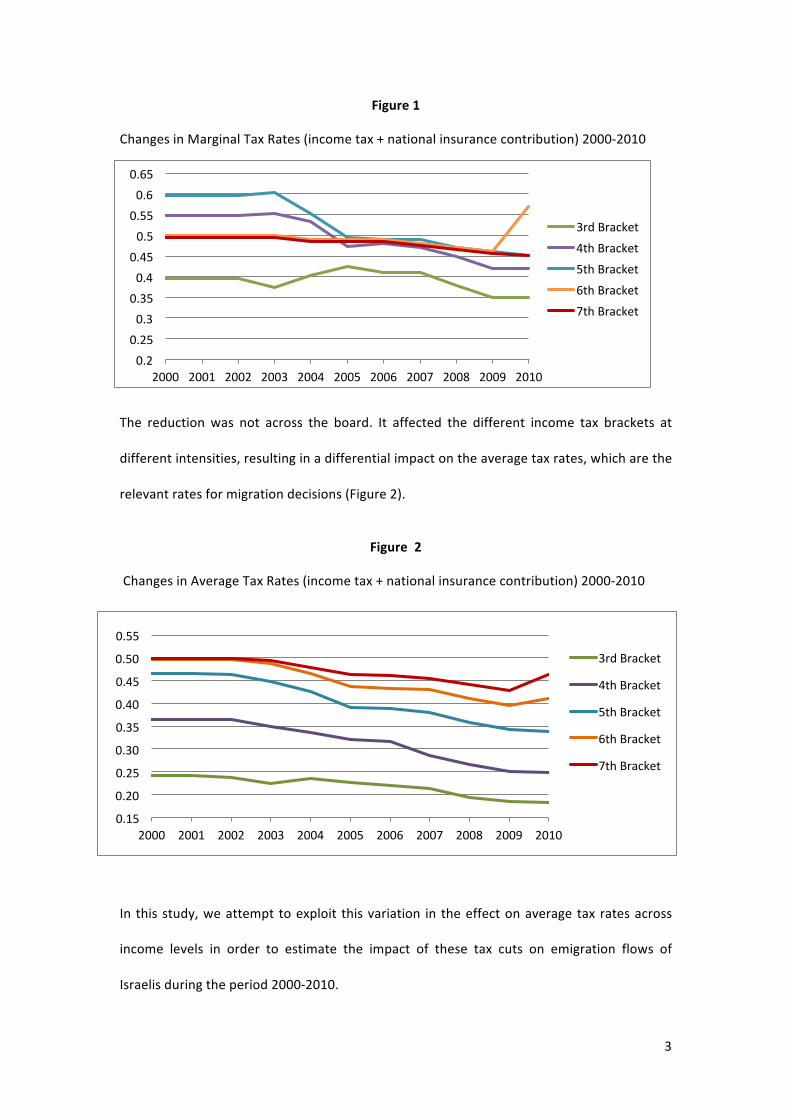
In the period 2004-‐2010, the Israeli Government implemented a substantial and consistent
gradual pre-‐announced reduction of the statutory marginal income tax rates, resulting in a
permanent reduction of marginal tax rates (Figure 1).2 The Israeli experience provides a
unique opportunity to examine the impact of a permanent tax reduction on migration.
2 Note that in the early 2000s the marginal tax rates for the 6th and 7th brackets were lower than the marginal tax rate applied to the 4th and 5th bracket. This apparent inconsistency was due to a threshold on National Insurance contributions at the relevant income ranges; above which the marginal contribution was zero.
3
0.2 0.25 0.3 0.35 0.4 0.45 0.5 0.55 0.6 0.65
2000 2001 2002 2003 2004 2005 2006 2007 2008 2009 2010
3rd Bracket
4th Bracket
5th Bracket
6th Bracket
7th Bracket
0.15
0.20
0.25
0.30
0.35
0.40
0.45
0.50
0.55
2000 2001 2002 2003 2004 2005 2006 2007 2008 2009 2010
3rd Bracket
4th Bracket
5th Bracket
6th Bracket
7th Bracket
Figure 1
Changes in Marginal Tax Rates (income tax + national insurance contribution) 2000-‐2010
The reduction was not across the board. It affected the different income tax brackets at
different intensities, resulting in a differential impact on the average tax rates, which are the
relevant rates for migration decisions (Figure 2).
Figure 2
Changes in Average Tax Rates (income tax + national insurance contribution) 2000-‐2010
In this study, we attempt to exploit this variation in the effect on average tax rates across
income levels in order to estimate the impact of these tax cuts on emigration flows of
Israelis during the period 2000-‐2010.

4
2. A Brief Review of the Literature
Our study relates to several strands of the existing empirical literature on the behavioral
effects of taxation and on migration. There is substantial empirical evidence on the impact of
tax rates and transfers on labor supply and labor income of individuals and households [for
two broad surveys see Blundell and MaCurdy (1999) and Giertz, Saez and Slemrod (2012)].
An additional strand of the literature examines the impact of taxation on capital flows
[Gordon and Hines (2002), Grifith and Devereux (2002) and Griffith, Hines, and Sørensen
(2010)]. A third relevant strand of empirical literature deals with the wage gaps among
immigrants [see, e.g., Borjas (1999)]. In a recent related paper Borjas, Kauppinen and
Poutvaara (2015) showed that for the Danish population the income distribution of
emigrants stochastically dominates that of non-‐emigrants and that self-‐selection was driven
primarily by unobservable characteristics.
The literature examining the impact of tax incentives on international migration is relatively
scarce. There are some studies that examine the migration within a federation, such as,
Wrobel and Feldstein (1998), Bakija and Slemrod (2004) and Varner and Young (2011)
focusing on migration within the US; and Pommerehne and Kirchgassner (1996) and Liebig et
al. (2007), examining migration across Swiss Cantons. More recently, several studies
examine the impact of tax incentives on international migration [Landais, Kleven and Saez
(2013), Landais, Kleven, Saez and Schultz (2014) and Akcigit, Baslandze and Stantcheva
(2015)]. The first paper studies the impact of tax incentives on migration of soccer players in
14 European countries in the period 1985-‐2008, finding an average (migration) elasticity that
is close to unitary for foreign players and even a higher elasticity for top soccer players.
Landais, Kleven, Saez and Schultz (2014) employ a differences-‐in-‐differences methodology to
study the impact on migration of a tax reform that took place in Denmark in the beginning of
the nineties, in which high-‐income earners (defined as individuals with an annual income
5
level exceeding 103 thousands Euros, in 2009 prices) received a substantial (34 percent) tax
reduction over a period of three years. The study finds a strong reaction to tax rates, with
elasticity exceeding unity. Finally, Akcigit, Baslandze and Stantcheva (2015) find evidence
that location decisions taken by top 1% inventors are significantly influenced by tax
considerations.
The policy implications of the above documented high migration elasticities were examined
in two recent theoretical studies. Lehmann, Simula and Trannoy (2014) demonstrated that
migration incentives could call for setting negative marginal tax rates at the top. Blumkin,
Sadka and Shem-‐tov (2015) have demonstrated that in the presence of labor migration and
tax competition, asymptotic optimal marginal tax rates should approach zero under
plausible parametric assumptions regarding the underlying migration elasticities. Both
studies indicate that migration may have a considerable impact on the optimal marginal tax
rates, in sharp contrast to previous studies focusing on traditional margins of response (such
as participation and labor supply).
3. Descriptive Statistics
Before turning to our analysis, we present some descriptive statistics of our data. Table 1
shows the characteristics of migrants by year and by gender. The data are based on flows of
individuals that migrate (in or out) for a period that is longer than one year.3 We show
statistics for both immigrants and emigrants, but will confine the econometric analysis to
emigrants, due to lack of relevant information regarding the immigrants.
3 See discussion of this point in Section 5 below.
6
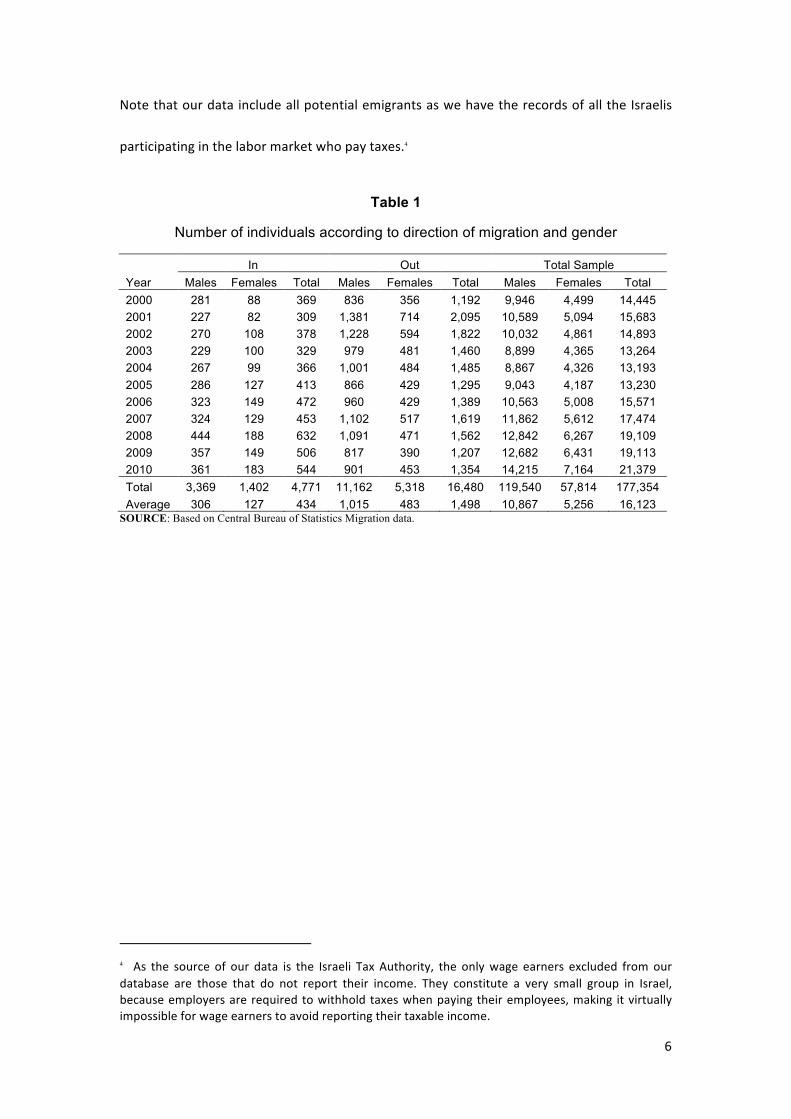
Note that our data include all potential emigrants as we have the records of all the Israelis
participating in the labor market who pay taxes.4
Table 1
Number of individuals according to direction of migration and gender
In Out Total Sample Year Males Females Total Males Females Total Males Females Total 2000 281 88 369 836 356 1,192 9,946 4,499 14,445 2001 227 82 309 1,381 714 2,095 10,589 5,094 15,683 2002 270 108 378 1,228 594 1,822 10,032 4,861 14,893 2003 229 100 329 979 481 1,460 8,899 4,365 13,264 2004 267 99 366 1,001 484 1,485 8,867 4,326 13,193 2005 286 127 413 866 429 1,295 9,043 4,187 13,230 2006 323 149 472 960 429 1,389 10,563 5,008 15,571 2007 324 129 453 1,102 517 1,619 11,862 5,612 17,474 2008 444 188 632 1,091 471 1,562 12,842 6,267 19,109 2009 357 149 506 817 390 1,207 12,682 6,431 19,113 2010 361 183 544 901 453 1,354 14,215 7,164 21,379 Total 3,369 1,402 4,771 11,162 5,318 16,480 119,540 57,814 177,354 Average 306 127 434 1,015 483 1,498 10,867 5,256 16,123
SOURCE: Based on Central Bureau of Statistics Migration data.
4 As the source of our data is the Israeli Tax Authority, the only wage earners excluded from our database are those that do not report their income. They constitute a very small group in Israel, because employers are required to withhold taxes when paying their employees, making it virtually impossible for wage earners to avoid reporting their taxable income.
7
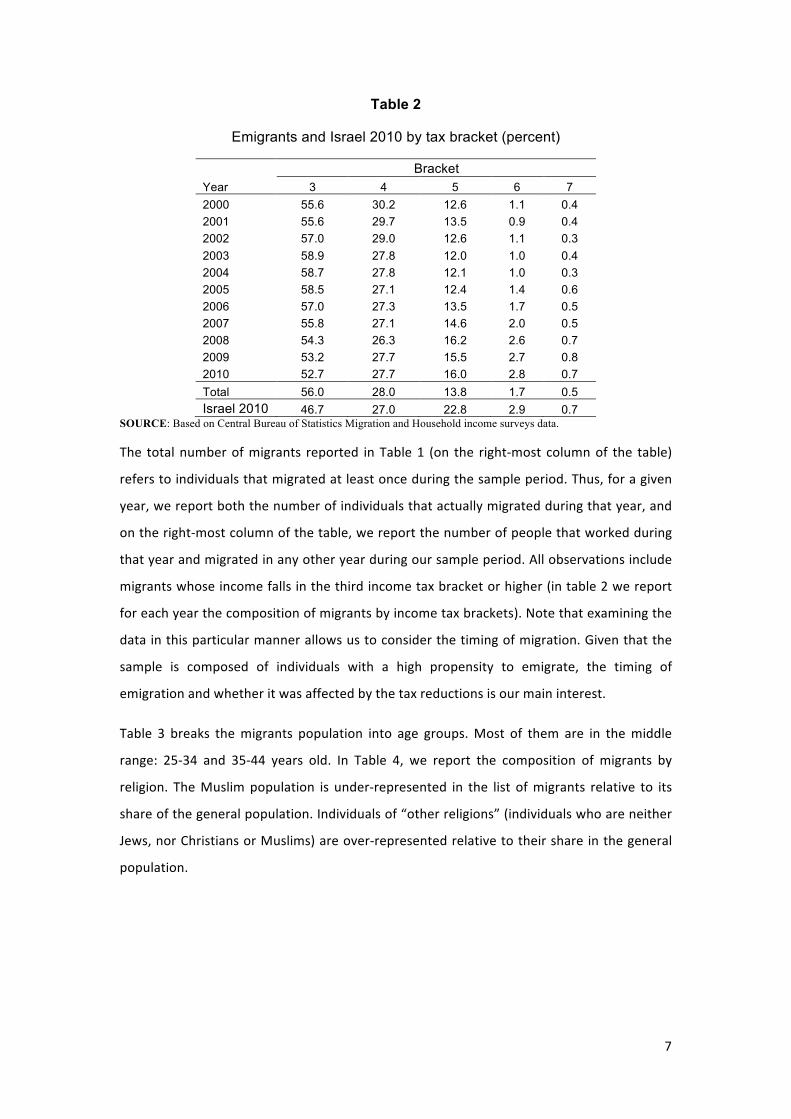
Table 2
Emigrants and Israel 2010 by tax bracket (percent)
Bracket Year 3 4 5 6 7 2000 55.6 30.2 12.6 1.1 0.4 2001 55.6 29.7 13.5 0.9 0.4 2002 57.0 29.0 12.6 1.1 0.3 2003 58.9 27.8 12.0 1.0 0.4 2004 58.7 27.8 12.1 1.0 0.3 2005 58.5 27.1 12.4 1.4 0.6 2006 57.0 27.3 13.5 1.7 0.5 2007 55.8 27.1 14.6 2.0 0.5 2008 54.3 26.3 16.2 2.6 0.7 2009 53.2 27.7 15.5 2.7 0.8 2010 52.7 27.7 16.0 2.8 0.7 Total 56.0 28.0 13.8 1.7 0.5 Israel 2010 46.7 27.0 22.8 2.9 0.7
SOURCE: Based on Central Bureau of Statistics Migration and Household income surveys data.
The total number of migrants reported in Table 1 (on the right-‐most column of the table)
refers to individuals that migrated at least once during the sample period. Thus, for a given
year, we report both the number of individuals that actually migrated during that year, and
on the right-‐most column of the table, we report the number of people that worked during
that year and migrated in any other year during our sample period. All observations include
migrants whose income falls in the third income tax bracket or higher (in table 2 we report
for each year the composition of migrants by income tax brackets). Note that examining the
data in this particular manner allows us to consider the timing of migration. Given that the
sample is composed of individuals with a high propensity to emigrate, the timing of
emigration and whether it was affected by the tax reductions is our main interest.
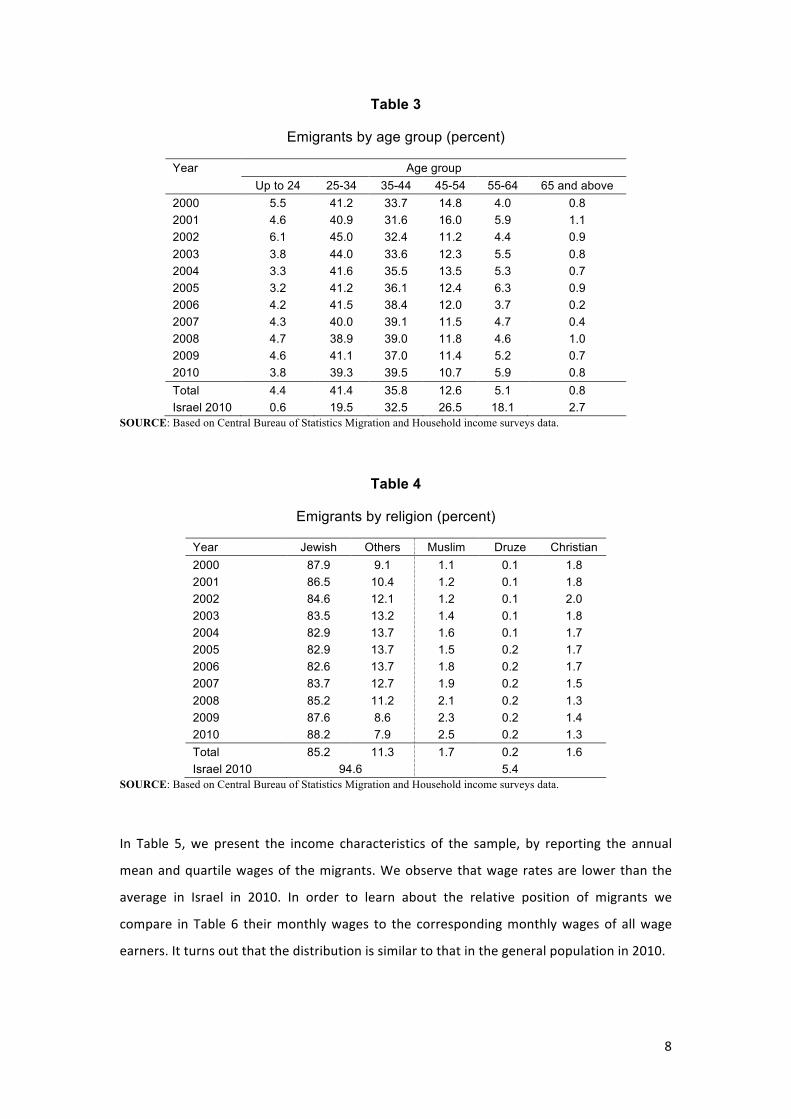
Table 3 breaks the migrants population into age groups. Most of them are in the middle
range: 25-‐34 and 35-‐44 years old. In Table 4, we report the composition of migrants by
religion. The Muslim population is under-‐represented in the list of migrants relative to its
share of the general population. Individuals of “other religions” (individuals who are neither
Jews, nor Christians or Muslims) are over-‐represented relative to their share in the general
population.
8
Table 3
Emigrants by age group (percent)
Year Age group
Up to 24 25-34 35-44 45-54 55-64 65 and above 2000 5.5 41.2 33.7 14.8 4.0 0.8 2001 4.6 40.9 31.6 16.0 5.9 1.1 2002 6.1 45.0 32.4 11.2 4.4 0.9 2003 3.8 44.0 33.6 12.3 5.5 0.8 2004 3.3 41.6 35.5 13.5 5.3 0.7 2005 3.2 41.2 36.1 12.4 6.3 0.9 2006 4.2 41.5 38.4 12.0 3.7 0.2 2007 4.3 40.0 39.1 11.5 4.7 0.4 2008 4.7 38.9 39.0 11.8 4.6 1.0 2009 4.6 41.1 37.0 11.4 5.2 0.7 2010 3.8 39.3 39.5 10.7 5.9 0.8 Total 4.4 41.4 35.8 12.6 5.1 0.8 Israel 2010 0.6 19.5 32.5 26.5 18.1 2.7
SOURCE: Based on Central Bureau of Statistics Migration and Household income surveys data.
Table 4
Emigrants by religion (percent)
Year Jewish Others Muslim Druze Christian 2000 87.9 9.1 1.1 0.1 1.8 2001 86.5 10.4 1.2 0.1 1.8 2002 84.6 12.1 1.2 0.1 2.0 2003 83.5 13.2 1.4 0.1 1.8 2004 82.9 13.7 1.6 0.1 1.7 2005 82.9 13.7 1.5 0.2 1.7 2006 82.6 13.7 1.8 0.2 1.7 2007 83.7 12.7 1.9 0.2 1.5 2008 85.2 11.2 2.1 0.2 1.3 2009 87.6 8.6 2.3 0.2 1.4 2010 88.2 7.9 2.5 0.2 1.3 Total 85.2 11.3 1.7 0.2 1.6 Israel 2010 94.6 5.4
SOURCE: Based on Central Bureau of Statistics Migration and Household income surveys data.
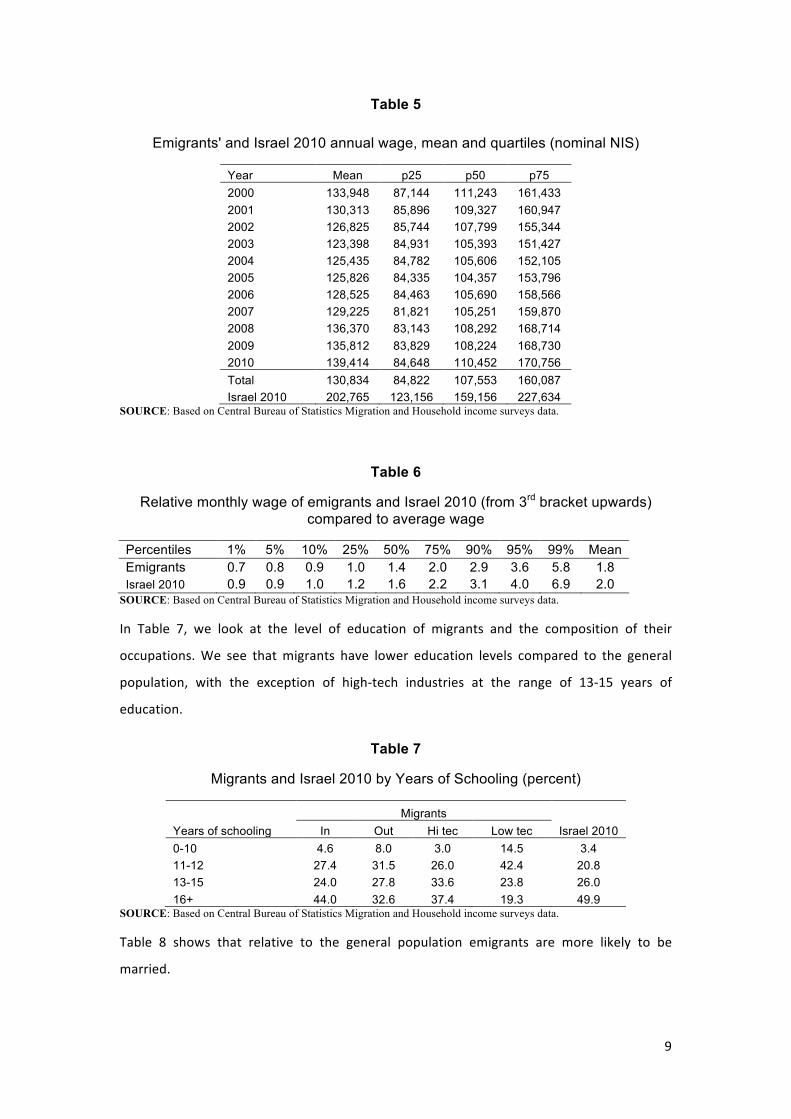
In Table 5, we present the income characteristics of the sample, by reporting the annual
mean and quartile wages of the migrants. We observe that wage rates are lower than the
average in Israel in 2010. In order to learn about the relative position of migrants we
compare in Table 6 their monthly wages to the corresponding monthly wages of all wage
earners. It turns out that the distribution is similar to that in the general population in 2010.
9
Table 5
Emigrants' and Israel 2010 annual wage, mean and quartiles (nominal NIS)
Year Mean p25 p50 p75 2000 133,948 87,144 111,243 161,433 2001 130,313 85,896 109,327 160,947 2002 126,825 85,744 107,799 155,344 2003 123,398 84,931 105,393 151,427 2004 125,435 84,782 105,606 152,105 2005 125,826 84,335 104,357 153,796 2006 128,525 84,463 105,690 158,566 2007 129,225 81,821 105,251 159,870 2008 136,370 83,143 108,292 168,714 2009 135,812 83,829 108,224 168,730 2010 139,414 84,648 110,452 170,756 Total 130,834 84,822 107,553 160,087 Israel 2010 202,765 123,156 159,156 227,634
SOURCE: Based on Central Bureau of Statistics Migration and Household income surveys data.
Table 6
Relative monthly wage of emigrants and Israel 2010 (from 3rd bracket upwards) compared to average wage
Percentiles 1% 5% 10% 25% 50% 75% 90% 95% 99% Mean Emigrants 0.7 0.8 0.9 1.0 1.4 2.0 2.9 3.6 5.8 1.8 Israel 2010 0.9 0.9 1.0 1.2 1.6 2.2 3.1 4.0 6.9 2.0
SOURCE: Based on Central Bureau of Statistics Migration and Household income surveys data.
In Table 7, we look at the level of education of migrants and the composition of their
occupations. We see that migrants have lower education levels compared to the general
population, with the exception of high-‐tech industries at the range of 13-‐15 years of
education.
Table 7
Migrants and Israel 2010 by Years of Schooling (percent)
Migrants Years of schooling In Out Hi tec Low tec Israel 2010 0-10 4.6 8.0 3.0 14.5 3.4 11-12 27.4 31.5 26.0 42.4 20.8 13-15 24.0 27.8 33.6 23.8 26.0 16+ 44.0 32.6 37.4 19.3 49.9
SOURCE: Based on Central Bureau of Statistics Migration and Household income surveys data.
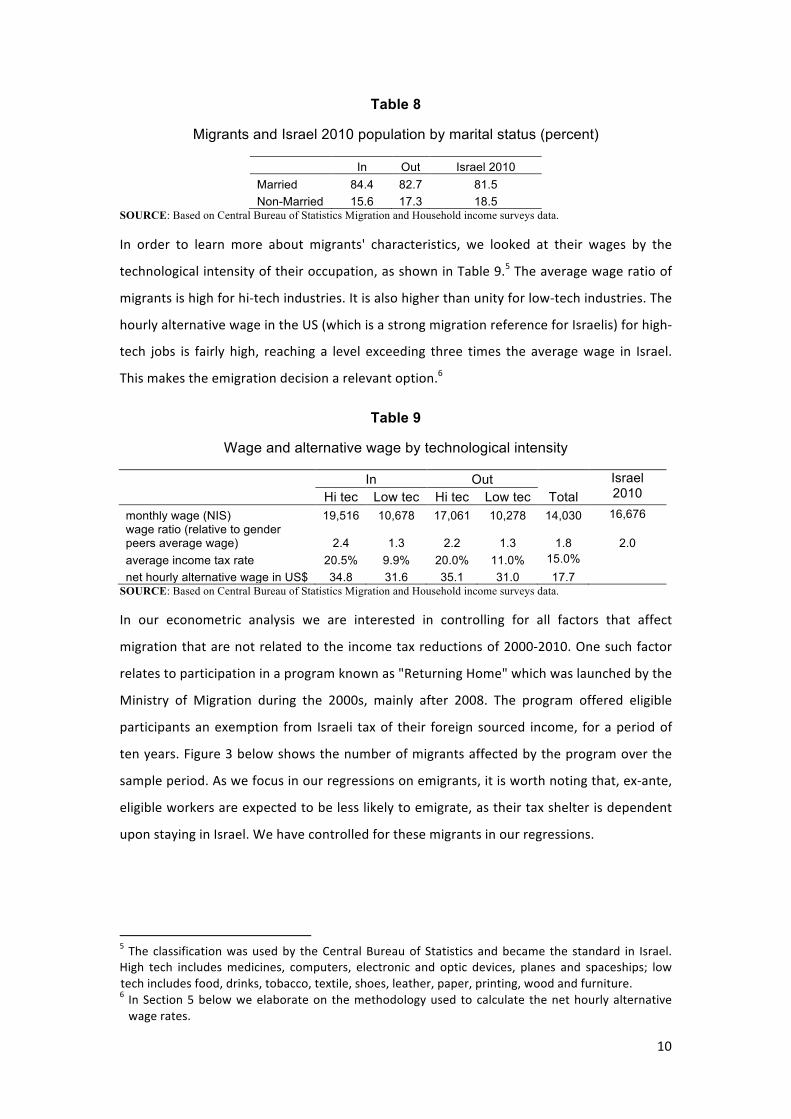
Table 8 shows that relative to the general population emigrants are more likely to be
married.
10
Table 8
Migrants and Israel 2010 population by marital status (percent)
In Out Israel 2010 Married 84.4 82.7 81.5 Non-Married 15.6 17.3 18.5
SOURCE: Based on Central Bureau of Statistics Migration and Household income surveys data.
In order to learn more about migrants' characteristics, we looked at their wages by the
technological intensity of their occupation, as shown in Table 9.5 The average wage ratio of
migrants is high for hi-‐tech industries. It is also higher than unity for low-‐tech industries. The
hourly alternative wage in the US (which is a strong migration reference for Israelis) for high-‐
tech jobs is fairly high, reaching a level exceeding three times the average wage in Israel.
This makes the emigration decision a relevant option.6
Table 9
Wage and alternative wage by technological intensity
In Out
Israel 2010 Hi tec Low tec Hi tec Low tec Total
monthly wage (NIS) 19,516 10,678 17,061 10,278 14,030 16,676 wage ratio (relative to gender peers average wage) 2.4 1.3 2.2 1.3 1.8
2.0
average income tax rate 20.5% 9.9% 20.0% 11.0% 15.0% net hourly alternative wage in US$ 34.8 31.6 35.1 31.0 17.7
SOURCE: Based on Central Bureau of Statistics Migration and Household income surveys data.
In our econometric analysis we are interested in controlling for all factors that affect
migration that are not related to the income tax reductions of 2000-‐2010. One such factor
relates to participation in a program known as "Returning Home" which was launched by the
Ministry of Migration during the 2000s, mainly after 2008. The program offered eligible
participants an exemption from Israeli tax of their foreign sourced income, for a period of
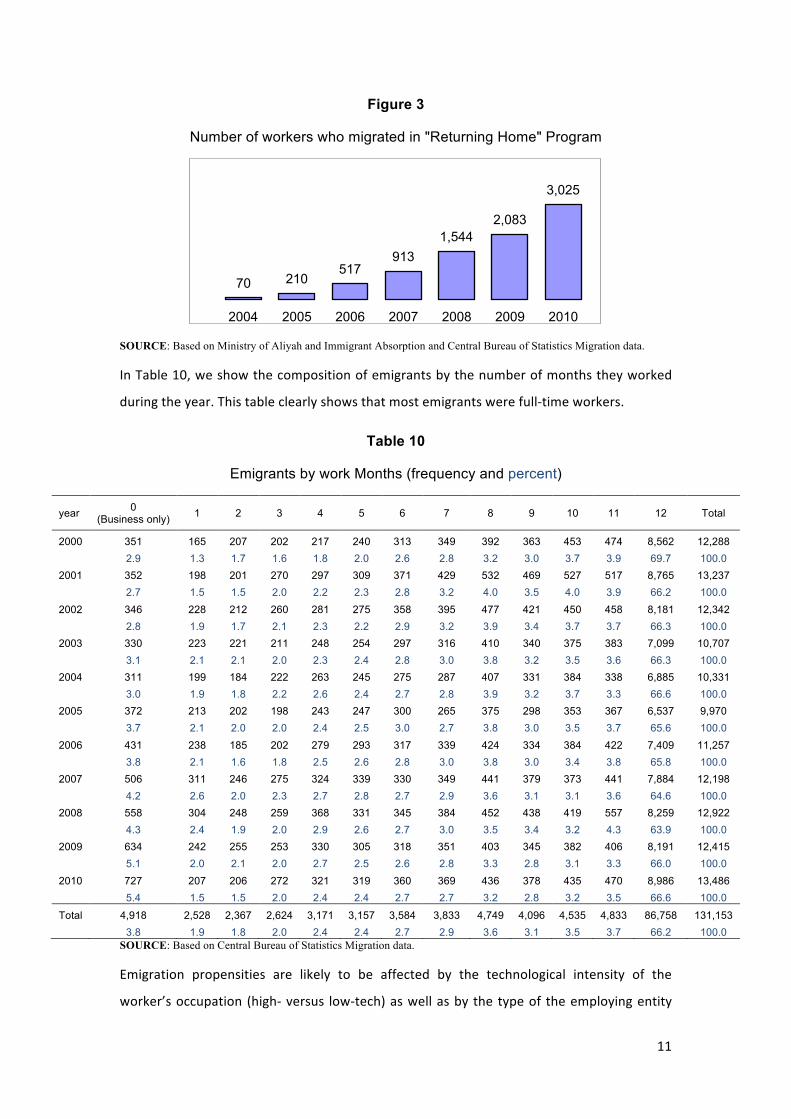
ten years. Figure 3 below shows the number of migrants affected by the program over the
sample period. As we focus in our regressions on emigrants, it is worth noting that, ex-‐ante,
eligible workers are expected to be less likely to emigrate, as their tax shelter is dependent
upon staying in Israel. We have controlled for these migrants in our regressions.
5 The classification was used by the Central Bureau of Statistics and became the standard in Israel. High tech includes medicines, computers, electronic and optic devices, planes and spaceships; low tech includes food, drinks, tobacco, textile, shoes, leather, paper, printing, wood and furniture. 6 In Section 5 below we elaborate on the methodology used to calculate the net hourly alternative wage rates.
11
Figure 3
Number of workers who migrated in "Returning Home" Program
SOURCE: Based on Ministry of Aliyah and Immigrant Absorption and Central Bureau of Statistics Migration data.
In Table 10, we show the composition of emigrants by the number of months they worked
during the year. This table clearly shows that most emigrants were full-‐time workers.
Table 10
Emigrants by work Months (frequency and percent)
year 0 (Business only) 1 2 3 4 5 6 7 8 9 10 11 12 Total
2000 351 165 207 202 217 240 313 349 392 363 453 474 8,562 12,288
2.9 1.3 1.7 1.6 1.8 2.0 2.6 2.8 3.2 3.0 3.7 3.9 69.7 100.0
2001 352 198 201 270 297 309 371 429 532 469 527 517 8,765 13,237
2.7 1.5 1.5 2.0 2.2 2.3 2.8 3.2 4.0 3.5 4.0 3.9 66.2 100.0
2002 346 228 212 260 281 275 358 395 477 421 450 458 8,181 12,342
2.8 1.9 1.7 2.1 2.3 2.2 2.9 3.2 3.9 3.4 3.7 3.7 66.3 100.0
2003 330 223 221 211 248 254 297 316 410 340 375 383 7,099 10,707
3.1 2.1 2.1 2.0 2.3 2.4 2.8 3.0 3.8 3.2 3.5 3.6 66.3 100.0
2004 311 199 184 222 263 245 275 287 407 331 384 338 6,885 10,331
3.0 1.9 1.8 2.2 2.6 2.4 2.7 2.8 3.9 3.2 3.7 3.3 66.6 100.0
2005 372 213 202 198 243 247 300 265 375 298 353 367 6,537 9,970
3.7 2.1 2.0 2.0 2.4 2.5 3.0 2.7 3.8 3.0 3.5 3.7 65.6 100.0
2006 431 238 185 202 279 293 317 339 424 334 384 422 7,409 11,257
3.8 2.1 1.6 1.8 2.5 2.6 2.8 3.0 3.8 3.0 3.4 3.8 65.8 100.0
2007 506 311 246 275 324 339 330 349 441 379 373 441 7,884 12,198
4.2 2.6 2.0 2.3 2.7 2.8 2.7 2.9 3.6 3.1 3.1 3.6 64.6 100.0
2008 558 304 248 259 368 331 345 384 452 438 419 557 8,259 12,922
4.3 2.4 1.9 2.0 2.9 2.6 2.7 3.0 3.5 3.4 3.2 4.3 63.9 100.0
2009 634 242 255 253 330 305 318 351 403 345 382 406 8,191 12,415
5.1 2.0 2.1 2.0 2.7 2.5 2.6 2.8 3.3 2.8 3.1 3.3 66.0 100.0
2010 727 207 206 272 321 319 360 369 436 378 435 470 8,986 13,486
5.4 1.5 1.5 2.0 2.4 2.4 2.7 2.7 3.2 2.8 3.2 3.5 66.6 100.0
Total 4,918 2,528 2,367 2,624 3,171 3,157 3,584 3,833 4,749 4,096 4,535 4,833 86,758 131,153 3.8 1.9 1.8 2.0 2.4 2.4 2.7 2.9 3.6 3.1 3.5 3.7 66.2 100.0
SOURCE: Based on Central Bureau of Statistics Migration data.
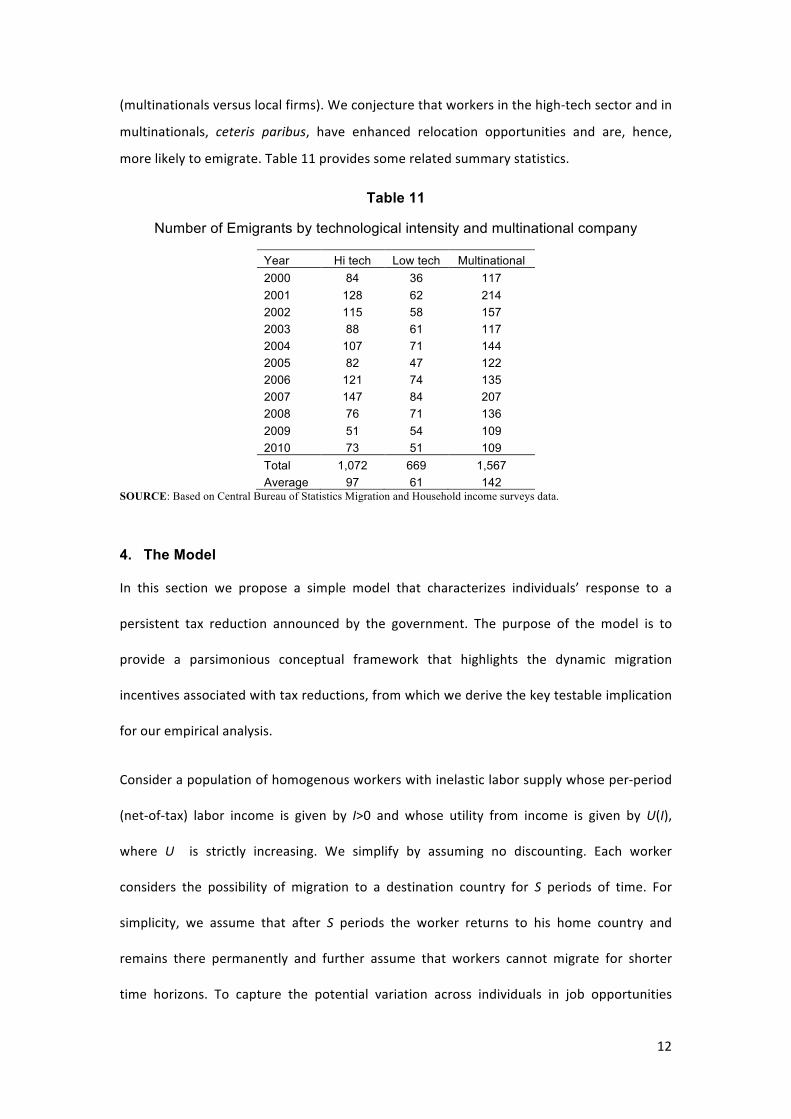
Emigration propensities are likely to be affected by the technological intensity of the
worker’s occupation (high-‐ versus low-‐tech) as well as by the type of the employing entity
70 210 517
913 1,544
2,083
3,025
2004 2005 2006 2007 2008 2009 2010
12
(multinationals versus local firms). We conjecture that workers in the high-‐tech sector and in
multinationals, ceteris paribus, have enhanced relocation opportunities and are, hence,
more likely to emigrate. Table 11 provides some related summary statistics.
Table 11
Number of Emigrants by technological intensity and multinational company
Year Hi tech Low tech Multinational 2000 84 36 117 2001 128 62 214 2002 115 58 157 2003 88 61 117 2004 107 71 144 2005 82 47 122 2006 121 74 135 2007 147 84 207 2008 76 71 136 2009 51 54 109 2010 73 51 109 Total 1,072 669 1,567 Average 97 61 142
SOURCE: Based on Central Bureau of Statistics Migration and Household income surveys data.
4. The Model
In this section we propose a simple model that characterizes individuals’ response to a
persistent tax reduction announced by the government. The purpose of the model is to
provide a parsimonious conceptual framework that highlights the dynamic migration
incentives associated with tax reductions, from which we derive the key testable implication
for our empirical analysis.
Consider a population of homogenous workers with inelastic labor supply whose per-‐period
(net-‐of-‐tax) labor income is given by I>0 and whose utility from income is given by U(I),
where U is strictly increasing. We simplify by assuming no discounting. Each worker
considers the possibility of migration to a destination country for S periods of time. For
simplicity, we assume that after S periods the worker returns to his home country and
remains there permanently and further assume that workers cannot migrate for shorter
time horizons. To capture the potential variation across individuals in job opportunities
13
abroad and migration costs, we assume that, at each period, the reservation utility
associated with migration for S periods, denoted by R, is drawn from a continuous
probability distribution function, G, with strictly positive densities, G’>0, over some support
[𝑅,𝑅].
In the benchmark setting the probability of migration at each period is therefore given by:
(1) Pr 𝑅 ≥ 𝑆𝑈 𝐼 = 1 − 𝐺[𝑆𝑈 𝐼 ]
Now suppose that at period t=0 the government announces a tax reform, according to which
each worker will be thereafter eligible for a tax reduction of T>0 per period, namely, his
post-‐reform net income (per period) will be given by I+T.
We plausibly allow for time inconsistency, by considering the possibility that the government
will ex-‐post renege on its announced policy reform. We assume that the government’s
propensity to renege on pre-‐announced policy reforms is unobserved by the workers.
However, the realization (or lack of realization) of the tax reform suggested may serve as an
informative signal for workers with respect to the propensity of the government to renege
and thereby affect the probability of migration.
We assume that there are two types of government, denoted by i=H, L, differing in their
propensity to renege on their announced policy reforms. Type-‐H implements its announced
policy reform at any period t>0 with probability 0 < 𝑞! < 1, whereas, Type-‐L implements its
announced policy reform at any period t>0 with probability 0 < 𝑞! < 1, with 𝑞! > 𝑞!. That
is, Type-‐H is more committed to its policy announcement and less likely to renege than
Type-‐L. Notice that for tractability we simplify by assuming that the probability to implement
the policy reform is identical and independent across time for each type of government.
Finally, we assume that the prior probabilities assigned by the workers to Type-‐H and Type-‐L
governments are given respectively, by 0 < 𝛼 < 1 and 0 < 1 − 𝛼 < 1.

14
Let 𝐸[𝑉! 𝑍!] denote the expected utility (evaluated at the beginning of period t for t>1)
associated with not migrating, namely, remaining in the home country for S periods of time
starting at period t, conditional on the history 𝑍!, where 𝑍! ≡ {𝑘!, 𝑘!,… , 𝑘!!!} with 𝑘!
denoting an indicator function assuming the value of one if the policy reform is implemented
at period s and zero otherwise. We further denote by 𝐸[𝑉!] the (unconditional) expected
utility evaluated at the beginning of period t=1.
The probability of migration at each period t, conditional on the history 𝑍!, is hence given
by:
(2) Pr 𝑅 ≥ 𝐸[𝑉! 𝑍!] = 1 − 𝐺[𝐸[𝑉! 𝑍!]].
Thus, the larger the expected utility associated with non-‐migration is the lower the
probability of migration turns out to be.
We let 𝑃![𝑘 = 𝐻 𝑍!] and 𝑃![𝑘 = 𝐿 𝑍!] denote the posterior probabilities (evaluated at the
beginning of period t, for t>1) assigned by the workers to Type-‐H and Type-‐L governments,
respectively, conditional on the history 𝑍!. By virtue of our previous assumptions the prior
probabilities assigned to Type-‐H and Type-‐L, respectively, are given by 𝑃! 𝑘 = 𝐻 = 𝛼 and
𝑃! 𝑘 = 𝐿 = 1 − 𝛼.
Employing the above notation one can derive expressions for the expected utility from non-‐
migration. The unconditional expected utility at the outset (upon announcement of the tax
reform) is given by:
(3) 𝐸[𝑉!] = 𝑆 𝛼𝑞! + 1 − 𝛼 𝑞! 𝑈 𝐼 + 𝑇 + 𝛼(1 − 𝑞!) + 1 − 𝛼 (1 − 𝑞!) 𝑈(𝐼)
The expected utility at the beginning of period t, t>1, depends on the history, 𝑍!, and given
by:

15
(4) 𝐸[𝑉! 𝑍!] = 𝑆𝑃![𝑘 = 𝐻 𝑍!]𝑞! + 𝑃![𝑘 = 𝐿 𝑍!]𝑞! 𝑈 𝐼 + 𝑇 +
𝑃 + 𝑃 𝑈 𝐼
By virtue of the independence property, the posterior probabilities and hence the expected
utility at any period t are invariant to any permutation of the history vector 𝑍!. That is, the
order of realizations has no impact on the expected utility. Employing the invariance
property one can show that the posterior probability assigned to Type-‐H at (the beginning
of) any period t is increasing with respect to the number of periods (prior to t) in which the
tax reduction has been implemented and decreasing with respect to the number of periods
in which the government reneged on its announced policy reform.
To see this let 𝐹!! denote the set of all histories, 𝑍!, during which the tax reduction has
been implemented in exactly m periods. Further let an element in the set 𝐹!! be denoted by
𝑍!!. Notice that by the invariance property the posterior probability at t associated with any
history 𝑍!! is identical. We need to show that for any t, 𝑃! 𝑘 = 𝐻 𝑍!! > 𝑃! 𝑘 = 𝐻 𝑍!! for
m>n. We will prove the property for m=n+1. The result will then follow by induction.
By virtue of Bayes’ Rule it follows that:
(5) 𝑃! 𝑘 = 𝐻 𝑍!!!! = !!!! !!! !!!!! !!
!!!! !!! !!!!! !!!!!!! !!! !!!!
! !!> 𝑃!!! 𝑘 = 𝐻 𝑍!!!! ,
where the inequality sign follows as 𝑞! > 𝑞! .
Applying again Bayes’ Rule it follows that:
(6) 𝑃! 𝑘 = 𝐻 𝑍!! = !!!! !!! !!!!! (!!!!)
!!!! !!! !!!!! (!!!!)!!!!! !!! !!!!
! (!!!!)< 𝑃!!! 𝑘 = 𝐻 𝑍!!!! ,
where the inequality sign follows as 𝑞! > 𝑞!.
Combining (5) and (6) then yields:
(7) 𝑃! 𝑘 = 𝐻 𝑍!!!! > 𝑃! 𝑘 = 𝐻 𝑍!! .
16
This completes the proof.
Employing (4), following some algebraic manipulations and re-‐arranging yields:
(8) 𝐸[𝑉! 𝑍!!!!] − 𝐸[𝑉! 𝑍!!] =
𝑆(𝑞! − 𝑞!)[𝑈(𝐼 + 𝑇) − 𝑈(𝐼)] 𝑃! 𝑘 = 𝐻 𝑍!!!! − 𝑃! 𝑘 = 𝐻 𝑍!! > 0,
where the inequality sign follows from (7) and as 𝑞! > 𝑞!.
We conclude that as the government persists in implementing its pre-‐announced tax
reduction, the posterior probability assigned to Type-‐H increases and hence, the gains from
non-‐migration increase, reflecting an updated lower assessment of the probability of
reneging by the government. This implies, by virtue of (2), a corresponding decrease in the
probability of migration. The latter constitutes the key testable implication for our empirical
analysis below, namely the negative relation between the accumulated tax reductions and
the propensity to emigrate.
5. The Effect of Permanent Tax Reductions: Econometric Analysis
In this section we perform an econometric analysis of the emigration decision, using a
framework that embeds the key insight from the model presented above, namely that the
emigration decision is associated with the cumulative gains from tax reductions, reflecting a
persistent implementation of a pre-‐announced tax reform.7
As explained in Section 3, the data is based on migration flows that are longer than one year.
This opens the possibility that an emigrant left Israel for a short period of time, say, 2 years,
and then returned to Israel. Two comments are in order: i) our econometric analysis is not
aimed at explaining permanent migration, but rather attempts to shed light on the
relationship between the timing of migration (for shorter or longer periods of time) and the
generosity of the tax reductions; ii) concerning emigrants, we have the possibility of tracking
7 In the appendix we provide a supplementary difference-‐in-‐difference analysis testing the illustrative model’s predictions.
17
their employment history, assuming that once they come back they return to the labor
market – which is the representative case (note that according to the data shown above, the
bulk of emigrants take their decision at an early stage – between 25 and 44 years old). There
are 9,428 observations of this type, which represent 5.3 percent of our migrations sample.
For 2,000 out of them we have data on the duration of their stay abroad, which averages
521 days, with a minimum of 364 days and a maximum of 3,097 days.
5.1 Emigration sensitivity to Tax Reductions for high-‐tech and low-‐tech workers
In order to allow the data to provide disaggregate information, we will separate our analysis
by looking into two groups of individuals: high-‐tech and low-‐tech workers. High-‐tech
industries are based on the global development of technologies around the world, and
consequently the human capital (know-‐how associated with education and/or on-‐the-‐job
experience) of workers in these industries is typically transferrable to a large extent across
countries and job prospects of these workers are, hence, less sensitive to fluctuations in
local demand. In contrast, low-‐tech workers are more dependent on local demand, thus we
expect that the net benefits from migration would be higher for high-‐tech workers.8 The
difference in the education patterns between these two sectors is readily reflected in Table
7: the share of workers in the high-‐tech with years of schooling weakly exceeding 16 is 37
percent, compared with 19 percent in the low tech.
We generalize this framework by including all other relevant factors that affect emigration,
which include: gender, age, religion, participation in the "Returning Home" Program, marital
status, affiliation with multinational companies, and key economic factors. The latter include
the main macroeconomic and microeconomic variables. Among the first category, we
included the unemployment rate in Israel and in the main destination countries (G7).
Concerning microeconomic factors, we calculated the alternative wage based on Mincer
regressions, namely the hypothetical wage rate that could be earned in the destination
country conditional on the observed characteristics of the worker. The calculation is based
on the findings shown by Polachek [(1981) and more recently (2008)) who constructed
Mincer equations that include occupational affiliation, age and gender as explanatory
variables of the observed wage in a large group of developed economies. Using the reported
8 Jaimovich and Siu (2012) show, for instance, that the demand for jobs that are homogeneous and that do not require creativity (routine and middle-‐skilled jobs) collapses during recessions, resulting in persistent unemployment within these occupations.
18
coefficients we imputed an alternative wage for each emigrant, which is based on his/her
own personal characteristics (gender, age and occupation). For this purpose we used data
from the US, France and the UK. Based on administrative data regarding the statutory tax
rates in place, we have calculated the average tax rate for each individual and derived
his/her alternative net wage.
We also included as explanatory variables key public goods provided by the government
(i.e., represented by government expenditure) in Israel and abroad: education and health. It
turned out that government expenditure on education for the different levels (primary,
secondary and higher education) did not have a significant impact. Health expenditure, in
contrast, resulted in significant coefficients. Our data source for the expenditure on both
education and health is the OECD.
The key regression specification takes the following form:
𝐸!,! = 𝐶! + 𝐴𝑁𝑊!,! +𝑊!,! + 𝐼𝑇!,! + 𝑍!,
where the dependent variable E represents the emigration decision for a worker of sector i
at time t. Note that individuals may decide to emigrate in every single year during the
sample, whereas in practice they do so at a particular timing. C represents the emigration
cost/benefit that is idiosyncratic to each sector, where i=1 for high tech and i=2 for low tech;
ANW is the alternative net wage at the destination country which is calculated as a weighted
average of the alternative wage rates in the US (50 percent), France (25 percent) and the UK
(25 percent)9; W is the gross wage in Israel; IT is the income tax; and Z is the vector of the
control variables, including gender, age, squared age, religion (Muslim, Christian, Druze),
unemployment in Israel, unemployment in G7 countries, marital status and some interaction
terms as we explain later. Note also that we include the business wage (namely, the cost
incurred by the employer) as an additional variable, although for data quality considerations
we base our analysis on employees' wages.
In Table 12 we show the results of the basic specification using d(probit). Columns 1 and 2
present the fixed effect for high-‐tech and low-‐tech employees respectively, in a separate
way (i.e., compared to all other sectors); Column 3 presents the results when fixed effects
appear together at the same regression (compared to all other sectors besides those two).
The coefficients represent the marginal effect of a change in the independent variables, in
probability terms. Note that all (micro and macro) variables have the expected sign. The
9 The US and Europe account for 90 percent of Israelis' emigrations.
19
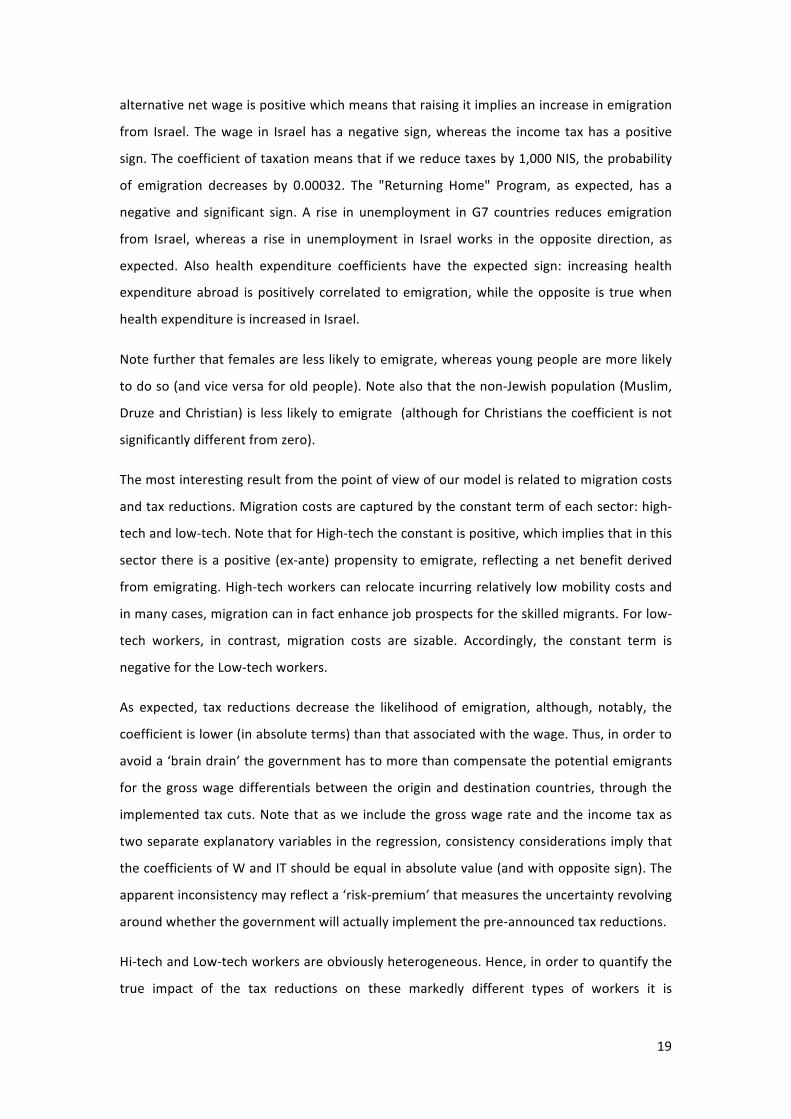
alternative net wage is positive which means that raising it implies an increase in emigration
from Israel. The wage in Israel has a negative sign, whereas the income tax has a positive
sign. The coefficient of taxation means that if we reduce taxes by 1,000 NIS, the probability
of emigration decreases by 0.00032. The "Returning Home" Program, as expected, has a
negative and significant sign. A rise in unemployment in G7 countries reduces emigration
from Israel, whereas a rise in unemployment in Israel works in the opposite direction, as
expected. Also health expenditure coefficients have the expected sign: increasing health
expenditure abroad is positively correlated to emigration, while the opposite is true when
health expenditure is increased in Israel.
Note further that females are less likely to emigrate, whereas young people are more likely
to do so (and vice versa for old people). Note also that the non-‐Jewish population (Muslim,
Druze and Christian) is less likely to emigrate (although for Christians the coefficient is not
significantly different from zero).
The most interesting result from the point of view of our model is related to migration costs
and tax reductions. Migration costs are captured by the constant term of each sector: high-‐
tech and low-‐tech. Note that for High-‐tech the constant is positive, which implies that in this
sector there is a positive (ex-‐ante) propensity to emigrate, reflecting a net benefit derived
from emigrating. High-‐tech workers can relocate incurring relatively low mobility costs and
in many cases, migration can in fact enhance job prospects for the skilled migrants. For low-‐
tech workers, in contrast, migration costs are sizable. Accordingly, the constant term is
negative for the Low-‐tech workers.
As expected, tax reductions decrease the likelihood of emigration, although, notably, the
coefficient is lower (in absolute terms) than that associated with the wage. Thus, in order to
avoid a ‘brain drain’ the government has to more than compensate the potential emigrants
for the gross wage differentials between the origin and destination countries, through the
implemented tax cuts. Note that as we include the gross wage rate and the income tax as
two separate explanatory variables in the regression, consistency considerations imply that
the coefficients of W and IT should be equal in absolute value (and with opposite sign). The
apparent inconsistency may reflect a ‘risk-‐premium’ that measures the uncertainty revolving
around whether the government will actually implement the pre-‐announced tax reductions.
Hi-‐tech and Low-‐tech workers are obviously heterogeneous. Hence, in order to quantify the
true impact of the tax reductions on these markedly different types of workers it is
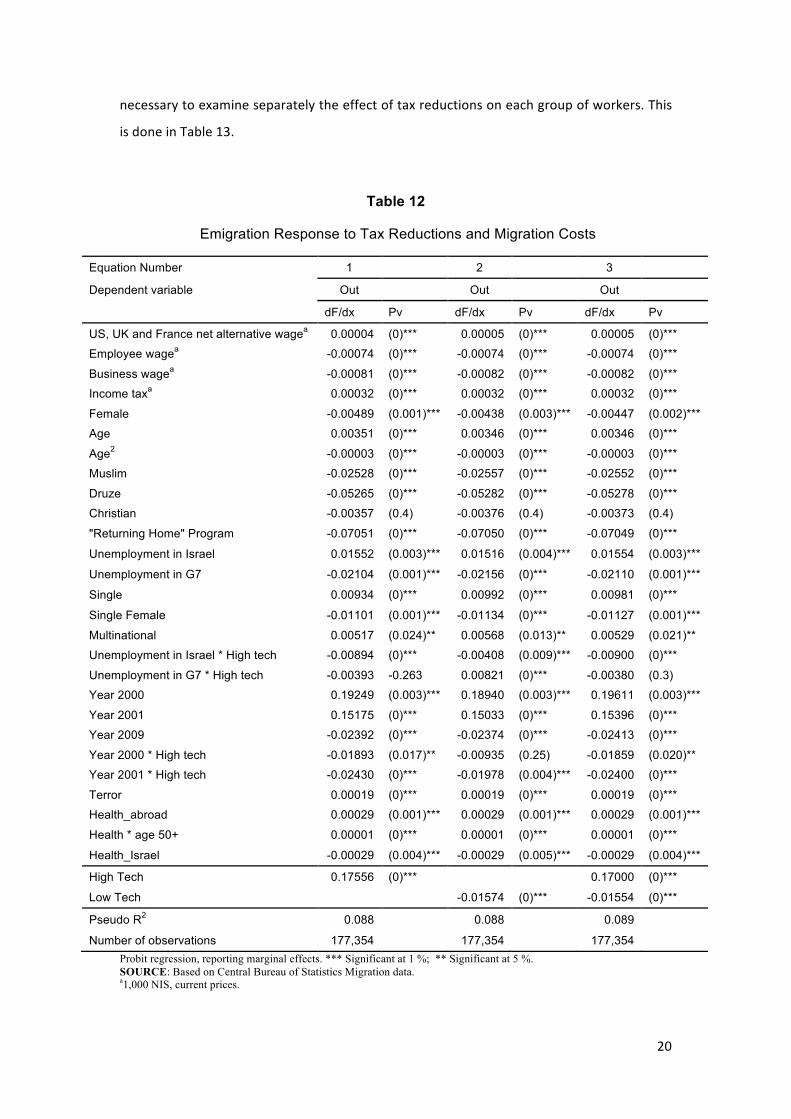
20
necessary to examine separately the effect of tax reductions on each group of workers. This
is done in Table 13.
Table 12
Emigration Response to Tax Reductions and Migration Costs
Equation Number 1 2 3
Dependent variable Out Out Out
dF/dx Pv dF/dx Pv dF/dx Pv
US, UK and France net alternative wagea 0.00004 (0)*** 0.00005 (0)*** 0.00005 (0)***
Employee wagea -0.00074 (0)*** -0.00074 (0)*** -0.00074 (0)***
Business wagea -0.00081 (0)*** -0.00082 (0)*** -0.00082 (0)***
Income taxa 0.00032 (0)*** 0.00032 (0)*** 0.00032 (0)***
Female -0.00489 (0.001)*** -0.00438 (0.003)*** -0.00447 (0.002)***
Age 0.00351 (0)*** 0.00346 (0)*** 0.00346 (0)***
Age2 -0.00003 (0)*** -0.00003 (0)*** -0.00003 (0)***
Muslim -0.02528 (0)*** -0.02557 (0)*** -0.02552 (0)***
Druze -0.05265 (0)*** -0.05282 (0)*** -0.05278 (0)***
Christian -0.00357 (0.4) -0.00376 (0.4) -0.00373 (0.4)
"Returning Home" Program -0.07051 (0)*** -0.07050 (0)*** -0.07049 (0)***
Unemployment in Israel 0.01552 (0.003)*** 0.01516 (0.004)*** 0.01554 (0.003)***
Unemployment in G7 -0.02104 (0.001)*** -0.02156 (0)*** -0.02110 (0.001)***
Single 0.00934 (0)*** 0.00992 (0)*** 0.00981 (0)***
Single Female -0.01101 (0.001)*** -0.01134 (0)*** -0.01127 (0.001)***
Multinational 0.00517 (0.024)** 0.00568 (0.013)** 0.00529 (0.021)**
Unemployment in Israel * High tech -0.00894 (0)*** -0.00408 (0.009)*** -0.00900 (0)***
Unemployment in G7 * High tech -0.00393 -0.263 0.00821 (0)*** -0.00380 (0.3)
Year 2000 0.19249 (0.003)*** 0.18940 (0.003)*** 0.19611 (0.003)***
Year 2001 0.15175 (0)*** 0.15033 (0)*** 0.15396 (0)***
Year 2009 -0.02392 (0)*** -0.02374 (0)*** -0.02413 (0)***
Year 2000 * High tech -0.01893 (0.017)** -0.00935 (0.25) -0.01859 (0.020)**
Year 2001 * High tech -0.02430 (0)*** -0.01978 (0.004)*** -0.02400 (0)***
Terror 0.00019 (0)*** 0.00019 (0)*** 0.00019 (0)***
Health_abroad 0.00029 (0.001)*** 0.00029 (0.001)*** 0.00029 (0.001)***
Health * age 50+ 0.00001 (0)*** 0.00001 (0)*** 0.00001 (0)***
Health_Israel -0.00029 (0.004)*** -0.00029 (0.005)*** -0.00029 (0.004)***
High Tech 0.17556 (0)***
0.17000 (0)***
Low Tech -0.01574 (0)*** -0.01554 (0)***
Pseudo R2 0.088
0.088
0.089 Number of observations 177,354 177,354 177,354
Probit regression, reporting marginal effects. *** Significant at 1 %; ** Significant at 5 %. SOURCE: Based on Central Bureau of Statistics Migration data. a1,000 NIS, current prices.
21
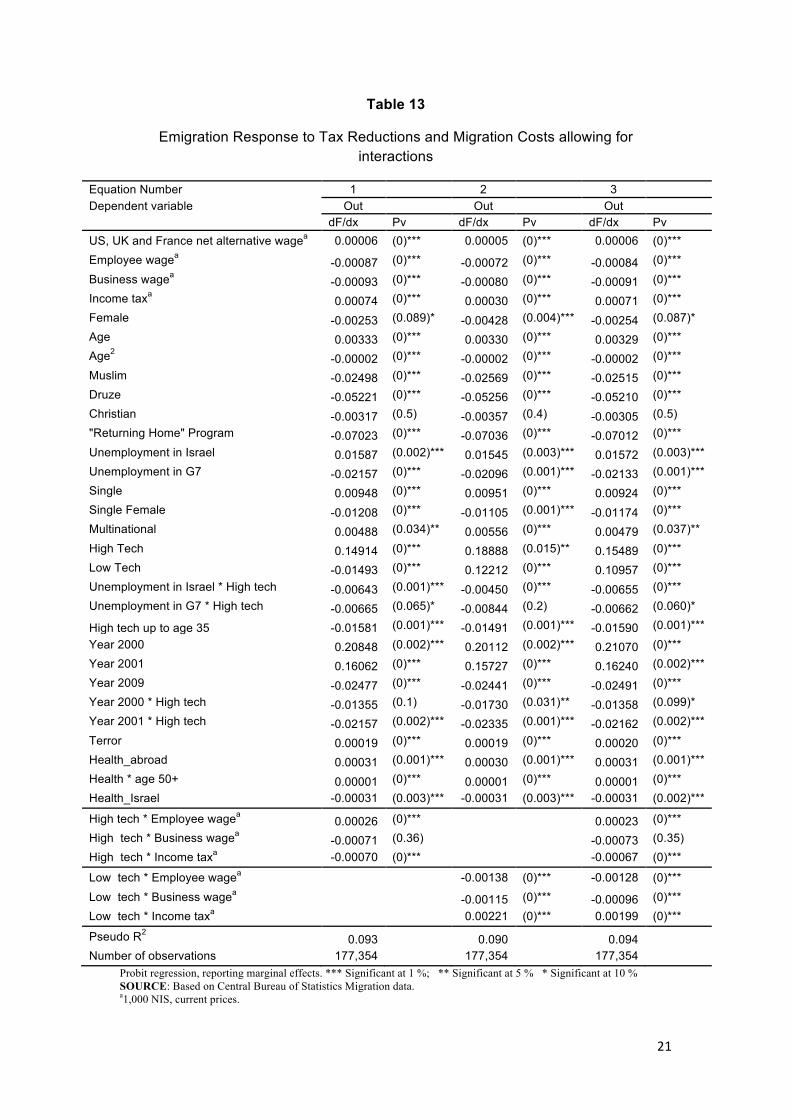
Table 13
Emigration Response to Tax Reductions and Migration Costs allowing for interactions
Equation Number 1 2 3 Dependent variable Out Out Out
dF/dx Pv dF/dx Pv dF/dx Pv
US, UK and France net alternative wagea 0.00006 (0)*** 0.00005 (0)*** 0.00006 (0)*** Employee wagea -0.00087 (0)*** -0.00072 (0)*** -0.00084 (0)*** Business wagea -0.00093 (0)*** -0.00080 (0)*** -0.00091 (0)*** Income taxa 0.00074 (0)*** 0.00030 (0)*** 0.00071 (0)*** Female -0.00253 (0.089)* -0.00428 (0.004)*** -0.00254 (0.087)* Age 0.00333 (0)*** 0.00330 (0)*** 0.00329 (0)*** Age2 -0.00002 (0)*** -0.00002 (0)*** -0.00002 (0)*** Muslim -0.02498 (0)*** -0.02569 (0)*** -0.02515 (0)*** Druze -0.05221 (0)*** -0.05256 (0)*** -0.05210 (0)*** Christian -0.00317 (0.5) -0.00357 (0.4) -0.00305 (0.5) "Returning Home" Program -0.07023 (0)*** -0.07036 (0)*** -0.07012 (0)*** Unemployment in Israel 0.01587 (0.002)*** 0.01545 (0.003)*** 0.01572 (0.003)*** Unemployment in G7 -0.02157 (0)*** -0.02096 (0.001)*** -0.02133 (0.001)*** Single 0.00948 (0)*** 0.00951 (0)*** 0.00924 (0)*** Single Female -0.01208 (0)*** -0.01105 (0.001)*** -0.01174 (0)*** Multinational 0.00488 (0.034)** 0.00556 (0)*** 0.00479 (0.037)** High Tech 0.14914 (0)*** 0.18888 (0.015)** 0.15489 (0)*** Low Tech -0.01493 (0)*** 0.12212 (0)*** 0.10957 (0)*** Unemployment in Israel * High tech -0.00643 (0.001)*** -0.00450 (0)*** -0.00655 (0)*** Unemployment in G7 * High tech -0.00665 (0.065)* -0.00844 (0.2) -0.00662 (0.060)*
High tech up to age 35 -0.01581 (0.001)*** -0.01491 (0.001)*** -0.01590 (0.001)*** Year 2000 0.20848 (0.002)*** 0.20112 (0.002)*** 0.21070 (0)*** Year 2001 0.16062 (0)*** 0.15727 (0)*** 0.16240 (0.002)*** Year 2009 -0.02477 (0)*** -0.02441 (0)*** -0.02491 (0)*** Year 2000 * High tech -0.01355 (0.1) -0.01730 (0.031)** -0.01358 (0.099)* Year 2001 * High tech -0.02157 (0.002)*** -0.02335 (0.001)*** -0.02162 (0.002)*** Terror 0.00019 (0)*** 0.00019 (0)*** 0.00020 (0)*** Health_abroad 0.00031 (0.001)*** 0.00030 (0.001)*** 0.00031 (0.001)*** Health * age 50+ 0.00001 (0)*** 0.00001 (0)*** 0.00001 (0)*** Health_Israel -0.00031 (0.003)*** -0.00031 (0.003)*** -0.00031 (0.002)***
High tech * Employee wagea 0.00026 (0)***
0.00023 (0)*** High tech * Business wagea -0.00071 (0.36)
-0.00073 (0.35)
High tech * Income taxa -0.00070 (0)*** -0.00067 (0)***
Low tech * Employee wagea
-0.00138 (0)*** -0.00128 (0)*** Low tech * Business wagea
-0.00115 (0)*** -0.00096 (0)***
Low tech * Income taxa 0.00221 (0)*** 0.00199 (0)***
Pseudo R2 0.093 0.090 0.094 Number of observations 177,354 177,354 177,354
Probit regression, reporting marginal effects. *** Significant at 1 %; ** Significant at 5 % * Significant at 10 % SOURCE: Based on Central Bureau of Statistics Migration data. a1,000 NIS, current prices.
22
The results shown in Table 13 indicate that the signs of all coefficients are as expected, with
a statistical significance that in most cases is less than 1 percent. Among the controls we
included interactions of unemployment in Israel and in G7 countries, which show that hi-‐
tech is less sensitive to local unemployment and more sensitive to unemployment abroad.
We also controlled for years that represented a remarkable phase of a cycle: 2000 (high rate
of growth) and 2001, 2002 and 2009 (recessions). For 2000 and 2001 we allowed for an
interaction with high-‐tech, since 2000 represents the high-‐tech bubble and 2001 its burst.
Interestingly these variables were all significant and with expected signs. Thus, in 2001, the
sum of the coefficients associated with the year dummy and the interacted year dummy
with the high-‐tech sector is slightly positive.
To understand the impact of the tax reduction on each group of workers it is necessary to
compare the sum of coefficients that include also the interaction terms. From this point of
view the results are suggestive. The interaction term of income tax for high-‐tech is negative,
which implies that for this kind of workers the impact of tax reductions is less important
when compared to the general case. The opposite is true for low-‐tech workers, for whom
the interaction term is positive – which means that tax reductions are more effective for
incentivizing low-‐tech workers to avoid emigration. These results are valid also for wages:
the overall sensitivity of high-‐tech workers to wages declines when we allow for interactions,
while the one of low-‐tech workers is enhanced.
In Table 14 we summarize the effect of these variables on emigration. An interesting issue is
related to the calculation of the amount of the tax reduction for the purpose of simulating
the effect of a hypothetical tax reduction on the number of emigrants. Note that since tax
reductions analyzed in our paper are permanent, they can be implemented in a limited way:
this is so because in the short run tax reductions lower tax revenues and consequently raise
government deficit and debt, which means that their scope is limited. In the long-‐run, given
that in Israel there is a budget deficit reduction law that prevents an increase in the deficit, a
permanent tax reduction reduces the size of the government. Thus, permanent tax
reductions that are implemented with a parallel reduction in government expenditure
change the political economy equilibrium. In the case of Israel, there was a well-‐known
general public protest that induced policy-‐makers to raise back the income and corporate
tax rates after 2011, bringing them to the levels that prevailed in April 2007.10 For the
10 See Achdut, Spivak and Strawczynski (2013).
23
purposes of our simulation we only consider the tax reductions implemented until 2007,
reflecting a feasible permanent tax reduction.11
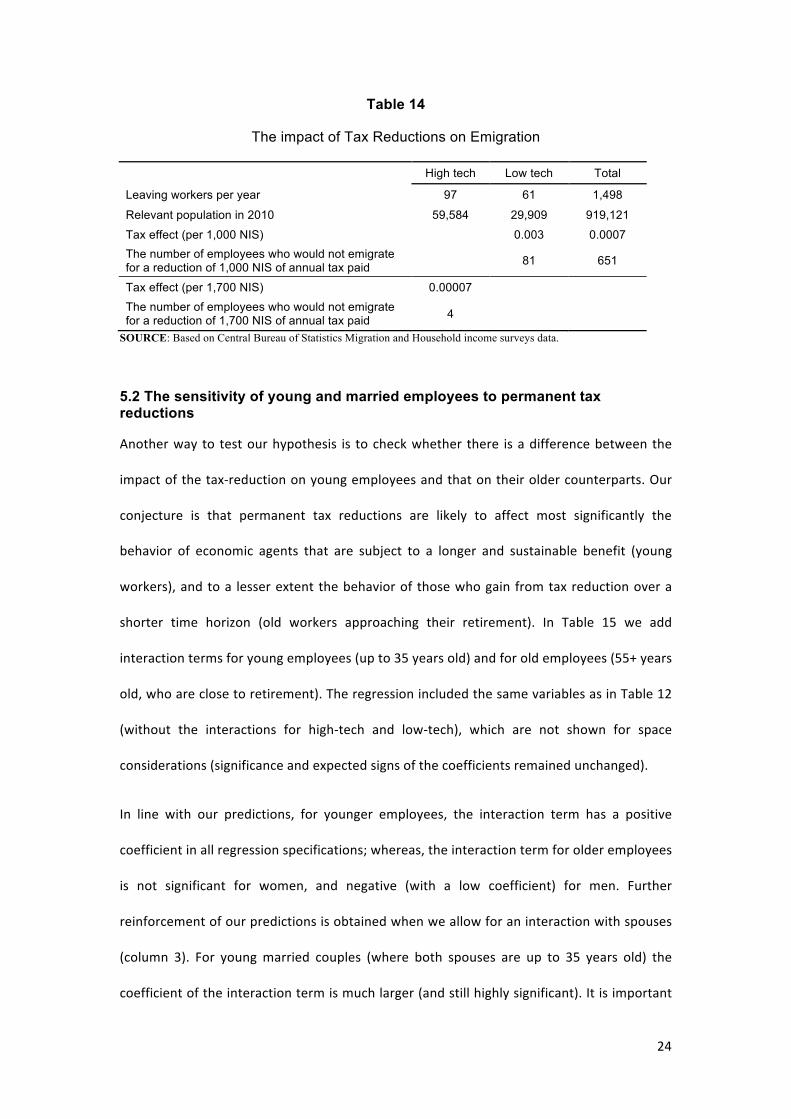
The results indicate that the effect of tax reductions is much stronger for low-‐tech workers
than for high-‐tech ones, implying that tax reductions are more effective for low-‐tech
workers, who appear to be fairly sensitive to their pecuniary reward. In order to perform the
simulation we stress first that the average wage of high-‐tech workers is 1.7 times higher
than the one for low-‐tech. Thus, we reduce taxes by 1,000 NIS for low-‐tech workers and by
1,700 NIS for high-‐tech workers (ensuring that the reduction in percentage terms is identical
across the two sectors). Reducing taxes by an annual amount of 1,000 NIS would reduce the
number of low-‐tech emigrants by 81, which represents approximately 133 percent of the
annual emigration flow; whereas, for the high-‐tech sector, a tax reduction of 1,700 NIS
would imply reducing emigration by 4 employees, which is only 5 percent of the annual
emigration flow. These numbers reflect migration elasticities (with respect to the net-‐of-‐tax
wage rates) of 0.25 and 0.05 for the low-‐tech and the high-‐tech workers, respectively, and
an elasticity of 0.09 for all potential emigrants.
Note that these figures are substantially lower than the elasticity found by Kleven, Landais,
Saez and Schultz (2014) for the Danish case. The latter may be attributed to the fact that the
elasticity found by Kleven et al. (2014) reflects a short-‐term response to a temporary tax
reform confined to the top bracket, whereas in our case, the elasticity reflects a long-‐term
response to a permanent tax reduction associated with middle and high brackets. In
addition, our analysis focuses on the reduction in emigration rates, and does not account for
the corresponding likely increase in migration rates.
11 Our calculation assumes that statutory tax rates remain at this level. The amount of the reduction was calibrated according to a monthly wage of 10,000 NIS, which is similar to the wage of low-‐tech workers who emigrated (see Table 9). According to recently published calculations by the Bank of Israel, further tax increases are needed in order to finance current government obligations.
24
Table 14
The impact of Tax Reductions on Emigration
High tech Low tech Total
Leaving workers per year 97 61 1,498
Relevant population in 2010 59,584 29,909 919,121
Tax effect (per 1,000 NIS) 0.003 0.0007 The number of employees who would not emigrate for a reduction of 1,000 NIS of annual tax paid 81 651
Tax effect (per 1,700 NIS) 0.00007 The number of employees who would not emigrate for a reduction of 1,700 NIS of annual tax paid 4
SOURCE: Based on Central Bureau of Statistics Migration and Household income surveys data.
5.2 The sensitivity of young and married employees to permanent tax reductions
Another way to test our hypothesis is to check whether there is a difference between the
impact of the tax-‐reduction on young employees and that on their older counterparts. Our
conjecture is that permanent tax reductions are likely to affect most significantly the
behavior of economic agents that are subject to a longer and sustainable benefit (young
workers), and to a lesser extent the behavior of those who gain from tax reduction over a
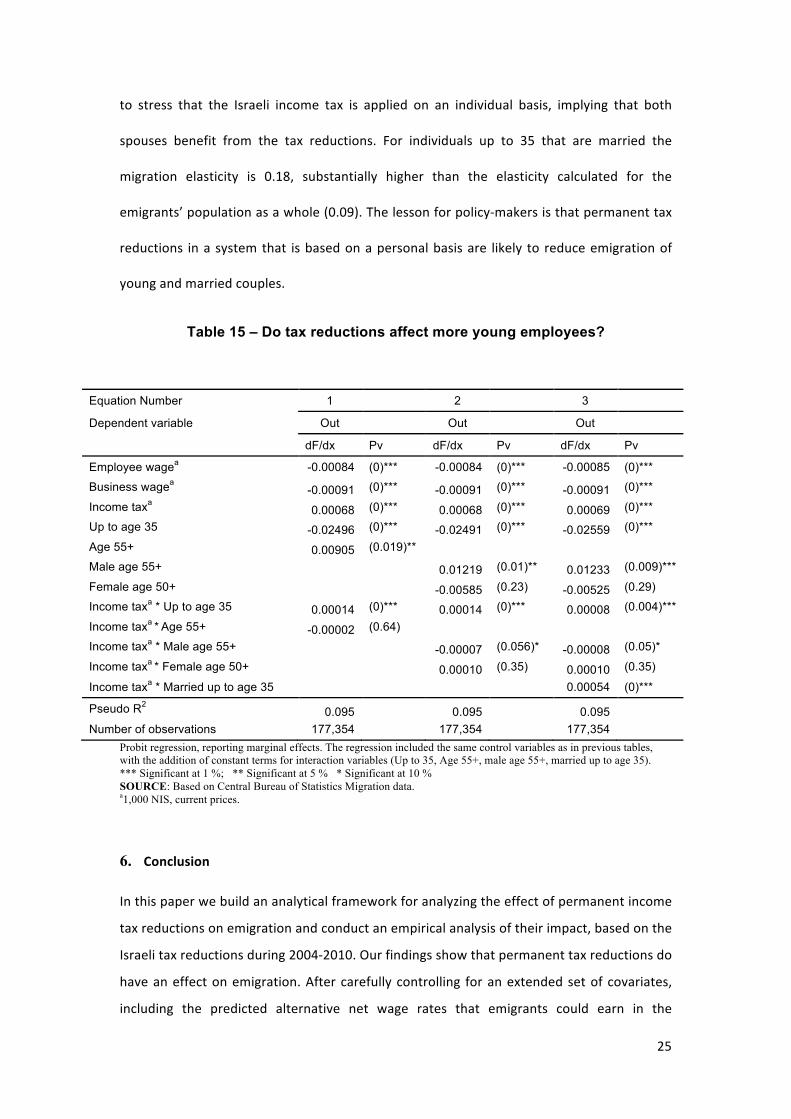
shorter time horizon (old workers approaching their retirement). In Table 15 we add
interaction terms for young employees (up to 35 years old) and for old employees (55+ years
old, who are close to retirement). The regression included the same variables as in Table 12
(without the interactions for high-‐tech and low-‐tech), which are not shown for space
considerations (significance and expected signs of the coefficients remained unchanged).
In line with our predictions, for younger employees, the interaction term has a positive
coefficient in all regression specifications; whereas, the interaction term for older employees
is not significant for women, and negative (with a low coefficient) for men. Further
reinforcement of our predictions is obtained when we allow for an interaction with spouses
(column 3). For young married couples (where both spouses are up to 35 years old) the
coefficient of the interaction term is much larger (and still highly significant). It is important
25
to stress that the Israeli income tax is applied on an individual basis, implying that both
spouses benefit from the tax reductions. For individuals up to 35 that are married the
migration elasticity is 0.18, substantially higher than the elasticity calculated for the
emigrants’ population as a whole (0.09). The lesson for policy-‐makers is that permanent tax
reductions in a system that is based on a personal basis are likely to reduce emigration of
young and married couples.
Table 15 – Do tax reductions affect more young employees?
Equation Number 1 2 3
Dependent variable Out Out Out
dF/dx Pv dF/dx Pv dF/dx Pv
Employee wagea -0.00084 (0)*** -0.00084 (0)*** -0.00085 (0)***
Business wagea -0.00091 (0)*** -0.00091 (0)*** -0.00091 (0)***
Income taxa 0.00068 (0)*** 0.00068 (0)*** 0.00069 (0)***
Up to age 35 -0.02496 (0)*** -0.02491 (0)*** -0.02559 (0)***
Age 55+ 0.00905 (0.019)**
Male age 55+
0.01219 (0.01)** 0.01233 (0.009)***
Female age 50+
-0.00585 (0.23) -0.00525 (0.29)
Income taxa * Up to age 35 0.00014 (0)*** 0.00014 (0)*** 0.00008 (0.004)***
Income taxa * Age 55+ -0.00002 (0.64)
Income taxa * Male age 55+
-0.00007 (0.056)* -0.00008 (0.05)*
Income taxa * Female age 50+
0.00010 (0.35) 0.00010 (0.35)
Income taxa * Married up to age 35 0.00054 (0)***
Pseudo R2 0.095 0.095 0.095 Number of observations 177,354 177,354 177,354
Probit regression, reporting marginal effects. The regression included the same control variables as in previous tables, with the addition of constant terms for interaction variables (Up to 35, Age 55+, male age 55+, married up to age 35). *** Significant at 1 %; ** Significant at 5 % * Significant at 10 % SOURCE: Based on Central Bureau of Statistics Migration data. a1,000 NIS, current prices.
6. Conclusion
In this paper we build an analytical framework for analyzing the effect of permanent income
tax reductions on emigration and conduct an empirical analysis of their impact, based on the
Israeli tax reductions during 2004-‐2010. Our findings show that permanent tax reductions do
have an effect on emigration. After carefully controlling for an extended set of covariates,
including the predicted alternative net wage rates that emigrants could earn in the

26
destination countries, we found that the tax reduction implemented in Israel reduced the
emigration flows, primarily amongst the low-‐tech wage earners, who presumably assign a
higher weight to pecuniary aspects (due to diminishing marginal utility from Income),
relative to unobservable variables associated with the development of their career paths
(such as networking), as well as, among young and married employees who are subject to a
substantially larger tax reduction, as they face a longer working horizon compared to
employees that are approaching retirement.
27
References Achdut, L., A. Spivak and M. Strawczynski (2013), "The development of taxes in Israel", The
New Government Budget (Hebrew), fourth Budget Conference of the Economics and Society
Program at Van leer, Policy Paper No 13, page 18.
Akcigit, Baslandze and Stantcheva (2015), "Taxation and the international mobility of
inventors”, NBER, WP 21024.
Bakija, J. M., and J. B. Slemrod. (2004) "Do the Rich Flee from High State Taxes? Evidence
from Federal Estate Tax Returns," NBER Working Paper No. 10645.
Blumkin, T., E. Sadka and Y. Shem-‐Tov (2015). “International Tax Competition: Zero Tax Rate
at the Top Re-‐established”, International Tax and Public Finance, 22 (5), 760-‐776.
Blundell, R. and T. MaCurdy (1999). "Labor Supply: A Review of Alternative Approaches," in
O. Ashenfelter and D. Card (eds.), Handbook of Labor Economics, Volume 3A, North-‐Holland,
Amsterdam.
Borjas, G. J. (1999). "The Economic Analysis of Immigration." In: Orley C. Ashenfelter and
David Card, Ed(s), Handbook of Labor Economics, Elsevier: Amsterdam, Volume 3A.
Borjas, G., I. Kauppinen and P. Poutvaara (2015), "Self-‐selection of emigrants: theory and
evidence on stochastic dominance in observable and unobservable characteristics", NBER
Working Paper No 21649, October.
Devereux, Michael P., and Rachel Griffith (2002), “Evaluating Tax Policy for Location
Decisions.” International Tax and Public Finance 10: 107–126.
Feldstein, M. and M. V. Wrobel (1998), "Can State Taxes Redistribute Income?" Journal of
Public Economics 68, 369-‐396.
Ferejohn, J. (1986), “Incumbent Performance and Electoral Control”, Public Choice, 50, 5-‐25.
Gruber, J. and E. Saez (2002), "The elasticity of taxable income: evidence and implications",
Journal of Public Economics 84, 1-‐32.
Gordon, R. H. and J. R. Hines (2002). "International taxation," in A. Auerbach and M.
Feldstein (eds.), Handbook of Public Economics, Volume 4, North-‐Holland, Amsterdam.
Griffith, Rachel, James Hines, and Peter B. Sørensen (2010). “International Capital
28
Taxation.” In Dimension of Tax Design: The Mirrlees Review, Oxford: Oxford University Press.
Jaimovich, N. and Siu, H.E. (2012), "The trend is the cycle: job polarization and jobless
recoveries", NBER Working Paper 18334
Kirchgassner, Gebhard, and Werner Pommerehne. 1996. “Tax Harmonization and Tax
Competition in the European Union: Lessons from Switzerland.” Journal of Public Economics
60: 351–371.
Kleven, Henrik J., Camille Landais, and Emmanuel Saez (2013). "Taxation and International
Migration of Superstars: Evidence from the European Football Market” American Economic
Review, 103 (5), 1892-‐1924.
Kleven, Henrik J., Camille Landais, Emmanuel Saez, and Esben A. Schultz (2014), “Taxation
and International Migration of Top Earners: Evidence from the Foreigner Tax Scheme in
Denmark.” The Quarterly Journal of Economics, 129 (1), 333-‐378.
Lehmann, E., Simula, L. and Trannoy, A. (2014) "Tax Me If You Can: Optimal Non-‐linear
Income Tax between competing Governments", Quarterly Journal of Economics, 129 (4),
1995-‐2030.
Liebig, T., P. A. Puhani, and A. Sousa-‐Poza (2007). “Taxation and Internal Migration: Evidence
from the Swiss Census using Community-‐Level Variation in Income Tax Rates," Journal of
Regional Science 47(4), 807-‐836.
Polachek, W. (1981), "Occupational Self-‐Selection: A Human Capital Approach to Sex
Differences in Occupational Structure", The Review of Economics and Statistics, Vol. 63, No.
1: 60-‐69.
Polachek (2008), "Earnings Over the Lifecycle: The Mincer Earnings Function and Its
Applications", Foundations and trends in Microeconomics, Now Publishers, Vol. 4 (3), 165-‐
272 .
Saez, Emmanuel, Joel Slemrod, and Seth Giertz (2012). “The Elasticity of Taxable Income
with Respect to Marginal Tax Rates: A Critical Review.” Journal of Economic Literature 50: 3–
50.
Young, Cristobal, and Charles Varner (2011). “Millionaire Migration and State Taxation of
Top Incomes: Evidence from a Natural Experiment.” National Tax Journal 64: 255–284.
29
Appendix – Difference in Difference Estimation
In this Appendix, we estimate the expected response to the tax reductions by performing a
diff-‐in-‐diff exercise. Note that as shown in Figure 2, the tax reduction associated with the 3rd
bracket is significantly lower than those associated with the higher brackets. Our analysis
will focus on comparing the emigration flows before and after the tax reductions (i.e., before
and after 2004) for the treated group (4th and 5th brackets) compared with the control group
(3rd bracket), in order to separate the change in emigration flows associated with the tax
reductions from those attributed to the time trend. The latter is captured by the evolution of
emigration flows within the 3rd bracket, based on the identifying assumption that time-‐
trends in emigration patterns are shared by individuals across income tax brackets. We have
excluded from the analysis the 6th and 7th brackets due to a small number of observations.
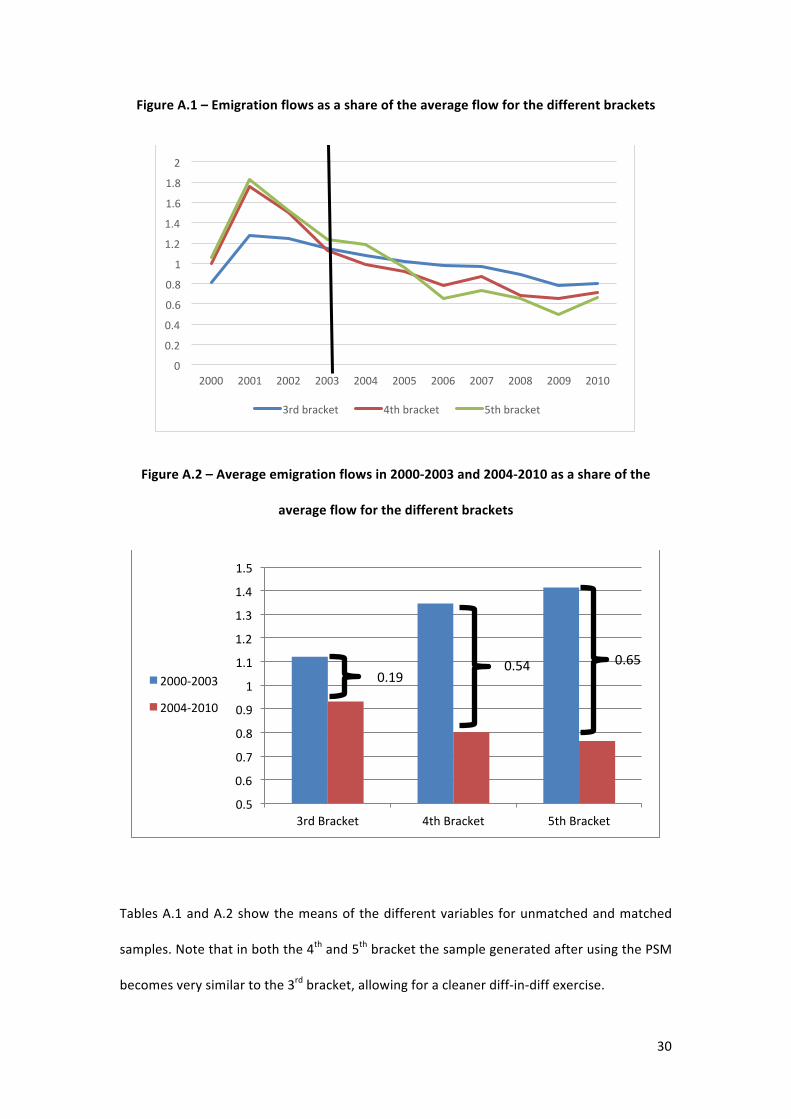
In Figure A.1 we show the raw data, which confirms that the emigration reduction is
substantial for the 4th and 5th brackets, and less so for the 3rd bracket. Figure A.2 calculates
the averages for the periods before and after the tax reduction (2000-‐2003 compared to
2004-‐2010) which reveal a reduction of about 0.6 in average for the 4th and 5th brackets,
compared to about 0.2 for the 3rd bracket.
These figures call for performing a more careful difference in difference analysis, aimed at
examining whether the reduction of emigration before and after the tax reductions was
statistically different for the treated group (brackets 4th and 5th) in comparison to the control
group (3rd bracket). In order to perform a careful diff-‐in-‐diff analysis, we used a propensity
score matching (PSM) strategy for comparing individuals of the different brackets with
general characteristics that are as similar as possible according to their PSM score. For this
purpose we performed regressions that included the following characteristics: age, squared
age, technology branch, major branch during the career, affiliation with a multinational
company and residence in Dan Region (Tel Aviv and suburbs).
30
Figure A.1 – Emigration flows as a share of the average flow for the different brackets
Figure A.2 – Average emigration flows in 2000-‐2003 and 2004-‐2010 as a share of the
average flow for the different brackets
Tables A.1 and A.2 show the means of the different variables for unmatched and matched
samples. Note that in both the 4th and 5th bracket the sample generated after using the PSM
becomes very similar to the 3rd bracket, allowing for a cleaner diff-‐in-‐diff exercise.
0
0.2
0.4
0.6
0.8
1
1.2
1.4
1.6
1.8
2
2000 2001 2002 2003 2004 2005 2006 2007 2008 2009 2010
3rd bracket 4th bracket 5th bracket
0.5
0.6
0.7
0.8
0.9
1
1.1
1.2
1.3
1.4
1.5
3rd Bracket 4th Bracket 5th Bracket
2000-‐2003
2004-‐2010
0.19 0.54 0.65
31
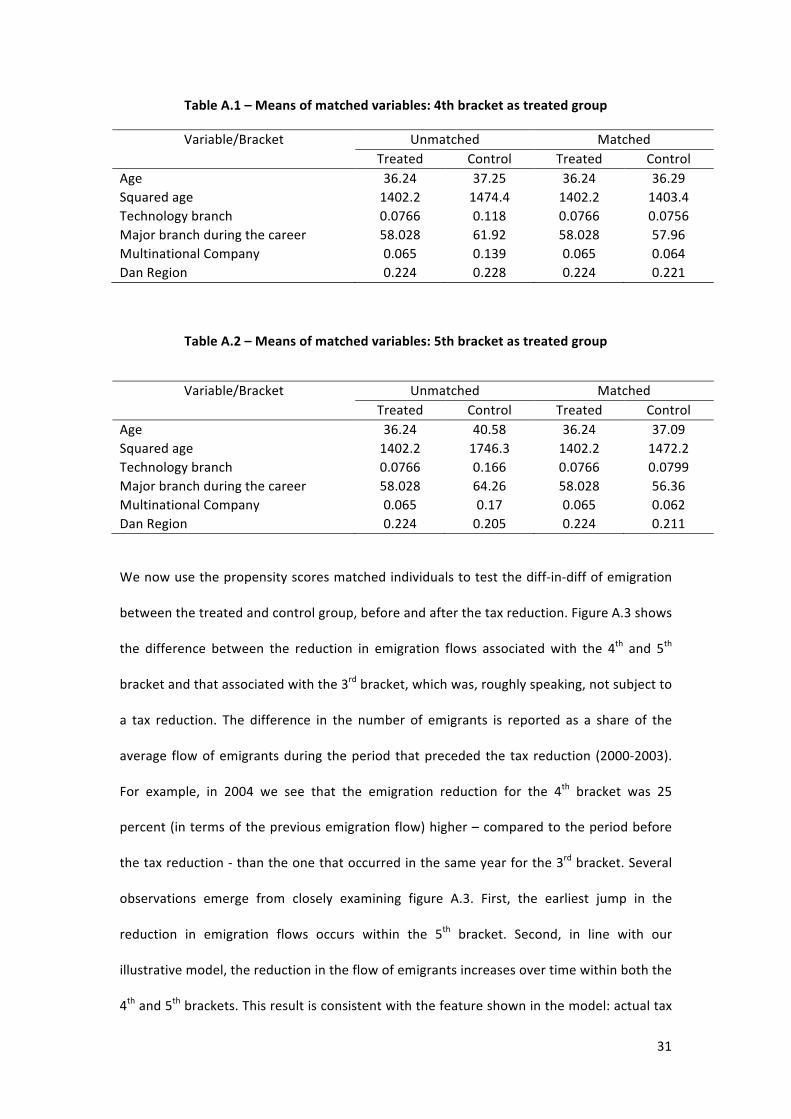
Table A.1 – Means of matched variables: 4th bracket as treated group
Variable/Bracket Unmatched Matched Treated Control Treated Control
Age 36.24 37.25 36.24 36.29 Squared age 1402.2 1474.4 1402.2 1403.4 Technology branch 0.0766 0.118 0.0766 0.0756 Major branch during the career 58.028 61.92 58.028 57.96 Multinational Company 0.065 0.139 0.065 0.064 Dan Region 0.224 0.228 0.224 0.221
Table A.2 – Means of matched variables: 5th bracket as treated group
Variable/Bracket Unmatched Matched Treated Control Treated Control
Age 36.24 40.58 36.24 37.09 Squared age 1402.2 1746.3 1402.2 1472.2 Technology branch 0.0766 0.166 0.0766 0.0799 Major branch during the career 58.028 64.26 58.028 56.36 Multinational Company 0.065 0.17 0.065 0.062 Dan Region 0.224 0.205 0.224 0.211
We now use the propensity scores matched individuals to test the diff-‐in-‐diff of emigration
between the treated and control group, before and after the tax reduction. Figure A.3 shows
the difference between the reduction in emigration flows associated with the 4th and 5th
bracket and that associated with the 3rd bracket, which was, roughly speaking, not subject to
a tax reduction. The difference in the number of emigrants is reported as a share of the
average flow of emigrants during the period that preceded the tax reduction (2000-‐2003).
For example, in 2004 we see that the emigration reduction for the 4th bracket was 25
percent (in terms of the previous emigration flow) higher – compared to the period before
the tax reduction -‐ than the one that occurred in the same year for the 3rd bracket. Several
observations emerge from closely examining figure A.3. First, the earliest jump in the
reduction in emigration flows occurs within the 5th bracket. Second, in line with our
illustrative model, the reduction in the flow of emigrants increases over time within both the
4th and 5th brackets. This result is consistent with the feature shown in the model: actual tax
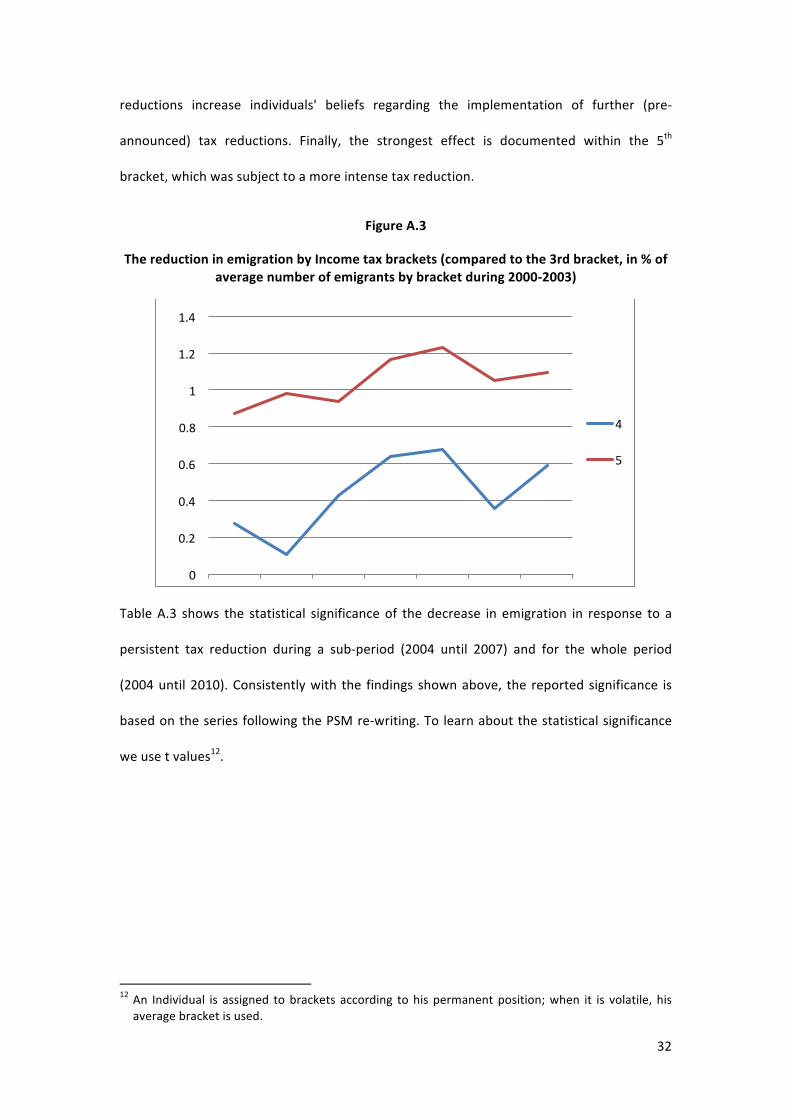
32
reductions increase individuals' beliefs regarding the implementation of further (pre-‐
announced) tax reductions. Finally, the strongest effect is documented within the 5th
bracket, which was subject to a more intense tax reduction.
Figure A.3
The reduction in emigration by Income tax brackets (compared to the 3rd bracket, in % of average number of emigrants by bracket during 2000-‐2003)
Table A.3 shows the statistical significance of the decrease in emigration in response to a
persistent tax reduction during a sub-‐period (2004 until 2007) and for the whole period
(2004 until 2010). Consistently with the findings shown above, the reported significance is
based on the series following the PSM re-‐writing. To learn about the statistical significance
we use t values12.
12 An Individual is assigned to brackets according to his permanent position; when it is volatile, his average bracket is used.
0
0.2
0.4
0.6
0.8
1
1.2
1.4
2004 2005 2006 2007 2008 2009 2010
4
5
33
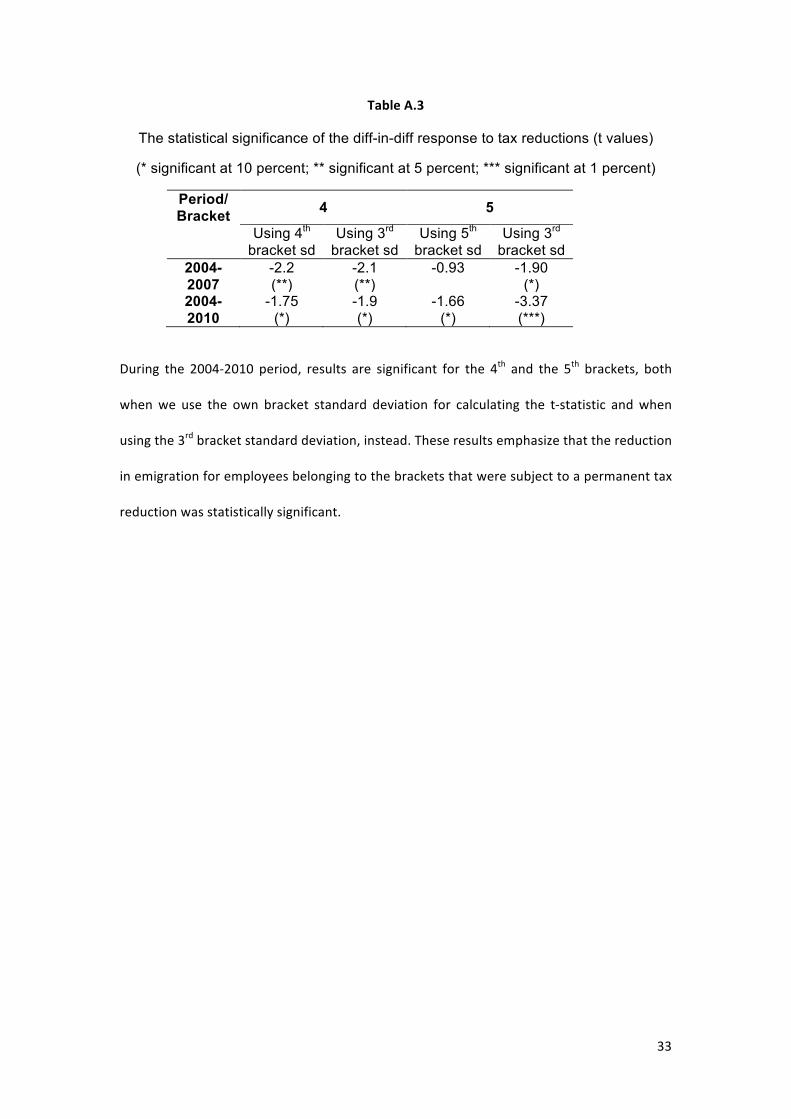
Table A.3
The statistical significance of the diff-in-diff response to tax reductions (t values)
(* significant at 10 percent; ** significant at 5 percent; *** significant at 1 percent)
Period/ Bracket 4 5
Using 4th bracket sd
Using 3rd bracket sd
Using 5th bracket sd
Using 3rd bracket sd
2004-2007
-2.2 (**)
-2.1 (**)
-0.93 -1.90 (*)
2004-2010
-1.75 (*)
-1.9 (*)
-1.66 (*)
-3.37 (***)
During the 2004-‐2010 period, results are significant for the 4th and the 5th brackets, both
when we use the own bracket standard deviation for calculating the t-‐statistic and when
using the 3rd bracket standard deviation, instead. These results emphasize that the reduction
in emigration for employees belonging to the brackets that were subject to a permanent tax
reduction was statistically significant.
Related Documents


