Unique Identifier 1 In this context, Malaysian eCommerce is projected to grow at 11% CAGR. However, there is potential to double this growth % GDP 6.4% Additional government interventions will drive higher GDP contribution Critical Success Factors Ready infrastructure and ecosystem Specific government interventions Favorable demographic & economic trends 68 2016F 2015F 2014 2012 2013 +12% B2B +11% 114 15% 2018F 85% 2019F 2017F B2C 2020F 49 eCommerce GDP contribution (RM billion) Sources: 2012 – 2013 data from DOSM; 2014 – 2020 data from EPU, MDeC, Euromonitor, WorldBank, A.T. Kearney analysis 5.0% 5.9% National eCommerce Strategic Roadmap Overview 1 Page 2 3 4

Welcome message from author
This document is posted to help you gain knowledge. Please leave a comment to let me know what you think about it! Share it to your friends and learn new things together.
Transcript

Unique Identifier
1
In this context, Malaysian eCommerce is projected to grow at 11% CAGR. However, there is potential to double this growth
% GDP
6.4%
Additional government interventions will drive higher GDP contribution
Critical Success Factors
Ready infrastructure and ecosystem
Specific government interventions
Favorable demographic & economic trends
68
2016F 2015F 2014 2012 2013
+12%
B2B
+11% 114 15%
2018F
85%
2019F 2017F
B2C
2020F
49
eCommerce GDP contribution (RM billion)
Sources: 2012 – 2013 data from DOSM; 2014 – 2020 data from EPU, MDeC, Euromonitor, WorldBank, A.T. Kearney analysis
5.0% 5.9%
National eCommerce Strategic Roadmap Overview 1 Page 2 3 4

Unique Identifier
2
Malaysian eCommerce is now at an inflection point; growth can be accelerated with focused interventions
Evolution curve of eCommerce
1. Estimated transactions in B2C and B2B Source: A.T. Kearney
Nascent
Sh
are
of
eC
om
me
rce
1
Maturity of eCommerce industry
China Imperative for Malaysia to
accelerate into the next stage
Singapore
US
Growth Mature
?
Malaysia
Korea
Thailand
Indonesia India
10-15% 20-25%
XX Typical growth rate in
respective phases
Taiwan
4-6%
National eCommerce Strategic Roadmap Overview 1 Page 2 3 4

Unique Identifier
3
To accelerate eCommerce growth, 6 thrust areas have been identified under the National eCommerce Strategic Roadmap
Source: A.T. Kearney
Good and Affordable Infrastructure
Supportive Governance Framework
Doubling eCommerce growth
Accelerate seller
adoption of eCommerce
Increase adoption of eProcure-ment by
businesses
Promote national brand to
boost cross-border
eCommerce
Make strategic
investments in select
eCommerce player(s)
Lift non-tariff barriers
• Domestic eFulfillment
• Cross-border eCommerce
• ePayment
• Consumer protection
Realign existing
economic incentives
1 2 3 4 5 6
Malaysia’s National eCommerce Strategic Roadmap
National eCommerce Strategic Roadmap Overview 1 Page 2 3 4

Unique Identifier
4
2015 Current
2020 Business As
Usual
2020 With
Intervention
eCommerce
contribution,
MYR Bn. 68 114 170+
eCommerce
growth1,
CAGR %
12.8
2012–15
10.8
2015–20
20.8
2015–20
These interventions can double eCommerce growth and drive eCommerce GDP contribution to cross RM 170 Bn by 2020
49
61
49
61
86
0
30
60
90
120
150
180
2012 2013 2014 2015 2016 2017 2018 2019 2020
2
3
Uplift
1
The trajectory path of eCommerce (MYR Bn.)
Source: 2012 – 2013 data from DOSM; 2014 – 2020 data from EPU, MDeC, A.T. Kearney
1 2 3
uplift
121
114
With Additional Initiatives (Uplift)
Business As Usual (BAU)
DOUBLE
current growth
projection
National eCommerce Strategic Roadmap Overview 1 Page 2 3 4

Unique Identifier
5
eCommerce is a new way of doing business – to conduct transactions electronically
Buyer Seller
Electronic transaction
Payment providers
Logistics/ Fulfillment providers
eCommerce ecosystem
Flow of goods
Flow of money
Make purchase
Provide goods or services
Provide payment services
Provide fulfillment and deliver services
Retail / wholesale
End-customers / Businesses
eCommerce for SME 1 Page 2 3
Unique Identifier
6
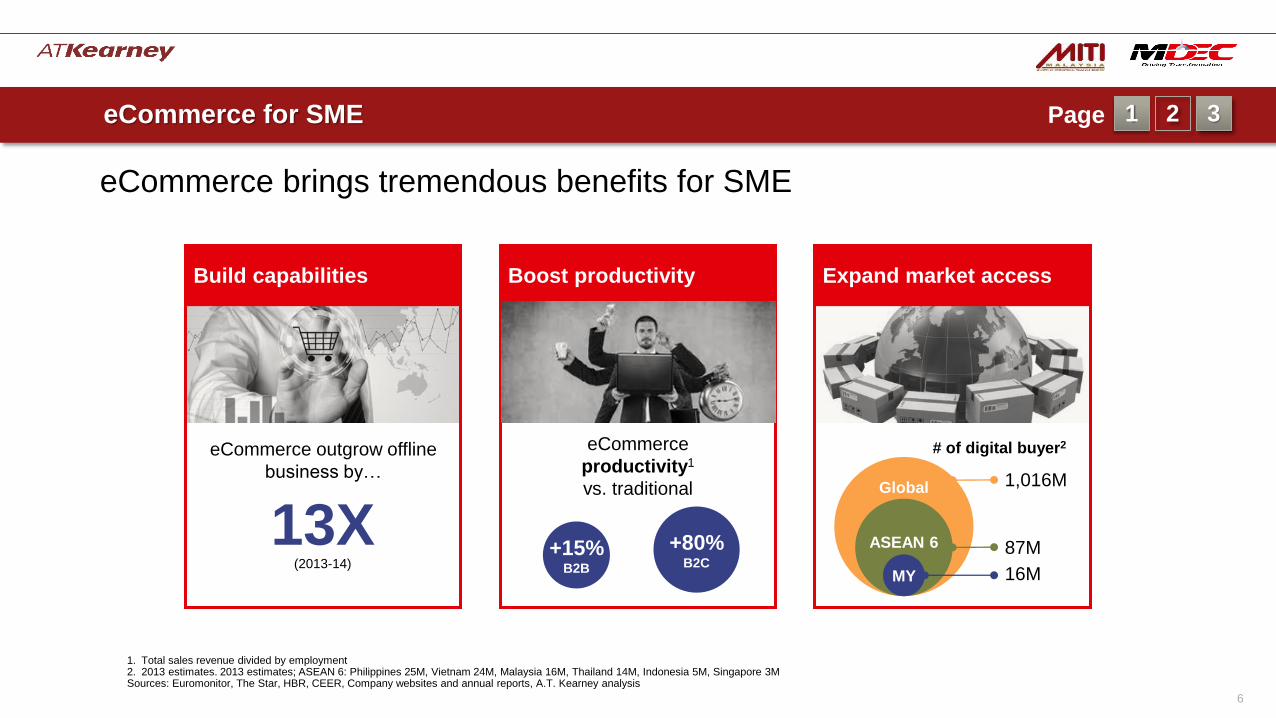
eCommerce brings tremendous benefits for SME
eCommerce outgrow offline
business by…
Build capabilities Boost productivity Expand market access
1. Total sales revenue divided by employment 2. 2013 estimates. 2013 estimates; ASEAN 6: Philippines 25M, Vietnam 24M, Malaysia 16M, Thailand 14M, Indonesia 5M, Singapore 3M Sources: Euromonitor, The Star, HBR, CEER, Company websites and annual reports, A.T. Kearney analysis
eCommerce
productivity1
vs. traditional
+80% B2C
+15% B2B
13X (2013-14)
Replace image
# of digital buyer2
Global
ASEAN 6
MY
1,016M
87M
16M
eCommerce for SME 1 Page 2 3

Unique Identifier
7
What should you as an SME do?
Connect with partners and agencies to support your
eCommerce ambition
3
Try selling your best product and build capability from
there
2
Learn more about various eCommerce channels and
decide which is most suitable
1
Study the opportunities! Take action! Reach out for support!
eCommerce for SME 1 Page 2 3
Unique Identifier
8
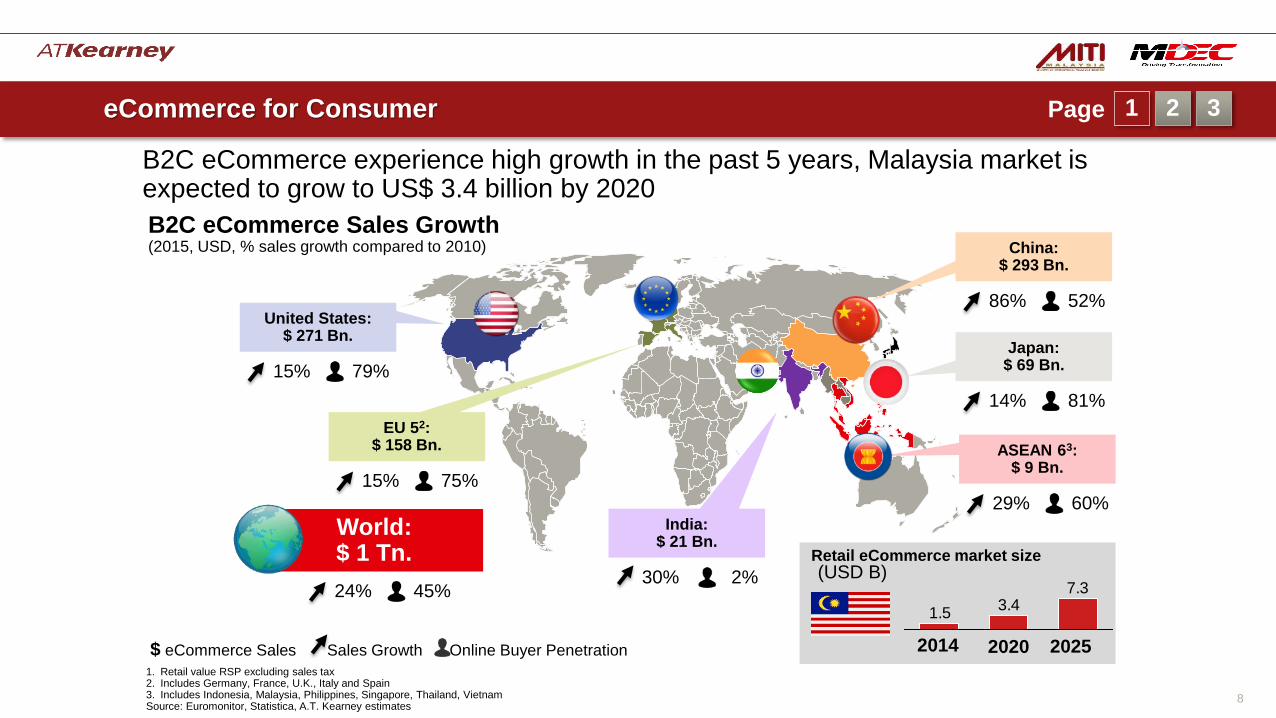
B2C eCommerce experience high growth in the past 5 years, Malaysia market is expected to grow to US$ 3.4 billion by 2020
B2C eCommerce Sales Growth (2015, USD, % sales growth compared to 2010)
$ eCommerce Sales Sales Growth Online Buyer Penetration
1. Retail value RSP excluding sales tax 2. Includes Germany, France, U.K., Italy and Spain 3. Includes Indonesia, Malaysia, Philippines, Singapore, Thailand, Vietnam Source: Euromonitor, Statistica, A.T. Kearney estimates
United States: $ 271 Bn.
15% 79%
EU 52: $ 158 Bn.
15% 75%
China: $ 293 Bn.
86% 52%
Japan: $ 69 Bn.
14% 81%
World: $ 1 Tn.
24% 45%
ASEAN 63: $ 9 Bn.
29% 60% India:
$ 21 Bn.
30% 2% 7.3
3.41.5
2014 2020
(USD B) Retail eCommerce market size
2025
eCommerce for Consumer 1 Page 2 3
Unique Identifier
9
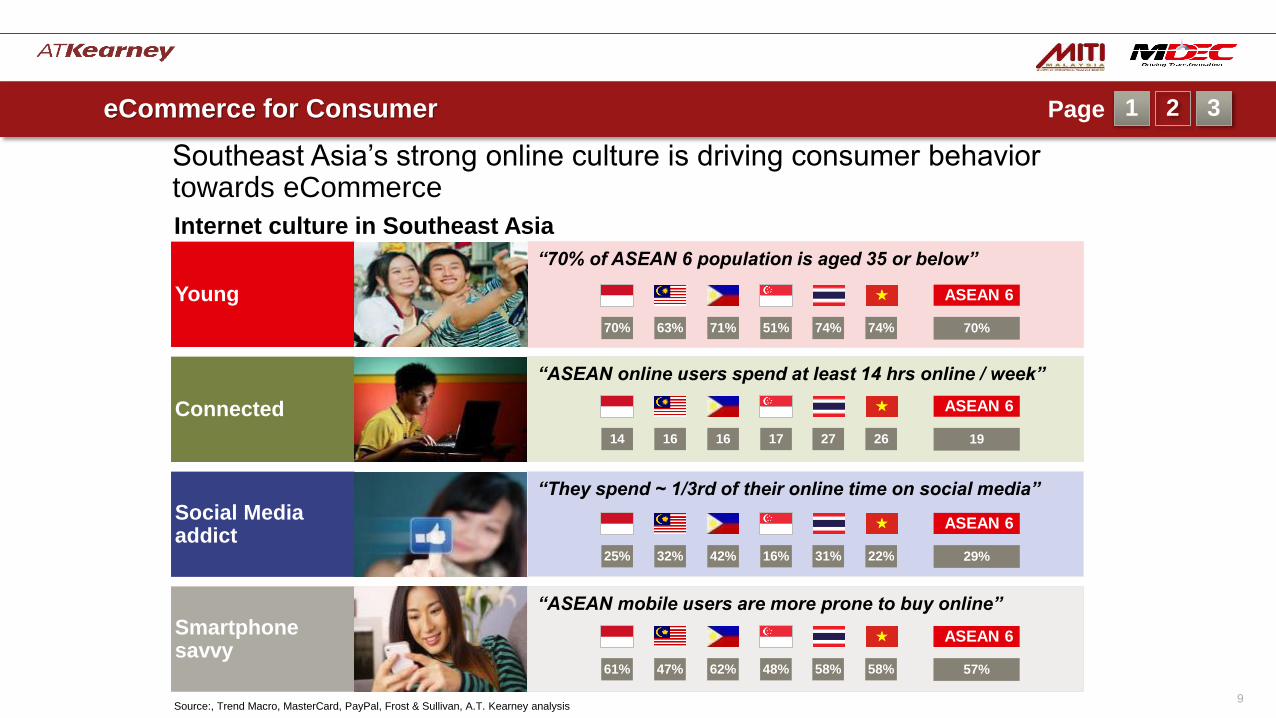
“70% of ASEAN 6 population is aged 35 or below”
Southeast Asia’s strong online culture is driving consumer behavior towards eCommerce
Source:, Trend Macro, MasterCard, PayPal, Frost & Sullivan, A.T. Kearney analysis
Internet culture in Southeast Asia
Young
Connected
Social Media addict
Smartphone savvy
“ASEAN online users spend at least 14 hrs online / week”
“They spend ~ 1/3rd of their online time on social media”
“ASEAN mobile users are more prone to buy online”
70% 63% 71% 51% 74% 74% 70%
ASEAN 6
14 16 16 17 27 26 19
ASEAN 6
25% 32% 42% 16% 31% 22% 29%
ASEAN 6
61% 47% 62% 48% 58% 58% 57%
ASEAN 6
eCommerce for Consumer 1 Page 2 3

Unique Identifier
10
While eCommerce offers lower cost and higher convenience, consumers should be careful to transact online
Best practices in transacting online
Compare prices
Check the business’s background
Check testimonials
Choose reliable websites
Consider the hidden costs
Obtain seller’s personal details
Know the market rate and be-careful with
low pricing
Verify business activities through address/ license
number with CCM1
Get feedback from other customers to ensure reliability of
the seller
Make purchase only through a secure and trustworthy website
Consider the total cost and value of
goods in local currency
Contact the seller to confirm purchases
1. CCM = Companies Commission of Malaysia Source: kpdnkk.gov, A.T. Kearney
eCommerce for Consumer 1 Page 2 3
Unique Identifier
11
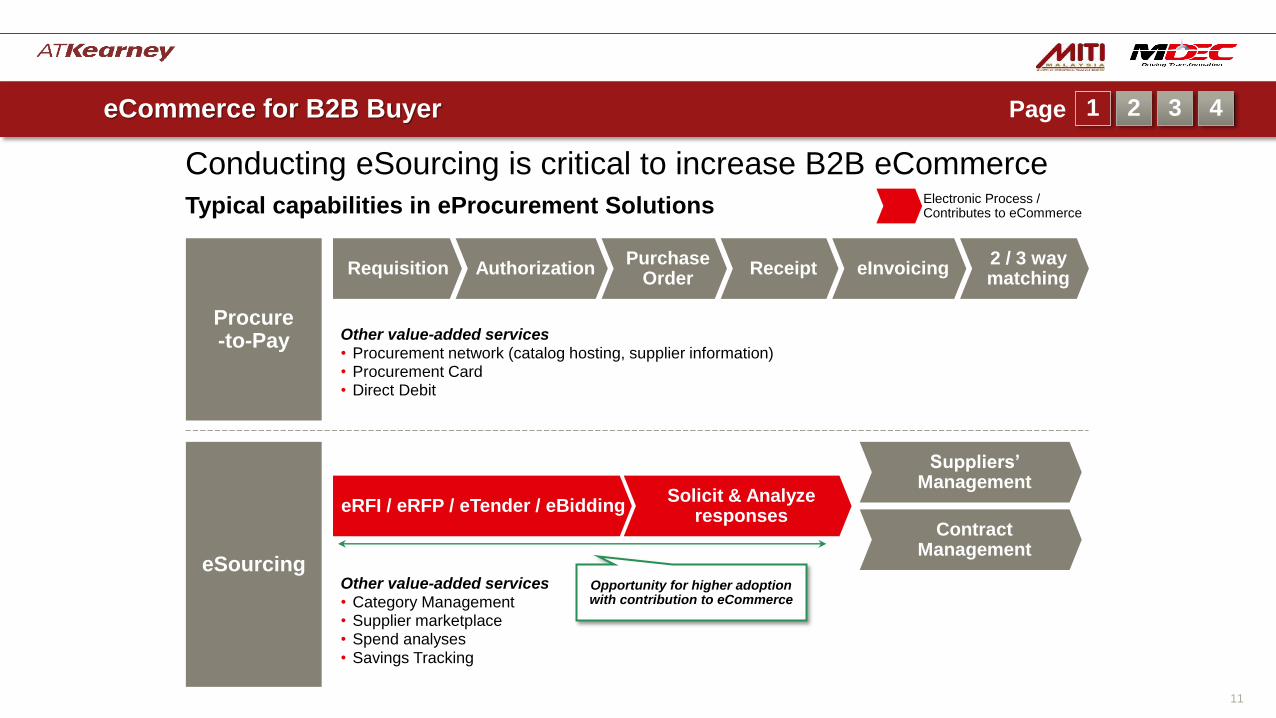
Conducting eSourcing is critical to increase B2B eCommerce
eSourcing
Typical capabilities in eProcurement Solutions
Procure -to-Pay
eRFI / eRFP / eTender / eBidding Solicit & Analyze
responses
Suppliers’ Management
Contract Management
Requisition Authorization Purchase
Order Receipt eInvoicing
2 / 3 way matching
Other value-added services • Procurement network (catalog hosting, supplier information) • Procurement Card • Direct Debit
Other value-added services • Category Management • Supplier marketplace • Spend analyses • Savings Tracking
Electronic Process / Contributes to eCommerce
Opportunity for higher adoption with contribution to eCommerce
eCommerce for B2B Buyer 1 Page 2 3 4
Unique Identifier
12
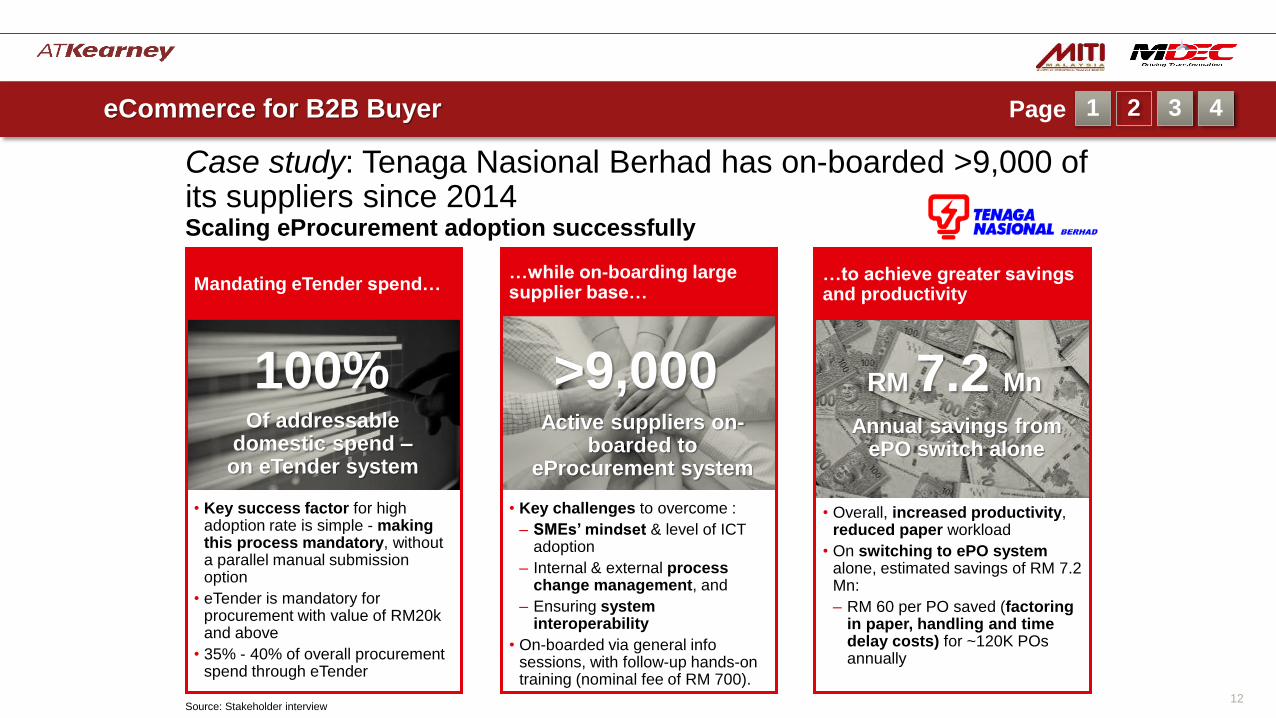
Case study: Tenaga Nasional Berhad has on-boarded >9,000 of its suppliers since 2014
100% Of addressable
domestic spend – on eTender system
>9,000 Active suppliers on-
boarded to eProcurement system
RM 7.2 Mn
Annual savings from ePO switch alone
Scaling eProcurement adoption successfully
• Key challenges to overcome :
– SMEs’ mindset & level of ICT adoption
– Internal & external process change management, and
– Ensuring system interoperability
• On-boarded via general info sessions, with follow-up hands-on training (nominal fee of RM 700).
…while on-boarding large supplier base…
• Key success factor for high adoption rate is simple - making this process mandatory, without a parallel manual submission option
• eTender is mandatory for procurement with value of RM20k and above
• 35% - 40% of overall procurement spend through eTender
Mandating eTender spend…
• Overall, increased productivity, reduced paper workload
• On switching to ePO system alone, estimated savings of RM 7.2 Mn:
– RM 60 per PO saved (factoring in paper, handling and time delay costs) for ~120K POs annually
…to achieve greater savings and productivity
Source: Stakeholder interview
eCommerce for B2B Buyer 1 Page 2 3 4
Unique Identifier
13
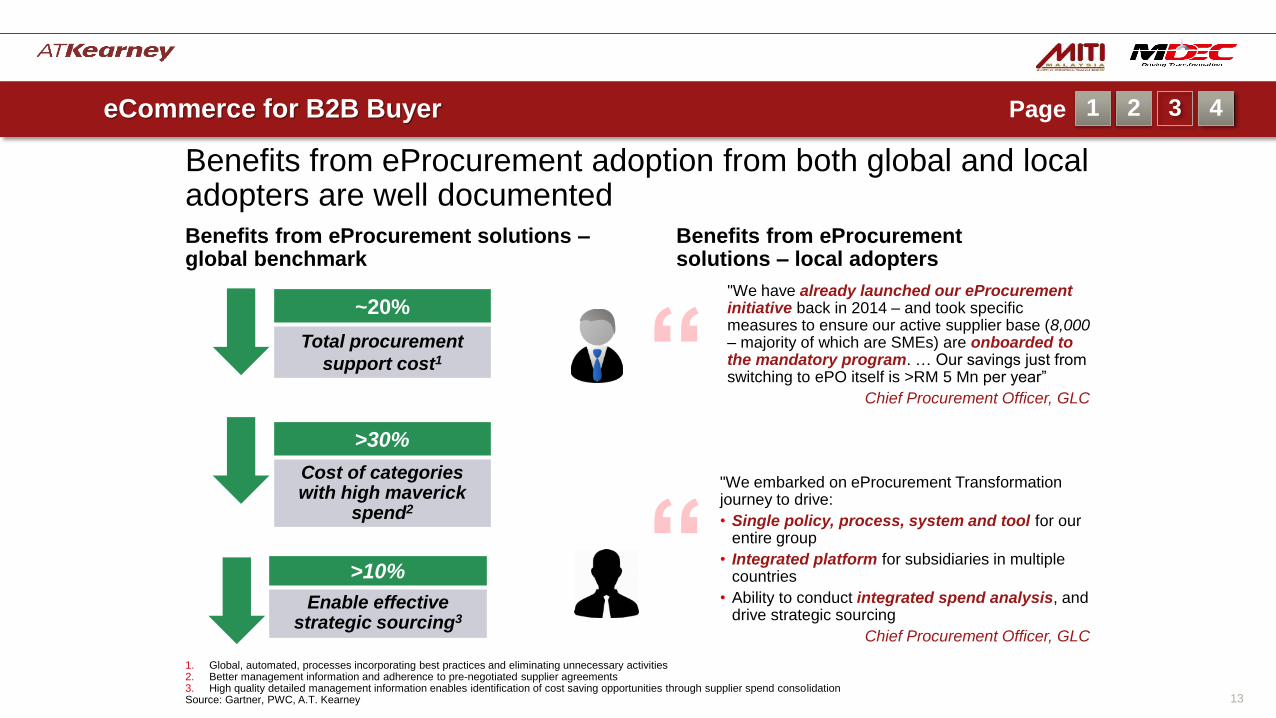
~20%
Total procurement
support cost1
Benefits from eProcurement adoption from both global and local adopters are well documented
1. Global, automated, processes incorporating best practices and eliminating unnecessary activities 2. Better management information and adherence to pre-negotiated supplier agreements 3. High quality detailed management information enables identification of cost saving opportunities through supplier spend consolidation Source: Gartner, PWC, A.T. Kearney
“ "We embarked on eProcurement Transformation journey to drive:
• Single policy, process, system and tool for our entire group
• Integrated platform for subsidiaries in multiple countries
• Ability to conduct integrated spend analysis, and drive strategic sourcing
Chief Procurement Officer, GLC
“ "We have already launched our eProcurement initiative back in 2014 – and took specific measures to ensure our active supplier base (8,000 – majority of which are SMEs) are onboarded to the mandatory program. … Our savings just from switching to ePO itself is >RM 5 Mn per year”
Chief Procurement Officer, GLC
>30%
Cost of categories with high maverick
spend2
>10%
Enable effective strategic sourcing3
Benefits from eProcurement solutions – global benchmark
Benefits from eProcurement solutions – local adopters
eCommerce for B2B Buyer 1 Page 2 3 4

Unique Identifier
14
What should you as an B2B ‘buyer’ do?
Contact the solution providers to walk you through their systems
2
Learn more about various eProcurement solution
provider and decide which is most suitable for your
business
1
Study the opportunities! Reach out for support!
eCommerce for B2B Buyer 1 Page 2 3 4

Unique Identifier
15
Last-mile
Delivery
Shipping
Logistics
Warehousing
& Order
Fulfilment
Customer
Interface
Product
Sourcing Payment
eFulfillment ePayment ePlatform
eFulfillment plays a critical role in shaping the customer and end-consumer experience
Source: Stakeholders Interviews, Expert Interviews, Market-Back Insights, A.T. Kearney
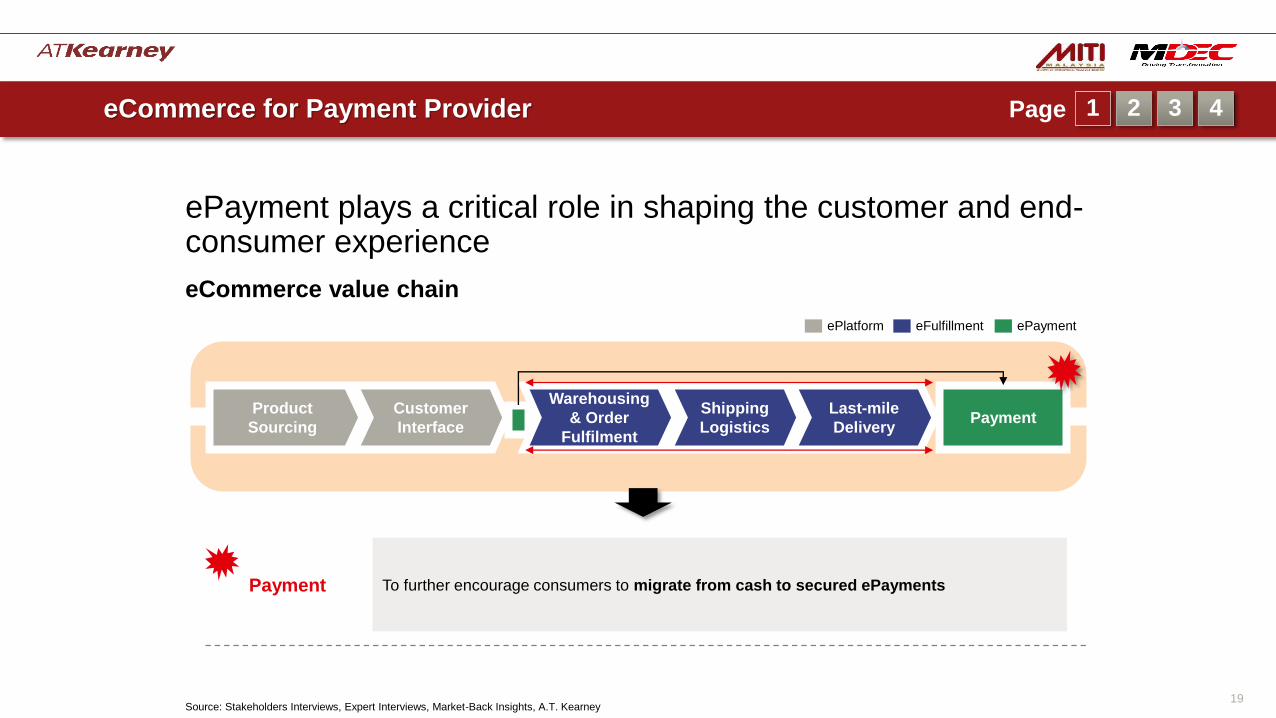
eCommerce value chain
1
2
To improve domestic eFulfillment service levels that are aligned with customer expectations Domestic
eFulfillment
1
To improve service levels to ensure swift and efficient flow of cross-border goods
Cross-Border eCommerce
2
eCommerce for Logistic & eFulfillment Player 1 Page 2 3 4

Unique Identifier
16
To facilitate eCommerce growth, eFulfillment players need to invest across warehousing to last-mile
Source: Stakeholders Interviews, Expert Interviews, Market-Back Insights, A.T. Kearney
Pick-up
Inventory management
Pick and pack
Quality control
Shipping label
Track and trace
Delivery
Track and trace
Returns management
Delivery and payment flexibility
Inventory management
Quality control
Track and trace
Sorting
Transportation
Customs
Track and trace
Order Fulfilment
Last-mile Delivery Warehousing Shipping Logistics
eFulfillment Value Chain
eCommerce for Logistic & eFulfillment Player 1 Page 2 3 4

Unique Identifier
17
End-to-end fulfillment players can potentially provide three key benefits for Malaysia eCommerce
Case Study
Source: Stakeholders Interviews, Market-Back Insights, A.T. Kearney
• Flexible Pick-Up Timings
• Packing Solutions
• Inventory Management and Fulfillment Solutions
• Transportation and Warehousing
• Flexible Last-Mile Delivery Options
• Payments on Delivery
• Returns Management
Provide end-to-end eFulfillment capabilities
• SMEs to extend their reach towards new markets
• Network of partnership to ease the burden of cross-border fulfillment
Enable cross-border eCommerce
• Web-Hosting Services
• Training / Consulting Services for getting products online (e.g. Product Cataloguing)
• Customer Care
• Digital Marketing
Value-added services to help merchants sell online
eCommerce for Logistic & eFulfillment Player 1 Page 2 3 4

Unique Identifier
18
What should you as a Logistics & Fulfillment Player do?
Connect with partners and agencies to support your
eFulfillment ambition
3
Kick start strategic intent and pilot key initiatives in
your respective organizations
2
Learn more about the best-in-class capabilities required to
succeed in eCommerce
1
Study the opportunities! Take action! Reach out for support!
eCommerce for Logistic & eFulfillment Player 1 Page 2 3 4
Unique Identifier
19
ePayment plays a critical role in shaping the customer and end-consumer experience
Last-mile
Delivery
Shipping
Logistics
Warehousing
& Order
Fulfilment
Customer
Interface
Product
Sourcing Payment
eFulfillment ePayment ePlatform
Source: Stakeholders Interviews, Expert Interviews, Market-Back Insights, A.T. Kearney
eCommerce value chain
To further encourage consumers to migrate from cash to secured ePayments Payment
eCommerce for Payment Provider 1 Page 2 3 4
Unique Identifier
20
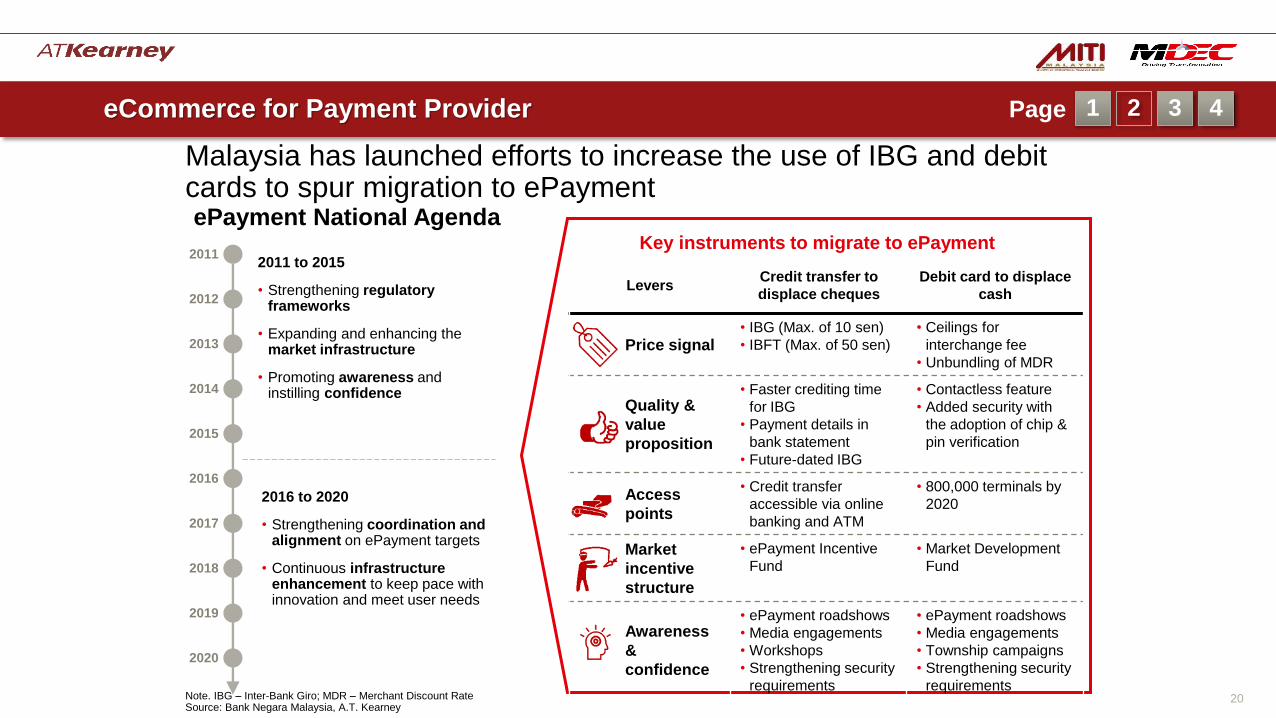
Malaysia has launched efforts to increase the use of IBG and debit cards to spur migration to ePayment
2011
2012
2013
2014
2015
2016
2017
2018
2019
2020
2011 to 2015
• Strengthening regulatory frameworks
• Expanding and enhancing the market infrastructure
• Promoting awareness and instilling confidence
2016 to 2020
• Strengthening coordination and alignment on ePayment targets
• Continuous infrastructure enhancement to keep pace with innovation and meet user needs
Key instruments to migrate to ePayment
Levers Credit transfer to
displace cheques
Debit card to displace
cash
Price signal • IBG (Max. of 10 sen)
• IBFT (Max. of 50 sen)
• Ceilings for
interchange fee
• Unbundling of MDR
Quality &
value
proposition
• Faster crediting time
for IBG
• Payment details in
bank statement
• Future-dated IBG
• Contactless feature
• Added security with
the adoption of chip &
pin verification
Access
points
• Credit transfer
accessible via online
banking and ATM
• 800,000 terminals by
2020
Market
incentive
structure
• ePayment Incentive
Fund
• Market Development
Fund
Awareness
&
confidence
• ePayment roadshows
• Media engagements
• Workshops
• Strengthening security
requirements
• ePayment roadshows
• Media engagements
• Township campaigns
• Strengthening security
requirements
ePayment National Agenda
Note. IBG – Inter-Bank Giro; MDR – Merchant Discount Rate Source: Bank Negara Malaysia, A.T. Kearney
eCommerce for Payment Provider 1 Page 2 3 4

Unique Identifier
21
Malaysia’s eCommerce transactions is largely around online banking and credit/ debit card transaction
5142
2515
23
52
66
70
75
14
10 15
68
6
10
616
4
2
S. Korea Germany China
18
Brazil
4
3
Malaysia India
5
Payment methods for eCommerce transactions %, 2015
Source: Company websites, Press releases, The World Bank, Adyen Research, A.T. Kearney
PayPal
Credit / Debit Card
Online Banking
Local Offerings (e.g. eWallets)
Others
eCommerce for Payment Provider 1 Page 2 3 4

Unique Identifier
22
What should you as a Payment Provider do?
Connect with partners and agencies to support your
ePayment ambition
Kick start strategic intent and pilot key initiatives in
your respective organizations
2
Learn more about the latest innovations in ePayment required to succeed in
eCommerce
1
Study the opportunities! Take action! Reach out for support!
3
eCommerce for Payment Provider 1 Page 2 3 4
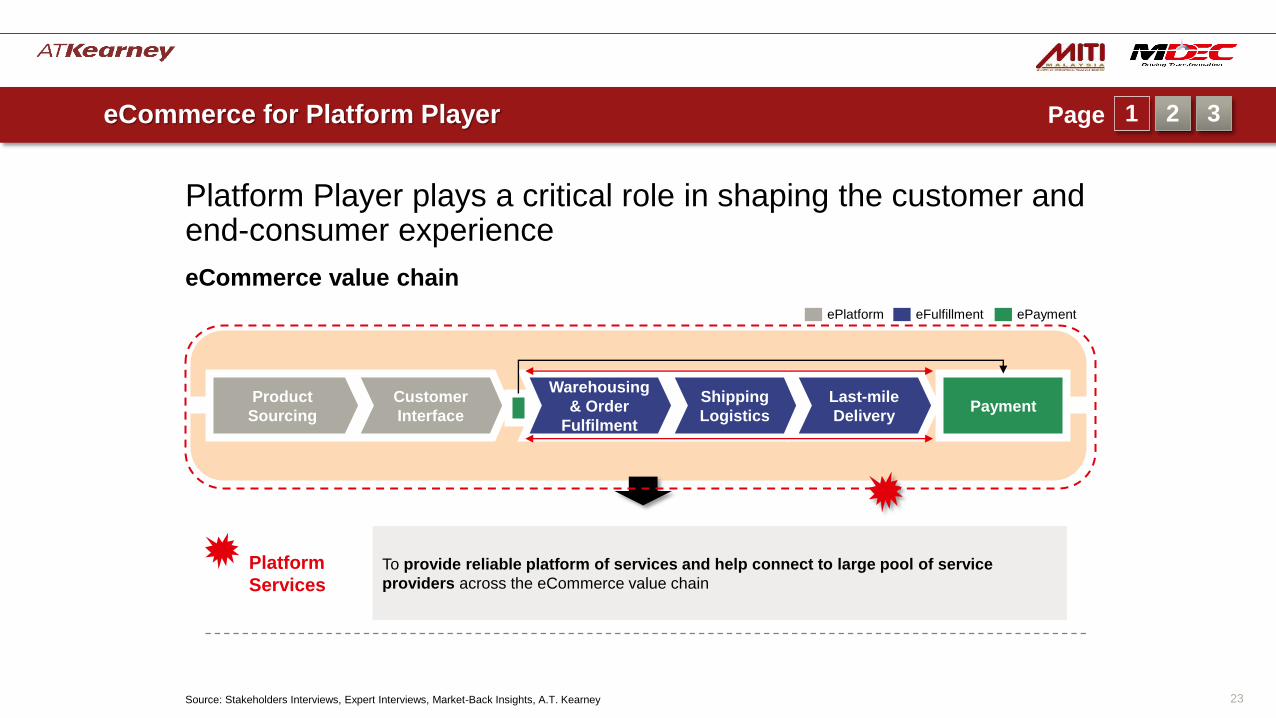
Unique Identifier
23
Last-mile
Delivery
Shipping
Logistics
Warehousing
& Order
Fulfilment
Customer
Interface
Product
Sourcing Payment
eFulfillment ePayment ePlatform
Platform Player plays a critical role in shaping the customer and end-consumer experience
eCommerce value chain
To provide reliable platform of services and help connect to large pool of service
providers across the eCommerce value chain
Platform
Services
Source: Stakeholders Interviews, Expert Interviews, Market-Back Insights, A.T. Kearney
eCommerce for Platform Player 1 Page 2 3

Unique Identifier
24
Platform Players are especially important to support SMEs to embrace the ‘new way of business’ Value added services from Platform Players
Connect buyers & sellers
Increase flow of goods and money
Help ease regulation barriers
Provide insights to consumers’ intelligence
Increase competitive transparency
Encourage new business models
Connect customers with service
providers globally
Provide sellers with faster and more
reliable transaction of goods and money
Educate policy and regulatory and
enable to export businesses beyond
own territory
Drive market intelligence on
customers behavior
Allow sellers to have greater awareness
over their competitors in the
market
Create opportunities and bring new
innovative solutions to the market
1. CCM = Companies Commission of Malaysia Source: kpdnkk.gov, A.T. Kearney
eCommerce for Platform Player 1 Page 2 3
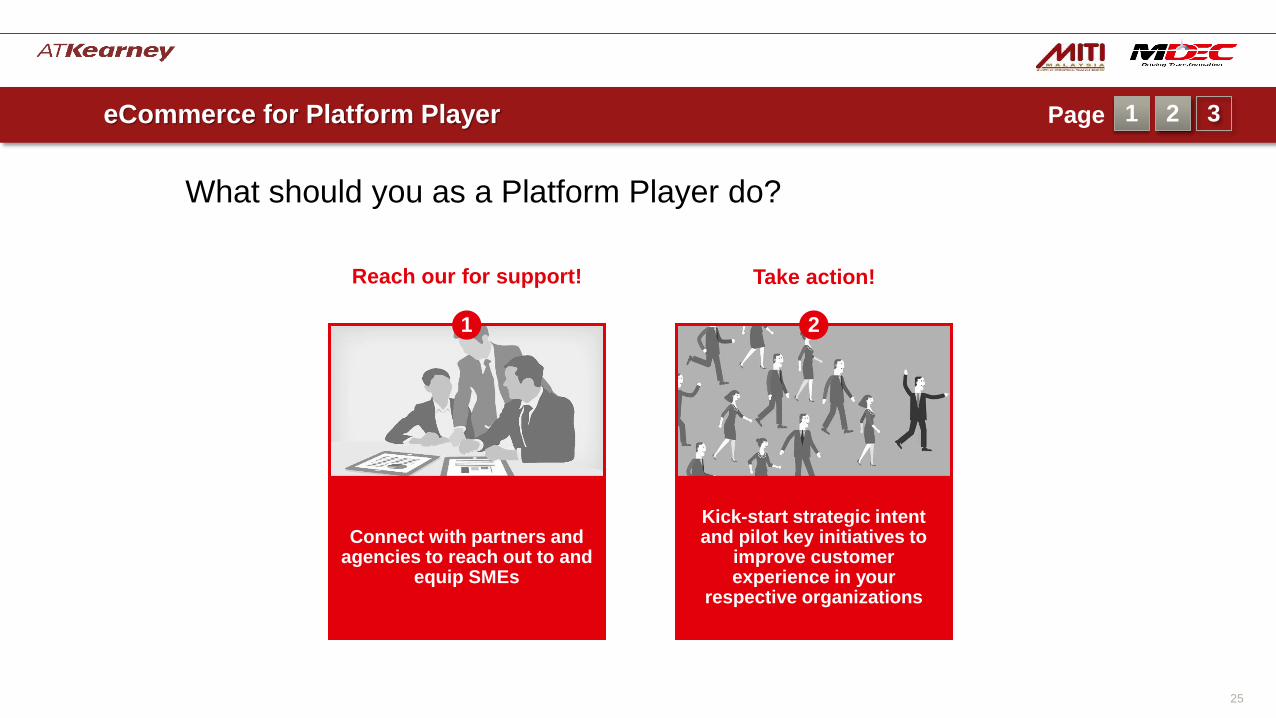
Unique Identifier
25
What should you as a Platform Player do?
Kick-start strategic intent and pilot key initiatives to
improve customer experience in your
respective organizations
2
Connect with partners and agencies to reach out to and
equip SMEs
1
Reach our for support! Take action!
eCommerce for Platform Player 1 Page 2 3
Related Documents