In-the-wild detection of speech affecting diseases Maria Joana Ribeiro Folgado Correia Language Technologies Institute School of Computer Science Carnegie Mellon University Pittsburgh, USA Instituto Superior Técnico University of Lisbon INESC-ID Lisbon, Portugal Professor Bhiksha Raj (Co-advisor), Carnegie Mellon University Professor Isabel Trancoso (Co-advisor), Instituto Superior Técnico, University of Lisbon Professor Tanja Schultz, University of Bremen Professor António Teixeira, University of Aveiro Professor Rita Singh, Carnegie Mellon University Professor Alberto Abad, Instituto Superior Técnico, University of Lisbon Submitted in partial fulfillment of the requirements for the degrees of Doctor of Philosophy in Language and Information Technologies and Doctor of Philosophy in Electrical and Computer Engineering June 2021

Welcome message from author
This document is posted to help you gain knowledge. Please leave a comment to let me know what you think about it! Share it to your friends and learn new things together.
Transcript
In-the-wild detection ofspeech affecting diseases
Maria Joana Ribeiro Folgado Correia
Language Technologies InstituteSchool of Computer ScienceCarnegie Mellon University
Pittsburgh, USA
Instituto Superior TécnicoUniversity of Lisbon
INESC-IDLisbon, Portugal
Professor Bhiksha Raj (Co-advisor), Carnegie Mellon UniversityProfessor Isabel Trancoso (Co-advisor), Instituto Superior Técnico, University of Lisbon
Professor Tanja Schultz, University of BremenProfessor António Teixeira, University of AveiroProfessor Rita Singh, Carnegie Mellon University
Professor Alberto Abad, Instituto Superior Técnico, University of Lisbon
Submitted in partial fulfillment of the requirements for the degrees ofDoctor of Philosophy in Language and Information Technologies and
Doctor of Philosophy in Electrical and Computer Engineering
June 2021


©2021, Maria Joana Ribeiro Folgado Correia

ii

to my grandparentspara os meus avós

iv
Acknowledgements
I would like to begin by acknowledging my outstanding advisors, Professor Isabel Trancoso,and Professor Bhiksha Raj. I have had the immense privilege of working under them, as adoctoral student, for the past six years. These have been years of intense growth, professionallyas a researcher, and also personally, so I owe Professor Isabel Trancoso and Professor BhikshaRaj a great dept of gratitude for their teachings, for guiding me, believing in my work, andsupporting me on a personal level as well, during this period of time. For the great amountof time and energy that they have spent discussing research ideas, and providing technicalinsight, I will be forever grateful to them.
I would also like to acknowledge Professor Tanja Shultz, and Professor Rita Singh for theirmany insightful discussions, particularly since the thesis proposal.
Furthermore, I would like to acknowledge all the Professors and colleagues that I had thepleasure to work alongside, and collaborate with, at the MLSP group, at CMU, and the HLTgroup, at IST. It has been an invaluable experience to share ideas with such a bright, anddiverse group of researchers and friends. I am grateful and indebted to each of them forwhat they have taught me. A special thank you to my colleagues who have also been myco-authors. In particular, to Francisco Teixeira, and Catarina Botelho for their thoughtfulreview of this thesis, and to Professor Alberto Abad for his guidance and insight since myyears as a master student.
It is also important to acknowledge the Portuguese Foundation for Science and Technology(FCT), for partially funding this PhD; and the CMU Portugal program, for creating such aunique program for young researchers. The experience of learning and working at two leadingresearch institutes has been an invaluable one.
On a personal note, I would like to acknowledge my friends. An enormous thank you to Bill,Luís, Miguel, Joli, Shenglan, António, Eliezer, Telmo, Paul, Anuva, Carlos, Leonor, MariaCremilde, and Figueiredo for their support through good and bad.
Finally, my family, who has loved and supported me unconditionally through my life, whichhas allowed me to stand here today. To them, I say: whatever accomplishments I achieve inlife, they are yours. My deepest gratitude and love goes to my mother Maria João, brotherJoão, grandparents Maria das Dores, Maria Filomena, João, and José, godmother Maria,mother-in-law Edna, grandmother-in-law Lourdes, brother-in-law Rui, stepfather-in-lawAmadeu, cousins Raquel and Matthew, and to my life partner João.

vi
Abstract
Speech is a complex bio-signal that is intrinsically related to human physiology and cognition.It has the potential to provide a rich biomarker for health, allowing a non-invasive route toearly diagnosis and monitoring of a range of conditions that affect speech. The scientificcommunity has shown consistent interest in automating the diagnosis and monitoring ofspeech affecting diseases, but advances in this area have been limited by the small size ofthe available speech medical corpora, as these can be prohibitively difficult and expensive tocollect.
At the same time, the problem of diagnosing and monitoring speech affecting diseasesspecifically in in-the-wild contexts has been neglected, as the few existing speech medicalcorpora only contain recordings made in controlled conditions. These are typically conditionsin which the channel is known, the background noise is minimized, or the content of therecordings is controlled by either speaking exercises or clinical interviews. They do notprovide a good representation of real life scenarios.
In this thesis we address the problem of detecting SA in in-the-wild contexts by, on one handproposing novel strategies to collect and annotate speech medical corpora of arbitrary size,for arbitrary speech affecting (SA) diseases, from pre-existing massive online multimediarepositories. On the other hand, by proposing novel strategies to detect speech affectingdiseases in both controlled and in-the-wild conditions, thus expanding the scenarios in whichthe detection of such diseases is possible.
At the same time, we perform the first study of the limitations of both the existing speechmedical corpora and current speech affecting disease detecting techniques when faced within-the-wild data.
In the scope of this thesis we also collect and annotate the in-the-wild speech medical (WSM)corpus, a first of its kind, ever growing corpus of in-the-wild multimodal recordings, featuringexamples of several speech affecting diseases, including depression and Parkinson’s disease.

viii
Resumo
A fala é um bio-sinal complexo, que está intrinsecamente ligado à fisiologia e cognição humana.Tem o potencial de ser um bio-marcador importante para determinar o estado de saúde,permitindo o diagnóstico precoce e a monitorização de um leque do doenças que afectam afala. A comunidade científica tem consistentemente mostrado interesse na automatização dodiagnóstico médico e monitorização de doenças que afectam a fala, mas o progresso desta áreatêm sido travado pelo tamanho limitado das corpora de oradores com doenças que afectama fala, uma vez que o custo e a dificuldade de recolha e anotação das mesmas tende a serproibitivo.
Em simultâneo, o problema de diagnosticar e monitorizar doenças que afectam a fala,particularmente em contextos in-the-wild, tem sido negligenciado, uma vez que as corporaexistentes apenas contêm exemplos recolhidos em condições controladas. Estas condições são,tipicamente, aquelas em que o canal é conhecido, o ruído de fundo é minimizado, e tambémnas quais o conteúdo dos exemplos presentes no corpus é determinado por exercícios de fala,ou guiado por entrevistas clínicas. Estas condições não consistem numa representação fieldas condições encontradas na vida real.
Nesta tese procuramos endereçar o problema da detecção de doenças que afectam a fala,particularmente em contextos in-the-wild. Por um lado, propomo-nos a fazê-lo atravésdo desenvolvimento de novas estratégias de recolha e anotação automática de corpus deoradores com doenças que afectam a fala, para doenças que afectam a fala arbitrárias, apartir de repositórios massivos e multimodais já existentes. Por outro lado, desenvolvendonovas estratégias de detecção automática de doenças que afectam a fala, tanto em condiçõescontroladas, como em condições in-the-wild, alargando assim o leque de cenários em que estaspodem ser automaticamente detectadas.
Também realizamos aquele é, tanto quanto sabemos, o primeiro estudo que mede as limitaçõestanto das corpora actualmente existentes, como das técnicas actuais de detecção de doençasque afectam a fala, quando confrontadas com exemplos provenientes de condições in-the-wild.
No âmbito desta tese, também recolhemos e anotamos o in-the-wild speech medical (WSM)corpus. Um corpus com características únicas, em permanente crescimento, com exemplos devídeos in-the-wild, e que contempla várias doenças que afectam a fala, incluindo depressão edoença de Parkinson.

x
Contents
I Introduction 1
1 Thesis Overview 31.1 Motivation . . . . . . . . . . . . . . . . . . . . . . . . . . . . . . . . . . . . . 31.2 Thesis Statement . . . . . . . . . . . . . . . . . . . . . . . . . . . . . . . . . 51.3 Contributions . . . . . . . . . . . . . . . . . . . . . . . . . . . . . . . . . . . 51.4 Thesis Organization . . . . . . . . . . . . . . . . . . . . . . . . . . . . . . . . 7
2 Speech affecting diseases: depression and Parkinson’s disease 92.1 Speech affecting diseases . . . . . . . . . . . . . . . . . . . . . . . . . . . . . 9
2.1.1 Depression . . . . . . . . . . . . . . . . . . . . . . . . . . . . . . . . . 92.1.2 Parkinson’s disease . . . . . . . . . . . . . . . . . . . . . . . . . . . . 12
2.2 Existing Speech Medical Corpora . . . . . . . . . . . . . . . . . . . . . . . . 142.2.1 Depression: Distress Analysis Interview Corpus . . . . . . . . . . . . 142.2.2 Parkinson’s disease: New Spanish Parkinson Corpus . . . . . . . . . . 152.2.3 Other related corpora . . . . . . . . . . . . . . . . . . . . . . . . . . . 16
3 Automatic, speech-based detection of Depression and Parkinson’s disease 193.1 Automatic detection of SA diseases: Depression and Parkinson’s disease . . . 20
3.1.1 Depression . . . . . . . . . . . . . . . . . . . . . . . . . . . . . . . . . 203.1.2 Parkinson’s disease . . . . . . . . . . . . . . . . . . . . . . . . . . . . 24
3.2 Related work: automatic corpora labeling . . . . . . . . . . . . . . . . . . . 27
II Towards automating the collection and annotation of speechmedical corpora 31
4 The In-the-wild Speech Medical Corpus 334.1 Collection Methodology . . . . . . . . . . . . . . . . . . . . . . . . . . . . . 35
xi
4.2 WSM Corpus, v.1 . . . . . . . . . . . . . . . . . . . . . . . . . . . . . . . . . 374.3 WSM Corpus, v.2 . . . . . . . . . . . . . . . . . . . . . . . . . . . . . . . . . 394.4 WSM Corpus, v.3 . . . . . . . . . . . . . . . . . . . . . . . . . . . . . . . . . 40
4.4.1 Annotation protocol via crowdsourcing . . . . . . . . . . . . . . . . . 414.4.2 Video selection . . . . . . . . . . . . . . . . . . . . . . . . . . . . . . 434.4.3 Insights on the WSM Corpus and its annotations . . . . . . . . . . . 46
5 Automatic annotation of speech medical datasets 55
5.1 Leveraging from transcriptions and metadata in a fully supervised context . 575.1.1 Feature extraction . . . . . . . . . . . . . . . . . . . . . . . . . . . . 585.1.2 Classifiers . . . . . . . . . . . . . . . . . . . . . . . . . . . . . . . . . 595.1.3 Datasets . . . . . . . . . . . . . . . . . . . . . . . . . . . . . . . . . . 595.1.4 Experiments and Results . . . . . . . . . . . . . . . . . . . . . . . . . 59
5.2 Greedy set partitioning for corpora annotation . . . . . . . . . . . . . . . . . 615.2.1 Proposed framework . . . . . . . . . . . . . . . . . . . . . . . . . . . 625.2.2 Feature extraction . . . . . . . . . . . . . . . . . . . . . . . . . . . . 635.2.3 Datasets . . . . . . . . . . . . . . . . . . . . . . . . . . . . . . . . . . 635.2.4 Experimental results for the base model . . . . . . . . . . . . . . . . 645.2.5 Experiment results for the noisy model . . . . . . . . . . . . . . . . . 65
5.3 Generalizing the Multiple Instance Learning framework in a semi supervisedcontext . . . . . . . . . . . . . . . . . . . . . . . . . . . . . . . . . . . . . . . 665.3.1 Underlying structure of the WSM Corpus . . . . . . . . . . . . . . . 675.3.2 Multiple Instance Learning . . . . . . . . . . . . . . . . . . . . . . . . 695.3.3 Intuition for generalizing the Multiple Instance Learning framework . 705.3.4 MIL formulated as a maximum margin problem . . . . . . . . . . . . 705.3.5 θ-MIL . . . . . . . . . . . . . . . . . . . . . . . . . . . . . . . . . . . 72
5.4 Deep Generalized Multiple Instance Learning . . . . . . . . . . . . . . . . . 765.4.1 Proposed differentiable approximation . . . . . . . . . . . . . . . . . 77
5.5 Application of Deep θ-MIL for the automatic annotation of the WSM Corpus 795.5.1 Dataset . . . . . . . . . . . . . . . . . . . . . . . . . . . . . . . . . . 805.5.2 Feature extraction . . . . . . . . . . . . . . . . . . . . . . . . . . . . 805.5.3 Fully supervised upper bound . . . . . . . . . . . . . . . . . . . . . . 815.5.4 Deep θ-MIL performance . . . . . . . . . . . . . . . . . . . . . . . . . 835.5.5 Contribution of each type of document . . . . . . . . . . . . . . . . . 855.5.6 Influence of bag size . . . . . . . . . . . . . . . . . . . . . . . . . . . 86
xii
III Detecting speech affecting diseases in-the-wild 91
6 Detecting speech affecting diseases in-the-wild 936.1 Modeling Strategies for detecting SA diseases . . . . . . . . . . . . . . . . . 96
6.1.1 Generic knowledge based approaches . . . . . . . . . . . . . . . . . . 976.1.2 Speaker modeling based approaches . . . . . . . . . . . . . . . . . . . 986.1.3 End-to-end DL based approaches . . . . . . . . . . . . . . . . . . . . 101
6.2 Experiments and results . . . . . . . . . . . . . . . . . . . . . . . . . . . . . 1026.2.1 Datasets . . . . . . . . . . . . . . . . . . . . . . . . . . . . . . . . . . 1026.2.2 Experiments . . . . . . . . . . . . . . . . . . . . . . . . . . . . . . . . 1036.2.3 Results and discussion . . . . . . . . . . . . . . . . . . . . . . . . . . 1086.2.4 Final considerations . . . . . . . . . . . . . . . . . . . . . . . . . . . 115
IV Conclusion and future work 119
7 Conclusions 121
8 Future work 125
Appendices 147
A Measuring word connotations from word embeddings to detect depression,anxiety and PTSD in clinical interviews 149A.1 Motivation . . . . . . . . . . . . . . . . . . . . . . . . . . . . . . . . . . . . . 149A.2 Data . . . . . . . . . . . . . . . . . . . . . . . . . . . . . . . . . . . . . . . . 150A.3 Proposed approach . . . . . . . . . . . . . . . . . . . . . . . . . . . . . . . . 150A.4 Experiments and results . . . . . . . . . . . . . . . . . . . . . . . . . . . . . 151
B Detection of polarity on movie reviews using θ-MIL 153B.1 Motivation . . . . . . . . . . . . . . . . . . . . . . . . . . . . . . . . . . . . . 153B.2 Data . . . . . . . . . . . . . . . . . . . . . . . . . . . . . . . . . . . . . . . . 153B.3 Features . . . . . . . . . . . . . . . . . . . . . . . . . . . . . . . . . . . . . . 154B.4 Experiments and results . . . . . . . . . . . . . . . . . . . . . . . . . . . . . 155
C Intellectual property and distribution of the WSM Corpus 157
xiii

xiv
List of Tables
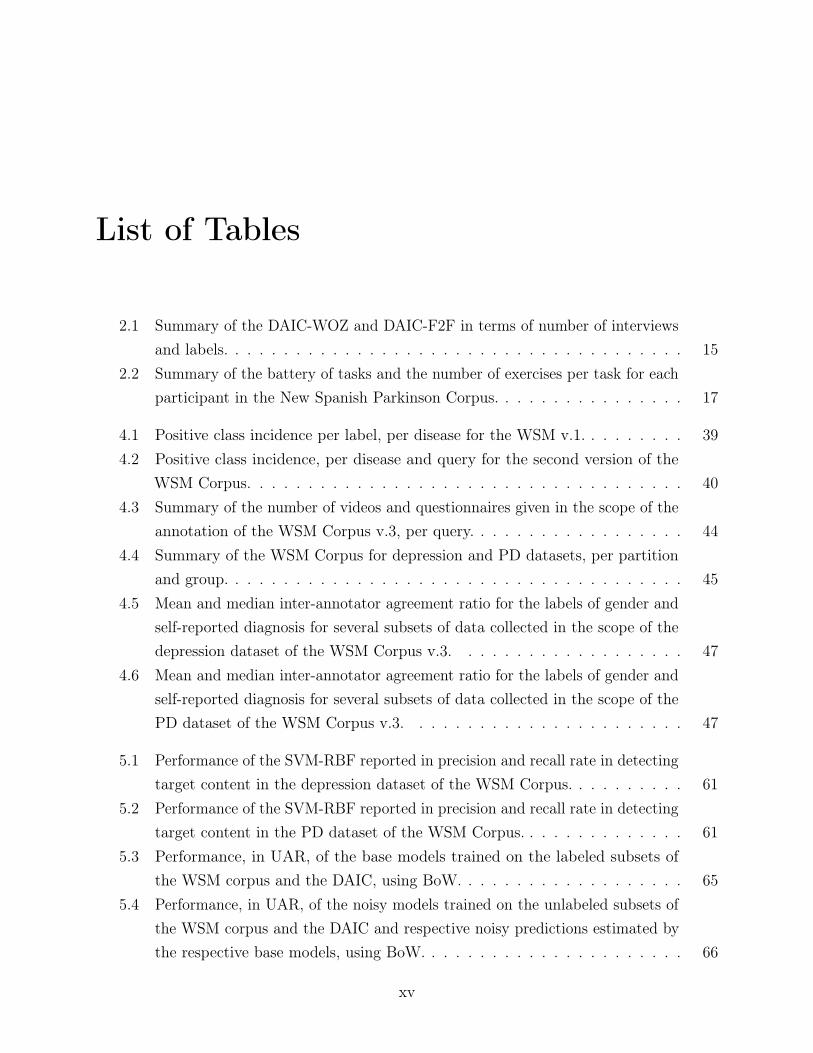
2.1 Summary of the DAIC-WOZ and DAIC-F2F in terms of number of interviewsand labels. . . . . . . . . . . . . . . . . . . . . . . . . . . . . . . . . . . . . . 15
2.2 Summary of the battery of tasks and the number of exercises per task for eachparticipant in the New Spanish Parkinson Corpus. . . . . . . . . . . . . . . . 17
4.1 Positive class incidence per label, per disease for the WSM v.1. . . . . . . . . 394.2 Positive class incidence, per disease and query for the second version of the
WSM Corpus. . . . . . . . . . . . . . . . . . . . . . . . . . . . . . . . . . . . 404.3 Summary of the number of videos and questionnaires given in the scope of the
annotation of the WSM Corpus v.3, per query. . . . . . . . . . . . . . . . . . 444.4 Summary of the WSM Corpus for depression and PD datasets, per partition
and group. . . . . . . . . . . . . . . . . . . . . . . . . . . . . . . . . . . . . . 454.5 Mean and median inter-annotator agreement ratio for the labels of gender and
self-reported diagnosis for several subsets of data collected in the scope of thedepression dataset of the WSM Corpus v.3. . . . . . . . . . . . . . . . . . . 47
4.6 Mean and median inter-annotator agreement ratio for the labels of gender andself-reported diagnosis for several subsets of data collected in the scope of thePD dataset of the WSM Corpus v.3. . . . . . . . . . . . . . . . . . . . . . . 47
5.1 Performance of the SVM-RBF reported in precision and recall rate in detectingtarget content in the depression dataset of the WSM Corpus. . . . . . . . . . 61
5.2 Performance of the SVM-RBF reported in precision and recall rate in detectingtarget content in the PD dataset of the WSM Corpus. . . . . . . . . . . . . . 61
5.3 Performance, in UAR, of the base models trained on the labeled subsets ofthe WSM corpus and the DAIC, using BoW. . . . . . . . . . . . . . . . . . . 65
5.4 Performance, in UAR, of the noisy models trained on the unlabeled subsets ofthe WSM corpus and the DAIC and respective noisy predictions estimated bythe respective base models, using BoW. . . . . . . . . . . . . . . . . . . . . . 66
xv
5.5 Performance in F1 score of the proposed deep MIL network for one type oftextual cue at a time, for depression and PD for the original bags of size 50. 86
5.6 Performance in F1 score for the proposed deep MIL network for different sizesof bags, and different types of textual cues, for depression and PD. . . . . . . 88
6.1 Summary of the datasets used for the experiments described in Section 6.2, bydisease, and recording condition. *All systems except end-to-end, **end-to-end.103
6.2 Results in UAR of the same domain experiments to detect depression. . . . . 1096.3 Results in UAR of the same domain experiments to detect PD. . . . . . . . . 1096.4 Results in UAR of the cross domain experiments to detect depression, where
the train data are from CC and the test data from in-the-wild conditions. . . 1116.5 Results in UAR of the cross domain experiments to detect PD, where the train
data are from CC and the test data from in-the-wild conditions. . . . . . . . 1116.6 Results in UAR of the cross domain experiments to detect depression, where
the train data are from in-the-wild conditions and the test data from CC. . . 1126.7 Results in UAR of the cross domain experiments to detect PD, where the train
data are from in-the-wild conditions and the test data from CC. . . . . . . . 1126.8 Results in UAR of the mixed domain experiments to detect depression, where
the train data are from CC and in-the-wild conditions. . . . . . . . . . . . . 1146.9 Results in UAR of the mixed domain experiments to detect PD, where the
train data are from CC and in-the-wild conditions. . . . . . . . . . . . . . . 114
A.1 Performance in F1 score of the long-term unimodal system with different levelsof corruption of the transcription for depression, anxiety and PTSD. . . . . . 152
B.1 Performance in accuracy of the the supervised SVM, θ-mi-SVM and θ-MI-SVMfor the train and test dataset. . . . . . . . . . . . . . . . . . . . . . . . . . . 156
xvi
List of Figures
4.1 Frames from six videos of the WSM Corpus, showing what the setting of thetypical video is. Usually in a vlog, or other informal video, the subject isaddressing the camera, and records him/herself in a familiar environment, suchas the house, car, or a nearby park. . . . . . . . . . . . . . . . . . . . . . . . 34
4.2 Example of the search results for the query “Depression” (left), and “Depressionvlog” (right) on the multimedia repository YouTube. Next to each videothumbnail is the title in bold, and below is the channel’s unique identifier, thenumber of video views, and how long ago the video was posted. The last linesshow a preview of the video’s description, as written by the uploader. Videothumbnails outlined by a red box correspond to videos of people who do notclaim to be currently affected by depression, and video thumbnails outlined ingreen correspond to target videos featuring subjects who claim to be currentlyaffected by depression. . . . . . . . . . . . . . . . . . . . . . . . . . . . . . . 38(a) “Depression” . . . . . . . . . . . . . . . . . . . . . . . . . . . . . . . . 38(b) “Depression vlog” . . . . . . . . . . . . . . . . . . . . . . . . . . . . . 38
4.3 Average work time measured in seconds versus average performance measuredin f1-score of annotators (each dot represents one annotator), for annotationsrelated to self-reported diagnosis of the depression data of the WSM Corpus v.3. 49
4.4 Average work time measured in seconds versus average performance measuredin f1-score of annotators (each dot represents one annotator), for annotationsrelated to self-reported diagnosis of the PD data of the WSM Corpus v.3. . . 50
4.5 Distribution of the accepted and rejected gender annotations for the depressiondataset of the WSM Corpus v.3. . . . . . . . . . . . . . . . . . . . . . . . . . 51
4.6 Distribution of the accepted and rejected gender annotations for the PD datasetof the WSM Corpus v.3. . . . . . . . . . . . . . . . . . . . . . . . . . . . . . 51
4.7 Distribution of the accepted and rejected self-reported diagnosis annotationsfor the depression dataset of the WSM Corpus v.3. . . . . . . . . . . . . . . 52
xvii
4.8 Distribution of the accepted and rejected self-reported diagnosis annotationsfor the PD dataset of the WSM Corpus v.3. . . . . . . . . . . . . . . . . . . 52
4.9 Distribution of accepted and rejected annotations per age group for the de-pression dataset of the WSM Corpus v.3. . . . . . . . . . . . . . . . . . . . . 53
4.10 Distribution of accepted and rejected annotations per age group for the PDdataset of the WSM Corpus v.3. . . . . . . . . . . . . . . . . . . . . . . . . . 54
5.1 Proposed framework, using base and noisy model, to reconstruct labels of thelabeled subset of a corpus and estimate labels for the unlabeled subset of acorpus. . . . . . . . . . . . . . . . . . . . . . . . . . . . . . . . . . . . . . . . 63
5.2 Example of the natural bag organization of videos retrieved with a given query.Circles represent a set of results for the query above the respective circle.Videos outlined in green contain a positive self-reported health status for thetarget SA disease, and red ones do not. . . . . . . . . . . . . . . . . . . . . . 68
5.3 Illustration of the label assumptions under the MIL framework. Adapted from[1]. . . . . . . . . . . . . . . . . . . . . . . . . . . . . . . . . . . . . . . . . . 69
5.4 Illustration of the label assumptions under the generalized MIL framework,with the threshold of positive examples before the bag becomes positive, θ, setto 25%. . . . . . . . . . . . . . . . . . . . . . . . . . . . . . . . . . . . . . . 71
5.5 mi-SVM (left), and MI-SVM (right) solutions to an arbitrary MIL problem,where negative instances are denoted by “-” and positive instances by a numberencoding their bag membership. Adapted from [2]. . . . . . . . . . . . . . . 73
(a) mi-SVM solution . . . . . . . . . . . . . . . . . . . . . . . . . . . . . 73
(b) MI-SVM solution . . . . . . . . . . . . . . . . . . . . . . . . . . . . . 73
5.6 Illustration of the different smooth differentiable maximum approximation,with different sets of hyperparameters. . . . . . . . . . . . . . . . . . . . . . 78
5.7 Architecture of the fully supervised model that estimates the upper bound ofthe performance that can be obtained in labeling the WSM Corpus, given thefeature choice and model architecture. . . . . . . . . . . . . . . . . . . . . . 82
5.8 Summary of the performance in F1 score of all the models trained to estimatethe depression labels of the WSM Corpus, for different bag sizes and sourcesof textual cues. . . . . . . . . . . . . . . . . . . . . . . . . . . . . . . . . . . 83
5.9 Summary of the performance in F1 score of all the models trained to estimatethe PD labels of the WSM Corpus, for different bag sizes and sources of textualcues. . . . . . . . . . . . . . . . . . . . . . . . . . . . . . . . . . . . . . . . . 84
xviii
5.10 Architecture of the proposed deep-θ-MIL solution to automatically annotatethe WSM Corpus. This architecture is based on a 3-stream network, whereeach stream processed one document. . . . . . . . . . . . . . . . . . . . . . 85
6.1 Baseline system, using eGeMAPS and SVMs, as proposed in previous INTER-SPEECH ComParE Challenges, to detect SA diseases. . . . . . . . . . . . . 98
6.2 Framework, using i-vectors as the front-end and PLDA as the back-end, todetect SA diseases. . . . . . . . . . . . . . . . . . . . . . . . . . . . . . . . . 99
6.3 Framework, using x-vectors as the front-end and PLDA as the back-end, todetect SA diseases. . . . . . . . . . . . . . . . . . . . . . . . . . . . . . . . . 100
6.4 Proposed end-to-end model: this model uses mel-spectrograms as inputs to aCNN-LSTM network, where the LSTM layer has a self-attention mechanism. 102
6.5 Summary of the intuition behind each experiment, based on the domain ofthe data used for training and testing . . . . . . . . . . . . . . . . . . . . . . 105
6.6 Performance in UAR% of the four strategies to detect depression, in both CCand in-the-wild conditions. . . . . . . . . . . . . . . . . . . . . . . . . . . . . 116
6.7 Performance in UAR% of the four strategies to detect PD, in both CC andin-the-wild conditions. . . . . . . . . . . . . . . . . . . . . . . . . . . . . . . 117
A.1 Examples of words with large relative frequency difference for each label. . . 152
B.1 Proposed θ-MIL framework at test time, to predict the polarity of a movie(bag) and its reviews (instances). . . . . . . . . . . . . . . . . . . . . . . . . 154
C.1 Email confirmation from the CTTEC regarding the distribution of the WSMCorpus. . . . . . . . . . . . . . . . . . . . . . . . . . . . . . . . . . . . . . . 164
xix

xx
Acronyms
AMT Amazon Mechanical Turk.
AVEC Audio/Visual Emotion Challenge and Workshop.
BERT Bidirectional Encoder Representations from Transformers.
BoAW Bag-of-AudioWords.
BoW Bag-of-Word.
CC Controled Conditions.
CNN Convolutional Neural Network.
ComParE Computational Paralinguistics challengE.
DAIC Distress Analysis Interview Corpus.
DAIC-F2F Distress Analysis Interview Corpus - Face to Face.
DAIC-WOZ Distress Analysis Interview Corpus - Wizard of Oz.
DDK diadochokinetic.
DL Deep Learning.
DNN Deep Neural Networks.
EER Equal Error Rate.
eGeMAPs extended Geneva minimalistic acoustic parameters.
EM Expectation Maximization.
F2F Face-to-face.
xxi
GeMAPs Geneva minimalistic acoustic parameters.
GMM Gaussian Mixture Model.
HC Healthy Controls.
JFA Joint Factor Analisys.
LDA Linear Discriminant Analysis.
LLD Low-Level Descriptor.
LLR Log-Likelihood Ratio.
LR Logistic Regression.
MAE Mean Absolute Error.
MFCC Mel-Frequency Cepstral Coefficients.
mi/MI-SVM Multiple Instance Support Vector Machine.
MIL Multiple-Instance Learning.
MLP Multi-Layer Perceptron.
NN Neural Network.
OSA Obstructive Sleep Apnea.
PC-GITA Parkinson’s disease Corpus from the Applied Telecommunications Group.
PCC Pearson correlation coefficient.
PD Parkinson’s Disease.
PHQ-9 Patient Health Questionnaire.
PLDA Probabilistic Linear Discriminant Analysis.
PTSD Post-Traumatic Stress Disorder.
RBF Radial Basis Function.
RMSE Root Mean Squared Error.
xxii
RNN Recurrent Neural Networks.
RNTN Recursive Neural Tensor Network.
SA Speech Affecting [Disease].
SBERT Sentence Bidirectional Encoder Representations from Transformers.
SVM Support Vector Machine.
td-idf term-frequency times inverse document-frequency.
TD-NN Time-Delay Neural Network.
UAR Unweighted Average Recall.
UBM Universal Background Model.
VAD Voice Activity Detection.
WOZ Wizard-of-Oz.
WSM in-the-Wild Speech Medical [Corpus].
xxiii

xxiv

Part I
Introduction
1

Chapter 1
Thesis Overview
1.1 Motivation
Speech is a complex bio-signal that is intrinsically related to human physiology and cognition.It has the potential to provide a rich bio-marker for health, allowing a non-invasive route toearly diagnosis and monitoring of a range of conditions that affect speech, including severalmood disorders (depression, bipolar disorder, anxiety, etc.), several degenerative diseases(including Parkinson’s disease, Alzheimer’s disease, Huntington’s disease, amyotrophic lateralsclerosis, among others), sleep related conditions (such as sleep apnea), some forms of autism,and diseases of the respiratory system (such as the asthma, COVID-19, or influenza).
The scientific community has done extensive work, and has shown consistent interest inautomating the diagnosis and monitoring of such diseases, to which we will refer to asspeech affecting (SA) diseases, using a plethora of approaches, not necessarily based onspeech analysis. ML-based tools for diagnosis range from those that analyse medical images,including magnetic resonance imaging [3] [4] [5], to electroencephalograms [6] [7], to videos,including eye-tracking [8] [9], and motion tracking [10], among others. All of them have theirown advantages and disadvantages, namely in terms of four parameters: cost, invasiveness,accessibility, and performance.
The advantages of performing automatic diagnosis based specifically on speech, over othertechniques, include the following: non-invasiveness, and easy availability, both of whichbecause the only necessary material for the diagnosis is an external microphone.
However, cost can become an issue, in fact, it is one of the most important factors that islimiting the progress towards creating robust and accurate automatic speech based diagnosis
3
technologies. In this context, cost is related both to human and financial resources associatedto collecting, and labeling speech medical data. The usual setup to collect any given speechmedical dataset involves finding eligible and willing subjects, assigning healthcare specialists,and ensuring the technical, logistic and legal requirements for the data collection process.After that, it is necessary to have a team of specialists process the raw collected data andannotate it manually. As a consequence, the existing speech medical datasets are few innumber, and small in size.
In turn, because of the limited size of existing speech medical datasets, any models ortechniques developed using them are limited in complexity, which can be translated intolimitations on the performance that can be achieved using this data.
Furthermore, currently existing speech medical data are collected in controlled conditions(CC), which corresponds to one or several of the following criteria: patients have a script orguidelines for what to say, as determined by specific speech exercises or via clinical interviews;the channel conditions are known; the noise conditions are controlled or minimized. Theseconditions may, at first glance, seem the most desirable conditions to collect the speechmedical data in, given that the constraints under which the data were collected make theproblem easier to solve: e.g. specific speaking exercises are designed to make isolated aspectsof articulation, phonation or prosody, that are characteristic of a given SA disease standout, when compared to spontaneous speech; or clinical interviews may guide the subject toan emotional state that is characteristic of a given SA disease (typically only applicable tomood disorders, and diseases from the autism spectrum), but which the subject would notspontaneously demonstrate.
In contrast, real-life applications for detecting SA diseases should operate in vastly differentconditions, where the subjects are not constrained in terms of what they say or how they sayit, and where, at the same time, there is no knowledge about the channel and backgroundnoise, i.e. in-the-wild conditions.
While detecting SA diseases in in-the-wild conditions is a more difficult problem than theequivalent task in CC, it is arguably a more relevant one. This is because the former has thepotential to create a more realistic characterization of SA diseases, as well as be applicable inmore scenarios, and be made available more broadly, beyond what is possible in CC. However,the problem of detecting SA diseases in in-the-wild conditions, is yet to be addressed.
We believe that by improving the detection of SA diseases, particularly in in-the-wildconditions, we are making a small contribution towards democratizing the access to healthcareworldwide.
4
1.2 Thesis Statement
With the previous motivation in mind, the goal of this thesis is to address the limitations inthe state-of-the-art in the detection of SA diseases based on speech, both in terms of lack ofdata that faithfully represents real life scenarios, as well as techniques that automate thedetection of such diseases in any conditions, both CC and in-the-wild.
In essence, the main goal of this thesis is to:
Push the state-of-the-art of automatic detection of SA diseases based on speech,by proposing a set of tools that would ultimately allow the detection of any SAdisease, in real-life scenarios.
Along the way, we hope to answer the following research questions:
• How does the problem of detecting SA diseases in CC differ from the same problem inin-the wild conditions?
• Do speech medical data collected from existing in-the-wild sources provide a goodrepresentation of non-healthy speech?
• Can speech medical data collected from existing in-the-wild sources be an effectiveresource for training and evaluating SA detectors?
1.3 Contributions
To the best of our knowledge, this is the first work to address the in-the-wild detection ofSA diseases, from the data collection and labeling stage, to the diagnosis. Over the courseof this thesis, we will focus on two SA diseases as our working examples: depression, andParkinson’s disease (PD). Nevertheless, it is not the goal of this thesis to present solutionsthat are optimized for these two SA diseases. Rather, our aim was to develop solutions thatremained “disease agnostic”, i.e., that do not leverage from domain specific knowledge abouta target SA disease, and that, therefore, can be easily reused for any SA disease, not onlydepression and PD.
This thesis’ main contributions are:
1. The in-the-wild speech medical (WSM) corpus, an ever growing, first of its kind corpusthat features in-the-wild recordings of subjects affected by several SA diseases;
2. The development of novel frameworks that automate the collection and annotationprocess of these in-the-wild datasets of arbitrary size, that are, at the same time, easily
5
translatable to other tasks;
3. A study comparing and measuring the differences between the tasks of detecting SAdiseases in CC and in-the-wild conditions;
4. The development of frameworks to tackle the in-the-wild detection of SA diseases, whileremaining agnostic to the target SA disease.
Finally, the work presented on this thesis has resulted in the following peer reviewed publica-tions:
• J. Correia, I. Trancoso, and B. Raj, “Detecting psychological distress in adults throughtranscriptions of clinical interviews,” in IberSPEECH 2016, Lisbon, Portugal, November2016
• J. Correia, I. Trancoso, and B. Raj, “Adaptation of SVM for MIL for inferring thepolarity of movies and movie reviews,” in 2016 IEEE Spoken Language TechnologyWorkshop (SLT), San Diego, USA, December 2016
• J. Correia, I. Trancoso, B. Raj, and F. Teixeira, “Mining multimodal repositoriesfor speech affecting diseases,” in 19th Annual Conference of the International SpeechCommunication Association (INTERSPEECH), Hyderabad, India, September 2018
• J. Correia, I. Trancoso, and B. Raj, “Querying depression vlogs,”, in IEEE SpokenLanguage Technology Workshop (SLT), Athens, Greece, December 2018
• J. Correia, I. Trancoso, and B. Raj, “End-to-end in-the-wild detection of speech affectingdiseases,” in IEEE Automatic Speech Recognition and Understanding Workshop (ASRU)2019, Sentosa, Singapore, December 2019
• J. Correia, I. Trancoso, and B. Raj, “Automatic in-the-wild dataset annotation with deepgeneralized multiple instance learning,” in 12th International Conference on LanguageResources and Evaluation (LREC), Nice, France, May 2020
• J. Correia, C. Botelho, F. Teixeira, I. Trancoso, and B. Raj, The In-the-Wild SpeechMedical Corpus,”, in 2021 IEEE International Conference on Acoustics, Speech andSignal Processing (ICASSP), Toronto, Canada, June 2021
This work has also been included in several keynote papers.
6
1.4 Thesis Organization
This thesis is organized in four parts. Part I is dedicated to introduce, motivate andcontextualize the problems addressed in this thesis. Specifically, within Part I, Chapter2 provides an overview of the characteristics of depression and PD, and the physiologicalchanges that are associated to these diseases, particularly regarding speech production, thusproviding the necessary context to understand how it is possible to detect them throughspeech. This Chapter also provides a summary of the existing speech medical corpora forthese two target SA diseases. Chapter 3 is dedicated to reviewing the state-of-the-art of thedetection of depression and PD. However this review is limited to experiments performed inCC conditions, which are the only conditions that have yet been studied. Additionally, thisChapter also reviews some of the work previously developed in the scope of automating theannotation of corpora.
Part II lays out our proposed strategies to automate the process of collecting and annotatingspeech medical corpora for arbitrary SA diseases, and provides examples for depression andPD. Chapter 4 describes the WSM Corpus, a corpus of in-the-wild recordings of subjectsaffected by several SA diseases, collected in the scope of this thesis. This Chapter alsoprovides some details regarding different versions of the corpus, from proof-of-concept to final,along with their collection methodology. Chapter 5 proposes several techniques to automatethe annotation of corpora, with varying ratios of labeled to unlabeled data during training.In this Chapter we perform several experiments where we apply the proposed techniques toannotate the WSM Corpus.
Part III covers several techniques to detect SA diseases both in CC and in-the-wild conditions,both from a theoretical as well as experimental perspectives. Chapter 6 describes severalproposed approaches to detect SA diseases, by adopting different strategies do formulate theproblem, from knowledge based approaches, to approaches based on speaker modeling andend-to-end deep learning (DL). This Chapter also features the experimental verification ofthese techniques, using, among others, the WSM Corpus.
Finally, Part IV is dedicated to reflect on the work that has been accomplished over thecourse of this thesis, drawing some conclusions, which can be found in Chapter 7, as well aslaying out suggestions for future work, in Chapter 8.
Additionally to the main body of this thesis, we include three Appendices. Two containideas, experiments, and results, that, while not directly in the scope of this thesis, provideadditional insight to problems adjacent to the ones presented and addressed in this thesis.Appendix A explores a novel strategy to detect depression, anxiety and post-traumatic stress
7

disorder (PTSD) based on a quantity deemed the “connotation” of a word. Appendix Bprovides an experimental verification to the problem of dataset annotation, using one of thetechniques proposed in Chapter 5, applied to the domain of written movie reviews. Finally,the third, Appendix C, provides the supporting documentation for the distribution of theWSM Corpus for academic, research, and other non-commercial purposes.
8

Chapter 2
Speech affecting diseases: depression andParkinson’s disease
Before addressing the main problem of this thesis, which is related to the detection of SAdiseases, it is important to have a basic understanding of what the target SA diseases are, andwhat symptoms are typically associated with them, particularly regarding speech production.We will dedicate this Chapter to covering these aspects, specifically for the SA diseases whichwere chosen to illustrate our thesis statement: depression and PD.
In Section 2.1 we review the main acoustic changes that these impairments impose onotherwise healthy, or “normal” speech. Then, in Section 2.2, we describe the most commonlyused speech medical datasets to automatically train models that detect or assess the severityof depression and PD, as a way to provide context to the resources typically available in thisresearch area.
2.1 Speech affecting diseases
2.1.1 Depression
Depression, otherwise known as major depressive disorder, or clinical depression, is a commonand serious mood disorder, characterized by persistent feelings of sadness and hopelessness,as well as loss of interest or pleasure in activities previously enjoyed. It has a lifetimeprevalence of over 16% [11], and is considered the world’s fourth most serious health threat[12]. At the same time, it is the leading cause of disability worldwide in terms of total yearslost due to disability [13]. An estimated 350 million people of all ages are affected by this
9
disorder, worldwide [13], and it is expected to become more prevalent as the average age ofthe worldwide population increases [12].
It is estimated that the total cost of depression per year in the European Union is e92billion, out of which e54 billion is the amount lost due to lost work productivity [14]. Similarestimates were made in the United States, where the cost of lost work productivity per yeardue to depression is estimated to be between $US 36 billion [15] and $US 53 billion [16]. InAustralia the annual cost associated to absenteeism, presenteeism, turnover and treatmentcosts caused by depression is of $AUD 12.6 billion [17].
Aside from the above mentioned emotional symptoms, depression can also cause physicalsymptoms such as chronic pain or digestive issues.
According to the American Diagnostic and Statistical Manual of Mental Disorders, 5th Edition(DSM-5) [18] (published by the American Psychiatric Association), the most widely usedresource in the diagnosis of mental disorders, the diagnostic for depression must verify thatthe individual being diagnosed experiences five or more of the following symptoms during thesame two week period, and at least one of the symptoms should be either depressed mood, orloss of interest and pleasure:
• Depressed mood most of the day, nearly every day
• Markedly diminished interest or pleasure in all, or almost all, activities most of the day,nearly every day
• Significant weight loss when not dieting or weight gain, or decrease or increase inappetite nearly every day
• A slowing down of thought and a reduction of physical movement (observable by others,not merely subjective feelings of restlessness or being slowed down)
• Sleep disturbance (insomnia or hypersomnia)
• Psychomotor agitation or retardation
• Feelings of worthlessness or excessive or inappropriate guilt nearly every day
• Diminished ability to think or concentrate, or indecisiveness, nearly every day
• Recurrent thoughts of death, recurrent suicidal ideation without a specific plan, or asuicide attempt or a specific plan for committing suicide
The criteria-based diagnosis of depression can also be accomplished with other instruments,including several self administered questionnaires, such as the Patient Health Questionnaire
10
(PHQ-9) [19], which scores each of the nine DSM-5 criteria as “0” (not at all) to “3” (nearlyevery day), thus being a tool that allows for a measure of severity of depression as well.
From a perspective of automating the diagnosis, it is important to understand which symp-toms of depression can be quantified and measured. Typically, psychomotor disturbances indepression are a good candidate, since they account for a significant portion of the physicalsymptoms that occur in depression. Additionally, there is growing evidence that psychomotordisturbances are the earliest and most consistent indicators of mood disorders [20]. Psy-chomotor disturbances can be broadly classified into four subgroups of symptoms and signsbased on three available clinical rating scales designed to characterize them (CORE [21],motor agitation and retardation scale [22], Widlöcher scale [23]): retardation, agitation,non-interactiveness, and mental slowing.
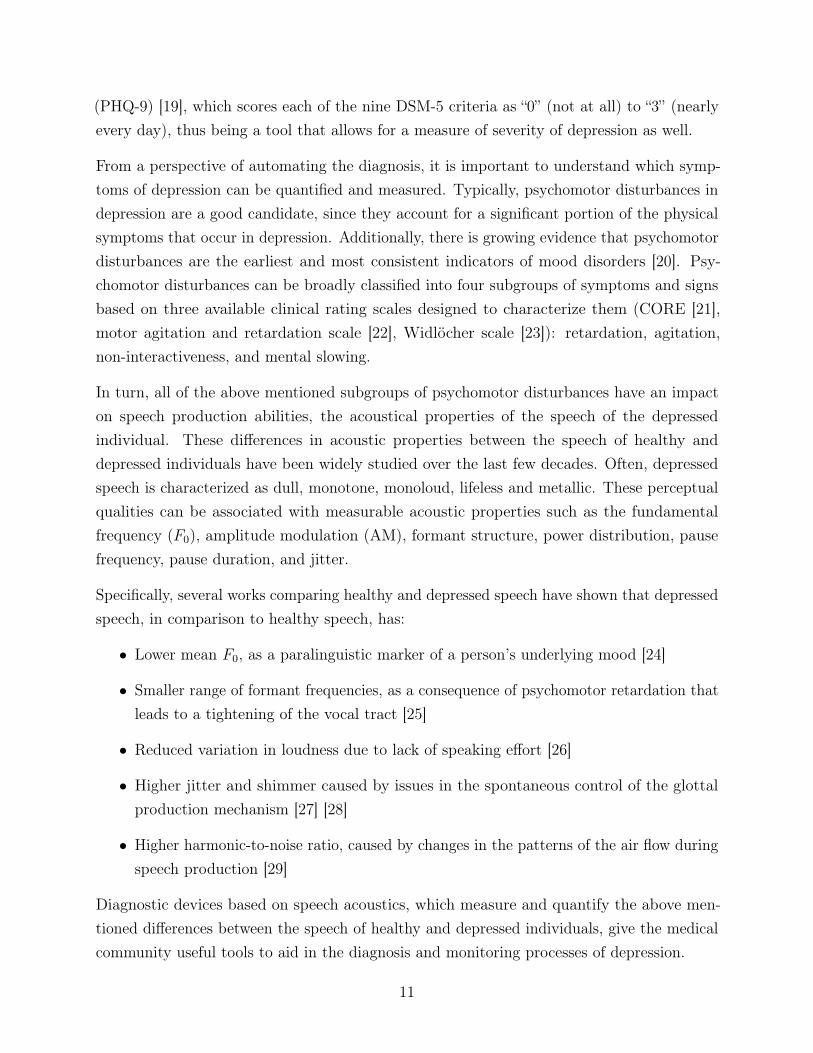
In turn, all of the above mentioned subgroups of psychomotor disturbances have an impacton speech production abilities, the acoustical properties of the speech of the depressedindividual. These differences in acoustic properties between the speech of healthy anddepressed individuals have been widely studied over the last few decades. Often, depressedspeech is characterized as dull, monotone, monoloud, lifeless and metallic. These perceptualqualities can be associated with measurable acoustic properties such as the fundamentalfrequency (F0), amplitude modulation (AM), formant structure, power distribution, pausefrequency, pause duration, and jitter.
Specifically, several works comparing healthy and depressed speech have shown that depressedspeech, in comparison to healthy speech, has:
• Lower mean F0, as a paralinguistic marker of a person’s underlying mood [24]
• Smaller range of formant frequencies, as a consequence of psychomotor retardation thatleads to a tightening of the vocal tract [25]
• Reduced variation in loudness due to lack of speaking effort [26]
• Higher jitter and shimmer caused by issues in the spontaneous control of the glottalproduction mechanism [27] [28]
• Higher harmonic-to-noise ratio, caused by changes in the patterns of the air flow duringspeech production [29]
Diagnostic devices based on speech acoustics, which measure and quantify the above men-tioned differences between the speech of healthy and depressed individuals, give the medicalcommunity useful tools to aid in the diagnosis and monitoring processes of depression.
11
2.1.2 Parkinson’s disease
PD is a progressive multi-system neurodegenerative disease of the central nervous system, withmultiple subgroups (including but not limited to multiple-system atrophy, and progressivesupranuclear palsy), that causes partial or full loss in motor reflexes, speech, behaviour,mental processing, and other vital functions [30].
Its cause remains unknown, however, there is some evidence that the disease arises from aninteraction between genetic and environmental factors that leads to progressive degenerationof neurons in susceptible regions of the brain.
PD is the second most common neurological problem in the elderly, after Alzheimer’s disease[31]. The prevalence of PD in industrialised countries is generally estimated at 0.3% of theentire population, about 1% in people over 60 years of age, and about 4% in people over 80years of age [31][32]. Therefore, as the average life expectancy increases, so will the impact ofPD in future years. At the same time, the estimated yearly economic burden of PD in theUS alone, including direct, indirect, and non-medical costs, is $US 52 billion [33]. A numberthat is predicted to increase to $US 79 billion by 2037 [33].
James Parkinson’s original description of “the shaking palsy” in 1817 focused on the motorfeatures of the disorder: tremor, bradykinesia, rigidity, micrographia, and different speechimpairments [34][35]. Over time, a more complete picture of the clinical phenotype of PDhas emerged, revealing it to be a multi-system disorder with a wide variety of motor andnon-motor symptoms, with the non-motor symptoms being categorized into disturbances inautonomic function, sleep disturbances, cognitive and psychiatric disturbances, and sensorysymptoms.
The first step for a PD diagnosis is to detect slowness of initiation of voluntary movementswith progressive reduction in speed and amplitude of repetitive actions (bradykinesia) and oneof the following additional symptoms: muscular rigidity, resting tremor or postural instability.Then, the diagnosis also has to ascertain at least three supportive criteria for PD, such asunilateral onset of symptoms, persistent asymmetry of clinical symptoms, good response tolevodopa treatment, and induction of dyskinesias by the dopaminergic treatment.
In the present days, the diagnosis of PD is based on the criteria defined on the UK PD Brainbank [36], and the level and characteristics of motor impairments are currently evaluatedaccording to the Movement Disorder Society – Unified Parkinson’s Disease Rating Scale(MDS-UPDRS) [37]. However, this scale only contains one item that is related to speechimpairments.
12
An alternative scale to assess only the speech deficits of PD patients is the Frenchay DysarthriaAssessment (FDA), introduced in [38] and revised in [39], which was designed to assessdysarthria, a symptom that is frequently found in PD patients. The FDA scale includesseveral items to evaluate dysarthria such as reflexes, respiration, lips movement, palatemovement, laryngeal capacity, tongue posture/movement, intelligibility, and others. Thistool covers a wide range of aspects. However, it requires the patient to be with the examiner,which is not possible in many cases due to their reduced mobility.
As is the case of depression, studying the changes in speech produced by healthy individualsand individuals with PD can present a supplementary route to perform not just early diagnosisof PD, but also as a tool to monitor the progression of the disease.
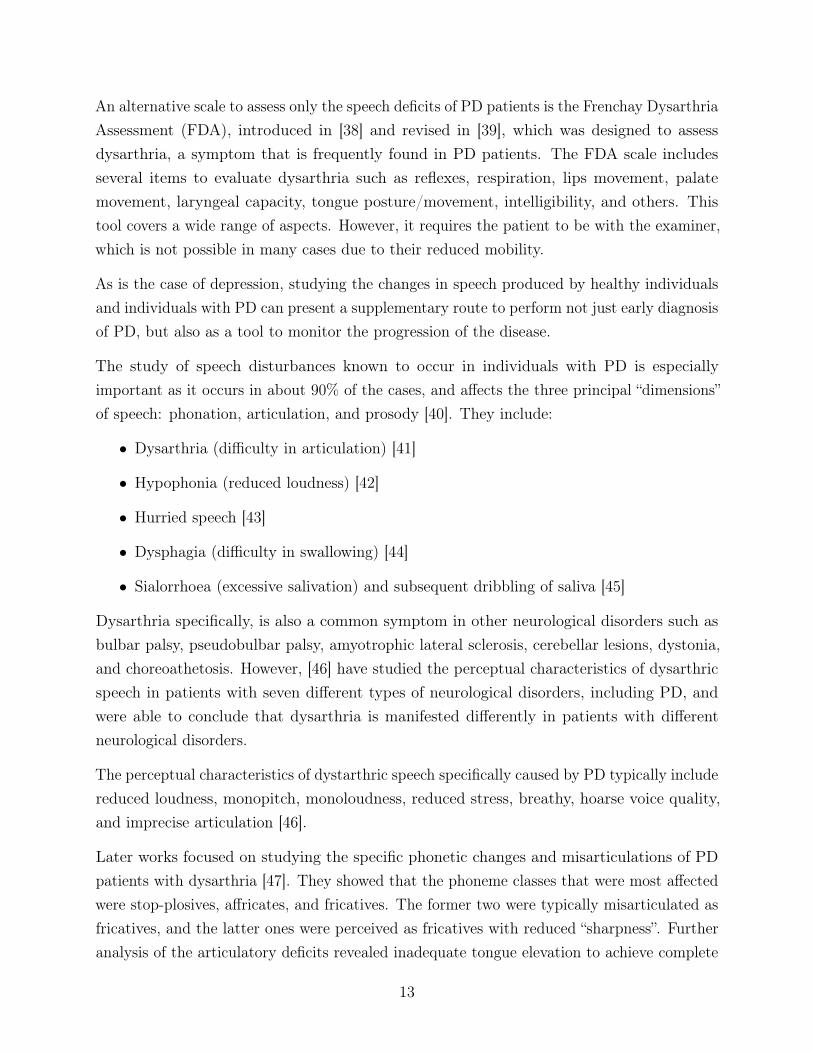
The study of speech disturbances known to occur in individuals with PD is especiallyimportant as it occurs in about 90% of the cases, and affects the three principal “dimensions”of speech: phonation, articulation, and prosody [40]. They include:
• Dysarthria (difficulty in articulation) [41]
• Hypophonia (reduced loudness) [42]
• Hurried speech [43]
• Dysphagia (difficulty in swallowing) [44]
• Sialorrhoea (excessive salivation) and subsequent dribbling of saliva [45]
Dysarthria specifically, is also a common symptom in other neurological disorders such asbulbar palsy, pseudobulbar palsy, amyotrophic lateral sclerosis, cerebellar lesions, dystonia,and choreoathetosis. However, [46] have studied the perceptual characteristics of dysarthricspeech in patients with seven different types of neurological disorders, including PD, andwere able to conclude that dysarthria is manifested differently in patients with differentneurological disorders.
The perceptual characteristics of dystarthric speech specifically caused by PD typically includereduced loudness, monopitch, monoloudness, reduced stress, breathy, hoarse voice quality,and imprecise articulation [46].
Later works focused on studying the specific phonetic changes and misarticulations of PDpatients with dysarthria [47]. They showed that the phoneme classes that were most affectedwere stop-plosives, affricates, and fricatives. The former two were typically misarticulated asfricatives, and the latter ones were perceived as fricatives with reduced “sharpness”. Furtheranalysis of the articulatory deficits revealed inadequate tongue elevation to achieve complete
13
closure on stop-plosives and affricates; and inadequate close constriction of the airway,which cause misarticulations in lingual fricatives. Both phenomena represented inadequatenarrowing of the vocal tract at the point of articulation.
Some of the effects of PD on the vocal tract have been observed through video stroboscopy,namely laryngeal tremor, vocal fold bowing, and abnormal glottal opening and closing [48].
Besides dysarthria, speech affected by PD is also characterized by variable rate and frequentword finding difficulties, referred to as “tip-of-the-tongue” phenomenon [49].
2.2 Existing Speech Medical Corpora
2.2.1 Depression: Distress Analysis Interview Corpus
The Distress Analysis Interview Corpus (DAIC) [50] is a multi-modal collection of semi-structured clinical interviews. It was designed to simulate the standard protocols createdfor identifying people at risk for depression, anxiety and post-traumatic stress disorder. Theinterviews were collected as part of a larger effort to create a computer agent that interviewedpeople and identified verbal and non-verbal indicators of mental illness [51].
The DAIC contains four types of interviews:
• Face-to-face (F2F) interviews between a participant and a human interviewer
• Teleconference interviews, conducted by a human interviewer over a teleconferencingsystem
• Wizard-of-Oz (WOZ) interviews, conducted by an animated virtual interviewed namedEllie, controlled by a human interviewer out of the participants sight
• Automated interviews, where participants are interviewed by Ellie, operating as a fullyautomated agent
Out of the four types of interviews, only one was made publicly accessible, the DAIC-WOZ,through the Audio/Visual Emotion Challenge and Workshop (AVEC 2016), and in thesubsequent editions of this challenge.
The DAIC-WOZ contains 189 interviews, ranging from about 5 to 20 minutes. The participantswere recorded by a camera, high-quality close-talking microphone, and Kinect. As such,the corpus contains audio, video, and depth sensor recordings of all the interactions. Theinterviews were automatically transcribed, and subsequently reviewed for accuracy by asenior transcriber. Utterances were segmented at boundaries with at least 300 milliseconds
14
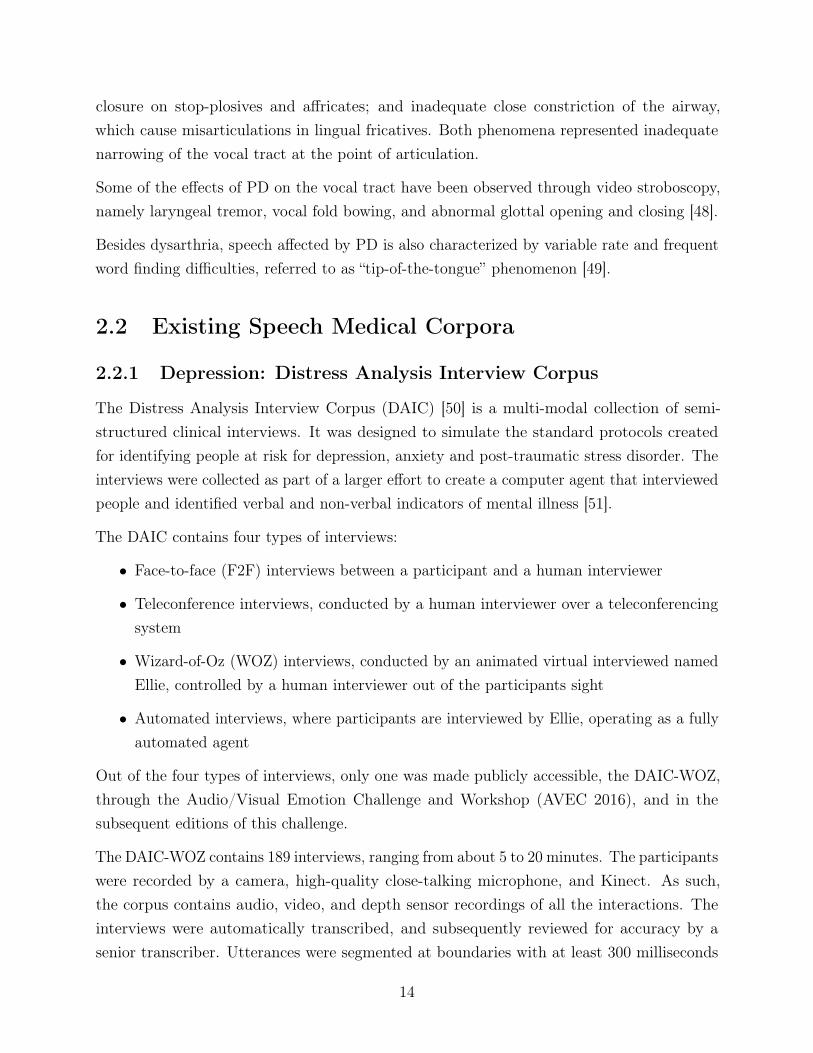
Table 2.1: Summary of the DAIC-WOZ and DAIC-F2F in terms of number of interviews andlabels.
Corpus Partition # Interviews # Depressed # PTSD # Anxiety
DAIC-WOZTrain 107 30 N/A N/ADevel. 35 12 N/A N/ATest 45 N/A N/A N/A
DAIC-F2F N/A 65 26 29 43
of silence. All of them were subsequently anonymized (references to the patients’ names,address or other such personal information was redacted).
Furthermore, the DAIC-F2F, although not publicly available, was kindly made available tous. It contains 65 videos recorded using the same setup as the DAIC-WOZ. However, theinterviews in the DAIC-F2F are on average longer than the DAIC-WOZ ones, lasting from30 to 60 minutes.
In terms of labels, the DAIC codes the participants for depression, PTSD and anxiety, basedon accepted standard psychiatric questionnaires. Respectively, they were based on the PatientHealth Questionnaire, depression module (PHQ-8) [19] (which is the same questionnaire asthe PHQ-9 without the suicidal ideation questions), the PTSD Checklist – Civilian Version[52], State-Trait Anxiety Inventory [53]. The results of all the questionnaires were highlycorrelated, reflecting the co-occurrences found in these clinical conditions.
In Table 2.1 we present a summary of the DAIC-WOZ (divided in train, development andtest partitions, as distributed by the authors), the DAIC-F2F, and their respective labeldistributions for depression, and, when available, for anxiety and PTSD. We note that thetest labels of the DAIC-WOZ are not publicly available, as they are part of the runningAVEC Challenge. Furthermore, the labels for PTSD and anxiety of the DAIC-WOZ havealso never been publicly distributed.
2.2.2 Parkinson’s disease: New Spanish Parkinson Corpus
The Parkinson’s disease Corpus from the Applied Telecommunications Group (GITA) atthe Universidad de Antioquia, Colombia [54] (PC-GITA), sometimes also referred to as theNew Spanish Speech Corpus by some works of the corpus’ authors, is a collection of speechrecordings from 50 PD patients and 50 control subjects, 25 men and 25 women on each group,where the subjects perform a number of speech exercises.
In terms of age of the subsets in the corpus, the men with PD have ages ranging from 33 to
15
77 years old, with a mean of 62.2± .2; and the age of the women with PD ranges from 44 to75 years old, with a mean of 60.1± 7.8. Among the healthy controls (HC), the age of themen ranges from 31 to 86, with a mean of 61.2± 11.3; and the age of the women ranges from43 to 76 years old, with a mean of 60.7± 7.7. As such, this dataset is balanced both in termsof gender as well as age.
The dataset is in Colombian Spanish, and the recordings were captured in noise controlledconditions, in a sound proof booth that was built at the Clinica Noel, in Medellin, Colombia.All of the patients were diagnosed by neurology experts, and were labeled according tostandard clinical protocols: the unified Parkinson’s disease rating scale (UPDRS) [55], andHoehn and Yahr (H&Y) [56]. These scales also provide a measure of the severity of PD.
The recording protocol considered different tasks which were designed to analyze severalaspects of the voice and speech of people with PD. Such tasks were grouped into three aspects:phonation, articulation and prosody.
The evaluation of phonation was performed through the task of performing three repetitionsof the five Spanish vowels uttered in a sustained manner; and the task of uttering the fiveSpanish vowels changing the tone of each vowel from low to high.
The evaluation of articulation included the following tasks: Three repetitions of the fiveSpanish vowels uttered in a sustained manner (same as in the phonation evaluation); therapid repetition of the words and phonemes /pa-ta-ka/, /pa-ka-ta/, /pe-ta-ka/, /pa/, /ta/,/ka/ (dysdiadochokinesia analysis, or DDK); and the repetition of a given list of Spanishwords.
Finally, prosody was evaluated with the tasks of: repeating sentences with different levels ofsyntactic complexity; reading a pre-written dialog between a doctor and a patient; readingsentences with additional emphasis in specific words; and spontaneous speech.
The complete evaluation protocol amounts to less than 10 minutes of speech per patient.
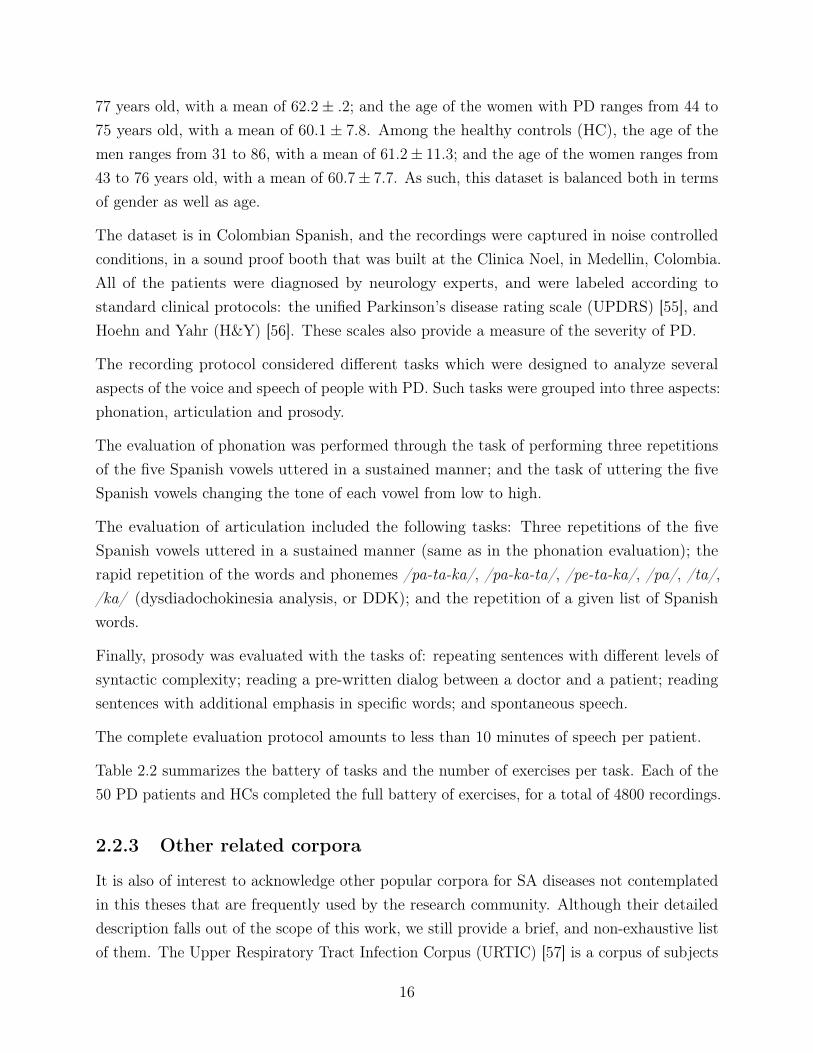
Table 2.2 summarizes the battery of tasks and the number of exercises per task. Each of the50 PD patients and HCs completed the full battery of exercises, for a total of 4800 recordings.
2.2.3 Other related corpora
It is also of interest to acknowledge other popular corpora for SA diseases not contemplatedin this theses that are frequently used by the research community. Although their detaileddescription falls out of the scope of this work, we still provide a brief, and non-exhaustive listof them. The Upper Respiratory Tract Infection Corpus (URTIC) [57] is a corpus of subjects
16
Table 2.2: Summary of the battery of tasks and the number of exercises per task for eachparticipant in the New Spanish Parkinson Corpus.
Task # Exercises Aprox.duration [sec]
Monologue 1 60Read text 1 20
Read sentences 6 5Vowels 5 3
DDK analysis 6 5
affected by the cold/flu. The Dementia Bank [58] is a corpus dedicated to Alzheimer’s disease,mild neurocognitive disorder, and primary progressive aphasia. The TORGO is databaseof dysarthric articulation, which consists of aligned acoustics and measured 3D articulatoryfeatures from speakers with either cerebral palsy or amyotrophic lateral sclerosis [59]. TheChild Pathological Speech Database (CPSD) [60] covers diseases from the autistic spectrum,specifically in children. More recently, the Coswara, is a corpus of respiratory sounds, suchas cough, breath, and voice, of COVID-19 patients [61].
We note that all the listed corpora contain CC recordings that impose the same limitationsas the DAIC and PC-GITA regarding real-life applications to diagnose, assess the severity,and monitor SA diseases. To different extents, each of this corpora verifies at least on of theconditions to be considered collected in CC: the content is determined by speaking exercisesor clinical interviews; the channel is known and/or controlled; the noise is controlled and/orminimized.
To the best of our knowledge, there exist no speech medical datasets that mimic real-lifescenarios. In fact, datasets in such conditions, also referred to as in-the-wild, are rare. One ofthe few examples of a task somewhat related to detection of SA diseases is the Acted FacialExpressions In The Wild (AFEW) Corpus [62], which claims to mimic real-life scenariosthrough close to real world environments extracted from movies.
17

18
Chapter 3
Automatic, speech-based detection ofDepression and Parkinson’s disease
Chapter 2 described the physiological mechanisms of depression and PD, as well as how theycan affect speech production from a perceptual point of view. Now we move on to look atSA diseases from an automation perspective. In this case it is necessary to translate thepreviously described perceptual characteristics of speech affected by depression or PD intoobjective measures that help differentiate it from healthy speech.
This Chapter, specifically Section 3.1, begins by reviewing the literature for the most relevantstudies performed towards improving the automatic, speech-based detection and severityassessment of depression and PD (in 3.1.1, and 3.1.2, respectively). In both cases, we adopta historical perspective and begin by summarizing the earliest relevant works in this topic,which tended to be heavily dependent on handcrafted features, and advance chronologicallyto more recent ones, which tend to be dominated by data driven approaches.
Finally, Section 3.2 reviews the state-of-the-art for the automatic annotation of corpora, notnecessarily in a speech or health care context. This review will provide context for the workdeveloped in this thesis regarding the automatic annotation of the WSM Corpus, which isdescribed in more detail in Chapter 5.
19
3.1 Automatic detection of SA diseases: Depression and
Parkinson’s disease
3.1.1 Depression
The early days:
Using speech to detect signs of depression in individuals dates back to as early as the 1930s,when the earliest paralinguistic investigations into depressed speech were carried out. Thefirst efforts to systematically use recordings as the patients read passages and answeredpsychiatrist’s questions, to allow the review and repetition of their speech samples wereperformed by [63]. They did not have the technology to apply acoustic methods and foundthat even a skilled speech pathologist required multiple repetitions of a speech sample todevelop reliable impressions. The measures used in this work included ratings of tempo, andpause frequencies, and rather than providing summary data, they described a few prototypiccases. These authors argued that the monotony of depressed voice, was a result of the reducedprosodic variability. The authors also identified rate differences between read and free speech,and rate differences between different topics of conversation. They called for the use ofobjective and reliable measures of voice, and in many ways, were ahead of their time.
Later on, works in the 1960s and 1970s showed that depressed speech was negatively correlatedto rate of productivity and filled pauses, and positively correlated to silent pauses [64].Depressed speech was typically characterized by decreased loudness and pitch variability[65][66].
In [67], the authors used measures of amplitude and frequency variability to reflect themonotone quality and the previously mentioned “flatness” of the speech of both depressedand schizophrenic patients. They seem to have been the first ones to have suggested thepossibility of developing voice profiles to assist diagnosis in psychiatry.
The Signal Processing and Machine Learning days:
Nowadays, there is a plethora of approaches using diverse machine learning based strategiesdo detect signs of depression from speech. However, the results presented in different worksare generally difficult to compare, given the lack of standard datasets of speech for depressiondetection, other than the DAIC, previously described in detail in Section 2.1. As such, thisdocument will focus on works that report their results on DAIC, and a few other notableworks that use other corpora.
Furthermore, this document will focus on reviewing the approaches that use speech alone to
20
determine the presence or severity of depression, and will disregard multimodal approachesthat include visual, natural language, or other types of cues. While there has been significantsuccess in using other modalities to detect depression, these exceed the scope of this work.
The baseline provided in the AVEC 2016 [68], for determining the severity of depression inthe DAIC-WOZ, based solely on speech, was obtained via Support Vector Machines (SVMs).The proposed baseline used prosodic, spectral and voice quality features, as well as the fourfirst formants at every 10ms. The acoustic features were extracted with the COVAREPtoolkit [69], and the resulting 79-dimensional feature set was used to fit a linear SVM trainedwith stochastic gradient descent (SGD). The model was validated on the development set,and the hyperparameters were optimized via grid search. Temporal fusion, to obtain a finalinterview level prediction, was achieved through simple majority voting of the predictions forall the frames within an entire screening interview. This baseline yielded an F1 score (definedas the harmonic mean of precision and recall) performance on the test set of 0.410 for thedepressed class and 0.582 for the not depressed class.
Later on, this baseline was beat in the 2016, 2017, and 2019 editions of the AVEC by severalresearch teams. Notably, there were several approaches that successfully predicted depressionor accessed its severity.
In [70], the authors proposed a gender specific decision tree, constructed according to thedistribution of the multimodal prediction of PHQ-8 scores (same as PHQ-9 without theitem for suicidal ideation) and participants’ characteristics (PTSD/Depression Diagnostic,sleep-status, feeling and personality) obtained via the analysis of the transcript files of theparticipants. At each node of the tree, there is a separate Support Vector Regression (SVR)model with Radial basis function (RBF) kernel to predict the PHQ-8 score. The single streamdecision tree for the speech modality proposed by the authors obtained a root mean squarederror (RMSE) in the development set of 6.224 and 6.910 for females and males, respectively,and a mean absolute error (MAE) of 4.842 and 5.750, for females and males, respectively.
Another work proposed a Gaussian staircase modeling approach, which generalizes the use ofGaussian distributions for binary classification into the domain of multivariate regression[71]. This is accomplished by partitioning the outcome variable into multiple nested rangeswith binary class labels for “lower” and “higher” being associated with complementary rangesat each nested partition. A multivariate normal distribution is used to model the class-conditioned features in each partition, and the class-conditioned likelihoods are computedby summing the likelihoods across all the partitions. The authors used correlation structure(CR) formant features, CR δ Mel-frequency cepstral coefficients (MFCC) features, spectral
21
energy, and peak-to-rms. The performance they obtained on the development set of theDAIC-WOZ was a RMSE of 6.38 and a MAE of 5.32. Furthermore, the authors report veryinteresting findings after performing a thorough analysis of the DAIC-WOZ. They reportfinding several limitations of the dataset: significant audio-transcript misalignments for somespeakers; change in the protocol of the virtual interviewer’s behavior after one third of theinterviews (in terms of turn duration, and questions asked to the patients); inconsistent signalto noise ratio (SNR) between interviews of different subjects.
In [72] the authors beat the challenge baseline using two approaches: training a linear SVMmodel with SGD where the input features were Teager energy cepstral coefficients (TECC);and performing a Gaussian Probabilistic Linear Discriminant Analysis (G-PLDA) with i-vector modelling based on MFCC features. The last approach was the most successful of thetwo. The authors reported an F1 score on the development set of the DAIC-WOZ of 0.43 and0.86 for the depressed and non-depressed classes, respectively, using the TECC features withthe linear SVM model; and an F1 score of 0.57 and 0.89 for the depressed and non-depressedclasses, respectively, using the i-vector features with the G-PLDA.
The authors of [73] proposed a deep learning based, DepAudioNet, to encode the depressionrelated characteristics in the vocal channel, combining Convolutional Neural Network (CNN)and Long Short Term Memory (LSTM) Recurrent Neural Networks (RNN). They introduceda random sampling strategy in the model training phase to balance the positive and negativesamples, which helped alleviates the bias caused by uneven sample distribution. The input tothe proposed network was raw spectrograms and Mel-scale filter bank features. The authorsreported an F1 score on the development set of the DAIC-WOZ of 0.52 and 0.70 for thedepressed and non-depressed classes, respectively.
Another solution is based on a gender dependent model to address the challenge [74]. Theytook advantage of the transcription and timestamps that were made available by the challengeorganizers to re-compute a number of low level descriptors according to a new protocol thatexcluded frames with laughter, sighs, unvoiced segments (V UV = 0), and voiced segmentslasting less than 5 ms. All of the frames that verified any of the above mentioned conditionswere considered to be non-informative for the task of detecting depression. The remainingframes were used to compute statistical descriptors from the low-level descriptors provided bythe challenge organizers, 10 Discrete Cosine Transform (DCT) coefficients, and 8 high levelfeatures computed at interview level (pause ratio, voiced segment ratio, speaking ratio, meanlaughter duration, mean delay in response, mean duration of pauses, maximum duration ofpauses, and fraction of pauses in overall time). The authors do not provide many details interms of the modeling strategies they chose, but reported an F1 score on the development set
22
of the DAIC-WOZ of 0.59 and 0.87 for the depressed and non-depressed classes, respectively.
Two works adopted a deep CNN (DCNN) based strategy [75] [76], using the Geneva minimal-istic acoustic parameters (GeMAPS) [77]. From those, the first and second order derivativeswere also computed, when relevant, which was used as the network input. The authorschose to train two separate models, one for each class, depressed and non-depressed. Theyreport the performance the development set of the DAIC-WOZ, and claim an RMSE of 4.516,2.767, 1.467, and 2.694 for depressed females, non-depressed females, depressed males andnon-depressed males, respectively; and a MAE of 3.633, 2.350,1.226 and 2.092, for the samegender and model combination.
Another work proposed a solution based on multi-scale temporal dilated CNNs (MS-TDCNN)[78]. These used a special case of dilated convolution, also called convolution with holes, wherethe multi-scale filters skip the input values with a certain step along the temporal dimension.Given the set of features of MFCCs, first and second derivatives, and extended Genevaminimalistic acoustic parameters (eGeMAPS) [77], for an interview, these were divided intoN spans of t frames. For each span, the authors computed maximum, minimum, average andstandard deviation of each feature, and they appended these to the existing set of features tothe span. The concatenation of the original set of features and the span-wise statistical audiofeatures were the input to the network. They reported an RMSE of 6.20 and an MAE of 4.88on the 2019 extended DAIC (e-DAIC), which is an extended version of the original DAICcorpus. The baseline reported for this dataset obtained an RMSE of 6.43 for the speechmodality only.
The authors of [79] proposed a multi-level attention network, which the authors claimedreinforced overall learning by selecting the most influential features within each modality. Forthe speech modality the authors trained four models, one for each type of features: MFCCs,eGeMAPS, Bag-of-AudioWords (BoAW) [80], and a high dimensional deep representationof the audio sample, extracted by passing the audio through a Deep Spectrum and a visualgeometry group (VGG) network. The authors only reported per network performances, anddid not report the results for the fusion of the four networks for the audio modality. Thebest performing model was the one based on the MFCCs, which yielded a RMSE of 5.11, onthe development set of e-DAIC.
In [81] the authors propose the use of deep convolutional generative adversarial networks(DCGANs) to overcome the limited amount of annotated on the DAIC, by developing a modelthat generates new examples of feature vectors, thus augmenting the available training data.The quality of the generated examples is measured in terms of characterizing the spatial,
23
frequency and representation learning of the augmented features. They were able to achievea RMSE of 5.520 and MAE of 4.634.
Finally, in [82], the authors propose a Hierarchical Attention Transfer Network, a novelcross task approach which transfers attention mechanisms from speech recognition to aiddepression severity measurement. The transfer is applied in a two-level hierarchical networkwhich mirrors the natural hierarchical structure of speech. Their experiments based on theDAIC, demonstrated the effectiveness of their model. On the development set, the approachachieved a RMSE of 3.85, and a MAE of 2.99.
3.1.2 Parkinson’s disease
As in the case of depression, PD can be diagnosed through multiple bio-signals, as well asthrough visual cues. The goal of this Section is to review the works that are dedicated todetection of PD from speech alone.
The earliest efforts to automate the detection of PD using speech were motivated by previousperceptual studies where differences in phonation, articulation and prosody between healthyindividuals and individuals with PD were clearly detected by trained medical specialists.
In contrast with depression, however, there is no standard dataset that is consistently usedto diagnose, or access the severity of PD. The most commonly adopted strategy is to havethe authors collect their own, typically very small dataset, with a handful of PD patientsand HCs, performing one or several short speech tasks, such as sustaining vowels, repeatingpredetermined sequences of syllables, reading sentences, or doing short monologues. Usuallythe data collected for each patient range from a few seconds up to a few minutes of speech.Therefore, the results of different works are not directly comparable, and it is not trivial todetermine which are the most promising strategies to diagnose or access the severity of PD.Furthermore, most works report results on datasets that are not balanced in terms of age, orgender, and do not address the biases that such imbalances may contribute to their findings.Nevertheless, the remainder of this Section will be dedicated to summarize some of the mostrelevant works and trends in this field.
As mentioned in Chapter 2.1, PD can cause speech impairments in patients in terms of threeprincipal dimensions: phonation, articulation, and prosody. Some works focus exclusively incapturing the differences in one of these dimensions, while others consider all three at thesame time.
The symptoms related to phonation impairments are related to the stability and periodicity
24
of the vocal fold vibration. They have been analyzed in terms of perturbation measures,and the most relevant features used in the literature are derived from jitter (absolute andaverage absolute difference between cycles), the amplitude perturbation quotient, shimmer(calculated as the average absolute difference between the amplitudes of consecutive periods),pitch perturbation quotient, harmonics to noise ratio (HNR), noise to harmonics ratio (NHR),MFCCs, and non-linear dynamics measures. Typically these features are computed overrecordings of sustained vowels. That was the case of [83], which performed an analysis ofsome of the above mentioned features using recurrence period density entropy, detrendedfluctuation analysis, correlation dimension, and the pitch period entropy. The authors reportedan accuracy of 91% in a test set of 23 PD patients and 8 HCs. In [84], the authors also used asimilar set of features computed over sustained vowels, but on a different speech dataset. Theauthors adopted random forests and support vector machines as their classification strategies,and reported, in the best case, a performance of 94.4% accuracy in detecting phonations byPD patients in a test set of 263 speech samples from 43 subjects (33 with PD and 10 HCs).Although the results seemed promising, the authors did not guarantee speaker independencebetween the train and test sets, and as such biased and optimistic conclusions may be drawn.
Articulation symptoms in patients with PD are related to the modification of position, stress,and shape of several limbs and muscles to produce speech. These symptoms have beenmodeled mostly by spectral features, including vowel space area, vowel articulation index,formant centralization ratio, diadochokinetic analysis (DDK), onset energy, and MFCCs andits derivatives. These features tend to be computed over a monologue, reading text, sentencerepetition, or some other form of running speech [85][86]. In [85], the authors were able tofind a strong correlation between features derived from different formant quotients and thepresence of dysarthric speech in patients with PD. In [86], the authors studied a group of35 Czech native speakers (20 early PD patients and 15 HCs), and were able to show thateven at early stages of PD, it is possible to use features that capture the characteristics ofarticulation, to discriminate between PD patients and HCs with an accuracy of about 80%.
Prosodic differences between the speech of PD patients and HCs are manifested as monotonoc-ity, monoloudness, and changes in speech rate and pauses. These changes need to be capturedover time, using features derived from pitch energy contours, and duration. Some of thesefeatures include the F0, its mean and standard deviation, intensity, and its standard deviation,all of these computed over a recording of running speech. Additionally, other useful featuresto measure changes in prosody are the speech rate, which can be measured using the lengthof each syllable and each pause, the net speech rate (NSR), which is measured in syllablesper second related to the net speech time in milliseconds, percent pause time, articulation
25
rate, number of pauses, etc.. In [87], the authors studied prosodic differences, and observedthat there is a correlation between several PD symptoms and prosodic variables, such asthe number of pauses in speech. They also showed that the variation of F0 is lower in PDpatients than in HCs.
More recent works tend to consider the differences over the three dimensions of speech,between PD patients and HCs. These works combine the features and approaches usedby the above mentioned works. In [88], the authors considered a total of 46 participants(23 with PD and 23 HCs), and performed an analysis of their phonation, articulation, andprosody. The authors concluded that 78% of the patients evidenced speech problems: prosodywas the most affected dimension of speech, even in the initial stage of the disease, andarticulation was the second most affected dimension. They also found that the variation ofthe fundamental frequency measured on the monologues and emotional sentences containedvery useful information for separating HCs from PD speakers. In [89] and [90], the authorsused the publicly available OpenSMILE [91] toolkit to extract a set of 1582 acoustic featuresper utterance that describe the phonation, articulatory and prosodic characteristics of aspeech signal. The former trained separate models for phonation, articulation, and prosodyusing appropriate subsets of the OpenSMILE feature set, and after combining the three taskswere able to obtain an unweighted average recall (UAR) of 81.9% on a dataset of 176 Germannative speakers (88 with PD and 88 HCs). The latter attempted to model all of the featuresin the OpenSMILE feature set as a single task, using several regression techniques, includingridge, lasso and support vector regression, to access the neurological state and the severity ofpatients with PD. According to their reports, features extracted from the reading texts arethe most effective and robust to quantify the severity of the disease.
Besides the classic features extraction methods that use with hand crafted features, there hasbeen some interest in exploring deep learning approaches to detect and monitor PD usingspeech. An example of such efforts was the “2015 Computational Paralinguistics challengE(ComParE)” [92], which had a sub-challenge dedicated to the automatic estimation of theneurological state of PD patients according to the MDS-UPDRS-III score. The corpus usedin this challenge was the subset of the PC-GITA, previously described in Section 2.2.2,corresponding to the speakers affected by PD.
The winners of this challenge [93] adopted Gaussian processes and deep neural networks(DNN) to predict the clinical scores and reported a correlation of 0.65. In [94], the authorsproposed a deep learning model to assess dysarthric speech. The model aimed to predict theseverity of dysarthria and proposed introducing an intermediate interpretable hidden layerin a DNN that contained four perceptual dimensions: nasality, vocal quality, articulatory
26
precision, and prosody. The authors presented an interpretable output that was highlycorrelated (Spearman’s correlation of up to 0.82) with subjective evaluations performed byspeech and language pathologists. In [95], the authors modeled the composition of non-modalphonations in PD. The authors computed phonological posteriors using DNNs to predictthe dysarthria levels. In [96], the authors modeled articulation impairments of PD patientswith time-frequency representations (TFR) and CNNs. The authors classified PD and HCspeakers considering speech recordings in three languages: Spanish, German, and Czech. Theyreported accuracies from 70% to 89%, depending on the language. In [97] the authors usedarticulation features extracted from continuous speech signals to create i-vectors, used train amodel to predicted the dysarthria level according to the FDA score. In [98] the authors takeadvantage of X-vectors [99], to generate DNN based speaker embeddings that are then usedto train a probabilistic linear discriminant analysis (PLDA) model that distinguishes healthyfrom non-healthy speech. X-vectors are known to be able to capture meta-information besidesthe speaker identity, such as gender or speech rate [100], and now also, some articulatory,prosodic or phonatory information characteristics that characterize PD affected speech.
In [101] the authors propose not only detecting PD, and distinguishing it from healthy speech,but also distinguishing PD from Amyotrophic Lateral Sclerosis (ALS), which is anotherprevalent neuro-degenerative movement disorder. Speech related complications that ALSpatients typically experience include dysphagia, dyspnoea, orthopnea and dysarthria, whichhave some overlap with the symptoms experienced by PD patients. This makes the task ofdistinguishing these two diseases more difficult than either of them from healthy speech. Theauthors opted to use a modeling strategy based on CNN-LSTMs and transfer learning, wherethey leveraged from the information from the ALS corpus to detect PD, and vice-versa.
3.2 Related work: automatic corpora labeling
The task of automatically annotating corpora is typically associated with scenarios wheremanual annotation is not a feasible approach. This tends to be the case in one of the followingsituations: when the number of examples that need to be annotated is larger than what canbe processed by the available human annotators; when the examples need to be annotatedfaster that human annotators can achieve; when the cost of manually annotating the examplesis prohibitively high; or simply, when there are no human annotators available for a givenannotation task.
In any of these cases, there is a compromise between the performance that would be achievedby the human annotators, and overcoming whatever limitation exists in the annotation
27
process.
Most automatic corpora annotation strategies are based on using a small “gold dataset”of manually annotated examples as a starting point for the automatic annotation process,and/or exploit the specific characteristics of the data that are being annotated, by imposingrestrictions based on their knowledge of the data on the automatic annotation model, thusmaking the overall task less ambiguous.
In this Section we will summarize some of the most popular works on automatic corporaannotation, particularly those that propose solutions that do not heavily rely on prior domainknowledge. Since automatic corpora annotation is a transversal task, popular in severaldifferent domains where annotated data are scarce, we will provide a review of the techniquesused to solve this problem, regardless of the applications (this means that we cover worksoutside the speech or medical domains).
In [102], the authors introduce a method for the automatic annotation of images withkeywords from a generic vocabulary of concepts or objects for the purpose of content-basedimage retrieval. Each image is represented as sequence of feature-vectors characterizinglow-level visual features such as color, texture or oriented-edges, and is modeled as havingbeen stochastically generated by a hidden Markov model (HMM), whose states representconcepts. The parameters of the model are estimated from a set of manually annotated(training) images. Each image in a large test collection is then automatically annotated withthe a posteriori probability of concepts present in it.
In [103] the authors revisit a well-known active learning algorithm: uncertainty sampling. Theypropose an adaptation of this technique with lower computational complexity: approximateuncertainty sampling, which is applied in the context of finding spam e-mails in large e-mailcorpora. The onus of active learning strategies is optimizing the strategies of iterativelyfinding the few examples in the dataset that should be sent for human annotation. In thiscase, at each iteration, approximate uncertainty sampling selects only a subset of examples tore-evaluate and then chooses the best m examples amongst this limited subset. The key to theeffectiveness of this technique is that, at each iteration, the model, rather than reevaluatingthe uncertainty of each message, performs the sampling using the uncertainties calculated inprevious iterations.
In [104], the authors propose a graph-based semi-supervised learning approach that incorpo-rates embedding techniques. In their work, they propose that the embedding of an instanceis jointly trained to predict the class label of the instance and the context in the graph. Thenthey concatenate the embeddings and the hidden layers of the original classifier and feed them
28
to a softmax layer when making the prediction. They formulate a transductive solution wherethe embeddings are learned based on the graph structure, as well as an inductive solutionwhere they define the embeddings as a parameterized function of input feature vectors, i.e.,the embeddings can be viewed as hidden layers of a neural network. This work was appliedin the context of annotating new examples for text classification, entity extraction and entityclassification.
In [105], the authors present an approach capable of training deep neural networks onlarge-scale weakly-supervised web images, which are crawled from the Internet, using textqueries, without any human annotation. Their learning strategy leverages from curriculumlearning, with the goal of handling a massive amount of noisy labels and data imbalanceeffectively. They design the learning curriculum by measuring the complexity of data using itsdistribution density in a feature space, and rank the complexity in an unsupervised manner.This allows for an efficient implementation of curriculum learning on large-scale web images,resulting in a high-performance CNN model, where the negative impact of noisy labels isreduced substantially.
Overall we have reviewed some works that use generative models, active learning strategies,weakly supervised learning strategies, and semi-supervised learning strategies for automaticcorpora annotation in very different domains. There are a number of variants for each of theseapproaches. The choice for each approach and variant should be based on the constraints ofthe specific problem being solved, and there is not a single approach that is necessarily thebest for every case.
29

30

Part II
Towards automating the collection andannotation of speech medical corpora
31

Chapter 4
The In-the-wild Speech Medical Corpus
In Chapter 2 we have identified that there is a lack of resources, specifically speech corpora,that faithfully represent SA diseases in in-the-wild contexts. The existing ones are small insize, and collected in CC. In an attempt to overcome this, we have collected the WSM Corpus.This is an audiovisual corpus of videos collected from the online multimedia repositoryYouTube, mostly featuring recordings in the vlog format, of subjects potentially affected bySA diseases.
Vlogs, short for both video blog and video log, are a popular video format where subjectsrecord themselves talking about one or several topics of their choosing, ranging from productsor media reviews, to video diary entries, among many others. These videos are typicallyrecorded in very informal settings, such as at home, in a car, etc.. Furthermore, the recordingsare usually made with a smartphone, laptop computer, or other non professional camera andmicrophone equipment.
This category of videos, vlogs, and more generally, informal videos, are a valuable resourcethat portrait human behaviour and speech in real life conditions, which provides a window tostudy SA diseases specifically in an in-the-wild context. Figure 4.1 shows some examples ofscreenshots of vlogs included in the WSM Corpus, to provide a sense of the nature of thiscorpus.
It is important to clarify the meaning of our prior claim that the WSM is a corpus of peoplepotentially affected by SA diseases. In the context of this corpus, the videos are categorizedinto two classes: videos containing a subject making an explicit claim that they are currentlyaffected by the target SA disease, to which we refer to as self-reported health status, andvideos that do not contain such claims. We emphasise that self-reported health status does
33

Figure 4.1: Frames from six videos of the WSM Corpus, showing what the setting of thetypical video is. Usually in a vlog, or other informal video, the subject is addressing thecamera, and records him/herself in a familiar environment, such as the house, car, or a nearbypark.
not depend on the presence of any symptom related to the target SA disease, nor it is thesame thing as the true health status of the subject. The latter would have to be determinedby an appropriate healthcare specialist. However, for both practical and ethical reasons, thatdetermination is not made for the videos of the WSM Corpus, therefore its videos are onlyclassified in terms of the self-reported health status.
We acknowledge that the self-reported health status is not the same as the true health status,but, at the same time, it is our claim that the subject’s self-reported health status in vlogstends to be accurate and truthful, as there is no incentive for the subjects to be deceitfulabout their health status. We will show later, in Chapter 6, several experimental results thatsupport this claim, that in the context of the WSM Corpus, self-reported health status is, infact, a good proxy for the true health status, and therefore, they can be used interchangeably.
In Section 4.1 we begin by describing the collection methodology of the videos pre-selectedto be part of the WSM Corpus, from our multimedia platform of choice, YouTube. We alsosummarize what metadata we extracted, along with the videos.
Then, in Sections 4.2, 4.3, and 4.4 we describe each of the three versions of the WSM corpus,where each one was created with a specific purpose in mind. Specifically, in Section 4.2 wewill describe the earliest version of the WSM Corpus, which was our first effort of collectingin-the-wild speech medical data. The goal of this version of the corpus was to create a small
34
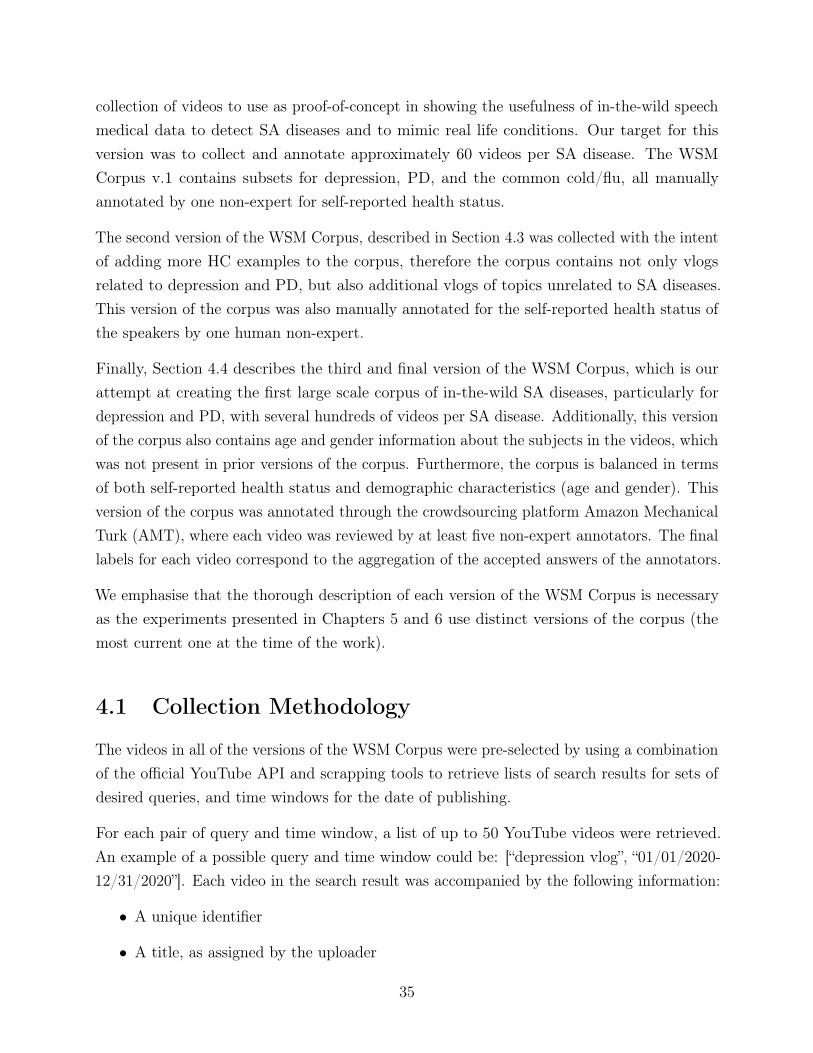
collection of videos to use as proof-of-concept in showing the usefulness of in-the-wild speechmedical data to detect SA diseases and to mimic real life conditions. Our target for thisversion was to collect and annotate approximately 60 videos per SA disease. The WSMCorpus v.1 contains subsets for depression, PD, and the common cold/flu, all manuallyannotated by one non-expert for self-reported health status.
The second version of the WSM Corpus, described in Section 4.3 was collected with the intentof adding more HC examples to the corpus, therefore the corpus contains not only vlogsrelated to depression and PD, but also additional vlogs of topics unrelated to SA diseases.This version of the corpus was also manually annotated for the self-reported health status ofthe speakers by one human non-expert.
Finally, Section 4.4 describes the third and final version of the WSM Corpus, which is ourattempt at creating the first large scale corpus of in-the-wild SA diseases, particularly fordepression and PD, with several hundreds of videos per SA disease. Additionally, this versionof the corpus also contains age and gender information about the subjects in the videos, whichwas not present in prior versions of the corpus. Furthermore, the corpus is balanced in termsof both self-reported health status and demographic characteristics (age and gender). Thisversion of the corpus was annotated through the crowdsourcing platform Amazon MechanicalTurk (AMT), where each video was reviewed by at least five non-expert annotators. The finallabels for each video correspond to the aggregation of the accepted answers of the annotators.
We emphasise that the thorough description of each version of the WSM Corpus is necessaryas the experiments presented in Chapters 5 and 6 use distinct versions of the corpus (themost current one at the time of the work).
4.1 Collection Methodology
The videos in all of the versions of the WSM Corpus were pre-selected by using a combinationof the official YouTube API and scrapping tools to retrieve lists of search results for sets ofdesired queries, and time windows for the date of publishing.
For each pair of query and time window, a list of up to 50 YouTube videos were retrieved.An example of a possible query and time window could be: [“depression vlog”, “01/01/2020-12/31/2020”]. Each video in the search result was accompanied by the following information:
• A unique identifier
• A title, as assigned by the uploader
35
• A description, as assigned by the uploader (optional, can be left blank)
• The transcription (when available. This transcription is automatically generated forvideos in English, unless provided by a user)
• The uploader channel’s unique identifier
• The playlist’s unique identifier, if the video is part of a playlist
• The timestamp of the time of publishing
• The video category, as assigned by the uploader (one out of a closed set of 14 categories,including “News”, “Music”, “Entertainment”, etc.)
• The total number of of times the video was viewed
• The total number of “thumbs up” given to the video by the viewers
• The total number of “thumbs down” given to the video by the viewers
• The comments to the video, including the unique identifier of the user that made thecomment, and the timestamp of when it was posted
We note that the video’s transcription was automatically generated by YouTube, using alarge scale, semi-supervised deep neural network for acoustic modeling [106], unless a humantranscription was provided by a user.
The set of pre-selected videos was further narrowed down to be part of each version of theWSM Corpus according to different criteria, which is described in the corresponding Sections.
The choice to collect a dataset specifically of vlogs originated from empirical experienceswhen manually searching for videos of people affected by SA diseases. We were able to verifythat searching simple for a “[target disease]” would yield vastly different results compared to“[target disease] vlog”, in terms of finding content that included people currently affected bythe “target disease”. As an example, Figure 4.2 shows the differences in the search resultsfor the queries “depression”, on the left side, and “depression vlog”, on the right side. Eachsearch result in this Figure marked in red corresponds to a video that is somehow related todepression, but does not necessarily contain a subject currently affected by it. This includeslectures about depression, motivational videos, videos of therapists, medical doctors or otherhealthcare specialists sharing knowledge about depression, videos of caretakers or partnersof people suffering from depression, and even videos of people who are describing their pastexperiences with depression, who are currently not affected by it. We observed the samephenomena for PD, cold/flu, Alzheimer’s disease, bipolar disorder, and obstructive sleep
36
apnea (OSA). Marked in green are the videos of the people who verbally confirm to becurrently affected by depression. As it can be seen, the target videos are found much morecommonly when the search query includes the term “vlog”.
4.2 WSM Corpus, v.1
The first version of the WSM Corpus contains a total of 182 videos, published betweenJanuary 2017 and January 2018. The videos in the WSM Corpus v.1 were pre-selected usingthe queries “Depression vlog”, “Parkinson’s disease vlog”, and “Flu vlog”.
The videos retrieved with the query “depression vlog” tend to display subjects that arecurrently suffering from depression, or have suffered in the past (and are recalling theirpast experiences), or videos from therapists and other healthcare specialists, among others.In the case of PD, the videos retrieved with the query “Parkinson’s disease vlog” tend toshow either PD patients relaying their current experience with the disease (e.g. discussingsymptoms, treatments, lifestyle changes, the progression of the disease, etc.), or videos ofinformal caregivers, healthcare professionals, and others. Finally, the videos retrieved withthe query “Flu vlog” tend to include videos where the speaker is affected with a cold or aflu and is describing how they are feeling, or experiences from parents and other guardiansdescribing the experiences of their children going through a cold or flu.
A total of 177, 164, and 174 videos were pre-selected for depression, PD, and flu, respectively,and approximately 60 randomly chosen videos for each SA disease were manually annotated.All the annotated videos of the corpus are in English, but not restricted to native speakers.These videos have an average duration of approximately 10 minutes, totaling approximately30 hours of raw recordings.
Each annotated video in this version of the corpus was manually annotated by one non-expertannotator, with five binary labels, corresponding to a yes or no answer to each question ofthe following questionnaire:
Q1: Is the video in a vlog format?
Q2: Regardless of the topic, is the main speaker of the video talking mostly aboutthemself?
Q3: Regardless of the topic, is the main subject of the video talking mostly about presentevents/opinions/situations/etc. or from a recent past (over the last few hours/days)?
Q4: Is the main topic of the video related to [target disease]?
37
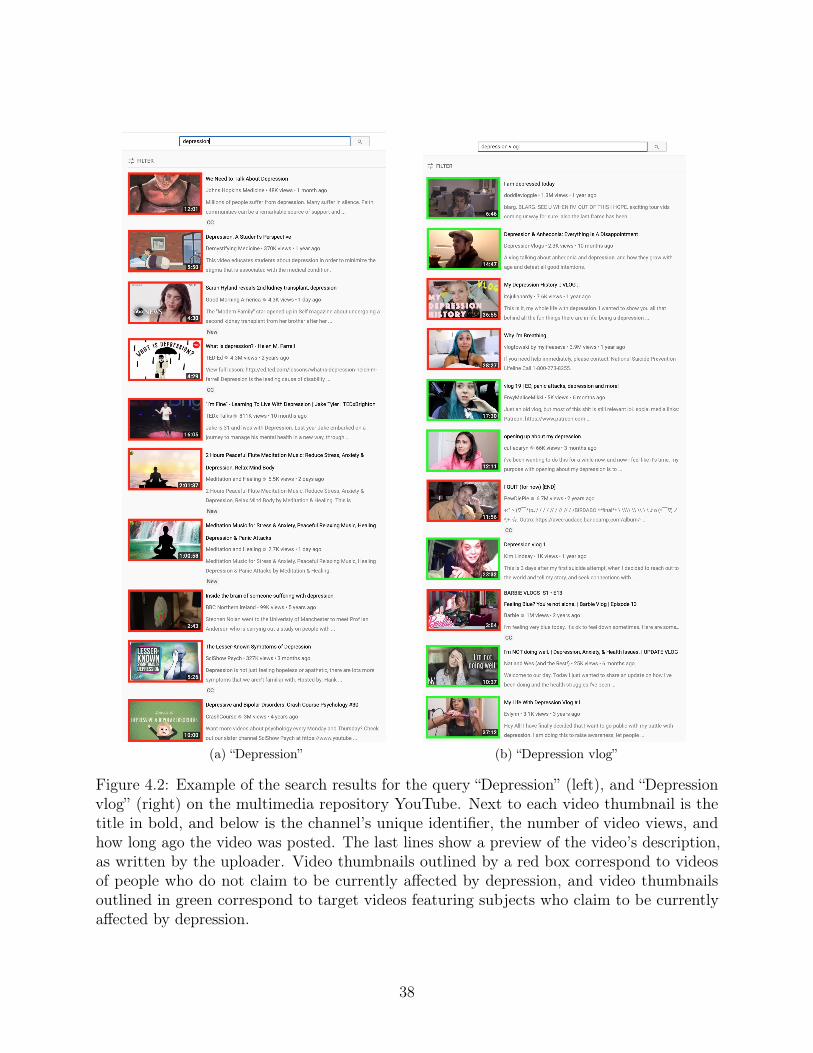
(a) “Depression” (b) “Depression vlog”
Figure 4.2: Example of the search results for the query “Depression” (left), and “Depressionvlog” (right) on the multimedia repository YouTube. Next to each video thumbnail is thetitle in bold, and below is the channel’s unique identifier, the number of video views, andhow long ago the video was posted. The last lines show a preview of the video’s description,as written by the uploader. Video thumbnails outlined by a red box correspond to videosof people who do not claim to be currently affected by depression, and video thumbnailsoutlined in green correspond to target videos featuring subjects who claim to be currentlyaffected by depression.
38
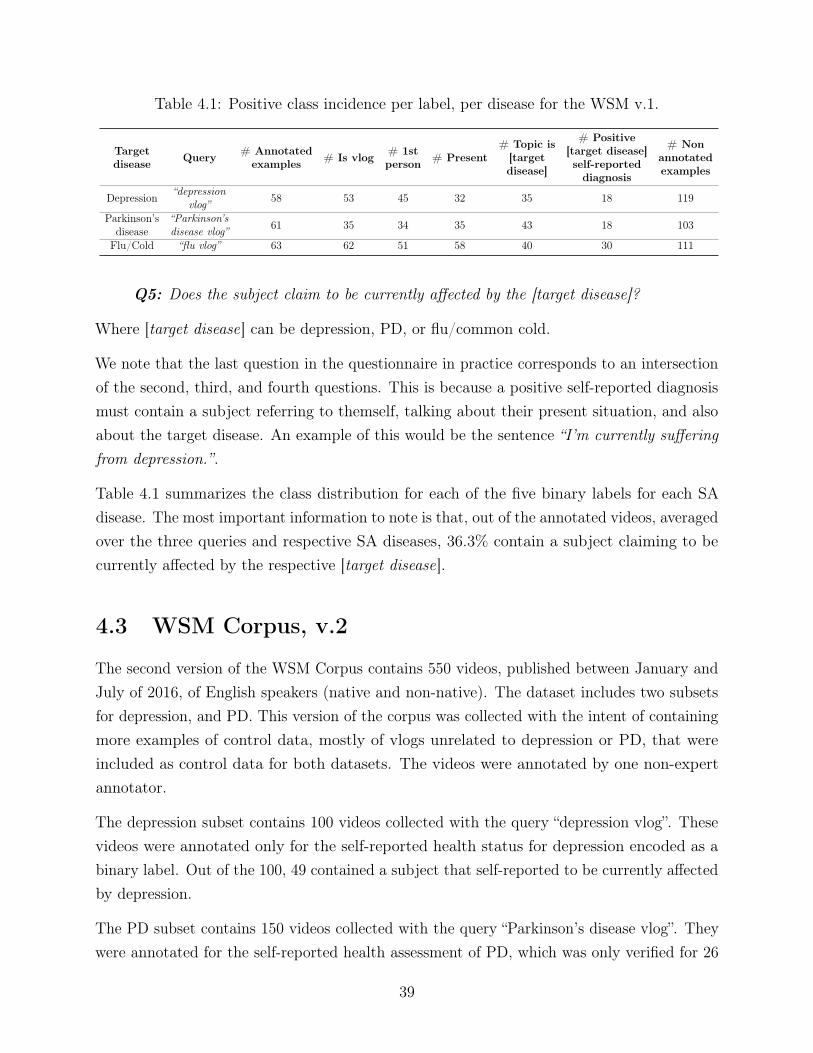
Table 4.1: Positive class incidence per label, per disease for the WSM v.1.
Targetdisease Query # Annotated
examples # Is vlog # 1stperson # Present
# Topic is[targetdisease]
# Positive[target disease]self-reporteddiagnosis
# Nonannotatedexamples
Depression “depressionvlog” 58 53 45 32 35 18 119
Parkinson’sdisease
“Parkinson’sdisease vlog” 61 35 34 35 43 18 103
Flu/Cold “flu vlog” 63 62 51 58 40 30 111
Q5: Does the subject claim to be currently affected by the [target disease]?
Where [target disease] can be depression, PD, or flu/common cold.
We note that the last question in the questionnaire in practice corresponds to an intersectionof the second, third, and fourth questions. This is because a positive self-reported diagnosismust contain a subject referring to themself, talking about their present situation, and alsoabout the target disease. An example of this would be the sentence “I’m currently sufferingfrom depression.”.
Table 4.1 summarizes the class distribution for each of the five binary labels for each SAdisease. The most important information to note is that, out of the annotated videos, averagedover the three queries and respective SA diseases, 36.3% contain a subject claiming to becurrently affected by the respective [target disease].
4.3 WSM Corpus, v.2
The second version of the WSM Corpus contains 550 videos, published between January andJuly of 2016, of English speakers (native and non-native). The dataset includes two subsetsfor depression, and PD. This version of the corpus was collected with the intent of containingmore examples of control data, mostly of vlogs unrelated to depression or PD, that wereincluded as control data for both datasets. The videos were annotated by one non-expertannotator.
The depression subset contains 100 videos collected with the query “depression vlog”. Thesevideos were annotated only for the self-reported health status for depression encoded as abinary label. Out of the 100, 49 contained a subject that self-reported to be currently affectedby depression.
The PD subset contains 150 videos collected with the query “Parkinson’s disease vlog”. Theywere annotated for the self-reported health assessment of PD, which was only verified for 26
39
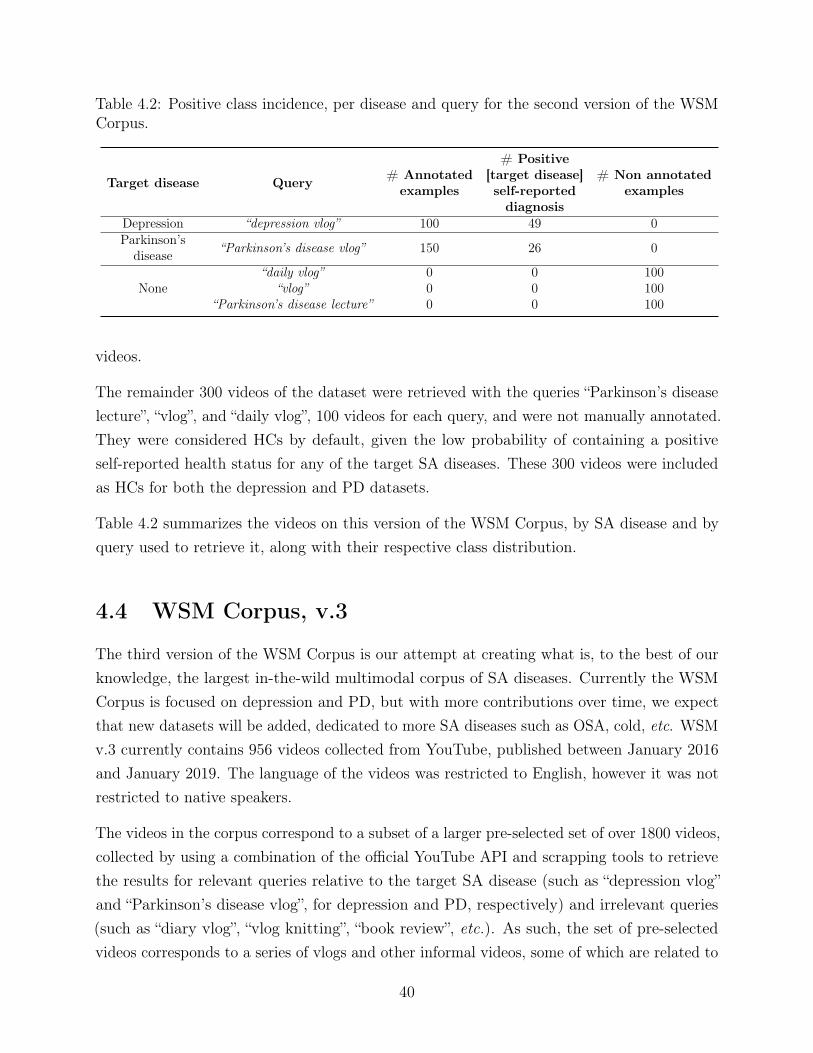
Table 4.2: Positive class incidence, per disease and query for the second version of the WSMCorpus.
Target disease Query # Annotatedexamples
# Positive[target disease]self-reporteddiagnosis
# Non annotatedexamples
Depression “depression vlog” 100 49 0Parkinson’s
disease “Parkinson’s disease vlog” 150 26 0
None“daily vlog” 0 0 100
“vlog” 0 0 100“Parkinson’s disease lecture” 0 0 100
videos.
The remainder 300 videos of the dataset were retrieved with the queries “Parkinson’s diseaselecture”, “vlog”, and “daily vlog”, 100 videos for each query, and were not manually annotated.They were considered HCs by default, given the low probability of containing a positiveself-reported health status for any of the target SA diseases. These 300 videos were includedas HCs for both the depression and PD datasets.
Table 4.2 summarizes the videos on this version of the WSM Corpus, by SA disease and byquery used to retrieve it, along with their respective class distribution.
4.4 WSM Corpus, v.3
The third version of the WSM Corpus is our attempt at creating what is, to the best of ourknowledge, the largest in-the-wild multimodal corpus of SA diseases. Currently the WSMCorpus is focused on depression and PD, but with more contributions over time, we expectthat new datasets will be added, dedicated to more SA diseases such as OSA, cold, etc. WSMv.3 currently contains 956 videos collected from YouTube, published between January 2016and January 2019. The language of the videos was restricted to English, however it was notrestricted to native speakers.
The videos in the corpus correspond to a subset of a larger pre-selected set of over 1800 videos,collected by using a combination of the official YouTube API and scrapping tools to retrievethe results for relevant queries relative to the target SA disease (such as “depression vlog”and “Parkinson’s disease vlog”, for depression and PD, respectively) and irrelevant queries(such as “diary vlog”, “vlog knitting”, “book review”, etc.). As such, the set of pre-selectedvideos corresponds to a series of vlogs and other informal videos, some of which are related to
40
the target SA disease and others are not. From the irrelevant queries we obtain generic vlogswith a single speaker, not related to depression or PD, discussing a broad category of topics,from video diary entries, to daily routines, errand running, media reviews, short tutorials,among many others.
We will proceed to summarize the protocol that was used to annotate the pre-selected videosretrieved with both relevant and irrelevant queries, and the criteria that was used to selectwhich ones to include in the final version of the corpus.
4.4.1 Annotation protocol via crowdsourcing
The protocol for the annotation follows below. The videos were annotated in batches, via thecrowdsourcing platform AMT by at least five distinct human non-expert annotators. Theannotators were given a short questionnaire where they were asked to watch the video andestimate the age and gender of the speaker in the video. The age was estimated via thefollowing question:
Q: What is the apparent age group of the subject in the video?
A: [0-18, 18-30, 30-40, 40-50, 50-60, 60-70, 70-80, 80+, Ambiguous/difficult/notpossible to answer]
The gender was estimated with the following question:
Q: What is the apparent gender of the subject in the video?
A: [Male, Female, Ambiguous/difficult/not possible to answer]
For both questions the annotator was able to select a single answer. This allowed us toobtain a simple demographic characterization of the subjects in the pre-selected videos. Wenote that the option “Ambiguous/difficult/not possible to answer” was made available to theannotators in case there were no speakers or more than one speaker in the video, or in caseof a single speaker, if it was difficult to determine their age or gender, e.g. in videos wherethe speaker is talking from behind the camera, or the sound is muffled.
Additionally, for the videos pre-selected via relevant queries only, i.e. “depression vlog” and“Parkinsons’s disease vlog”, for depression and PD, respectively, the questionnaire includedan additional question where they were asked to retrieve the self-reported health status ofthe speaker.
We chose to get this annotation only for the videos pre-selected via relevant queries becausewe assume that, in videos of topics unrelated to the target SA diseases there will not exist
41
speakers that claim to be discussing, and more importantly, claim to be currently affected bythe target SA disease. This design decision is similar to the ones taken in the scope of theWSM Corpus v.2 describes in Section 4.3.
The self-reported health status was obtained by having the annotators chose one of theanswers to the following question:
Q: Does the subject in the video claim to be currently suffering from [target disease]?
A: [Yes, currently; No, but claimed they suffered in the past and got cured; No, butclaims to suffer from another disease; No, the speaker makes no claims about their healthstatus]
The options provided to the annotators were more specific than a simple yes or no answerregarding the subject’s self-reported health status. This was a design choice to incentivizethem to pay closer attention to the content of the video, rather than simply providing asimple binary answer. Naturally, these labels can be merged into broader categories (a binaryyes or no answer) to reflect if the subject is currently suffering from the target SA disease ornot.
To illustrate why more granular answers are useful in the context of retrieving self-reportedhealth status, we can use PD as an example. We recall that PD is an incurable, degenerativedisease, and that its progress cannot be reversed. As such, in the best case scenario, itssymptoms can be managed through appropriate medication, and, in some cases, treatmentsthat include deep brain stimulation. Therefore, if a subject claims to have had PD in thepast but to have subsequently gotten cured, we know that this statement does not accuratelyreflect their experience with PD. However, to non-expert annotators, this scenario could leadto missannotations if presented simply with yes or no annotation options. Although thevideos that contain such scenarios are rare, it is important to find them and avoid mistakenlyflagging them as target videos. Having more granular options than a simple yes or no answeris helpful for annotators to correctly describe what is happening in the video, as well as tomaintain their engagement.
In summary, the questionnaires associated to videos pre-selected with irrelevant queriescontained two questions, to estimate age and gender of the subject in the video. Thequestionnaire associated to videos pre-selected with relevant queries contained three questions,to estimate age, gender, and assess the subject’s self-reported health status.
The annotations obtained via AMT questionnaires were subject to approval. We note thatthe approval or rejection of the annotations is provided at questionnaire level. We established
42
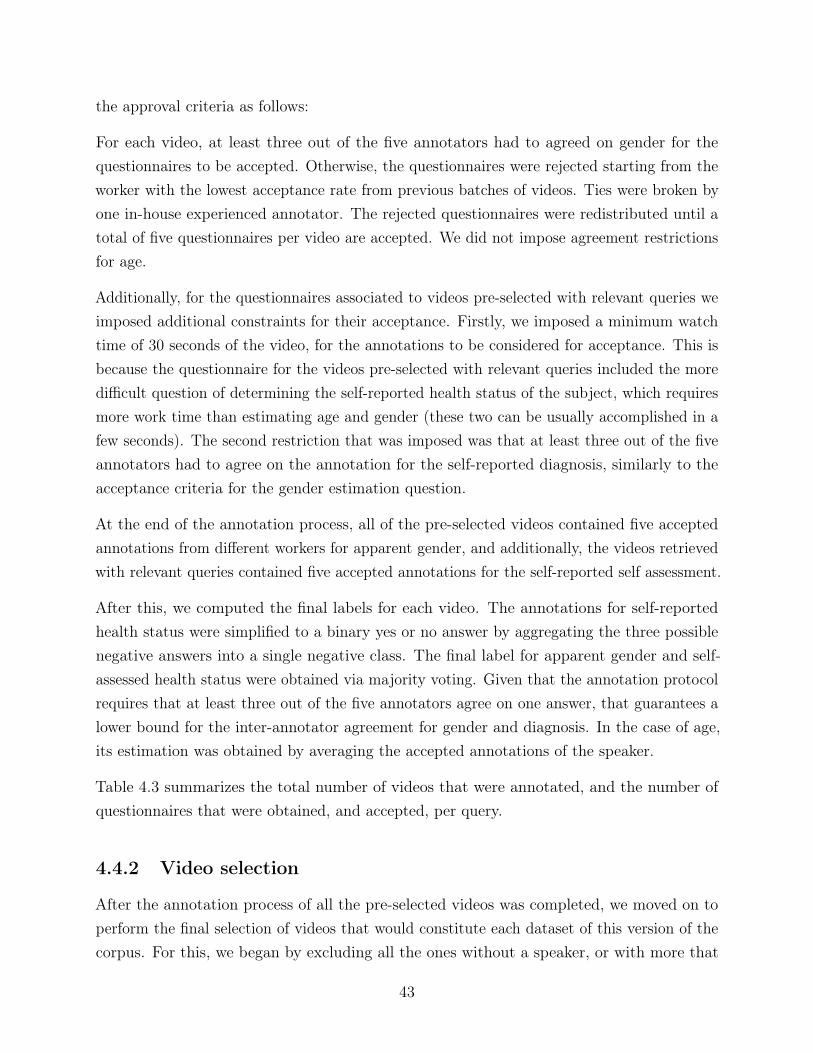
the approval criteria as follows:
For each video, at least three out of the five annotators had to agreed on gender for thequestionnaires to be accepted. Otherwise, the questionnaires were rejected starting from theworker with the lowest acceptance rate from previous batches of videos. Ties were broken byone in-house experienced annotator. The rejected questionnaires were redistributed until atotal of five questionnaires per video are accepted. We did not impose agreement restrictionsfor age.
Additionally, for the questionnaires associated to videos pre-selected with relevant queries weimposed additional constraints for their acceptance. Firstly, we imposed a minimum watchtime of 30 seconds of the video, for the annotations to be considered for acceptance. This isbecause the questionnaire for the videos pre-selected with relevant queries included the moredifficult question of determining the self-reported health status of the subject, which requiresmore work time than estimating age and gender (these two can be usually accomplished in afew seconds). The second restriction that was imposed was that at least three out of the fiveannotators had to agree on the annotation for the self-reported diagnosis, similarly to theacceptance criteria for the gender estimation question.
At the end of the annotation process, all of the pre-selected videos contained five acceptedannotations from different workers for apparent gender, and additionally, the videos retrievedwith relevant queries contained five accepted annotations for the self-reported self assessment.
After this, we computed the final labels for each video. The annotations for self-reportedhealth status were simplified to a binary yes or no answer by aggregating the three possiblenegative answers into a single negative class. The final label for apparent gender and self-assessed health status were obtained via majority voting. Given that the annotation protocolrequires that at least three out of the five annotators agree on one answer, that guarantees alower bound for the inter-annotator agreement for gender and diagnosis. In the case of age,its estimation was obtained by averaging the accepted annotations of the speaker.
Table 4.3 summarizes the total number of videos that were annotated, and the number ofquestionnaires that were obtained, and accepted, per query.
4.4.2 Video selection
After the annotation process of all the pre-selected videos was completed, we moved on toperform the final selection of videos that would constitute each dataset of this version of thecorpus. For this, we began by excluding all the ones without a speaker, or with more that
43
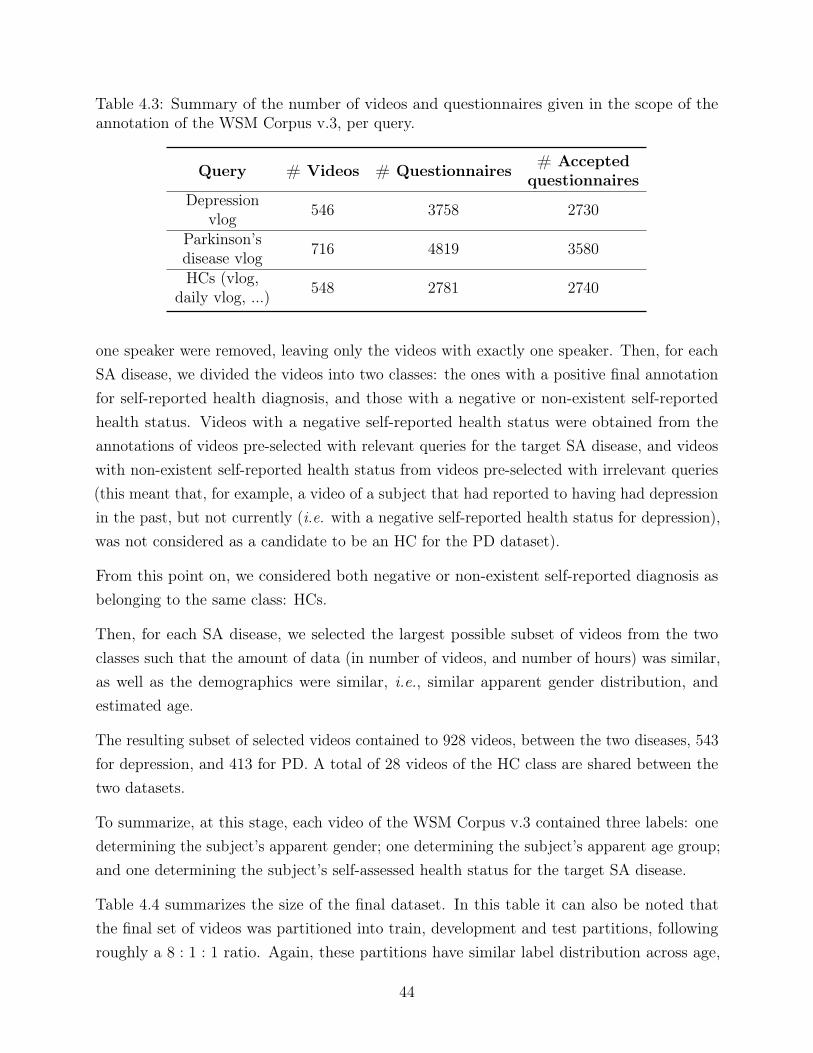
Table 4.3: Summary of the number of videos and questionnaires given in the scope of theannotation of the WSM Corpus v.3, per query.
Query # Videos # Questionnaires # Acceptedquestionnaires
Depressionvlog 546 3758 2730
Parkinson’sdisease vlog 716 4819 3580
HCs (vlog,daily vlog, ...) 548 2781 2740
one speaker were removed, leaving only the videos with exactly one speaker. Then, for eachSA disease, we divided the videos into two classes: the ones with a positive final annotationfor self-reported health diagnosis, and those with a negative or non-existent self-reportedhealth status. Videos with a negative self-reported health status were obtained from theannotations of videos pre-selected with relevant queries for the target SA disease, and videoswith non-existent self-reported health status from videos pre-selected with irrelevant queries(this meant that, for example, a video of a subject that had reported to having had depressionin the past, but not currently (i.e. with a negative self-reported health status for depression),was not considered as a candidate to be an HC for the PD dataset).
From this point on, we considered both negative or non-existent self-reported diagnosis asbelonging to the same class: HCs.
Then, for each SA disease, we selected the largest possible subset of videos from the twoclasses such that the amount of data (in number of videos, and number of hours) was similar,as well as the demographics were similar, i.e., similar apparent gender distribution, andestimated age.
The resulting subset of selected videos contained to 928 videos, between the two diseases, 543for depression, and 413 for PD. A total of 28 videos of the HC class are shared between thetwo datasets.
To summarize, at this stage, each video of the WSM Corpus v.3 contained three labels: onedetermining the subject’s apparent gender; one determining the subject’s apparent age group;and one determining the subject’s self-assessed health status for the target SA disease.
Table 4.4 summarizes the size of the final dataset. In this table it can also be noted thatthe final set of videos was partitioned into train, development and test partitions, followingroughly a 8 : 1 : 1 ratio. Again, these partitions have similar label distribution across age,
44
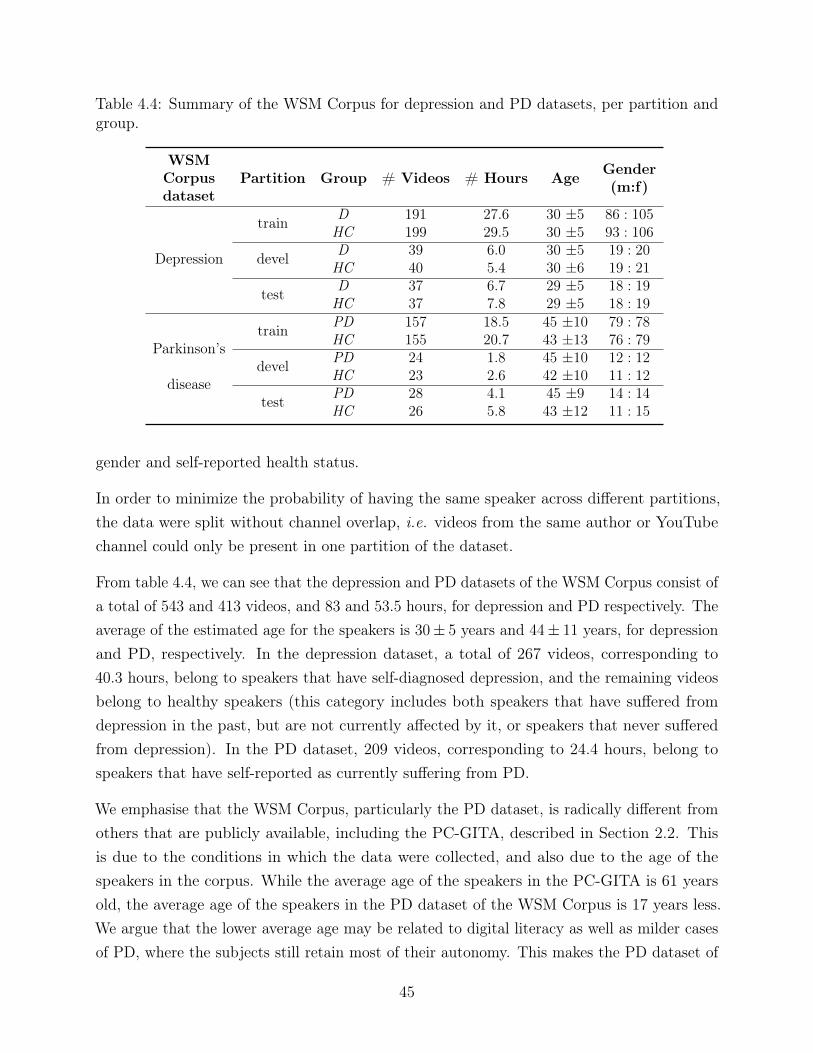
Table 4.4: Summary of the WSM Corpus for depression and PD datasets, per partition andgroup.
WSMCorpusdataset
Partition Group # Videos # Hours Age Gender(m:f)
Depression
train D 191 27.6 30 ±5 86 : 105HC 199 29.5 30 ±5 93 : 106
devel D 39 6.0 30 ±5 19 : 20HC 40 5.4 30 ±6 19 : 21
test D 37 6.7 29 ±5 18 : 19HC 37 7.8 29 ±5 18 : 19
Parkinson’s
disease
train PD 157 18.5 45 ±10 79 : 78HC 155 20.7 43 ±13 76 : 79
devel PD 24 1.8 45 ±10 12 : 12HC 23 2.6 42 ±10 11 : 12
test PD 28 4.1 45 ±9 14 : 14HC 26 5.8 43 ±12 11 : 15
gender and self-reported health status.
In order to minimize the probability of having the same speaker across different partitions,the data were split without channel overlap, i.e. videos from the same author or YouTubechannel could only be present in one partition of the dataset.
From table 4.4, we can see that the depression and PD datasets of the WSM Corpus consist ofa total of 543 and 413 videos, and 83 and 53.5 hours, for depression and PD respectively. Theaverage of the estimated age for the speakers is 30± 5 years and 44± 11 years, for depressionand PD, respectively. In the depression dataset, a total of 267 videos, corresponding to40.3 hours, belong to speakers that have self-diagnosed depression, and the remaining videosbelong to healthy speakers (this category includes both speakers that have suffered fromdepression in the past, but are not currently affected by it, or speakers that never sufferedfrom depression). In the PD dataset, 209 videos, corresponding to 24.4 hours, belong tospeakers that have self-reported as currently suffering from PD.
We emphasise that the WSM Corpus, particularly the PD dataset, is radically different fromothers that are publicly available, including the PC-GITA, described in Section 2.2. Thisis due to the conditions in which the data were collected, and also due to the age of thespeakers in the corpus. While the average age of the speakers in the PC-GITA is 61 yearsold, the average age of the speakers in the PD dataset of the WSM Corpus is 17 years less.We argue that the lower average age may be related to digital literacy as well as milder casesof PD, where the subjects still retain most of their autonomy. This makes the PD dataset of
45

the WSM Corpus an invaluable resource to possibly study phenomena such as early stages ofPD, and subgroups of PD such as early onset PD.
4.4.3 Insights on the WSM Corpus and its annotations
After having annotated all the examples and selected the subset that would integrate thefinal corpus, we move on to perform an analysis of the annotations collected in the previousstage.
In this Section we will, on one hand, provide some metrics of quality of the annotations inthis corpus, based on measures of inter-annotator agreement, and on the other hand, explorethe consequences of our annotation acceptance criteria.
We begin by providing a summary of the inter-annotator agreement for each label on thecorpus (i.e. estimated age, estimated gender, and, when applicable, self-reported healthstatus). Traditionally, the two options to measure the agreement between annotators fornon-ordered categorical items are the Cohen kappa [107], and the Fleiss kappa [108]. Theformer is used when the number of annotators is exactly two, and the latter when there isan arbitrary but fixed number of annotators. Neither of these scenarios correspond to theannotation framework that was used on the WSM Corpus v.3. In fact, for each examplewe collected a minimum of five annotations. Of all the annotations for one example, fiveare accepted, and the remaining are rejected. As an alternative to the Cohen and Fleisskappa, we use agreement ratio as the inter-annotator agreement metric, computed as thequotient between the frequency of the most common answer and the total number of answers.This measure, while less robust than Cohen and Fleiss kappa, which takes into account thepossibility of the agreement occurring by chance, is the only one out of the three that isapplicable to our scenario. Under the metric of the inter-annotator agreement ratio, highervalues represent a better inter-annotator agreement, and the maximum value this metric cantake is one, which represents a perfect inter-annotator agreement (where all annotators selectthe same answer).
We chose to report the average and the median inter-annotator agreement ratio for three setsof annotations per SA disease: the set of all annotations, the set of accepted annotations,and the set of selected annotations (which is the subset of accepted annotations associated tovideos that were selected for the final dataset). This analysis will concern the two non-orderedcategorical items to be annotated - gender and diagnosis - since no agreement restrictionswere imposed for age. The summary of the measures of the inter-annotator agreement ratiocan be found on Table 4.5 and 4.6, for depression and PD, respectively.
46
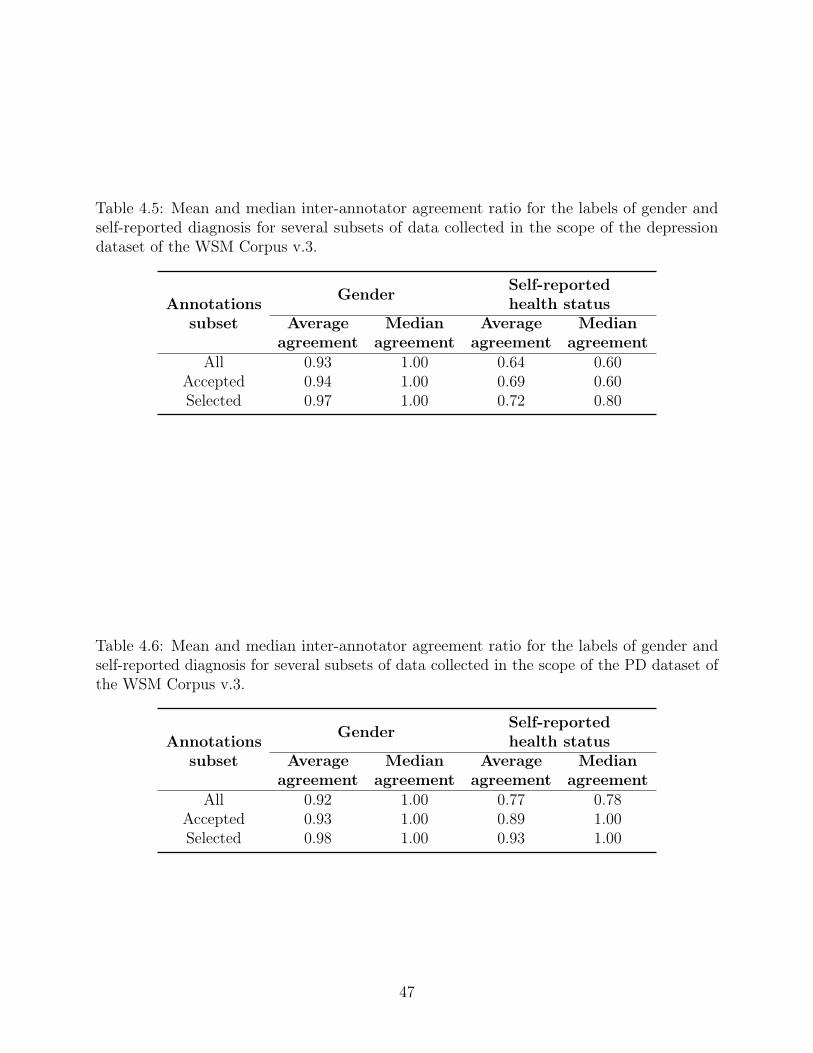
Table 4.5: Mean and median inter-annotator agreement ratio for the labels of gender andself-reported diagnosis for several subsets of data collected in the scope of the depressiondataset of the WSM Corpus v.3.
Annotationssubset
Gender Self-reportedhealth status
Averageagreement
Medianagreement
Averageagreement
Medianagreement
All 0.93 1.00 0.64 0.60Accepted 0.94 1.00 0.69 0.60Selected 0.97 1.00 0.72 0.80
Table 4.6: Mean and median inter-annotator agreement ratio for the labels of gender andself-reported diagnosis for several subsets of data collected in the scope of the PD dataset ofthe WSM Corpus v.3.
Annotationssubset
Gender Self-reportedhealth status
Averageagreement
Medianagreement
Averageagreement
Medianagreement
All 0.92 1.00 0.77 0.78Accepted 0.93 1.00 0.89 1.00Selected 0.98 1.00 0.93 1.00
47
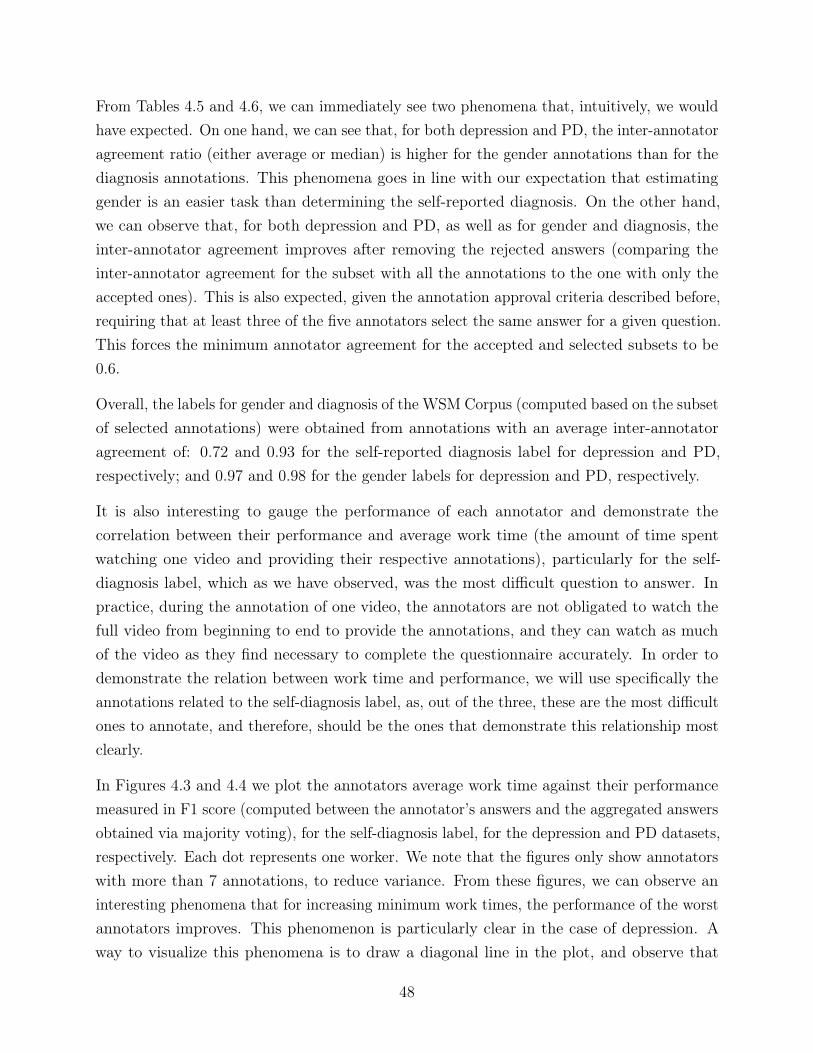
From Tables 4.5 and 4.6, we can immediately see two phenomena that, intuitively, we wouldhave expected. On one hand, we can see that, for both depression and PD, the inter-annotatoragreement ratio (either average or median) is higher for the gender annotations than for thediagnosis annotations. This phenomena goes in line with our expectation that estimatinggender is an easier task than determining the self-reported diagnosis. On the other hand,we can observe that, for both depression and PD, as well as for gender and diagnosis, theinter-annotator agreement improves after removing the rejected answers (comparing theinter-annotator agreement for the subset with all the annotations to the one with only theaccepted ones). This is also expected, given the annotation approval criteria described before,requiring that at least three of the five annotators select the same answer for a given question.This forces the minimum annotator agreement for the accepted and selected subsets to be0.6.
Overall, the labels for gender and diagnosis of the WSM Corpus (computed based on the subsetof selected annotations) were obtained from annotations with an average inter-annotatoragreement of: 0.72 and 0.93 for the self-reported diagnosis label for depression and PD,respectively; and 0.97 and 0.98 for the gender labels for depression and PD, respectively.
It is also interesting to gauge the performance of each annotator and demonstrate thecorrelation between their performance and average work time (the amount of time spentwatching one video and providing their respective annotations), particularly for the self-diagnosis label, which as we have observed, was the most difficult question to answer. Inpractice, during the annotation of one video, the annotators are not obligated to watch thefull video from beginning to end to provide the annotations, and they can watch as muchof the video as they find necessary to complete the questionnaire accurately. In order todemonstrate the relation between work time and performance, we will use specifically theannotations related to the self-diagnosis label, as, out of the three, these are the most difficultones to annotate, and therefore, should be the ones that demonstrate this relationship mostclearly.
In Figures 4.3 and 4.4 we plot the annotators average work time against their performancemeasured in F1 score (computed between the annotator’s answers and the aggregated answersobtained via majority voting), for the self-diagnosis label, for the depression and PD datasets,respectively. Each dot represents one worker. We note that the figures only show annotatorswith more than 7 annotations, to reduce variance. From these figures, we can observe aninteresting phenomena that for increasing minimum work times, the performance of the worstannotators improves. This phenomenon is particularly clear in the case of depression. Away to visualize this phenomena is to draw a diagonal line in the plot, and observe that
48
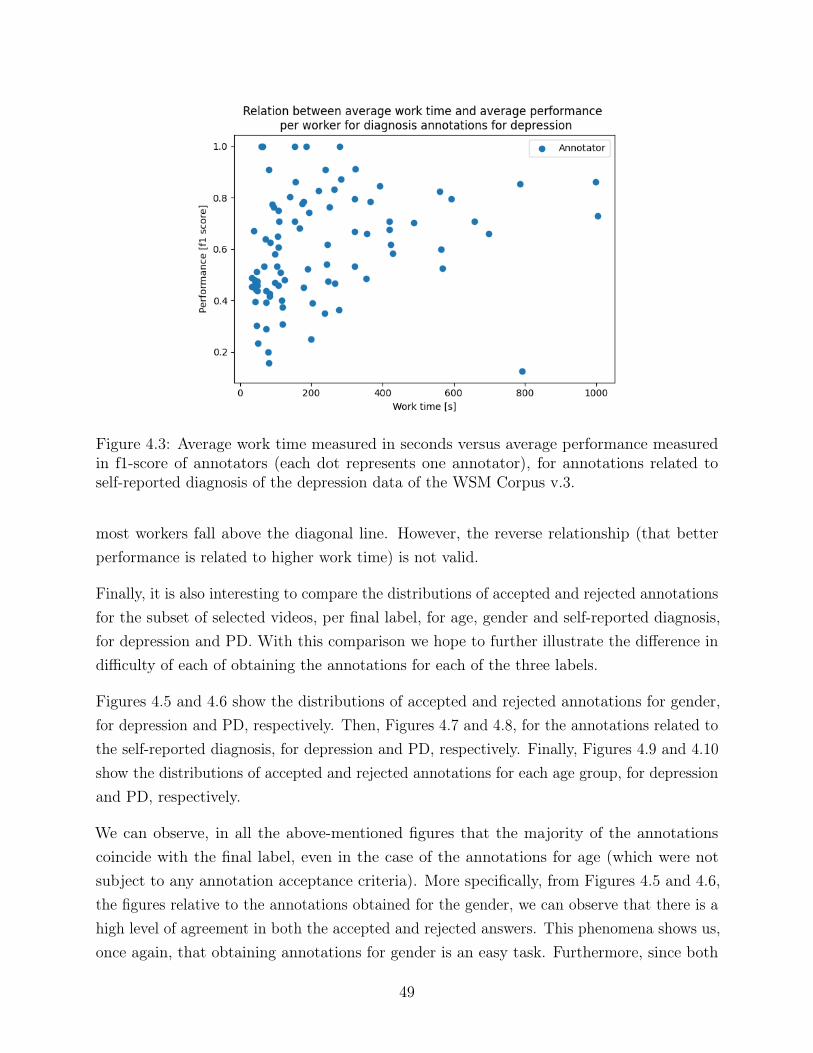
Figure 4.3: Average work time measured in seconds versus average performance measuredin f1-score of annotators (each dot represents one annotator), for annotations related toself-reported diagnosis of the depression data of the WSM Corpus v.3.
most workers fall above the diagonal line. However, the reverse relationship (that betterperformance is related to higher work time) is not valid.
Finally, it is also interesting to compare the distributions of accepted and rejected annotationsfor the subset of selected videos, per final label, for age, gender and self-reported diagnosis,for depression and PD. With this comparison we hope to further illustrate the difference indifficulty of each of obtaining the annotations for each of the three labels.
Figures 4.5 and 4.6 show the distributions of accepted and rejected annotations for gender,for depression and PD, respectively. Then, Figures 4.7 and 4.8, for the annotations related tothe self-reported diagnosis, for depression and PD, respectively. Finally, Figures 4.9 and 4.10show the distributions of accepted and rejected annotations for each age group, for depressionand PD, respectively.
We can observe, in all the above-mentioned figures that the majority of the annotationscoincide with the final label, even in the case of the annotations for age (which were notsubject to any annotation acceptance criteria). More specifically, from Figures 4.5 and 4.6,the figures relative to the annotations obtained for the gender, we can observe that there is ahigh level of agreement in both the accepted and rejected answers. This phenomena shows us,once again, that obtaining annotations for gender is an easy task. Furthermore, since both
49
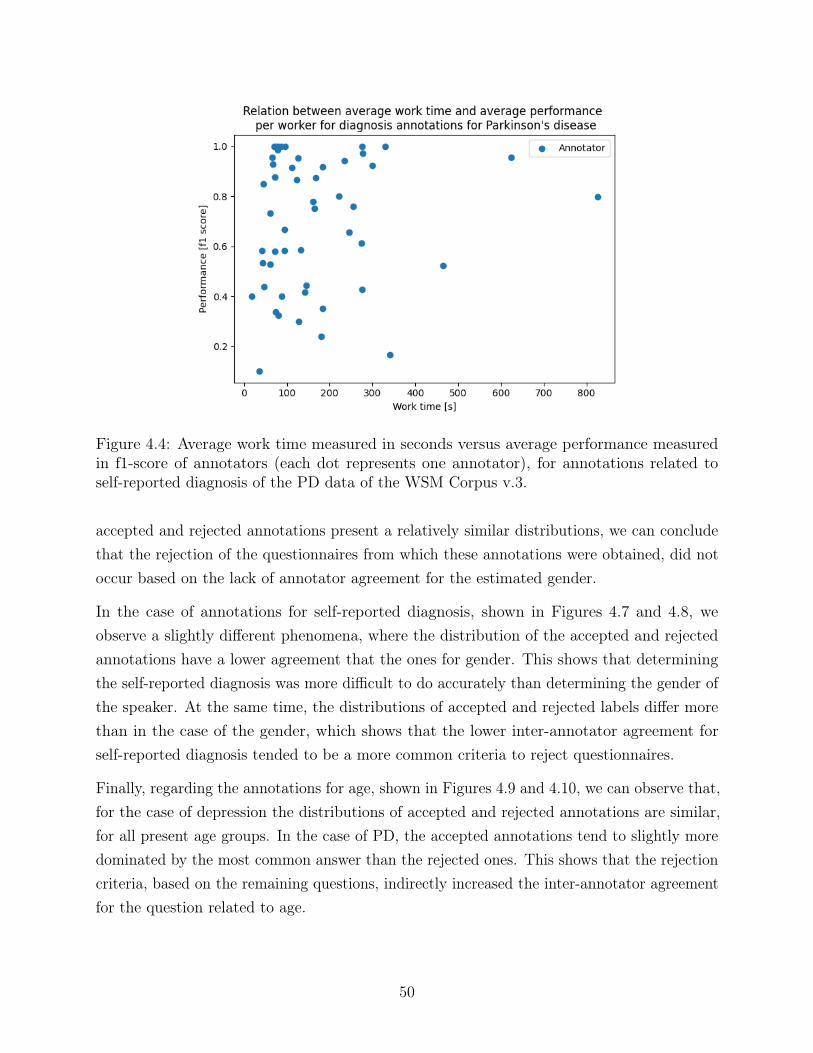
Figure 4.4: Average work time measured in seconds versus average performance measuredin f1-score of annotators (each dot represents one annotator), for annotations related toself-reported diagnosis of the PD data of the WSM Corpus v.3.
accepted and rejected annotations present a relatively similar distributions, we can concludethat the rejection of the questionnaires from which these annotations were obtained, did notoccur based on the lack of annotator agreement for the estimated gender.
In the case of annotations for self-reported diagnosis, shown in Figures 4.7 and 4.8, weobserve a slightly different phenomena, where the distribution of the accepted and rejectedannotations have a lower agreement that the ones for gender. This shows that determiningthe self-reported diagnosis was more difficult to do accurately than determining the gender ofthe speaker. At the same time, the distributions of accepted and rejected labels differ morethan in the case of the gender, which shows that the lower inter-annotator agreement forself-reported diagnosis tended to be a more common criteria to reject questionnaires.
Finally, regarding the annotations for age, shown in Figures 4.9 and 4.10, we can observe that,for the case of depression the distributions of accepted and rejected annotations are similar,for all present age groups. In the case of PD, the accepted annotations tend to slightly moredominated by the most common answer than the rejected ones. This shows that the rejectioncriteria, based on the remaining questions, indirectly increased the inter-annotator agreementfor the question related to age.
50
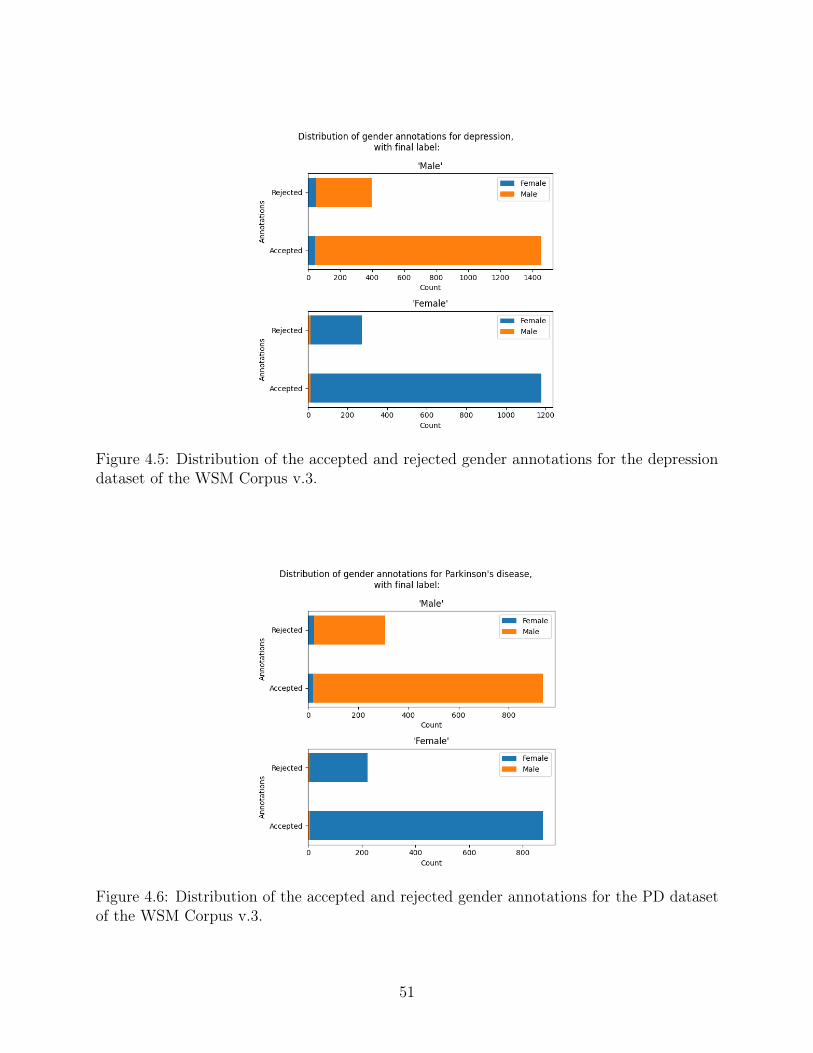
Figure 4.5: Distribution of the accepted and rejected gender annotations for the depressiondataset of the WSM Corpus v.3.
Figure 4.6: Distribution of the accepted and rejected gender annotations for the PD datasetof the WSM Corpus v.3.
51
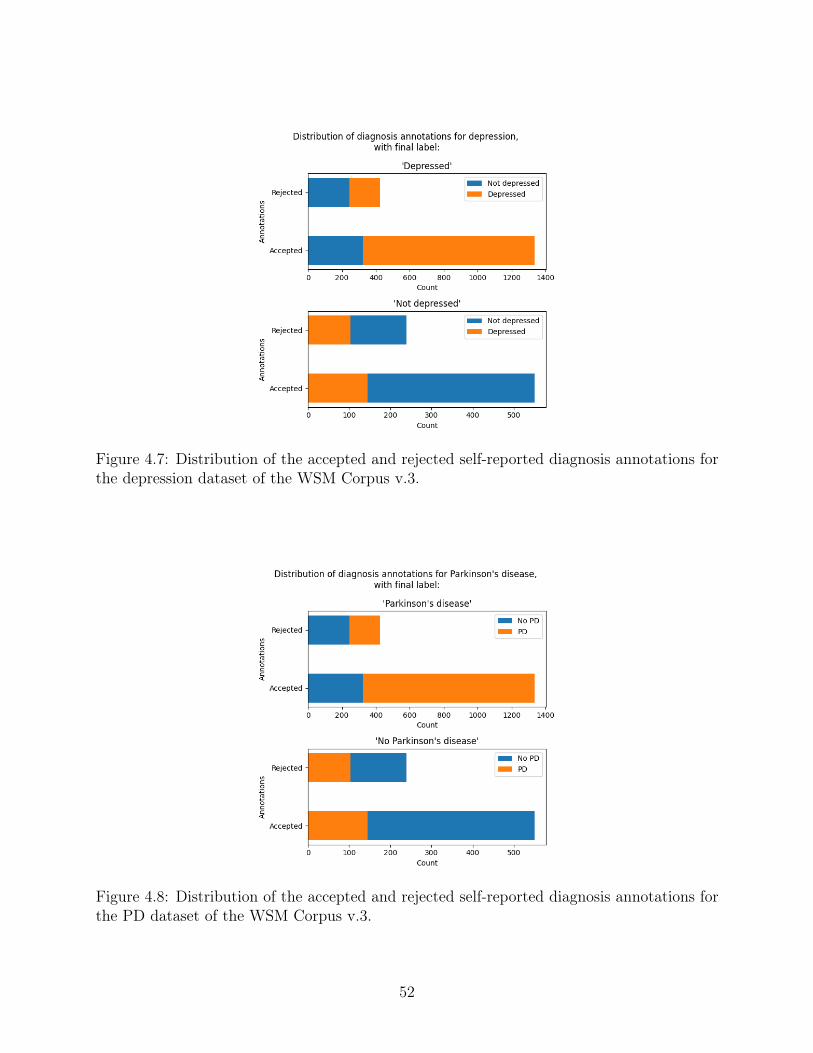
Figure 4.7: Distribution of the accepted and rejected self-reported diagnosis annotations forthe depression dataset of the WSM Corpus v.3.
Figure 4.8: Distribution of the accepted and rejected self-reported diagnosis annotations forthe PD dataset of the WSM Corpus v.3.
52
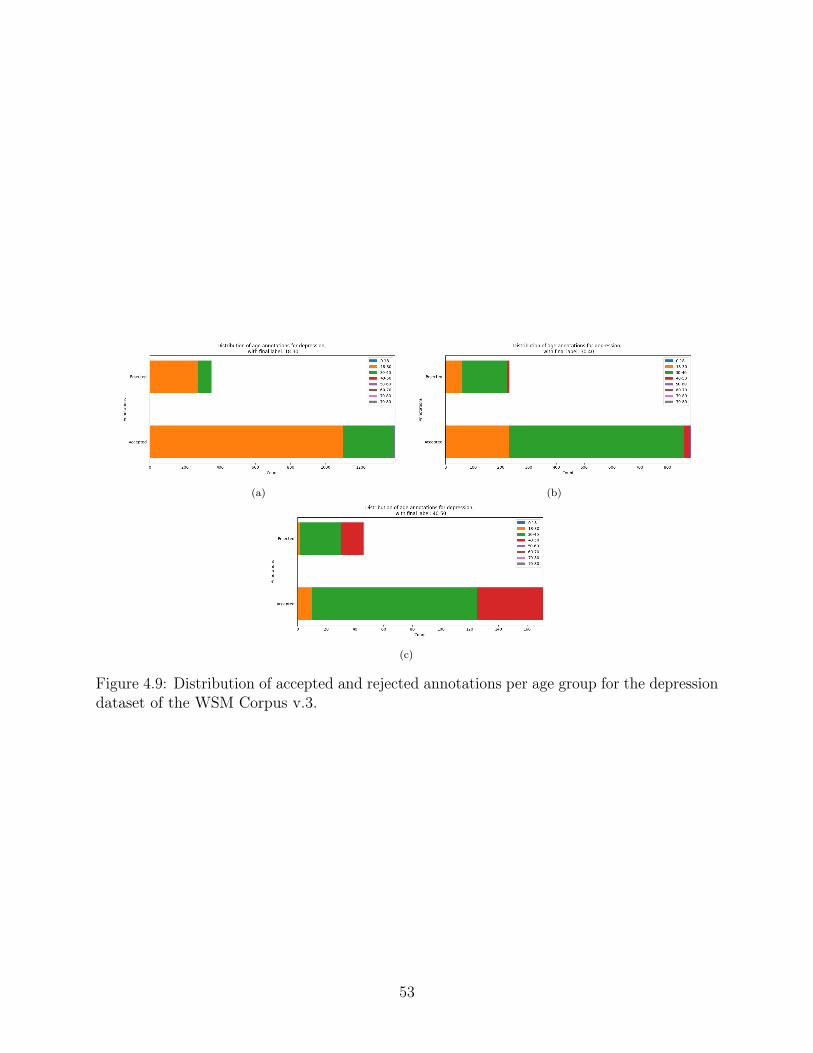
(a) (b)
(c)
Figure 4.9: Distribution of accepted and rejected annotations per age group for the depressiondataset of the WSM Corpus v.3.
53
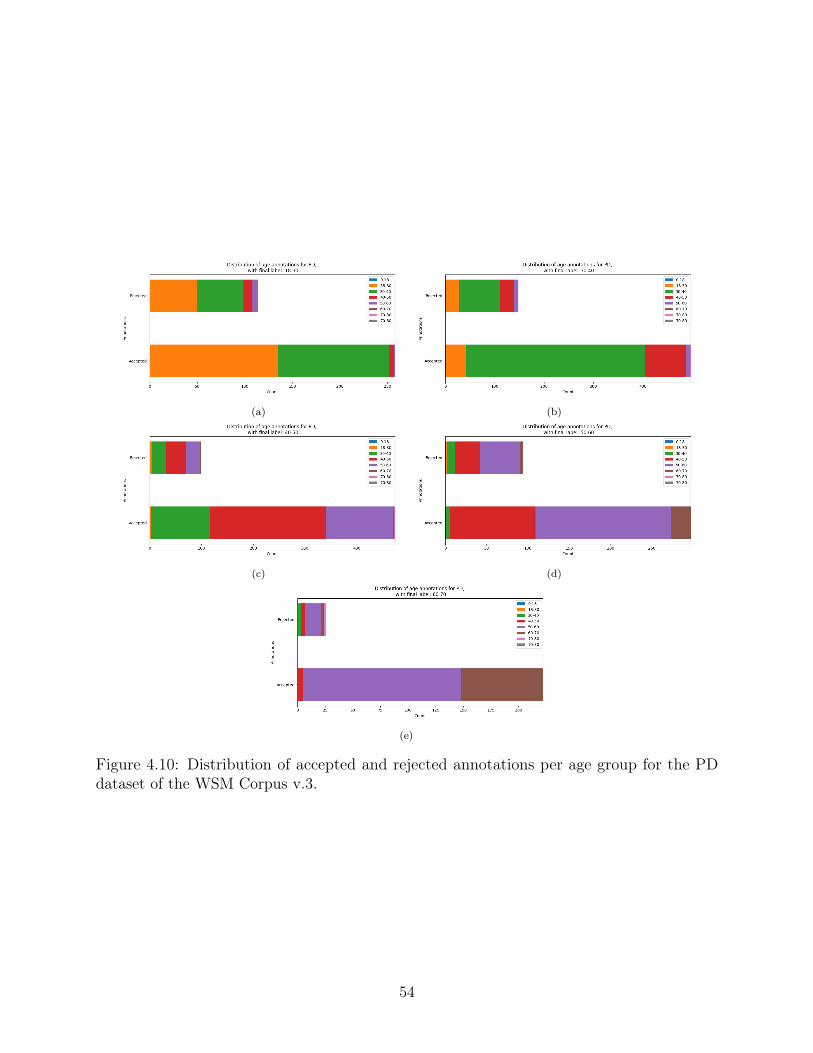
(a) (b)
(c) (d)
(e)
Figure 4.10: Distribution of accepted and rejected annotations per age group for the PDdataset of the WSM Corpus v.3.
54
Chapter 5
Automatic annotation of speech medicaldatasets
After having described in detail the collection and manual annotation process of the WSMCorpus in Chapter 4, in its three versions, we move on to explore strategies to automatethe annotation process. By developing a successful automatic annotation strategy for thesecorpora, we are able to significantly reduce the costs typically associated with annotationtasks. In fact, with the constant addition of new videos to the existing online multimediarepositories, having access to an automatic annotation strategy, enables the possibility tocontinue growing the WSM Corpus indefinitely at no extra cost.
In this Chapter, we will explore several strategies to perform automatic annotation of corpora,particularly the WSM Corpus. It is important to be aware that this task is more specificthan separating videos featuring people who self-report to be currently suffering by eitherdepression or PD from videos featuring people who do not. It is doing so in a contextwhere the negative examples are somehow also related to the target disease as well as thepositive ones. In most cases, the negative examples belong to one of the following categories:featuring subjects that suffered from the target disease in the past (only in the case ofdepression), featuring caretakers of subjects with the target disease; featuring healthcarespecialists sharing knowledge about the target disease. As such, the strategies presentedthroughout this Chapter also take the intricacies of the task into consideration.
One of the design choices we made in the work presented in this Chapter, was to choosenatural language as the main modality used to automatically annotate the WSM Corpus.The choice of this modality over speech was based on the specific characteristics of thedata that were pre-selected for annotation via scrapping tools and implemented retrieval
55
algorithms: the retrieved examples are mostly of subjects who are aware of their healthstatus, and who are either discussing it or discussing a related topic (as it is also the case ofmany of the interviews on the DAIC-WOZ). Therefore, we will take advantage of this, andfocus on looking for explicit cues that the person is affected by depression or PD. As we willshow along this Chapter, using the natural language modality allows us to achieve a goodannotation quality. Furthermore, there are also practical considerations to take into account:text based information such as the video’s transcription, comments, or the metadata of thevideo, are typically lighter (can be downloaded faster, stored in less space, and be processedfaster); versus the audio of the videos, which is heavier (requires downloading the full videoand splitting it into video without audio and audio, it takes more storage, and it takes longerto process).
In this Chapter we will present several different solutions to automate corpora annotation,where each strategy has different requirements for the availability of labeled data duringtraining. We begin by exploring the most straightforward case, the fully supervised one,where the training data are labeled. Then we move on to explore a semi-supervised strategy,and finally we adopt a weakly supervised solution for this problem. The later does notrequire any labeled data during training, and only takes advantage of the existing underlyingstructure of the data.
In a way, the different strategies represent some of the possible operating points on the scaleof the cost of manually annotating none to all of the corpus. Depending on the resourcesavailable, one can chose the most appropriate approach. At the same time, all the techniquespresented in this Chapter are presented in such a way that they may be easily translatable tocorpora annotation problems from other domains.
Specifically, in Section 5.1 we adopt a naive strategy based on fully supervised learningstrategies and off-the-shelf tools, in which we establish a baseline for annotating new exampleson the WSM Corpus when all the previously existing ones have already been (manually)annotated. We study the influence of a number of features derived from the transcriptionand the metadata of the video.
Then, in Section 5.2 we explore a greedy semi-supervised strategy to automatically annotatethe WSM Corpus. This strategy attempts to partition the unlabeled subset of the data intopositive and negative examples, such that the performance of a model trained on these dataand labels, evaluated on the labeled subset of the corpus, is optimized. This strategy dependson the existence of a small “gold” dataset containing manual annotations.
Finally, in Section 5.3 and 5.4, we propose more sophisticated strategies, more specifically,
56
we propose two weakly supervised learning strategies based on original generalizations ofthe multiple-instance learning (MIL) framework, that take advantage of the data structureimplicit in the videos collected from YouTube, and do not depend on any manual labeling:θ-MIL and deep-θ-MIL. Specifically, the fact that each video is associated with the searchterm that was used to retrieve it, and the hypothesis that the set of videos retrieved withthe same search term is made up of videos that have some sort of commonalities amongthemselves. θ-MIL is based on the application of SVMs for MIL, and deep-θ-MIL is animplementation of a similar solution with neural networks. We test the proposed deep-θ-MILsolution to annotate the WSM Corpus v.2 in Section 5.5.
5.1 Leveraging from transcriptions and metadata in a
fully supervised context
In this Section we will show some experiments, first reported in [109], where we attempted toannotate the WSM Corpus (v.1) by finding videos deemed “ideal candidates”. This meansthat they verify the following characteristics: be in the vlog format, featuring a single subject;who is typically talking about themself; and typically referring to present and not past events,situations, or emotions; and which has to verify all the prior labels at the same time, whichequated to explicitly self-report their current health status of depressed or suffering from PD.
This work was done as a proof-of-concept to show a possible avenue to annotate new examples,and automatically grow the WSM Corpus with a fully supervised learning setting as thestarting point.
We took advantage of the binary labels for which the corpus is annotated (the videois in a vlog format; regardless of the topic, the main speaker of the video talks mostlyabout themself; regardless of the topic, the main subject is speaking mostly about presentevents/opinions/situations/etc. or from a recent past (over the last few hours/days); themain topic of the video is related to the [target disease]; and finally, the subject claims to becurrently affected by the [target disease]) to find these “ideal candidates”.
As mentioned, we worked on a fully supervised learning scenario, where the modeling strategieswe adopted were Logistic regression (LR), and SVMs, and where the the input to these modelswas a set of features and descriptors extracted from the transcription, title, description, topcomments, and metadata of the videos.
We trained a separate model for each binary label and for each type of feature in order tostudy their different contributions to find the target videos.
57
Again, we emphasise that we opted for simple, straightforward techniques, both for the featureextraction stage as well as for the modeling stage, using mostly off-the-shelf tools in order topresent a modular baseline in which the features or the modeling techniques can be easilychanged. We deferred replicating state of the art techniques used to solve related problems,including multimodal emotion recognition [110][111][112], and techniques that perform thesynchronization of the features across different modalities [113][114][115] to future work.
5.1.1 Feature extraction
From the information extracted for each video, we computed the following features derivedfrom the video’s transcription, title and description as provided by the uploader:
• Bag-of-Word (BoW) features: We extract these from the video’s transcription.The BoW model was used to convert a transcription in to a frequency vector of tokensin the transcriptions. In this scheme, we obtained one feature vector per transcription,in which each feature was the normalized frequency of an individual token. The lengthof the vector was the total size of the vocabulary of the corpus of transcriptions. Thismodel ignores the ordering of the tokens in the transcription. In order to reducethe weight of very common words, (e.g. “the”, “a”, “is” in English), which carry verylittle meaningful information about the actual content of the document, we used theterm-frequency times inverse document-frequency (tf-idf) transform.
• Sentiment features: We derived these from the title, description, transcription andtop n comments of the video using the Stanford Core NLP tool [116]. This tool isbased on a Recursive Neural Tensor Network (RNTN). RNTNs take as input phrasesof any length, and represent them through word vectors and a parse tree. They thencompute vectors for higher nodes in the tree using the same tensor-based compositionfunction. This RNTN was trained on a corpus of movie reviews [117], and parsed withthe Stanford parser [118].
• Metadata: We extracted features that were derived from the collected metadataincluding: a one hot vector representing the video category out of fourteen possiblecategories; the video duration; the number of views; the number of comments; thenumber of thumbs up; and the number of thumbs down at the time of collection.
At this early stage, and given the limited size of the WSM Corpus v.1, we did not includetopic modeling, nor semantic word embedding models.
58
5.1.2 Classifiers
We used two alternatives to predict each of the five binary labels of the videos in the WSMCorpus: LR, and SVMs. For the case of the SVM we trained 3 distinct models with linear,polynomial of degree 3, and RBF kernels.
5.1.3 Datasets
For the experiments reported in the following Section, we used the labeled examples of thedepression and PD subsets of the WSM Corpus v.1, as described in Section 4.2. These subsetscontained 58 and 61 examples for depression and PD, respectively. Out of which 18 and18 were positive for the self-reported health status of depression and PD, respectively. Thedistribution of the remaining labels was reported in Table 4.1.
5.1.4 Experiments and Results
The training and evaluation of the proposed pipeline for each SA disease was accomplishedvia leave-one-out cross validation, i.e., the model was trained n times, each time with n− 1
examples as the training data, and the remaining example is left to evaluate the model. Thisprocess is repeated, always leaving a different example for evaluation, such that, by the nth
time, each example is used once during the evaluation. The final performance is the averageof all the performances.
In order to understand the contribution of each type of feature to detect each of the fivebinary labels, we trained a distinct classifier for each type of feature, and another one withall the features.
The BoW features contributed with feature vectors of dimension 5096 and 5849 for depressionand PD, respectively; the sentiment features extracted from the title, description, transcriptionand comments of the video contributed with a 28 dimensions feature vector (7 dimensionseach); the metadata contributed with 19 dimensional feature vector. By concatenatingfeatures extracted from all modalities, the final feature vectors had 5914 and 6667 dimensionsfor depression and PD, respectively.
For practical reasons, given the limited amount of examples in our datasets, and the com-paratively large number of features, the feature vectors were reduced in dimensionality byeliminating the features that had a Pearson correlation coefficient (PCC) with the corre-sponding label below 0.2, thus only the features that carried some linear correlation to thelabel were preserved.
59
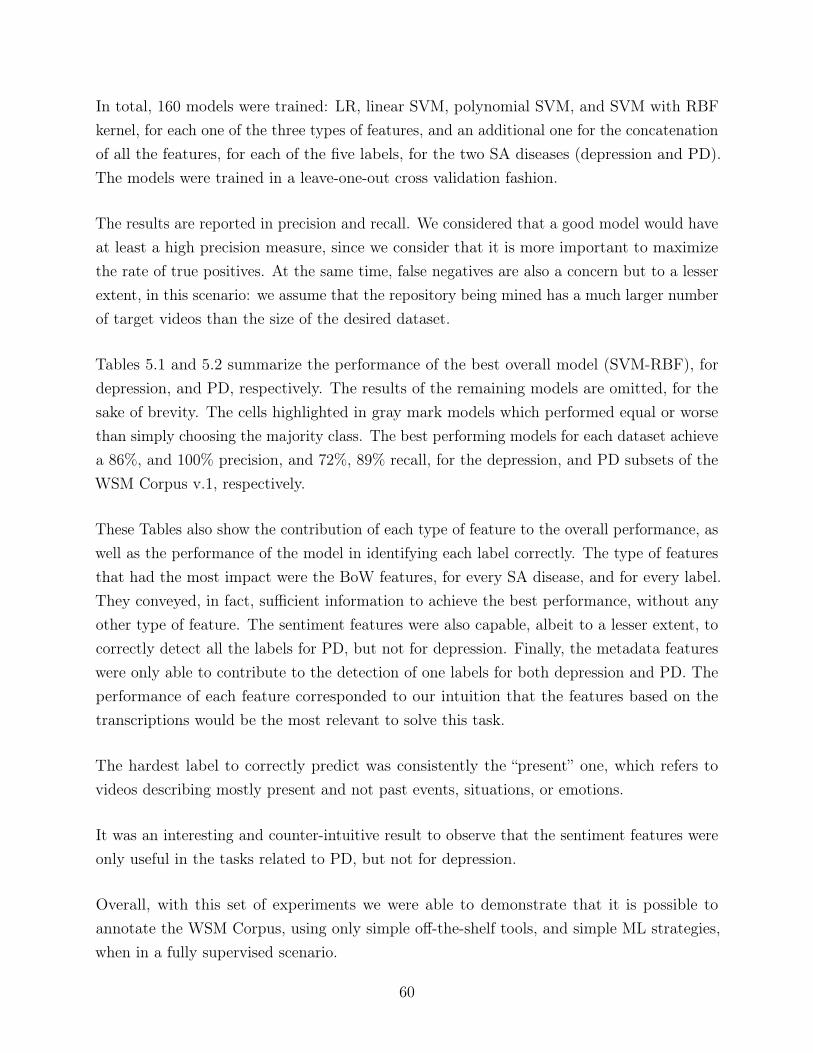
In total, 160 models were trained: LR, linear SVM, polynomial SVM, and SVM with RBFkernel, for each one of the three types of features, and an additional one for the concatenationof all the features, for each of the five labels, for the two SA diseases (depression and PD).The models were trained in a leave-one-out cross validation fashion.
The results are reported in precision and recall. We considered that a good model would haveat least a high precision measure, since we consider that it is more important to maximizethe rate of true positives. At the same time, false negatives are also a concern but to a lesserextent, in this scenario: we assume that the repository being mined has a much larger numberof target videos than the size of the desired dataset.
Tables 5.1 and 5.2 summarize the performance of the best overall model (SVM-RBF), fordepression, and PD, respectively. The results of the remaining models are omitted, for thesake of brevity. The cells highlighted in gray mark models which performed equal or worsethan simply choosing the majority class. The best performing models for each dataset achievea 86%, and 100% precision, and 72%, 89% recall, for the depression, and PD subsets of theWSM Corpus v.1, respectively.
These Tables also show the contribution of each type of feature to the overall performance, aswell as the performance of the model in identifying each label correctly. The type of featuresthat had the most impact were the BoW features, for every SA disease, and for every label.They conveyed, in fact, sufficient information to achieve the best performance, without anyother type of feature. The sentiment features were also capable, albeit to a lesser extent, tocorrectly detect all the labels for PD, but not for depression. Finally, the metadata featureswere only able to contribute to the detection of one labels for both depression and PD. Theperformance of each feature corresponded to our intuition that the features based on thetranscriptions would be the most relevant to solve this task.
The hardest label to correctly predict was consistently the “present” one, which refers tovideos describing mostly present and not past events, situations, or emotions.
It was an interesting and counter-intuitive result to observe that the sentiment features wereonly useful in the tasks related to PD, but not for depression.
Overall, with this set of experiments we were able to demonstrate that it is possible toannotate the WSM Corpus, using only simple off-the-shelf tools, and simple ML strategies,when in a fully supervised scenario.
60
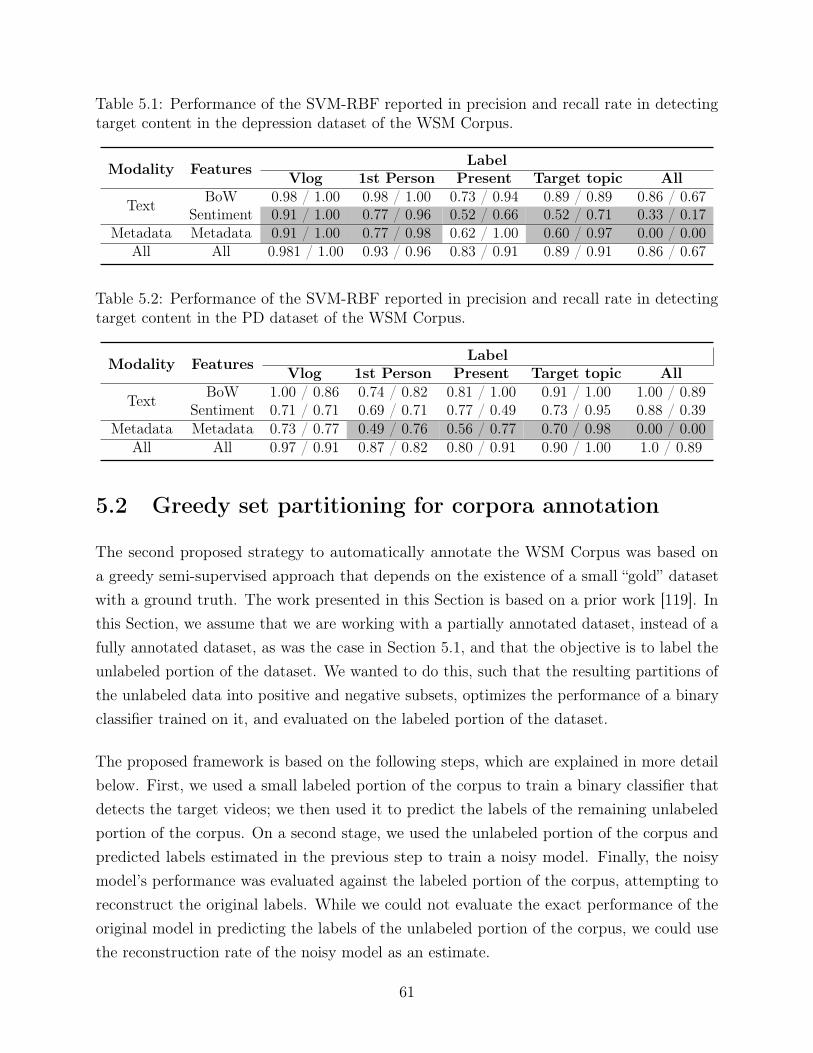
Table 5.1: Performance of the SVM-RBF reported in precision and recall rate in detectingtarget content in the depression dataset of the WSM Corpus.
LabelModality Features Vlog 1st Person Present Target topic AllBoW 0.98 / 1.00 0.98 / 1.00 0.73 / 0.94 0.89 / 0.89 0.86 / 0.67Text Sentiment 0.91 / 1.00 0.77 / 0.96 0.52 / 0.66 0.52 / 0.71 0.33 / 0.17
Metadata Metadata 0.91 / 1.00 0.77 / 0.98 0.62 / 1.00 0.60 / 0.97 0.00 / 0.00All All 0.981 / 1.00 0.93 / 0.96 0.83 / 0.91 0.89 / 0.91 0.86 / 0.67
Table 5.2: Performance of the SVM-RBF reported in precision and recall rate in detectingtarget content in the PD dataset of the WSM Corpus.
LabelModality Features Vlog 1st Person Present Target topic AllBoW 1.00 / 0.86 0.74 / 0.82 0.81 / 1.00 0.91 / 1.00 1.00 / 0.89Text Sentiment 0.71 / 0.71 0.69 / 0.71 0.77 / 0.49 0.73 / 0.95 0.88 / 0.39
Metadata Metadata 0.73 / 0.77 0.49 / 0.76 0.56 / 0.77 0.70 / 0.98 0.00 / 0.00All All 0.97 / 0.91 0.87 / 0.82 0.80 / 0.91 0.90 / 1.00 1.0 / 0.89
5.2 Greedy set partitioning for corpora annotation
The second proposed strategy to automatically annotate the WSM Corpus was based ona greedy semi-supervised approach that depends on the existence of a small “gold” datasetwith a ground truth. The work presented in this Section is based on a prior work [119]. Inthis Section, we assume that we are working with a partially annotated dataset, instead of afully annotated dataset, as was the case in Section 5.1, and that the objective is to label theunlabeled portion of the dataset. We wanted to do this, such that the resulting partitions ofthe unlabeled data into positive and negative subsets, optimizes the performance of a binaryclassifier trained on it, and evaluated on the labeled portion of the dataset.
The proposed framework is based on the following steps, which are explained in more detailbelow. First, we used a small labeled portion of the corpus to train a binary classifier thatdetects the target videos; we then used it to predict the labels of the remaining unlabeledportion of the corpus. On a second stage, we used the unlabeled portion of the corpus andpredicted labels estimated in the previous step to train a noisy model. Finally, the noisymodel’s performance was evaluated against the labeled portion of the corpus, attempting toreconstruct the original labels. While we could not evaluate the exact performance of theoriginal model in predicting the labels of the unlabeled portion of the corpus, we could usethe reconstruction rate of the noisy model as an estimate.
61
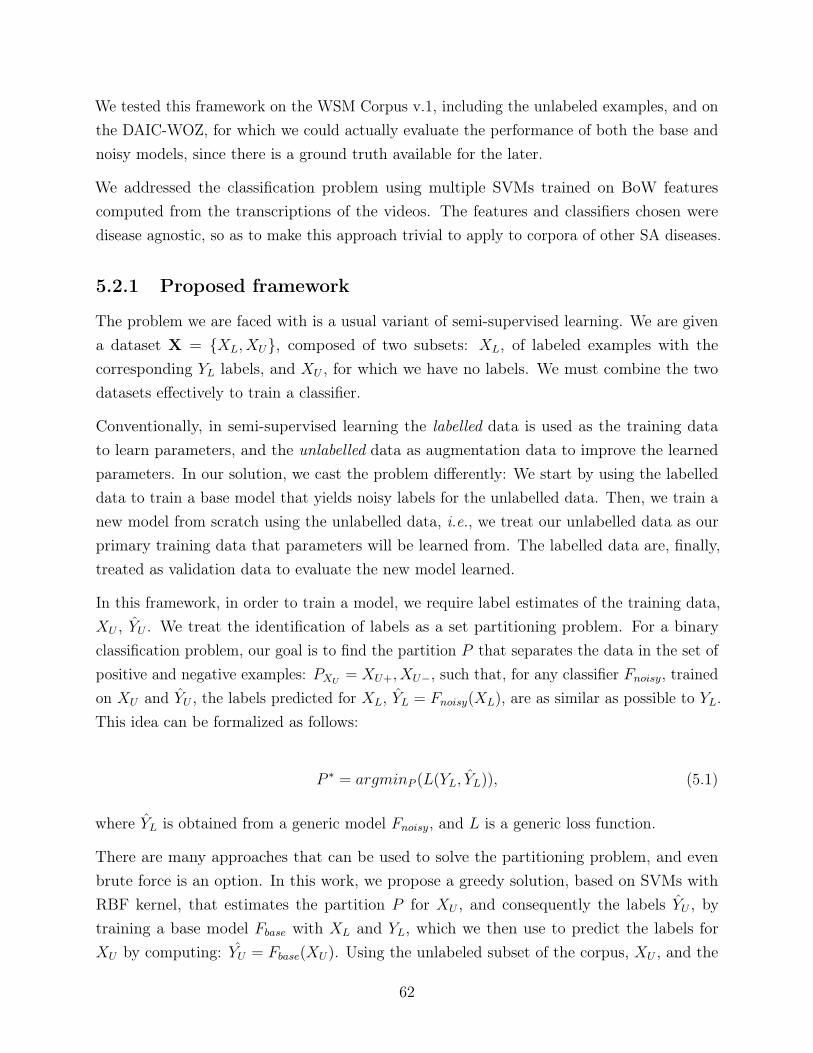
We tested this framework on the WSM Corpus v.1, including the unlabeled examples, and onthe DAIC-WOZ, for which we could actually evaluate the performance of both the base andnoisy models, since there is a ground truth available for the later.
We addressed the classification problem using multiple SVMs trained on BoW featurescomputed from the transcriptions of the videos. The features and classifiers chosen weredisease agnostic, so as to make this approach trivial to apply to corpora of other SA diseases.
5.2.1 Proposed framework
The problem we are faced with is a usual variant of semi-supervised learning. We are givena dataset X = {XL, XU}, composed of two subsets: XL, of labeled examples with thecorresponding YL labels, and XU , for which we have no labels. We must combine the twodatasets effectively to train a classifier.
Conventionally, in semi-supervised learning the labelled data is used as the training datato learn parameters, and the unlabelled data as augmentation data to improve the learnedparameters. In our solution, we cast the problem differently: We start by using the labelleddata to train a base model that yields noisy labels for the unlabelled data. Then, we train anew model from scratch using the unlabelled data, i.e., we treat our unlabelled data as ourprimary training data that parameters will be learned from. The labelled data are, finally,treated as validation data to evaluate the new model learned.
In this framework, in order to train a model, we require label estimates of the training data,XU , YU . We treat the identification of labels as a set partitioning problem. For a binaryclassification problem, our goal is to find the partition P that separates the data in the set ofpositive and negative examples: PXU = XU+, XU−, such that, for any classifier Fnoisy, trainedon XU and YU , the labels predicted for XL, YL = Fnoisy(XL), are as similar as possible to YL.This idea can be formalized as follows:
P ∗ = argminP (L(YL, YL)), (5.1)
where YL is obtained from a generic model Fnoisy, and L is a generic loss function.
There are many approaches that can be used to solve the partitioning problem, and evenbrute force is an option. In this work, we propose a greedy solution, based on SVMs withRBF kernel, that estimates the partition P for XU , and consequently the labels YU , bytraining a base model Fbase with XL and YL, which we then use to predict the labels forXU by computing: YU = Fbase(XU). Using the unlabeled subset of the corpus, XU , and the
62
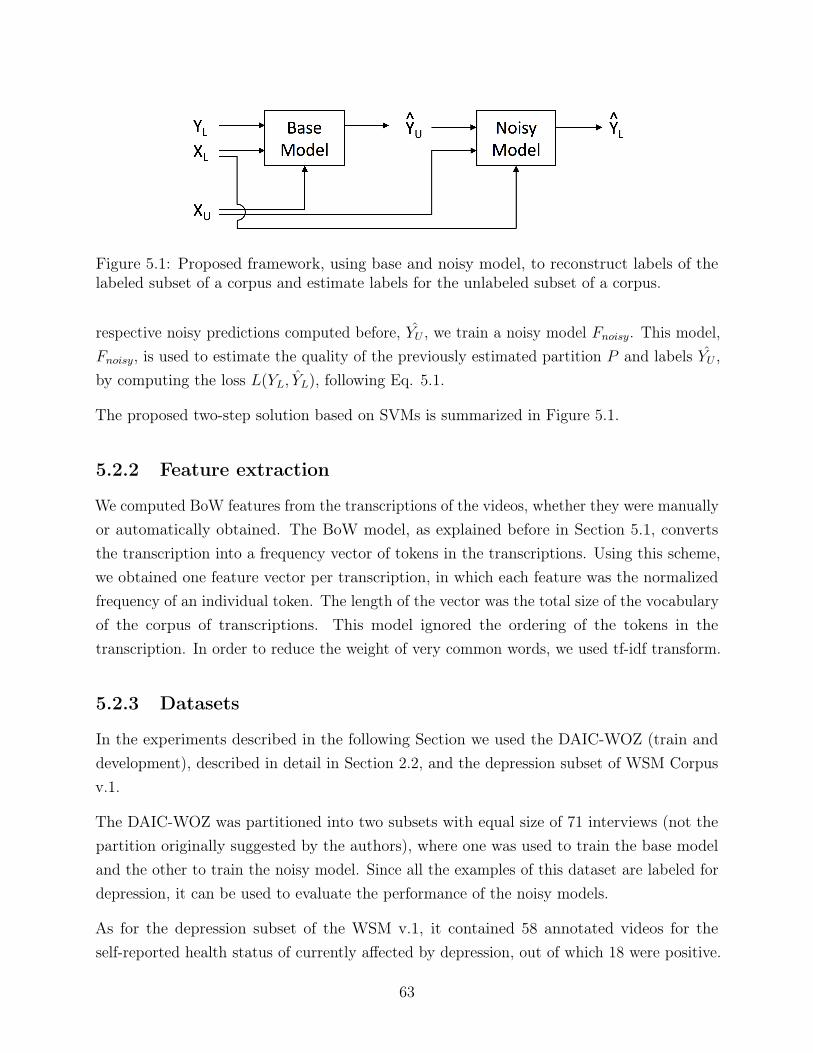
Figure 5.1: Proposed framework, using base and noisy model, to reconstruct labels of thelabeled subset of a corpus and estimate labels for the unlabeled subset of a corpus.
respective noisy predictions computed before, YU , we train a noisy model Fnoisy. This model,Fnoisy, is used to estimate the quality of the previously estimated partition P and labels YU ,by computing the loss L(YL, YL), following Eq. 5.1.
The proposed two-step solution based on SVMs is summarized in Figure 5.1.
5.2.2 Feature extraction
We computed BoW features from the transcriptions of the videos, whether they were manuallyor automatically obtained. The BoW model, as explained before in Section 5.1, convertsthe transcription into a frequency vector of tokens in the transcriptions. Using this scheme,we obtained one feature vector per transcription, in which each feature was the normalizedfrequency of an individual token. The length of the vector was the total size of the vocabularyof the corpus of transcriptions. This model ignored the ordering of the tokens in thetranscription. In order to reduce the weight of very common words, we used tf-idf transform.
5.2.3 Datasets
In the experiments described in the following Section we used the DAIC-WOZ (train anddevelopment), described in detail in Section 2.2, and the depression subset of WSM Corpusv.1.
The DAIC-WOZ was partitioned into two subsets with equal size of 71 interviews (not thepartition originally suggested by the authors), where one was used to train the base modeland the other to train the noisy model. Since all the examples of this dataset are labeled fordepression, it can be used to evaluate the performance of the noisy models.
As for the depression subset of the WSM v.1, it contained 58 annotated videos for theself-reported health status of currently affected by depression, out of which 18 were positive.
63
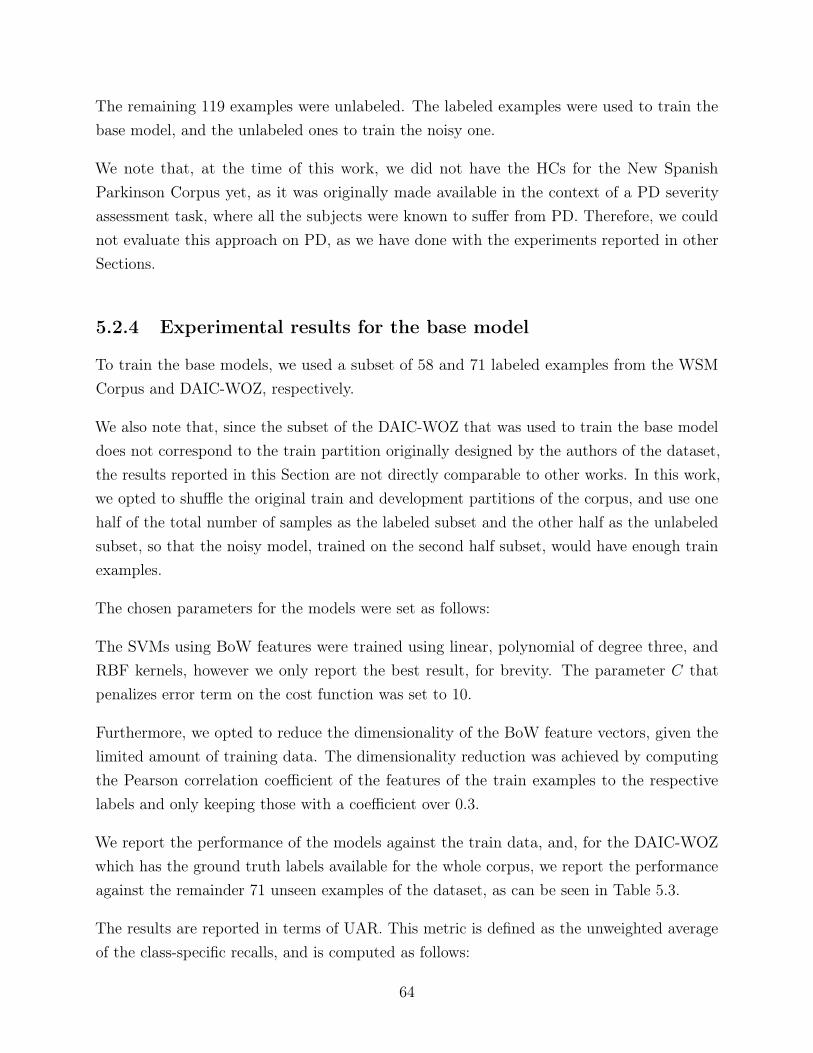
The remaining 119 examples were unlabeled. The labeled examples were used to train thebase model, and the unlabeled ones to train the noisy one.
We note that, at the time of this work, we did not have the HCs for the New SpanishParkinson Corpus yet, as it was originally made available in the context of a PD severityassessment task, where all the subjects were known to suffer from PD. Therefore, we couldnot evaluate this approach on PD, as we have done with the experiments reported in otherSections.
5.2.4 Experimental results for the base model
To train the base models, we used a subset of 58 and 71 labeled examples from the WSMCorpus and DAIC-WOZ, respectively.
We also note that, since the subset of the DAIC-WOZ that was used to train the base modeldoes not correspond to the train partition originally designed by the authors of the dataset,the results reported in this Section are not directly comparable to other works. In this work,we opted to shuffle the original train and development partitions of the corpus, and use onehalf of the total number of samples as the labeled subset and the other half as the unlabeledsubset, so that the noisy model, trained on the second half subset, would have enough trainexamples.
The chosen parameters for the models were set as follows:
The SVMs using BoW features were trained using linear, polynomial of degree three, andRBF kernels, however we only report the best result, for brevity. The parameter C thatpenalizes error term on the cost function was set to 10.
Furthermore, we opted to reduce the dimensionality of the BoW feature vectors, given thelimited amount of training data. The dimensionality reduction was achieved by computingthe Pearson correlation coefficient of the features of the train examples to the respectivelabels and only keeping those with a coefficient over 0.3.
We report the performance of the models against the train data, and, for the DAIC-WOZwhich has the ground truth labels available for the whole corpus, we report the performanceagainst the remainder 71 unseen examples of the dataset, as can be seen in Table 5.3.
The results are reported in terms of UAR. This metric is defined as the unweighted averageof the class-specific recalls, and is computed as follows:
64
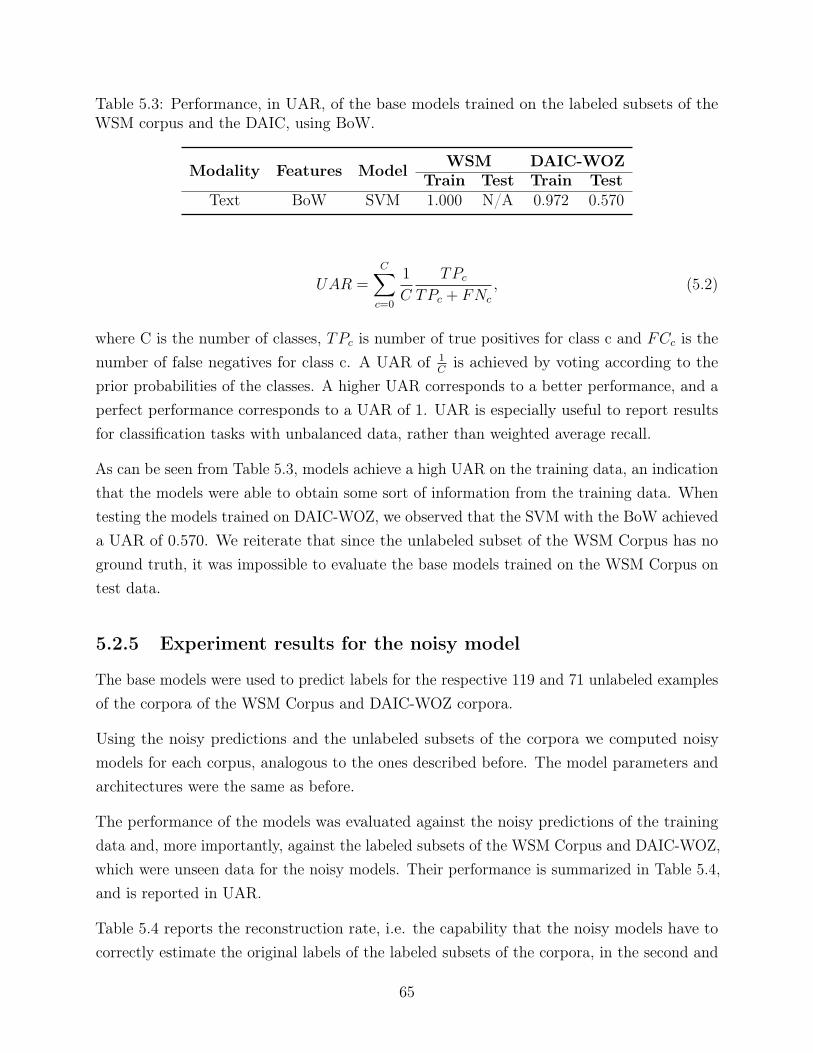
Table 5.3: Performance, in UAR, of the base models trained on the labeled subsets of theWSM corpus and the DAIC, using BoW.
Modality Features Model WSM DAIC-WOZTrain Test Train Test
Text BoW SVM 1.000 N/A 0.972 0.570
UAR =C∑c=0
1
C
TPcTPc + FNc
, (5.2)
where C is the number of classes, TPc is number of true positives for class c and FCc is thenumber of false negatives for class c. A UAR of 1
Cis achieved by voting according to the
prior probabilities of the classes. A higher UAR corresponds to a better performance, and aperfect performance corresponds to a UAR of 1. UAR is especially useful to report resultsfor classification tasks with unbalanced data, rather than weighted average recall.
As can be seen from Table 5.3, models achieve a high UAR on the training data, an indicationthat the models were able to obtain some sort of information from the training data. Whentesting the models trained on DAIC-WOZ, we observed that the SVM with the BoW achieveda UAR of 0.570. We reiterate that since the unlabeled subset of the WSM Corpus has noground truth, it was impossible to evaluate the base models trained on the WSM Corpus ontest data.
5.2.5 Experiment results for the noisy model
The base models were used to predict labels for the respective 119 and 71 unlabeled examplesof the corpora of the WSM Corpus and DAIC-WOZ corpora.
Using the noisy predictions and the unlabeled subsets of the corpora we computed noisymodels for each corpus, analogous to the ones described before. The model parameters andarchitectures were the same as before.
The performance of the models was evaluated against the noisy predictions of the trainingdata and, more importantly, against the labeled subsets of the WSM Corpus and DAIC-WOZ,which were unseen data for the noisy models. Their performance is summarized in Table 5.4,and is reported in UAR.
Table 5.4 reports the reconstruction rate, i.e. the capability that the noisy models have tocorrectly estimate the original labels of the labeled subsets of the corpora, in the second and
65
Table 5.4: Performance, in UAR, of the noisy models trained on the unlabeled subsets ofthe WSM corpus and the DAIC and respective noisy predictions estimated by the respectivebase models, using BoW.
Modality Features Model WSM DAIC-WOZTrain Dev Train Dev
Text BoW SVM 0.981 0.969 1.000 0.917
fourth columns, for the WSM Corpus and the DAIC-WOZ, respectively. We observe mostlygood reconstruction rates. Furthermore, by comparing the fourth column of Tables 5.3 andTable 5.4, we can observe a possible correlation between the performances of the noisy modelson unseen data and the base models for the DAIC-WOZ. From the comparison of these twocolumns we can hypothesize a similar relation between the performances of the noisy andbase model trained with DAIC-WOZ, thus assuming a reasonable performance of the basemodels in estimating the labels of the dataset, even with so few examples to learn from.
This semi-supervised greedy approach could be further improved by using the labels estimatedby the base model as the initialization for an iterative algorithm that would further optimizethe partition of the unlabeled subset into positive and negative samples.
5.3 Generalizing the Multiple Instance Learning frame-
work in a semi supervised context
In this Section we will explore a weakly supervised learning strategy to automatically annotatethe WSM Corpus without the requirement of having any annotated data during training.Instead, we will take advantage of the existing underlying structure of the data to imposesome constraints on the problem.
We will begin by describing the existing structure of the WSM Corpus, to motivate oursolutions. After that, we move on to introduce the MIL frameworks, as well as its generalizedversion, θ-MIL, proposed in previous works [120]. Additionally, we proposed two solutions forthe θ-MIL problem, the first based on SVMs, and the second on NNs. The solution based onSVMs is detailed in this Section, and the one based on NNs, in Section 5.4. Finally, we usethe NN-based solution for θ-MIL to annotate the WSM Corpus v.2, and report the obtainedresults in Section 5.5.
The SVM based solution for the θ-MIL problem was tested in the context of inferring thepolarity of written movie reviews, where the bags were considered to be the sets of reviews
66
for a given movie, and the bag labels were the binarized score of the movie. The task was toidentify which reviews were positive or negative without access to any information, otherthan the movie scores (the bag labels) and the reviews for each movie (the instances, andtheir bag assignment). However, since this task is not directly relevant to the scope of thisthesis, but the technical details are, we opted to describe them in the body of this document,and relay the experimental results to the Appendix B, where we experimentally confirm theusefulness of the proposed technique.
5.3.1 Underlying structure of the WSM Corpus
The videos of the WSM Corpus, as explained in Chapter 4, were pre-selected with eitherrelevant or irrelevant queries to the target SA disease. For example, in the case of depression,the candidate videos were selected by querying the YouTube API for the relevant query“depression vlog”, along with a time window. This process was repeated for several timewindows. As a result, we obtained, for each combination of query and time window, a set ofup to 50 videos, that are the top ranking results, within the given time windows, accordingto YouTube’s recommendation algorithm. Intuitively, we can expect that the retrieved videosare either related to the concepts of “depression”, “vlog”, or both. However, while all thevideos may relate to these concepts, not all of them verify the conditions to be a targetvideo in the WSM Corpus. We recall that in order for a video to be included as a targetvideo of the depression dataset of the WSM Corpus, it must contain a subject self-reportingas currently suffering from depression. From prior experiments, and also according to thesmall annotation task reported in 4.2, we know that about one third of the results fromthe query “depression vlog” consist of target videos for depression. The remaining videoscontain subjects that are, for example, caregivers, partners, or other family members ofpeople suffering from depression; people who have suffered from depression in the past, butnot currently; medical specialists discussing some aspect of depression; or other videos.
Conversely, when querying the YouTube API for terms unrelated to the target SA disease,such as “vlog” of “book review”, and a time window, it is reasonable to expect that eithervery few, or none, of the retrieved videos contain a positive self-reported health status forthat target disease.
We illustrate, in Figure 5.2, how the results of the sets of results are organized based onqueries.
67
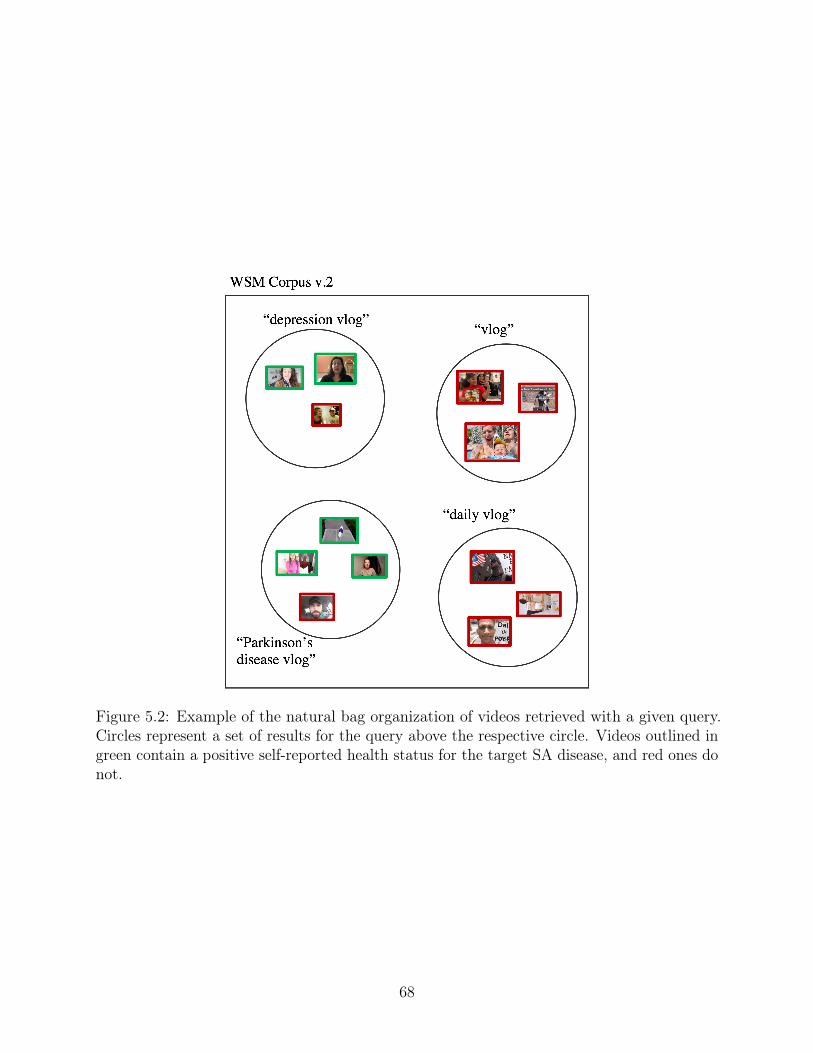
Figure 5.2: Example of the natural bag organization of videos retrieved with a given query.Circles represent a set of results for the query above the respective circle. Videos outlined ingreen contain a positive self-reported health status for the target SA disease, and red ones donot.
68
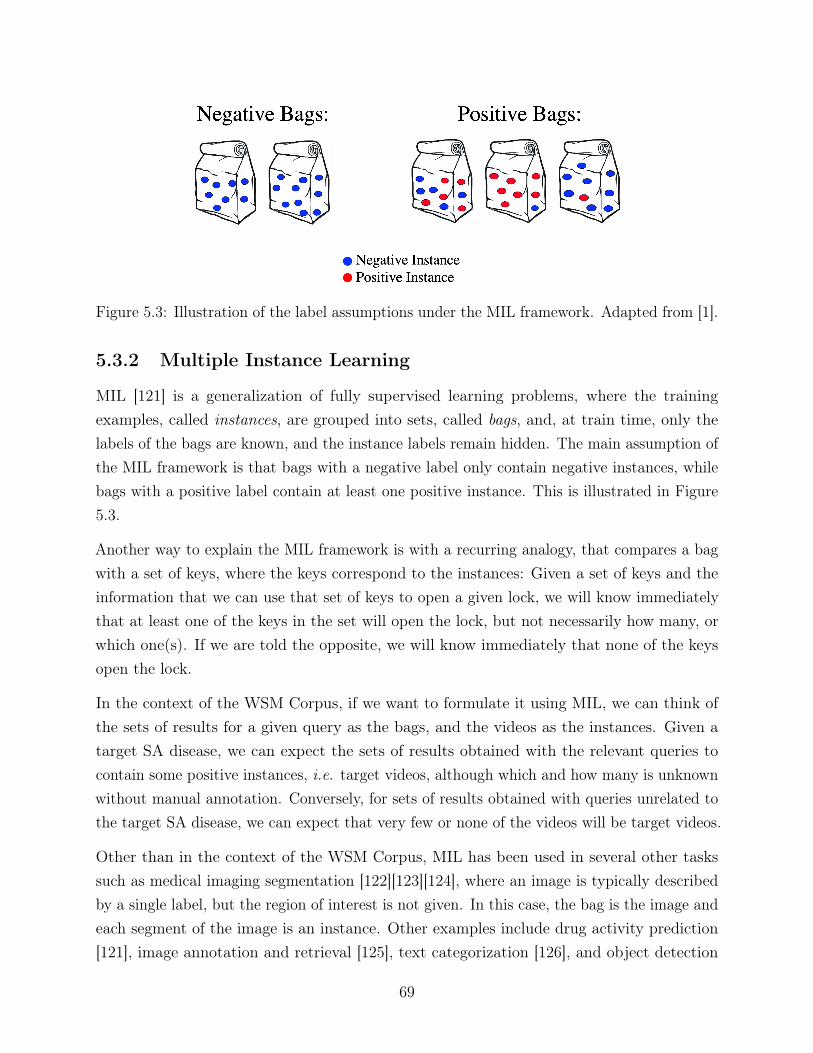
Figure 5.3: Illustration of the label assumptions under the MIL framework. Adapted from [1].
5.3.2 Multiple Instance Learning
MIL [121] is a generalization of fully supervised learning problems, where the trainingexamples, called instances, are grouped into sets, called bags, and, at train time, only thelabels of the bags are known, and the instance labels remain hidden. The main assumption ofthe MIL framework is that bags with a negative label only contain negative instances, whilebags with a positive label contain at least one positive instance. This is illustrated in Figure5.3.
Another way to explain the MIL framework is with a recurring analogy, that compares a bagwith a set of keys, where the keys correspond to the instances: Given a set of keys and theinformation that we can use that set of keys to open a given lock, we will know immediatelythat at least one of the keys in the set will open the lock, but not necessarily how many, orwhich one(s). If we are told the opposite, we will know immediately that none of the keysopen the lock.
In the context of the WSM Corpus, if we want to formulate it using MIL, we can think ofthe sets of results for a given query as the bags, and the videos as the instances. Given atarget SA disease, we can expect the sets of results obtained with the relevant queries tocontain some positive instances, i.e. target videos, although which and how many is unknownwithout manual annotation. Conversely, for sets of results obtained with queries unrelated tothe target SA disease, we can expect that very few or none of the videos will be target videos.
Other than in the context of the WSM Corpus, MIL has been used in several other taskssuch as medical imaging segmentation [122][123][124], where an image is typically describedby a single label, but the region of interest is not given. In this case, the bag is the image andeach segment of the image is an instance. Other examples include drug activity prediction[121], image annotation and retrieval [125], text categorization [126], and object detection
69
[127], among others.
There are multiple approaches to address the MIL problem. Arguably, one of the early, mostpopular ones is [2]’s solution, based on SVMs, that describes two algorithms that formulatethe MIL problem as a maximum-margin problem. Then, this problem can be solved via mixedeither of two integer quadratic programs: mi-SVM and MI-SVM. Both will be explained infurhter detail in Section 5.3.4.
Other, more recent works have proposed solutions for the MIL problem via deep neuralnetworks, as is the case of the pioneering work of [128], and our own previous work [129].Others, such as [124], proposed a formulation for the MIL problem as learning the Bernoullidistribution of the bag labels, which is parametrized by a neural network with an attentionmechanism.
5.3.3 Intuition for generalizing the Multiple Instance Learning frame-
work
The MIL framework has its limitations. Arguably the most significant one is its sensitivity topositive instances, in the sense that even one positive instance in a bag is enough to flip thebag’s label. This can be an issue in certain domains where the labels can be noisy. Even inthe context of the WSM Corpus, there is no guarantee that negative bags will not containnegative instances, i.e., that queries unrelated to the target SA disease will not return videoswith positive self-reported health status ever. The solution to this limitation can be found bygeneralizing the MIL framework, such that the generalization allows the user to specify howmany instances, or which fraction of the instances in the bag, needs to be positive for the bagto be assigned a positive label. In this case, a bag would be positive if more than a fractionof the instances in the bag were positive, and negative otherwise, where this fraction couldbe determined either by the user or the problem’s intrinsic constraints. This is illustrated inFigure 5.4.
5.3.4 MIL formulated as a maximum margin problem
The main concepts of MIL have been explained from a high level perspective in the previousSection. We will now formalize it, and compare it to fully supervised learning. In the laterscenario, particularly in binary classification, it is necessary to have pairs of instances andlabels, (xi, yi) ∈ Rd → Y, generated independently from an unknown distribution, whereY = {−1, 1}, as an example. In the MIL scenario, this problem is generalized by the ambiguityin the labeling of the instances. Instances, x1, ...,xn, are grouped into bags, B1, ...,Bm, with
70
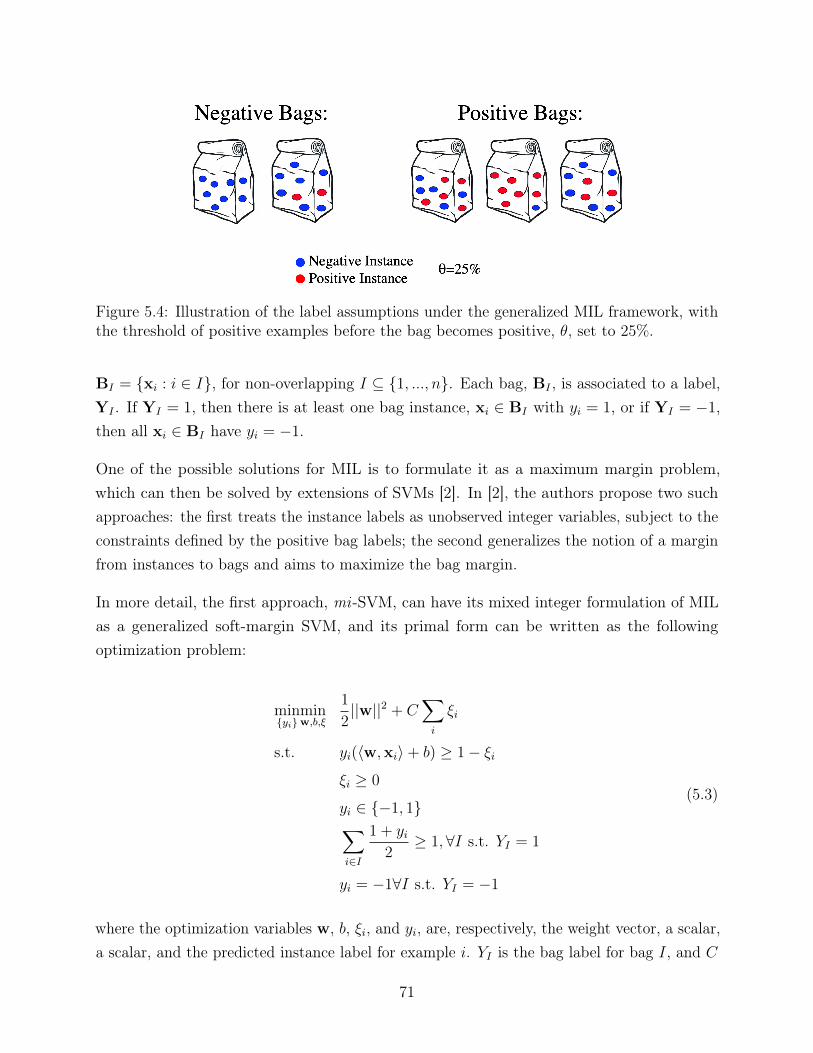
Figure 5.4: Illustration of the label assumptions under the generalized MIL framework, withthe threshold of positive examples before the bag becomes positive, θ, set to 25%.
BI = {xi : i ∈ I}, for non-overlapping I ⊆ {1, ..., n}. Each bag, BI , is associated to a label,YI . If YI = 1, then there is at least one bag instance, xi ∈ BI with yi = 1, or if YI = −1,then all xi ∈ BI have yi = −1.
One of the possible solutions for MIL is to formulate it as a maximum margin problem,which can then be solved by extensions of SVMs [2]. In [2], the authors propose two suchapproaches: the first treats the instance labels as unobserved integer variables, subject to theconstraints defined by the positive bag labels; the second generalizes the notion of a marginfrom instances to bags and aims to maximize the bag margin.
In more detail, the first approach, mi -SVM, can have its mixed integer formulation of MILas a generalized soft-margin SVM, and its primal form can be written as the followingoptimization problem:
min{yi}
minw,b,ξ
1
2||w||2 + C
∑i
ξi
s.t. yi(〈w,xi〉+ b) ≥ 1− ξiξi ≥ 0
yi ∈ {−1, 1}∑i∈I
1 + yi2≥ 1,∀I s.t. YI = 1
yi = −1∀I s.t. YI = −1
(5.3)
where the optimization variables w, b, ξi, and yi, are, respectively, the weight vector, a scalar,a scalar, and the predicted instance label for example i. YI is the bag label for bag I, and C
71

is a hyperparameter.
The second approach, MI -SVM, is formulated as a quadratic mixed integer problem, asfollows:
mins
minw,b,ξ
1
2||w||2 + C
∑I
ξI
s.t.
∀I : YI = −1 ∧ −〈w,xi〉 − b ≥ 1− ξIor YI = 1 ∧ 〈w,xs(I)〉+ b ≥ 1− ξIξI ≥ 0
(5.4)
where the optimization variables w, b, ξ, and s, are, respectively, the weight vector, a scalar,a scalar, and the instance selector. YI is the bag label for bag I. Note that s(I) acts as aselector among the instances of a bag. It will be active for one instance in each positive bag.C is a hyperparameter.
In this case, the positive bag margin is defined by the margin of the “most positive” instance.
The difference between the two approaches is essentially that in MI-SVM, the negativeinstances of the positive bags are ignored, and at the same time, only one instance perpositive bag contributes to the optimization problem. On the other hand, in mi-SVM,negative instances in positive bags, as well as one or more positive instances from a positivebag can be support vectors. This is illustrated in an example in Figure 5.5.
5.3.5 θ-MIL
In order to generalize the MIL framework, we can view it as a particular case of a moregeneric problem. An alternative for the assumptions regarding bag and instance organizationwould be to associate to each bag, BI , a label YI , given by:
YI = sign(
∑i(yi : i ∈ I + 1)
2|I|+ θ), (5.5)
where θ ∈ [0, 1] is the minimum fraction of instances in the bag that has to be positive. Thatis, in this generalized version of MIL, θ-MIL, the label of a bag is positive if more than afraction θ of the instances in that bag are positive, otherwise the bag is negative. This hasbeen illustrated before in Figure 5.4. To reduce θ-MIL to the traditional MIL framework,one has simply to make θ = 0.
72
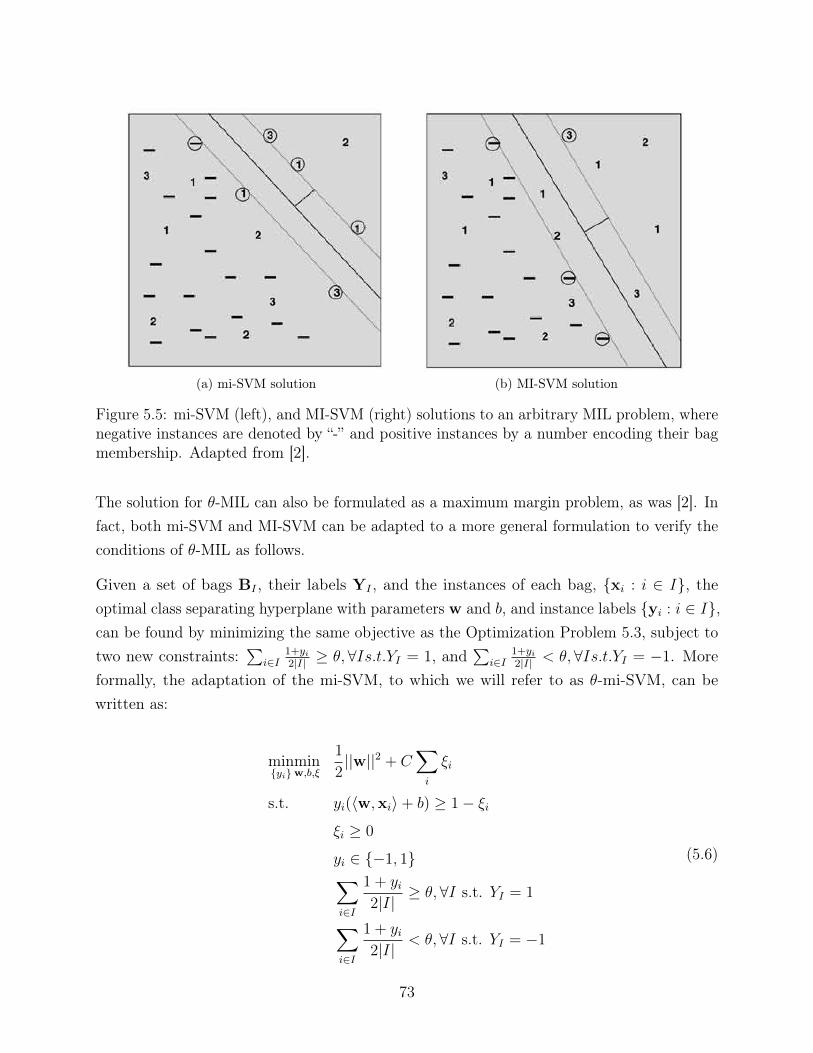
(a) mi-SVM solution (b) MI-SVM solution
Figure 5.5: mi-SVM (left), and MI-SVM (right) solutions to an arbitrary MIL problem, wherenegative instances are denoted by “-” and positive instances by a number encoding their bagmembership. Adapted from [2].
The solution for θ-MIL can also be formulated as a maximum margin problem, as was [2]. Infact, both mi-SVM and MI-SVM can be adapted to a more general formulation to verify theconditions of θ-MIL as follows.
Given a set of bags BI , their labels YI , and the instances of each bag, {xi : i ∈ I}, theoptimal class separating hyperplane with parameters w and b, and instance labels {yi : i ∈ I},can be found by minimizing the same objective as the Optimization Problem 5.3, subject totwo new constraints:
∑i∈I
1+yi2|I| ≥ θ, ∀Is.t.YI = 1, and
∑i∈I
1+yi2|I| < θ, ∀Is.t.YI = −1. More
formally, the adaptation of the mi-SVM, to which we will refer to as θ-mi-SVM, can bewritten as:
min{yi}
minw,b,ξ
1
2||w||2 + C
∑i
ξi
s.t. yi(〈w,xi〉+ b) ≥ 1− ξiξi ≥ 0
yi ∈ {−1, 1}∑i∈I
1 + yi2|I|
≥ θ, ∀I s.t. YI = 1
∑i∈I
1 + yi2|I|
< θ,∀I s.t. YI = −1
(5.6)
73
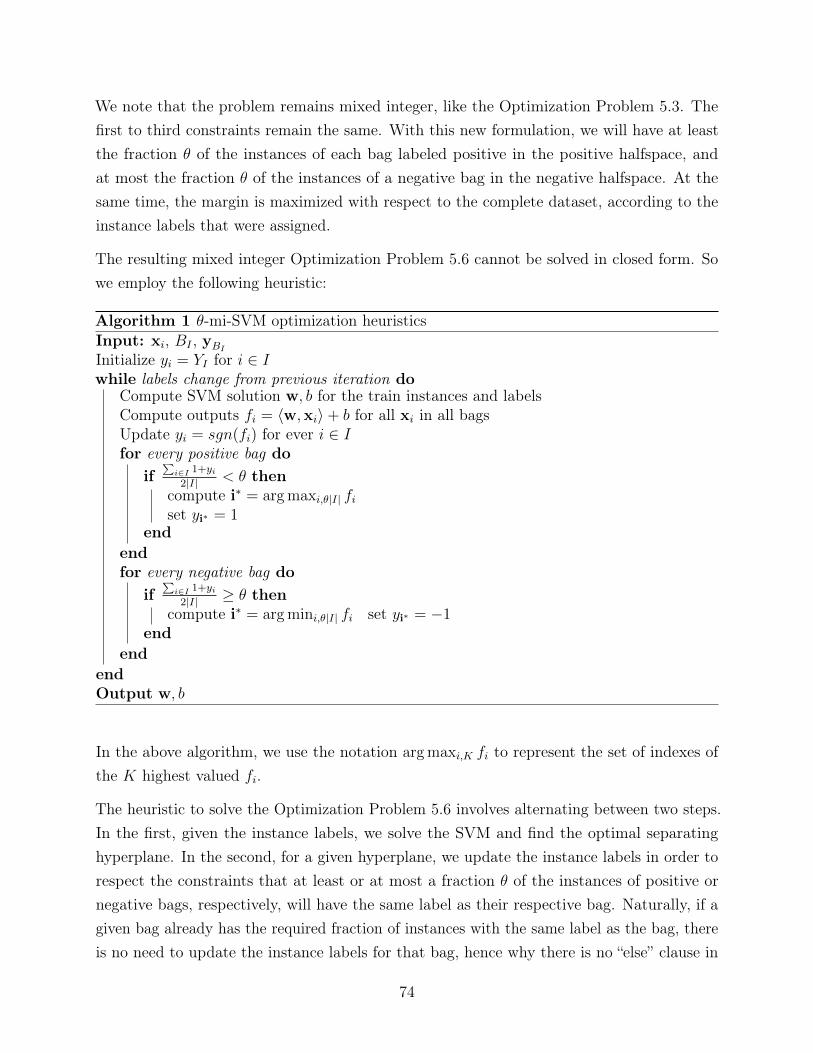
We note that the problem remains mixed integer, like the Optimization Problem 5.3. Thefirst to third constraints remain the same. With this new formulation, we will have at leastthe fraction θ of the instances of each bag labeled positive in the positive halfspace, andat most the fraction θ of the instances of a negative bag in the negative halfspace. At thesame time, the margin is maximized with respect to the complete dataset, according to theinstance labels that were assigned.
The resulting mixed integer Optimization Problem 5.6 cannot be solved in closed form. Sowe employ the following heuristic:
Algorithm 1 θ-mi-SVM optimization heuristicsInput: xi, BI , yBIInitialize yi = YI for i ∈ Iwhile labels change from previous iteration do
Compute SVM solution w, b for the train instances and labelsCompute outputs fi = 〈w,xi〉+ b for all xi in all bagsUpdate yi = sgn(fi) for ever i ∈ Ifor every positive bag do
if∑i∈I 1+yi2|I| < θ then
compute i∗ = arg maxi,θ|I| fiset yi∗ = 1
endendfor every negative bag do
if∑i∈I 1+yi2|I| ≥ θ then
compute i∗ = arg mini,θ|I| fi set yi∗ = −1end
endendOutput w, b
In the above algorithm, we use the notation arg maxi,K fi to represent the set of indexes ofthe K highest valued fi.
The heuristic to solve the Optimization Problem 5.6 involves alternating between two steps.In the first, given the instance labels, we solve the SVM and find the optimal separatinghyperplane. In the second, for a given hyperplane, we update the instance labels in order torespect the constraints that at least or at most a fraction θ of the instances of positive ornegative bags, respectively, will have the same label as their respective bag. Naturally, if agiven bag already has the required fraction of instances with the same label as the bag, thereis no need to update the instance labels for that bag, hence why there is no “else” clause in
74

Algorithm 1.
Secondly, we propose an adaptation of the MI-SVM, to which we will refer to as θ-MI-SVM tosolve the θ-MIL problem using a maximum margin formulation again. In this case, the goal isto extend the notion of a margin from instance level to the bag level. As such, we define thefunctional margin of a bag with respect to only the instances with the same predicted labelas the bag. So for the positive margin, the optimization problem uses the “most positive”instances and for the negative margin it uses the “most negative” instances, such that eachpositive and negative bag have at least or at most a fraction θ, of the instances being selectedas key witnesses, respectively. The new optimization problem can be written as follows:
mins
minw,b,ξ
1
2||w||2 + C
∑I
ξI
s.t.
∀I : YI = 1 ∧ (〈w,xs(I)〉+ b) ≥ 1− ξi ∧ |s(I)| ≥ θ|I|
or YI = −1 ∧ (−〈w,xs(I)〉 − b) ≥ 1− ξi ∧ |s(I)| ≤ θ|I|
ξi ≥ 0
(5.7)
where the optimization variables w, b, ξ, and s are the weights vector, a scalar, a scalar,and the instance selector respectively. Note that s(I) selects a fraction of the instances ofthe bag, an not just one, unlike in the Optimization Problem 5.4. Furthermore, since themargins are defined by the instances which have a label that matches their respective bag,this approach ignores the remaining instances within each bag. They are not contemplatedin the optimization problem, contrary to the case of θ-mi-SVM.
There can be many initializations of the labels, however [2] recommends initializing theinstance labels with the corresponding bag label.
This new problem, as in the MI-SVM formulation, is a mixed integer problem, without aneasy solution. Therefore, we use the heuristic shown in Algorithm 2 to solve it iteratively.
75
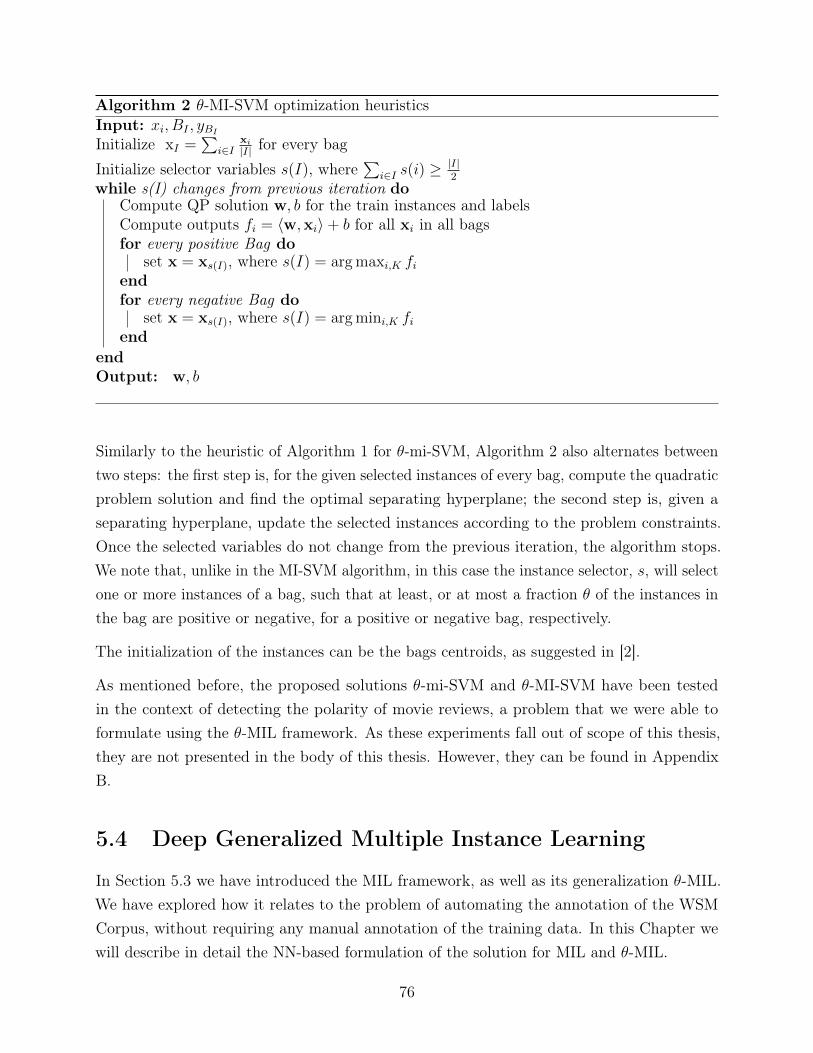
Algorithm 2 θ-MI-SVM optimization heuristicsInput: xi, BI , yBIInitialize xI =
∑i∈I
xi|I| for every bag
Initialize selector variables s(I), where∑
i∈I s(i) ≥|I|2
while s(I) changes from previous iteration doCompute QP solution w, b for the train instances and labelsCompute outputs fi = 〈w,xi〉+ b for all xi in all bagsfor every positive Bag do
set x = xs(I), where s(I) = arg maxi,K fiendfor every negative Bag do
set x = xs(I), where s(I) = arg mini,K fiend
endOutput: w, b
Similarly to the heuristic of Algorithm 1 for θ-mi-SVM, Algorithm 2 also alternates betweentwo steps: the first step is, for the given selected instances of every bag, compute the quadraticproblem solution and find the optimal separating hyperplane; the second step is, given aseparating hyperplane, update the selected instances according to the problem constraints.Once the selected variables do not change from the previous iteration, the algorithm stops.We note that, unlike in the MI-SVM algorithm, in this case the instance selector, s, will selectone or more instances of a bag, such that at least, or at most a fraction θ of the instances inthe bag are positive or negative, for a positive or negative bag, respectively.
The initialization of the instances can be the bags centroids, as suggested in [2].
As mentioned before, the proposed solutions θ-mi-SVM and θ-MI-SVM have been testedin the context of detecting the polarity of movie reviews, a problem that we were able toformulate using the θ-MIL framework. As these experiments fall out of scope of this thesis,they are not presented in the body of this thesis. However, they can be found in AppendixB.
5.4 Deep Generalized Multiple Instance Learning
In Section 5.3 we have introduced the MIL framework, as well as its generalization θ-MIL.We have explored how it relates to the problem of automating the annotation of the WSMCorpus, without requiring any manual annotation of the training data. In this Chapter wewill describe in detail the NN-based formulation of the solution for MIL and θ-MIL.
76
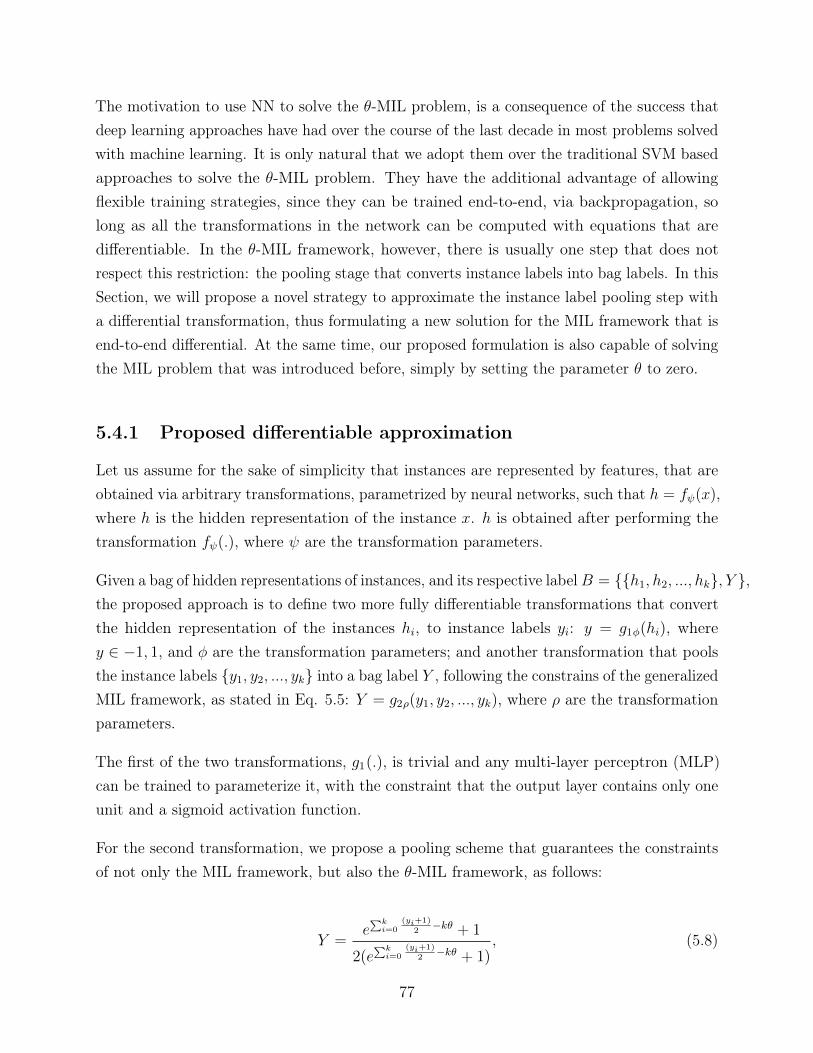
The motivation to use NN to solve the θ-MIL problem, is a consequence of the success thatdeep learning approaches have had over the course of the last decade in most problems solvedwith machine learning. It is only natural that we adopt them over the traditional SVM basedapproaches to solve the θ-MIL problem. They have the additional advantage of allowingflexible training strategies, since they can be trained end-to-end, via backpropagation, solong as all the transformations in the network can be computed with equations that aredifferentiable. In the θ-MIL framework, however, there is usually one step that does notrespect this restriction: the pooling stage that converts instance labels into bag labels. In thisSection, we will propose a novel strategy to approximate the instance label pooling step witha differential transformation, thus formulating a new solution for the MIL framework that isend-to-end differential. At the same time, our proposed formulation is also capable of solvingthe MIL problem that was introduced before, simply by setting the parameter θ to zero.
5.4.1 Proposed differentiable approximation
Let us assume for the sake of simplicity that instances are represented by features, that areobtained via arbitrary transformations, parametrized by neural networks, such that h = fψ(x),where h is the hidden representation of the instance x. h is obtained after performing thetransformation fψ(.), where ψ are the transformation parameters.
Given a bag of hidden representations of instances, and its respective labelB = {{h1, h2, ..., hk}, Y },the proposed approach is to define two more fully differentiable transformations that convertthe hidden representation of the instances hi, to instance labels yi: y = g1φ(hi), wherey ∈ −1, 1, and φ are the transformation parameters; and another transformation that poolsthe instance labels {y1, y2, ..., yk} into a bag label Y , following the constrains of the generalizedMIL framework, as stated in Eq. 5.5: Y = g2ρ(y1, y2, ..., yk), where ρ are the transformationparameters.
The first of the two transformations, g1(.), is trivial and any multi-layer perceptron (MLP)can be trained to parameterize it, with the constraint that the output layer contains only oneunit and a sigmoid activation function.
For the second transformation, we propose a pooling scheme that guarantees the constraintsof not only the MIL framework, but also the θ-MIL framework, as follows:
Y =e∑ki=0
(yi+1)
2−kθ + 1
2(e∑ki=0
(yi+1)
2−kθ + 1)
, (5.8)
77
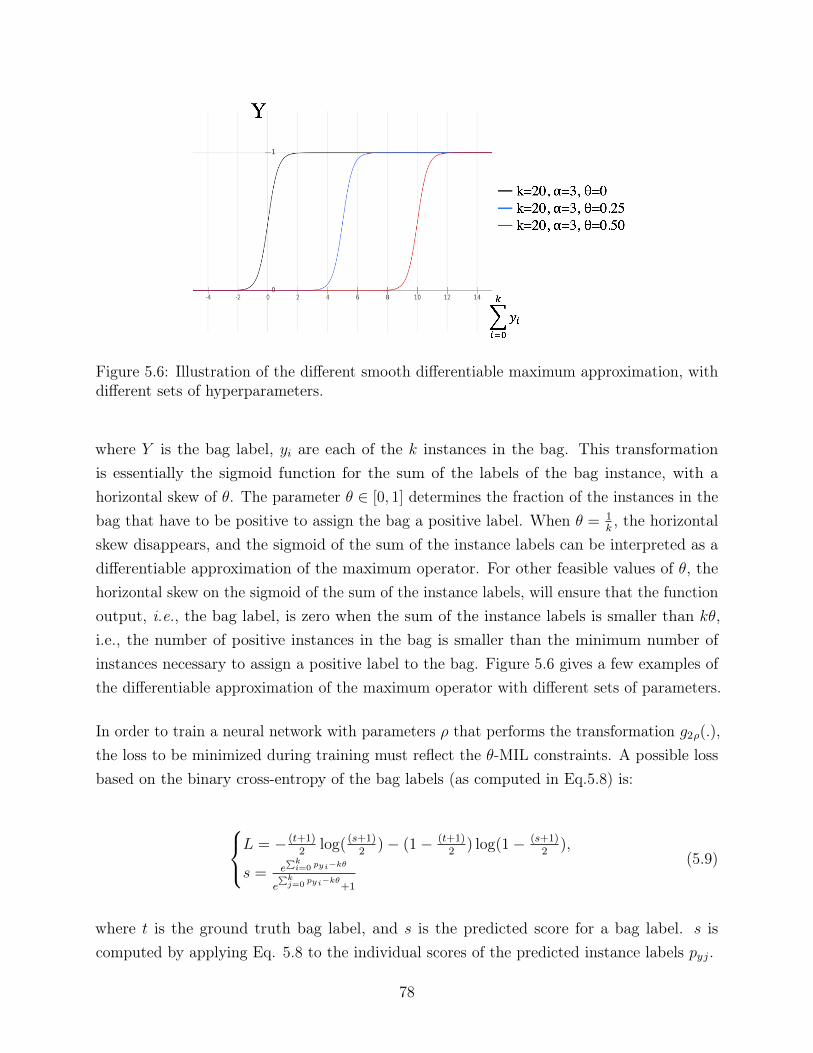
Figure 5.6: Illustration of the different smooth differentiable maximum approximation, withdifferent sets of hyperparameters.
where Y is the bag label, yi are each of the k instances in the bag. This transformationis essentially the sigmoid function for the sum of the labels of the bag instance, with ahorizontal skew of θ. The parameter θ ∈ [0, 1] determines the fraction of the instances in thebag that have to be positive to assign the bag a positive label. When θ = 1
k, the horizontal
skew disappears, and the sigmoid of the sum of the instance labels can be interpreted as adifferentiable approximation of the maximum operator. For other feasible values of θ, thehorizontal skew on the sigmoid of the sum of the instance labels, will ensure that the functionoutput, i.e., the bag label, is zero when the sum of the instance labels is smaller than kθ,i.e., the number of positive instances in the bag is smaller than the minimum number ofinstances necessary to assign a positive label to the bag. Figure 5.6 gives a few examples ofthe differentiable approximation of the maximum operator with different sets of parameters.
In order to train a neural network with parameters ρ that performs the transformation g2ρ(.),the loss to be minimized during training must reflect the θ-MIL constraints. A possible lossbased on the binary cross-entropy of the bag labels (as computed in Eq.5.8) is:
L = − (t+1)2
log( (s+1)2
)− (1− (t+1)2
) log(1− (s+1)2
),
s = e∑ki=0 pyi−kθ
e∑kj=0
pyi−kθ+1
(5.9)
where t is the ground truth bag label, and s is the predicted score for a bag label. s iscomputed by applying Eq. 5.8 to the individual scores of the predicted instance labels pyj.
78
5.5 Application of Deep θ-MIL for the automatic anno-
tation of the WSM Corpus
In this Section, we test the proposed deep θ-MIL solution introduced in Section 5.4 andpublished in [129] to automatically label the videos of the WSM Corpus v.2, which has beendescribed in detail in Section 4.3, featuring subjects possibly affected by depression and PD,and using only semantic and metadata information.
As a reminder, we take advantage of the existing structure on the WSM Corpus, where thevideos are associated to the search term that was used to retrieve them, as well as a timewindow for the upload date. Therefore, in this context, a bag is the set of search resultsobtained for a given search term and time window, and the instances are the retrieved videos.The bag labels are assigned according to whether the search term used to retrieve the set ofvideos is relevant or irrelevant for the target SA disease.
For example, in the context of the WSM Corpus, if the target disease is depression, and thesearch term is “depression vlog”, then we can assume that among the retrieved search resultsthere will be some that will be target videos, although it is impossible to know which oneswithout further analysis. This means that the set of these results form a positive bag.
Conversely, if the search term is not related to depression, such as just “vlog”, it is generallysafe to assume that among the search results there will be no target ones. Thus, this set ofresults would form a negative bag.
A more subtle case occurs when using search terms like “Parkinson lecture”. The results arestill related to PD, but from both common sense and empirical evidence, we know that theretrieved videos are very unlikely to contain target videos, i.e., videos of subjects that claimto be currently affected by PD, and are much more likely to contain healthy subjects, such asmedical doctors, therapists, researchers or journalists, describing some aspect of PD, mostlyfrom a third party perspective.
We argue that generating such negative bags creates a more interesting and nuanced problemthan simply generating negative bags of videos with content that is less related. Models thatare successfully trained with such data should be more useful in real life situations to detectsubjects affected by a target disease than if the control examples were completely unrelated.From a class separation perspective, our argument is that these negative examples are muchcloser to the true decision boundary between the two classes than unrelated ones, whichallows for a better estimation when training a model to learn it.
79
It is trivial to formulate this problem as either MIL and θ-MIL, by simply allowing for somepositive examples to be in negative bags, which is a reasonable assumption in the context ofthis problem. In fact, there is no guarantee that irrelevant queries, i.e. negative bags, willnot produce any positive instance. For generalization purposes, we will describe the followingexperimental setup and results assuming a θ-MIL formulation, which we can reduce to MILby setting the threshold θ to zero.
Before presenting the experiments and results of the previously proposed deep θ-MIL so-lution, we establish an upper bound for the performance that can be achieved on the taskof automatically labeling the WSM corpus using the chosen features, by training a fullysupervised model on the dataset with the manually obtained labels. After this, we comparethe performance of the fully supervised model to the performance obtained by a similarmodel but in a MIL scenario, where the instance labels are unavailable during training.We also study the contribution of different types features to the performance of the model,extracted from the transcription, title, description and comments from the video, which willbe described in detail below.
Finally we study the influence of the bag size in the performance of the models, and as asanity check, show that when bags are smaller, the MIL problem is easier to solve, and thatin the extreme case where the bag size is one, the problem is reduced to a fully supervisedlearning problem, since all the instance labels correspond to their respective bag label.
5.5.1 Dataset
This work used the WSM Corpus v.2 as described in Section 4.3. Each set of search resultswas retrieved by a pair of search term and time window, corresponds to one bag, and itssize is 50 videos. In the following experiments the data are organized as follows: both thedepression and the PD model use all the 550 videos available in the dataset, organized intobags of size 50. In the case of depression, all bags were assigned a negative label except thetwo that were retrieved with the search term “depression vlog”, which were assigned a positivelabel. For PD all the bags except the three retrieved with the search term “Parkinson’sdisease vlog” are assigned an negative label, and vice-versa.
5.5.2 Feature extraction
In regards to the information derived from the WSM Corpus v.2, we used exclusivelyinformation derived from the text-based components of the video. In particular, we used thetranscription of the video, the title, the description, and the top 5 comments.
80
Relatively to the feature extraction process used in this work, we adopted a process derivedfrom Bidirectional Encoder Representations from Transformers (BERT) [130], the Sentence-BERT (SBERT) [131], which we used to encode natural language cues.
For context, BERT was considered the state-of-the-art in encoding language representationsat the time of this work, and is based on bi-directional transformers. It is designed to generaterepresentations from unlabeled text by jointly conditioning on both its left and right context.However, it is not optimized for long sentences or even full text documents. SBERT, is amodification of the BERT network, using siamese and triplet networks, in order to derivemeaningful sentence embedding of fixed sized, for arbitrarily sized sentences, converting theminto feature vectors of 768 dimensions. With SBERT, the similarity between sentences canbe computed by any similarity measure such as cosine similarity.
As such we adopt a pre-trained version of SBERT that was first trained on Natural LanguageInference (NLI) data, then fine-tuned on AllNLI, and on the semantic text similarity (STS)benchmark training set, obtaining an STS score of 85.29, out of 100 possible points, asreported by the authors.
We use this pre-trained model to embed the three documents associated with a search result:1) the transcription of the video; 2) the title and description of the video provided by theuser; and 3) the top 5 comments on the video, sorted by popularity. Thus each search resultis characterized by three 768-dimensional vectors. We repeat this for the complete dataset of550 search results, which amounts to a total of 1650 embeddings.
Some of the videos did not have any comments. In such cases, a random 768-dimensionalvector was generated, which in practice represents a random sentence/document.
5.5.3 Fully supervised upper bound
As mentioned before, the WSM Corpus contains manual annotations. While it is not realisticto assume that these will be available in a real-life application, they are useful in this contextto perform a number of tasks, such as for evaluation purposes, for semi supervised learningtasks, etc.. In this case, we use the manual annotations of the WSM corpus to perform thefully supervised learning task of predicting the presence of subjects who claim to be currentlyaffected by two diseases, depression and PD, from SBERT embeddings of the transcription,title and description, and top 5 comments of YouTube videos. This experiment is usefulto determine what is the upper bound of the performance that could be obtained with amodel trained on the WSM corpus, if all the instance labels were available. In other words,by comparing the following results with the performance of a similar model in a (θ)-MIL
81
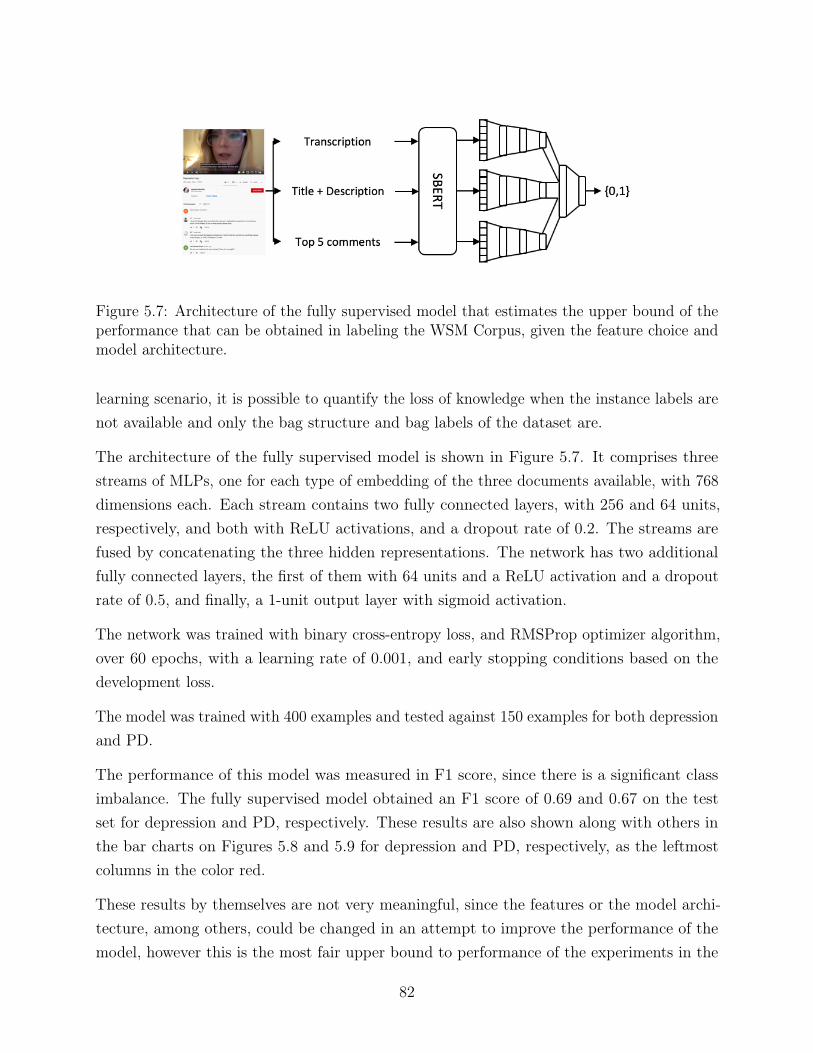
Figure 5.7: Architecture of the fully supervised model that estimates the upper bound of theperformance that can be obtained in labeling the WSM Corpus, given the feature choice andmodel architecture.
learning scenario, it is possible to quantify the loss of knowledge when the instance labels arenot available and only the bag structure and bag labels of the dataset are.
The architecture of the fully supervised model is shown in Figure 5.7. It comprises threestreams of MLPs, one for each type of embedding of the three documents available, with 768dimensions each. Each stream contains two fully connected layers, with 256 and 64 units,respectively, and both with ReLU activations, and a dropout rate of 0.2. The streams arefused by concatenating the three hidden representations. The network has two additionalfully connected layers, the first of them with 64 units and a ReLU activation and a dropoutrate of 0.5, and finally, a 1-unit output layer with sigmoid activation.
The network was trained with binary cross-entropy loss, and RMSProp optimizer algorithm,over 60 epochs, with a learning rate of 0.001, and early stopping conditions based on thedevelopment loss.
The model was trained with 400 examples and tested against 150 examples for both depressionand PD.
The performance of this model was measured in F1 score, since there is a significant classimbalance. The fully supervised model obtained an F1 score of 0.69 and 0.67 on the testset for depression and PD, respectively. These results are also shown along with others inthe bar charts on Figures 5.8 and 5.9 for depression and PD, respectively, as the leftmostcolumns in the color red.
These results by themselves are not very meaningful, since the features or the model archi-tecture, among others, could be changed in an attempt to improve the performance of themodel, however this is the most fair upper bound to performance of the experiments in the
82
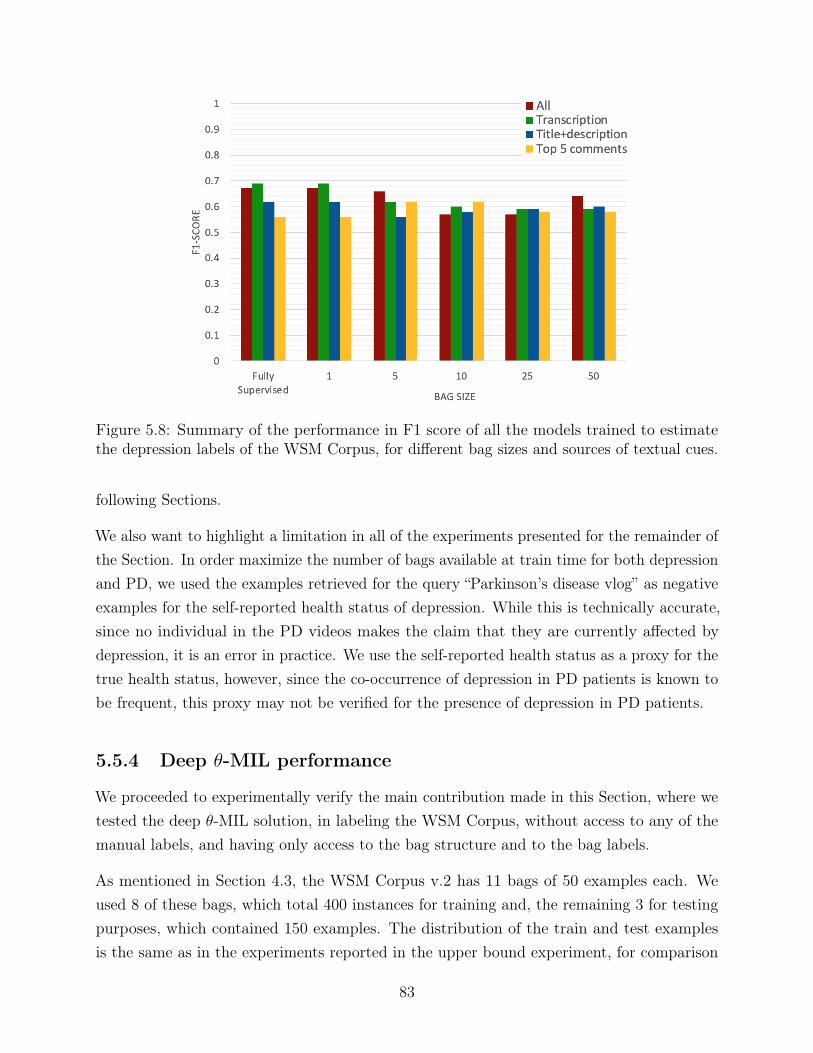
Figure 5.8: Summary of the performance in F1 score of all the models trained to estimatethe depression labels of the WSM Corpus, for different bag sizes and sources of textual cues.
following Sections.
We also want to highlight a limitation in all of the experiments presented for the remainder ofthe Section. In order maximize the number of bags available at train time for both depressionand PD, we used the examples retrieved for the query “Parkinson’s disease vlog” as negativeexamples for the self-reported health status of depression. While this is technically accurate,since no individual in the PD videos makes the claim that they are currently affected bydepression, it is an error in practice. We use the self-reported health status as a proxy for thetrue health status, however, since the co-occurrence of depression in PD patients is known tobe frequent, this proxy may not be verified for the presence of depression in PD patients.
5.5.4 Deep θ-MIL performance
We proceeded to experimentally verify the main contribution made in this Section, where wetested the deep θ-MIL solution, in labeling the WSM Corpus, without access to any of themanual labels, and having only access to the bag structure and to the bag labels.
As mentioned in Section 4.3, the WSM Corpus v.2 has 11 bags of 50 examples each. Weused 8 of these bags, which total 400 instances for training and, the remaining 3 for testingpurposes, which contained 150 examples. The distribution of the train and test examplesis the same as in the experiments reported in the upper bound experiment, for comparison
83
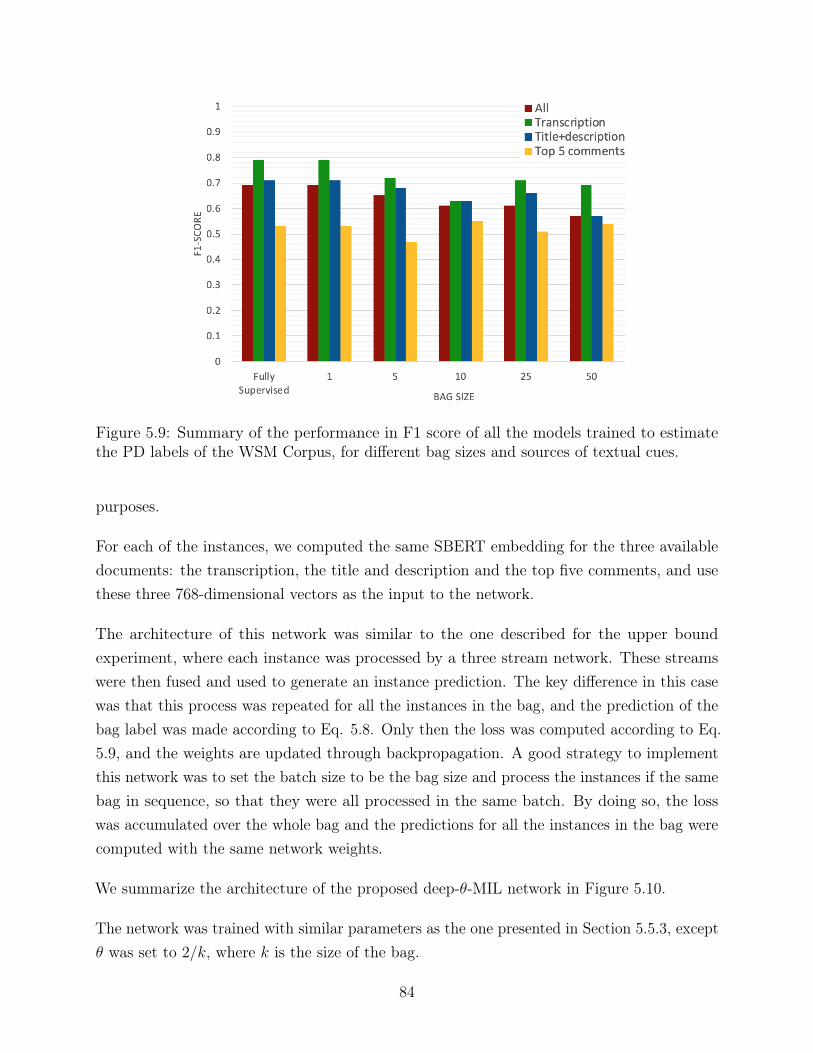
Figure 5.9: Summary of the performance in F1 score of all the models trained to estimatethe PD labels of the WSM Corpus, for different bag sizes and sources of textual cues.
purposes.
For each of the instances, we computed the same SBERT embedding for the three availabledocuments: the transcription, the title and description and the top five comments, and usethese three 768-dimensional vectors as the input to the network.
The architecture of this network was similar to the one described for the upper boundexperiment, where each instance was processed by a three stream network. These streamswere then fused and used to generate an instance prediction. The key difference in this casewas that this process was repeated for all the instances in the bag, and the prediction of thebag label was made according to Eq. 5.8. Only then the loss was computed according to Eq.5.9, and the weights are updated through backpropagation. A good strategy to implementthis network was to set the batch size to be the bag size and process the instances if the samebag in sequence, so that they were all processed in the same batch. By doing so, the losswas accumulated over the whole bag and the predictions for all the instances in the bag werecomputed with the same network weights.
We summarize the architecture of the proposed deep-θ-MIL network in Figure 5.10.
The network was trained with similar parameters as the one presented in Section 5.5.3, exceptθ was set to 2/k, where k is the size of the bag.
84
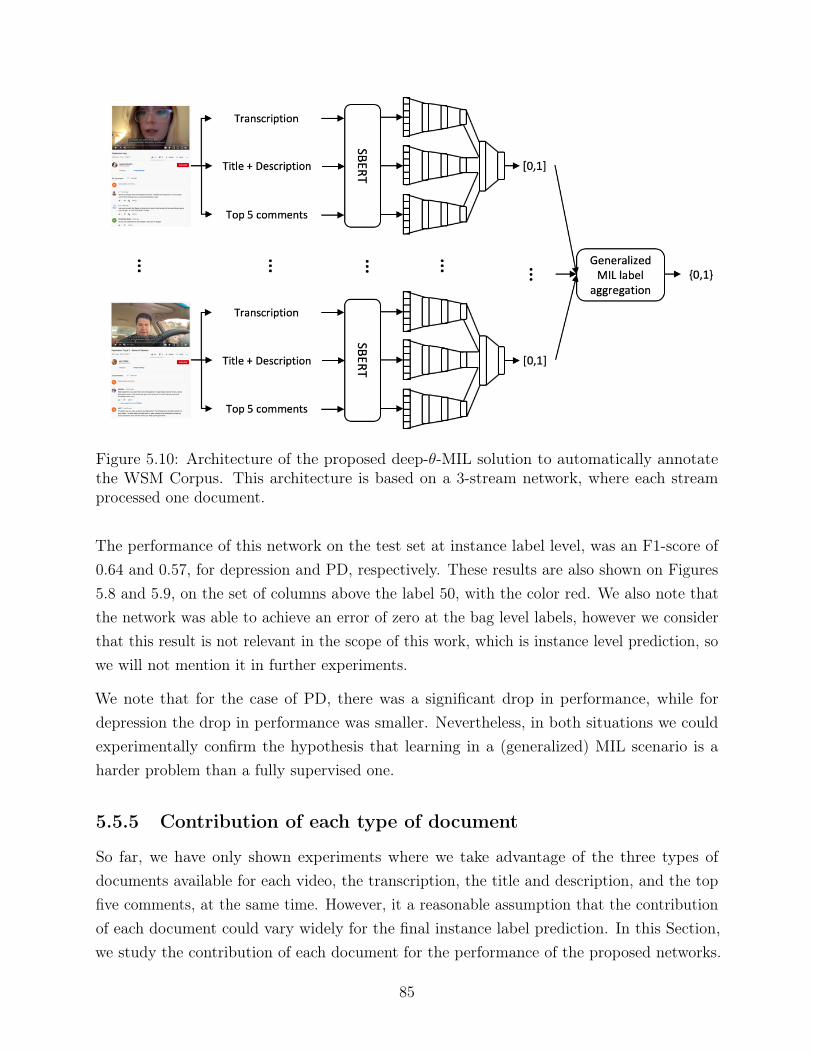
Figure 5.10: Architecture of the proposed deep-θ-MIL solution to automatically annotatethe WSM Corpus. This architecture is based on a 3-stream network, where each streamprocessed one document.
The performance of this network on the test set at instance label level, was an F1-score of0.64 and 0.57, for depression and PD, respectively. These results are also shown on Figures5.8 and 5.9, on the set of columns above the label 50, with the color red. We also note thatthe network was able to achieve an error of zero at the bag level labels, however we considerthat this result is not relevant in the scope of this work, which is instance level prediction, sowe will not mention it in further experiments.
We note that for the case of PD, there was a significant drop in performance, while fordepression the drop in performance was smaller. Nevertheless, in both situations we couldexperimentally confirm the hypothesis that learning in a (generalized) MIL scenario is aharder problem than a fully supervised one.
5.5.5 Contribution of each type of document
So far, we have only shown experiments where we take advantage of the three types ofdocuments available for each video, the transcription, the title and description, and the topfive comments, at the same time. However, it a reasonable assumption that the contributionof each document could vary widely for the final instance label prediction. In this Section,we study the contribution of each document for the performance of the proposed networks.
85
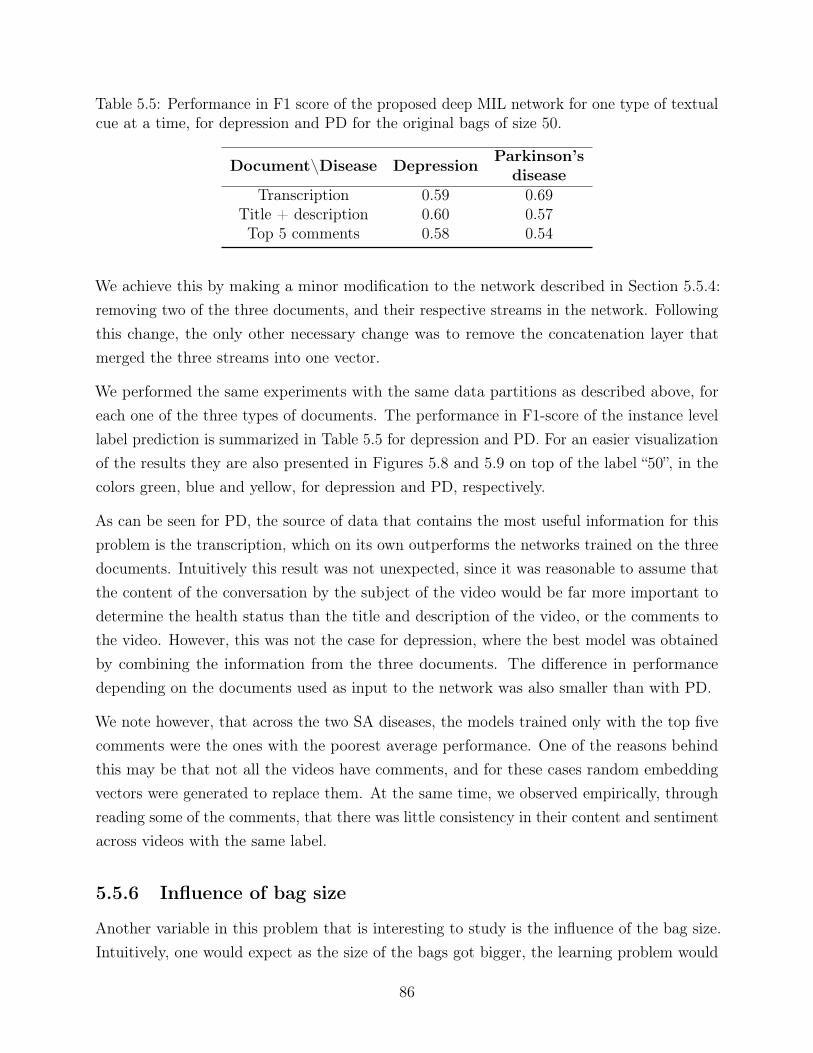
Table 5.5: Performance in F1 score of the proposed deep MIL network for one type of textualcue at a time, for depression and PD for the original bags of size 50.
Document\Disease Depression Parkinson’sdisease
Transcription 0.59 0.69Title + description 0.60 0.57Top 5 comments 0.58 0.54
We achieve this by making a minor modification to the network described in Section 5.5.4:removing two of the three documents, and their respective streams in the network. Followingthis change, the only other necessary change was to remove the concatenation layer thatmerged the three streams into one vector.
We performed the same experiments with the same data partitions as described above, foreach one of the three types of documents. The performance in F1-score of the instance levellabel prediction is summarized in Table 5.5 for depression and PD. For an easier visualizationof the results they are also presented in Figures 5.8 and 5.9 on top of the label “50”, in thecolors green, blue and yellow, for depression and PD, respectively.
As can be seen for PD, the source of data that contains the most useful information for thisproblem is the transcription, which on its own outperforms the networks trained on the threedocuments. Intuitively this result was not unexpected, since it was reasonable to assume thatthe content of the conversation by the subject of the video would be far more important todetermine the health status than the title and description of the video, or the comments tothe video. However, this was not the case for depression, where the best model was obtainedby combining the information from the three documents. The difference in performancedepending on the documents used as input to the network was also smaller than with PD.
We note however, that across the two SA diseases, the models trained only with the top fivecomments were the ones with the poorest average performance. One of the reasons behindthis may be that not all the videos have comments, and for these cases random embeddingvectors were generated to replace them. At the same time, we observed empirically, throughreading some of the comments, that there was little consistency in their content and sentimentacross videos with the same label.
5.5.6 Influence of bag size
Another variable in this problem that is interesting to study is the influence of the bag size.Intuitively, one would expect as the size of the bags got bigger, the learning problem would
86
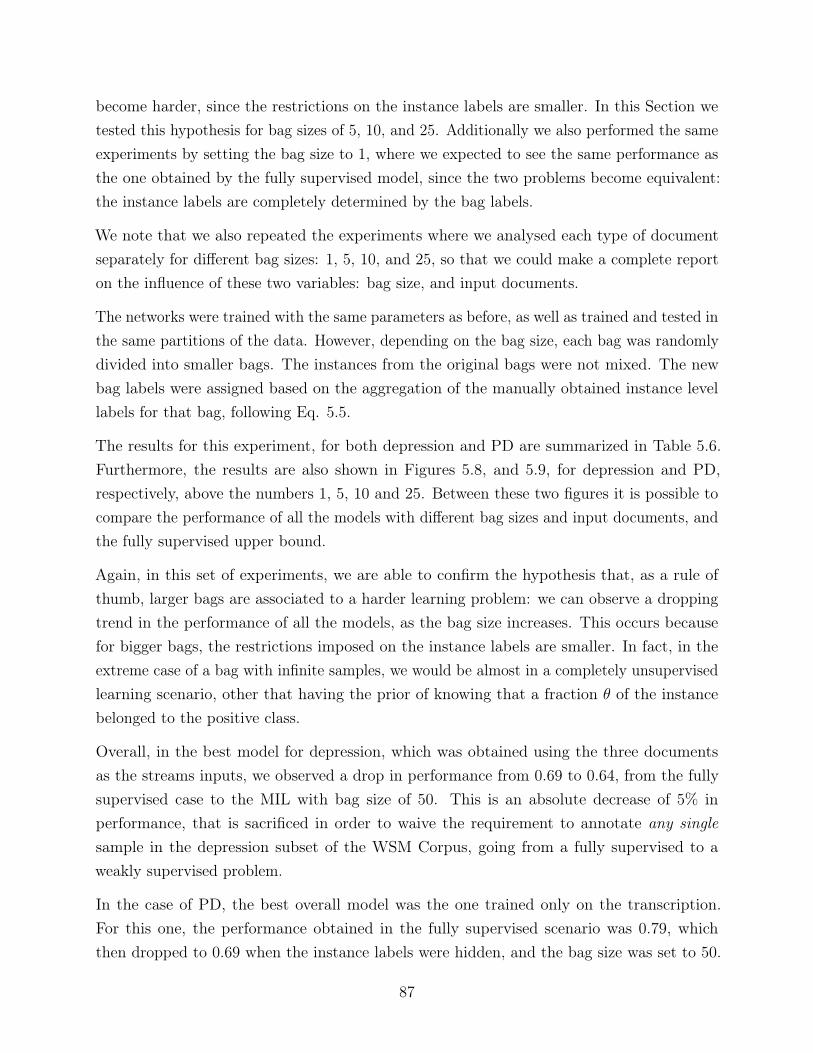
become harder, since the restrictions on the instance labels are smaller. In this Section wetested this hypothesis for bag sizes of 5, 10, and 25. Additionally we also performed the sameexperiments by setting the bag size to 1, where we expected to see the same performance asthe one obtained by the fully supervised model, since the two problems become equivalent:the instance labels are completely determined by the bag labels.
We note that we also repeated the experiments where we analysed each type of documentseparately for different bag sizes: 1, 5, 10, and 25, so that we could make a complete reporton the influence of these two variables: bag size, and input documents.
The networks were trained with the same parameters as before, as well as trained and tested inthe same partitions of the data. However, depending on the bag size, each bag was randomlydivided into smaller bags. The instances from the original bags were not mixed. The newbag labels were assigned based on the aggregation of the manually obtained instance levellabels for that bag, following Eq. 5.5.
The results for this experiment, for both depression and PD are summarized in Table 5.6.Furthermore, the results are also shown in Figures 5.8, and 5.9, for depression and PD,respectively, above the numbers 1, 5, 10 and 25. Between these two figures it is possible tocompare the performance of all the models with different bag sizes and input documents, andthe fully supervised upper bound.
Again, in this set of experiments, we are able to confirm the hypothesis that, as a rule ofthumb, larger bags are associated to a harder learning problem: we can observe a droppingtrend in the performance of all the models, as the bag size increases. This occurs becausefor bigger bags, the restrictions imposed on the instance labels are smaller. In fact, in theextreme case of a bag with infinite samples, we would be almost in a completely unsupervisedlearning scenario, other that having the prior of knowing that a fraction θ of the instancebelonged to the positive class.
Overall, in the best model for depression, which was obtained using the three documentsas the streams inputs, we observed a drop in performance from 0.69 to 0.64, from the fullysupervised case to the MIL with bag size of 50. This is an absolute decrease of 5% inperformance, that is sacrificed in order to waive the requirement to annotate any singlesample in the depression subset of the WSM Corpus, going from a fully supervised to aweakly supervised problem.
In the case of PD, the best overall model was the one trained only on the transcription.For this one, the performance obtained in the fully supervised scenario was 0.79, whichthen dropped to 0.69 when the instance labels were hidden, and the bag size was set to 50.
87
Table 5.6: Performance in F1 score for the proposed deep MIL network for different sizes ofbags, and different types of textual cues, for depression and PD.
Bagsize Document Depression Parkinson’s
disease
1
All 0.67 0.69Transcription 0.69 0.79
Title + description 0.62 0.71Top 5 comments 0.56 0.53
5
All 0.66 0.65Transcription 0.62 0.72
Title + description 0.56 0.68Top 5 comments 0.62 0.47
10
All 0.57 0.61Transcription 0.60 0.63
Title + description 0.58 0.63Top 5 comments 0.62 0.55
25
All 0.57 0.61Transcription 0.59 0.71
Title + description 0.60 0.66Top 5 comments 0.58 0.51
The cost of going from a situation where the full dataset was annotated, and the learningscenario was fully supervised, to the generalized MIL framework where only the bag labelsare available and no sample of the corpus was manually annotated, was 10% of the absoluteperformance. Even though the drop in performance was smaller for depression, the absoluteperformance was better in PD.
Overall this technique shows promising results regarding the automatic annotation of theWSM Corpus without any annotated data available. At the same time, the proposed techniquecan be improved by finding other more suitable representations for the documents or betternetwork architectures, so that the absolute performance of all the models is improved.
Looking back to the works described in Sections 5.1, 5.3, and 5.4, there would be much roomfor improvement of all the presented techniques by, for example, leveraging from each other,or by combining them. However, due to time limitations that possibility was not addressed.
At the same time, we can reflect on the work presented in this Chapter and propose otherstrategies, for future work, that could also be relevant to solve the problem of automatingthe annotation of the WSM Corpus. Considering the very specific definition of positiveself-reported diagnosis, i.e. the moment in which the subject of the video claims to be
88

currently suffering from the target SA disease, it could be argued that a simple rule-basedsolution could provide a relevant alternative to solve this problem. For example, by searchingfor and counting sets of target words, to searching for negations, to identifying verb tenses,etc. This, and other avenues remain to be explored.
89

90

Part III
Detecting speech affecting diseasesin-the-wild
91

Chapter 6
Detecting speech affecting diseasesin-the-wild
After describing the collection and manual annotation process of WSM Corpus on Chapter4, and proposing several automatic annotation strategies to replace its manual annotationprocess on Chapter 5, we move on to explore the topic of detecting SA diseases in anin-the-wild context and/or with in-the-wild data.
Before moving on to describing in detail the experiments conducted, we want to note that, inthis Chapter, we will be focusing on the speech modality alone, to detect SA diseases. Inprevious Chapters, we have dedicated our attention to the natural language modality (andmetadata) to address the automation of the collection and annotation of speech medicalcorpora. This meant that our focus was on explicit cues, collected from what was said by thesubjects in the videos.
However, we now shift our focus to speech, since we want to be operating in such conditionsthat detecting SA diseases does not depend on what has been said, but only on how it wassaid. At this stage, we will be looking for implicit cues that convey a subject’s health status,present in the speech signal, rather than the explicit ones, present in the content, that werestudied in Chapter 5. This decision is especially important in the context of this work, giventhat the majority of the speech medical corpora, and particularly, the ones used in the scopeof this work (DAIC, PC-GITA, and the WSM Corpus), contain subjects who are not onlyaware of their health status, but where a fraction of the target speakers are also explicitlydiscussing aspects of their SA disease (including symptoms, medication, treatments, etc.).We consider that, in such conditions, it would be redundant to develop a system that wouldrely on the explicit, natural language based cues, related to the subject’s knowledge of their
93
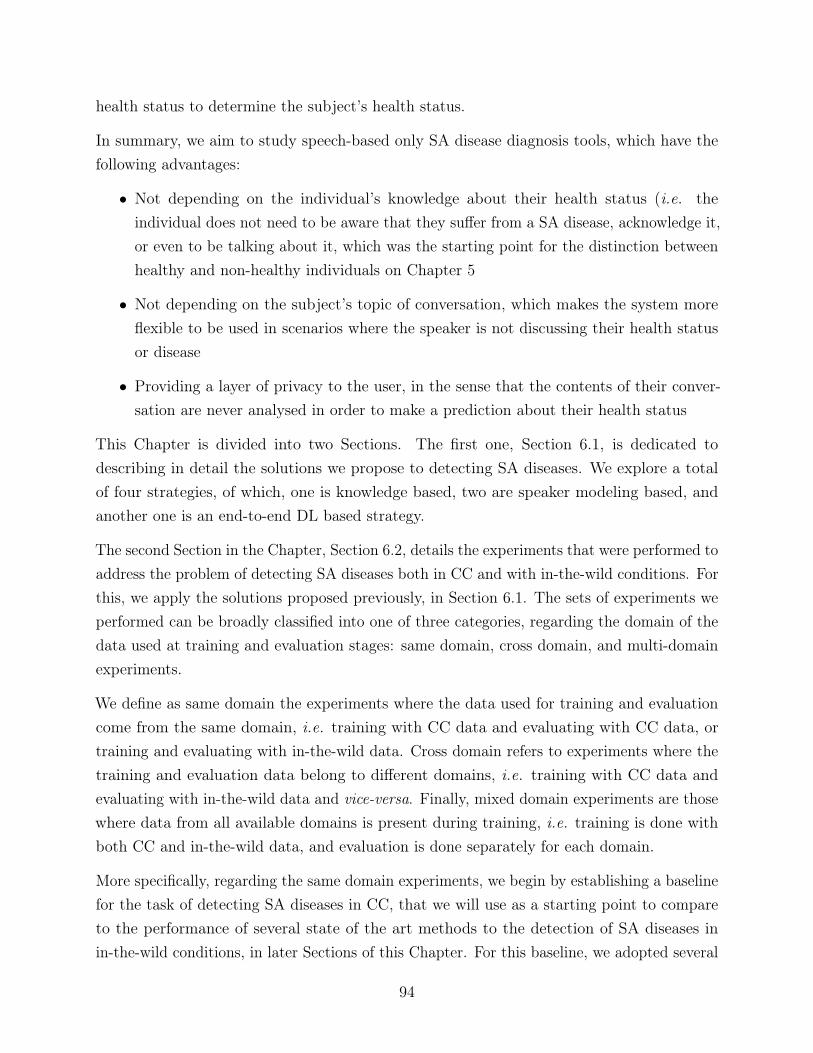
health status to determine the subject’s health status.
In summary, we aim to study speech-based only SA disease diagnosis tools, which have thefollowing advantages:
• Not depending on the individual’s knowledge about their health status (i.e. theindividual does not need to be aware that they suffer from a SA disease, acknowledge it,or even to be talking about it, which was the starting point for the distinction betweenhealthy and non-healthy individuals on Chapter 5
• Not depending on the subject’s topic of conversation, which makes the system moreflexible to be used in scenarios where the speaker is not discussing their health statusor disease
• Providing a layer of privacy to the user, in the sense that the contents of their conver-sation are never analysed in order to make a prediction about their health status
This Chapter is divided into two Sections. The first one, Section 6.1, is dedicated todescribing in detail the solutions we propose to detecting SA diseases. We explore a totalof four strategies, of which, one is knowledge based, two are speaker modeling based, andanother one is an end-to-end DL based strategy.
The second Section in the Chapter, Section 6.2, details the experiments that were performed toaddress the problem of detecting SA diseases both in CC and with in-the-wild conditions. Forthis, we apply the solutions proposed previously, in Section 6.1. The sets of experiments weperformed can be broadly classified into one of three categories, regarding the domain of thedata used at training and evaluation stages: same domain, cross domain, and multi-domainexperiments.
We define as same domain the experiments where the data used for training and evaluationcome from the same domain, i.e. training with CC data and evaluating with CC data, ortraining and evaluating with in-the-wild data. Cross domain refers to experiments where thetraining and evaluation data belong to different domains, i.e. training with CC data andevaluating with in-the-wild data and vice-versa. Finally, mixed domain experiments are thosewhere data from all available domains is present during training, i.e. training is done withboth CC and in-the-wild data, and evaluation is done separately for each domain.
More specifically, regarding the same domain experiments, we begin by establishing a baselinefor the task of detecting SA diseases in CC, that we will use as a starting point to compareto the performance of several state of the art methods to the detection of SA diseases inin-the-wild conditions, in later Sections of this Chapter. For this baseline, we adopted several
94
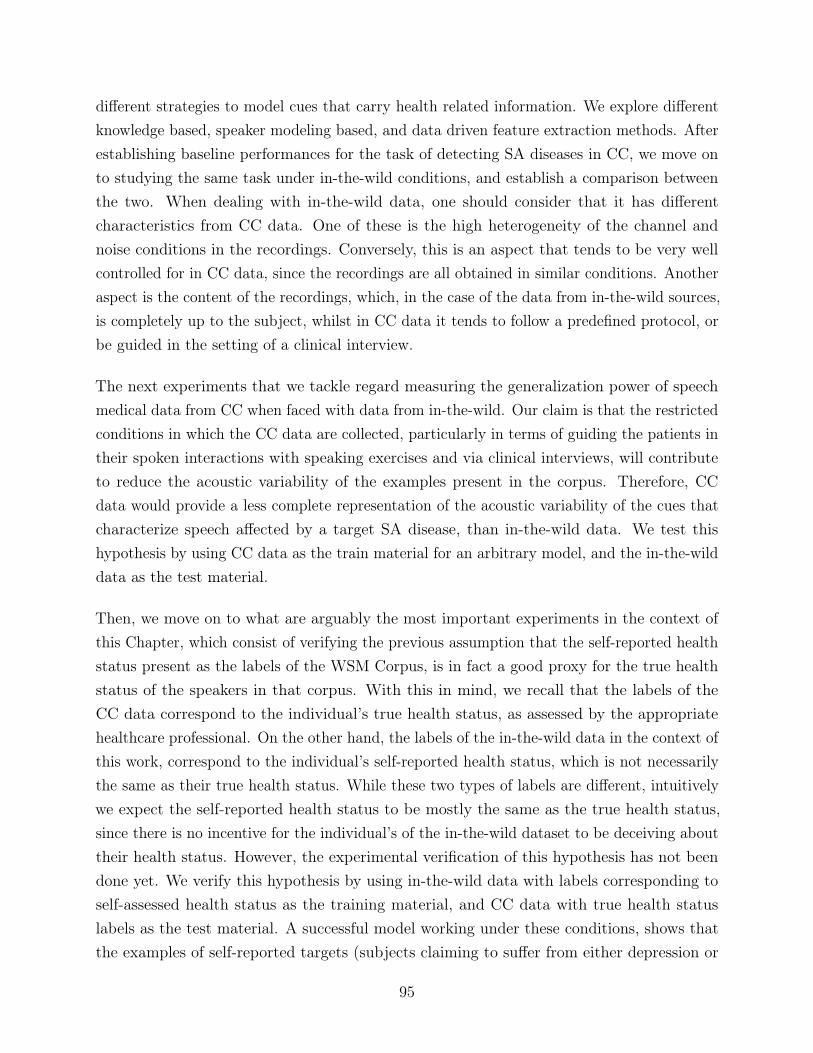
different strategies to model cues that carry health related information. We explore differentknowledge based, speaker modeling based, and data driven feature extraction methods. Afterestablishing baseline performances for the task of detecting SA diseases in CC, we move onto studying the same task under in-the-wild conditions, and establish a comparison betweenthe two. When dealing with in-the-wild data, one should consider that it has differentcharacteristics from CC data. One of these is the high heterogeneity of the channel andnoise conditions in the recordings. Conversely, this is an aspect that tends to be very wellcontrolled for in CC data, since the recordings are all obtained in similar conditions. Anotheraspect is the content of the recordings, which, in the case of the data from in-the-wild sources,is completely up to the subject, whilst in CC data it tends to follow a predefined protocol, orbe guided in the setting of a clinical interview.
The next experiments that we tackle regard measuring the generalization power of speechmedical data from CC when faced with data from in-the-wild. Our claim is that the restrictedconditions in which the CC data are collected, particularly in terms of guiding the patients intheir spoken interactions with speaking exercises and via clinical interviews, will contributeto reduce the acoustic variability of the examples present in the corpus. Therefore, CCdata would provide a less complete representation of the acoustic variability of the cues thatcharacterize speech affected by a target SA disease, than in-the-wild data. We test thishypothesis by using CC data as the train material for an arbitrary model, and the in-the-wilddata as the test material.
Then, we move on to what are arguably the most important experiments in the context ofthis Chapter, which consist of verifying the previous assumption that the self-reported healthstatus present as the labels of the WSM Corpus, is in fact a good proxy for the true healthstatus of the speakers in that corpus. With this in mind, we recall that the labels of theCC data correspond to the individual’s true health status, as assessed by the appropriatehealthcare professional. On the other hand, the labels of the in-the-wild data in the context ofthis work, correspond to the individual’s self-reported health status, which is not necessarilythe same as their true health status. While these two types of labels are different, intuitivelywe expect the self-reported health status to be mostly the same as the true health status,since there is no incentive for the individual’s of the in-the-wild dataset to be deceiving abouttheir health status. However, the experimental verification of this hypothesis has not beendone yet. We verify this hypothesis by using in-the-wild data with labels corresponding toself-assessed health status as the training material, and CC data with true health statuslabels as the test material. A successful model working under these conditions, shows thatthe examples of self-reported targets (subjects claiming to suffer from either depression or
95
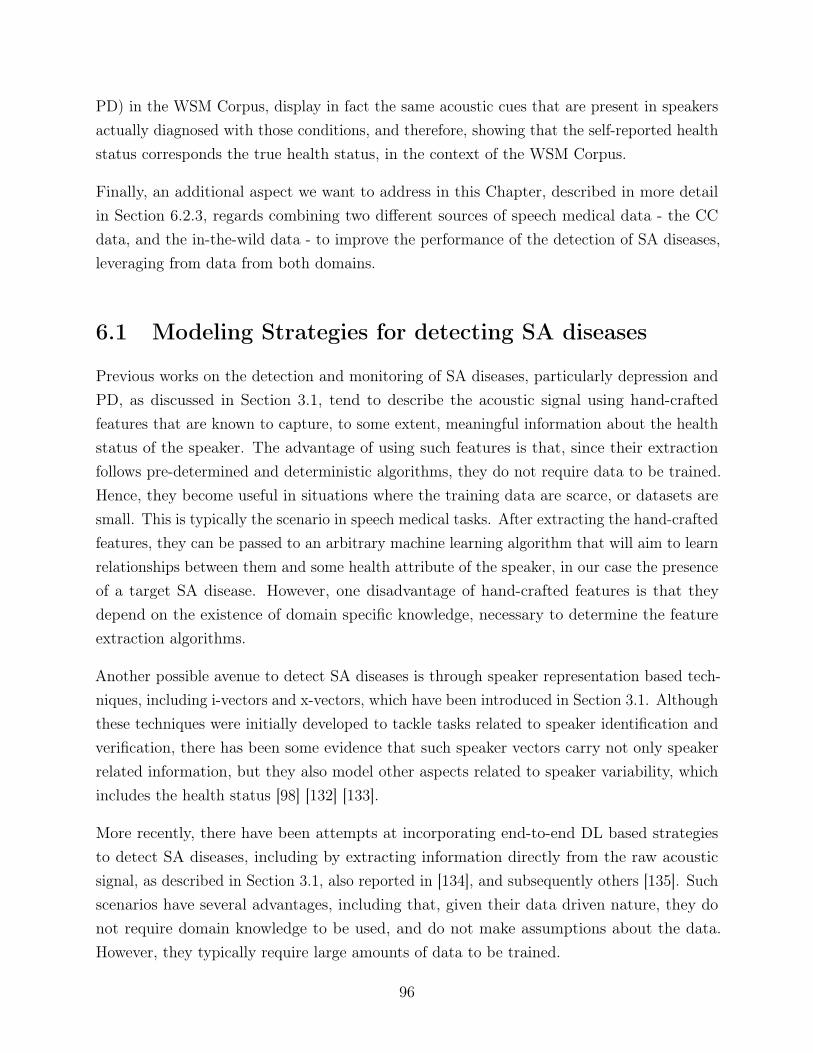
PD) in the WSM Corpus, display in fact the same acoustic cues that are present in speakersactually diagnosed with those conditions, and therefore, showing that the self-reported healthstatus corresponds the true health status, in the context of the WSM Corpus.
Finally, an additional aspect we want to address in this Chapter, described in more detailin Section 6.2.3, regards combining two different sources of speech medical data - the CCdata, and the in-the-wild data - to improve the performance of the detection of SA diseases,leveraging from data from both domains.
6.1 Modeling Strategies for detecting SA diseases
Previous works on the detection and monitoring of SA diseases, particularly depression andPD, as discussed in Section 3.1, tend to describe the acoustic signal using hand-craftedfeatures that are known to capture, to some extent, meaningful information about the healthstatus of the speaker. The advantage of using such features is that, since their extractionfollows pre-determined and deterministic algorithms, they do not require data to be trained.Hence, they become useful in situations where the training data are scarce, or datasets aresmall. This is typically the scenario in speech medical tasks. After extracting the hand-craftedfeatures, they can be passed to an arbitrary machine learning algorithm that will aim to learnrelationships between them and some health attribute of the speaker, in our case the presenceof a target SA disease. However, one disadvantage of hand-crafted features is that theydepend on the existence of domain specific knowledge, necessary to determine the featureextraction algorithms.
Another possible avenue to detect SA diseases is through speaker representation based tech-niques, including i-vectors and x-vectors, which have been introduced in Section 3.1. Althoughthese techniques were initially developed to tackle tasks related to speaker identification andverification, there has been some evidence that such speaker vectors carry not only speakerrelated information, but they also model other aspects related to speaker variability, whichincludes the health status [98] [132] [133].
More recently, there have been attempts at incorporating end-to-end DL based strategiesto detect SA diseases, including by extracting information directly from the raw acousticsignal, as described in Section 3.1, also reported in [134], and subsequently others [135]. Suchscenarios have several advantages, including that, given their data driven nature, they donot require domain knowledge to be used, and do not make assumptions about the data.However, they typically require large amounts of data to be trained.
96
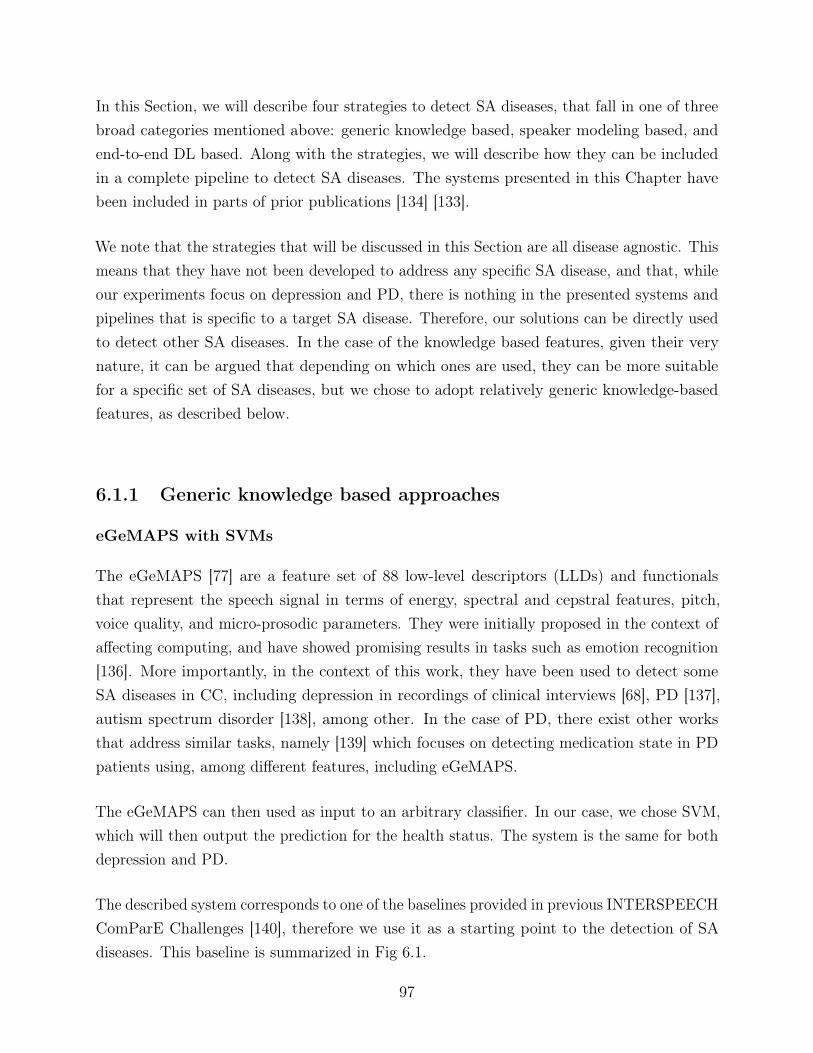
In this Section, we will describe four strategies to detect SA diseases, that fall in one of threebroad categories mentioned above: generic knowledge based, speaker modeling based, andend-to-end DL based. Along with the strategies, we will describe how they can be includedin a complete pipeline to detect SA diseases. The systems presented in this Chapter havebeen included in parts of prior publications [134] [133].
We note that the strategies that will be discussed in this Section are all disease agnostic. Thismeans that they have not been developed to address any specific SA disease, and that, whileour experiments focus on depression and PD, there is nothing in the presented systems andpipelines that is specific to a target SA disease. Therefore, our solutions can be directly usedto detect other SA diseases. In the case of the knowledge based features, given their verynature, it can be argued that depending on which ones are used, they can be more suitablefor a specific set of SA diseases, but we chose to adopt relatively generic knowledge-basedfeatures, as described below.
6.1.1 Generic knowledge based approaches
eGeMAPS with SVMs
The eGeMAPS [77] are a feature set of 88 low-level descriptors (LLDs) and functionalsthat represent the speech signal in terms of energy, spectral and cepstral features, pitch,voice quality, and micro-prosodic parameters. They were initially proposed in the context ofaffecting computing, and have showed promising results in tasks such as emotion recognition[136]. More importantly, in the context of this work, they have been used to detect someSA diseases in CC, including depression in recordings of clinical interviews [68], PD [137],autism spectrum disorder [138], among other. In the case of PD, there exist other worksthat address similar tasks, namely [139] which focuses on detecting medication state in PDpatients using, among different features, including eGeMAPS.
The eGeMAPS can then used as input to an arbitrary classifier. In our case, we chose SVM,which will then output the prediction for the health status. The system is the same for bothdepression and PD.
The described system corresponds to one of the baselines provided in previous INTERSPEECHComParE Challenges [140], therefore we use it as a starting point to the detection of SAdiseases. This baseline is summarized in Fig 6.1.
97
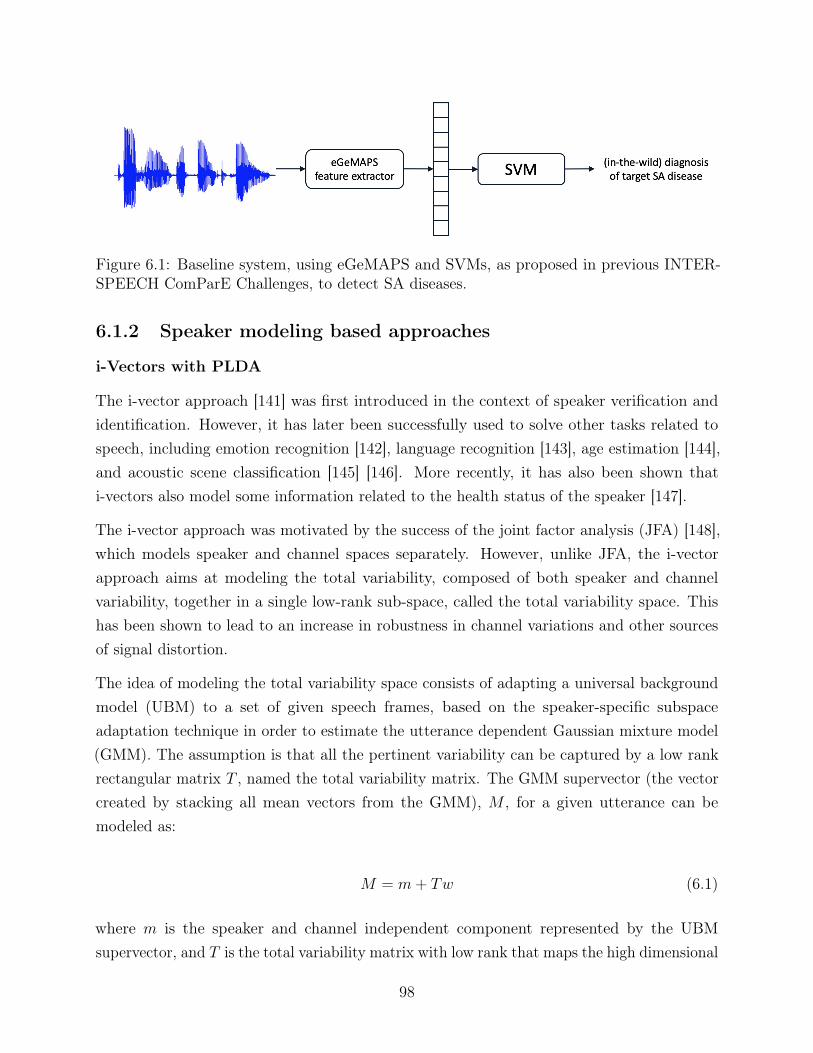
Figure 6.1: Baseline system, using eGeMAPS and SVMs, as proposed in previous INTER-SPEECH ComParE Challenges, to detect SA diseases.
6.1.2 Speaker modeling based approaches
i-Vectors with PLDA
The i-vector approach [141] was first introduced in the context of speaker verification andidentification. However, it has later been successfully used to solve other tasks related tospeech, including emotion recognition [142], language recognition [143], age estimation [144],and acoustic scene classification [145] [146]. More recently, it has also been shown thati-vectors also model some information related to the health status of the speaker [147].
The i-vector approach was motivated by the success of the joint factor analysis (JFA) [148],which models speaker and channel spaces separately. However, unlike JFA, the i-vectorapproach aims at modeling the total variability, composed of both speaker and channelvariability, together in a single low-rank sub-space, called the total variability space. Thishas been shown to lead to an increase in robustness in channel variations and other sourcesof signal distortion.
The idea of modeling the total variability space consists of adapting a universal backgroundmodel (UBM) to a set of given speech frames, based on the speaker-specific subspaceadaptation technique in order to estimate the utterance dependent Gaussian mixture model(GMM). The assumption is that all the pertinent variability can be captured by a low rankrectangular matrix T , named the total variability matrix. The GMM supervector (the vectorcreated by stacking all mean vectors from the GMM), M , for a given utterance can bemodeled as:
M = m+ Tw (6.1)
where m is the speaker and channel independent component represented by the UBMsupervector, and T is the total variability matrix with low rank that maps the high dimensional
98
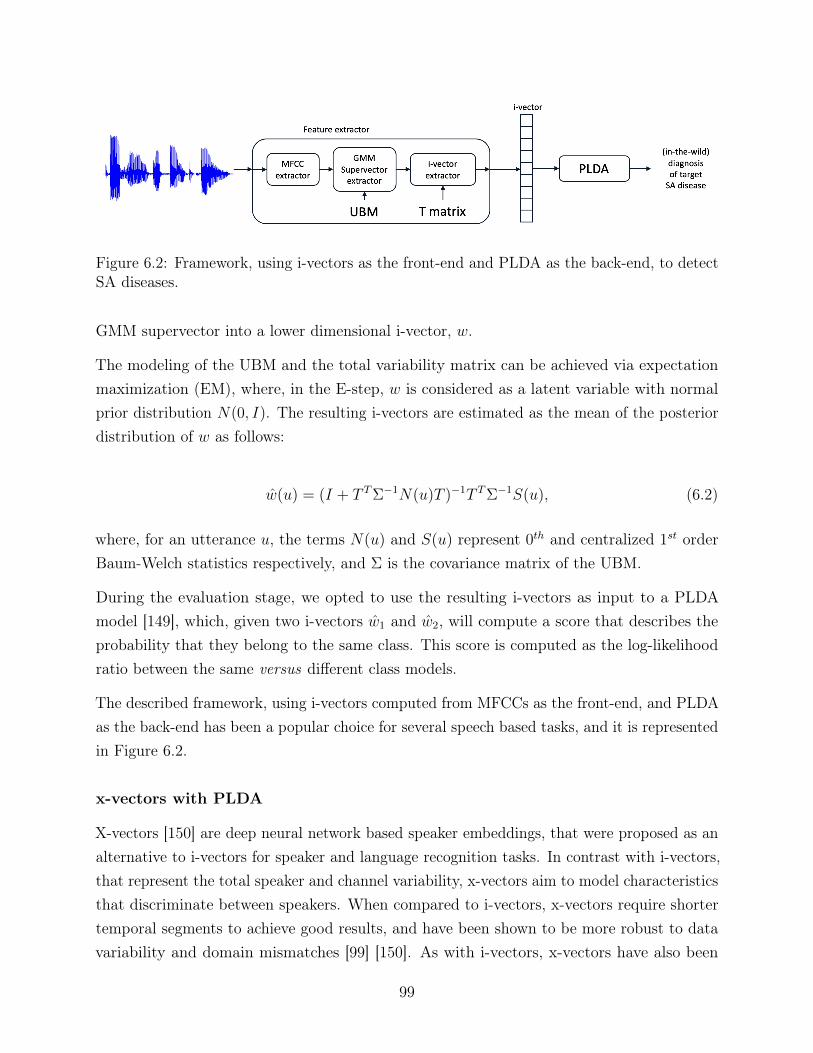
Figure 6.2: Framework, using i-vectors as the front-end and PLDA as the back-end, to detectSA diseases.
GMM supervector into a lower dimensional i-vector, w.
The modeling of the UBM and the total variability matrix can be achieved via expectationmaximization (EM), where, in the E-step, w is considered as a latent variable with normalprior distribution N(0, I). The resulting i-vectors are estimated as the mean of the posteriordistribution of w as follows:
w(u) = (I + T TΣ−1N(u)T )−1T TΣ−1S(u), (6.2)
where, for an utterance u, the terms N(u) and S(u) represent 0th and centralized 1st orderBaum-Welch statistics respectively, and Σ is the covariance matrix of the UBM.
During the evaluation stage, we opted to use the resulting i-vectors as input to a PLDAmodel [149], which, given two i-vectors w1 and w2, will compute a score that describes theprobability that they belong to the same class. This score is computed as the log-likelihoodratio between the same versus different class models.
The described framework, using i-vectors computed from MFCCs as the front-end, and PLDAas the back-end has been a popular choice for several speech based tasks, and it is representedin Figure 6.2.
x-vectors with PLDA
X-vectors [150] are deep neural network based speaker embeddings, that were proposed as analternative to i-vectors for speaker and language recognition tasks. In contrast with i-vectors,that represent the total speaker and channel variability, x-vectors aim to model characteristicsthat discriminate between speakers. When compared to i-vectors, x-vectors require shortertemporal segments to achieve good results, and have been shown to be more robust to datavariability and domain mismatches [99] [150]. As with i-vectors, x-vectors have also been
99
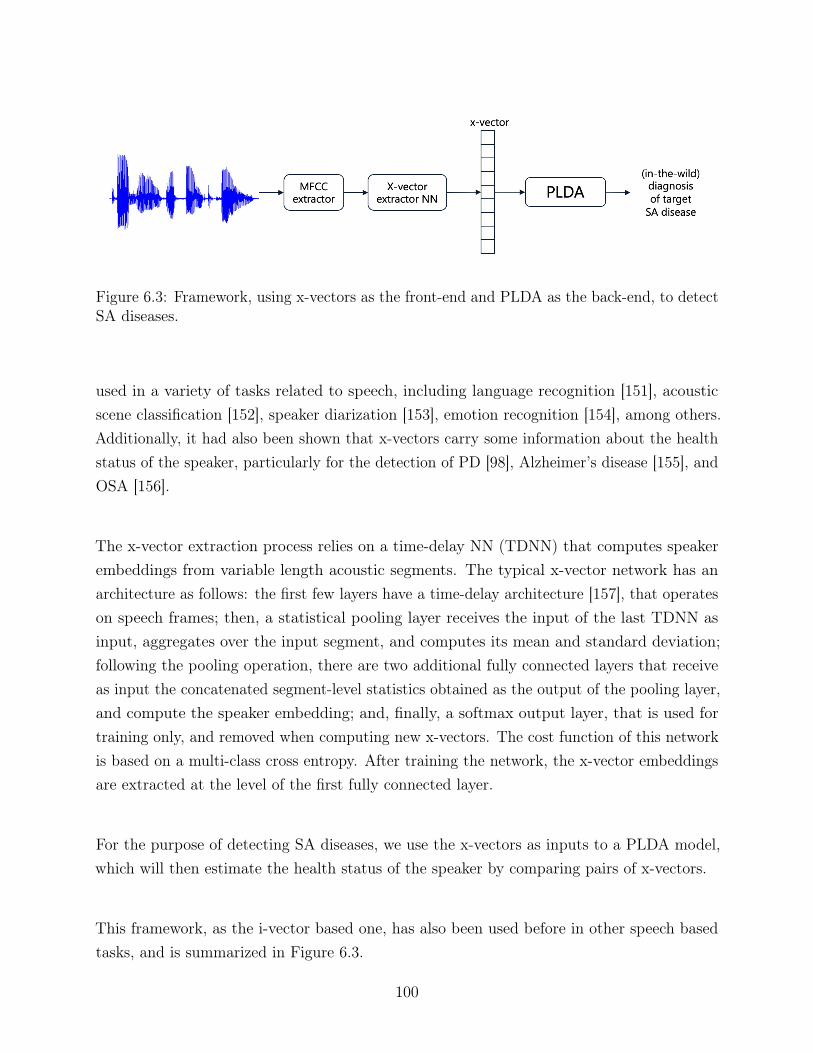
Figure 6.3: Framework, using x-vectors as the front-end and PLDA as the back-end, to detectSA diseases.
used in a variety of tasks related to speech, including language recognition [151], acousticscene classification [152], speaker diarization [153], emotion recognition [154], among others.Additionally, it had also been shown that x-vectors carry some information about the healthstatus of the speaker, particularly for the detection of PD [98], Alzheimer’s disease [155], andOSA [156].
The x-vector extraction process relies on a time-delay NN (TDNN) that computes speakerembeddings from variable length acoustic segments. The typical x-vector network has anarchitecture as follows: the first few layers have a time-delay architecture [157], that operateson speech frames; then, a statistical pooling layer receives the input of the last TDNN asinput, aggregates over the input segment, and computes its mean and standard deviation;following the pooling operation, there are two additional fully connected layers that receiveas input the concatenated segment-level statistics obtained as the output of the pooling layer,and compute the speaker embedding; and, finally, a softmax output layer, that is used fortraining only, and removed when computing new x-vectors. The cost function of this networkis based on a multi-class cross entropy. After training the network, the x-vector embeddingsare extracted at the level of the first fully connected layer.
For the purpose of detecting SA diseases, we use the x-vectors as inputs to a PLDA model,which will then estimate the health status of the speaker by comparing pairs of x-vectors.
This framework, as the i-vector based one, has also been used before in other speech basedtasks, and is summarized in Figure 6.3.
100
6.1.3 End-to-end DL based approaches
CNN-LSTM with self-attention
The final approach that we have used to detect SA diseases differs from the previous ones inthat, in this one, our goal is to use the raw spectrograms as the input to our network, and letthe network determine on its own which are the relevant features for this task. This approachblends front- and back-end into a single network that can be trained end-to-end, withoutinputting into the model any pre-existing domain knowledge. On one hand this strategyrelieves the model from the biases that hand-crafted features may impose, on the other hand,such strategies typically required large amounts of data to robustly estimate the relevantfeatures for the given tasks.
The idea of using end-to-end approaches to address problems related to speech has beenproposed for tasks such as speaker identification and recognition [158], speech recognition[159] [160] [161], language recognition [162], acoustic localization [163], speech dereverberation[164], emotion recognition [112] [165], among others.
However, at the time of this work, there were, few applications of end-to-end DL basedstrategies in tasks related to healthcare, particularly to detect depression [73], and PD [166]from speech. In recent years, this type of architectures has received more attention, whichresulted in several works that use such strategies to detect depression [167] [168], and PD[101] [169].
The end-to-end architecture chosen for our task of SA diseases diagnosis consists of acombination of CNNs, LSTMs, and a self-attention mechanism to jointly model local spectro-temporal information from the raw spectrograms, producing a high-level representation ofthe input.
For this, we use fixed length raw mel spectrograms directly as the inputs to the NN. Theseare fed to several CNN layers which have the purpose of embedding the spectrograms, thusreplacing the function of a traditional feature extraction step. These hidden representationsare then used as inputs to an LSTM layer, that is used to capture the longer term temporalinformation present in the input sequence. Finally, we include a self-attention mechanism tocapture correlations between the different elements of the input sequence.
Figure 6.4 summarizes the proposed end-to-end system.
101
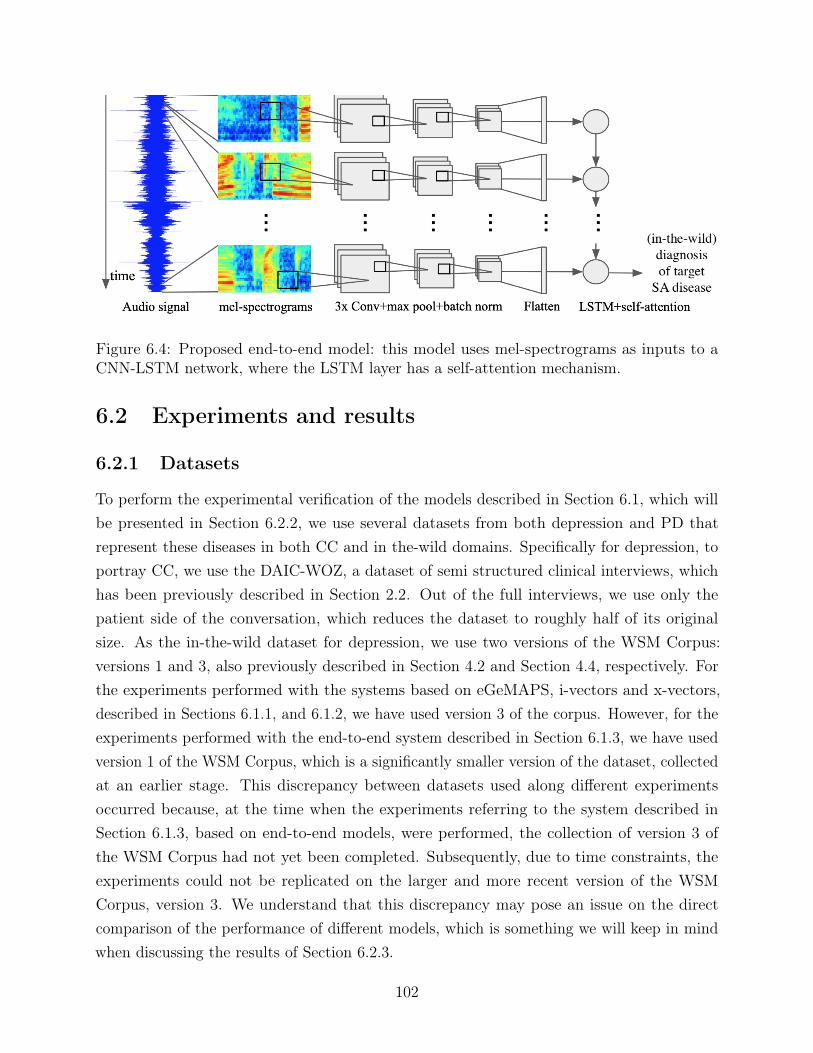
Figure 6.4: Proposed end-to-end model: this model uses mel-spectrograms as inputs to aCNN-LSTM network, where the LSTM layer has a self-attention mechanism.
6.2 Experiments and results
6.2.1 Datasets
To perform the experimental verification of the models described in Section 6.1, which willbe presented in Section 6.2.2, we use several datasets from both depression and PD thatrepresent these diseases in both CC and in the-wild domains. Specifically for depression, toportray CC, we use the DAIC-WOZ, a dataset of semi structured clinical interviews, whichhas been previously described in Section 2.2. Out of the full interviews, we use only thepatient side of the conversation, which reduces the dataset to roughly half of its originalsize. As the in-the-wild dataset for depression, we use two versions of the WSM Corpus:versions 1 and 3, also previously described in Section 4.2 and Section 4.4, respectively. Forthe experiments performed with the systems based on eGeMAPS, i-vectors and x-vectors,described in Sections 6.1.1, and 6.1.2, we have used version 3 of the corpus. However, for theexperiments performed with the end-to-end system described in Section 6.1.3, we have usedversion 1 of the WSM Corpus, which is a significantly smaller version of the dataset, collectedat an earlier stage. This discrepancy between datasets used along different experimentsoccurred because, at the time when the experiments referring to the system described inSection 6.1.3, based on end-to-end models, were performed, the collection of version 3 ofthe WSM Corpus had not yet been completed. Subsequently, due to time constraints, theexperiments could not be replicated on the larger and more recent version of the WSMCorpus, version 3. We understand that this discrepancy may pose an issue on the directcomparison of the performance of different models, which is something we will keep in mindwhen discussing the results of Section 6.2.3.
102
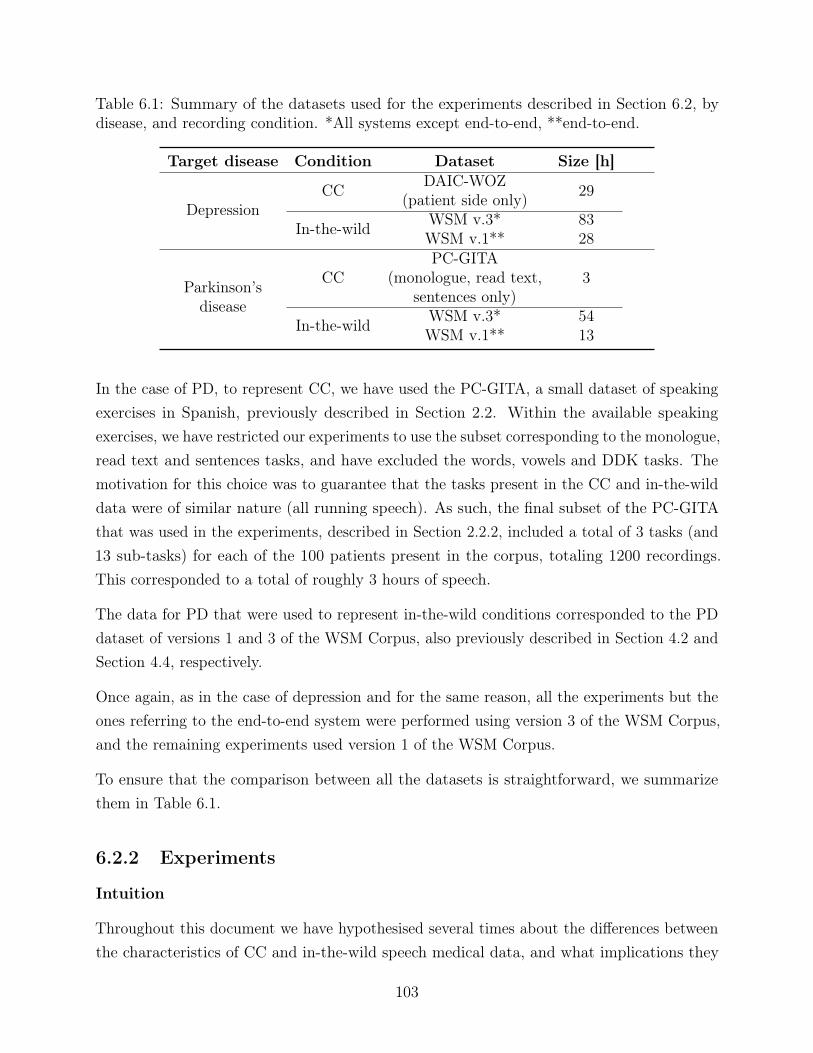
Table 6.1: Summary of the datasets used for the experiments described in Section 6.2, bydisease, and recording condition. *All systems except end-to-end, **end-to-end.
Target disease Condition Dataset Size [h]
DepressionCC DAIC-WOZ
(patient side only) 29
In-the-wild WSM v.3* 83WSM v.1** 28
Parkinson’sdisease
CCPC-GITA
(monologue, read text,sentences only)
3
In-the-wild WSM v.3* 54WSM v.1** 13
In the case of PD, to represent CC, we have used the PC-GITA, a small dataset of speakingexercises in Spanish, previously described in Section 2.2. Within the available speakingexercises, we have restricted our experiments to use the subset corresponding to the monologue,read text and sentences tasks, and have excluded the words, vowels and DDK tasks. Themotivation for this choice was to guarantee that the tasks present in the CC and in-the-wilddata were of similar nature (all running speech). As such, the final subset of the PC-GITAthat was used in the experiments, described in Section 2.2.2, included a total of 3 tasks (and13 sub-tasks) for each of the 100 patients present in the corpus, totaling 1200 recordings.This corresponded to a total of roughly 3 hours of speech.
The data for PD that were used to represent in-the-wild conditions corresponded to the PDdataset of versions 1 and 3 of the WSM Corpus, also previously described in Section 4.2 andSection 4.4, respectively.
Once again, as in the case of depression and for the same reason, all the experiments but theones referring to the end-to-end system were performed using version 3 of the WSM Corpus,and the remaining experiments used version 1 of the WSM Corpus.
To ensure that the comparison between all the datasets is straightforward, we summarizethem in Table 6.1.
6.2.2 Experiments
Intuition
Throughout this document we have hypothesised several times about the differences betweenthe characteristics of CC and in-the-wild speech medical data, and what implications they
103
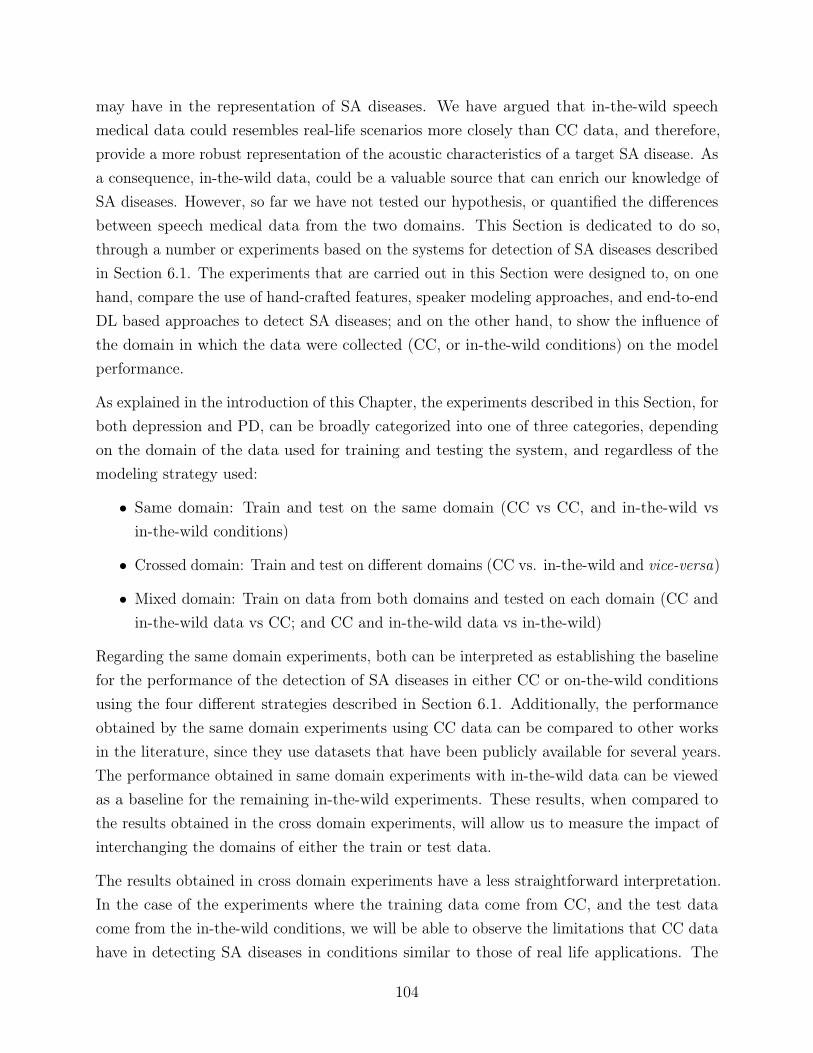
may have in the representation of SA diseases. We have argued that in-the-wild speechmedical data could resembles real-life scenarios more closely than CC data, and therefore,provide a more robust representation of the acoustic characteristics of a target SA disease. Asa consequence, in-the-wild data, could be a valuable source that can enrich our knowledge ofSA diseases. However, so far we have not tested our hypothesis, or quantified the differencesbetween speech medical data from the two domains. This Section is dedicated to do so,through a number or experiments based on the systems for detection of SA diseases describedin Section 6.1. The experiments that are carried out in this Section were designed to, on onehand, compare the use of hand-crafted features, speaker modeling approaches, and end-to-endDL based approaches to detect SA diseases; and on the other hand, to show the influence ofthe domain in which the data were collected (CC, or in-the-wild conditions) on the modelperformance.
As explained in the introduction of this Chapter, the experiments described in this Section, forboth depression and PD, can be broadly categorized into one of three categories, dependingon the domain of the data used for training and testing the system, and regardless of themodeling strategy used:
• Same domain: Train and test on the same domain (CC vs CC, and in-the-wild vsin-the-wild conditions)
• Crossed domain: Train and test on different domains (CC vs. in-the-wild and vice-versa)
• Mixed domain: Train on data from both domains and tested on each domain (CC andin-the-wild data vs CC; and CC and in-the-wild data vs in-the-wild)
Regarding the same domain experiments, both can be interpreted as establishing the baselinefor the performance of the detection of SA diseases in either CC or on-the-wild conditionsusing the four different strategies described in Section 6.1. Additionally, the performanceobtained by the same domain experiments using CC data can be compared to other worksin the literature, since they use datasets that have been publicly available for several years.The performance obtained in same domain experiments with in-the-wild data can be viewedas a baseline for the remaining in-the-wild experiments. These results, when compared tothe results obtained in the cross domain experiments, will allow us to measure the impact ofinterchanging the domains of either the train or test data.
The results obtained in cross domain experiments have a less straightforward interpretation.In the case of the experiments where the training data come from CC, and the test datacome from the in-the-wild conditions, we will be able to observe the limitations that CC datahave in detecting SA diseases in conditions similar to those of real life applications. The
104
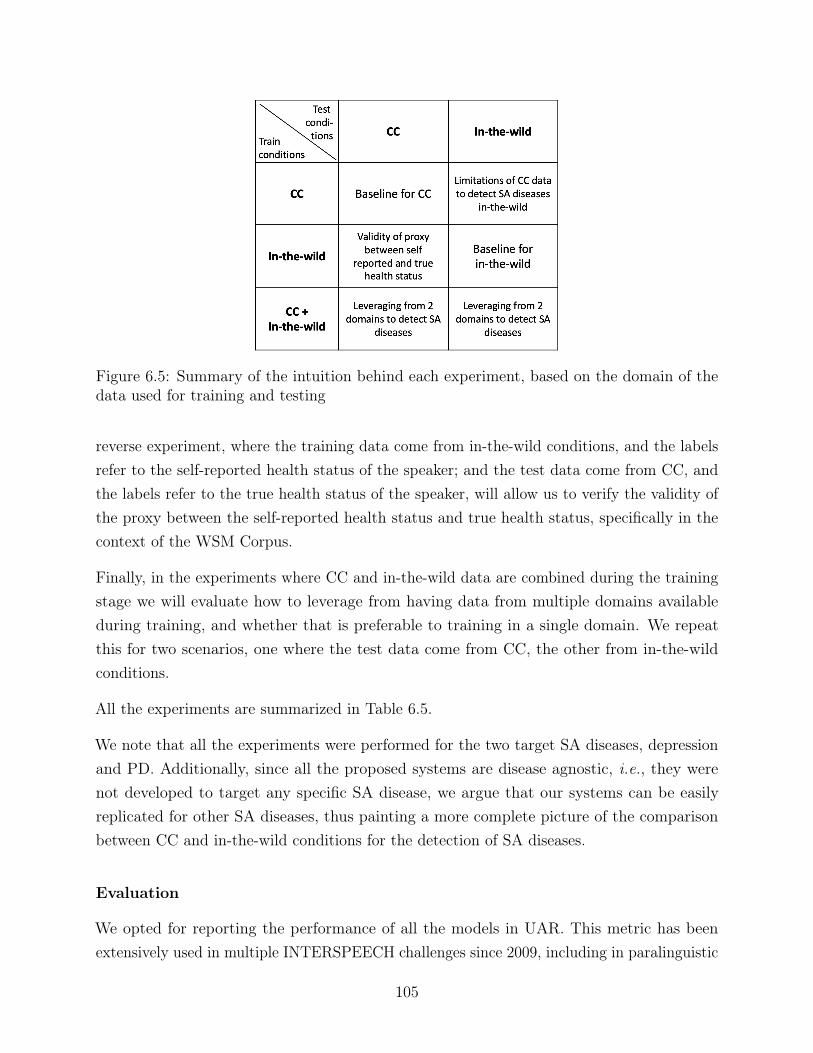
Figure 6.5: Summary of the intuition behind each experiment, based on the domain of thedata used for training and testing
reverse experiment, where the training data come from in-the-wild conditions, and the labelsrefer to the self-reported health status of the speaker; and the test data come from CC, andthe labels refer to the true health status of the speaker, will allow us to verify the validity ofthe proxy between the self-reported health status and true health status, specifically in thecontext of the WSM Corpus.
Finally, in the experiments where CC and in-the-wild data are combined during the trainingstage we will evaluate how to leverage from having data from multiple domains availableduring training, and whether that is preferable to training in a single domain. We repeatthis for two scenarios, one where the test data come from CC, the other from in-the-wildconditions.
All the experiments are summarized in Table 6.5.
We note that all the experiments were performed for the two target SA diseases, depressionand PD. Additionally, since all the proposed systems are disease agnostic, i.e., they werenot developed to target any specific SA disease, we argue that our systems can be easilyreplicated for other SA diseases, thus painting a more complete picture of the comparisonbetween CC and in-the-wild conditions for the detection of SA diseases.
Evaluation
We opted for reporting the performance of all the models in UAR. This metric has beenextensively used in multiple INTERSPEECH challenges since 2009, including in paralinguistic
105
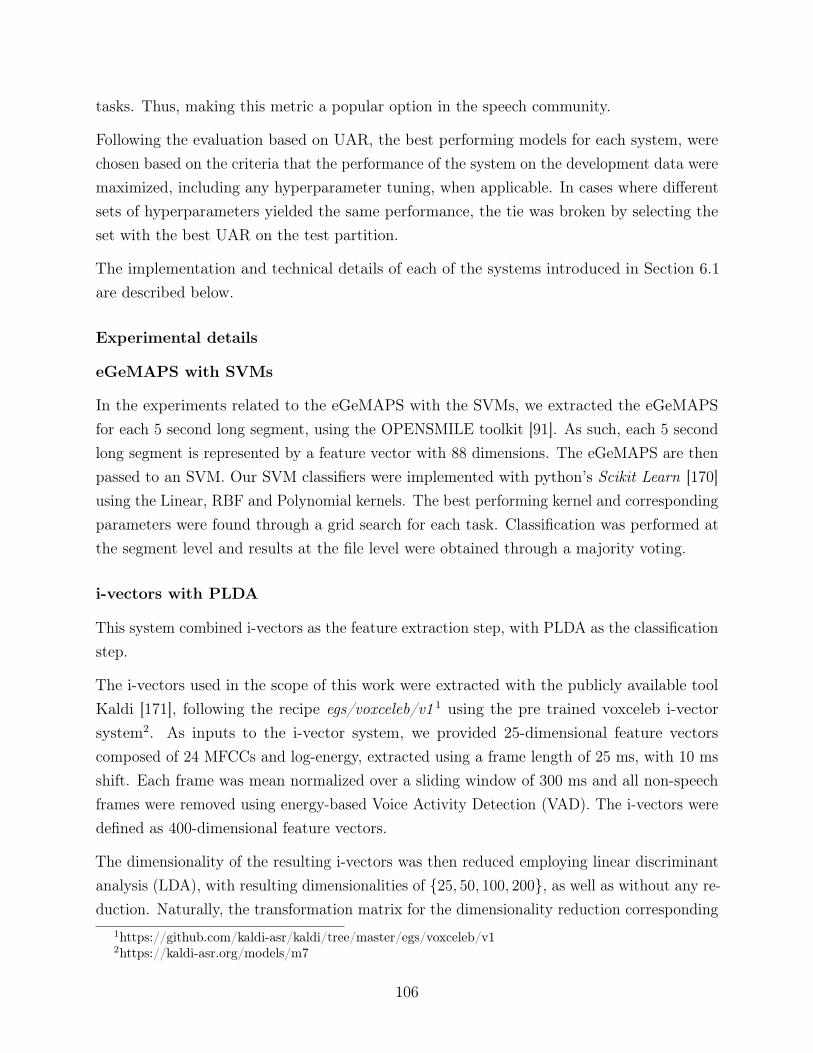
tasks. Thus, making this metric a popular option in the speech community.
Following the evaluation based on UAR, the best performing models for each system, werechosen based on the criteria that the performance of the system on the development data weremaximized, including any hyperparameter tuning, when applicable. In cases where differentsets of hyperparameters yielded the same performance, the tie was broken by selecting theset with the best UAR on the test partition.
The implementation and technical details of each of the systems introduced in Section 6.1are described below.
Experimental details
eGeMAPS with SVMs
In the experiments related to the eGeMAPS with the SVMs, we extracted the eGeMAPSfor each 5 second long segment, using the OPENSMILE toolkit [91]. As such, each 5 secondlong segment is represented by a feature vector with 88 dimensions. The eGeMAPS are thenpassed to an SVM. Our SVM classifiers were implemented with python’s Scikit Learn [170]using the Linear, RBF and Polynomial kernels. The best performing kernel and correspondingparameters were found through a grid search for each task. Classification was performed atthe segment level and results at the file level were obtained through a majority voting.
i-vectors with PLDA
This system combined i-vectors as the feature extraction step, with PLDA as the classificationstep.
The i-vectors used in the scope of this work were extracted with the publicly available toolKaldi [171], following the recipe egs/voxceleb/v1 1 using the pre trained voxceleb i-vectorsystem2. As inputs to the i-vector system, we provided 25-dimensional feature vectorscomposed of 24 MFCCs and log-energy, extracted using a frame length of 25 ms, with 10 msshift. Each frame was mean normalized over a sliding window of 300 ms and all non-speechframes were removed using energy-based Voice Activity Detection (VAD). The i-vectors weredefined as 400-dimensional feature vectors.
The dimensionality of the resulting i-vectors was then reduced employing linear discriminantanalysis (LDA), with resulting dimensionalities of {25, 50, 100, 200}, as well as without any re-duction. Naturally, the transformation matrix for the dimensionality reduction corresponding
1https://github.com/kaldi-asr/kaldi/tree/master/egs/voxceleb/v12https://kaldi-asr.org/models/m7
106
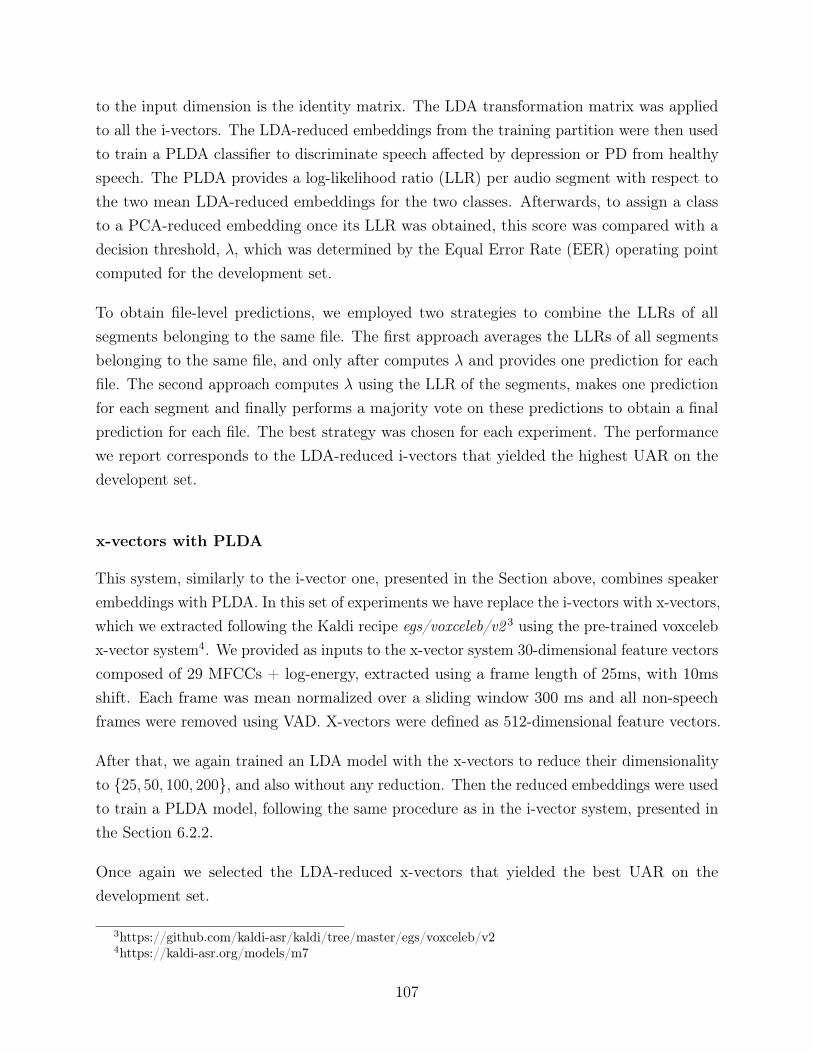
to the input dimension is the identity matrix. The LDA transformation matrix was appliedto all the i-vectors. The LDA-reduced embeddings from the training partition were then usedto train a PLDA classifier to discriminate speech affected by depression or PD from healthyspeech. The PLDA provides a log-likelihood ratio (LLR) per audio segment with respect tothe two mean LDA-reduced embeddings for the two classes. Afterwards, to assign a classto a PCA-reduced embedding once its LLR was obtained, this score was compared with adecision threshold, λ, which was determined by the Equal Error Rate (EER) operating pointcomputed for the development set.
To obtain file-level predictions, we employed two strategies to combine the LLRs of allsegments belonging to the same file. The first approach averages the LLRs of all segmentsbelonging to the same file, and only after computes λ and provides one prediction for eachfile. The second approach computes λ using the LLR of the segments, makes one predictionfor each segment and finally performs a majority vote on these predictions to obtain a finalprediction for each file. The best strategy was chosen for each experiment. The performancewe report corresponds to the LDA-reduced i-vectors that yielded the highest UAR on thedevelopent set.
x-vectors with PLDA
This system, similarly to the i-vector one, presented in the Section above, combines speakerembeddings with PLDA. In this set of experiments we have replace the i-vectors with x-vectors,which we extracted following the Kaldi recipe egs/voxceleb/v2 3 using the pre-trained voxcelebx-vector system4. We provided as inputs to the x-vector system 30-dimensional feature vectorscomposed of 29 MFCCs + log-energy, extracted using a frame length of 25ms, with 10msshift. Each frame was mean normalized over a sliding window 300 ms and all non-speechframes were removed using VAD. X-vectors were defined as 512-dimensional feature vectors.
After that, we again trained an LDA model with the x-vectors to reduce their dimensionalityto {25, 50, 100, 200}, and also without any reduction. Then the reduced embeddings were usedto train a PLDA model, following the same procedure as in the i-vector system, presented inthe Section 6.2.2.
Once again we selected the LDA-reduced x-vectors that yielded the best UAR on thedevelopment set.
3https://github.com/kaldi-asr/kaldi/tree/master/egs/voxceleb/v24https://kaldi-asr.org/models/m7
107
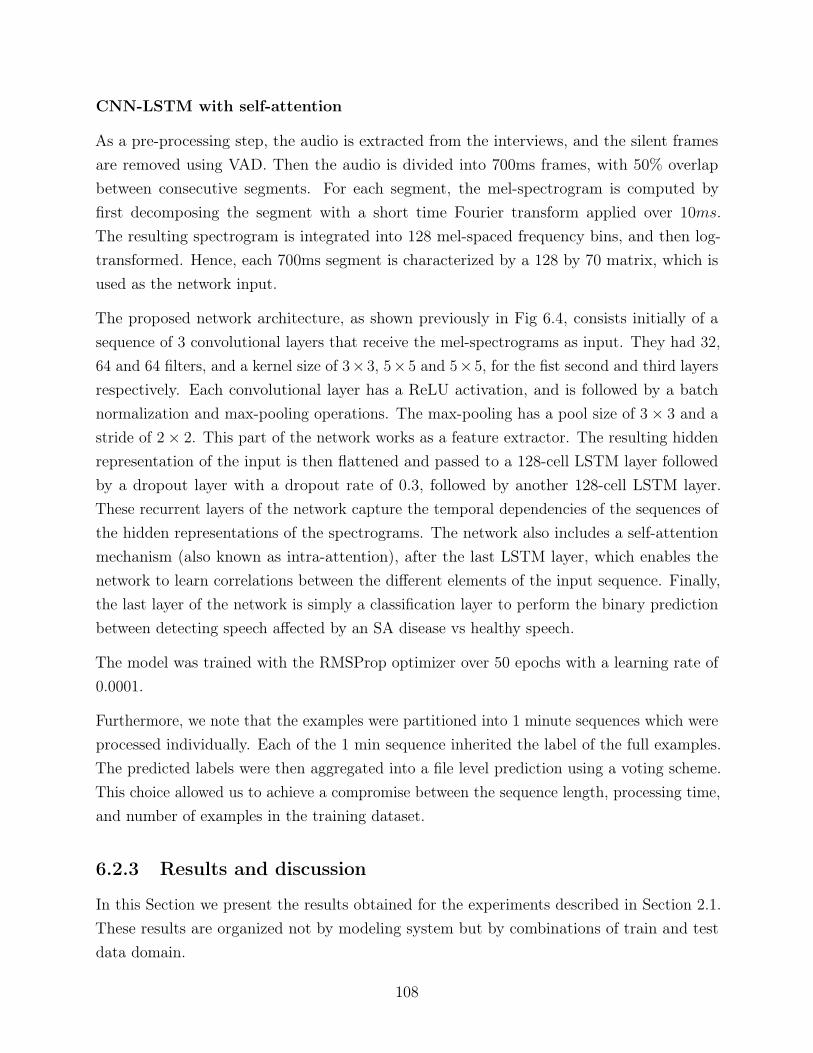
CNN-LSTM with self-attention
As a pre-processing step, the audio is extracted from the interviews, and the silent framesare removed using VAD. Then the audio is divided into 700ms frames, with 50% overlapbetween consecutive segments. For each segment, the mel-spectrogram is computed byfirst decomposing the segment with a short time Fourier transform applied over 10ms.The resulting spectrogram is integrated into 128 mel-spaced frequency bins, and then log-transformed. Hence, each 700ms segment is characterized by a 128 by 70 matrix, which isused as the network input.
The proposed network architecture, as shown previously in Fig 6.4, consists initially of asequence of 3 convolutional layers that receive the mel-spectrograms as input. They had 32,64 and 64 filters, and a kernel size of 3× 3, 5× 5 and 5× 5, for the fist second and third layersrespectively. Each convolutional layer has a ReLU activation, and is followed by a batchnormalization and max-pooling operations. The max-pooling has a pool size of 3× 3 and astride of 2× 2. This part of the network works as a feature extractor. The resulting hiddenrepresentation of the input is then flattened and passed to a 128-cell LSTM layer followedby a dropout layer with a dropout rate of 0.3, followed by another 128-cell LSTM layer.These recurrent layers of the network capture the temporal dependencies of the sequences ofthe hidden representations of the spectrograms. The network also includes a self-attentionmechanism (also known as intra-attention), after the last LSTM layer, which enables thenetwork to learn correlations between the different elements of the input sequence. Finally,the last layer of the network is simply a classification layer to perform the binary predictionbetween detecting speech affected by an SA disease vs healthy speech.
The model was trained with the RMSProp optimizer over 50 epochs with a learning rate of0.0001.
Furthermore, we note that the examples were partitioned into 1 minute sequences which wereprocessed individually. Each of the 1 min sequence inherited the label of the full examples.The predicted labels were then aggregated into a file level prediction using a voting scheme.This choice allowed us to achieve a compromise between the sequence length, processing time,and number of examples in the training dataset.
6.2.3 Results and discussion
In this Section we present the results obtained for the experiments described in Section 2.1.These results are organized not by modeling system but by combinations of train and testdata domain.
108
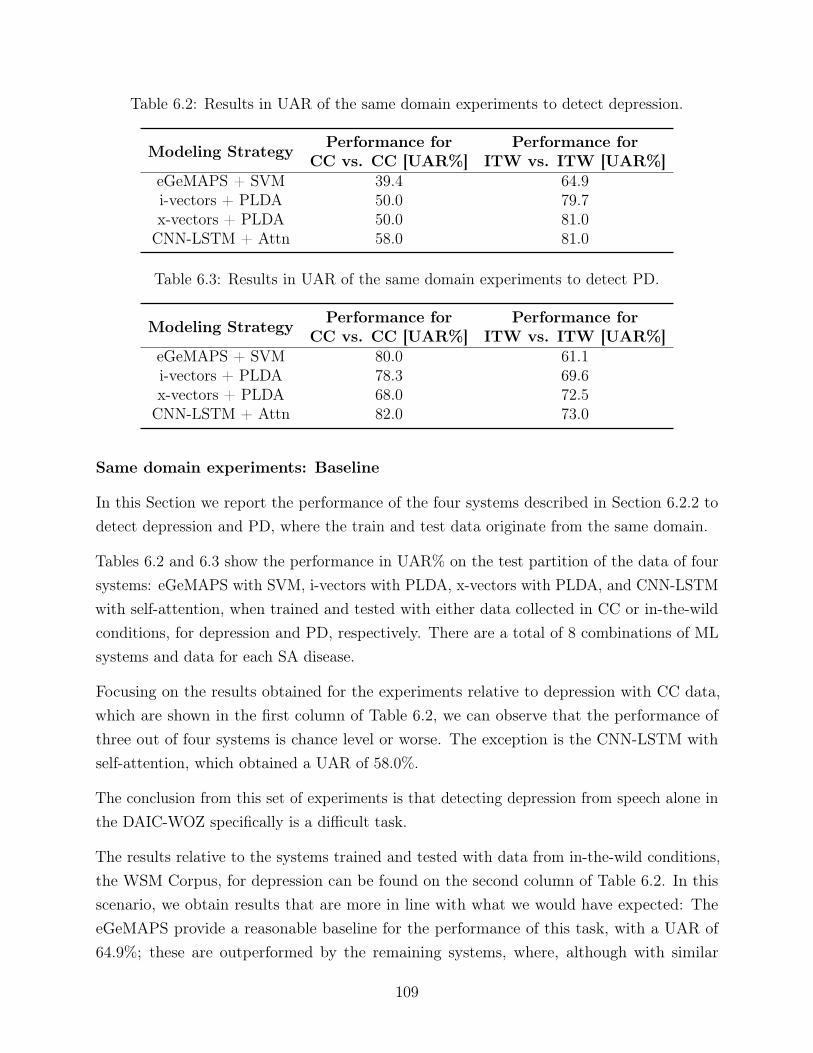
Table 6.2: Results in UAR of the same domain experiments to detect depression.
Modeling Strategy Performance forCC vs. CC [UAR%]
Performance forITW vs. ITW [UAR%]
eGeMAPS + SVM 39.4 64.9i-vectors + PLDA 50.0 79.7x-vectors + PLDA 50.0 81.0CNN-LSTM + Attn 58.0 81.0
Table 6.3: Results in UAR of the same domain experiments to detect PD.
Modeling Strategy Performance forCC vs. CC [UAR%]
Performance forITW vs. ITW [UAR%]
eGeMAPS + SVM 80.0 61.1i-vectors + PLDA 78.3 69.6x-vectors + PLDA 68.0 72.5CNN-LSTM + Attn 82.0 73.0
Same domain experiments: Baseline
In this Section we report the performance of the four systems described in Section 6.2.2 todetect depression and PD, where the train and test data originate from the same domain.
Tables 6.2 and 6.3 show the performance in UAR% on the test partition of the data of foursystems: eGeMAPS with SVM, i-vectors with PLDA, x-vectors with PLDA, and CNN-LSTMwith self-attention, when trained and tested with either data collected in CC or in-the-wildconditions, for depression and PD, respectively. There are a total of 8 combinations of MLsystems and data for each SA disease.
Focusing on the results obtained for the experiments relative to depression with CC data,which are shown in the first column of Table 6.2, we can observe that the performance ofthree out of four systems is chance level or worse. The exception is the CNN-LSTM withself-attention, which obtained a UAR of 58.0%.
The conclusion from this set of experiments is that detecting depression from speech alone inthe DAIC-WOZ specifically is a difficult task.
The results relative to the systems trained and tested with data from in-the-wild conditions,the WSM Corpus, for depression can be found on the second column of Table 6.2. In thisscenario, we obtain results that are more in line with what we would have expected: TheeGeMAPS provide a reasonable baseline for the performance of this task, with a UAR of64.9%; these are outperformed by the remaining systems, where, although with similar
109
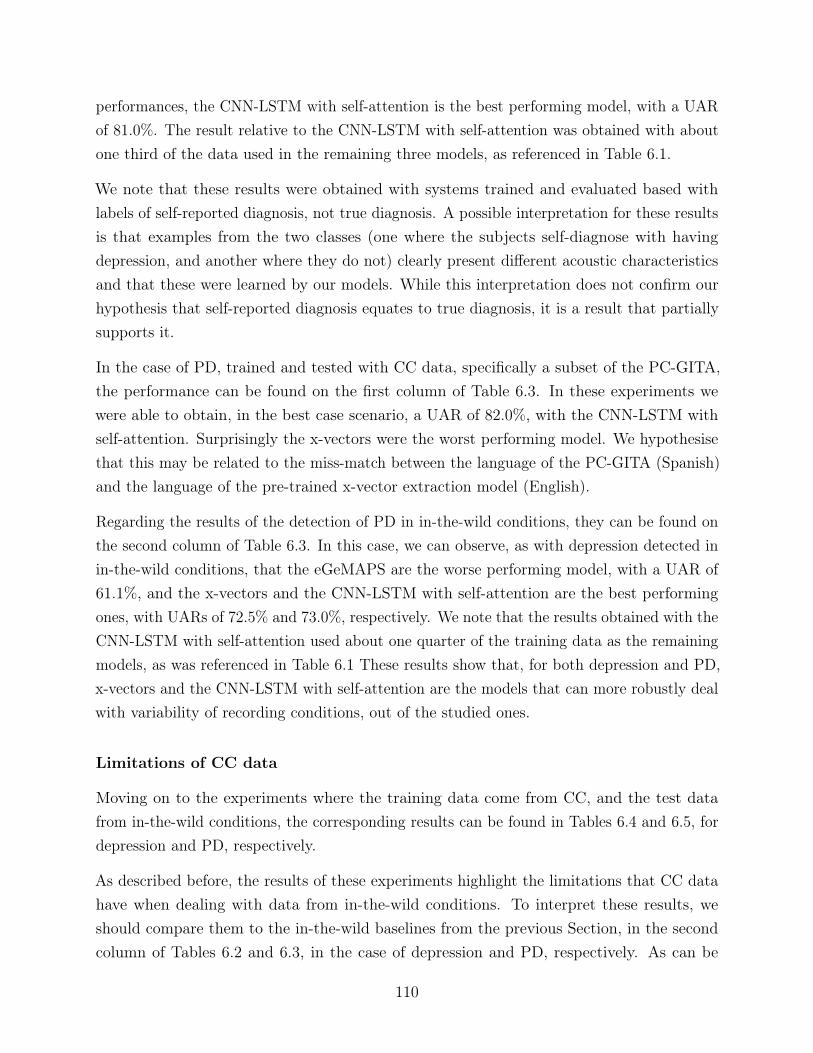
performances, the CNN-LSTM with self-attention is the best performing model, with a UARof 81.0%. The result relative to the CNN-LSTM with self-attention was obtained with aboutone third of the data used in the remaining three models, as referenced in Table 6.1.
We note that these results were obtained with systems trained and evaluated based withlabels of self-reported diagnosis, not true diagnosis. A possible interpretation for these resultsis that examples from the two classes (one where the subjects self-diagnose with havingdepression, and another where they do not) clearly present different acoustic characteristicsand that these were learned by our models. While this interpretation does not confirm ourhypothesis that self-reported diagnosis equates to true diagnosis, it is a result that partiallysupports it.
In the case of PD, trained and tested with CC data, specifically a subset of the PC-GITA,the performance can be found on the first column of Table 6.3. In these experiments wewere able to obtain, in the best case scenario, a UAR of 82.0%, with the CNN-LSTM withself-attention. Surprisingly the x-vectors were the worst performing model. We hypothesisethat this may be related to the miss-match between the language of the PC-GITA (Spanish)and the language of the pre-trained x-vector extraction model (English).
Regarding the results of the detection of PD in in-the-wild conditions, they can be found onthe second column of Table 6.3. In this case, we can observe, as with depression detected inin-the-wild conditions, that the eGeMAPS are the worse performing model, with a UAR of61.1%, and the x-vectors and the CNN-LSTM with self-attention are the best performingones, with UARs of 72.5% and 73.0%, respectively. We note that the results obtained with theCNN-LSTM with self-attention used about one quarter of the training data as the remainingmodels, as was referenced in Table 6.1 These results show that, for both depression and PD,x-vectors and the CNN-LSTM with self-attention are the models that can more robustly dealwith variability of recording conditions, out of the studied ones.
Limitations of CC data
Moving on to the experiments where the training data come from CC, and the test datafrom in-the-wild conditions, the corresponding results can be found in Tables 6.4 and 6.5, fordepression and PD, respectively.
As described before, the results of these experiments highlight the limitations that CC datahave when dealing with data from in-the-wild conditions. To interpret these results, weshould compare them to the in-the-wild baselines from the previous Section, in the secondcolumn of Tables 6.2 and 6.3, in the case of depression and PD, respectively. As can be
110
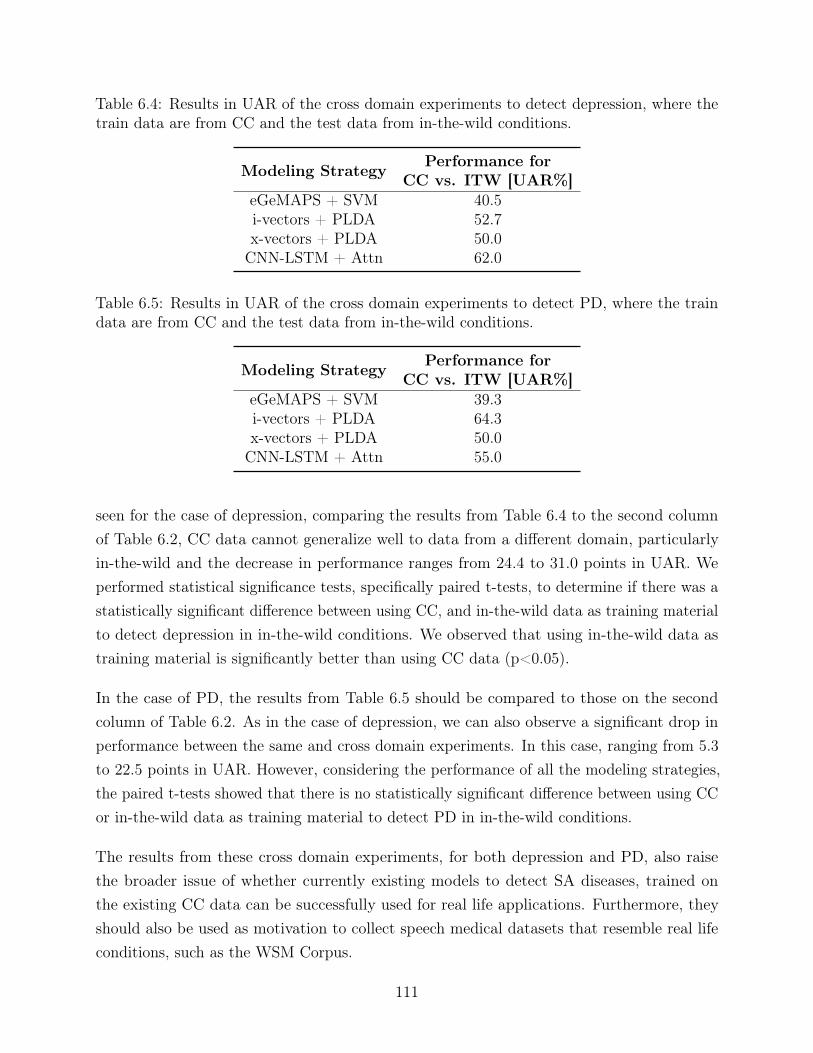
Table 6.4: Results in UAR of the cross domain experiments to detect depression, where thetrain data are from CC and the test data from in-the-wild conditions.
Modeling Strategy Performance forCC vs. ITW [UAR%]
eGeMAPS + SVM 40.5i-vectors + PLDA 52.7x-vectors + PLDA 50.0CNN-LSTM + Attn 62.0
Table 6.5: Results in UAR of the cross domain experiments to detect PD, where the traindata are from CC and the test data from in-the-wild conditions.
Modeling Strategy Performance forCC vs. ITW [UAR%]
eGeMAPS + SVM 39.3i-vectors + PLDA 64.3x-vectors + PLDA 50.0CNN-LSTM + Attn 55.0
seen for the case of depression, comparing the results from Table 6.4 to the second columnof Table 6.2, CC data cannot generalize well to data from a different domain, particularlyin-the-wild and the decrease in performance ranges from 24.4 to 31.0 points in UAR. Weperformed statistical significance tests, specifically paired t-tests, to determine if there was astatistically significant difference between using CC, and in-the-wild data as training materialto detect depression in in-the-wild conditions. We observed that using in-the-wild data astraining material is significantly better than using CC data (p<0.05).
In the case of PD, the results from Table 6.5 should be compared to those on the secondcolumn of Table 6.2. As in the case of depression, we can also observe a significant drop inperformance between the same and cross domain experiments. In this case, ranging from 5.3
to 22.5 points in UAR. However, considering the performance of all the modeling strategies,the paired t-tests showed that there is no statistically significant difference between using CCor in-the-wild data as training material to detect PD in in-the-wild conditions.
The results from these cross domain experiments, for both depression and PD, also raisethe broader issue of whether currently existing models to detect SA diseases, trained onthe existing CC data can be successfully used for real life applications. Furthermore, theyshould also be used as motivation to collect speech medical datasets that resemble real lifeconditions, such as the WSM Corpus.
111
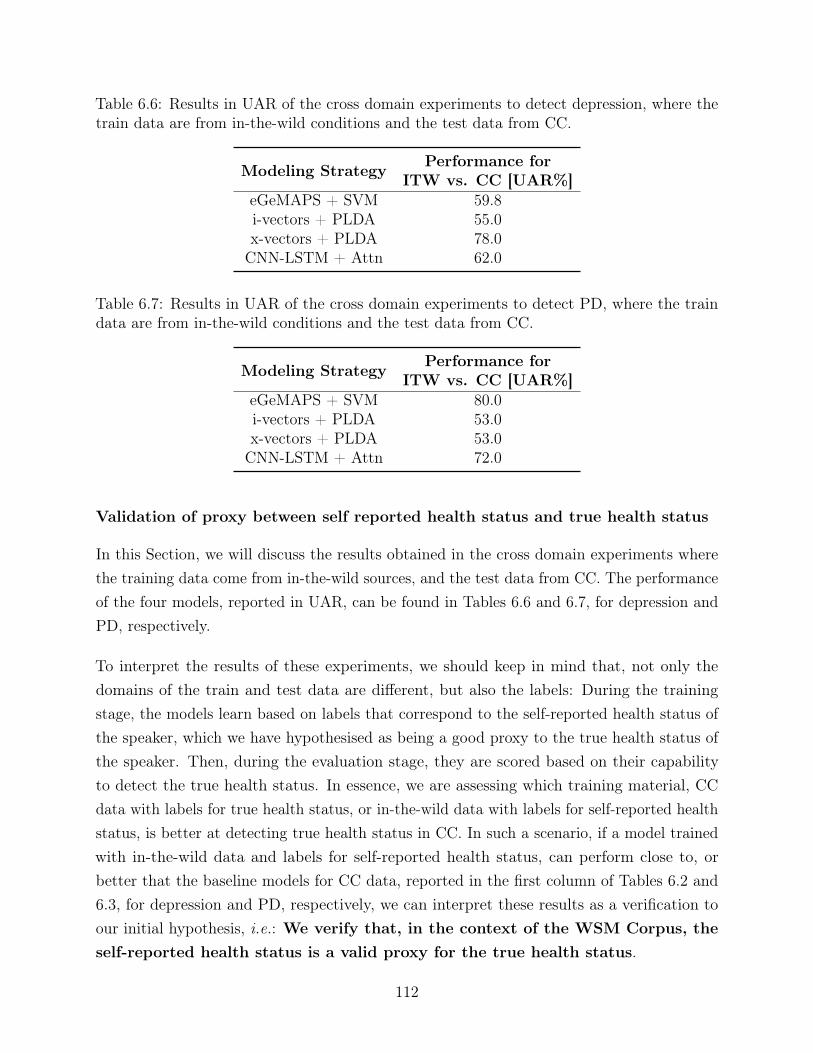
Table 6.6: Results in UAR of the cross domain experiments to detect depression, where thetrain data are from in-the-wild conditions and the test data from CC.
Modeling Strategy Performance forITW vs. CC [UAR%]
eGeMAPS + SVM 59.8i-vectors + PLDA 55.0x-vectors + PLDA 78.0CNN-LSTM + Attn 62.0
Table 6.7: Results in UAR of the cross domain experiments to detect PD, where the traindata are from in-the-wild conditions and the test data from CC.
Modeling Strategy Performance forITW vs. CC [UAR%]
eGeMAPS + SVM 80.0i-vectors + PLDA 53.0x-vectors + PLDA 53.0CNN-LSTM + Attn 72.0
Validation of proxy between self reported health status and true health status
In this Section, we will discuss the results obtained in the cross domain experiments wherethe training data come from in-the-wild sources, and the test data from CC. The performanceof the four models, reported in UAR, can be found in Tables 6.6 and 6.7, for depression andPD, respectively.
To interpret the results of these experiments, we should keep in mind that, not only thedomains of the train and test data are different, but also the labels: During the trainingstage, the models learn based on labels that correspond to the self-reported health status ofthe speaker, which we have hypothesised as being a good proxy to the true health status ofthe speaker. Then, during the evaluation stage, they are scored based on their capabilityto detect the true health status. In essence, we are assessing which training material, CCdata with labels for true health status, or in-the-wild data with labels for self-reported healthstatus, is better at detecting true health status in CC. In such a scenario, if a model trainedwith in-the-wild data and labels for self-reported health status, can perform close to, orbetter that the baseline models for CC data, reported in the first column of Tables 6.2 and6.3, for depression and PD, respectively, we can interpret these results as a verification toour initial hypothesis, i.e.: We verify that, in the context of the WSM Corpus, theself-reported health status is a valid proxy for the true health status.
112
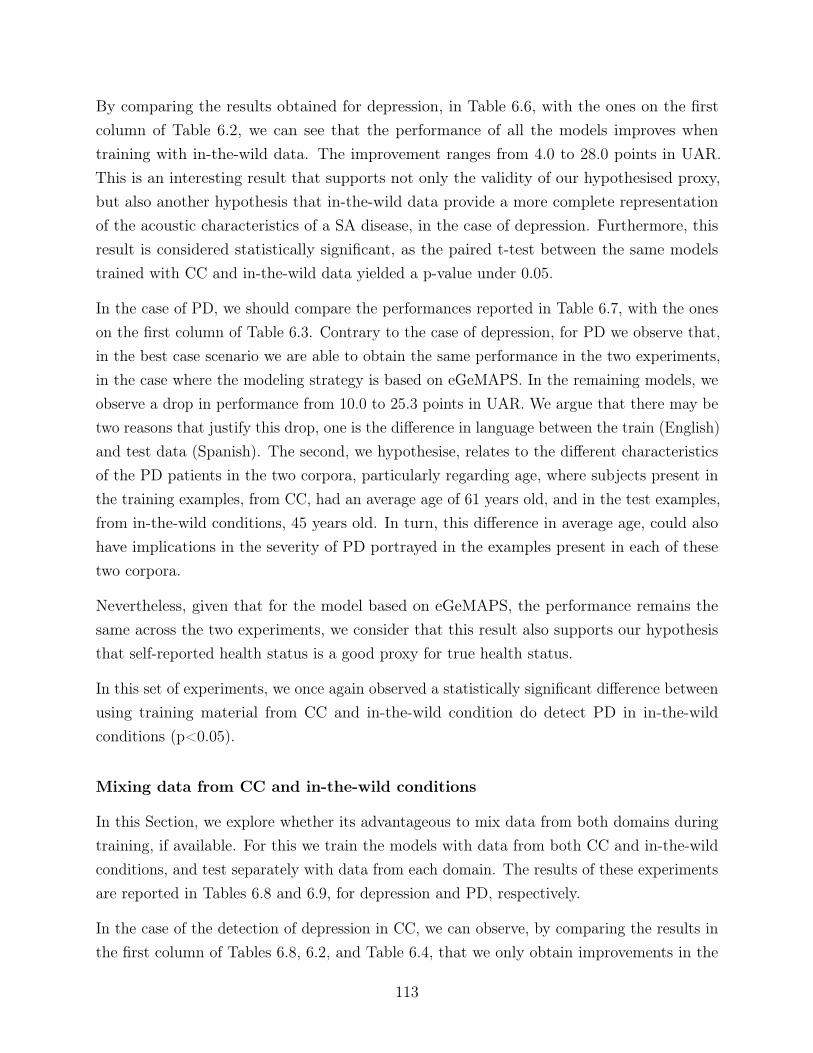
By comparing the results obtained for depression, in Table 6.6, with the ones on the firstcolumn of Table 6.2, we can see that the performance of all the models improves whentraining with in-the-wild data. The improvement ranges from 4.0 to 28.0 points in UAR.This is an interesting result that supports not only the validity of our hypothesised proxy,but also another hypothesis that in-the-wild data provide a more complete representationof the acoustic characteristics of a SA disease, in the case of depression. Furthermore, thisresult is considered statistically significant, as the paired t-test between the same modelstrained with CC and in-the-wild data yielded a p-value under 0.05.
In the case of PD, we should compare the performances reported in Table 6.7, with the oneson the first column of Table 6.3. Contrary to the case of depression, for PD we observe that,in the best case scenario we are able to obtain the same performance in the two experiments,in the case where the modeling strategy is based on eGeMAPS. In the remaining models, weobserve a drop in performance from 10.0 to 25.3 points in UAR. We argue that there may betwo reasons that justify this drop, one is the difference in language between the train (English)and test data (Spanish). The second, we hypothesise, relates to the different characteristicsof the PD patients in the two corpora, particularly regarding age, where subjects present inthe training examples, from CC, had an average age of 61 years old, and in the test examples,from in-the-wild conditions, 45 years old. In turn, this difference in average age, could alsohave implications in the severity of PD portrayed in the examples present in each of thesetwo corpora.
Nevertheless, given that for the model based on eGeMAPS, the performance remains thesame across the two experiments, we consider that this result also supports our hypothesisthat self-reported health status is a good proxy for true health status.
In this set of experiments, we once again observed a statistically significant difference betweenusing training material from CC and in-the-wild condition do detect PD in in-the-wildconditions (p<0.05).
Mixing data from CC and in-the-wild conditions
In this Section, we explore whether its advantageous to mix data from both domains duringtraining, if available. For this we train the models with data from both CC and in-the-wildconditions, and test separately with data from each domain. The results of these experimentsare reported in Tables 6.8 and 6.9, for depression and PD, respectively.
In the case of the detection of depression in CC, we can observe, by comparing the results inthe first column of Tables 6.8, 6.2, and Table 6.4, that we only obtain improvements in the
113
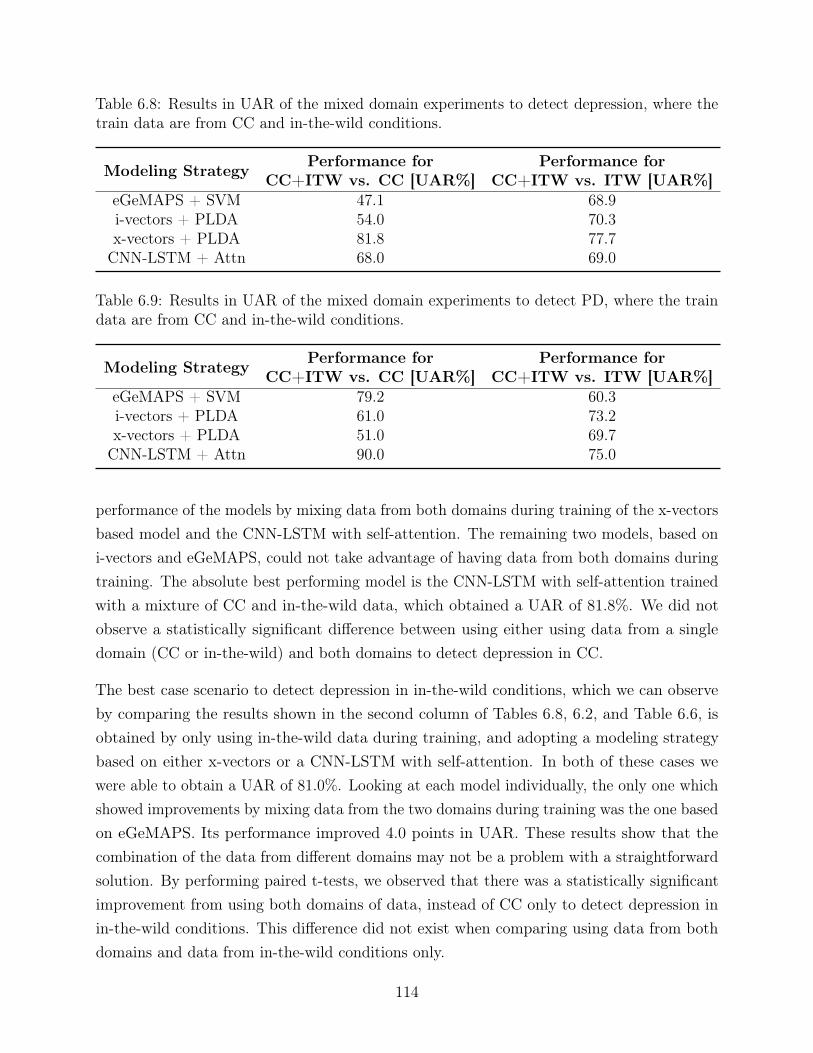
Table 6.8: Results in UAR of the mixed domain experiments to detect depression, where thetrain data are from CC and in-the-wild conditions.
Modeling Strategy Performance forCC+ITW vs. CC [UAR%]
Performance forCC+ITW vs. ITW [UAR%]
eGeMAPS + SVM 47.1 68.9i-vectors + PLDA 54.0 70.3x-vectors + PLDA 81.8 77.7CNN-LSTM + Attn 68.0 69.0
Table 6.9: Results in UAR of the mixed domain experiments to detect PD, where the traindata are from CC and in-the-wild conditions.
Modeling Strategy Performance forCC+ITW vs. CC [UAR%]
Performance forCC+ITW vs. ITW [UAR%]
eGeMAPS + SVM 79.2 60.3i-vectors + PLDA 61.0 73.2x-vectors + PLDA 51.0 69.7CNN-LSTM + Attn 90.0 75.0
performance of the models by mixing data from both domains during training of the x-vectorsbased model and the CNN-LSTM with self-attention. The remaining two models, based oni-vectors and eGeMAPS, could not take advantage of having data from both domains duringtraining. The absolute best performing model is the CNN-LSTM with self-attention trainedwith a mixture of CC and in-the-wild data, which obtained a UAR of 81.8%. We did notobserve a statistically significant difference between using either using data from a singledomain (CC or in-the-wild) and both domains to detect depression in CC.
The best case scenario to detect depression in in-the-wild conditions, which we can observeby comparing the results shown in the second column of Tables 6.8, 6.2, and Table 6.6, isobtained by only using in-the-wild data during training, and adopting a modeling strategybased on either x-vectors or a CNN-LSTM with self-attention. In both of these cases wewere able to obtain a UAR of 81.0%. Looking at each model individually, the only one whichshowed improvements by mixing data from the two domains during training was the one basedon eGeMAPS. Its performance improved 4.0 points in UAR. These results show that thecombination of the data from different domains may not be a problem with a straightforwardsolution. By performing paired t-tests, we observed that there was a statistically significantimprovement from using both domains of data, instead of CC only to detect depression inin-the-wild conditions. This difference did not exist when comparing using data from bothdomains and data from in-the-wild conditions only.
114
In the case of PD, and specifically its detection in CC, we can compare the results in the firstcolumn of Tables 6.9, 6.3, and Table 6.5, to determine that the best strategy to perform thistask is to use data from both domains during training and adopt a learning strategy basedon CNN-LSTM with self-attention. In this scenario we obtained a UAR of 90.0%, whichcorresponds to an improvement of 8.0 points to the best single domain model. Once again,only the CNN-LSTM with self-attention was able to take advantage of having data from bothdomains during training. Considering all of the proposed models, we observed that there wasno statistically significant difference between using only one domain of data during trainingand mixing data from both domains to detect PD in CC.
Finally, to study the impact of mixing data from different domains in the task of detectingPD in in-the-wild conditions, we should compare the results in the second column of Tables6.3, 6.9, and Table 6.7. From these tables we can observe that, once again, the best strategyis to train a CNN-LSTM with self-attention with data from both domains. With it we canachieve a UAR of 75.0%, which corresponds to an increase in performance of 2.0 points whencompared to the best single domain model. The model based on i-vectors was also capable ofleveraging from having training data from both domains, which resulted in an improvementin the performance of 3.6 points, to a UAR of 73.2%. Similarly to the case of detectingdepression in in-the-wild conditions, we observed that the improvement obtained by mixingthe domains of the data during training, compared to using CC data only, was statisticallysignificant (p<0.05), but this was not the case when using in-the-wild data only.
Overall we can see that, across most experiments, the leading strategy to detect SA diseasesis based on using the CNN-LSTM with self-attention, which is the only strategy that canconsistently leverage from combining data from two domains during training. However,in most experiments expect those dedicated to detect PD in in-the-wild conditions, thisdifference is not statistically significant.
Figures 6.6 and 6.7 summarize the performance in UAR of all the experiments in a morevisually intuitive manner.
We should keep in mind, however, that this strategy to combine data is naive, and thatshould only be used as a starting point to mix data from different domains.
6.2.4 Final considerations
As we conclude this Chapter, it is interesting to look back at this Chapter as well as Chapter5. In Chapter 5 we have addressed the problem of automating the collection and annotationprocess of speech medical corpora, particularly in the context of the WSM Corpus. Then, in
115
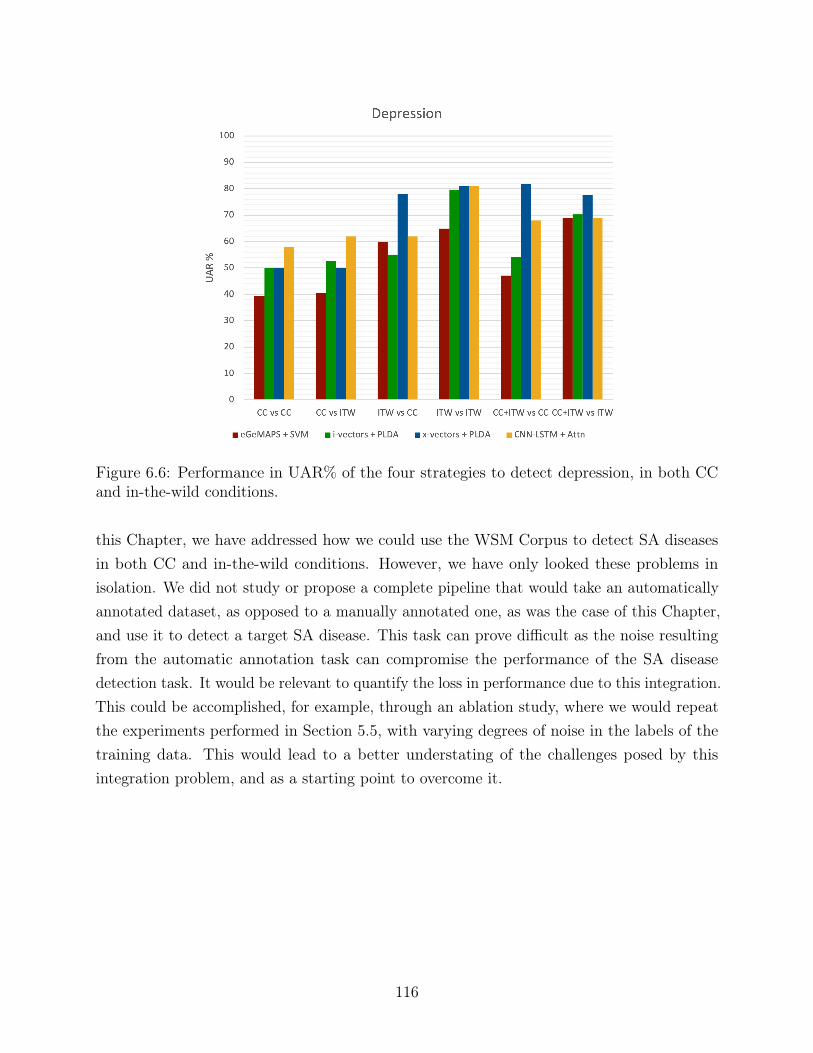
Figure 6.6: Performance in UAR% of the four strategies to detect depression, in both CCand in-the-wild conditions.
this Chapter, we have addressed how we could use the WSM Corpus to detect SA diseasesin both CC and in-the-wild conditions. However, we have only looked these problems inisolation. We did not study or propose a complete pipeline that would take an automaticallyannotated dataset, as opposed to a manually annotated one, as was the case of this Chapter,and use it to detect a target SA disease. This task can prove difficult as the noise resultingfrom the automatic annotation task can compromise the performance of the SA diseasedetection task. It would be relevant to quantify the loss in performance due to this integration.This could be accomplished, for example, through an ablation study, where we would repeatthe experiments performed in Section 5.5, with varying degrees of noise in the labels of thetraining data. This would lead to a better understating of the challenges posed by thisintegration problem, and as a starting point to overcome it.
116
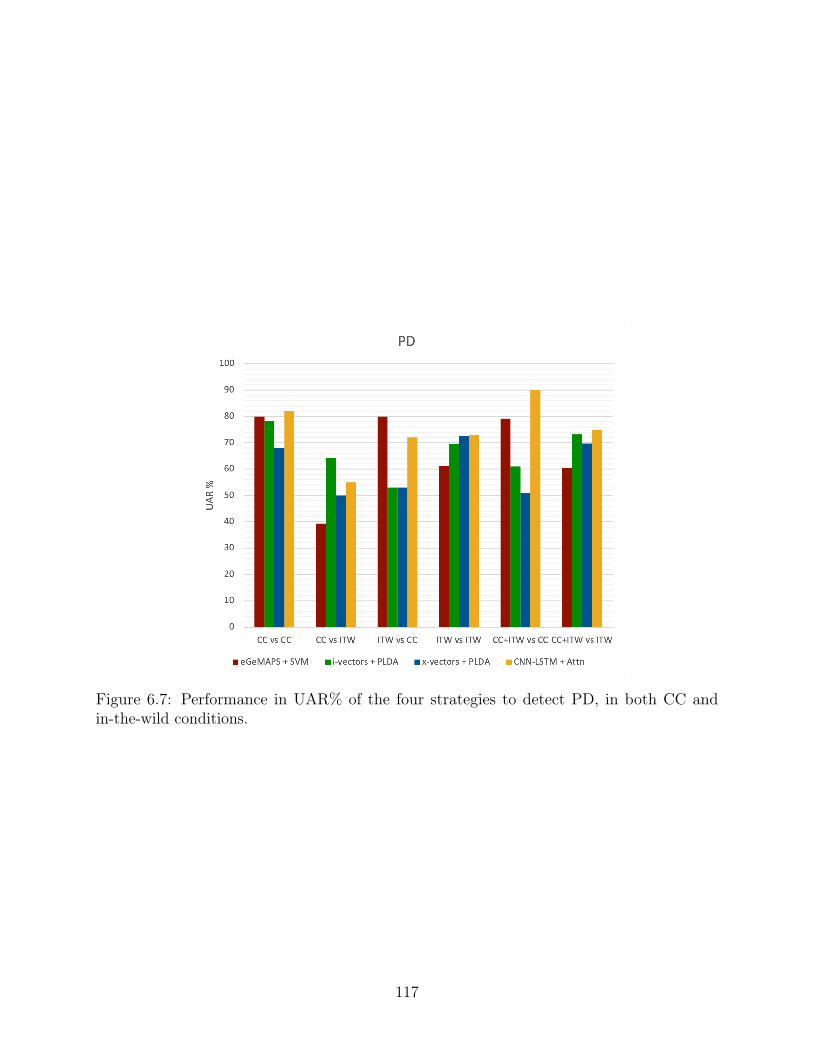
Figure 6.7: Performance in UAR% of the four strategies to detect PD, in both CC andin-the-wild conditions.
117

118

Part IV
Conclusion and future work
119

Chapter 7
Conclusions
In this thesis we have addressed the problem of detecting SA diseases particularly in in-the-wild, or real life conditions, thus addressing a problem that had not previously been tackled.While there exist numerous works related to the detection of several different SA diseases,they are restricted to CC, which, until now, have been the only conditions in which thedetection of SA diseases has been studied.
In the scope of this thesis, we adopted two SA diseases as our working examples, depressionand PD. We used them to experimentally verify our proposed solutions for the problem ofdetecting SA diseases in in-the-wild conditions. We were able to address the problem at everystage, from data collection and annotation, to problem modeling.
Over the course of this thesis we were able to make several contributions towards performingin-the-wild detection of SA diseases, of which we highlight the following:
• WSM Corpus: The WSM Corpus, which was collected and manually annotated inthe scope of this thesis, is a first of its kind corpus of mutimodal recordings collectedfrom online multimedia sources. The corpus currently contains roughy one thousandrecordings of subjects affected by depression and PD. This corpus represents whatis, to the best of our knowledge, the first publicly available speech medical corpus inin-the-wild conditions, as well as one of the largest speech medical corpora available,regardless of recording conditions.
• Automatic corpora collection and annotation strategies: In an effort to reducethe costs associated to the manual collection and annotation of corpora, specificallyspeech medical corpora, we have proposed several contributions to automate this process,using different amounts of labeled data during training, from 0 to 100%, and using
121
existing massive online multimedia repositories as the data source. We were able toexperimentally test our proposed techniques on the WSM Corpus and verify theirvalidity. At the same time, our contributions remained disease agnostic, allowing themto be easily used to automatically create speech medical datasets for SA diseases otherthan the two examples studied, depression and PD.
• Study comparing the detection of SA in CC and in-the-wild conditions: Inthe scope of this thesis, we were able to perform what is, to the best of our knowledge,the first study that compares the characteristics of in-the-wild vs CC speech medicaldata, and, at the same time, compare how current SA disease detection methods performin both conditions. This was, again to the best of our knowledge, the first work thatmeasured the limitations posed by diagnosis tools trained on CC data when faced withreal life scenarios. We also showed that, specifically for the examples of depression andPD, in-the-wild data can be used to create a more complete acoustic representation ofthe characteristics of these diseases than their CC counterparts.
• In-the-wild SA diseases detection: Arguably the most important contribution ofthis thesis was proposing novel strategies to detect SA diseases that we experimentallydemonstrated to be successful in detecting SA diseases in-the-wild conditions. We wereable to show this for two very different SA diseases, depression and PD, while adheringto our initial goal of proposing solutions that were disease agnostics, i.e. did not takeadvantage of any domain specific knowledge for the target SA disease. This choiceallows future works to leverage from the contributions of this thesis, to create a startingpoint to the detection of other SA diseases for which there does not need to exist anyprior domain knowledge.
The work developed in the scope of this thesis can have several immediate real life applications,all of which contribute to democratizing the access to quality healthcare. They include:
• Diagnosis aid tools: These technologies can be used in tandem with appropriatemedical specialists, in a hospital scenario, to provide complementary insight on thepatient’s health status. They would not be restricted to the typical CC where specificspeaking exercises and recording conditions are necessary. Our proposed solutions couldbe implemented simply as an app running in the background of a medical appointment,providing additional real life feedback to the healthcare specialist.
• Patient monitoring in clinical trials: Clinical trials are lengthy and costly due totheir meticulous nature. The technologies developed in the scope of this thesis couldbe used to provide better monitoring of the trial subjects, by providing them with, for
122

example, a smartphone with an SA disease monitoring app. This might contribute toreducing the amount of time necessary to assess the effects of a new drug or treatment,and consequently, reducing the length and cost of clinical trials.
• Personal health monitoring tool: Running as background applications on anypersonal devices, including smartphones, smartwatches, personal computers, digitalassistants, etc., to provide frequent monitoring of a subjects health status.
123

124
Chapter 8
Future work
In this thesis we have laid the ground for the in-the-wild detection of SA diseases. As oneof the first publicly available works dedicated to the detection of SA diseases specifically inreal-life scenarios, there is still a lot of room to further develop the work that was presentedin this thesis. Some of the future work directions of this thesis include:
• WSM Corpus: The WSM Corpus is an ever growing corpus, as such it will continueto be expanded, both in term of the existing datasets (for depression and PD), as wellas datasets for other SA diseases. Our short term goals include creating new datasetsin the WSM Corpus dedicated to OSA, the flu, and COVID-19, expanding the existingdepression and PD datasets, and creating longitudinal datasets where samples from thesame speaker are collected over long periods of time. This would, not only result ina larger and more diverse resource of speech medical data, but would also allow thestudy of more SA diseases, other than the ones contemplated in this thesis.
• Other modalities: In the scope of this thesis we have focused on performing thedetection of SA diseases from the speech modality alone. However, the WSM Corpus,as a multi-modal corpus, allows the study of these diseases using other modalities. Wehighlight the visual modality as the natural next step to study diseases such as PD,known to have several motor symptoms, which are already present in the corpus, thusenriching the information used to perform the diagnosis.
• Other languages: In this thesis we have focused on detecting SA diseases in English.At the same time, the WSM Corpus is currently also restricted to videos in the Englishlanguage. It would be relevant to not only collect data in other languages, but also tocompare the detection of a given SA across different languages.
125
• Longitudinal studies: An aspect that is of great relevance that was not addressed inthis thesis, relates to the study of chronic SA diseases over time. It would be of greatrelevance to be able to study, for example, how the speech impairments of patientsaffected by PD evolve over the years, thus establishing a correlation between voice anddisease severity.
• Adopting disease specific strategies: We have emphasised several times that oursolutions to the problem of detecting SA diseases would be disease agnostic. In a way,our goal was to have this thesis be a sort of template for future works in the detectionof SA diseases in real life conditions. We have attempted, over the course of this thesis,to present solutions that can be, on one hand used as a starting point for the studyof other SA diseases, and on the other hand, easily adapted and specialized to dealwith specific SA diseases. With this in mind it would be relevant to adapt the solutionsproposed in this thesis so that they would be specific to either depression or PD, amongother SA diseases, and perform a study on the impact of such changes. Naturally,we would expect the performance of the disease specific solutions to improve over thesolutions presented in this thesis.
• Leveraging from multiple domains of data to detect SA diseases: In Chapter6, we have performed several experiments to detect SA diseases, including experimentswhere we attempted to leverage from having data from both CC and in-the-wild domainsto detect SA diseases. In these experiments it was not clear that we were able to benefitfrom having data from the two domains. Instead of naively mixing the data, moresophisticated methods should be studied in order to take advantage of having datafrom both domains.
• Real world applications: Finally, we believe it would be very relevant to applythe work proposed in this thesis to real life applications, e.g. by having smartphoneapplications, smartwatches, virtual assistants, etc. use the proposed solutions andoffering the possibility to monitor and detect SA diseases in real life.
Looking back at the work developed in this thesis, and at the future work we propose, it isimportant to keep in mind the essence of the problem we are attempting to solve. We areattempting to improve the quality and accessibility of medical diagnosis, thus, to improvehumanity’s quality of life. This thesis is a small contribution towards this goal.
However, given the sensitive nature of this goal, or any other health related goals, it isparamount to maintain a very conservative perspective when making any claims derived fromexperimental results.
126

In the context of this thesis, can we claim that we have solved the problem of detectingSA diseases in in-the-wild conditions? Or are we restricted to a smaller claim, related todepression and PD alone, and even then, only in the context of the studied datasets? Andwhat is the validity of the results we present, given the small amount of data, specifically CCdata, that we used in the scope of this thesis, to attempt to answer the research questionsposed in Section 1? These, and other questions will remain open to discussion, and our workshould be viewed as one more piece of evidence to form consistent scientific consensus aroundthe problem of detecting SA diseases, of any nature, in any conditions.
127

128
Bibliography
[1] C. Jiao, X. Du, and A. Zare, “Addressing the inevitable imprecision: Multiple instancelearning for hyperspectral image analysis,” in Hyperspectral Image Analysis. Springer,2020, pp. 141–185.
[2] S. Andrews, I. Tsochantaridis, and T. Hofmann, “Support vector machines for multiple-instance learning,” in Advances in neural information processing systems, 2002, pp.561–568.
[3] M. J. Patel, A. Khalaf, and H. J. Aizenstein, “Studying depression using imaging andmachine learning methods,” NeuroImage: Clinical, vol. 10, pp. 115–123, 2016.
[4] C. Salvatore, A. Cerasa, I. Castiglioni, F. Gallivanone, A. Augimeri, M. Lopez, G. Arabia,M. Morelli, M. Gilardi, and A. Quattrone, “Machine learning on brain mri data fordifferential diagnosis of parkinson’s disease and progressive supranuclear palsy,” Journalof neuroscience methods, vol. 222, pp. 230–237, 2014.
[5] C. Plant, S. J. Teipel, A. Oswald, C. Böhm, T. Meindl, J. Mourao-Miranda, A. W.Bokde, H. Hampel, and M. Ewers, “Automated detection of brain atrophy patternsbased on mri for the prediction of alzheimer’s disease,” Neuroimage, vol. 50, no. 1, pp.162–174, 2010.
[6] B. Hosseinifard, M. H. Moradi, and R. Rostami, “Classifying depression patients andnormal subjects using machine learning techniques and nonlinear features from eegsignal,” Computer methods and programs in biomedicine, vol. 109, no. 3, pp. 339–345,2013.
[7] H. Korkalainen, J. Aakko, S. Nikkonen, S. Kainulainen, A. Leino, B. Duce, I. O. Afara,S. Myllymaa, J. Töyräs, and T. Leppänen, “Accurate deep learning-based sleep stagingin a clinical population with suspected obstructive sleep apnea,” IEEE journal ofbiomedical and health informatics, vol. 24, no. 7, pp. 2073–2081, 2019.
129
[8] M. D. Crutcher, R. Calhoun-Haney, C. M. Manzanares, J. J. Lah, A. I. Levey, andS. M. Zola, “Eye tracking during a visual paired comparison task as a predictor of earlydementia,” American Journal of Alzheimer’s Disease & Other Dementias®, vol. 24,no. 3, pp. 258–266, 2009.
[9] Y. Zhang, T. Wilcockson, K. I. Kim, T. Crawford, H. Gellersen, and P. Sawyer,“Monitoring dementia with automatic eye movements analysis,” in Intelligent DecisionTechnologies 2016. Springer, 2016, pp. 299–309.
[10] A. Y. Meigal, K. S. Prokhorov, N. A. Bazhenov, L. I. Gerasimova-Meigal, and D. G. Ko-rzun, “Towards a personal at-home lab for motion video tracking in patients with parkin-son’s disease,” in 2017 21st Conference of Open Innovations Association (FRUCT).IEEE, 2017, pp. 231–237.
[11] R. C. Kessler et al., “Lifetime prevalence and age-of-onset distributions of mentaldisorders in the world health organization’s world mental health survey initiative,”World psychiatry, vol. 6, no. 3, p. 168, 2007.
[12] T. Üstün, J. Ayuso-Mateos, S. Chatterji, C. Mathers, and C. Murray, “Global burdenof depressive disorders in the year 2000,” The British journal of psychiatry, vol. 184,no. 5, pp. 386–392, 2004.
[13] W. H. Organization, “Depression: A global public health concern,” https://www.who.int/mental_health/management/depression/who_paper_depression_wfmh_2012.pdf.
[14] J. Olesen, A. Gustavsson, M. Svensson, H.-U. Wittchen, B. Jönsson, C. S. Group, andE. B. Council, “The economic cost of brain disorders in europe,” European journal ofneurology, vol. 19, no. 1, pp. 155–162, 2012.
[15] R. C. Kessler, S. Aguilar-Gaxiola, J. Alonso, S. Chatterji, S. Lee, J. Ormel, T. B. Üstün,and P. S. Wang, “The global burden of mental disorders: an update from the who worldmental health (wmh) surveys,” Epidemiology and Psychiatric Sciences, vol. 18, no. 1,pp. 23–33, 2009.
[16] P. E. Greenberg, R. C. Kessler, T. L. Nells, S. N. Finkelstein, and E. R. Berndt,“Depression in the workplace: an economic perspective,” Selective Serotonin ReuptakeInhibitors: Advances in Basic Research and Clinical Practice. New York: John Wiley& Sons Ltd, 1996.
130
[17] K. Sanderson, E. Tilse, J. Nicholson, B. Oldenburg, and N. Graves, “Which presenteeismmeasures are more sensitive to depression and anxiety?” Journal of affective disorders,vol. 101, no. 1-3, pp. 65–74, 2007.
[18] A. P. Association et al., Diagnostic and statistical manual of mental disorders (DSM-5®). American Psychiatric Pub, 2013.
[19] K. Kroenke and R. L. Spitzer, “The phq-9: a new depression diagnostic and severitymeasure,” Psychiatric annals, vol. 32, no. 9, pp. 509–515, 2002.
[20] C. Sobin and H. A. Sackeim, “Psychomotor symptoms of depression,” American Journalof Psychiatry, vol. 154, no. 1, pp. 4–17, 1997.
[21] G. Parker, D. Hadzi-Pavlovic, H. Brodaty, P. Boyce, P. Mitchell, K. Wilhelm, I. Hickie,and K. Eyers, “Psychomotor disturbance in depression: defining the constructs,” Journalof affective disorders, vol. 27, no. 4, pp. 255–265, 1993.
[22] C. Sobin, L. Mayer, and J. Endicott, “The motor agitation and retardation scale: ascale for the assessment of motor abnormalities in depressed patients,” The Journal ofneuropsychiatry and clinical neurosciences, vol. 10, no. 1, pp. 85–92, 1998.
[23] D. J. Widlöcher, “Psychomotor retardation: clinical, theoretical, and psychometricaspects.” Psychiatric Clinics of North America, 1983.
[24] H. Ellgring and K. R. Scherer, “Vocal indicators of mood change in depression,” Journalof Nonverbal Behavior, vol. 20, no. 2, pp. 83–110, 1996.
[25] A. J. Flint, S. E. Black, I. Campbell-Taylor, G. F. Gailey, and C. Levinton, “Abnormalspeech articulation, psychomotor retardation, and subcortical dysfunction in majordepression,” Journal of psychiatric research, vol. 27, no. 3, pp. 309–319, 1993.
[26] J. K. Darby and H. Hollien, “Vocal and speech patterns of depressive patients,” FoliaPhoniatrica et Logopaedica, vol. 29, no. 4, pp. 279–291, 1977.
[27] A. Ozdas, R. G. Shiavi, S. E. Silverman, M. K. Silverman, and D. M. Wilkes, “Inves-tigation of vocal jitter and glottal flow spectrum as possible cues for depression andnear-term suicidal risk,” IEEE Transactions on Biomedical Engineering, vol. 51, no. 9,pp. 1530–1540, 2004.
[28] R. Kliper, S. Portuguese, and D. Weinshall, “Prosodic analysis of speech and the under-lying mental state,” in International Symposium on Pervasive Computing Paradigmsfor Mental Health. Springer, 2015, pp. 52–62.
131
[29] L.-S. A. Low, N. C. Maddage, M. Lech, L. B. Sheeber, and N. B. Allen, “Detection ofclinical depression in adolescents’ speech during family interactions,” IEEE Transactionson Biomedical Engineering, vol. 58, no. 3, pp. 574–586, 2010.
[30] J. Jankovic, “Parkinson’s disease: clinical features and diagnosis,” Journal of neurology,neurosurgery & psychiatry, vol. 79, no. 4, pp. 368–376, 2008.
[31] L. M. De Lau and M. M. Breteler, “Epidemiology of parkinson’s disease,” The LancetNeurology, vol. 5, no. 6, pp. 525–535, 2006.
[32] M. d. De Rijk, C. Tzourio, M. Breteler, J. Dartigues, L. Amaducci, S. Lopez-Pousa,J. Manubens-Bertran, A. Alperovitch, and W. A. Rocca, “Prevalence of parkinsonismand parkinson’s disease in europe: the europarkinson collaborative study. europeancommunity concerted action on the epidemiology of parkinson’s disease.” Journal ofNeurology, Neurosurgery & Psychiatry, vol. 62, no. 1, pp. 10–15, 1997.
[33] W. Yang, J. L. Hamilton, C. Kopil, J. C. Beck, C. M. Tanner, R. L. Albin, E. R. Dorsey,N. Dahodwala, I. Cintina, P. Hogan et al., “Current and projected future economicburden of parkinson’s disease in the us,” npj Parkinson’s Disease, vol. 6, no. 1, pp. 1–9,2020.
[34] J. Parkinson, “An essay on the shaking palsy,” The Journal of neuropsychiatry andclinical neurosciences, vol. 14, no. 2, pp. 223–236, 2002.
[35] P. A. Kempster, D. R. Williams, M. Selikhova, J. Holton, T. Revesz, and A. J. Lees,“Patterns of levodopa response in parkinson’s disease: a clinico-pathological study,”Brain, vol. 130, no. 8, pp. 2123–2128, 2007.
[36] A. J. Hughes, S. E. Daniel, L. Kilford, and A. J. Lees, “Accuracy of clinical diagnosis ofidiopathic parkinson’s disease: a clinico-pathological study of 100 cases.” Journal ofNeurology, Neurosurgery & Psychiatry, vol. 55, no. 3, pp. 181–184, 1992.
[37] C. G. Goetz, B. C. Tilley, S. R. Shaftman, G. T. Stebbins, S. Fahn, P. Martinez-Martin,W. Poewe, C. Sampaio, M. B. Stern, R. Dodel et al., “Movement disorder society-sponsored revision of the unified parkinson’s disease rating scale (mds-updrs): scalepresentation and clinimetric testing results,” Movement disorders: official journal ofthe Movement Disorder Society, vol. 23, no. 15, pp. 2129–2170, 2008.
[38] P. Enderby, “Frenchay dysarthria assessment,” British Journal of Disorders of Commu-nication, vol. 15, no. 3, pp. 165–173, 1980.
[39] P. M. Enderby and R. Palmer, Frenchay dysarthria assessment. Pro-ed, 2008.
132
[40] L. O. Ramig, C. Fox, and S. Sapir, “Speech treatment for parkinson’s disease,” ExpertReview of Neurotherapeutics, vol. 8, no. 2, pp. 297–309, 2008.
[41] J. Müller, G. K. Wenning, M. Verny, A. McKee, K. R. Chaudhuri, K. Jellinger,W. Poewe, and I. Litvan, “Progression of dysarthria and dysphagia in postmortem-confirmed parkinsonian disorders,” Archives of neurology, vol. 58, no. 2, pp. 259–264,2001.
[42] K. K. Baker, L. O. Ramig, E. S. Luschei, and M. E. Smith, “Thyroarytenoid muscleactivity associated with hypophonia in parkinson disease and aging,” Neurology, vol. 51,no. 6, pp. 1592–1598, 1998.
[43] S. Perez-Lloret, L. Nègre-Pagès, A. Ojero-Senard, P. Damier, A. Destée, F. Tison,M. Merello, O. Rascol, and C. S. Group, “Oro-buccal symptoms (dysphagia, dysarthria,and sialorrhea) in patients with parkinson’s disease: preliminary analysis from thefrench copark cohort,” European journal of neurology, vol. 19, no. 1, pp. 28–37, 2012.
[44] N. A. Leopold and M. C. Kagel, “Prepharyngeal dysphagia in parkinson’s disease,”Dysphagia, vol. 11, no. 1, pp. 14–22, 1996.
[45] J. Kalf, B. Bloem, and M. Munneke, “Diurnal and nocturnal drooling in parkinson’sdisease,” Journal of neurology, vol. 259, no. 1, pp. 119–123, 2012.
[46] F. L. Darley, A. E. Aronson, and J. R. Brown, “Differential diagnostic patterns ofdysarthria,” Journal of speech and hearing research, vol. 12, no. 2, pp. 246–269, 1969.
[47] J. A. Logemann and H. B. Fisher, “Vocal tract control in parkinson’s disease,” Journalof Speech and Hearing Disorders, vol. 46, no. 4, pp. 348–352, 1981.
[48] R. E. Bartt and J. L. Topel, “Chapter 50 - autoimmune and inflammatorydisorders,” in Textbook of Clinical Neurology (Third Edition), third edition ed., C. G.Goetz, Ed. Philadelphia: W.B. Saunders, 2007, pp. 1155–1184. [Online]. Available:http://www.sciencedirect.com/science/article/pii/B9781416036180100505
[49] R. Matison, R. Mayeux, J. Rosen, and S. Fahn, “ “tip-of-the-tongue” phenomenon inparkinson disease,” Neurology, vol. 32, no. 5, pp. 567–567, 1982.
[50] J. Gratch, R. Artstein, G. M. Lucas, G. Stratou, S. Scherer, A. Nazarian, R. Wood,J. Boberg, D. DeVault, S. Marsella et al., “The distress analysis interview corpus ofhuman and computer interviews.” in LREC. Citeseer, 2014, pp. 3123–3128.
[51] D. DeVault, R. Artstein, G. Benn, T. Dey, E. Fast, A. Gainer, K. Georgila, J. Gratch,A. Hartholt, M. Lhommet et al., “Simsensei kiosk: A virtual human interviewer for
133
healthcare decision support,” in Proceedings of the 2014 international conference onAutonomous agents and multi-agent systems. International Foundation for AutonomousAgents and Multiagent Systems, 2014, pp. 1061–1068.
[52] E. B. Blanchard, J. Jones-Alexander, T. C. Buckley, and C. A. Forneris, “Psychometricproperties of the ptsd checklist (pcl),” Behaviour research and therapy, vol. 34, no. 8,pp. 669–673, 1996.
[53] C. D. Spielberger, “State-trait anxiety inventory,” The Corsini encyclopedia of psychol-ogy, pp. 1–1, 2010.
[54] J. R. Orozco-Arroyave, J. D. Arias-Londoño, J. F. Vargas-Bonilla, M. C. Gonzalez-Rátiva, and E. Nöth, “New spanish speech corpus database for the analysis of peoplesuffering from parkinson’s disease.” in LREC, 2014, pp. 342–347.
[55] M. D. S. T. F. on Rating Scales for Parkinson’s Disease, “The unified parkinson’s diseaserating scale (updrs): status and recommendations,” Movement Disorders, vol. 18, no. 7,pp. 738–750, 2003.
[56] C. G. Goetz, W. Poewe, O. Rascol, C. Sampaio, G. T. Stebbins, C. Counsell, N. Giladi,R. G. Holloway, C. G. Moore, G. K. Wenning et al., “Movement disorder society taskforce report on the hoehn and yahr staging scale: status and recommendations themovement disorder society task force on rating scales for parkinson’s disease,” Movementdisorders, vol. 19, no. 9, pp. 1020–1028, 2004.
[57] N. Cummins, M. Schmitt, S. Amiriparian, J. Krajewski, and B. Schuller, “ “you soundill, take the day off”: Automatic recognition of speech affected by upper respiratorytract infection,” in Engineering in Medicine and Biology Society (EMBC), 2017 39thAnnual International Conference of the IEEE. IEEE, 2017, pp. 3806–3809.
[58] F. Boller and J. Becker, “Dementiabank database guide,” University of Pittsburgh, 2005.
[59] F. Rudzicz, A. K. Namasivayam, and T. Wolff, “The torgo database of acoustic andarticulatory speech from speakers with dysarthria,” Language Resources and Evaluation,vol. 46, no. 4, pp. 523–541, 2012.
[60] F. Ringeval, J. Demouy, G. Szaszak, M. Chetouani, L. Robel, J. Xavier, D. Cohen, andM. Plaza, “Automatic intonation recognition for the prosodic assessment of language-impaired children,” IEEE Transactions on Audio, Speech, and Language Processing,vol. 19, no. 5, pp. 1328–1342, 2010.
134
[61] N. Sharma, P. Krishnan, R. Kumar, S. Ramoji, S. R. Chetupalli, P. K. Ghosh, S. Gana-pathy et al., “Coswara–a database of breathing, cough, and voice sounds for covid-19diagnosis,” arXiv preprint arXiv:2005.10548, 2020.
[62] A. Dhall, R. Goecke, S. Lucey, T. Gedeon et al., “Collecting large, richly annotatedfacial-expression databases from movies,” IEEE multimedia, vol. 19, no. 3, pp. 34–41,2012.
[63] S. Newman and V. G. Mather, “Analysis of spoken language of patients with affectivedisorders,” American journal of psychiatry, vol. 94, no. 4, pp. 913–942, 1938.
[64] B. Pope, T. Blass, A. W. Siegman, and J. Raher, “Anxiety and depression in speech.”Journal of Consulting and Clinical Psychology, vol. 35, no. 1p1, p. 128, 1970.
[65] W. A. Hargreaves, J. Starkweather, and K. Blacker, “Voice quality in depression.”Journal of Abnormal Psychology, vol. 70, no. 3, p. 218, 1965.
[66] E. Whitman and D. Flicker, “A potential new measurement of emotional state: Apreliminary report,” Newark Beth-Israel Hospital, vol. 17, pp. 167–172, 1966.
[67] N. C. Andreasen, M. Alpert, and M. J. Martz, “Acoustic analysis: an objective measureof affective flattening,” Archives of General Psychiatry, vol. 38, no. 3, pp. 281–285,1981.
[68] M. F. Valstar, J. Gratch, B. W. Schuller, F. Ringeval, D. Lalanne, M. Torres,S. Scherer, G. Stratou, R. Cowie, and M. Pantic, “AVEC 2016 - depression, mood,and emotion recognition workshop and challenge,” CoRR, vol. abs/1605.01600, 2016.[Online]. Available: http://arxiv.org/abs/1605.01600
[69] G. Degottex, J. Kane, T. Drugman, T. Raitio, and S. Scherer, “Covarep—a collaborativevoice analysis repository for speech technologies,” in 2014 ieee international conferenceon acoustics, speech and signal processing (icassp). IEEE, 2014, pp. 960–964.
[70] L. Yang, D. Jiang, L. He, E. Pei, M. Oveneke, and H. Sahli, “Decision tree baseddepression classification from audio video and language information,” in Proceedings ofthe 6th International Workshop on Audio/Visual Emotion Challenge. ACM, 2016, pp.89–96.
[71] J. Williamson, E. Godoy, M. Cha, A. Schwarzentruber, P. Khorrami, Y. Gwon, H. Kung,C. Dagli, and T. Quatieri, “Detecting depression using vocal, facial and semanticcommunication cues,” in Proceedings of the 6th International Workshop on Audio/VisualEmotion Challenge. ACM, 2016, pp. 11–18.
135
[72] M. Nasir, A. Jati, P. G. Shivakumar, S. Nallan Chakravarthula, and P. Georgiou,“Multimodal and multiresolution depression detection from speech and facial landmarkfeatures,” in Proceedings of the 6th International Workshop on Audio/Visual EmotionChallenge, 2016, pp. 43–50.
[73] X. Ma, H. Yang, Q. Chen, D. Huang, and Y. Wang, “Depaudionet: An efficient deepmodel for audio based depression classification,” in Proceedings of the 6th InternationalWorkshop on Audio/Visual Emotion Challenge, 2016, pp. 35–42.
[74] A. Pampouchidou, O. Simantiraki, A. Fazlollahi, M. Pediaditis, D. Manousos, A. Ronio-tis, G. Giannakakis, F. Meriaudeau, P. Simos, K. Marias et al., “Depression assessmentby fusing high and low level features from audio, video, and text,” in Proceedings of the6th International Workshop on Audio/Visual Emotion Challenge, 2016, pp. 27–34.
[75] L. Yang, H. Sahli, X. Xia, E. Pei, M. C. Oveneke, and D. Jiang, “Hybrid depressionclassification and estimation from audio video and text information,” in Proceedings ofthe 7th Annual Workshop on Audio/Visual Emotion Challenge, 2017, pp. 45–51.
[76] L. Yang, D. Jiang, X. Xia, E. Pei, M. C. Oveneke, and H. Sahli, “Multimodal mea-surement of depression using deep learning models,” in Proceedings of the 7th AnnualWorkshop on Audio/Visual Emotion Challenge, 2017, pp. 53–59.
[77] F. Eyben, K. Scherer, B. Schuller, J. Sundberg, E. André, C. Busso, L. Devillers,J. Epps, P. Laukka, S. Narayanan, and K. Truong, “The geneva minimalistic acousticparameter set (gemaps) for voice research and affective computing,” IEEE transactionson affective computing, vol. 7, no. 2, pp. 190–202, 4 2016, open access.
[78] W. Fan, Z. He, X. Xing, B. Cai, and W. Lu, “Multi-modality depression detectionvia multi-scale temporal dilated cnns,” in Proceedings of the 9th International onAudio/Visual Emotion Challenge and Workshop, 2019, pp. 73–80.
[79] A. Ray, S. Kumar, R. Reddy, P. Mukherjee, and R. Garg, “Multi-level attentionnetwork using text, audio and video for depression prediction,” in Proceedings of the9th International on Audio/Visual Emotion Challenge and Workshop, 2019, pp. 81–88.
[80] M. Schmitt and B. Schuller, “Openxbow: introducing the passau open-source crossmodalbag-of-words toolkit,” The Journal of Machine Learning Research, vol. 18, no. 1, pp.3370–3374, 2017.
[81] L. Yang, D. Jiang, and H. Sahli, “Feature augmenting networks for improving depressionseverity estimation from speech signals,” IEEE Access, vol. 8, pp. 24 033–24 045, 2020.
136
[82] Z. Zhao, Z. Bao, Z. Zhang, N. Cummins, H. Wang, and B. Schuller, “Hierarchical atten-tion transfer networks for depression assessment from speech,” in ICASSP 2020-2020IEEE International Conference on Acoustics, Speech and Signal Processing (ICASSP).IEEE, 2020, pp. 7159–7163.
[83] M. Little, P. McSharry, E. Hunter, J. Spielman, and L. Ramig, “Suitability of dysphoniameasurements for telemonitoring of parkinson’s disease,” Nature Precedings, pp. 1–1,2008.
[84] A. Tsanas, M. A. Little, P. E. McSharry, J. Spielman, and L. O. Ramig, “Novel speechsignal processing algorithms for high-accuracy classification of parkinson’s disease,”IEEE transactions on biomedical engineering, vol. 59, no. 5, pp. 1264–1271, 2012.
[85] S. Sapir, L. O. Ramig, J. L. Spielman, and C. Fox, “Formant centralization ratio: Aproposal for a new acoustic measure of dysarthric speech,” Journal of speech, language,and hearing research, 2010.
[86] J. Rusz, R. Cmejla, T. Tykalova, H. Ruzickova, J. Klempir, V. Majerova, J. Picmausova,J. Roth, and E. Ruzicka, “Imprecise vowel articulation as a potential early marker ofparkinson’s disease: Effect of speaking task,” The Journal of the Acoustical Society ofAmerica, vol. 134, no. 3, pp. 2171–2181, 2013.
[87] S. Skodda, W. Grönheit, and U. Schlegel, “Intonation and speech rate in parkinson’sdisease: General and dynamic aspects and responsiveness to levodopa admission,”Journal of Voice, vol. 25, no. 4, pp. e199–e205, 2011.
[88] J. Rusz, R. Cmejla, H. Ruzickova, and E. Ruzicka, “Quantitative acoustic measurementsfor characterization of speech and voice disorders in early untreated parkinson’s disease,”The journal of the Acoustical Society of America, vol. 129, no. 1, pp. 350–367, 2011.
[89] T. Bocklet, S. Steidl, E. Nöth, and S. Skodda, “Automatic evaluation of parkinson’sspeech-acoustic, prosodic and voice related cues.” in Interspeech, 2013, pp. 1149–1153.
[90] A. Bayestehtashk, M. Asgari, I. Shafran, and J. McNames, “Fully automated assessmentof the severity of parkinson’s disease from speech,” Computer speech & language, vol. 29,no. 1, pp. 172–185, 2015.
[91] F. Eyben, M. Wöllmer, and B. Schuller, “Opensmile: the munich versatile and fastopen-source audio feature extractor,” in Proceedings of the 18th ACM internationalconference on Multimedia. ACM, 2010, pp. 1459–1462.
137
[92] B. Schuller, S. Steidl, A. Batliner, S. Hantke, F. Hönig, J. R. Orozco-Arroyave, E. Nöth,Y. Zhang, and F. Weninger, “The interspeech 2015 computational paralinguisticschallenge: nativeness, parkinson’s & eating condition,” in Sixteenth annual conferenceof the international speech communication association, 2015.
[93] T. Grósz, R. Busa-Fekete, G. Gosztolya, and L. Tóth, “Assessing the degree of nativenessand parkinson’s condition using gaussian processes and deep rectifier neural networks,”2015.
[94] M. Tu, V. Berisha, and J. Liss, “Interpretable objective assessment of dysarthric speechbased on deep neural networks.” in INTERSPEECH, 2017, pp. 1849–1853.
[95] M. Cernak, J. R. Orozco-Arroyave, F. Rudzicz, H. Christensen, J. C. Vásquez-Correa,and E. Nöth, “Characterisation of voice quality of parkinson’s disease using differentialphonological posterior features,” Computer Speech & Language, vol. 46, pp. 196–208,2017.
[96] J. C. Vásquez-Correa, J. R. Orozco-Arroyave, and E. Nöth, “Convolutional neuralnetwork to model articulation impairments in patients with parkinson’s disease.” inINTERSPEECH, 2017, pp. 314–318.
[97] J. Vásquez-Correa, J. Orozco-Arroyave, T. Bocklet, and E. Nöth, “Towards an automaticevaluation of the dysarthria level of patients with parkinson’s disease,” Journal ofcommunication disorders, vol. 76, pp. 21–36, 2018.
[98] L. Moro-Velazquez, J. Villalba, and N. Dehak, “Using x-vectors to automatically detectparkinson’s disease from speech,” in ICASSP 2020-2020 IEEE International Conferenceon Acoustics, Speech and Signal Processing (ICASSP). IEEE, 2020, pp. 1155–1159.
[99] D. Snyder, D. Garcia-Romero, G. Sell, D. Povey, and S. Khudanpur, “X-vectors: Robustdnn embeddings for speaker recognition,” in 2018 IEEE International Conference onAcoustics, Speech and Signal Processing (ICASSP). IEEE, 2018, pp. 5329–5333.
[100] D. Raj, D. Snyder, D. Povey, and S. Khudanpur, “Probing the information encoded inx-vectors,” in 2019 IEEE Automatic Speech Recognition and Understanding Workshop(ASRU). IEEE, 2019, pp. 726–733.
[101] J. Mallela, A. Illa, B. Suhas, S. Udupa, Y. Belur, N. Atchayaram, R. Yadav, P. Reddy,D. Gope, and P. K. Ghosh, “Voice based classification of patients with amyotrophiclateral sclerosis, parkinson’s disease and healthy controls with cnn-lstm using transfer
138
learning,” in ICASSP 2020-2020 IEEE International Conference on Acoustics, Speechand Signal Processing (ICASSP). IEEE, 2020, pp. 6784–6788.
[102] A. Ghoshal, P. Ircing, and S. Khudanpur, “Hidden markov models for automaticannotation and content-based retrieval of images and video,” in Proceedings of the28th annual international ACM SIGIR conference on Research and development ininformation retrieval, 2005, pp. 544–551.
[103] R. Segal, T. Markowitz, and W. Arnold, “Fast uncertainty sampling for labeling largee-mail corpora.” in CEAS. Citeseer, 2006.
[104] Z. Yang, W. W. Cohen, and R. Salakhutdinov, “Revisiting semi-supervised learningwith graph embeddings,” arXiv preprint arXiv:1603.08861, 2016.
[105] H. Kuehne, A. Richard, and J. Gall, “Weakly supervised learning of actions fromtranscripts,” Computer Vision and Image Understanding, vol. 163, pp. 78–89, 2017.
[106] H. Liao, E. McDermott, and A. Senior, “Large scale deep neural network acousticmodeling with semi-supervised training data for youtube video transcription,” in 2013IEEE Workshop on Automatic Speech Recognition and Understanding. IEEE, 2013,pp. 368–373.
[107] J. Cohen, “A coefficient of agreement for nominal scales,” Educational and psychologicalmeasurement, vol. 20, no. 1, pp. 37–46, 1960.
[108] J. L. Fleiss and J. Cohen, “The equivalence of weighted kappa and the intraclass corre-lation coefficient as measures of reliability,” Educational and psychological measurement,vol. 33, no. 3, pp. 613–619, 1973.
[109] J. Correia, B. Raj, I. Trancoso, and F. Teixeira, “Mining multimodal repositories forspeech affecting diseases,” 2018.
[110] G. Trigeorgis, F. Ringeval, R. Brueckner, E. Marchi, M. A. Nicolaou, B. Schuller, andS. Zafeiriou, “Adieu features? end-to-end speech emotion recognition using a deepconvolutional recurrent network,” in 2016 IEEE international conference on acoustics,speech and signal processing (ICASSP). IEEE, 2016, pp. 5200–5204.
[111] D. Palaz, M. Magimai.-Doss, and R. Collobert, “Analysis of cnn-based speech recognitionsystem using raw speech as input,” Idiap, Tech. Rep., 2015.
[112] P. Tzirakis, G. Trigeorgis, M. A. Nicolaou, B. W. Schuller, and S. Zafeiriou, “End-to-endmultimodal emotion recognition using deep neural networks,” IEEE Journal of SelectedTopics in Signal Processing, vol. 11, no. 8, pp. 1301–1309, 2017.
139
[113] S. Oviatt, A. DeAngeli, and K. Kuhn, “Integration and synchronization of inputmodes during multimodal human-computer interaction,” in Referring Phenomena in aMultimedia Context and their Computational Treatment. Association for ComputationalLinguistics, 1997, pp. 1–13.
[114] S. Poria, E. Cambria, R. Bajpai, and A. Hussain, “A review of affective computing:From unimodal analysis to multimodal fusion,” Information Fusion, vol. 37, pp. 98–125,2017.
[115] M. Vrigkas, C. Nikou, and I. A. Kakadiaris, “Identifying human behaviors usingsynchronized audio-visual cues,” IEEE Transactions on Affective Computing, vol. 8,no. 1, pp. 54–66, 2017.
[116] R. Socher, A. Perelygin, J. Wu, J. Chuang, C. D. Manning, A. Ng, and C. Potts,“Recursive deep models for semantic compositionality over a sentiment treebank,” inProceedings of the 2013 conference on empirical methods in natural language processing,2013, pp. 1631–1642.
[117] B. Pang and L. Lee, “Seeing stars: Exploiting class relationships for sentiment catego-rization with respect to rating scales,” in Proceedings of the 43rd annual meeting onassociation for computational linguistics. Association for Computational Linguistics,2005, pp. 115–124.
[118] D. Klein and C. D. Manning, “Accurate unlexicalized parsing,” in Proceedings of the41st annual meeting of the association for computational linguistics, 2003.
[119] J. Correia, B. Raj, and I. Trancoso, “Querying depression vlogs,” in 2018 IEEE SpokenLanguage Technology Workshop (SLT). IEEE, 2018, pp. 987–993.
[120] J. Correia, I. Trancoso, and B. Raj, “Adaptation of svm for mil for inferring the polarityof movies and movie reviews,” in 2016 IEEE Spoken Language Technology Workshop(SLT). IEEE, 2016, pp. 258–264.
[121] T. G. Dietterich, R. H. Lathrop, and T. Lozano-Pérez, “Solving the multiple instanceproblem with axis-parallel rectangles,” Artificial intelligence, vol. 89, no. 1, pp. 31–71,1997.
[122] G. Quellec, G. Cazuguel, B. Cochener, and M. Lamard, “Multiple-instance learning formedical image and video analysis,” IEEE reviews in biomedical engineering, vol. 10, pp.213–234, 2017.
140
[123] O. Z. Kraus, J. L. Ba, and B. J. Frey, “Classifying and segmenting microscopy imageswith deep multiple instance learning,” Bioinformatics, vol. 32, no. 12, pp. i52–i59, 2016.
[124] M. Ilse, J. M. Tomczak, and M. Welling, “Attention-based deep multiple instancelearning,” arXiv preprint arXiv:1802.04712, 2018.
[125] G. Carneiro, A. B. Chan, P. J. Moreno, and N. Vasconcelos, “Supervised learning ofsemantic classes for image annotation and retrieval,” IEEE transactions on patternanalysis and machine intelligence, vol. 29, no. 3, pp. 394–410, 2007.
[126] B. Liu, Y. Xiao, and Z. Hao, “A selective multiple instance transfer learning method fortext categorization problems,” Knowledge-Based Systems, vol. 141, pp. 178–187, 2018.
[127] C. Zhang, J. C. Platt, and P. A. Viola, “Multiple instance boosting for object detection,”in Advances in neural information processing systems, 2006, pp. 1417–1424.
[128] J. Wu, Y. Yu, C. Huang, and K. Yu, “Deep multiple instance learning for imageclassification and auto-annotation,” in Proceedings of the IEEE Conference on ComputerVision and Pattern Recognition, 2015, pp. 3460–3469.
[129] J. Correia, I. Trancoso, and B. Raj, “Automatic in-the-wild dataset annotation withdeep generalized multiple instance learning,” in Proceedings of The 12th LanguageResources and Evaluation Conference (LREC), 2020, pp. 3542–3550.
[130] J. Devlin, M.-W. Chang, K. Lee, and K. Toutanova, “Bert: Pre-training of deepbidirectional transformers for language understanding,” 2018.
[131] N. Reimers and I. Gurevych, “Sentence-bert: Sentence embeddings using siamesebert-networks,” arXiv preprint arXiv:1908.10084, 2019.
[132] G. An, D. G. Brizan, M. Ma, M. Morales, A. R. Syed, and A. Rosenberg, “Automaticrecognition of unified parkinson’s disease rating from speech with acoustic, i-vectorand phonotactic features,” in Sixteenth Annual Conference of the International SpeechCommunication Association, 2015.
[133] J. Correia, F. Teixeira, C. Botelho, I. Trancoso, and B. Raj, “The in-the-wild speechmedical corpus,” in 2021 IEEE International Conference on Acoustics, Speech andSignal Processing (ICASSP), 2021.
[134] J. Correia, I. Trancoso, and B. Raj, “In-the-wild end-to-end detection of speech affectingdiseases,” in 2019 IEEE Automatic Speech Recognition and Understanding Workshop(ASRU). IEEE, 2019, pp. 734–741.
141
[135] N. Srimadhur and S. Lalitha, “An end-to-end model for detection and assessment ofdepression levels using speech,” Procedia Computer Science, vol. 171, pp. 12–21, 2020.
[136] F. Povolny, P. Matejka, M. Hradis, A. Popková, L. Otrusina, P. Smrz, I. Wood, C. Robin,and L. Lamel, “Multimodal emotion recognition for avec 2016 challenge,” in Proceedingsof the 6th International Workshop on Audio/Visual Emotion Challenge. ACM, 2016,pp. 75–82.
[137] J. C. Vásquez-Correa, T. Arias-Vergara, J. R. Orozco-Arroyave, B. Eskofier, J. Klucken,and E. Nöth, “Multimodal assessment of parkinson’s disease: a deep learning approach,”IEEE journal of biomedical and health informatics, vol. 23, no. 4, pp. 1618–1630, 2018.
[138] E. Marchi, B. Schuller, S. Baron-Cohen, O. Golan, S. Bölte, P. Arora, and R. Häb-Umbach, “Typicality and emotion in the voice of children with autism spectrumcondition: Evidence across three languages,” in Sixteenth Annual Conference of theInternational Speech Communication Association, 2015.
[139] A. Pompili, R. Solera-Urena, A. Abad, R. Cardoso, I. Guimaraes, M. Fabbri, I. P.Martins, and J. Ferreira, “Assessment of parkinson’s disease medication state throughautomatic speech analysis,” arXiv preprint arXiv:2005.14647, 2020.
[140] B. Schuller, A. Batliner, C. Bergler, F. B. Pokorny, J. Krajewski, M. Cychosz, R. Voll-mann, S.-D. Roelen, S. Schnieder, E. Bergelson et al., “The interspeech 2019 computa-tional paralinguistics challenge: Styrian dialects, continuous sleepiness, baby sounds &orca activity,” 2019.
[141] N. Dehak, P. J. Kenny, R. Dehak, P. Dumouchel, and P. Ouellet, “Front-end factoranalysis for speaker verification,” IEEE Transactions on Audio, Speech, and LanguageProcessing, vol. 19, no. 4, pp. 788–798, 2010.
[142] P. Lopez-Otero, L. Docio-Fernandez, and C. Garcia-Mateo, “ivectors for continuousemotion recognition,” Training, vol. 45, p. 50, 2014.
[143] N. Dehak, P. A. Torres-Carrasquillo, D. Reynolds, and R. Dehak, “Language recogni-tion via i-vectors and dimensionality reduction,” in Twelfth annual conference of theinternational speech communication association, 2011.
[144] M. H. Bahari, M. McLaren, D. A. van Leeuwen et al., “Speaker age estimation usingi-vectors,” Engineering Applications of Artificial Intelligence, vol. 34, pp. 99–108, 2014.
142
[145] M. Dorfer, B. Lehner, H. Eghbal-zadeh, H. Christop, P. Fabian, and W. Gerhard,“Acoustic scene classification with fully convolutional neural networks and i-vectors,”Proceedings of the Detection and Classification of Acoustic Scenes and Events, 2018.
[146] H. Eghbal-zadeh, B. Lehner, M. Dorfer, and G. Widmer, “A hybrid approach with multi-channel i-vectors and convolutional neural networks for acoustic scene classification,”in 2017 25th European Signal Processing Conference (EUSIPCO). IEEE, 2017, pp.2749–2753.
[147] Y. Hauptman, R. Aloni-Lavi, I. Lapidot, T. Gurevich, Y. Manor, S. Naor, N. Diamant,and I. Opher, “Identifying distinctive acoustic and spectral features in parkinson’sdisease.” in Interspeech, 2019, pp. 2498–2502.
[148] P. Kenny, “Joint factor analysis of speaker and session variability: Theory and algo-rithms,” CRIM, Montreal,(Report) CRIM-06/08-13, vol. 14, pp. 28–29, 2005.
[149] S. J. Prince and J. H. Elder, “Probabilistic linear discriminant analysis for inferencesabout identity,” in 2007 IEEE 11th International Conference on Computer Vision.IEEE, 2007, pp. 1–8.
[150] D. Snyder, D. Garcia-Romero, D. Povey, and S. Khudanpur, “Deep neural networkembeddings for text-independent speaker verification.” in Interspeech, 2017, pp. 999–1003.
[151] D. Snyder, D. Garcia-Romero, A. McCree, G. Sell, D. Povey, and S. Khudanpur,“Spoken language recognition using x-vectors.” in Odyssey, 2018, pp. 105–111.
[152] H. Zeinali, L. Burget, and J. Cernocky, “Convolutional neural networks and x-vector embedding for dcase2018 acoustic scene classification challenge,” arXiv preprintarXiv:1810.04273, 2018.
[153] M. Diez, L. Burget, S. Wang, J. Rohdin, and J. Cernocky, “Bayesian hmm basedx-vector clustering for speaker diarization.” in INTERSPEECH, 2019, pp. 346–350.
[154] R. Pappagari, T. Wang, J. Villalba, N. Chen, and N. Dehak, “x-vectors meet emotions: Astudy on dependencies between emotion and speaker recognition,” in ICASSP 2020-2020IEEE International Conference on Acoustics, Speech and Signal Processing (ICASSP).IEEE, 2020, pp. 7169–7173.
[155] S. Zargarbashi and B. Babaali, “A multi-modal feature embedding approach to diagnosealzheimer disease from spoken language,” arXiv preprint arXiv:1910.00330, 2019.
143
[156] J. M. Perero-Codosero, F. Espinoza-Cuadros, J. Antón-Martín, M. A. Barbero-Álvarez,and L. A. Hernández-Gómez, “Modeling obstructive sleep apnea voices using deepneural network embeddings and domain-adversarial training,” IEEE Journal of SelectedTopics in Signal Processing, vol. 14, no. 2, pp. 240–250, 2019.
[157] V. Peddinti, D. Povey, and S. Khudanpur, “A time delay neural network architecturefor efficient modeling of long temporal contexts,” in Sixteenth Annual Conference of theInternational Speech Communication Association, 2015.
[158] C. Li, X. Ma, B. Jiang, X. Li, X. Zhang, X. Liu, Y. Cao, A. Kannan, and Z. Zhu,“Deep speaker: an end-to-end neural speaker embedding system,” arXiv preprintarXiv:1705.02304, vol. 650, 2017.
[159] A. Hannun, C. Case, J. Casper, B. Catanzaro, G. Diamos, E. Elsen, R. Prenger,S. Satheesh, S. Sengupta, A. Coates et al., “Deep speech: Scaling up end-to-end speechrecognition,” arXiv preprint arXiv:1412.5567, 2014.
[160] A. Graves and N. Jaitly, “Towards end-to-end speech recognition with recurrent neuralnetworks,” in International conference on machine learning. PMLR, 2014, pp. 1764–1772.
[161] D. Amodei, S. Ananthanarayanan, R. Anubhai, J. Bai, E. Battenberg, C. Case, J. Casper,B. Catanzaro, Q. Cheng, G. Chen et al., “Deep speech 2: End-to-end speech recognitionin english and mandarin,” in International conference on machine learning. PMLR,2016, pp. 173–182.
[162] W. Cai, J. Chen, and M. Li, “Exploring the encoding layer and loss function in end-to-end speaker and language recognition system,” arXiv preprint arXiv:1804.05160,2018.
[163] J. M. Vera-Diaz, D. Pizarro, and J. Macias-Guarasa, “Towards end-to-end acousticlocalization using deep learning: From audio signals to source position coordinates,”Sensors, vol. 18, no. 10, p. 3418, 2018.
[164] B. Wu, K. Li, F. Ge, Z. Huang, M. Yang, S. M. Siniscalchi, and C.-H. Lee, “Anend-to-end deep learning approach to simultaneous speech dereverberation and acousticmodeling for robust speech recognition,” IEEE Journal of Selected Topics in SignalProcessing, vol. 11, no. 8, pp. 1289–1300, 2017.
[165] P. Tzirakis, J. Zhang, and B. W. Schuller, “End-to-end speech emotion recognition usingdeep neural networks,” in 2018 IEEE international conference on acoustics, speech and
144
signal processing (ICASSP). IEEE, 2018, pp. 5089–5093.
[166] H. Zhang, A. Wang, D. Li, and W. Xu, “Deepvoice: A voiceprint-based mobile healthframework for parkinson’s disease identification,” in 2018 IEEE EMBS InternationalConference on Biomedical & Health Informatics (BHI). IEEE, 2018, pp. 214–217.
[167] A. Vázquez-Romero and A. Gallardo-Antolín, “Automatic detection of depression inspeech using ensemble convolutional neural networks,” Entropy, vol. 22, no. 6, p. 688,2020.
[168] M. Muzammel, H. Salam, Y. Hoffmann, M. Chetouani, and A. Othmani, “Audvowel-consnet: A phoneme-level based deep cnn architecture for clinical depression diagnosis,”Machine Learning with Applications, vol. 2, p. 100005, 2020.
[169] D. Gope and P. K. Ghosh, “Raw speech waveform based classification of patients withals, parkinson’s disease and healthy controls using cnn-blstm,” 2020.
[170] F. Pedregosa, G. Varoquaux, A. Gramfort, V. Michel, B. Thirion, O. Grisel, M. Blondel,P. Prettenhofer, R. Weiss, V. Dubourg et al., “Scikit-learn: Machine learning in python,”the Journal of machine Learning research, vol. 12, pp. 2825–2830, 2011.
[171] D. Povey, A. Ghoshal, G. Boulianne, L. Burget, O. Glembek, N. Goel, M. Hannemann,P. Motlicek, Y. Qian, P. Schwarz et al., “The kaldi speech recognition toolkit,” in IEEE2011 workshop on automatic speech recognition and understanding, no. CONF. IEEESignal Processing Society, 2011.
[172] J. Correia, I. Trancoso, and B. Raj, “Detecting psychological distress in adults throughtranscriptions of clinical interviews,” in International Conference on Advances in Speechand Language Technologies for Iberian Languages (Iberspeech). Springer, 2016, pp.162–171.
[173] J. Pennington, R. Socher, and C. D. Manning, “Glove: Global vectors for word repre-sentation.” in EMNLP, vol. 14, 2014, pp. 1532–1543.
[174] B. Pang and L. Lee, “A sentimental education: Sentiment analysis using subjectivitysummarization based on minimum cuts,” in Proceedings of the ACL, 2004.
[175] Q. V. Le and T. Mikolov, “Distributed representations of sentences and documents.” inICML, vol. 14, 2014, pp. 1188–1196.
145

146
Appendices
147

Appendix A
Measuring word connotations from wordembeddings to detect depression, anxietyand PTSD in clinical interviews
A.1 Motivation
The following Appendix is a short study where we tested the hypothesis that the vocabularyof an individual affected by psychological distress, including depression, anxiety and PTSD,is different from that of those who are not affected, when evaluated in the context of clinicalinterviews [172].
We consider this work as part of the literature review for the detection of depression andother forms of psychological distress from natural language cues, and one of the contributionsaccomplished during the thesis towards the state of the art in this field. However, since theexperiments do not incorporate in-the-wild data in any capacity, this work is not as relevantas the others presented in the scope of this thesis, therefore it is presented as an Appendix.
In this study, we considered two approaches to evaluate the changes in vocabulary betweenhealthy and distressed speakers. The first took into account small samples of the clinicalinterview at a time, such as a turn or a sentence, to assess whether that sample belonged toan individual affected by psychological distress. This approach was designed to be used inan online scenario, such as to assist the therapist during the clinical interview. The secondwas a system that performed an analysis of the full transcription of each interview, takingadvantage of larger amounts of information at once. This system was designed to be used in
149
an offline scenario, after the full interview had been conducted.
In this Appendix we will focus solely on reviewing the offline system when it comes to detectingdepression, anxiety and PTSD, as these were the experiments with the most relevant findings,in the context of this thesis proposal.
A.2 Data
This study was performed on the DAIC-F2F, a dataset of audio recordings and transcriptionsof clinical interviews of subjects who potentially suffer from psychological distress, conductedby a human therapist. This dataset was previously described in more detail in Chapter 2.2.We randomly partitioned this dataset into a train and development subsets, with 55 and 10interviews, respectively.
A.3 Proposed approach
The proposed system was based on the computation of a novel type of “conotation” featuresfor each word in the interview based on the relative frequency difference between the use ofthis word by distressed and healthy individuals. Given a corpus of transcriptions of depressedand healthy individuals the computation of these features was as follows:
• Obtain the vocabulary of the corpus, of size V
• Compute the relative frequency of each word for the subset of the corpus belonging tohealthy individuals, and for the one of the depressed people.
• Compute the difference of the relative frequency for each work (the result is a table ofsize V where a word with a larger absolute value tends to be used more by individualsof one of the classes, healthy or depressed, and a word with a small absolute value isused more or less the same by individuals of the two classes).
• From the table, assign a healthy or distressed “connotation” to each word as a binarylabel.
• For each word in the vocabulary of the corpus, get their word vector representations.
At test time, for a given interview, for each word:
• Get its word representation vector and find the 20 most similar words from the vocabu-lary of the training data.
150
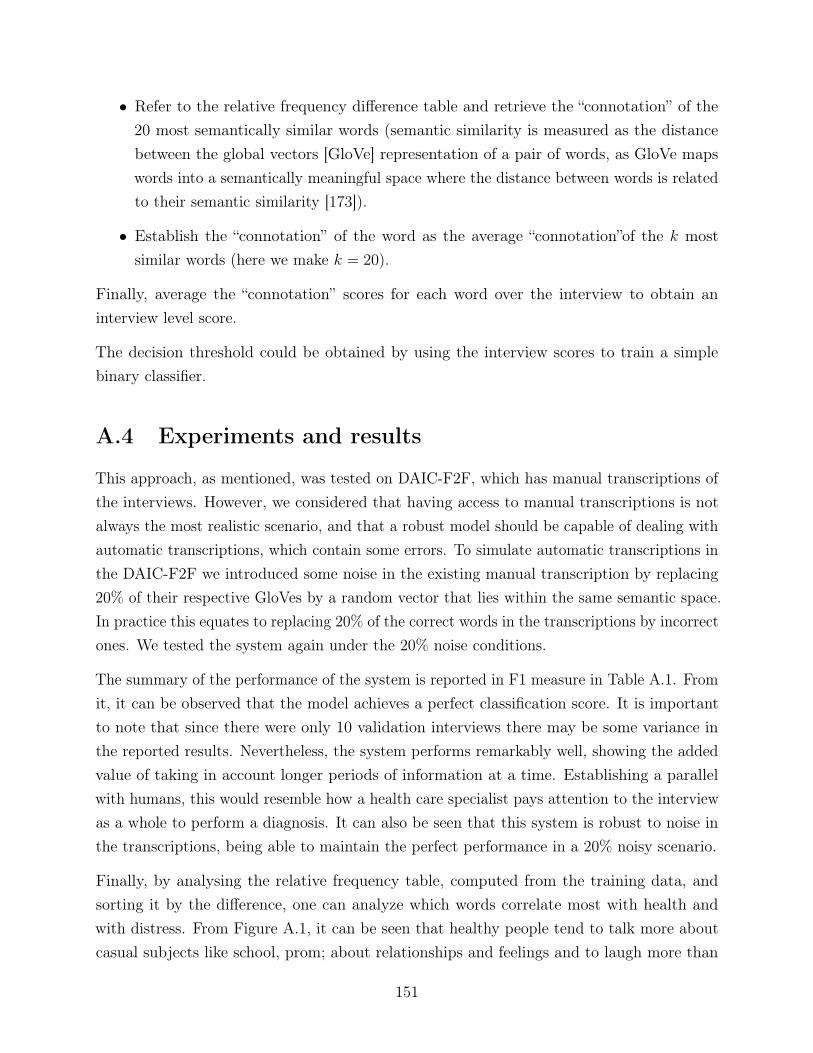
• Refer to the relative frequency difference table and retrieve the “connotation” of the20 most semantically similar words (semantic similarity is measured as the distancebetween the global vectors [GloVe] representation of a pair of words, as GloVe mapswords into a semantically meaningful space where the distance between words is relatedto their semantic similarity [173]).
• Establish the “connotation” of the word as the average “connotation”of the k mostsimilar words (here we make k = 20).
Finally, average the “connotation” scores for each word over the interview to obtain aninterview level score.
The decision threshold could be obtained by using the interview scores to train a simplebinary classifier.
A.4 Experiments and results
This approach, as mentioned, was tested on DAIC-F2F, which has manual transcriptions ofthe interviews. However, we considered that having access to manual transcriptions is notalways the most realistic scenario, and that a robust model should be capable of dealing withautomatic transcriptions, which contain some errors. To simulate automatic transcriptions inthe DAIC-F2F we introduced some noise in the existing manual transcription by replacing20% of their respective GloVes by a random vector that lies within the same semantic space.In practice this equates to replacing 20% of the correct words in the transcriptions by incorrectones. We tested the system again under the 20% noise conditions.
The summary of the performance of the system is reported in F1 measure in Table A.1. Fromit, it can be observed that the model achieves a perfect classification score. It is importantto note that since there were only 10 validation interviews there may be some variance inthe reported results. Nevertheless, the system performs remarkably well, showing the addedvalue of taking in account longer periods of information at a time. Establishing a parallelwith humans, this would resemble how a health care specialist pays attention to the interviewas a whole to perform a diagnosis. It can also be seen that this system is robust to noise inthe transcriptions, being able to maintain the perfect performance in a 20% noisy scenario.
Finally, by analysing the relative frequency table, computed from the training data, andsorting it by the difference, one can analyze which words correlate most with health andwith distress. From Figure A.1, it can be seen that healthy people tend to talk more aboutcasual subjects like school, prom; about relationships and feelings and to laugh more than
151
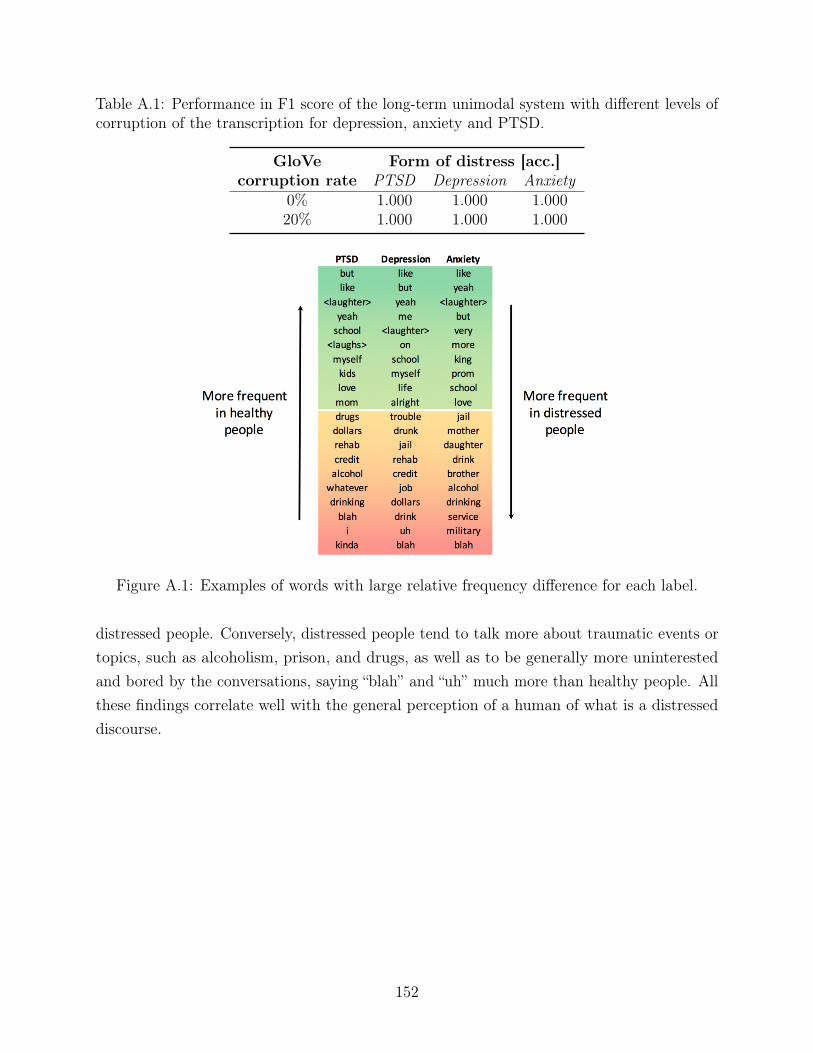
Table A.1: Performance in F1 score of the long-term unimodal system with different levels ofcorruption of the transcription for depression, anxiety and PTSD.
GloVecorruption rate
Form of distress [acc.]PTSD Depression Anxiety
0% 1.000 1.000 1.00020% 1.000 1.000 1.000
Figure A.1: Examples of words with large relative frequency difference for each label.
distressed people. Conversely, distressed people tend to talk more about traumatic events ortopics, such as alcoholism, prison, and drugs, as well as to be generally more uninterestedand bored by the conversations, saying “blah” and “uh” much more than healthy people. Allthese findings correlate well with the general perception of a human of what is a distresseddiscourse.
152
Appendix B
Detection of polarity on movie reviewsusing θ-MIL
B.1 Motivation
In this appendix, we report the experiments and results obtained in the task of inferring thepolarity of movie reviews with the IMDb movie review database [174], which was performedin the context of the proposed θ-MIL strategy presented in Section 5.3.
As mentioned, in that Section, the experiments fall out of the scope of this thesis, however itis still relevant to report them in order to demonstrate how the proposed methods work in apractical application.
The motivation for this task was to test the θ-MIL in a scenario where the data wouldnaturally organize into bags, and where the bag label would be determined not by a keypositive instance, but by a group of instances.
In the context of movie reviews, the reviews for any given movie are naturally related to eachother, as all of them pertain to the same movie. At the same time, the polarity of the movie,whether its considered good or bad overall, is not defined by a single instance, but by a groupof them. This scenario fits very well with the θ-MIL framework, hence the choice.
B.2 Data
The polarity dataset is a corpus of movie reviews retrieved from the Internet Movie Database(IMDb) archive [174]. The corpus contains 2000 movie reviews in English, where each review
153
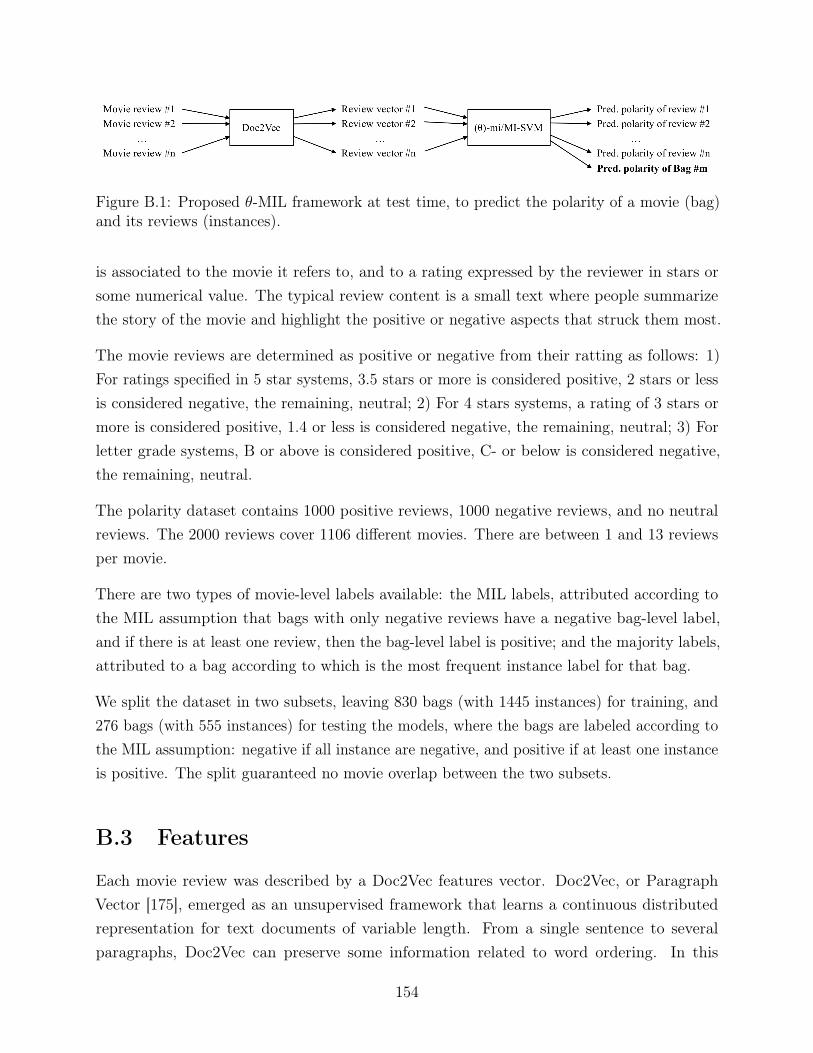
Figure B.1: Proposed θ-MIL framework at test time, to predict the polarity of a movie (bag)and its reviews (instances).
is associated to the movie it refers to, and to a rating expressed by the reviewer in stars orsome numerical value. The typical review content is a small text where people summarizethe story of the movie and highlight the positive or negative aspects that struck them most.
The movie reviews are determined as positive or negative from their ratting as follows: 1)For ratings specified in 5 star systems, 3.5 stars or more is considered positive, 2 stars or lessis considered negative, the remaining, neutral; 2) For 4 stars systems, a rating of 3 stars ormore is considered positive, 1.4 or less is considered negative, the remaining, neutral; 3) Forletter grade systems, B or above is considered positive, C- or below is considered negative,the remaining, neutral.
The polarity dataset contains 1000 positive reviews, 1000 negative reviews, and no neutralreviews. The 2000 reviews cover 1106 different movies. There are between 1 and 13 reviewsper movie.
There are two types of movie-level labels available: the MIL labels, attributed according tothe MIL assumption that bags with only negative reviews have a negative bag-level label,and if there is at least one review, then the bag-level label is positive; and the majority labels,attributed to a bag according to which is the most frequent instance label for that bag.
We split the dataset in two subsets, leaving 830 bags (with 1445 instances) for training, and276 bags (with 555 instances) for testing the models, where the bags are labeled according tothe MIL assumption: negative if all instance are negative, and positive if at least one instanceis positive. The split guaranteed no movie overlap between the two subsets.
B.3 Features
Each movie review was described by a Doc2Vec features vector. Doc2Vec, or ParagraphVector [175], emerged as an unsupervised framework that learns a continuous distributedrepresentation for text documents of variable length. From a single sentence to severalparagraphs, Doc2Vec can preserve some information related to word ordering. In this
154
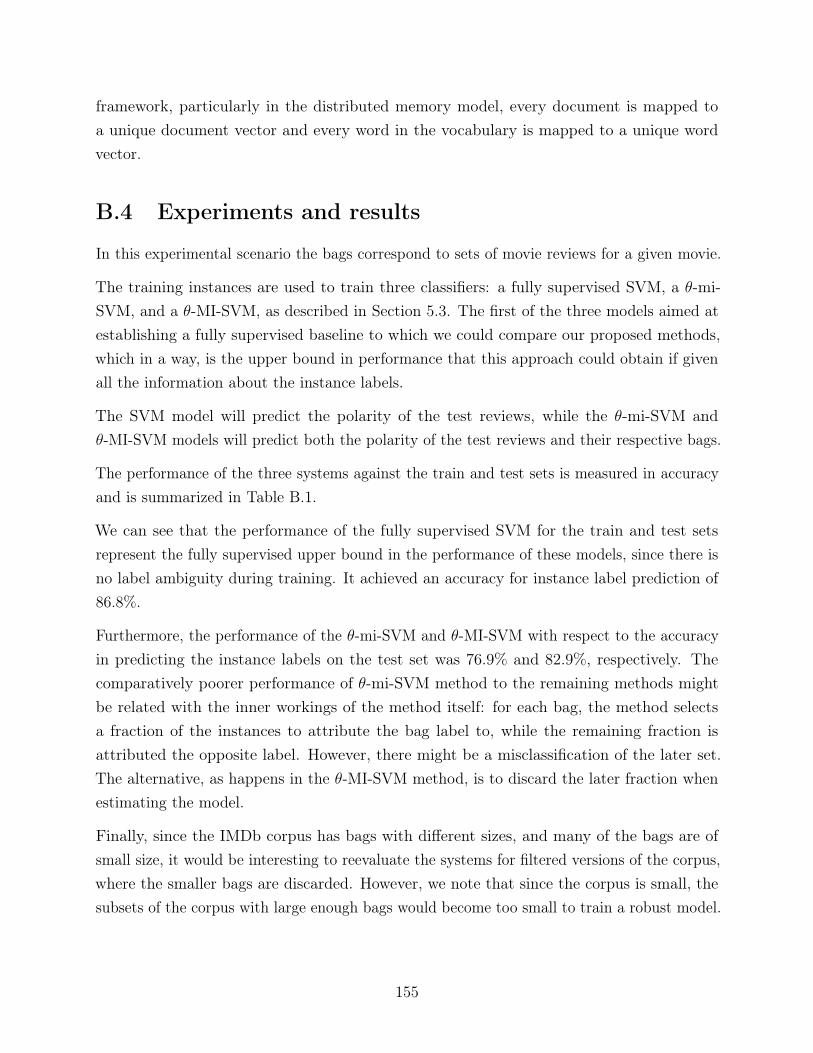
framework, particularly in the distributed memory model, every document is mapped toa unique document vector and every word in the vocabulary is mapped to a unique wordvector.
B.4 Experiments and results
In this experimental scenario the bags correspond to sets of movie reviews for a given movie.
The training instances are used to train three classifiers: a fully supervised SVM, a θ-mi-SVM, and a θ-MI-SVM, as described in Section 5.3. The first of the three models aimed atestablishing a fully supervised baseline to which we could compare our proposed methods,which in a way, is the upper bound in performance that this approach could obtain if givenall the information about the instance labels.
The SVM model will predict the polarity of the test reviews, while the θ-mi-SVM andθ-MI-SVM models will predict both the polarity of the test reviews and their respective bags.
The performance of the three systems against the train and test sets is measured in accuracyand is summarized in Table B.1.
We can see that the performance of the fully supervised SVM for the train and test setsrepresent the fully supervised upper bound in the performance of these models, since there isno label ambiguity during training. It achieved an accuracy for instance label prediction of86.8%.
Furthermore, the performance of the θ-mi-SVM and θ-MI-SVM with respect to the accuracyin predicting the instance labels on the test set was 76.9% and 82.9%, respectively. Thecomparatively poorer performance of θ-mi-SVM method to the remaining methods mightbe related with the inner workings of the method itself: for each bag, the method selectsa fraction of the instances to attribute the bag label to, while the remaining fraction isattributed the opposite label. However, there might be a misclassification of the later set.The alternative, as happens in the θ-MI-SVM method, is to discard the later fraction whenestimating the model.
Finally, since the IMDb corpus has bags with different sizes, and many of the bags are ofsmall size, it would be interesting to reevaluate the systems for filtered versions of the corpus,where the smaller bags are discarded. However, we note that since the corpus is small, thesubsets of the corpus with large enough bags would become too small to train a robust model.
155
Table B.1: Performance in accuracy of the the supervised SVM, θ-mi-SVM and θ-MI-SVMfor the train and test dataset.
Majority bagsSVM[acc.%]
θ-mi-SVM[acc.%]
θ-MI-SVM[acc.%]
inst. bags inst. bags inst.train 95.85 - 91.06 - 91.62test 86.85 82.61 76.94 83.33 82.89
156
Appendix C
Intellectual property and distribution ofthe WSM Corpus
The WSM Corpus is an audiovisual corpus of videos collected from the online multimediarepository YouTube, mostly featuring recordings in the vlog format, of subjects potentiallyaffected by SA diseases. It contains a total 928 videos, and over 131 hours of speech.Each video in the corpus is accompanied by a crowdsourced annotation for the estimatedage, estimated gender, and self-reported health status of the subject in the video. Thesecrowdsourced annotations were obtained through AMT, which were funded by ProfessorBhiksha Raj, from Carnegie Mellon University (CMU).
On April 21, 2021, the Center for Technology Transfer and Enterprise Creation (CTTEC),at CMU, has determined that the WSM Corpus’ intellectual property, consisting of itsannotations (estimated age, estimated gender, and self-reported health status of the subjectin the video), and pointers to the videos in the form of URLs, can be distributed for non-commercial purposes, including research and academic purposes, under the creative commonsnon-commercial license.
With this statement, we include two supporting documents:
• The form submitted to CTTEC, describing, and pointing to the WSM Corpus;
• The email confirmation from Cindy Chepanoske, from CTTEC, this institution’sdetermination regarding the distribution of the WSM Corpus.
157
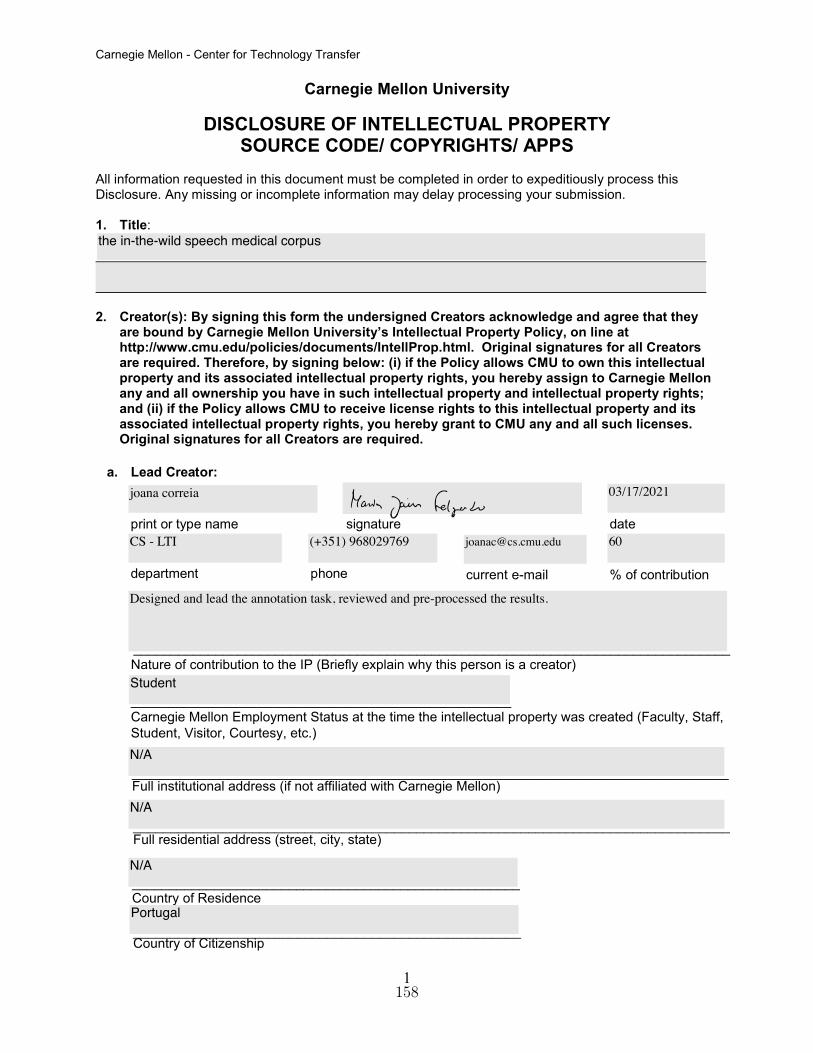
Carnegie Mellon - Center for Technology Transfer�
��
Carnegie Mellon University
DISCLOSURE OF INTELLECTUAL PROPERTY SOURCE CODE/ COPYRIGHTS/ APPS
All information requested in this document must be completed in order to expeditiously process this Disclosure. Any missing or incomplete information may delay processing your submission.
1. Title:
2. Creator(s): By signing this form the undersigned Creators acknowledge and agree that theyare bound by Carnegie Mellon University’s Intellectual Property Policy, on line athttp://www.cmu.edu/policies/documents/IntellProp.html. Original signatures for all Creatorsare required. Therefore, by signing below: (i) if the Policy allows CMU to own this intellectualproperty and its associated intellectual property rights, you hereby assign to Carnegie Mellonany and all ownership you have in such intellectual property and intellectual property rights;and (ii) if the Policy allows CMU to receive license rights to this intellectual property and itsassociated intellectual property rights, you hereby grant to CMU any and all such licenses.Original signatures for all Creators are required.
D� /HDG�&UHDWRU�
print or type name signature date
department phone current e-mail % of contribution
____________________________________________________Country of Citizenship
________________________________________________________________________________ Nature of contribution to the IP (Briefly explain why this person is a creator)
___________________________________________________ Carnegie Mellon Employment Status at the time the intellectual property was created (Faculty, Staff, Student, Visitor, Courtesy, etc.)
________________________________________________________________________________ Full institutional address (if not affiliated with Carnegie Mellon)
________________________________________________________________________________ Full residential address (street, city, state)
____________________________________________________Country of Residence
the in-the-wild speech medical corpus
joana correia 03/17/2021
CS - LTI (+351) 968029769 [email protected] 60
Designed and lead the annotation task, reviewed and pre-processed the results.
Student
N/A
N/A
N/A
Portugal
158
Carnegie Mellon - Center for Technology Transfer�
E� 1H[W�&UHDWRU�
print or type name signature date
department phone current e-mail % of contribution
F� 1H[W�&UHDWRU�
print or type name signature date
department phone ________________B current e-mail % of contribution
____________________________________________________________BB___________________�Nature of contribution to the IP (Briefly explain why this person is a creator)
Carnegie Mellon Employment Status at the time the intellectual property was created (Faculty, Staff, Student, Visitor, Courtesy, etc.)
BBBBBBBBBBBBBBBBBBBBBBBBBBBBBBBBBBBBBBBBBBBBBBBBBBBBBBBBBBBBBBBBBBBBBBBBBBBBBBBB�1DWXUH�RI�FRQWULEXWLRQ�WR�WKH�,3��%ULHIO\�H[SODLQ�ZK\�WKLV�SHUVRQ�LV�D�FUHDWRU�
BBBBBBBBBBBBBBBBBBBBBBBBBBBBBBBBBBBBBBBBBBBBBBBBBBB�&DUQHJLH�0HOORQ�(PSOR\PHQW�6WDWXV�DW�WKH�WLPH�WKH�LQWHOOHFWXDO�SURSHUW\�ZDV�FUHDWHG��)DFXOW\��6WDII��6WXGHQW��9LVLWRU��&RXUWHV\��HWF���
BBBBBBBBBBBBBBBBBBBBBBBBBBBBBBBBBBBBBBBBBBBBBBBBBBBBBBBBBBBBBBBBBBBBBBBBBBBBBBBB�)XOO�LQVWLWXWLRQDO�DGGUHVV��LI�QRW�DIILOLDWHG�ZLWK�&DUQHJLH�0HOORQ��
BBBBBBBBBBBBBBBBBBBBBBBBBBBBBBBBBBBBBBBBBBBBBBBBBBBBBBBBBBBBBBBBBBBBBBBBBBBBBBBB�)XOO�UHVLGHQWLDO�DGGUHVV��VWUHHW��FLW\��VWDWH�
BBBBBBBBBBBBBBBBBBBBBBBBBBBBBBBBBBBBBBBBBBBBBBBBBBBBCountry of 5HVLGHQFH
BBBBBBBBBBBBBBBBBBBBBBBBBBBBBBBBBBBBBBBBBBBBBBBBBBBB&RXQWU\�RI�&LWL]HQVKLS
��
Bhiksha Raj
CS - LTI 412-2686591 [email protected] 20
Oversaw the full process of the dataset creation, from design of annotation task, error corrections, data pre-processing, etc.
Faculty
N/A
N/A
USA
USA
Isabel Trancoso
(external) (+351) 213100300 [email protected] 20
Oversaw the full process of the dataset creation, from design of annotation task, error corrections, data pre-processing, etc.
(external: Instituto Superior Tecnico / INESC-ID)
14 april 2021
159
&DUQHJLH�0HOORQ���&HQWHU�IRU�7HFKQRORJ\�7UDQVIHU�
G� 1H[W�&UHDWRU�
SULQW�RU�W\SH�QDPH� VLJQDWXUH� GDWH�
GHSDUWPHQW� SKRQH�BBBBBBBBBBBBBBBBBFXUUHQW�H�PDLO� ��RI�FRQWULEXWLRQ�
BBBBBBBBBBBBBBBBBBBBBBBBBBBBBBBBBBBBBBBBBBBBBBBBBBBBBBBBBBBBBBBBBBBBBBBBBBBBBBBB�1DWXUH�RI�FRQWULEXWLRQ�WR�WKH�,3��%ULHIO\�H[SODLQ�ZK\�WKLV�SHUVRQ�LV�D�FUHDWRU�
BBBBBBBBBBBBBBBBBBBBBBBBBBBBBBBBBBBBBBBBBBBBBBBBBBB�&DUQHJLH�0HOORQ�(PSOR\PHQW�6WDWXV�DW�WKH�WLPH�WKH�LQWHOOHFWXDO�SURSHUW\�ZDV�FUHDWHG��)DFXOW\��6WDII��6WXGHQW��9LVLWRU��&RXUWHV\��HWF���
BBBBBBBBBBBBBBBBBBBBBBBBBBBBBBBBBBBBBBBBBBBBBBBBBBBBBBBBBBBBBBBBBBBBBBBBBBBBBBBB�)XOO�LQVWLWXWLRQDO�DGGUHVV��LI�QRW�DIILOLDWHG�ZLWK�&DUQHJLH�0HOORQ��
BBBBBBBBBBBBBBBBBBBBBBBBBBBBBBBBBBBBBBBBBBBBBBBBBBBBBBBBBBBBBBBBBBBBBBBBBBBBBBBB�)XOO�UHVLGHQWLDO�DGGUHVV��VWUHHW��FLW\��VWDWH�
BBBBBBBBBBBBBBBBBBBBBBBBBBBBBBBBBBBBBBBBBBBBBBBBBBBB&RXQWU\�RI�5HVLGHQFH
BBBBBBBBBBBBBBBBBBBBBBBBBBBBBBBBBBBBBBBBBBBBBBBBBBBB�&RXQWU\�RI�&LWL]HQVKLS�
3OHDVH�OLVW�DGGLWLRQDO�LQYHQWRU�V��DQG�UHOHYDQW�LQIRUPDWLRQ�RQ�DQ�DGGLWLRQDO�VKHHW��
Full LQVWLWXWLRQDO�DGGUHVV��LI�QRW�DIILOLDWHG�ZLWK�&DUQHJLH�0HOORQ�
BBBBBBBBBBBBBBBBBBBBBBBBBBBBBBBBBBBBBBBBBBBBBBBBBBBBBBBBBBBBBBBBBBBBBBBBBBBBBBBBB�)XOO�UHVLGHQWLDO�DGGUHVV��VWUHHW��FLW\��VWDWH��
_____________________________________________________Country of Residence
_____________________________________________________ Country of Citizenship
��
Rua Alves Redol, n. 9, 1000-029 Lisboa, Portugal
N/A
Portugal
Portugal
160
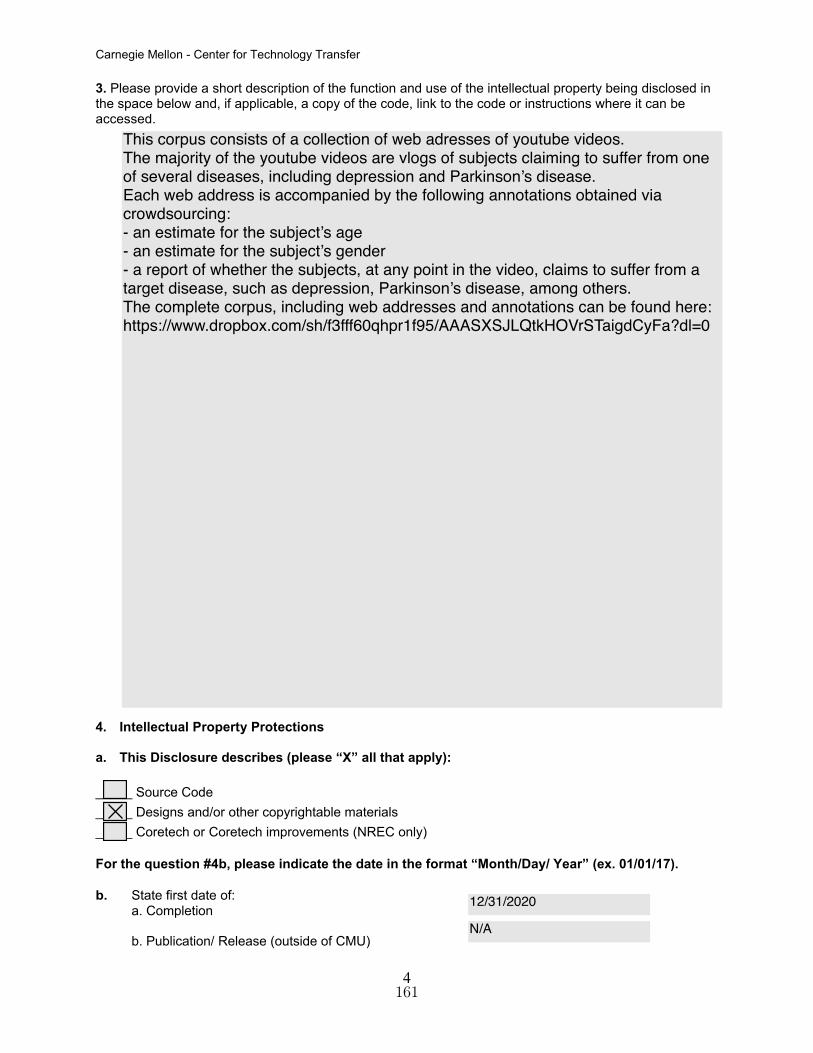
Carnegie Mellon - Center for Technology Transfer�
��
3. Please provide a short description of the function and use of the intellectual property being disclosed inthe space below and, if applicable, a copy of the code, link to the code or instructions where it can beaccessed.
4. Intellectual Property Protections
a. This Disclosure describes (please “X” all that apply):
_____ Source Code
_____ Designs and/or other copyrightable materials
_____ Coretech or Coretech improvements (NREC only)
For the question #4b, please indicate the date in the format “Month/Day/ Year” (ex. 01/01/17).
E� State first date of:D� Completion
E� Publication/ Release (outside of CMU)
This corpus consists of a collection of web adresses of youtube videos.The majority of the youtube videos are vlogs of subjects claiming to suffer from one of several diseases, including depression and Parkinson’s disease. Each web address is accompanied by the following annotations obtained via crowdsourcing:- an estimate for the subject’s age- an estimate for the subject’s gender- a report of whether the subjects, at any point in the video, claims to suffer from a target disease, such as depression, Parkinson’s disease, among others.The complete corpus, including web addresses and annotations can be found here:https://www.dropbox.com/sh/f3fff60qhpr1f95/AAASXSJLQtkHOVrSTaigdCyFa?dl=0
12/31/2020
N/A
161
Carnegie Mellon - Center for Technology Transfer 5. Sponsorship/ Use of 3rd Party Resourcesa.
External Sponsor(s) CMU Oracle #(s) AND Contract or Grant #(s)
(Your department administrator may be of assistance in identifying funding sources used.)
Have external sponsors been informed of or provided with the intellectual property?
E� If funded under a grant or contract, please describe this intellectual property as one of the following:______�Background IP (developed prior to the grant but used in research funded by the grant)______ Background�IP Improvement (developed both prior to and during the grant)______ Foreground IP (developed only during the grant)
F� Internal Sponsor (Department Research Funds, etc.) _______________________
G� Was this intellectual property developed in collaboration with any other 3rd parties (companies,�universities,etc.) or as a part of a research consortium? Please list below:
H� Have you used any software, libraries, etc. from other internal (e.g., CMU) sources (ex. projects orresearchers) in the development of this technology or does the technology otherwise build upon�earlier workat CMU? Please list below:
I� Was there any Open Source software, Creative Commons copyrights or other third party material�XVHG�LQWKH�GHYHORSPHQW�RI�WKLV�WHFKQRORJ\�RU�GRHV�WKH�WHFKQRORJ\�RWKHUZLVH�EXLOG�XSRQ�HDUOLHU�ZRUN�DW�&08"3OHDVH�OLVW�EHORZ�
�� +DYH�\RX���GR�\RX�LQWHQQG�WR�UHOHDVH�WKH�6RXUFH�&RGH�SXUVXDQW�WR�DQ�2SHQ�6RXUFH�OLFHQVH"�,I�VR��SOHDVH
LQGLFDWH�ZKHUH�WKH�FRGH�LV���ZLOO�EH�UHOHDVHG (please “X” all that�apply):
_____ Your website
_____ SourceForge, github or other similar hosting provider
_____ through a federal agency (e.g. NASA)
_____ other (please identify)
_____ Do NOT intend to release open source
�� How long would it take someone skilled in the art to recreate this copyrightable work?
��
Instituto Superior Técnico (University of Lisbon)
4-12 mo
162

Carnegie Mellon - Center for Technology Transfer�
��
'HSDUWPHQW�$GPLQLVWUDWRU��&HQWHU�IRU�7HFKQRORJ\�7UDQVIHU��(QWHUSULVH�&UHDWLRQ�
�����)RUEHV�$YHQXH��6XLWH����
3OHDVH�IHHO�IUHH�WR�DWWDFK�DGGLWLRQDO�PDWHULDO�RU�GDWD�WKDW�ZRXOG�SURYLGH�XV�ZLWK�KHOSIXO�LQIRUPDWLRQ�
Email the completed electronic copy of this Invention Disclosure form to:
�LQQRYDWLRQ#FPX�HGX��
,I�XQDEOH�WR�VLJQ�HOHFWURQLFDOO\��SDSHU�FRSLHV�PD\�EH�VHQW�WR���
163
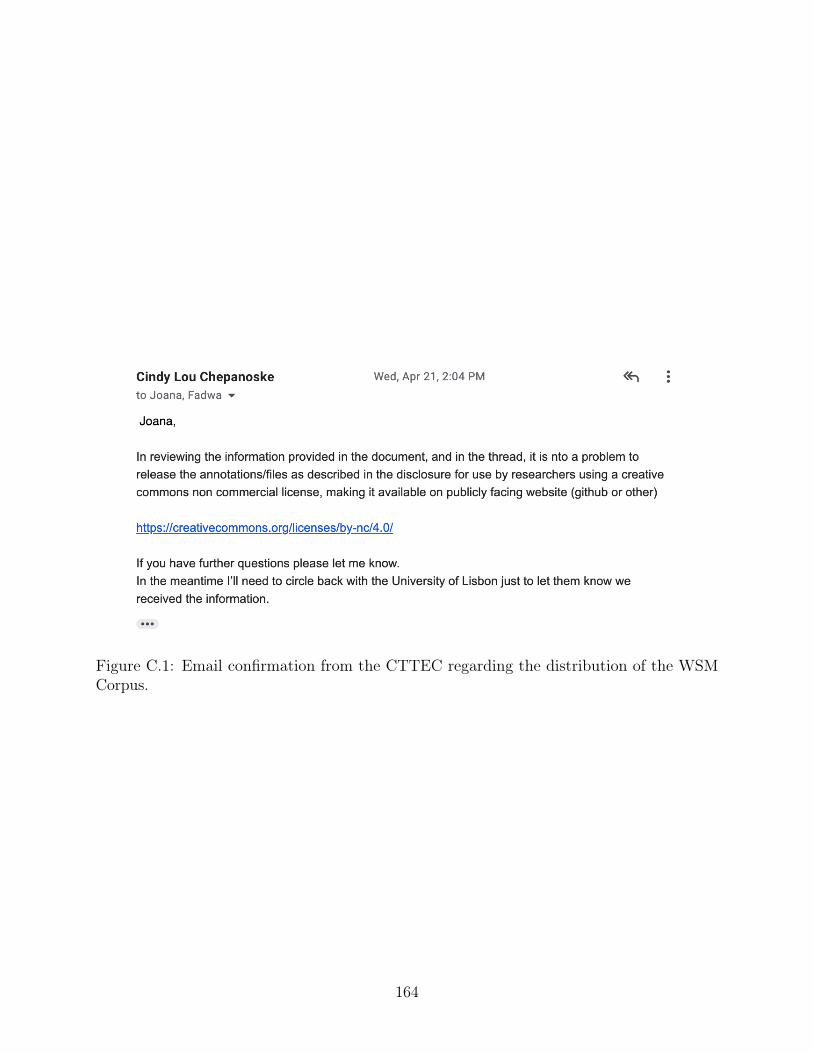
Figure C.1: Email confirmation from the CTTEC regarding the distribution of the WSMCorpus.
164
Related Documents


