1 - In-situ Extra Heavy Oil Production - benchmarking of CO2 capture solutions Karina Hofstad, Knut Ingvar Åsen, Kjersti Wilhelmsen, Erik Mikkelsen 2nd Oxyfuel Combustion Conference Yeppoon Australia, 12th – 16th September 2011

Welcome message from author
This document is posted to help you gain knowledge. Please leave a comment to let me know what you think about it! Share it to your friends and learn new things together.
Transcript
1 -
In-situ Extra Heavy Oil Production - benchmarking of CO2 capture solutions Karina Hofstad, Knut Ingvar Åsen, Kjersti Wilhelmsen, Erik Mikkelsen
2nd Oxyfuel Combustion Conference
Yeppoon Australia, 12th – 16th September 2011
2 - 2 -
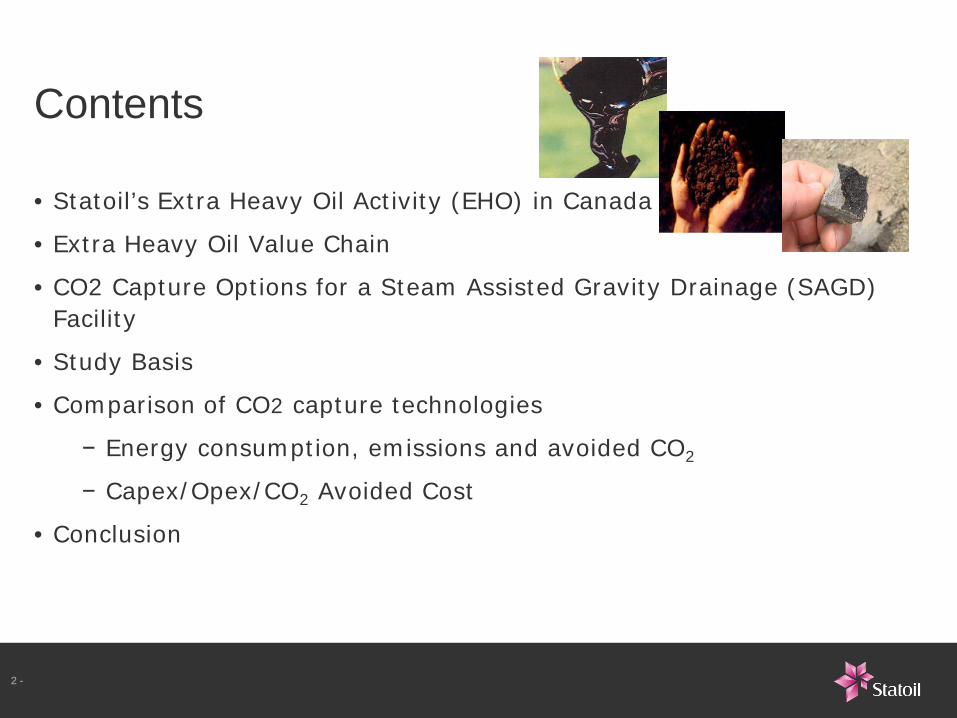
Contents
• Statoil’s Extra Heavy Oil Activity (EHO) in Canada
• Extra Heavy Oil Value Chain
• CO2 Capture Options for a Steam Assisted Gravity Drainage (SAGD) Facility
• Study Basis
• Comparison of CO2 capture technologies
− Energy consumption, emissions and avoided CO2
− Capex/Opex/CO2 Avoided Cost
• Conclusion
3 -
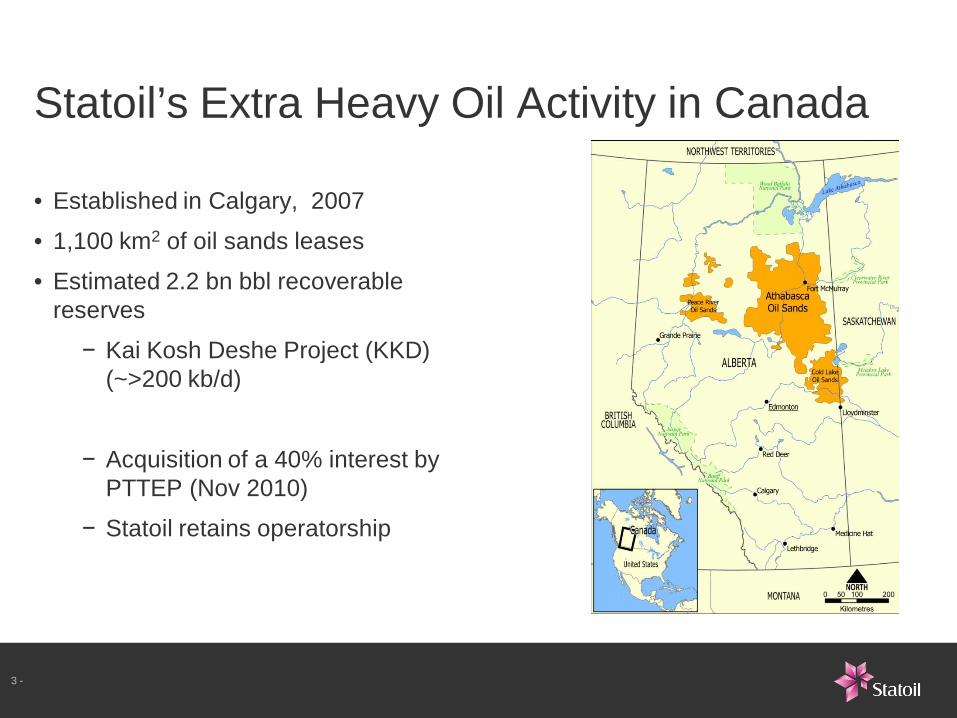
Statoil’s Extra Heavy Oil Activity in Canada
• Established in Calgary, 2007
• 1,100 km2 of oil sands leases
• Estimated 2.2 bn bbl recoverable reserves
− Kai Kosh Deshe Project (KKD) (~>200 kb/d)
− Acquisition of a 40% interest by PTTEP (Nov 2010)
− Statoil retains operatorship
3 -
4 - 4 -
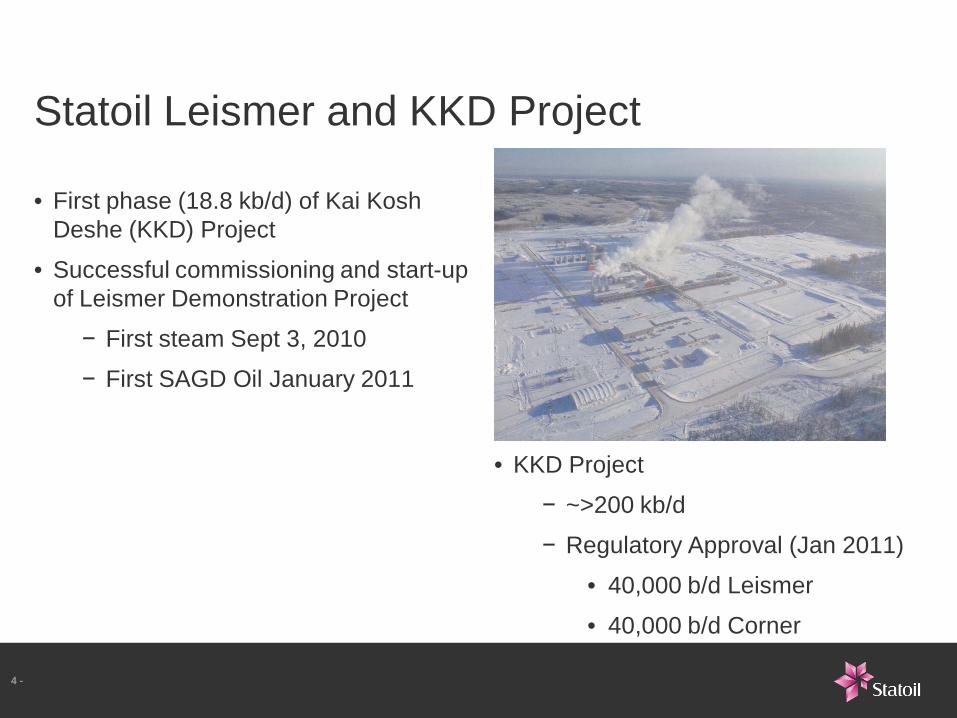
Statoil Leismer and KKD Project
• First phase (18.8 kb/d) of Kai Kosh Deshe (KKD) Project
• Successful commissioning and start-up of Leismer Demonstration Project
− First steam Sept 3, 2010
− First SAGD Oil January 2011
• KKD Project
− ~>200 kb/d
− Regulatory Approval (Jan 2011)
• 40,000 b/d Leismer
• 40,000 b/d Corner

5 - 5 -
EHO SAGD Production
• Steam is produced by Once Through Steam Generators (OTSGs).
• SAGD may require a Steam to Oil Ratio (SOR) of 2.5-3.0
• With natural gas as the main fuel the CO2 emission per produced barrel of heavy oil is very high (60–80 kg/bbl).
• The most common method for in-situ Extra Heavy Oil (EHO) production is Steam Assisted Gravity Drainage (SAGD).
• Injection of steam into the reservoir to reduce the viscosity of the bitumen

6 - 6 -
Natural Gas
Power
Water
SAGD Facilities Pipelines &
Terminals Upgrader
Bitumen Resource
Diluent Purchases
(Syncrude or condensate)
Bit Blend Purchases
Synbit or Dilbit Sales
Utilities - Natural Gas - Power
Water
Light Ends
Diluent
SCO
Byproducts - Coke - Sulphur
Emissions Emissions
Steam
Diluent Diluent
Bit Blend Bit Blend
EHO Value Chain
7 - 7 -
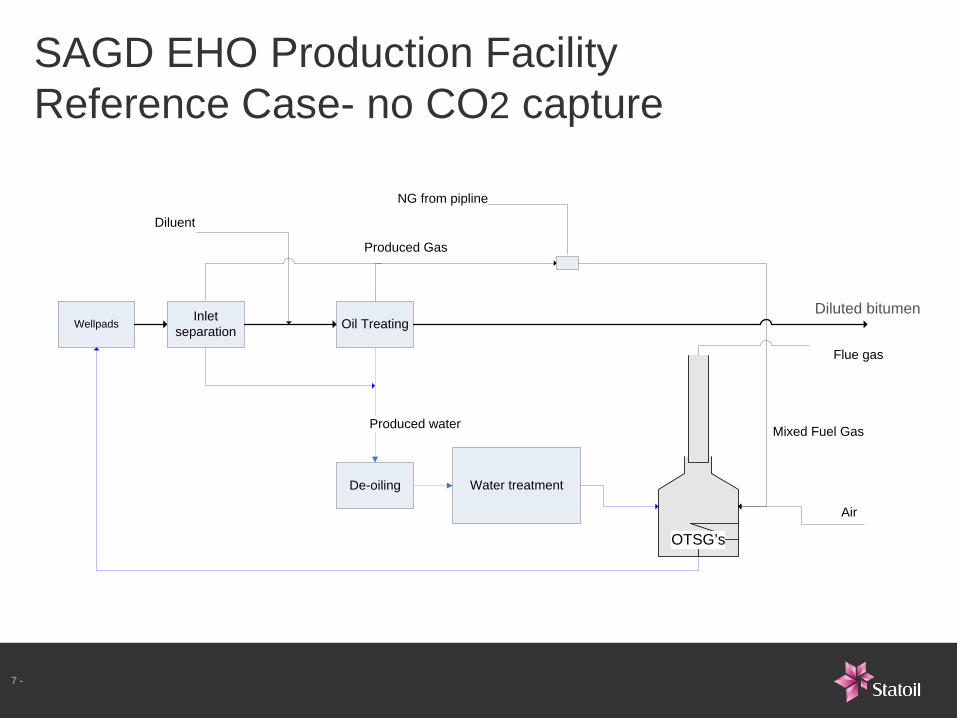
SAGD EHO Production Facility Reference Case- no CO2 capture
OTSG’s
Oil TreatingWellpads
Produced water
De-oiling Water treatment
Inlet separation
Diluted bitumen
Produced Gas
Mixed Fuel Gas
Air
NG from pipline
Diluent
Flue gas

8 - 8 -
Study basis
• Bitumen Production Capacity
− 60 000 bbl/d
• Steam Production from 9 OTSG’s
− ~30 000 ton/d saturated steam at 90 bar
− Steam quality from OTSG 75% steam (25% condensate)
− Emitting 1.6 mill ton CO2/y
• Dry NG from grid (>91% CH4) (additional produced gas from EHO wells)
• Electricity is imported from grid
• Cooling: air cooling and glycol/water mixture
• CO2 product specification
− CO2 >99 vol%
− H2O <50 ppm
− 220 Bar
• Statoil in house modelling and economic tools for dimentioning and costing
9 - 9 -
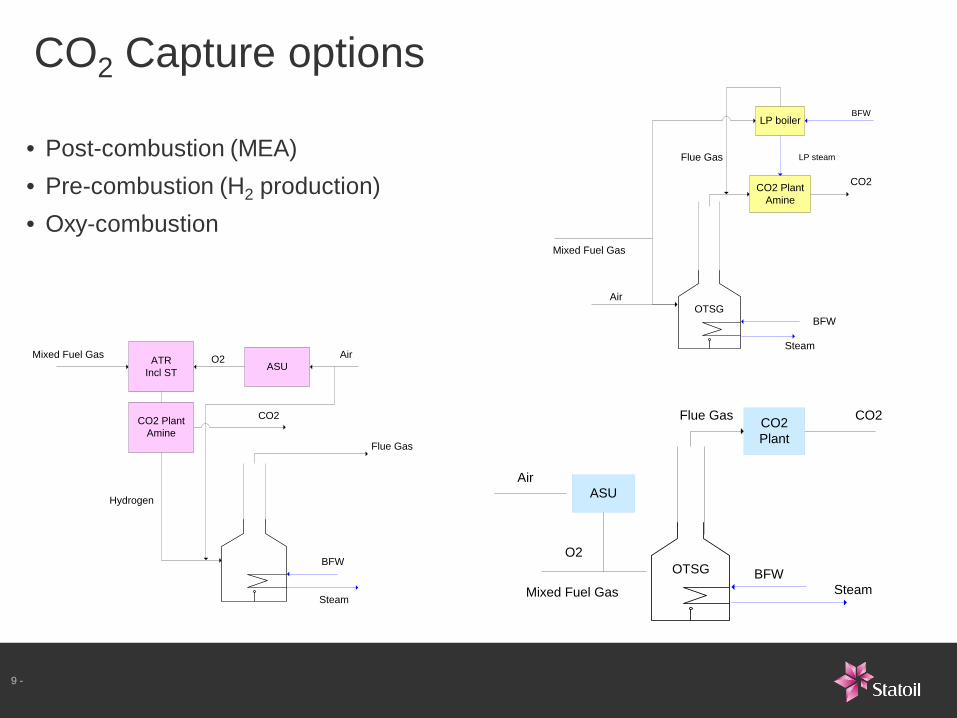
CO2 Capture options
• Oxy-combustion
• Pre-combustion (H2 production)
• Post-combustion (MEA) Flue Gas
Mixed Fuel Gas
CO2 PlantAmine
LP boiler
LP steam
CO2
BFW
BFW
Steam
AirOTSG
Flue Gas
Mixed Fuel Gas ATRIncl ST
ASU
CO2
Hydrogen
CO2 PlantAmine
O2
BFW
Steam
Air
Flue Gas
Mixed Fuel Gas
ASU
CO2CO2Plant
BFWSteam
O2
Air
OTSG

10 - 10 -
Energy Consumption
• Oxy-combustion CO2 capture has the lowest additional energy consumption
Energy Ref. Case Post- Oxy- Pre-Consumption no capture combustion combustion combustion(NG + produced gas) consumption (MJ/bbl) 1313 1650 1282 2045Electric power import (kWh/bbl) 20 36 58 32Total energy input (MJ/bbl) 1458 1910 1700 2276
Additional energy consumption (%) 31 17 56
50% efficiency assumed for power production
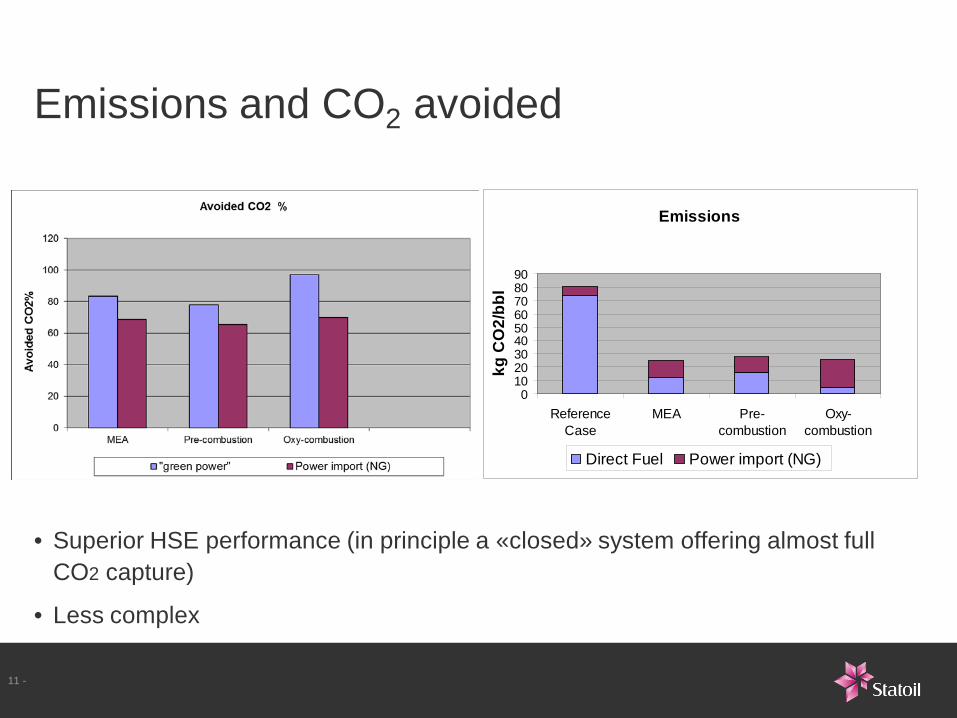
Emissions and CO2 avoided
• Superior HSE performance (in principle a «closed» system offering almost full CO2 capture)
• Less complex
• 11 -
Emissions
0102030405060708090
ReferenceCase
MEA Pre-combustion
Oxy-combustion
kg C
O2/
bb
l
Direct Fuel Power import (NG)
12 - 12 -
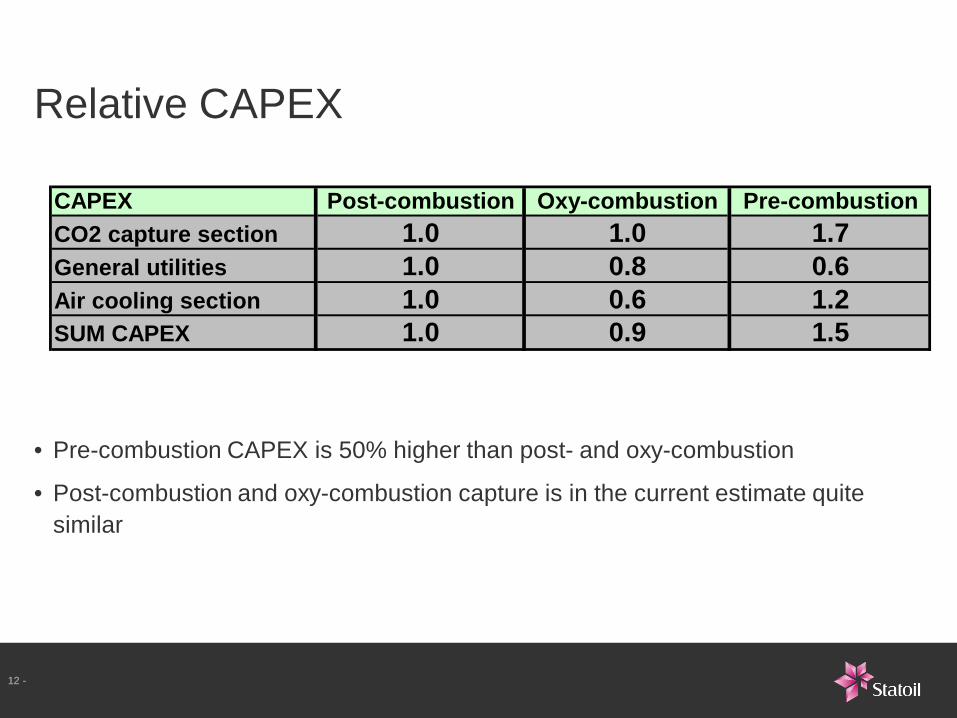
Relative CAPEX
• Pre-combustion CAPEX is 50% higher than post- and oxy-combustion
• Post-combustion and oxy-combustion capture is in the current estimate quite similar
CAPEX Post-combustion Oxy-combustion Pre-combustionCO2 capture section 1.0 1.0 1.7General utilities 1.0 0.8 0.6Air cooling section 1.0 0.6 1.2SUM CAPEX 1.0 0.9 1.5
13 -
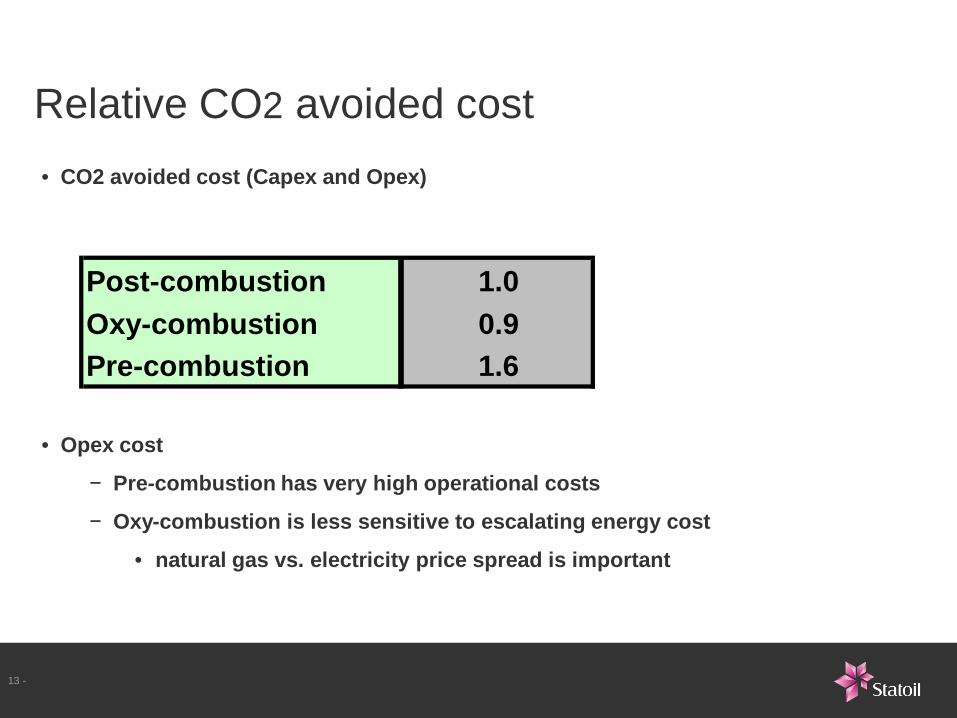
Relative CO2 avoided cost
• CO2 avoided cost (Capex and Opex)
• Opex cost
− Pre-combustion has very high operational costs
− Oxy-combustion is less sensitive to escalating energy cost
• natural gas vs. electricity price spread is important
Post-combustion 1.0Oxy-combustion 0.9Pre-combustion 1.6
14 - 14 -
Conclusion
• Pre-combustion capture is not favourable regarding neither total energy demand, avoided rate nor CO2 avoided cost
• Oxy-combustion has the lowest total energy demand per bbl of EHO produced
• Post-combustion and oxy-combustion show very similar CO2
avoided when electricity import is based on natural gas
• For SAGD, oxy-combustion capture is a promising option regarding energy consumption and CO2 avoided cost

15 - 15 -
In-situ Heavy Oil Production – benchmarking of CO2 capture solutions
Karina Hofstad
Principal Researcher Process Downstream
[email protected], tel: +47 48 02 78 53
www.statoil.com
Thank you
Related Documents


![TAR-SANDS (ARENAS BITUMINOSAS) [OIL-SANDS]](https://static.cupdf.com/doc/110x72/546e6d60b4af9faa268b468b/tar-sands-arenas-bituminosas-oil-sands.jpg)