submitted papers In Situ Diffusion Studies Using Spatially Resolved Infrared Microspectroscopy SUDARSANA R. CHALLA, SHI-QING WANG, and JACK L. KOENIG* Department of Macromolecular Science, Case Western Reserve University, Cleveland, Ohio 44106 Spatially resolved infrared microspectroscopy is used in conjunction with the contact method to conduct in situ diffusion experiments of photocured polymer-dispersed liquid crystals (LCs). The system an- alyzed consists of a low-molecular-weight liquid crystal (E7) diffus- ing into a photopolymerizable monomer (NOA65). The measured concentration profiles were generated by monitoring the hydroxyl band of the monomer as a function of time and spatial position. The diffusion coefficients were calculated from least-squares fitting of the data. The system followed Fick's second law of diffusion. The diffusion coefficient for this system is (1.97 ± 0.2)*(10 8) cmVs. The morphology of the system after polymerization exhibited three dis- tinct regions: nematic LC molecularly mixed in the cross-linked network of the polymer, nematic LC droplet gradient in the poly- mer matrix, and polymer fibers scattered in the continuous nematic LC. Index Headings: FT-IR microspectroscopy; Diffusion; E7; NOA65; Polymers; Liquid crystals; Polymer-dispersed liquid crystals; PDLC. INTRODUCTION Infrared microspectroscopy has found a wide range of applications in several areas of analytical science includ- ing polymer science, forensic science, earth science, pharmaceutics, and electronics. 1 The capability of this technique to obtain chemical information from an area as small as 10 txm makes the method very attractive for these applications. When the technique is coupled with a computerized stage, one can obtain spatial compositional information of samples and generate functional group im- ages. 2,3 This infrared imaging or mapping has been used to identify inhomogenieties in samples such as polymers, materials, and biological tissues. The proper utilization of this technique requires appropriate microsampling tech- niques. The diffusion of small molecules in and through pol- ymeric materials and the resulting effect on the prop- erties of the polymers have been the subject of many studies because of the utility of the polymeric materials as membranes and structural materials. Several types of diffusion have been identified, and typically polymers above their glass transition temperature exhibit Fickian characteristics. Diffusion processes have been studied Received 4 January 1996; accepted 23 June 1996. * Author to whom correspondence should be sent. by various techniques including light scattering, Ruth- erford backscattering spectrometry, and nuclear mag- netic resonance (NMR) imaging. 4 Each of these methods has its drawbacks with respect to the sample preparation techniques, spatial resolution, and concentration sensi- tivity. IR microspectroscopy proves to be a viable technique for diffusion studies and has been used to probe the pro- files of additives in polymers, 5 to estimate the diffusion of antioxidant in cross-linked polyethylene, 6 and to study the diffusion behavior of bovine serum albumin in amy- lopectin gels. 7 In some of these cases diffusion is allowed to occur in the bulk of the sample, and then the sample is microtomed before the analysis. Microtoming has sev- eral disadvantages such as the requirement of several minutes for preparation of the sample and the sacrifice of the sample in the process. In this paper we report the development of a new tech- nique to conduct in situ diffusion studies combining the contact method with spatially resolved infrared micro- spectroscopy. In the contact method, the pure components of a binary mixture are brought into contact with each other to form an interface and subsequent concentration gradient. The study of diffusion of liquid crystals (LCs) into polymers is important because of the dependence of the phase-separation dynamics of these blends on the diffu- sion parameters. Mixtures of a polymer and a low-mo- lecular-weight liquid crystal usually result in the disper- sion of LC droplets in the polymer matrix. These poly- mer-dispersed liquid crystals (PDLCs) have been the sub- ject of extensive research because of their potential utility in the electro-optics industry. 8 When placed between two conductive slides, PDLC films appear opaque because of the mismatching of the refractive indices between the droplet and the polymer matrix. With the application of the electric field, the liquid crystal molecules in the drop- lets align, leading to a matching of the refractive indices; hence, the sample appears transparent. One of the techniques for forming PDLC films is by the polymerization-induced phase-separation process. 9 This process involves mixing the LC with the prepolymer and then polymerizing the monomer by either UV light or heat to separate out the LC in the form of droplets. Volume 50, Number 11 1996 0003-7028/96/5011-133952.00/0 APPLIED SPECTROSCOPY 1339 ' © 1996 Society for Applied Spectroscopy

Welcome message from author
This document is posted to help you gain knowledge. Please leave a comment to let me know what you think about it! Share it to your friends and learn new things together.
Transcript

submitted papers
In Situ Diffusion Studies Using Spatially Resolved Infrared Microspectroscopy
SUDARSANA R. CHALLA, SHI-QING WANG, and JACK L. KOENIG* Department o f Macromolecular Science, Case Western Reserve University, Cleveland, Ohio 44106
Spatially resolved infrared microspectroscopy is u sed in conjunction with the contact method to conduct in situ diffusion experiments of photocured polymer-dispersed liquid crystals (LCs) . T h e system an- alyzed consists of a low-molecu la r -we igh t l iquid crys ta l (E7) diffus- ing into a photopolymerizable monomer (NOA65). T he measured concentration profiles were generated by monitoring the hydroxyl band of the monomer as a function of time and spatial position. The diffusion coefficients were calculated from least-squares fitting of the data. The system followed F ick ' s second law of diffusion. The diffusion coefficient for this system is (1.97 ± 0.2)*(10 8) cmVs. The morphology of the system after polymerization exhibited three dis- t inct regions: nematic LC molecularly mi xed in the cross-linked network of the polymer, nematic LC droplet gradient in the poly- mer matrix, and polymer fibers scattered in the continuous nematic LC.
Index Headings: F T - I R microspectroscopy; Diffusion; E7; NOA65 ; Polymers; Liquid crystals; Polymer-dispersed liquid crystals; P D L C .
I N T R O D U C T I O N
Infrared microspectroscopy has found a wide range of applications in several areas of analytical science includ- ing polymer science, forensic science, earth science, pharmaceutics, and electronics. 1 The capability of this technique to obtain chemical information from an area as small as 10 txm makes the method very attractive for these applications. When the technique is coupled with a computerized stage, one can obtain spatial compositional information of samples and generate functional group im- ages. 2,3 This infrared imaging or mapping has been used to identify inhomogenieties in samples such as polymers, materials, and biological tissues. The proper utilization of this technique requires appropriate microsampling tech- niques.
The diffusion of small molecules in and through pol- ymeric materials and the resulting effect on the prop- erties of the polymers have been the subject of many studies because of the utility of the polymeric materials as membranes and structural materials. Several types of diffusion have been identified, and typically polymers above their glass transition temperature exhibit Fickian characteristics. Diffusion processes have been studied
Received 4 January 1996; accepted 23 June 1996. * Author to whom correspondence should be sent.
by various techniques including light scattering, Ruth- erford backscattering spectrometry, and nuclear mag- netic resonance (NMR) imaging. 4 Each of these methods has its drawbacks with respect to the sample preparation techniques, spatial resolution, and concentration sensi- tivity.
IR microspectroscopy proves to be a viable technique for diffusion studies and has been used to probe the pro- files of additives in polymers, 5 to estimate the diffusion of antioxidant in cross-linked polyethylene, 6 and to study the diffusion behavior of bovine serum albumin in amy- lopectin gels. 7 In some of these cases diffusion is allowed to occur in the bulk of the sample, and then the sample is microtomed before the analysis. Microtoming has sev- eral disadvantages such as the requirement of several minutes for preparation of the sample and the sacrifice of the sample in the process.
In this paper we report the development of a new tech- nique to conduct in situ diffusion studies combining the contact method with spatially resolved infrared micro- spectroscopy. In the contact method, the pure components of a binary mixture are brought into contact with each other to form an interface and subsequent concentration gradient.
The study of diffusion of liquid crystals (LCs) into polymers is important because of the dependence of the phase-separation dynamics of these blends on the diffu- sion parameters. Mixtures of a polymer and a low-mo- lecular-weight liquid crystal usually result in the disper- sion of LC droplets in the polymer matrix. These poly- mer-dispersed liquid crystals (PDLCs) have been the sub- ject of extensive research because of their potential utility in the electro-optics industry. 8 When placed between two conductive slides, PDLC films appear opaque because of the mismatching of the refractive indices between the droplet and the polymer matrix. With the application of the electric field, the liquid crystal molecules in the drop- lets align, leading to a matching of the refractive indices; hence, the sample appears transparent.
One of the techniques for forming PDLC films is by the polymerization-induced phase-separation process. 9 This process involves mixing the LC with the prepolymer and then polymerizing the monomer by either UV light or heat to separate out the LC in the form of droplets.
Volume 50, Number 11 1996 0003-7028/96/5011-133952.00/0 APPLIED SPECTROSCOPY 1339 ' © 1996 Society for Applied Spectroscopy
A A B B
Working area
Diffusion direction Monomer Liquid crystal
/-,/-y//f,, IR
After curing FXG. 1. Schematic illustration of the contact method and the experimental setup for diffusion.
Smith studied the phase behavior of a UV-curable PDLC system using calorimetry and electron microscopy. ~°,1~ Lovinger et al. studied the various morphological features exhibited in these systems as a function of curing inten- sity and temperature. J2 We utilized this process to prepare the PDLC films used in our in situ infrared microspec- troscopic study.
EXPERIMENTAL
The low-molecular-weight liquid crystal used in the studies was E7, a eutectic liquid crystal mixture con-
sisting of four types of cyano-biphenyls. E7 is manu- factured by BDH Chemical Co., Poole, England and dis- tributed by EM Industries, Hawthorne, NY. Norland op- tical adhesive (NOA65), the photopolymerizable mix- ture, was pu rchased f rom Nor l and Produc ts , New Brunswick, NJ. NOA65 consists of tr imethylolpropane diallyl ether, tr imethylolpropane tristhiol, isophorone di- isocyanate ester, and benzophenone photoinitiator. 1° The materials were used as received. The UV-curable mix- ture was not exposed to UV radiation from sunlight or room lights.
0.95
0.85
0.75
0.65
0.66
~o 0.45
O
< 0.35
0.26
0.15.
0.05.
FIG. 2.
-0.05
4000 3500 3000 2500
Wavenumber (cm "1)
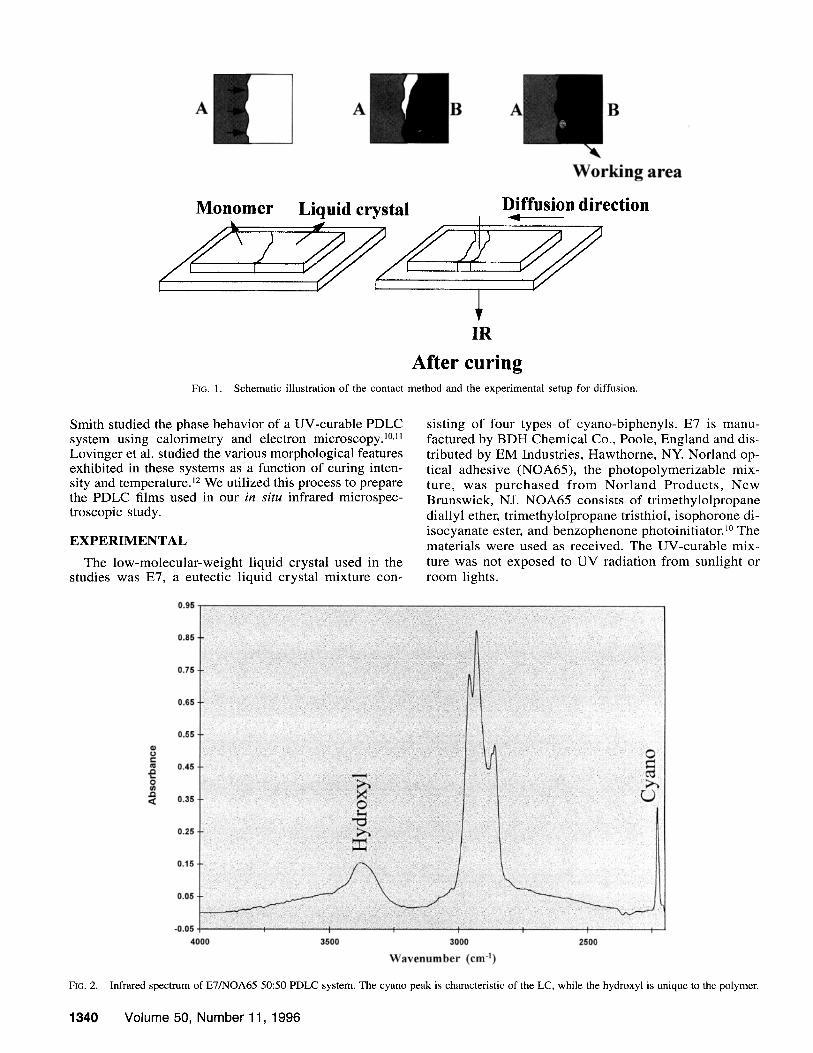
Infrared spectrum of E7/NOA65 50:50 PDLC system. The cyano peak is characteristic of the LC, while the hydroxyl is unique to the polymer.
1340 Volume 50, Number 11, 1996

Diffusion Direction
1,0-
0.8.
0.2,
FIG. 3. A schematic representation of the experimental parameters to obtain the line maps and the rectangular maps.
0,6.
0.4.
0.0, 300 200 100 0 -100 -200
Diffusion Distance (~m)
FIG. 4. The diffusion profile of E7 into NOA65 at 27 °C after 70 rain, adhering to Fick's second law of diffusion.
A cell such as that shown in Fig. 1 is fabricated by using two glass slides. The monomer is introduced at one end. After the monomer moves into the gap by capillary action to about half the width of the cell, the LC is in- troduced at the other end. The LC moves into the vacant space and meets the monomer boundary. The time period after the liquids meet is observed as the beginning of the diffusion. This approach is known as the contact method and has been used for qualitative elucidation of phase diagramsJ 3-17 A further description is given in the next section. After the diffusion process, the system was cured by using a UV lamp (Black Ray, UVR San Gabriel, CA) at 365-nm wavelength and 1-mW/cm 2 intensity. The re- suiting sample was subjected to spectroscopic studies.
Spectra were recorded on a Spectra-Tech IRixS infrared microscope system equipped with a 250-)xm × 250-txm narrow-band MCT detector. A 15x objective coupled with a 10x condenser was used to obtain transmission spectra with 50 scans at a resolution of 4 cm -1. The re- gion to be imaged depended upon the time period of the diffusion. The selection of the type of aperture and the step size was based upon the type of map, whether linear or rectangular. The details are given in the following sec- tion.
A Mettler FP84HT/FPSOHt thermal microscopy cell was used to control the cooling and heating rates. This cell was used in conjunction with a Spectra-Tech IR~S infrared microscope so that the spectra could be collected while the sample was experiencing different temperature conditions. The changes in the morphology were record- ed with a video recorder from which the images were processed with the use of variety of software packages including Digital Asymmetrix Video Producer and Adobe Photoshop.
R E S U L T S A N D D I S C U S S I O N
The infrared spectrum of a mixture of NOA65 and E7 in the ratio of 1:1 is shown in Fig. 2. The hydroxyl band (3381 cm -1) is characteristic of the polymer, and the ni- trile (2226 cm -~) is unique to the liquid crystal. By mon-
itoring the absorbance values of these two peaks, we can obtain spatial information about the concentration of the polymer and the LC. This spectrum is obtained by plac- ing the material between two glass substrates. Glass ab- sorption cuts off wavelengths after 2220 cm -1. If the background spectrum is collected by using air as the me- dium or by focusing on a KBr disk without the sample, and the sample spectrum is collected with the glass sub- strates, then the nitrile peak that is characteristic of the LC is located on the broad shoulder, making it difficult to obtain accurate values of absorbance. The key to ob- taining a good spectrum that can give an identifiable cy- ano peak is to first obtain a background by using a cell of the same thickness as the sample cell but with no sample in it and then to proceed to fill it with the mono- mer and LC and the other experimental components to obtain a spectrum of the type shown in Fig. 2.
The contact method was used in conjunction with op- tical microscopy to determine the miscibility character- istics of several polymers and liquid crystals. With the
b
1,0
0,8.
0.6.
0.4.
0,2-
0.0
FIG. 5. of time.
--,--70 rrinutes
--°--45 rdnutes
--A--25 rrinutes
--v-- 10 ninctes
ooO . " =
,-g I A / .d ..-;
, °
! r 0 ' - - ~ - - " d z - - ' ~ ' ~ 169
Diffusion Distance (lain)
The diffusion profiles of E7 into NOA65 at 27 °C as a function
APPLIED SPECTROSCOPY 1341

10 min
0
25 min
45 min
70 min
, J II" V ~,lal 1.1[
FiG. 6. [R spectroscopic images of the concentration profiles. The normalized intensity of the cyano peak is plotted as a function of position. The images reflect the concentration of the LC within the system.
use of the infrared spectrometer with this method, quan- titative information was obtained with relative ease. 18,19 Two issues that need to be addressed in this process are the spatial resolution and the time scale of the experi- ment. Approximately 10 ixm is identified as the limit of spatial resolution of the instrument. The diffusion dis- tance must be greater than the spatial resolution. Second, either the time scale of the experiment should be much shorter than the time period of diffusion or the system needs to be made less mobile by freezing or cross-link- ing.
In the present situation, the diffusion was stopped by cross-linking the monomer by UV light after diffusion was allowed for a certain t ime period. The cross-linked network system exhibits interesting features that give valuable information about the morphological behavior of PDLC systems. The initial monomer and LC system were maintained at 27 °C. A mixture of these materials was shown to exhibit a UCST (upper critical solution temperature) type of behavior with the critical point around 27 °C, above which the materials are miscible for all composi t ionsJ ° It is expected that the system will fol- low Fickian diffusion above this temperature. Diffusion below this temperature might result in other types of dif- fusion behavior such as case II or anomalous diffusion. The system is exposed to UV light while being main- tained at 27 °C. I f the system is brought to room tem- perature (20-23 °C) after the diffusion process, this con- dition might result in phase separation even before ex- posure to UV light. Exposure to UV light results in sross-
linking of the monomer, which results in an increase in the molecular weight due to the formation of polymer. This behavior results in the upward shift of the original UCST curve, resulting in the phase separation of the LC in the form of droplets, until eventually the droplet mor- phology is locked in by the cross-linking of the polymei:
IR mapping can be done in two ways, linear mapping and rectangular mapping. As the names suggest, linear mapping involves moving the stage in either the x or y direction to obtain concentration information along a sin- gle line. Therefore, a linear mapping experiment con- ducted along the diffusion direction is sufficient to delin- eate the features of the diffusion process. Rectangular mapping is done to obtain spatial information, a proce- dure typically conducted to test the size or extent of de- fects in polymer films or to obtain a picture of the con- centration fluctuations within a system as a function of t ime or temperature. This mapping technique as applied to diffusion gives insight into the concentration gradient in correlating with the optical micrographs, as will be demonstrated later. The experimental parameters are shown in Fig. 3.
Line maps were obtained by using a 24-~m × 60-txm aperture with a step size of 12 txm. The step size is cho- sen to be equal to about half the size of the aperture in order to obtain overlapping information, which yields im- proved spatial resolution. The shorter side of the rectan- gular aperture is aligned with the diffusion direction, and the spectra are obtained along a single line in this direc- tion. This experiment results in a line map yielding the
1:342 Volume 50, Number 11, 1996
::.~.:::::;~:~.;::::~i:~:~i:;~iii!~!::i::i ~:~i~::~:~:;?i::i ~!?:~i!!::i;~'iii~i~iiiii!!~:::~i~ ::~i~::~i~ ~
.:;.::::: ~.~%~::!~
: : : : : : : ? u
: : :4 . : : . . . ! : : : :
~ : i ' i " " :: : "~. " i : ":~i~ :?~:
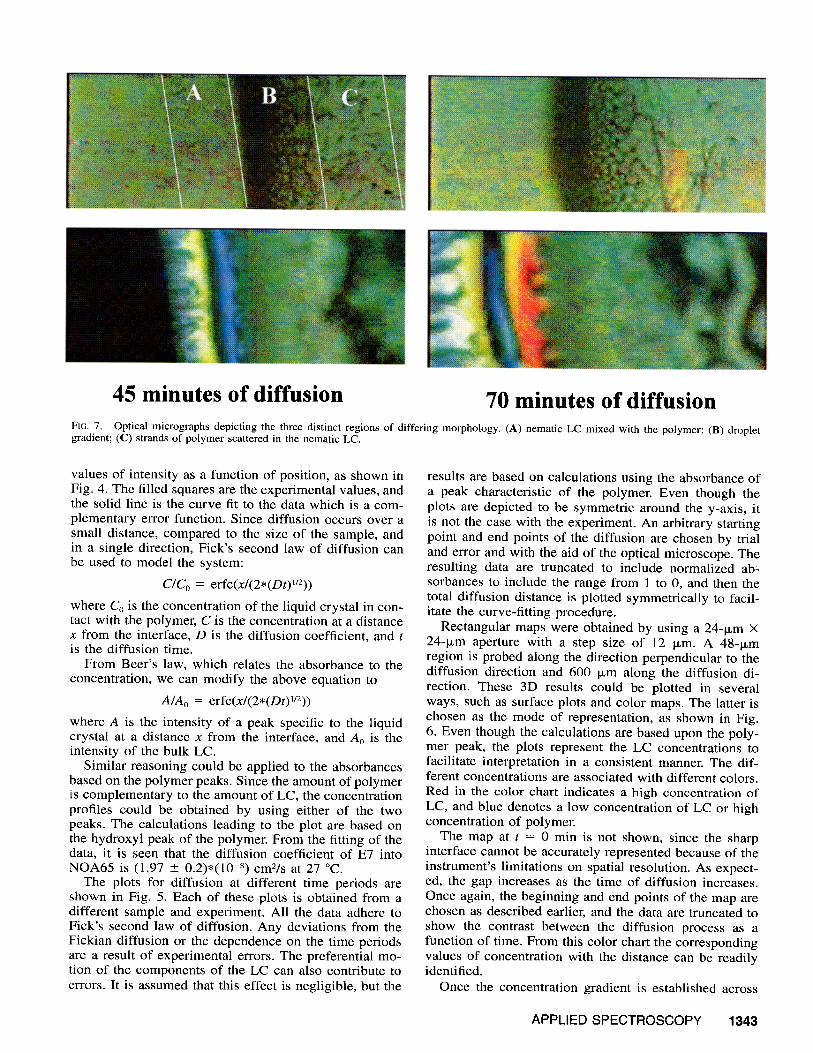
45 minutes of diffusion 70 minutes of diffusion FIG. 7. Optical micrographs depicting the three distinct regions of differing morphology. (A) nematic LC mixed with the polymer; (B) droplet gradient; (C) strands of polymer scattered in the nematic LC.
values of intensity as a function of position, as shown in Fig. 4. The filled squares are the experimental values, and the solid line is the curve fit to the data which is a com- plementary error function. Since diffusion occurs over a small distance, compared to the size of the sample, and in a single direction, Fick's second law of diffusion can be used to model the system:
C / C o = e r f c ( x / ( 2 , ( D t ) l / 2 ) )
where Co is the concentration of the liquid crystal in con- tact with the polymer, C is the concentration at a distance x from the interface, D is the diffusion coefficient, and t is the diffusion time.
From Beer 's law, which relates the absorbance to the concentration, we can modify the above equation to
A / A o = e r f c ( x / ( 2 , ( D t ) l / 2 ) )
where A is the intensity of a peak specific to the liquid crystal at a distance x from the interface, and A0 is the intensity of the bulk LC.
Similar reasoning could be applied to the absorbances based on the polymer peaks. Since the amount of polymer is complementary to the amount of LC, the concentration profiles could be obtained by using either of the two peaks. The calculations leading to the plot are based on the hydroxyl peak of the polymer. From the fitting of the data, it is seen that the diffusion coefficient of E7 into NOA65 is (1.97 ___ 0.2)*(10 -8) cmVs at 27 °C.
The plots for diffusion at different t ime periods are shown in Fig. 5. Each of these plots is obtained from a different sample and experiment. All the data adhere to Fick's second law of diffusion. Any deviations from the Fickian diffusion or the dependence on the time periods are a result of experimental errors. The preferential mo- tion of the components of the LC can also contribute to errors. It is assumed that this effect is negligible, but the
results are based on calculations using the absorbance of a peak characteristic of the polymer. Even though the plots are depicted to be symmetr ic around the y-axis, it is not the case with the experiment. An arbitrary starting point and end points of the diffusion are chosen by trial and error and with the aid of the optical microscope. The resulting data are truncated to include normalized ab= sorbances to include the range f rom 1 to 0, and then the total diffusion distance is plotted symmetrical ly to facil- itate the curve-fitting procedure.
Rectangular maps were obtained by using a 24-~m × 24-~m aperture with a step size of 12 ~m. A 48 -~m region is probed along the direction perpendicular to the diffusion direction and 600 ~m along the diffusion di- rection. These 3D results could be plotted in several ways, such as surface plots and color maps. The latter is chosen as the mode of representation, as shown in Fig. 6. Even though the calculations are based upon the poly- mer peak, the plots represent the LC concentrations to facilitate interpretation in a consistent manner. The dif- ferent concentrations are associated with different colors. Red in the color chart indicates a high concentration of LC, and blue denotes a low concentration of LC or high concentration of polymer.
The map at t = 0 min is not shown, since the sharp interface cannot be accurately represented because of the instrument 's limitations on spatial resolution. As expect- ed, the gap increases as the time of diffusion increases. Once again, the beginning and end points of the map are chosen as described earlier, and the data are truncated to show the contrast between the diffusion process as a function of time. From this color chart the corresponding values of concentration with the distance can be readily identified.
Once the concentration gradient is established across
APPLIED SPECTROSCOPY 1343
the system after diffusion, polymerization of this system exhibits interesting morphology. It behaves like a number of PDLC samples of varying composition of LC and polymer placed adjacent to each other with no distinct boundaries. One can get an approximate idea of the mor- phology of these PDLC systems as a function of com- position with a minimal amount of sample preparation and time.
Figure 7 shows the optical micrographs of a typical system after diffusion and curing. This sample exhibits three distinct bands: (1) polymer strands in the nematic LC, (2) a droplet gradient, and (3) a colorful band beside the 100% LC region and a 100% polymer region. Very close to the 100% LC region lies the fibrous region. Since the amount of monomer is small in comparison to the LC, the monomer polymerizes into a polymer network that aggregates into the strands suspended in the nematic LC as the continuous medium.
As the concentration of the polymer increases, it is sufficient to form a continuous matrix containing the LC in the form of droplets. The size of these droplets de- creases with increasing concentration of the polymer, consistent with the reports published earlier. 9 Since the whole sample experiences the same conditions of thick- ness, temperature, and curing intensity, a whole range of droplet sizes results in a droplet gradient with big drops closer to the pure LC region and small, optically indis- tinguishable droplets closer to the 100% polymer region.
A clear boundary exists between the phase-separated and single-phase regions, as shown in Fig. 7. To the left of this boundary, there is LC molecularly mixed with the polymer. This region shows birefringence under crossed polarizers. It is thought that the nematic LC exhibits a certain order within this region, giving this region a char- acteristic colorful appearance. This LC order is possibly due to the low intensity of the UV light and hence longer curing times, which probably allow sufficient time for the LC molecules to order. In between the colorful region and the 100% polymer region, there could be a region where the LC is mixed with the polymer but does not manifest itself in the form of an observable band.
There are several variables that control this morphol- ogy: the curing temperature, the curing intensity, and the method of curing. 12 These issues are under investigation.
C O N C L U S I O N
In situ diffusion studies of liquids into liquids and liq- uids into polymers can be successfully conducted by us- ing spatially resolved infrared microspectroscopy. This technique, when coupled with the contact method, can be used to obtain the diffusion coefficients as well as the concentration profiles of the systems as a function of spa- tial position. The diffusion of a low-molecular-weight liq- uid crystal (E7) into a photopolymerizable monomer
(NOA65) followed Fick's second law of diffusion at a temperature above the critical temperature of the mixture with a diffusion coefficient of (1.97 ± 0.2)*(10 -8) cm2/s at 27 °C.
Optical micrographs of the system after diffusion and polymerization showed three distinct regions: (1) nematic LC molecularly mixed in the cross-linked network of the polymer, (2) nematic LC droplet gradient in the polymer matrix, and (3) polymer fibers scattered in the continuous nematic LC. These regions span the concentration region between the 100% polymer and the 100% LC region. It was shown that the technique is capable of obtaining de- tailed morphological information as a function of curing intensity and temperature with relative ease and simplic- ity. Research is under way not only to understand the morphological behavior but also to determine the limits of solubility of the LC in the cured matrix by using an infrared microspectrometer.
A C K N O W L E D G M E N T
Financial support by the National Science Foundation Center for Ad- vanced Liquid Crystalline Optical Materials is gratefully acknowledged.
1. H. J. Humecki, Practical Guide to Infrared Microspectroscopy (Marcel Dekker, New York, 1995).
2. R. G. Messerschmidt and M. A. Harthcock, Infrared Micro-spec- troscopy: Theory and Applications (Marcel Dekker, New York, 1988).
3. K. Krishnan and S. L. Hill, in Practical Fourier Transform Infrared Spectroscopy: Industrial and Laboratory Chemical Analysis, J. R. Ferraro and K. Krishnan, Eds. (Academic Press, London, 1990), p. 103.
4. L. A. Weisenberger and J. L. Koenig, Macromolecules 23, 2445 (1990).
5. S. C. Hsu, D. Lin-Vien, and R. N. French, Appl. Spectrosc. 46, 225 (1992).
6. K. Sheu, S. J. Huang, and J. E Johnson, Polym. Eng. Sci. 29, 77 (1989).
7. R. E. Cameron, M. A. Jalil, and A. M. Donald., Macromolecules 27, 2708 (1994).
8. J. W. Doane, N. A. Vaz, and S. Zumer, Appl. Phys. Lett. 48, 269 (1986).
9. J. L. West, in Advances in Liquid Crystal Polymers, R. A. Weiss, and C. K. Ober, Eds., ACS symposium series (American Chemical Society, Washington, D.C., 1990).
10. G. W. Smith, Mol. Cryst. Liq. Cryst. 196, 89 (1991). 11. G. W. Smith, Phys. Rev. Lett. 70, 198 (1993). 12. A. J. Lovinger, K. R. Amundson, and D. D. Davis, Chem. Mater.
6, 1726 (1994). 13. L. Koefler and A. Koefler, Thermomikromethoden (Verlag Chemie,
Weinheim, 1954). 14. G. Sigaud, M. E Achard, E Hardouin, M. Mauzac, H. Richard, and'
H. Gasparoux, Macromolecules 20, 578 (1987). 15. G. Sigaud, M. E Achard, E Hardouin, and H. Gasparoux, Molec.
Cryst. Liq. Cryst. 155, 443 (1988). 16. G. Sigaud, M. E Achard, F. Hardouin, C. Coulon, H. Richard, and
M. Mauzac, Macromolecules 23, 5020 (1990). 17. Fu-Lung Chen and A. M. Jamieson, Liq. Cryst. 15, 171 (1993). 18. S. R. Challa, S. Q. Wang, and J. L. Koenig, Appl. Spectrosc. 49,
267 (1995). 19. S. R. Challa, S. Q. Wang, and J. L. Koenig, Appl. Spectrosc., paper
accepted.
1344 Volume 50, Number 11, 1996
Related Documents