Contents of this document are for non-US residents only Wealth and Investment Management Important Information: Please note that the contents of this document are intended for non-US residents only. In Focus: Markets as we see them Wait for it “Opportunity doesn’t make appointments; you have to be ready when it arrives.” – Tim Fargo Oil price risks shifting to the upside A major driver of oil prices is of course the balance between global demand and supply. Unfortunately for those looking to guess at where oil prices will head next, both are much harder to accurately measure than much of the commentary would imply. Oil market data quality has surely come a long way in the past decade, but many flaws remain. As a result, the global demand and supply balance is frequently revised in both directions with initial estimates often alarmingly wide off the mark. For example with the 2014 revisions in, it is clear that a more than one million barrel per day discrepancy between estimates and reality contributed to the price decline in that year. Nonetheless, with hindsight, the statistics do tend to be decent indicators of price direction, if often not magnitude, (Figure 1) and so are still worth paying attention to. Right now they seem to be telling us that risks to the oil price are finally starting to tilt to the upside. Rebalanced? Oil market rebalancing has been underway for some time, since oversupply peaked in Q2 2015. According to IEA estimates, the global excess supply has already shrunk to only 0.3 million barrels per day during the second quarter of this year. The signs indicating that this rebalancing will continue into the future are both convincing and unsurprising - after all the best remedy for low oil prices is indeed low oil prices. Low oil prices have clearly stimulated demand, with North American drivers among those taking advantage (Figure 2). On the supply side, low oil prices have decisively 07 October 2016 For EMEA and Asia distribution only Inside (click to jump to sections) Oil price risks shifting to the upside A major driver of oil prices is the balance between global demand and supply. With hindsight, the statistics do tend to be decent indicators of price direction Rebalanced? Oil market rebalancing has been underway for some time, since oversupply peaked in Q2 2015. Many market observers including Barclays Investment Bank expect supply and demand shifting to a draw in the fourth quarter Can investors benefit? Most investors can only invest in oil though the futures market and derived products. As a result the investor’s return is not directly linked to the spot oil price movement but instead the futures price curve Upward bound There are various factors that might limit the upside potential of oil price in the medium term Conclusion Regarding our equity sector strategy, the improving outlook on the oil price is one of the developments that now warrant adjusting our stances Market calls – summary Selected risks to our views Asset class summary Latest market data Key macroeconomic projections The case for investing Figure 1: Global oil supply & demand balance and price Figure 2: US vehicle distance traveled Source: Datastream, Barclays Source: Datastream, Barclays 0 2 -2 1 -1 40 60 80 100 120 140 '13 '06 '12 '11 '10 '09 '15 '08 '14 '07 WTI oil price (lagged, rhs) Global oil demand minus supply Million barrels per day US dollar per barrel 3.0 2.4 2.8 2.6 2005-'09 2010-'14 1995-'99 2000-'04 US vehicle distance traveled Rolling 12 month total (trillion miles)

Welcome message from author
This document is posted to help you gain knowledge. Please leave a comment to let me know what you think about it! Share it to your friends and learn new things together.
Transcript

Contents of this document are for non-US residents only
Wealth and Investment
Management
Important Information: Please note that the contents of this document are intended for non-US residents only.
In Focus: Markets as we see them
Wait for it
“Opportunity doesn’t make appointments; you have to be ready when it
arrives.” – Tim Fargo
Oil price risks shifting to the upside
A major driver of oil prices is of course the balance between global demand and
supply. Unfortunately for those looking to guess at where oil prices will head next,
both are much harder to accurately measure than much of the commentary would
imply. Oil market data quality has surely come a long way in the past decade, but
many flaws remain. As a result, the global demand and supply balance is frequently
revised in both directions with initial estimates often alarmingly wide off the mark. For
example with the 2014 revisions in, it is clear that a more than one million barrel per
day discrepancy between estimates and reality contributed to the price decline in that
year. Nonetheless, with hindsight, the statistics do tend to be decent indicators of
price direction, if often not magnitude, (Figure 1) and so are still worth paying
attention to. Right now they seem to be telling us that risks to the oil price are finally
starting to tilt to the upside.
Rebalanced? Oil market rebalancing has been underway for some time, since oversupply peaked in
Q2 2015. According to IEA estimates, the global excess supply has already shrunk to
only 0.3 million barrels per day during the second quarter of this year. The signs
indicating that this rebalancing will continue into the future are both convincing and
unsurprising - after all the best remedy for low oil prices is indeed low oil prices.
Low oil prices have clearly stimulated demand, with North American drivers among
those taking advantage (Figure 2). On the supply side, low oil prices have decisively
07 October 2016
For EMEA and Asia distribution only
Inside (click to jump to sections)
Oil price risks shifting to the upside A
major driver of oil prices is the balance
between global demand and supply.
With hindsight, the statistics do tend
to be decent indicators of price
direction
Rebalanced? Oil market rebalancing
has been underway for some time,
since oversupply peaked in Q2 2015.
Many market observers including
Barclays Investment Bank expect
supply and demand shifting to a
draw in the fourth quarter
Can investors benefit? Most investors
can only invest in oil though the
futures market and derived products.
As a result the investor’s return is not
directly linked to the spot oil price
movement but instead the futures
price curve
Upward bound There are various
factors that might limit the upside
potential of oil price in the medium
term
Conclusion Regarding our equity
sector strategy, the improving outlook
on the oil price is one of the
developments that now warrant
adjusting our stances
Market calls – summary
Selected risks to our views
Asset class summary
Latest market data
Key macroeconomic projections
The case for investing
Figure 1: Global oil supply & demand balance and price Figure 2: US vehicle distance traveled
Source: Datastream, Barclays Source: Datastream, Barclays
0
2
-2
1
-1
40
60
80
100
120
140
'13'06 '12'11'10'09 '15'08 '14'07
WTI oil price (lagged, rhs)
Global oil demand
minus supply
Million barrels per day US dollar per barrel
3.0
2.4
2.8
2.6
2005-'09 2010-'141995-'99 2000-'04
US vehicle distance traveled
Rolling 12 month total (trillion miles)

In Focus 07 October 2016 2
hurt major producers, with Venezuela perhaps most visibly affected. Whilst the Ministry of
Energy recently released data showing an oil production recovery in July, the factors that
drive production lower persist, including Venezuela’s rig count being down 30% year-on-
year in July. We assume that if there is any production rebound, it is likely to be transitory.
Regarding wider OPEC oil output, there is now more tangible progress towards putting
the cartel back in business. In November 2014, Saudi Arabia led OPEC to defend market
share, notably against US shale oil producers, at the expense of high oil prices. Nearly two
years later, as the International Monetary Fund estimates that the kingdom will suffer a
fiscal deficit equal to 13.5 percent of gross domestic product this year, the kingdom is
signalling it may be ready for a U-turn. During the informal September meeting in Algeria,
the government in Riyadh offered a deal – including its first output cut in eight years – to
boost prices, according to Algerian Energy Minister Noureddine Boutarfa. OPEC agreed to
cut production to 32.5-33 million barrels per day during discussions in Algiers. While it
seems unlikely that the details of this deal will be finalised before the formal 30 OPEC
meeting in Vienna, this may signal an important change of direction.
Overall, many market observers, including Barclays Investment Bank, expect supply and
demand shifting to a draw in the fourth quarter. With the market balance moving toward
deficit, the risk of price weakness based on oil market fundamentals looks low compared
to the upside.
Can investors benefit?
Does this situation warrant getting invested in oil-related assets? Most investors can only
invest in oil though the futures market and derived products. As a result, the investor’s
return is not directly linked to the spot oil price movement but instead the futures price
curve. At the moment, whilst expectations have normalised a bit since reaching extremes
at the beginning of 2015, markets are still pricing in a significant rebound, as Figure 3
suggests. Oil one-year forward trades at a significant ~$6 premium to the spot price,
while five year forwards suggest a ~$13 premium.
Those (already baked in) expectations of recovering oil prices can have a significantly
detrimental impact on the investor’s prospective returns. The exact impact is hard to
predict and will depend on many factors, including the instrument chosen and the length
of investment. As an example, in Figures 4 and 5 we contrast historical dated Brent crude
oil six month price changes with the corresponding return of the Bloomberg crude oil total
return index. That index might be very close to returns achievable through certain
exchange traded products (ETPs). As Figure 4, containing data from 1988 to 2007 shows,
for many years investing through futures has been quite beneficial for investors: even if oil
spot prices did not change, they earned on average a +5% return. Part of this return of
course reflects the higher interest rates available during that time. This contrasts with the
situation from 2008 onwards that is shown in Figure 5. During this period, spreads in the
Figure 3: Oil future spreads Figure 4: Dated brent oil price vs. crude oil total return (1)
Source: Datastream, Barclays Source: Datastream, Barclays
-40
-30
-20
-10
0
10
20
30
40
Apr-94 Apr-99 Apr-04 Apr-09 Apr-14
Brent crude oil - one year
forward futureBrent crude oil - generic
5 year forward future
Spread vs. Dated
Brent (US Dollar)
y = 0.8784x + 5.2668
R² = 0.7144
-60
-40
-20
0
20
40
60
80
100
120
140
-100 -50 0 50 100 150
Dated brent oil price
6 month change (%)
Bloomberg crude oil 6
month total return (%)
Data from '88 to '07
There is now tangible
progress towards
putting the OPEC cartel
back in business
... the investor’s return is
not directly linked to the
spot oil price movement
but instead the futures
price curve

In Focus 07 October 2016 3
oil futures curve contained large variations reflecting distinct expectations about
expected oil price changes and investors would have lost on average more than 6% in the
case of constant oil prices.
Are energy-related equities a better way to participate in increasing oil prices? Again the
interesting question is how the relationship has been more recently. Figure 6 plots Brent
crude oil changes vs. the return of the MSCI World energy sector. Since 2008, energy
stock returns were only modestly linked to oil price increases – on average a 10% oil price
change only corresponded with a ~5% return of energy stocks. As a consequence, as
Figure 7 shows, the link between the relative performances of energy stocks vs. the
overall market and oil price changes has been a quite weak one (r-squared 26%) in recent
times. The issue is that the overall equity energy sector is comprised of several very
different sub industries. The performance of the largest sub industry – integrated oil & gas
companies – has recently only shown a weak relationship with oil price changes (Figure
8). There are sub industries like oil & gas drilling, for which the relationship is much
stronger (Figure 9), but the weight/market capitalisation of these companies is
comparably small (Figure 10).
What about currencies? Charts like Figure 11 give the impression of a strong link between
the movements of the US dollar and oil prices. The main issue here is the magnitude of
the movements – the change of the oil price in percentage terms dwarfs the currency
change. As oil is usually priced in US dollars, it is not surprising that amongst available
currencies, the inverse relationship between oil and US dollar shows the strongest
relationship. Regarding currencies that profit from higher oil prices, the Russian rouble
Figure 5: Dated brent oil price vs. crude oil total return (2) Figure 6: Dated brent oil price vs. equity energy sector (1)
Source: Datastream, Barclays Source: FactSet, Datastream, Barclays
y = 0.7998x - 6.4479
R² = 0.7563
-80
-60
-40
-20
0
20
40
60
80
-100 -50 0 50 100
Dated brent oil price
6 month change (%)
Bloomberg crude oil 6
month total return (%)
Data from '08 onwards
y = 0.4843x + 0.0164
R² = 0.6805
-50
-40
-30
-20
-10
0
10
20
30
40
50
60
-100 -50 0 50 100
Dated brent oil price
6 month change (%)
MSCI World energy
sector 6 month total
return (USD, %)
Data since 2008
Figure 7: Dated brent oil price vs. equity energy sector (2) Figure 8: Dated brent oil price vs. integrated oil & gas
Source: FactSet, Datastream, Barclays Source: FactSet, Datastream, Barclays
y = 0.1592x - 2.0827
R² = 0.2567-30
-25
-20
-15
-10
-5
0
5
10
15
20
25
-100 -50 0 50 100
Dated brent oil price
6 month change (%)
MSCI World energy
sector 6 month total
return relative to
market (%)
Data since 2008
y = 0.3765x + 0.3946
R² = 0.5733
-40
-30
-20
-10
0
10
20
30
40
50
-100 -50 0 50 100
Dated brent oil price
6 month change (%)
MSCI World IMI integrated
oil & gas subindustry 6
month total return (%)
Data since 2008
The overall equity
energy sector is
comprised of several
very different sub
industries and the
performance of the
largest sub industry has
recently only shown
weak relationship with
oil price changes

In Focus 07 October 2016 4
recently showed the strongest relationship (Figure 12).
Upward bound
In the current environment, where the oil futures curve is already pricing in decent oil
price increases, probably only pronounced moves in the oil price imply sure profits for
investors.
There are however various factors that should limit the upside potential of oil prices in the
medium term. Oil storage capacity has increased decisively over recent years and stocks
are at record levels (Figure 13). Whilst China’s Strategic Petroleum Reserve (SPRI) filling
program is still ongoing, there is a diminishing relationship between SPR storage capacity
plans and the fill rate – so in future, China’s SPR oil demand may be more doubtful.
Regarding OPEC exports, Saudi oil demand growth is slowing because of weak economic
growth, the removal of subsidies and the implementation of energy efficiency measures.
So OPEC production cuts will not filter through in full to the refined product and crude oil
exports from the kingdom.
Conclusion
Whilst in the short term the oil price can be driven by many factors like speculative
positioning (Figure 14), in the medium term it is oil market fundamentals that matter. The
global oil supply-demand realignment process is in progress and is shifting oil price risks
to the upside. Our equity sector strategy now reflects this improving outlook for the oil
Figure 9: Dated brent oil price vs. oil & gas drilling Figure 10: MSCI World IMI energy sector by sub-industry
Source: FactSet, Datastream, Barclays Source: Datastream, Barclays
y = 0.8669x - 3.9206
R² = 0.8099
-80
-60
-40
-20
0
20
40
60
80
-100 -50 0 50 100
Dated brent oil price
6 month change (%)
MSCI World IMI oil & gas
drilling subindustry 6
month total return (%)
Data since 2008
48.1
22.7
10.9
10.4
6.4
Integrated Oil & Gas
Oil & Gas Exploration
& ProductionOil & Gas Equipment
& ServicesOil & Gas Storage &
TransportationOil & Gas Refining &
MarketingOil & Gas Drilling
Coal & Consumable
Fuels
MSCI World IMI energy sector
breakdown by sub-industry
Figure 11: Oil price and US dollar Figure 12: Dated brent oil price vs. Russian rouble
Source: Datastream, Barclays Source: Datastream, Barclays
20
40
60
80
100
120
140
100
120
90
110
2005-'09 2010-'142000-'04
Brent dated crude oil
USD trade weighted (rhs)
Dollar per barrel Trade weighted index
y = 0.2226x - 3.9168
R² = 0.4188
-50
-40
-30
-20
-10
0
10
20
30
-100 -50 0 50 100
Dated brent oil price
6 month change (%)
Russian rouble 6 month
trade weighted FX
change (%)
Data since 2008
In the current
environment, where the
oil futures curve is
already pricing in decent
oil price increases,
probably only
pronounced moves in
the oil price imply sure
profits for investors

In Focus 07 October 2016 5
price with a slight overweight in the Energy sector across all regions, paid for by an
increase of our underweight in Consumer Staples. Valuations of the latter are still
materially elevated according to MSCI data (Figure 15) and equity analysts are now
tending to revise their earnings forecasts for that sector downwards (Figure 16). Since
relative performance of the sector vs. the overall MSCI world index peaked in early July,
the relative performance has trended downwards. As a result the sector now looks
unattractive along all the dimensions of valuation, price momentum and sentiment and
we are comfortable to extend our underweight. A summary of our sector stances can be
found on page 12. More broadly, our tactical overweight positions in UK equities and US
high yield credit should also benefit from a rising oil price, with both areas indexing heavily
in oil related companies.
Christian Theis, CFA
Investment Strategist
William Hobbs
Head of Investment Strategy, UK and Europe
Figure 13: US crude oil & petroleum stocks Figure 14: Speculative oil positioning and oil price
Source: Datastream, Barclays Source: Datastream, Barclays
0
500
1,000
1,500
2,000
Aug-82 Aug-92 Aug-02 Aug-12
Crude oil and petroleum
Crude oil commercial
Crude oil strategic reserve (SPR)
Petroleum
US stocks (million barrels)
100
200
300
50
100
125
75
'13'12'11'10 '16'09 '15'14
Net
Brent crude oil (rhs)
NYMEX managed money futures
positioning in crude
oil futures ('000 lots)
US Dollar / Barrel
Figure 15: Consumer staples forward price/earnings ratio Figure 16: Earnings revisions
Source: FactSet, Barclays Source: Datastream, Barclays
0
2
-2
4
-4
-6
-8
2005-'09 2010-'142000-'04
MSCI World consumer staples
10-year moving average
±one standard deviation
Forward PE relative to market (x)
30
40
50
60
70
IT TCom UtilWorld CDis CSta Heal FinaEner Mats Indu
Current
10-year average
±one standard deviation
Earnings revisions
(up/(up+down),%)
Whilst in the short term
the oil price can be
driven by many factors
like speculative
positioning, in the
medium term it is oil
market fundamentals
that matter
In Focus 07 October 2016 6
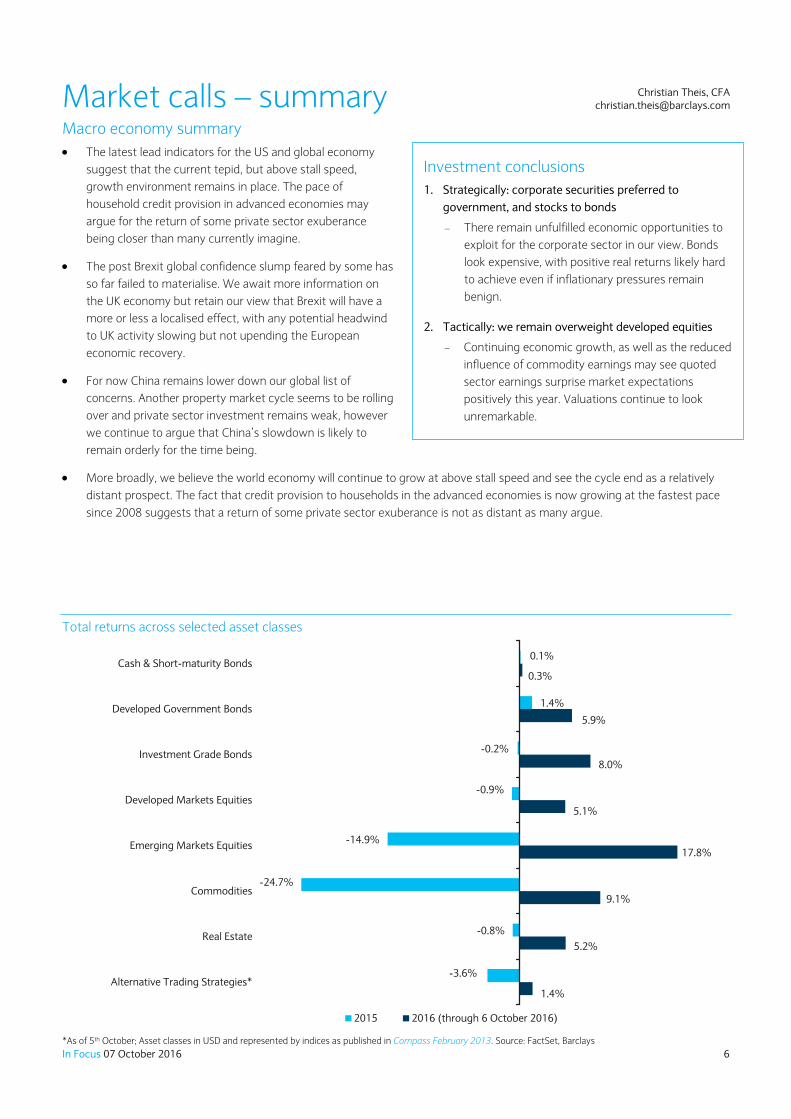
Investment conclusions
1. Strategically: corporate securities preferred to
government, and stocks to bonds
There remain unfulfilled economic opportunities to
exploit for the corporate sector in our view. Bonds
look expensive, with positive real returns likely hard
to achieve even if inflationary pressures remain
benign.
2. Tactically: we remain overweight developed equities
Continuing economic growth, as well as the reduced
influence of commodity earnings may see quoted
sector earnings surprise market expectations
positively this year. Valuations continue to look
unremarkable.
Market calls – summary Macro economy summary
The latest lead indicators for the US and global economy
suggest that the current tepid, but above stall speed,
growth environment remains in place. The pace of
household credit provision in advanced economies may
argue for the return of some private sector exuberance
being closer than many currently imagine.
The post Brexit global confidence slump feared by some has
so far failed to materialise. We await more information on
the UK economy but retain our view that Brexit will have a
more or less a localised effect, with any potential headwind
to UK activity slowing but not upending the European
economic recovery.
For now China remains lower down our global list of
concerns. Another property market cycle seems to be rolling
over and private sector investment remains weak, however
we continue to argue that China’s slowdown is likely to
remain orderly for the time being.
More broadly, we believe the world economy will continue to grow at above stall speed and see the cycle end as a relatively
distant prospect. The fact that credit provision to households in the advanced economies is now growing at the fastest pace
since 2008 suggests that a return of some private sector exuberance is not as distant as many argue.
Total returns across selected asset classes
1.4%
5.2%
9.1%
17.8%
5.1%
8.0%
5.9%
0.3%
-3.6%
-0.8%
-24.7%
-14.9%
-0.9%
-0.2%
1.4%
0.1%
Alternative Trading Strategies*
Real Estate
Commodities
Emerging Markets Equities
Developed Markets Equities
Investment Grade Bonds
Developed Government Bonds
Cash & Short-maturity Bonds
2015 2016 (through 6 October 2016)
*As of 5th October; Asset classes in USD and represented by indices as published in Compass February 2013. Source: FactSet, Barclays
Christian Theis, CFA [email protected]

In Focus 07 October 2016 7
Selected risks to our views
US recession?
A recession in the US poses the greatest risk to our investment outlook.
The current US economic expansion is now in its eighth year, a year longer than the average post-War cycle. This has led many to call, somewhat mechanically, for an imminent recession.
However, such claims are based on misguided notions about the fundamental drivers of the business cycle. Business cycles usually end because of some exogenous shock that causes firms and individuals to alter their planned expenditures and expectations of future incomes. They do not die of old age.
So far, lead indicators for the US economy still indicate modest growth prospects for the US economy. In particular, trend readings in the ISM Manufacturing and Non-manufacturing indices are still hovering close to their expansion thresholds.
Source: Datastream, Barclays
China hard landing?
Fears of a Chinese ‘hard landing’ have been lingering for some time. Since peaking in 2007, Chinese GDP growth has been on a downward trajectory. Manufacturing activity is no longer growing as it once did, while private sector investment growth has been falling. In particular, domestic corporations have started becoming more reluctant to invest, and the monetary transmission mechanism has become weaker over time.
However, as we have repeatedly noted, traditional indicators of growth such as the Li Keqiang index may mean less today in the context of a Chinese economy rebalancing away from heavy industry and towards services and consumption.
Our base case outlook is for the Chinese economy to undergo an orderly deceleration balanced by a lumpy pace of long-term reforms and occasional spurts of short-term stimulus.
Source: Datastream, Barclays
A messy end of the bond bull market?
The multi decade long bond bull market has continued to run on, driven by a cocktail of economic pessimism, falling inflation and central bank easing. However, this poses significant downside risks to global capital markets should this bull market unwind chaotically.
Already, close to half of the world’s government bond market offer investors a negative nominal yield. The return of some inflation could be the spark to end this bond bull market.
For the moment, central bank ownership and historic precedent suggest to us that the bond market will remain more or less orderly, even with the return of more inflation. However, this is certainly a risk worth keeping an eye on.
Source: Datastream, Barclays
0
2
-2
4
-4
6
8
10
12
1960-'79 1980-'99
US real GDP
Year on year (%)
5
10
15
20
25
8
10
12
14
2005-'09 2010-'142000-'04
Keqiang index
Real GDP (rhs)
Index value Year-on-year
growth (%)
2
3
4
5
6
7
8
9
10
11
12
13
14
15
1990-'99 2000-'09
10 year US treasury yield
Nominal yield level 10 years (%)

In Focus 07 October 2016 8
Asset class summary We maintain a Strategic Asset Allocation for five risk profiles, based on our outlook for each
asset class. Our Tactical Allocation Committee (TAC), made up of our senior investment
strategists and portfolio managers, regularly assesses the need for tactical adjustments to
those allocations, based on our shorter-term (three to six month) outlook. Here, we share
our latest thinking on our key tactical tilts.
Developed Markets Equities: Overweight (changed 22 July 2016)
We retain our view that the still under-appreciated prospects for global growth and inflation
will likely be the primary driver of investment returns on a six- to twelve-month view. It is
these prospects that are likely to be most influential with regards to the performance of
capital markets, rather than the ever-murky political backdrop.
On this, we still advise investors not to underestimate the US consumer, particularly with real
disposable income growing at such a robust pace. This positive view on the prospects for the
US economy and its stock market may surprise those again calling for US profit margins to
continue rolling over. However, we see such forecasts as likely understating the negative
effect of energy sector earnings over the last year as well as the headwind to profits from the
previous ascent of the US dollar. Both of these factors should fall out of the data in coming
quarters.
In the wake of the EU referendum, we have moved from a neutral to overweight tactical
position in UK large cap equities within Developed Markets Equities with the move funded by
increasing the underweight in Japanese equities. This move is primarily defensive, with the
UK large cap index a potential net beneficiary from a deterioration in the UK economic
backdrop. We have since added further to our tactical overweight in Continental European
equities, looking to take advantage of excessively pessimistic expectations with regards to
the European banking sector in particular.
Emerging Markets Equities: Neutral
We moved our recommended tactical position in Emerging Markets Equities up to neutral in
January. We are looking for a more visible turn in earnings momentum before adopting a
positive tactical posture. The bounce in China’s property market indicators, which now look
to be in the process of peaking, has helped to stabilise sentiment towards the asset class.
Meanwhile, a perhaps temporary reassessment of the pace of projected US interest rate rises
has also been helpful.
Within Emerging Markets Equities, Asia remains our preferred region, with Korea, Taiwan and
China (offshore) our highest conviction country bets on a strategic basis. The expected pick-
up in global trade is central to this view. We continue to watch US and Chinese imports for
any signs of this.
Cash & Short-Maturity Bonds: Neutral (decreased 22 July 2016)
Given ongoing market volatility, cash continues to play a pivotal portfolio insulation role.
While the fixed income universe remains unattractive at current extreme valuations, cash
offers a source of funds to invest into other asset classes when appropriate opportunities
arise. Evidence of some returning inflation in the US obviously needs to be watched very
carefully.
Our favoured developed
equity regions remain
for the moment the US
and Europe ex-UK

In Focus 07 October 2016 9
Developed Government Bonds: Neutral (decreased 22 July 2016)
With nominal yields offered by large chunks of the government bond universe negative or
close to it, investors will likely have to work hard to make real returns from these levels over
the next several years. Our view remains that such valuations underestimate the underlying
inflationary pressures within the US economy in particular, something that incoming inflation
data pay some testament to. While the level of (returns insensitive) central bank ownership
suggests that the bond market may lag a pick-up in inflation, our continuing small strategic
and tactical allocation to the area suggests that higher real returns lie elsewhere.
Investment Grade Bonds: Underweight
The spread of investment grade credit over government bond yields remains close to its ten-
year average. However, this leaves nominal yields in high quality corporate credit low in
absolute terms and may make the job of those trying to make positive real returns difficult.
High Yield & Emerging Markets Bonds: Overweight (increased 6 July 2016)
Earlier in the summer we moved from a tactical underweight to overweight position in High
Yield and Emerging Markets Bonds by adding to Global High Yield. This was funded by
moving from a tactical overweight to neutral position in Cash & Short-Maturity Bonds. Given
our more sanguine take on the various risks to global growth and inflation, yields on junk
credit look attractive on a risk-reward basis. Emerging Markets Bonds are expensive and
remain vulnerable to a reversal of inflows during the slow process of monetary normalisation.
Commodities: Neutral (Increased 13 May 2016)
We closed our long-held underweight in the commodity complex in May. US monetary
normalisation will likely provide a headwind, but the bounce in China’s property market
indicators looks sufficient to offset this for the moment.
Investors are likely best served by tilting their commodity exposure towards oil and away
from gold where possible, with the latter still particularly vulnerable to further US interest
rate rises. We see oil prices continuing to drift higher over the coming 12 – 18 months as the
market’s worst fears on China fail to materialise and a smaller than suspected surplus is
worked through.
Real Estate: Neutral
Recent volatility has served as a timely reminder of the importance of maintaining a
diversified portfolio with the ability to weather a number of market environments, and we
continue to encourage clients to ensure that they are fully allocated to Real Estate.
Alternative Trading Strategies: Underweight (decreased 13 May)
We shifted our previous tactical underweight in Commodities to Alternative Trading
Strategies (ATS). This is primarily a function of the difference in volatilities for the two asset
classes. There is less risk being underweight the lower volatility ATS in the current market
environment in our opinion. Alongside this, regulation and lower leverage leave this
diversifying asset class without much tactical appeal at the moment.
Some returning inflation
is central to our current
tactical posture

In Focus 07 October 2016 10
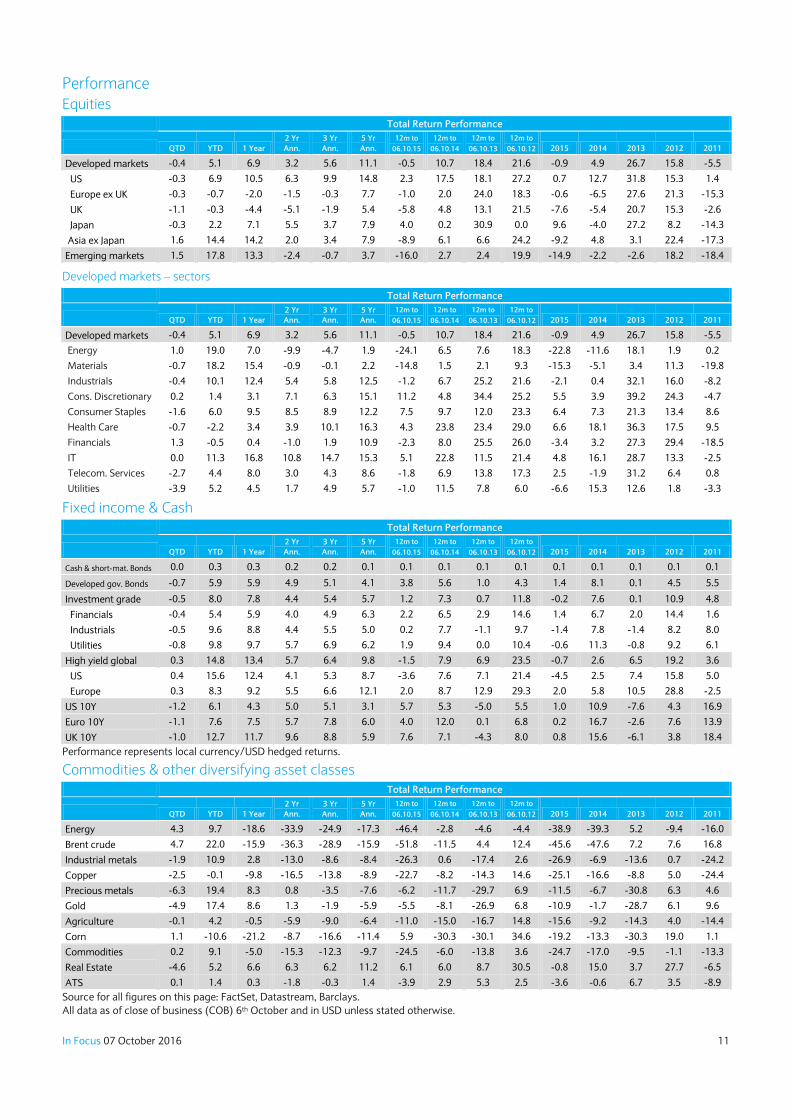
Equities
MSCI indices Yield
Total Return Performance
Global Market
Capitalisation
(%)
EPS growth (%)
P/E ratio (x)
2016 2017 LTM1
10 Year Ave.
LTM1 1 Week YTD 5Yr Ann. 2016 2017
Developed markets 2.6 0.0 5.1 11.1 88.8 0.5 12.9 17.7 15.7 17.8 15.1
US 2.1 0.5 6.9 14.8 52.7 0.8 13.3 19.1 16.8 19.1 15.8
Europe ex UK 3.4 0.0 -0.7 7.7 14.7 -0.3 12.0 15.8 14.1 15.8 13.7
UK 3.9 -1.3 -0.3 5.4 6.1 -5.7 16.8 17.4 14.9 17.2 12.6
Japan 2.3 -1.4 2.2 7.9 7.9 11.9 8.1 14.3 13.2 15.0 n/m
Asia ex Japan 2.5 0.4 14.4 7.9 9.6 1.7 12.1 14.2 12.7 14.4 13.8
Emerging markets 2.6 0.4 17.8 3.7 11.2 7.0 13.2 13.6 12.1 13.9 12.5 1 LTM = Last Twelve Months, i.e. trailing. Source: FactSet, Datastream, Barclays
Developed markets – sectors
MSCI indices Yield
Total Return Performance
Global Market
Capitalisation
(%)
EPS growth (%)
P/E ratio (x)
2016 2017 LTM1
10 Year Ave.
LTM1 1 Week YTD 5Yr Ann. 2016 2017
Developed markets 2.6 0.0 5.1 11.1 88.8 0.5 12.9 17.7 15.7 17.8 15.1
Energy 3.6 1.6 19.0 1.9 6.1 -50.4 147.0 55.5 22.5 53.0 51.2
Materials 2.2 -0.7 18.2 2.2 4.4 -6.8 19.4 19.8 16.6 19.1 17.6
Industrials 2.4 0.0 10.1 12.5 9.8 10.6 9.3 17.5 16.0 17.6 17.1
Cons. Discretionary 2.0 0.6 1.4 15.1 11.2 8.9 11.9 17.1 15.3 17.0 20.8
Consumer Staples 2.6 -1.1 6.0 12.2 9.3 4.1 10.2 22.0 20.0 21.4 18.4
Health Care 2.0 -0.1 -2.2 16.3 11.4 6.8 9.4 17.1 15.6 16.8 19.0
Financials 3.4 1.8 -0.5 10.9 14.5 -5.0 9.9 12.2 11.1 12.1 n/m
IT 1.5 0.5 11.3 15.3 13.3 2.4 12.2 19.1 17.0 18.3 20.2
Telecom. Services 4.1 -3.3 4.4 8.6 3.0 12.6 3.0 14.8 14.4 14.9 15.6
Utilities 3.8 -4.6 5.2 5.7 2.9 -2.9 2.5 16.7 16.3 15.9 16.7 1 LTM = Last Twelve Months, i.e. trailing. Source: FactSet, Datastream, Barclays
Fixed income Total Return Performance
95
100
105
110
115
31-Dec 31-Mar 30-Jun 30-Sep
US 10 Year Government Global IG Global high yield
Key Fixed Income Indices (31-Dec-15=100, USD Hedged)
Index Yield 1 Week YTD 5Yr Ann.
Global inv. Grade 2.3 -0.7 8.0 5.7
Financials 2.2 -0.6 5.4 6.3
Industrials 2.4 -0.8 9.6 5.0
Utilities 2.4 -1.2 9.8 6.2
High yield global 5.8 0.4 14.8 9.8
US 6.1 0.5 15.6 8.7
Europe 4.3 0.1 8.3 12.1
US 10Y 1.7 -1.6 6.1 3.1
Euro 10Y -0.1 -1.0 7.6 6.0
UK 10Y 0.9 -1.4 12.7 5.9
Performance represents local currency/USD hedged returns.
Commodities
Price Level
Total Return Performance
75
100
125
31-Dec 31-Mar 30-Jun 30-Sep
Overall Ener. Ind. met. Prec. met. Agri.
Key Commodity Indices (31-Dec-15=100, USD)
DJ-UBS 1 Week YTD 5Yr Ann.
Energy 4.6 9.7 -17.3
Brent crude 50.13 $/bbl 5.5 22.0 -15.9
Industrial metals -1.1 10.9 -8.4
Copper 4,738 $/tonne -1.6 -0.1 -8.9
Precious metals -6.7 19.4 -7.6
Gold 1251.4 $/oz -5.5 17.4 -5.9
Agriculture 0.4 4.2 -6.4
Corn 3.13 $/bushel 3.4 -10.6 -11.4
Commodities 0.3 9.1 -9.7
Source for all figures on this page: FactSet, Datastream, Barclays.
All data as of close of business (COB) 6th October and in USD unless stated otherwise – see following page for more performance figures.
In Focus 07 October 2016 11
Performance
Equities
Total Return Performance
QTD YTD 1 Year
2 Yr
Ann.
3 Yr
Ann.
5 Yr
Ann.
12m to
06.10.15
12m to
06.10.14
12m to
06.10.13
12m to
06.10.12 2015 2014 2013 2012 2011
Developed markets -0.4 5.1 6.9 3.2 5.6 11.1 -0.5 10.7 18.4 21.6 -0.9 4.9 26.7 15.8 -5.5
US -0.3 6.9 10.5 6.3 9.9 14.8 2.3 17.5 18.1 27.2 0.7 12.7 31.8 15.3 1.4
Europe ex UK -0.3 -0.7 -2.0 -1.5 -0.3 7.7 -1.0 2.0 24.0 18.3 -0.6 -6.5 27.6 21.3 -15.3
UK -1.1 -0.3 -4.4 -5.1 -1.9 5.4 -5.8 4.8 13.1 21.5 -7.6 -5.4 20.7 15.3 -2.6
Japan -0.3 2.2 7.1 5.5 3.7 7.9 4.0 0.2 30.9 0.0 9.6 -4.0 27.2 8.2 -14.3
Asia ex Japan 1.6 14.4 14.2 2.0 3.4 7.9 -8.9 6.1 6.6 24.2 -9.2 4.8 3.1 22.4 -17.3
Emerging markets 1.5 17.8 13.3 -2.4 -0.7 3.7 -16.0 2.7 2.4 19.9 -14.9 -2.2 -2.6 18.2 -18.4
Developed markets – sectors
Total Return Performance
QTD YTD 1 Year
2 Yr
Ann.
3 Yr
Ann.
5 Yr
Ann.
12m to
06.10.15
12m to
06.10.14
12m to
06.10.13
12m to
06.10.12 2015 2014 2013 2012 2011
Developed markets -0.4 5.1 6.9 3.2 5.6 11.1 -0.5 10.7 18.4 21.6 -0.9 4.9 26.7 15.8 -5.5
Energy 1.0 19.0 7.0 -9.9 -4.7 1.9 -24.1 6.5 7.6 18.3 -22.8 -11.6 18.1 1.9 0.2
Materials -0.7 18.2 15.4 -0.9 -0.1 2.2 -14.8 1.5 2.1 9.3 -15.3 -5.1 3.4 11.3 -19.8
Industrials -0.4 10.1 12.4 5.4 5.8 12.5 -1.2 6.7 25.2 21.6 -2.1 0.4 32.1 16.0 -8.2
Cons. Discretionary 0.2 1.4 3.1 7.1 6.3 15.1 11.2 4.8 34.4 25.2 5.5 3.9 39.2 24.3 -4.7
Consumer Staples -1.6 6.0 9.5 8.5 8.9 12.2 7.5 9.7 12.0 23.3 6.4 7.3 21.3 13.4 8.6
Health Care -0.7 -2.2 3.4 3.9 10.1 16.3 4.3 23.8 23.4 29.0 6.6 18.1 36.3 17.5 9.5
Financials 1.3 -0.5 0.4 -1.0 1.9 10.9 -2.3 8.0 25.5 26.0 -3.4 3.2 27.3 29.4 -18.5
IT 0.0 11.3 16.8 10.8 14.7 15.3 5.1 22.8 11.5 21.4 4.8 16.1 28.7 13.3 -2.5
Telecom. Services -2.7 4.4 8.0 3.0 4.3 8.6 -1.8 6.9 13.8 17.3 2.5 -1.9 31.2 6.4 0.8
Utilities -3.9 5.2 4.5 1.7 4.9 5.7 -1.0 11.5 7.8 6.0 -6.6 15.3 12.6 1.8 -3.3
Fixed income & Cash
Total Return Performance
QTD YTD 1 Year
2 Yr
Ann.
3 Yr
Ann.
5 Yr
Ann.
12m to
06.10.15
12m to
06.10.14
12m to
06.10.13
12m to
06.10.12 2015 2014 2013 2012 2011
Cash & short-mat. Bonds 0.0 0.3 0.3 0.2 0.2 0.1 0.1 0.1 0.1 0.1 0.1 0.1 0.1 0.1 0.1
Developed gov. Bonds -0.7 5.9 5.9 4.9 5.1 4.1 3.8 5.6 1.0 4.3 1.4 8.1 0.1 4.5 5.5
Investment grade -0.5 8.0 7.8 4.4 5.4 5.7 1.2 7.3 0.7 11.8 -0.2 7.6 0.1 10.9 4.8
Financials -0.4 5.4 5.9 4.0 4.9 6.3 2.2 6.5 2.9 14.6 1.4 6.7 2.0 14.4 1.6
Industrials -0.5 9.6 8.8 4.4 5.5 5.0 0.2 7.7 -1.1 9.7 -1.4 7.8 -1.4 8.2 8.0
Utilities -0.8 9.8 9.7 5.7 6.9 6.2 1.9 9.4 0.0 10.4 -0.6 11.3 -0.8 9.2 6.1
High yield global 0.3 14.8 13.4 5.7 6.4 9.8 -1.5 7.9 6.9 23.5 -0.7 2.6 6.5 19.2 3.6
US 0.4 15.6 12.4 4.1 5.3 8.7 -3.6 7.6 7.1 21.4 -4.5 2.5 7.4 15.8 5.0
Europe 0.3 8.3 9.2 5.5 6.6 12.1 2.0 8.7 12.9 29.3 2.0 5.8 10.5 28.8 -2.5
US 10Y -1.2 6.1 4.3 5.0 5.1 3.1 5.7 5.3 -5.0 5.5 1.0 10.9 -7.6 4.3 16.9
Euro 10Y -1.1 7.6 7.5 5.7 7.8 6.0 4.0 12.0 0.1 6.8 0.2 16.7 -2.6 7.6 13.9
UK 10Y -1.0 12.7 11.7 9.6 8.8 5.9 7.6 7.1 -4.3 8.0 0.8 15.6 -6.1 3.8 18.4
Performance represents local currency/USD hedged returns.
Commodities & other diversifying asset classes
Total Return Performance
QTD YTD 1 Year
2 Yr
Ann.
3 Yr
Ann.
5 Yr
Ann.
12m to
06.10.15
12m to
06.10.14
12m to
06.10.13
12m to
06.10.12 2015 2014 2013 2012 2011
Energy 4.3 9.7 -18.6 -33.9 -24.9 -17.3 -46.4 -2.8 -4.6 -4.4 -38.9 -39.3 5.2 -9.4 -16.0
Brent crude 4.7 22.0 -15.9 -36.3 -28.9 -15.9 -51.8 -11.5 4.4 12.4 -45.6 -47.6 7.2 7.6 16.8
Industrial metals -1.9 10.9 2.8 -13.0 -8.6 -8.4 -26.3 0.6 -17.4 2.6 -26.9 -6.9 -13.6 0.7 -24.2
Copper -2.5 -0.1 -9.8 -16.5 -13.8 -8.9 -22.7 -8.2 -14.3 14.6 -25.1 -16.6 -8.8 5.0 -24.4
Precious metals -6.3 19.4 8.3 0.8 -3.5 -7.6 -6.2 -11.7 -29.7 6.9 -11.5 -6.7 -30.8 6.3 4.6
Gold -4.9 17.4 8.6 1.3 -1.9 -5.9 -5.5 -8.1 -26.9 6.8 -10.9 -1.7 -28.7 6.1 9.6
Agriculture -0.1 4.2 -0.5 -5.9 -9.0 -6.4 -11.0 -15.0 -16.7 14.8 -15.6 -9.2 -14.3 4.0 -14.4
Corn 1.1 -10.6 -21.2 -8.7 -16.6 -11.4 5.9 -30.3 -30.1 34.6 -19.2 -13.3 -30.3 19.0 1.1
Commodities 0.2 9.1 -5.0 -15.3 -12.3 -9.7 -24.5 -6.0 -13.8 3.6 -24.7 -17.0 -9.5 -1.1 -13.3
Real Estate -4.6 5.2 6.6 6.3 6.2 11.2 6.1 6.0 8.7 30.5 -0.8 15.0 3.7 27.7 -6.5
ATS 0.1 1.4 0.3 -1.8 -0.3 1.4 -3.9 2.9 5.3 2.5 -3.6 -0.6 6.7 3.5 -8.9
Source for all figures on this page: FactSet, Datastream, Barclays.
All data as of close of business (COB) 6th October and in USD unless stated otherwise.

In Focus 07 October 2016 12
Barclays key macroeconomic projections Figure 1: Real GDP and consumer prices (% y-o-y)
Real GDP Consumer prices
2015
2016F
2017F
2015
2016F
2017F
Global 3.3
3.1
3.5
1.5
1.7
2.3
Advanced 2.1
1.5
1.6
0.2
0.7
1.9
Emerging 4.2
4.3
4.9
3.6
3.2
2.9
United States 2.6
1.5
2.3
0.1
1.3
2.6
Euro area 1.9
1.6
1.0
0.0
0.2
1.2
Japan 0.5
0.7
1.2
0.5
-0.3
0.6
United Kingdom 2.2
1.7
0.0
0.0
0.6
1.9
China 6.9
6.6
6.2
1.4
2.0
1.8
Brazil -3.8
-3.3
0.5
9.0
8.9
6.2
India 7.3
7.7
8.0
4.9
5.2
5.1
Russia -3.7
-0.5
1.1
15.5
7.1
4.7
Source: Barclays Research, Global Economics Weekly, 30 September 2016
Note: Arrows appear next to numbers if current forecasts differ from previous week by 0.2pp or more. Weights used for real GDP are based on
IMF PPP-based GDP (5yr centred moving averages). Weights used for consumer prices are based on IMF nominal GDP (5yr centred moving
averages). Aggregates for CPI exclude Argentina and Venezuela. There can be no guarantees that these projections will be achieved.
Wealth and Investment Management equity sector recommendations
Figure 1: Global sector strategy (% relative to GICS) – a zero indicates a neutral or GICS benchmark position
Figure 2: MSCI developed markets – sector forward PE ratios
US Eu x UK UK
Energy 1.5 1.5 1.5
Materials 0 0 0
Industrials 1.5 1.5 1.5
Consumer Discretionary 0 0 0
Consumer Staples -3.0 -3.0 -3.0
Health Care -1.5 1.5 1.5
Financials 1.5 1.5 1.5
Information Technology 1.5 0 0
Real Estate 0 0 0
Telecommunication Services 0 -1.5 -1.5
Utilities -1.5 -1.5 -1.5
Source: Barclays Source: MSCI, FactSet, Barclays; as of end of September
Figure 3: MSCI developed markets - sector return on equity
Figure 4: MSCI developed markets - sector forward eps growth
Source: MSCI, FactSet, Barclays; as of end of September Source: IBES, Datastream, Barclays; as of 29th September
0
5
-5
10
TCom UtilEner CSta Heal Fina ITMats Indu CDis
Current
10-year average
±one standard deviation
Forward PE relative to market (x)
0
2
-2
4
-4
6
-6
8
-8
-10
TCom UtilEner CSta Heal Fina ITMats Indu CDis
Current
10-year average
±one standard deviation
Relative return on equity (%)
05
-5
10
-10
15
-15
20
-20
2530
40
50
60
35
45
55
TCom UtilEner CSta Heal Fina ITMats Indu CDis
Current
10-year average
±one standard deviation
Forward eps growth relative to market (%)
In Focus 07 October 2016 13
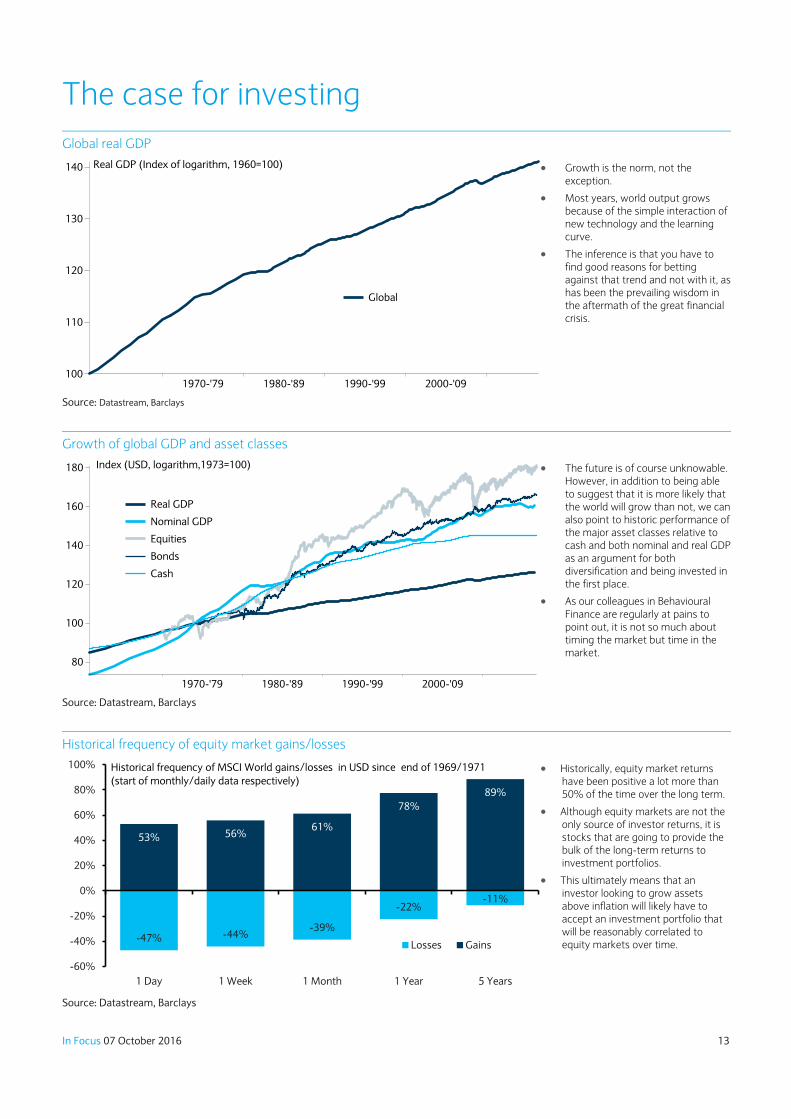
The case for investing
Global real GDP
Growth is the norm, not the exception.
Most years, world output grows because of the simple interaction of new technology and the learning curve.
The inference is that you have to find good reasons for betting against that trend and not with it, as has been the prevailing wisdom in the aftermath of the great financial crisis.
Source: Datastream, Barclays
Growth of global GDP and asset classes
The future is of course unknowable. However, in addition to being able to suggest that it is more likely that the world will grow than not, we can also point to historic performance of the major asset classes relative to cash and both nominal and real GDP as an argument for both diversification and being invested in the first place.
As our colleagues in Behavioural Finance are regularly at pains to point out, it is not so much about timing the market but time in the market.
Source: Datastream, Barclays
Historical frequency of equity market gains/losses
Historically, equity market returns have been positive a lot more than 50% of the time over the long term.
Although equity markets are not the only source of investor returns, it is stocks that are going to provide the bulk of the long-term returns to investment portfolios.
This ultimately means that an investor looking to grow assets above inflation will likely have to accept an investment portfolio that will be reasonably correlated to equity markets over time.
Source: Datastream, Barclays
100
120
130
110
140
1970-'79 1990-'991980-'89 2000-'09
Global
Real GDP (Index of logarithm, 1960=100)
80
100
120
160
140
180
1970-'79 1990-'991980-'89 2000-'09
Real GDP
Nominal GDP
Equities
Bonds
Cash
Index (USD, logarithm,1973=100)
53% 56%61%
78%
89%
-47% -44%-39%
-22%-11%
-60%
-40%
-20%
0%
20%
40%
60%
80%
100%
1 Day 1 Week 1 Month 1 Year 5 Years
Losses Gains
Historical frequency of MSCI World gains/losses in USD since end of 1969/1971
(start of monthly/daily data respectively)

In Focus 07 October 2016 14
This document has been prepared by the wealth and investment management division of Barclays Bank plc (“Barclays”), for information
purposes only. Barclays does not guarantee the accuracy or completeness of information which is contained in this document and which is stated
to have been obtained from or is based upon trade and statistical services or other third party sources. Any data on past performance, modelling
or back-testing contained herein is no indication as to future performance. No representation is made as to the reasonableness of the
assumptions made within or the accuracy or completeness of any modelling or back-testing. All opinions and estimates are given as of the date
hereof and are subject to change. The value of any investment may fluctuate as a result of market changes. The information in this document is
not intended to predict actual results and no assurances are given with respect thereto.
The information contained herein is intended for general circulation. It does not take into account the specific investment objectives, financial
situation or particular needs of any particular person. The investments discussed in this publication may not be suitable for all investors. Advice
should be sought from a financial adviser regarding the suitability of the investment products mentioned herein, taking into account your specific
objectives, financial situation and particular needs before you make any commitment to purchase any such investment products. Barclays and its
affiliates do not provide tax advice and nothing herein should be construed as such. Accordingly, you should seek advice based on your particular
circumstances from an independent tax advisor. Neither Barclays, nor any affiliate, nor any of their respective officers, directors, partners, or
employees accepts any liability whatsoever for any direct or consequential loss arising from any use of or reliance upon this publication or its
contents, or for any omission. Past performance does not guarantee or predict future performance. The information herein is not intended to
predict actual results, which may differ substantially from those reflected.
The products mentioned in this document may not be eligible for sale in some states or countries, nor suitable for all types of investors. This
document shall not constitute an underwriting commitment, an offer of financing, an offer to sell, or the solicitation of an offer to buy any
securities described herein, which shall be subject to Barclays’ internal approvals. No transaction or services related thereto is contemplated
without Barclays’ subsequent formal agreement. Unless expressly stated, products mentioned herein are not guaranteed by Barclays Bank plc or
its affiliates or any government entity.
This document is not directed to, nor intended for distribution or use by, any person or entity in any jurisdiction or country where the publication
or availability of this document or such distribution or use would be contrary to local law or regulation, including, for the avoidance of doubt, the
United States of America. It may not be reproduced or disclosed (in whole or in part) to any other person without prior written permission. You
should not take notice of this document if you know that your access would contravene applicable local, national or international laws. The
contents of this publication have not been reviewed or approved by any regulatory authority.
Barclays Capital Inc., Member SIPC, Barclays Bank plc and / or their affiliated companies and/or the individuals associated therewith (in various
capacities) may already have or intend to: (i) seek investment banking or other business relationships for which they already receive or will
receive compensation from the companies that are the subject of this publication (“Researched Companies”), such as underwriting, advising, and
lending – as such, it is possible that Barclays Capital Inc., Barclays Bank plc or their affiliated companies may have managed or co-managed a
public offering of securities for any issuer mentioned in this document within the last three years.; (ii) have an interest in the Researched
Companies by acting making a market or dealing as principal in securities issued by Researched Companies or in options or other derivatives
based thereon, or otherwise hold personal interests in the Research Companies; (iii) appoint employees or associates as directors or officers of
the Researched Companies; (iv) act upon the contents of this publication prior to your having received it; (v) effect transactions which are not
consistent with the recommendations given herein.
Barclays offers wealth and investment management products and services to its clients through Barclays Bank PLC and its subsidiary
companies. Barclays Bank PLC is registered in England and authorised by the Prudential Regulation Authority and regulated by the Financial
Conduct Authority and the Prudential Regulation Authority. Registered No. 1026167. Registered Office: 1 Churchill Place, London E14 5HP.
Cyprus – Barclays offers banking, wealth and investment management products and services to its clients through Barclays Bank PLC and its
subsidiaries. Barclays Bank PLC is registered in England and authorised by the Prudential Regulation Authority and regulated by the Financial Conduct
Authority and the Prudential Regulation Authority. Registered No. 1026167. Registered Office: 1 Churchill Place, London E14 5HP. Barclays Bank PLC is
regulated by the Central Bank of Cyprus in the conduct of its banking and investment business in Cyprus. France – Barclays Bank PLC, Succursale en
France - Principal établissement : 32 avenue George V - 75008 Paris - RCS Paris B 381 066 281 - C.C.P. 62-07 Paris - Siège social à Londres E14
5HP, Angleterre, 1, Churchill Place - Reg N° 1026167 - Capital autorisé 3 040 001 000 de Livres Sterling. BARCLAYS BANK PLC est un
établissement de crédit, intermédiaire en assurance (l'immatriculation auprès du FCA peut être contrôlée sur le site internet www.orias.fr ),
prestataire de service d’investissement de droit anglais agréé par the Financial Conduct Authority (FCA), autorité de tutelle britannique qui a son
siège social 25 The North Colonnade, Canary Wharf, Londres E14 5HS. (www.fca.org.uk), FCA register n° 122702 La Succursale française de
Barclays Bank PLC, est autorisée par le FCA à recourir à un Agent lié, Barclays Patrimoine SCS. Gibraltar – Barclays offers banking, wealth and
investment management products and services to its clients through Barclays Bank PLC and its subsidiaries. Barclays Bank PLC is registered in
England and authorised by the Prudential Regulation Authority and regulated by the Financial Conduct Authority and the Prudential Regulation Authority.
Registered No. 1026167. Registered Office: 1 Churchill Place, London E14 5HP. Barclays Bank PLC is authorised by the Gibraltar Financial Services
Commission to conduct banking and investment business in Gibraltar. Guernsey – Barclays offers wealth and investment products and services to its
clients through Barclays Bank PLC and its subsidiary companies. Barclays Bank PLC is registered in England and authorised by the Prudential
Regulation Authority and regulated by the Financial Conduct Authority and the Prudential Regulation Authority. Registered Number: 1026167.
Registered Office: 1 Churchill Place, London E14 5HP. Barclays Bank PLC, Guernsey Branch is licensed by the Guernsey Financial Services Commission
under the Banking Supervision (Bailiwick of Guernsey) Law 1994, as amended, and the Protection of Investors (Bailiwick of Guernsey) Law 1987, as
amended. Barclays Bank PLC, Guernsey Branch has its principal place of business at Le Marchant House, St Peter Port, Guernsey, GY1 3BE. Ireland –
Barclays Bank Ireland PLC is regulated by the Central Bank of Ireland. Registered in Ireland. Registered Number: 396330. Registered Office: Two
Park Place, Hatch Street, Dublin 2. Calls may be recorded for security and other purposes.Barclays Bank PLC is registered in England and
authorised by the Prudential Regulation Authority and regulated by the Financial Conduct Authority and the Prudential Regulation Authority. Registered
No. 1026167. Registered Office: 1 Churchill Place, London E14 5HP. Isle of Man – Barclays offers wealth and investment products and services to
its clients through Barclays Bank PLC and its subsidiary companies. Barclays Bank PLC is registered in England and authorised by the Prudential
Regulation Authority and regulated by the Financial Conduct Authority and the Prudential Regulation Authority. Registered Number: 1026167.
Registered Office: 1 Churchill Place, London E14 5HP. Barclays Bank PLC, Isle of Man Branch is licensed by the Isle of Man Financial Services
Authority. Barclays Bank PLC, Isle of Man Branch has its principal business address in the Isle of Man at Barclays House, Victoria Street, Douglas, Isle of
Man, IM99 1AJ. Italy – Barclays offers wealth and investment management products and services to its clients through Barclays Bank PLC and its
subsidiary companies. Barclays Bank PLC is registered in England and authorised by the Prudential Regulation Authority and regulated by the
Financial Conduct Authority and the Prudential Regulation Authority. Registered No. 1026167. Registered Office: 1 Churchill Place, London E14
5HP. Barclays Bank PLC – Via della Moscova. 18 – 20121 Milan – Italy, is a branch of Barclays Bank PLC and is registered with the Register of Banks

In Focus 07 October 2016 15
Milan n° 4862. Company Register Milan n° 80123490155 – R.E.A. Milan 1040254 – Fiscal Code n° 80123490155 – Registered VAT n° 04826660153.
Jersey – Barclays offers wealth and investment products and services to its clients through Barclays Bank PLC and its subsidiary
companies. Barclays Bank PLC is registered in England and authorised by the Prudential Regulation Authority and regulated by the Financial
Conduct Authority and the Prudential Regulation Authority. Registered Number: 1026167. Registered Office: 1 Churchill Place, London E14
5HP. Barclays Bank PLC, Jersey Branch is regulated by the Jersey Financial Services Commission. Barclays Bank PLC, Jersey Branch has its principal
business address in Jersey at 13 Library Place, St Helier, Jersey JE4 8NE, Channel Islands. Barclays Bank PLC, Jersey Branch is regulated by the Guernsey
Financial Services Commission under the Protection of Investors (Bailiwick of Guernsey) Law 1987 as amended. Monaco – Barclays Bank PLC – Monaco
is a branch of Barclays Bank PLC with its offices in the Principality of Monaco at 31 Avenue de la Costa, MC 98000 Monaco – Tel. +377 93 15 35
35. Registered with the Monaco Chamber of Commerce and Industry under No° 68 S 01191. Registered VAT No° FR 40 00002674 9. Nigeria –
Barclays offers wealth and investment management products and services to its clients through Barclays Bank PLC and its subsidiaries. Barclays
Bank PLC is registered in England and authorised by the Prudential Regulation Authority and regulated by the Financial Conduct Authority and the
Prudential Regulation Authority. Registered No.1026167. Registered Office: 1 Churchill Place, London E14 5HP. Barclays Group Representative Office (NIG)
Ltd. Registered Company No: RC41757 and its mailing address is Barclays Group Representative Office (NIG) Ltd, Courier Department, 3rd Floor, 1
Churchill Place, London, E14 5HP Portugal – Barclays offers wealth and investment management products and services to its clients through
Barclays Bank PLC and its subsidiary companies. Barclays Bank PLC is registered in England and authorised by the Prudential Regulation Authority and
regulated by the Financial Conduct Authority and the Prudential Regulation Authority. Registered No. 1026167. Registered Office: 1 Churchill Place,
London E14 5HP. Barclays Bank PLC activity in Portugal is supervised by Banco de Portugal (BoP) and Comissão de Mercado de Valores Mobiliários
(CMVM). Qatar – Barclays offers wealth and investment management products and services to its clients through Barclays Bank PLC and its
subsidiary companies. Barclays Bank PLC is registered in England and is authorised by the Prudential Regulation Authority and regulated by the
Financial Conduct Authority and the Prudential Regulation Authority. Registered No. 1026167. Registered Office: 1 Churchill Place, London E14
5HP. Barclays Bank PLC in the Qatar Financial Centre (Registered No. 00018) is authorised by the Qatar Financial Centre Regulatory Authority.
Barclays Bank PLC QFC Branch may only undertake the regulated activities that fall within the scope of its existing QFCRA authorisation. Principal
place of business in Qatar: Qatar Financial Centre, Office 1002, 10th Floor, QFC Tower, Diplomatic Area, West Bay, PO Box 15891, Doha, Qatar. This
information has been distributed by Barclays Bank PLC. Related financial products or services are only available to Business Customers as defined by the
QFCRA. Singapore and Hong Kong – Barclays offers wealth and investment management products and services to its clients through Barclays
Bank PLC and its subsidiaries. Barclays Bank PLC is registered and incorporated in England and authorised by the Prudential Regulation Authority
and regulated by the Financial Conduct Authority and the Prudential Regulation Authority. Its members have limited liability. Registered No.
1026167. Registered Office: 1 Churchill Place, London E14 5HP. Barclays Bank PLC Singapore Branch is a licensed bank in Singapore and is
regulated by the Monetary Authority of Singapore. Registered Address:10 Marina Boulevard, #24-01 Marina Bay Financial Centre Tower 2,
Singapore 018983. Barclays Bank PLC Hong Kong Branch is registered with the Hong Kong Securities and Futures Commission (CE No. AAJ160)
and is authorised and regulated by the Hong Kong Monetary Authority. Main business address in Hong Kong: 41/F Cheung Kong Center, 2
Queen’s Road Central, Hong Kong. Switzerland – Barclays Bank (Suisse) SA is a Bank registered in Switzerland and regulated and supervised by
FINMA. Registered No. CH-660.0.118.986-6. Registered Office: Chemin de Grange-Canal 18-20, P.O. Box 3941, 1211 Geneva 3, Switzerland.
Registered branch: Beethovenstrasse 19, P.O. Box, 8027 Zurich. Registered VAT No. CHE-106.002.386. Barclays Bank (Suisse) SA is a subsidiary of
Barclays Bank PLC registered in England, authorised by the Prudential Regulation Authority and regulated by the Financial Conduct Authority and the
Prudential Regulation Authority. It is registered under No. 1026167 and its registered office is 1 Churchill Place, London E14 5HP. United Arab Emirates
(Dubai) – Barclays offers wealth and investment management products and services to its clients through Barclays Bank PLC and its subsidiary
companies. Barclays Bank PLC is registered in England and authorised by the Prudential Regulation Authority and regulated by the Financial
Conduct Authority and the Prudential Regulation Authority. Registered No. 1026167. Registered Office: 1 Churchill Place, London E14
5HP. Barclays Bank PLC in the Dubai International Financial Centre (Registered No. 0060) is regulated by the Dubai Financial Services Authority.
Barclays Bank PLC DIFC Branch may only undertake the financial services activities that fall within the scope of its existing DFSA licence. Principal
place of business: Wealth and investment management, Dubai International Financial Centre, The Gate Village Building No. 10, Level 6, PO Box 506674,
Dubai, UAE. This information has been distributed by Barclays Bank PLC DIFC Branch. Related financial products or services are only available to
Professional Clients as defined by the DFSA.
Related Documents