2013 ASABE Annual International Meeting Paper Page 1 of 15 An ASABE Meeting Presentation Paper Number: 131538975 In-Field Performance of Hay Balers Using DGPS R. D. Grisso 1 , G. Moxley 1 , E. G. Webb 2 , J. S. Cundiff 1 , and S. Sokhansanj 2 1 Biological Systems Engineering Department, 200 Seitz Hall, Virginia Tech, Blacksburg, VA USA 2 Environmental Sciences Division, Oak Ridge National Laboratory, P.O. Box 2008, Oak Ridge, TN, USA 37831 USA Written for presentation at the 2013 ASABE Annual International Meeting Sponsored by ASABE Kansas City, Missouri July 21 – 24, 2013 Abstract. Herbaceous biomass in the southeast will contribute significantly to meeting U.S. renewable energy goals. Harvesting equipment for hay is generally suitable for mowing, raking, and baling grasses for bioenergy, such as switchgrass; however, there is a need for field data to better understand machine performance in energy crops. The purpose of this study was to collect field data to estimate baler throughput and speed. Data gathered with a DGPS unit during baling provided time-motion studies of baler productivity. Five fields were used to compare field capacity, speed, and throughput results from four round balers. The results showed that projected baler performance (from ASABE Standard estimates) was overestimated when the yield, maximum throughput, and wrap- eject time were not correctly accounted for. In the densest windrows, a baler encountered a maximum throughput beyond which increases in yield did not provide increases in baler productivity (t h -1 ). Assuming that baler productivity increases linearly with increasing yield, an assumption of many models, is only valid at yields below this maximum throughput. At high yields, the measured values of throughput were up to 50% lower than the calculated throughput. Keywords. Balers, energy crop, geo-referenced data, harvest, herbaceous biomass, machinery management The authors are solely responsible for the content of this meeting presentation. The presentation does not necessarily reflect the official position of the American Society of Agricultural and Biological Engineers (ASABE), and its printing and distribution does not constitute an endorsement of views which may be expressed. Meeting presentations are not subject to the formal peer review process by ASABE editorial committees; therefore, they are not to be presented as refereed publications. Citation of this work should state that it is from an ASABE meeting paper. EXAMPLE: Grisso, R., G. Moxley, E.G. Webb, J.S. Cundiff, and S. Sokhansanj. 2013. In-Field Performance of Hay Balers Using DGPS. ASABE Paper No. 131538975. St. Joseph, Mich.: ASABE. For information about securing permission to reprint or reproduce a meeting presentation, please contact ASABE at [email protected] or 269-932-7004 (2950 Niles Road, St. Joseph, MI 49085-9659 USA).

Welcome message from author
This document is posted to help you gain knowledge. Please leave a comment to let me know what you think about it! Share it to your friends and learn new things together.
Transcript

2013 ASABE Annual International Meeting Paper Page 1 of 15
An ASABE Meeting Presentation Paper Number: 131538975
In-Field Performance of Hay Balers Using DGPS
R. D. Grisso1, G. Moxley1, E. G. Webb2, J. S. Cundiff1, and S. Sokhansanj2 1Biological Systems Engineering Department, 200 Seitz Hall, Virginia Tech, Blacksburg, VA USA
2Environmental Sciences Division, Oak Ridge National Laboratory, P.O. Box 2008, Oak Ridge, TN, USA 37831 USA
Written for presentation at the
2013 ASABE Annual International Meeting Sponsored by ASABE Kansas City, Missouri
July 21 – 24, 2013
Abstract. Herbaceous biomass in the southeast will contribute significantly to meeting U.S.
renewable energy goals. Harvesting equipment for hay is generally suitable for mowing, raking, and
baling grasses for bioenergy, such as switchgrass; however, there is a need for field data to better
understand machine performance in energy crops. The purpose of this study was to collect field data
to estimate baler throughput and speed. Data gathered with a DGPS unit during baling provided
time-motion studies of baler productivity. Five fields were used to compare field capacity, speed, and
throughput results from four round balers. The results showed that projected baler performance (from
ASABE Standard estimates) was overestimated when the yield, maximum throughput, and wrap-
eject time were not correctly accounted for. In the densest windrows, a baler encountered a
maximum throughput beyond which increases in yield did not provide increases in baler productivity
(t h-1). Assuming that baler productivity increases linearly with increasing yield, an assumption of
many models, is only valid at yields below this maximum throughput. At high yields, the measured
values of throughput were up to 50% lower than the calculated throughput.
Keywords. Balers, energy crop, geo-referenced data, harvest, herbaceous biomass, machinery management
The authors are solely responsible for the content of this meeting presentation. The presentation does not necessarily reflect the official position of the American Society of Agricultural and Biological Engineers (ASABE), and its printing and distribution does not constitute an endorsement of views which may be expressed. Meeting presentations are not subject to the formal peer review process by ASABE editorial committees; therefore, they are not to be presented as refereed publications. Citation of this work should state that it is from an ASABE meeting paper. EXAMPLE: Grisso, R., G. Moxley, E.G. Webb, J.S. Cundiff, and S. Sokhansanj. 2013. In-Field Performance of Hay Balers Using DGPS. ASABE Paper No. 131538975. St. Joseph, Mich.: ASABE. For information about securing permission to reprint or reproduce a meeting presentation, please contact ASABE at [email protected] or 269-932-7004 (2950 Niles Road, St. Joseph, MI 49085-9659 USA).
2013 ASABE Annual International Meeting Paper Page 2 of 15
INTRODUCTION
Herbaceous biomass can contribute to the renewable energy supply for electricity, process steam, liquid fuel, and commodity chemicals. The Southeast U.S. (SE) has unique biomass potential (U.S. Department of Energy, 2011) because of: high annual rainfall, considerable land that can be diverted to biomass production without significant competition with food and feed production, and an established woody biomass industry. Native warm-season grasses, such as switchgrass, can be one of the most significant potential sources of biomass in the Southeast. An advantage of these grasses is that they can be harvested with commercial hay equipment used by farmers in the region for their livestock enterprises.
The two most commonly employed methods of hay harvesting are round and large-rectangular baling. Although large-rectangular balers can achieve a higher throughput (t/h), round bales offer several attractive features for the SE. Even in the humid SE, they can typically be stored under ambient conditions in the field, whereas large rectangular bales require covered storage. An additional advantage of round balers is that they are less expensive to purchase and operate. Also, they require a smaller tractor than large-rectangular balers, an advantage for the smaller farms of the SE.
As articulated by Womac et al., (2012), biomass harvest emerged with limited knowledge, practice, and data applicable to modern harvest equipment operating in high-yielding biomass crops. A wide range of potential biomass crops with unique harvest issues resulted in limited performance data published for commercially-available equipment. Throughput capacity of new harvest equipment was not reflected in previous data sets. Well established data sets, such as Agricultural Machinery Management Data (ASABE Standards, 2005) provided typical field efficiency, speed of operation, and power requirement parameters for machines operating in established commodity crops, but not necessarily biomass crops.
Womac et al., (2012) reported that commercial hay and forage harvest equipment operating in 3-m tall switchgrass produced in the southeast U.S. has potential as long as equipment selection avoids issues with crop flow through the machine. Disc mower curtain support design needs attention. Mower-conditioners have potential for high throughput rates in straight standing switchgrass, but design improvements are needed to accommodate lodged switchgrass. A pto-driven rotary rake works well with switchgrass stems up to 3-m long. A baler with new pickup design used in their study improved throughput rates and addressed previous baler pickup issues. Baler operation in friable switchgrass conditions need reduced collection points on the machine for loose material build up. Harvest time affects bale density and forage particle size due to switchgrass conditions. Womac et al., (2012) found that mean throughput rate for the round baler increased with increased speed and had a maximum throughput of 48.3 Mg DM h-1 if no losses were accounted for. All rates were significantly (p≤0.05) different as speed increased. Inclusion of all productivity losses, which would be most indicative of a typical rate for daily operation, resulted in maximum mean round baler throughput rates of 22.3 and 16.3 Mg DM h-1 for net wrap and twine application, respectively.
Due to high variability of machine capacity (throughput) within a field, a consistent relationship has not yet been developed for measuring in-field performance of round balers. Such data are needed to define and simulate harvest of biomass. Typically, two major issues are poorly represented in these models: available working time during the harvest window in which the operation is required to be completed (often called probability of workdays, pwd), and the impact of yield changes on the capacity of the equipment. Machinery performance assumptions have a direct bearing on estimates of the number of pieces of equipment needed to fill a year-round biorefinery demand given a restricted
2013 ASABE Annual International Meeting Paper Page 3 of 15
harvest window. For example, there have been only a few published reports documenting field studies of switchgrass harvest experiments (e.g., Bransby et al., 1996; Shinners et al., 2010; Womac et al., 2012).
Grisso et al., (2002) used geo-referenced data (from a DGPS unit) gathered during field operations (planting and harvesting) to determine productivity factors such as field efficiency. They demonstrated a strategy that compared field efficiency for machinery operations between flat, straight rows and contoured traffic patterns. The methodology described by Grisso et al., (2002) has several potential applications. First, the ASABE Standards (2005a&b) could be updated to provide additional information about selecting values for specific field operating conditions. Results of the analysis are similar to other time-motion studies used in industrial applications, where the inefficiencies of a given process can be identified and quantified, and economic impacts can be assessed. Management strategies can be implemented to minimize inefficiencies and solutions verified. The analysis could be used to compare various machinery operation techniques and practices. Assessment of machinery and operator costs could be estimated for each field or subsection instead of using whole farm enterprise averages. Applying conventional machinery management models with DGPS data for round baling operations would provide the basis for analysis and simulation of high-yielding bioenergy crops.
Throughput for agricultural machinery is expressed as:
K
EYWsC f
m (1)
where: Cm = throughput, t/h; s = field speed, km/h; W = implement working width, m; Ef = field efficiency, decimal; Y = unit yield of the field, t/ha; and K = constant for unit consistency.
The travel speed of balers, forage choppers, and other machines that process a product is limited by the theoretical throughput of the machine (Cm). Srivastava et al. (2006) stated that capacity measurements can be on the basis of area covered per unit time (ha/h) or of material processed per unit time (t/h), but they are related because the equipment cannot exceed their design throughput. The area that can be covered in unit time is called field capacity (Ca, ha/h), and is a product of the processing width and speed of the machine, two variables that are easy to measure. For machines such as mowers, rakes, mower-conditioners, or windrowers, where the forage receives a minimum amount of processing, the material handling capacity is not much of an issue for the typical yields found in hay fields in the SE.
Theoretical throughput is of increasing importance for forage harvesters and balers as yield increases. Theoretical throughput is the maximum feed rate (maximum throughput, Cmx) that can be accommodated on a sustained basis. Exceeding this design limitation will clog the machine.
Throughput is the product of mass processed per unit travel distance (for example, kg/m) times the forward speed of the harvester. The mass per unit distance can be measured before the material enters the machine or as it leaves. In this study of the round baler, feed rate was determined by measuring the average time required to produce a bale and weighing to determine the mass of that bale. This is not a continuous measurement of
2013 ASABE Annual International Meeting Paper Page 4 of 15
throughput (t/h), but it does give an average throughput experienced by the baler for the production of that specific bale.
Field capacity and “achieved” throughput for a machine are related:
YCC am (2)
Where: Y = yield, t/ha.
When a round baler is operated in a field with higher yield, the field capacity declines because of two issues: (1) a reduction in field efficiency (more bales per ha thus more wrap-eject time per ha), and (2) the operator is reducing the forward speed along the windrow to limit the amount of material flowing into the machine and thus staying below the design maximum throughput.
The objective of this paper is to measure field performance of balers in harvesting fields with a range of yields and comparing these observations with agricultural machinery management models. DGPS collected data were used to better understand the effect of yield variability on round baler performance, and to derive relationships that can be used in modeling harvest performance.
Methods
A handheld global positioning system (DGPS) receiver (Garmin eTrex Legend) was used to monitor the traffic patterns of balers in the field. Each DGPS entry provided latitude, longitude, elevation, instantaneous speed, distance traveled, time, and directional heading data. The DGPS units were placed in the tractor cab. In two fields, an external DGPS signal antenna/radiator (Holux AR-10) was used for improved signal reception.
A stopwatch was used to record the time the baler started a bale, the time to form the bale, and the time the baler stopped to wrap and eject the bale. Then a handheld DGPS unit was used to manually record latitude and longitude data at the location where the bale rested on the ground.
The generated log from the DGPS units was downloaded and tabulated in Microsoft Excel. The coordinate locations for the starting and ending position for each bale were overlaid with the positional track of the baler. The timestamp generated by the GPS was checked against the time recorded by the stopwatch. Additionally, the manual record of bale and eject times provided a backup of the time differences in case satellite reception was lost. From the spatial data, the distance traveled along a windrow was calculated to determine total length of windrow for a particular bale.
Each bale was weighed by lifting it with a sling connected to a crane scale (Cardinal CA 5000). Samples of grass were randomly collected and moisture content was determined following a standard oven-based drying procedure (ASABE, 2012).
Baler throughput was calculated using the time to roll a bale, tr. (tr does not include the wrap and eject time.)
r
bB t
MC (3)
where:
BC = baler capacity, t/h,
bM = mass of bale, t, and
rt = time to roll bale, h.
2013 ASABE Annual International Meeting Paper Page 5 of 15
Yield is variable across every field. Particularly in the Piedmont of the SE, yield can be quite variable because of significant differences in soil conditions within an individual field. A reasonable estimate of yield variability can be calculated from the DGPS data and bale weights.
sb
b
WL
M10,000Y (4)
where: Lb = length of windrow traveled to create bale, m, and Ws = width of swath to form windrow, m.
Windrow density (kg/m) is the bale mass (t) divided by the distance traveled along a windrow to form the bale (m).
b
bw L
MD (5)
where: Dw = windrow density, kg/m
Five different fields (Table 1) of varying size, shape, and contour were baled with 4 balers (Table 2) to examine the field performance. The field shape, traffic patterns and final bale location is shown in Figure 1. Field 1 was a moderately rolling field baled with Baler C. The field was a mix of cool season grasses, and was raked into windrows from swaths averaging 6.6 m wide. Field 2 was composed of two adjacent fields totaling 4.5 ha and was baled with Baler D. A small portion of one field had a steep slope, with the rest of the area being relatively flat. The field was a mix of alfalfa and cool season grasses, and it was raked into windrows with an average swath of 6.7 m. However, several areas of the field had denser windrows (it is believed that the rake operator combined multiple windrows). For the baling operation, this section represents an area with higher “yield”. Field 3 was a moderately rolling field of 6.8 ha and was baled with Baler A. The field was a mix of cool season grasses, and was raked into windrows from swaths averaging 5.8 m wide. Field 4 (3.6 ha) as a heavily rolling field of cool season grasses and was baled with Baler A. The average width of the swath for each windrow was 6.6 m, but during the first pass around the field the rake formed heavier windrows from swaths with an average width of 11.6 m. Field 5, a gently rolling field of 1.7 ha, was baled with Baler B. Switchgrass was the primary species in the field and had the highest yield observed. It was raked into windrows from swaths averaging 4.6 m.
Results and Discussion
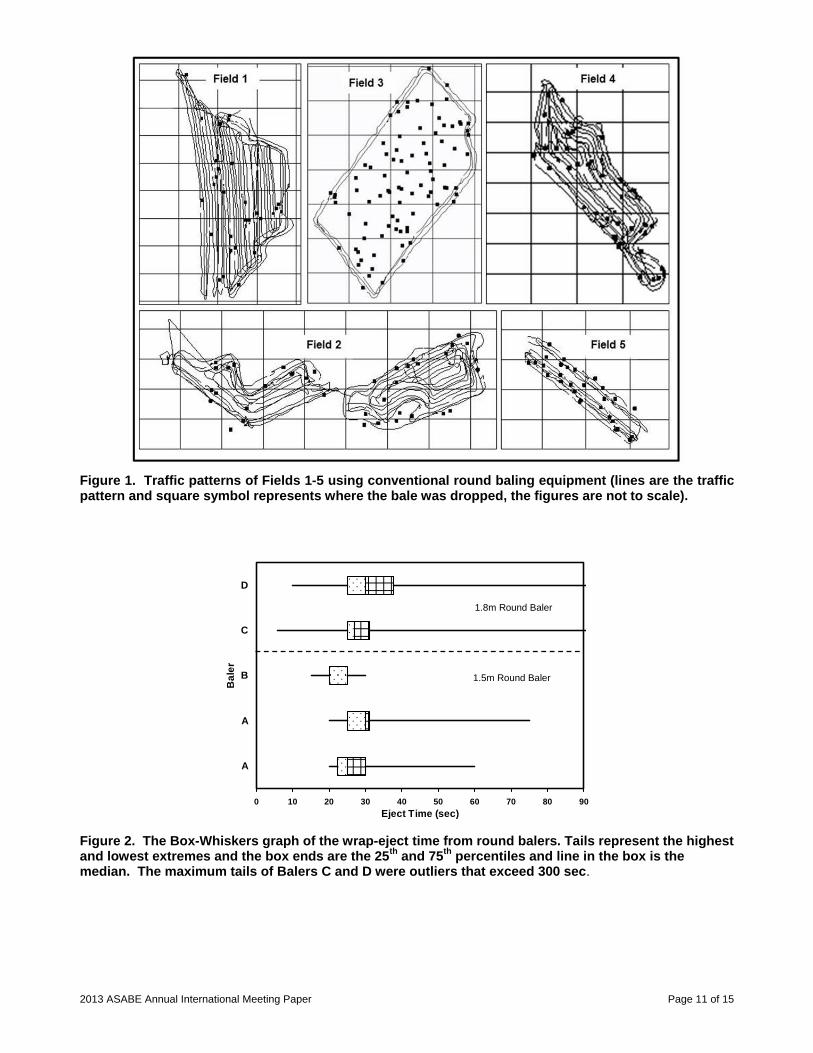
Baler performance data are summarized in Table 3. Average wrap-eject time for the 1.8 m diameter bales was 36 sec, while the 1.5 m diameter bales were wrapped and ejected in 27 sec. The time to wrap a bale with net wrap has been reported to be shorter than for wrapping a bale with twine (Shinners et al., 2010; Taylor, 1995). Only baler D used baling twine. Figure 2 shows the Box-Whisker graph of the ejection time for the round balers. This figure does not show the wide difference in average ejection times between the balers.
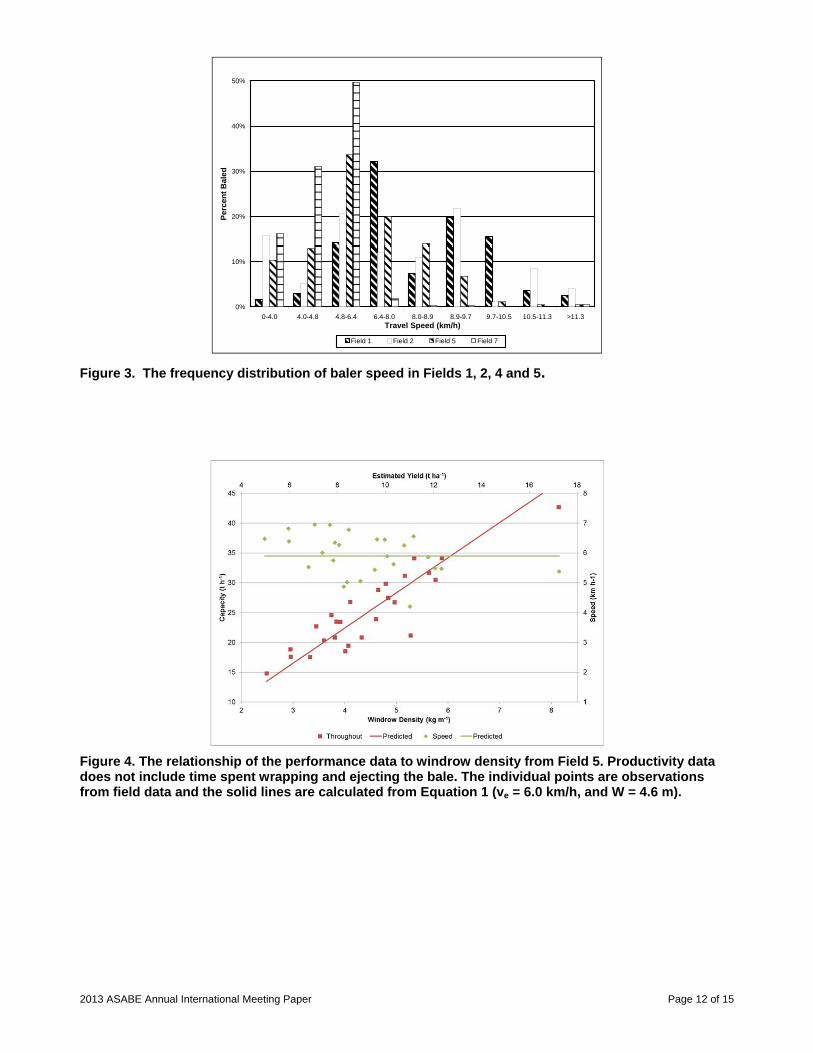
Travel speeds for Fields 1, 2, 4, and 5 averaged 8.9, 8.2, 7.0, and 5.9 km/h, respectively (Figure 3). This shows that the larger round baler was faster than the smaller baler. There was less variability in Field 5 than other fields. Fields 1 and 2 had a bi-modal distribution (two peak speeds) this was probably due to the field shape which influenced the operator’s driving patterns.

2013 ASABE Annual International Meeting Paper Page 6 of 15
Field 1 had 29 round bales, formed in 1.87 h (total roll time, no wrap-eject time included). The yield data indicated a relatively uniform density of biomass across the field. Field 2 had 37 round bales and the bales were formed in 2.06 h. Windrow density in this field was observed to be heavier than in other fields baled using the 1.8 m round baler. Deviations from the average occurred in locations where the baler was harvesting from a "double" windrow. In these locations, the rake formed one normal windrow, then switched direction and combined another windrow on top of the first.
Field 3 had 88 round bales, and the bales were formed in 2.7 h. The manual record of time interval between bales allowed for calculation of baler capacity but increased variability in readings. Variability in throughput is due not only to windrow density and baler speed, but extra time required to maneuver between windrows when the baler gets to the end of a windrow and the bale is only partly formed. Field 4 had 36 round bales, and they were formed in 1.4 h. Field 5 had 29 round bales, and they were formed in 0.77 h. In this field, the clutch on the baler pickup slipped in high throughput conditions and, in one instance, the pickup stalled and the operator had to back up to clear the baler. The average yield in Field 5 was 9.4 t/ha (total bale mass divided by area of field).
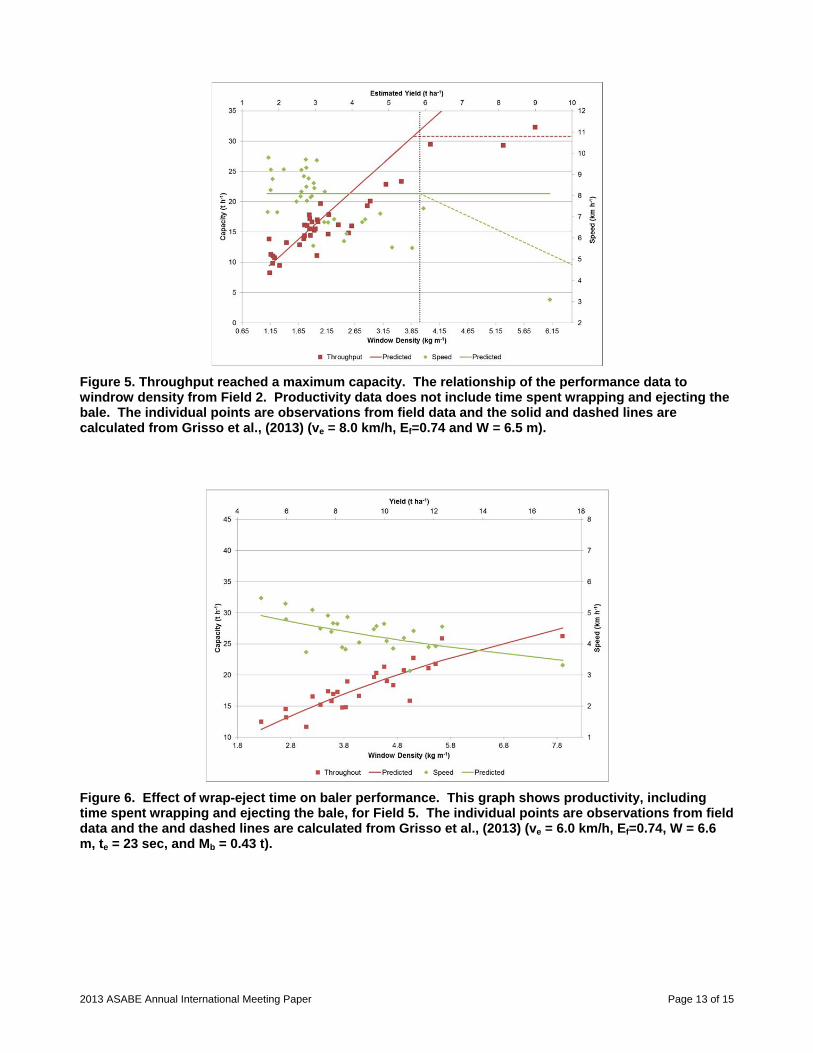
The performance of each of the observed balers has characteristics that are best explained in Figure 4. Figure 4 shows a round baler’s productivity during bale formation and does not include the bale wrap-eject time. The purpose of considering the baler performance during rolling only was to compare with existing models for agricultural equipment performance. It will be clear when the wrap-eject time is reintroduced that the complexity of the relationships are more difficult to discern when the time to wrap and eject is included in the calculations of baler performance. During bale formation, the baler throughput increased linearly for the range of yields encountered in this study. Table 4 shows the correlation coefficients between observed and calculated throughput. When not considering the bale ejection time, the R2 ranged from 0.59 for baler D in Field 2 to 0.88 for baler C in Field 1. Figure 4 also shows speed and field capacity versus yield. The points are measured data and the solid lines (red, green and blue) are calculated by assuming an effective speed and swath width and using Eqns. (2) and (3). As shown in Figure 4, the assumed effective speed of 5.8 km/h (green line) was similar to the average of the observed values (6.0 km/h). Note that the solid lines in Figure 4 are calculated from Eqns.(1) and (2) and these lines are not regression relationships of the observed values of speed and field capacity.
Many models assume that forage equipment operate at a constant speed and field capacity regardless of yield. The data in Figure 4 is consistent with this assumption. Speeds were constant with increasing yields, and the throughput was shown to have a positive linear relationship to yield. But there is a maximum limit on throughput. When forage equipment encounters a high-yield situation, it is possible to exceed the maximum throughput (Cmx) of the machine. In a study by Shinners et al. (2010), ground speed was limited due to high yields. They suggest that modifications to the baler pickup and throat may be needed to improve performance in high-yielding energy crops.
In this study, only one field/baler combination had conditions at which a change in baler field performance was observed (Field 2). These data are shown in Figure 5. At a yield of 9.4 t/ha, the throughput was essentially the same as was observed when harvesting a 5.6 t/ha field. Based on this observation, it was concluded that the maximum throughput for this particular baler was approximately 31 t/h. The modeling of the performance relationships in this situation is somewhat more difficult because the linear relationship and the transition to the constant maximum throughput must be correctly defined. Unfortunately, maximum throughput is not included in manufacturer specifications or in machinery management standards (ASABE Standard, 2005a). If this information was provided by manufacturers of
2013 ASABE Annual International Meeting Paper Page 7 of 15
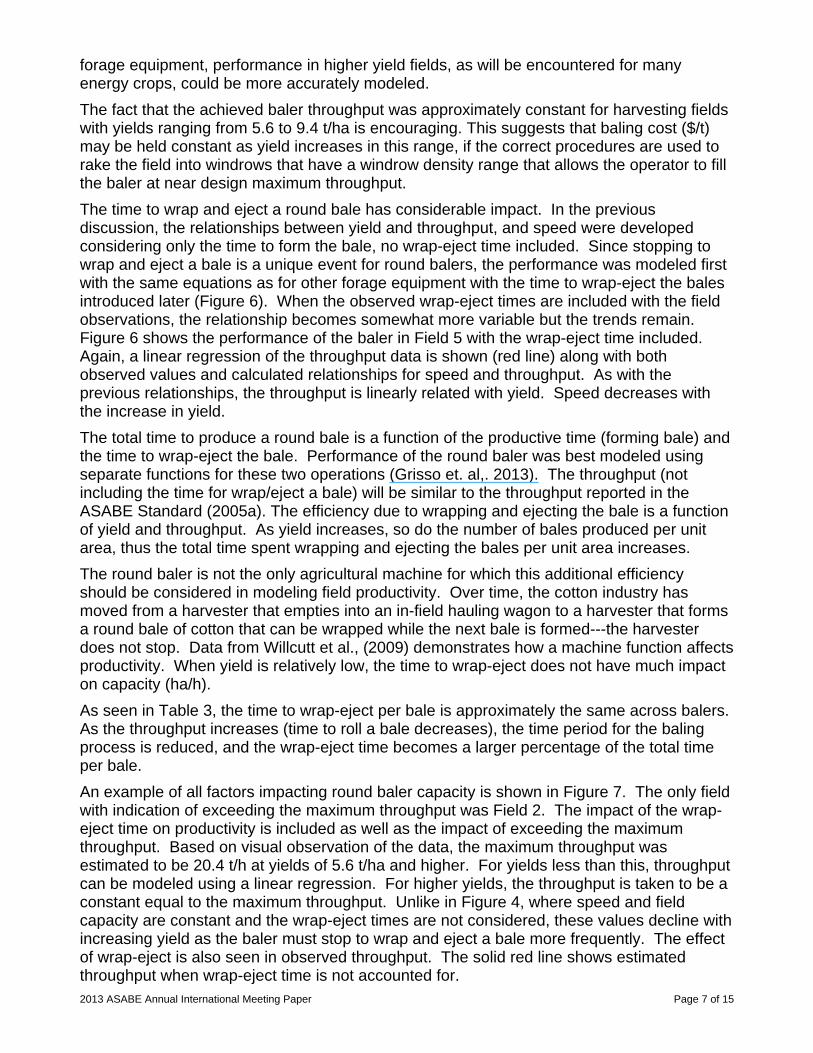
forage equipment, performance in higher yield fields, as will be encountered for many energy crops, could be more accurately modeled.
The fact that the achieved baler throughput was approximately constant for harvesting fields with yields ranging from 5.6 to 9.4 t/ha is encouraging. This suggests that baling cost ($/t) may be held constant as yield increases in this range, if the correct procedures are used to rake the field into windrows that have a windrow density range that allows the operator to fill the baler at near design maximum throughput.
The time to wrap and eject a round bale has considerable impact. In the previous discussion, the relationships between yield and throughput, and speed were developed considering only the time to form the bale, no wrap-eject time included. Since stopping to wrap and eject a bale is a unique event for round balers, the performance was modeled first with the same equations as for other forage equipment with the time to wrap-eject the bales introduced later (Figure 6). When the observed wrap-eject times are included with the field observations, the relationship becomes somewhat more variable but the trends remain. Figure 6 shows the performance of the baler in Field 5 with the wrap-eject time included. Again, a linear regression of the throughput data is shown (red line) along with both observed values and calculated relationships for speed and throughput. As with the previous relationships, the throughput is linearly related with yield. Speed decreases with the increase in yield.
The total time to produce a round bale is a function of the productive time (forming bale) and the time to wrap-eject the bale. Performance of the round baler was best modeled using separate functions for these two operations (Grisso et. al,. 2013). The throughput (not including the time for wrap/eject a bale) will be similar to the throughput reported in the ASABE Standard (2005a). The efficiency due to wrapping and ejecting the bale is a function of yield and throughput. As yield increases, so do the number of bales produced per unit area, thus the total time spent wrapping and ejecting the bales per unit area increases.
The round baler is not the only agricultural machine for which this additional efficiency should be considered in modeling field productivity. Over time, the cotton industry has moved from a harvester that empties into an in-field hauling wagon to a harvester that forms a round bale of cotton that can be wrapped while the next bale is formed---the harvester does not stop. Data from Willcutt et al., (2009) demonstrates how a machine function affects productivity. When yield is relatively low, the time to wrap-eject does not have much impact on capacity (ha/h).
As seen in Table 3, the time to wrap-eject per bale is approximately the same across balers. As the throughput increases (time to roll a bale decreases), the time period for the baling process is reduced, and the wrap-eject time becomes a larger percentage of the total time per bale.
An example of all factors impacting round baler capacity is shown in Figure 7. The only field with indication of exceeding the maximum throughput was Field 2. The impact of the wrap-eject time on productivity is included as well as the impact of exceeding the maximum throughput. Based on visual observation of the data, the maximum throughput was estimated to be 20.4 t/h at yields of 5.6 t/ha and higher. For yields less than this, throughput can be modeled using a linear regression. For higher yields, the throughput is taken to be a constant equal to the maximum throughput. Unlike in Figure 4, where speed and field capacity are constant and the wrap-eject times are not considered, these values decline with increasing yield as the baler must stop to wrap and eject a bale more frequently. The effect of wrap-eject is also seen in observed throughput. The solid red line shows estimated throughput when wrap-eject time is not accounted for.
2013 ASABE Annual International Meeting Paper Page 8 of 15
As shown in Figure 8, there is good agreement between the calculated machinery management equations and observed data for Field 1. The constant assumed effective speed and calculated field capacity without the time of wrap/eject is clearly seen and the scatter for these parameters with the wrap-eject included may be closer if actual values of time were used instead of the average time. The correlation coefficients are also high for the observed and calculated throughput (Table 4).
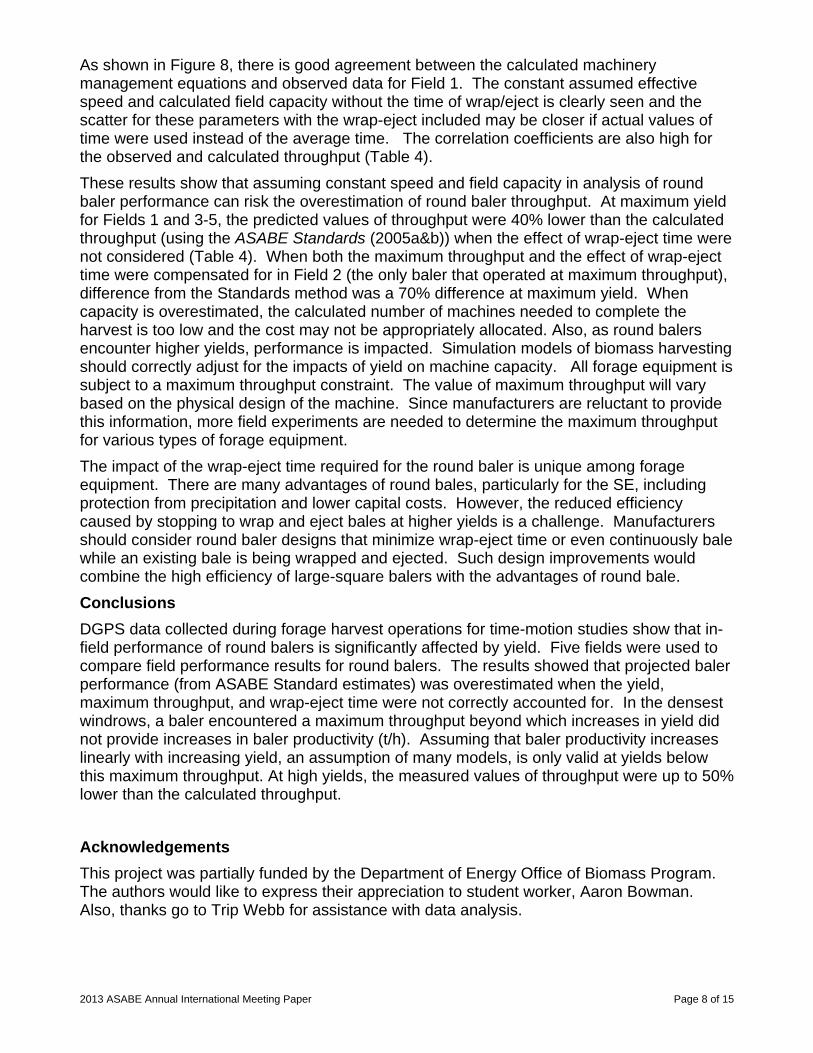
These results show that assuming constant speed and field capacity in analysis of round baler performance can risk the overestimation of round baler throughput. At maximum yield for Fields 1 and 3-5, the predicted values of throughput were 40% lower than the calculated throughput (using the ASABE Standards (2005a&b)) when the effect of wrap-eject time were not considered (Table 4). When both the maximum throughput and the effect of wrap-eject time were compensated for in Field 2 (the only baler that operated at maximum throughput), difference from the Standards method was a 70% difference at maximum yield. When capacity is overestimated, the calculated number of machines needed to complete the harvest is too low and the cost may not be appropriately allocated. Also, as round balers encounter higher yields, performance is impacted. Simulation models of biomass harvesting should correctly adjust for the impacts of yield on machine capacity. All forage equipment is subject to a maximum throughput constraint. The value of maximum throughput will vary based on the physical design of the machine. Since manufacturers are reluctant to provide this information, more field experiments are needed to determine the maximum throughput for various types of forage equipment.
The impact of the wrap-eject time required for the round baler is unique among forage equipment. There are many advantages of round bales, particularly for the SE, including protection from precipitation and lower capital costs. However, the reduced efficiency caused by stopping to wrap and eject bales at higher yields is a challenge. Manufacturers should consider round baler designs that minimize wrap-eject time or even continuously bale while an existing bale is being wrapped and ejected. Such design improvements would combine the high efficiency of large-square balers with the advantages of round bale.
Conclusions
DGPS data collected during forage harvest operations for time-motion studies show that in-field performance of round balers is significantly affected by yield. Five fields were used to compare field performance results for round balers. The results showed that projected baler performance (from ASABE Standard estimates) was overestimated when the yield, maximum throughput, and wrap-eject time were not correctly accounted for. In the densest windrows, a baler encountered a maximum throughput beyond which increases in yield did not provide increases in baler productivity (t/h). Assuming that baler productivity increases linearly with increasing yield, an assumption of many models, is only valid at yields below this maximum throughput. At high yields, the measured values of throughput were up to 50% lower than the calculated throughput.
Acknowledgements
This project was partially funded by the Department of Energy Office of Biomass Program. The authors would like to express their appreciation to student worker, Aaron Bowman. Also, thanks go to Trip Webb for assistance with data analysis.
2013 ASABE Annual International Meeting Paper Page 9 of 15
References
ASABE. 2012. ASABE Standards, S358.3, Moisture Management - Forages. St. Joseph, MI: ASABE.
ASABE. 2005a. ASABE Standards, D497.4, Agricultural machinery management data. St. Joseph, MI: ASABE.
ASABE. 2005b. ASABE Standards, EP496.2, Agricultural machinery management. St. Joseph, MI: ASABE.
Bransby, D. I., S. E. Sladden, and M. E. Downing. 1996. Yield Effects on Bale Density and Time required for Commercial Harvesting and Baling of Switchgrass. Proc. BIOENERGY ’96 – The Seventh National Bioenergy Conference: Partnerships to Develop and Apply Biomass Technologies, September 15-20, 1996, Nashville, TN.
Grisso, R.D., E. Webb, J.S. Cundiff, and S. Sokhansanj. 2013. Parametric Study of Machinery Management Relationships on Forage Equipment. ASABE Paper No. ---. St. Joseph, Mich.: ASABE.
Grisso, R.D., P. J. Jasa, and D. Rolofson. 2002. Analysis of Traffic Patterns and Yield Monitor Data for Field Efficiency Determination. Applied Engineering in Agriculture, 18(2):171- 178.
Shinners, K.J., G. C. Boettcher, R. E. Muck, P. J. Weimer, and M. D. Casler. 2010. Harvest and Storage of Two Perennial Grasses as Biomass Feedstocks. Transactions of the ASABE 53(2): 539-370.
Srivastava, A.K., C. E. Goering, R. P. Rohrbach, and D. R. Buckmaster. 2006. Machinery Selection and Management. Chapter 15 in Engineering Principles of Agricultural Machines, 2nd ed., 525-552. St. Joseph, MI: ASABE. Copyright American Society of Agricultural and Biological Engineers.
Taylor, R. 1995. Effect of Net-wrapping on Large Round Baler Capacity. Applied Engineering in Agriculture 11(2):229-230.
U.S. Department of Energy. 2011. U.S. Billion-Ton Update: Biomass Supply for a Bioenergy and Bioproducts Industry. R.D. Perlack and B.J. Stokes (Leads), ORNL/TM-2011/224. Oak Ridge National Laboratory, Oak Ridge, TN. 227p.
Willcutt, M. H., M. J. Buschermohle, E. Barnes, F. To, J. Field, and P. Allen. 2009. In field time in motion comparisons of conventional, John Deere 7760, and Case 625 Module Express cotton pickers. In Proc. Beltwide Cotton Conf., Memphis, TN: National Cotton (2009).
Womac, A.R., W.E. Hart, V.S.P. Bita, and T. Kraus. 2012. Biomass Harvesting of High-Yield Low-Moisture Switchgrass: Equipment Performance and Moisture Relations. Applied Engineering in Agriculture, 28(6):775-786

2013 ASABE Annual International Meeting Paper Page 10 of 15
Table 1. Field characteristics, baler used, number of bales and number of DGPS points for the field.
Field Field Size (ha)
Field Terrain Baler* Moisture content (% w.b.)
Yield (t/ha)
# of Bales Number of DGPS data
points
1 5.6 moderately
rolling C -
2.3 (1.3 to 3.8)
29 902
2 4.5 hilly D - 3.2
(1.7 to 9.4) 37 903
3 6.8 hilly A 17.9
(14.3 to 25.5) 4.7
(2.9 to 5.6) 88 349
4 3.6 hilly A 15.7
(14.6 to 16.4) 2.7
(1.8 to 5.2) 36 618
5 1.7 flat B 24.6
(24 to 25.5) 9.42
(5.0 to 17.3) 29 333
* See Table 3
Table 2. Baler specifications.
Baler Tractor Rated Power
(kW)
Baler Model Bale Wrap Specifications
A - Case IH BR740 Round Baler (1.5 m) 3 Wraps polyurethane net
B 63.4 John Deere 467 Round Baler (1.5 m) 3 Wraps polyurethane net
C 67.5 Case IH RBX462 Round Baler (1.8 m) 3.5 Wraps polyurethane net
D 67.5 Case IH RBX462 Round Baler (1.8 m) 10 Wraps baling twine
Table 3. Measured performance data for round balers.
Baler Field
Average & Ranges
Speed (km/h)
Field capacity
(t/h)
Mass per bale (t)
Windrow density (kg/m)
Time to form bale
(sec)
Time to wrap-eject
(sec)
A 3 5.7
(4.8 to 6.8) 15.1
(11.0 to 18.8) 0.38
(0.33 to 0.44) 2.7
(1.8 to 3.2) 92 28
A 4 7.0
(4.24 to 8.65) 15.0
(8.5 to 28.3) 0.32
(0.28 to 0.35) 2.3
(1.13 to 6.0) 84 32
B 5 5.9
(4.2 to 6.9) 25.1
(14.8 to 42.7) 0.43
(0.15 to 0.48) 4.2
(5.0 to 17.3) 65 23
C 1 8.9
(6.3 to 9.9) 13.1
(8 to 23.2) 0.56
(0.28 to 0.66) 1.5
(0.8 to 2.5) 167 39
D 2 8.2
(3.1 to 12.3) 16.9
(8.2 to 32.3) 0.52
(0.46 to 0.61) 2.4
(1.1 to 9.7) 123 32
Table 4. Correlation coefficients of the relationship between calculated and observed baling throughput for the 5 fields. Coefficients are given for both the productivity of the bales without and with the wrap-eject time. Percent change of calculated values from the constant assumed productivity factors (ASABE Standards) at maximum yield.
Baler Field
Correlation Coefficients without
Bale ejection R2
withBale ejection
R2
% change of calculated at Maximum yield
A 3 0.657 0.343 27.1%
A 4 0.602 0.542 43.8%
B 5 0.807 0.771 41.3%
C 1 0.876 0.599 30.0%
D 2 0.587 0.608 33.3% / 73.7%a a Two estimates, compared at maximum throughput and maximum yield
2013 ASABE Annual International Meeting Paper Page 11 of 15
Figure 1. Traffic patterns of Fields 1-5 using conventional round baling equipment (lines are the traffic pattern and square symbol represents where the bale was dropped, the figures are not to scale).
Figure 2. The Box-Whiskers graph of the wrap-eject time from round balers. Tails represent the highest and lowest extremes and the box ends are the 25th and 75th percentiles and line in the box is the median. The maximum tails of Balers C and D were outliers that exceed 300 sec.
0 10 20 30 40 50 60 70 80 90
A
A
B
C
D
Ba
ler
Eject Time (sec)
1.5m Round Baler
1.8m Round Baler
2013 ASABE Annual International Meeting Paper Page 12 of 15
Figure 3. The frequency distribution of baler speed in Fields 1, 2, 4 and 5.
Figure 4. The relationship of the performance data to windrow density from Field 5. Productivity data does not include time spent wrapping and ejecting the bale. The individual points are observations from field data and the solid lines are calculated from Equation 1 (ve = 6.0 km/h, and W = 4.6 m).
0%
10%
20%
30%
40%
50%
0-4.0 4.0-4.8 4.8-6.4 6.4-8.0 8.0-8.9 8.9-9.7 9.7-10.5 10.5-11.3 >11.3Travel Speed (km/h)
Per
cen
t B
ale
d
Field 1 Field 2 Field 5 Field 7
2013 ASABE Annual International Meeting Paper Page 13 of 15
Figure 5. Throughput reached a maximum capacity. The relationship of the performance data to windrow density from Field 2. Productivity data does not include time spent wrapping and ejecting the bale. The individual points are observations from field data and the solid and dashed lines are calculated from Grisso et al., (2013) (ve = 8.0 km/h, Ef=0.74 and W = 6.5 m).
Figure 6. Effect of wrap-eject time on baler performance. This graph shows productivity, including time spent wrapping and ejecting the bale, for Field 5. The individual points are observations from field data and the and dashed lines are calculated from Grisso et al., (2013) (ve = 6.0 km/h, Ef=0.74, W = 6.6 m, te = 23 sec, and Mb = 0.43 t).

2013 ASABE Annual International Meeting Paper Page 14 of 15
Figure 7. Effect of maximum throughput and wrap-eject time on baler performance. Productivity in Field 2, including time spent wrapping and ejecting the bale, is shown. The individual points are observations from the field data and the solid and dashed lines are calculated from Grisso et al., (2013) (ve = 8.0 km/h, Ef=0.74, W = 6.5 m, te = 32 sec, and Mb = 0.52 t).
Figure 8. Comparison of the observed and calculated productivity factors for Field 1. The observed from the field data and calculated from Equations 1 and 2 (ve = 12.0 km/h, Ef=0.74, W = 6.55 m, te = 39 sec, and Mb = 0.56 t). The red line indicates a perfect correlation between calculated and observed values (1:1 line).
Related Documents