AAS - A TOOL FOR MONITORING TRACE METALS IN ENVIRONMENT CFIANI)RA SEKIIAR K.* INTRODUCTION Rapid industrialisation coupled with geochemical alterations posed a major threat to environment. Pollution of air, soil and water with both organics and inorganics is a matter of great concern, however, the non-degradable persistent trace metals are the most pressing problems of present decade. They are the most insidious pollutants because of their non-biodegradable nature and property to effect all forms of ecological systems. Owing to their toxicity and ill-effects on living being the present day scientists and researchers have developed interest in the amounts, origin and fate of certain elements. For ex- ample certain trace elements such as cadmium, chromium, mercury, lead and vanadium are of great concern because of their toxic effects on plants, animals and humans. Essential trace elements, such as chromium, vanadium, manganese. iron, cobalt, copper and zinc are indispensible for the growth and survival of mankind. From the point of view of toxicity metals can be classified according to the following three criteria: non-critical, toxic and very toxic. Classification of elements according to toxicity and availability is given in Table-1. The impact of heavy metal contamination in biosphere is slowly being recognised as a potential Health Hazard not only to human beings but almost all the major industries are also affected by trace elements imbalances. For instance the presence of silica in boiler feed water at 30 to 1000 ppm level leads to appearance of scale forming silicates which reduces the heat transfer from boiler. Scientist, Analytical Ciremislrij Uiutsion, Nat tonal Metallurgical Laboraloru, Jamshedpur - 831 007 VIII-1 ^I

Welcome message from author
This document is posted to help you gain knowledge. Please leave a comment to let me know what you think about it! Share it to your friends and learn new things together.
Transcript
AAS - A TOOL FOR MONITORING TRACE METALSIN ENVIRONMENT
CFIANI)RA SEKIIAR K.*
INTRODUCTION
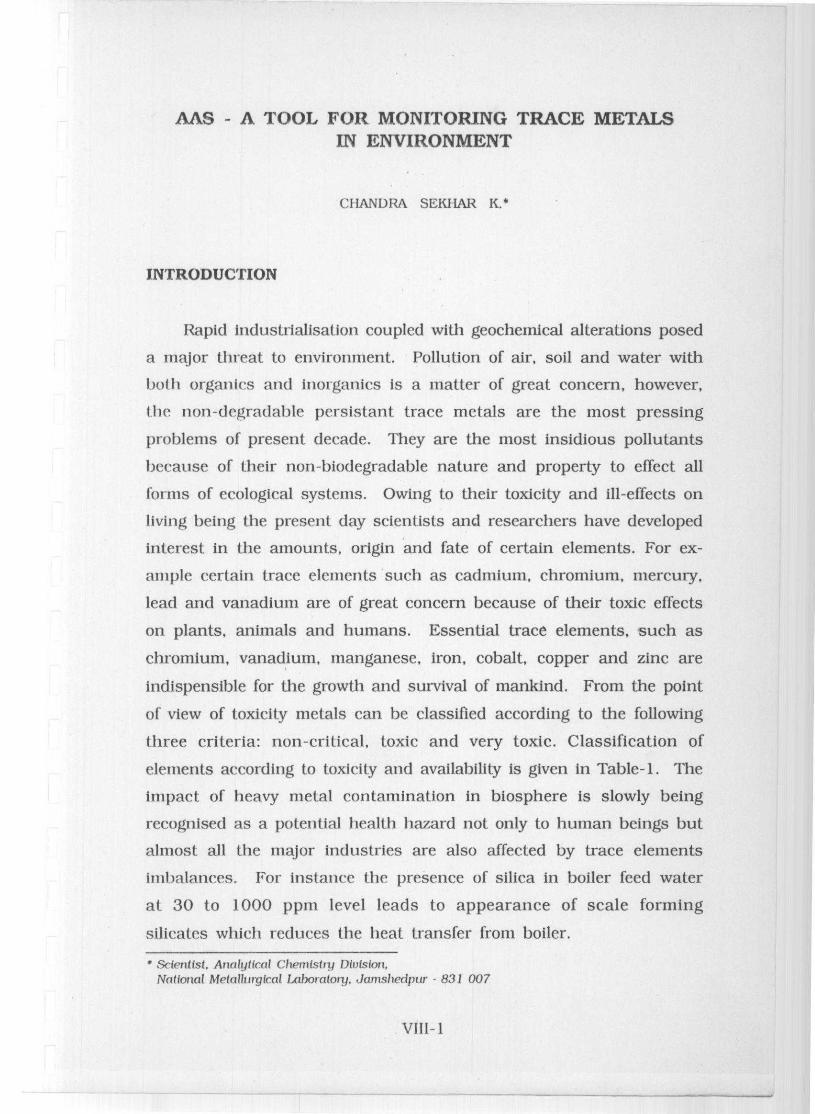
Rapid industrialisation coupled with geochemical alterations posed
a major threat to environment. Pollution of air, soil and water with
both organics and inorganics is a matter of great concern, however,
the non-degradable persistent trace metals are the most pressing
problems of present decade. They are the most insidious pollutants
because of their non-biodegradable nature and property to effect all
forms of ecological systems. Owing to their toxicity and ill-effects on
living being the present day scientists and researchers have developed
interest in the amounts, origin and fate of certain elements. For ex-
ample certain trace elements such as cadmium, chromium, mercury,
lead and vanadium are of great concern because of their toxic effects
on plants, animals and humans. Essential trace elements, such as
chromium, vanadium, manganese. iron, cobalt, copper and zinc are
indispensible for the growth and survival of mankind. From the point
of view of toxicity metals can be classified according to the following
three criteria: non-critical, toxic and very toxic. Classification of
elements according to toxicity and availability is given in Table-1. The
impact of heavy metal contamination in biosphere is slowly being
recognised as a potential Health Hazard not only to human beings but
almost all the major industries are also affected by trace elements
imbalances. For instance the presence of silica in boiler feed water
at 30 to 1000 ppm level leads to appearance of scale forming
silicates which reduces the heat transfer from boiler.
Scientist, Analytical Ciremislrij Uiutsion,Nat tonal Metallurgical Laboraloru, Jamshedpur - 831 007
VIII-1
^I

Continuous monitoring of trace elements is becoming more im-
portant front pollution point of view. Pollution monitoring and con-
trol of these metals of environment significance need analytical
techniques capable of detecting low concentration of these metals
which are generally present in micro and submicro quantities. The
instrumental methods which are most widely used for determination
of tace metals are emission spectroscopy, X-ray fluorescence nutron
aclivat.ion analysis and atomic absorption spectropltotometry(AAS).
These Instruments are highly sensitive, but most of them except AAS
MCI not suitable for atmospheric samples.
I
A HISTORY OF ATOMIC ABSORPTION SPECTROMETRY
Early History : optical spectroscopy can be traced to 1672, when
Newton observed that sunlight could be separated into colours upon
passage through a prism. Indeed, the word spectrum comes from
Newton's attempt to describe the ghostly appearance of dispersed
sunlight. The first person to observe spectral features other than
simple colours was Wollaston, who in 1802 described (but made no
attempt to explain or characterize) numerous dark lines in the sun's
spectrum. Starting in 1817, T'r-aunhofer carefully mapped these lines
that bear his name and designated some of the more prominent ones
by letters, starting with A at the red end of the spectrum. Even
today, one sees reference to the sodium D lines, using Fraunhofer's
original designation. His observations also laid the groundwork for
spectral observations in astronomy. Fraunhofer noted that light from
Venus looked much like that from the Sun but that light from the
hi ight star, Sirus, had a very different spectrum.
Kircl ►of' and Bunsen explained the origin of Fraunhofer lines in
a classic series of papers published in 1859 and 1860. They not only
explained that Fraunhofer lines were caused by atomic absorption in
VIII-2

the Sun's atmosphere ; they also established the general laws of emis-
sion and absorption of light and described the conditions needed for
earthbound analytial observations using flames in both emission and
aloniic absorption . Flauie analysis became common in I3unsen's lab,
and several new elements were discovered by spectral analysis in the
early 1960's . Ilowcvei , the Bill analytical potential of both flame
emission and atomic absorption remained unexploited for many years.
Modern History : 'T'here were several distinct periods, in the
thccnilnIail history of (lance AAS covering nearly four decades.
In the induction period (1955-62) Atomic absorption - the tech-
01(11Ie that_ soon would revolutionize elemental analysis - was ignored
lw nearly all practicing analytical chemists. Walsh and a mere hand-
fill of people down tinder developed the method and demonstrated its
Wilily lime and lime again and still people stayed away in droves.
Walsh traveled extensively, trying to promote AAS, and was often
frustrated by his inability to generate wide interest. His American
friends have not let him forget that he once accurately described the
United States as a country 'tinderdeveloped' in AAS.
From 1962 through 1969 explosive growth ("fun time") occured
as AAS caught on and surged to the forefront of elemental analysis.
YYtri time" because during this period AAS symposia were spiced
by frequcnl, (usually polite) arginicnt.s about the best sources and
atomizers. New techniques and applications were suggested almost
as rapidly as Most could lollow. During the fun time, detection liin-
its were a source of great pride and it seemed that nearly every con-
ference paper included a claim to have established a new record in
the quest for zero. A discussion of interferences were sure to spark
instant debate; many researchers argued that AAS was much
less prone than atomic emission to effects from chemical interferences.
VIII-3

The very existence of spectral interferences in AAS was vigorously
denied by proponents of the technique . The confusion concerning
interferences can perhaps be best conveyed by quoting from a publi-
cation of the period.
"Atomic ahsor-ptiort spectroscopy does not su ffer from
chemical interference but (Me) presence of large amounts
of anions and cations can cause pronounced effects on
absorption"
In other words, it is not the chemicals, but those blasted anions
and cations that. cause the problems. This is an indicative of the
cmilttsion that. prevailed during the 'fun time'.
By 1969 iiinsl iiiiscnnceplions about AAS had been resolved, and
1969-76 was a period of relative stability (i.e. relative to that of the
previous years). AAS piit on its work clothes and began to generate
data li ► r other fields. Slicclral inlerfCreiwes. allhotigh relatively rare,
were acknowledged, and chemical interferences were known to be
primarily function of the atomizer, not the mode of observation.
Research was still being done, and improvements were still being made
but with a slower pace compared to growth period. Automated back-
ground correction systems for AAS were available and, in an impor-
tant advance, .thee IlitroLlsoxide-accetylene flame had nearly doubled the
number of elements to which AAS was applicable. The evolution of
AAS was essentially complete.
In about 1976 the revolution in sold -state electronics began to
slake an impact on chemical instrumentation, and there appears to
be no end in sight . Instrument throughput and, to a lesser extent,
instrument capabilities have been enhanced whereas much of the
IccIiiiiit of routitlc analysis has been removed.
VIII-4
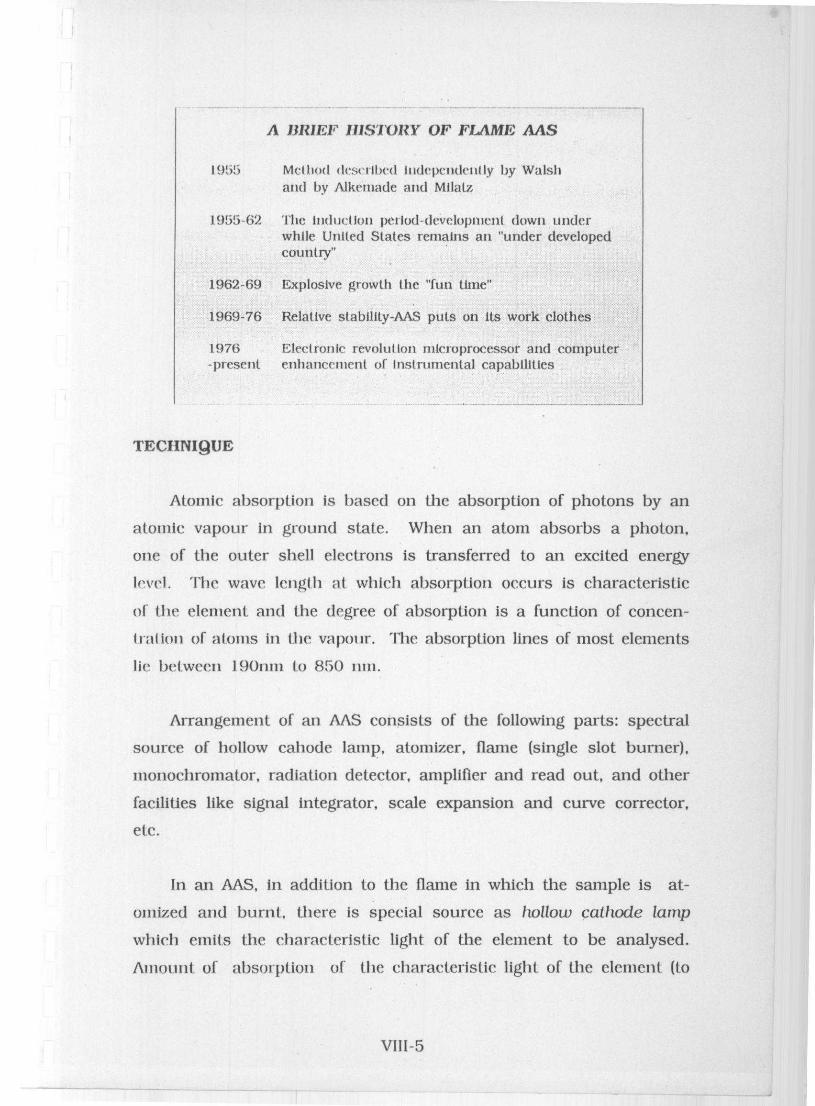
A IJRII FRIS'I`OR.Y OF FLAMI AAS
1955 Method cleseilbecl Imlependeut ly by Walshand by Alke ► tiade and Mllatz
1955-62 The indncliou petiod-development down underwhile United States remains an "under developedcountry"
1962-69 Explosive growth the "fun time"
1969-76 Relative stability-AAS puts on its work clothes
1976 Electronic revolulion microprocessor and computer-present erhancrinent of Instrumental capabilities
TECHNIQUE
Atomic absorption is based on the absorption of photons by an
atomic vapour in ground state. When an atom absorbs a photon,
one of the outer shell electrons is transferred to an excited energy
level. The wave length at which absorption occurs is characteristic
of the element and the degree of absorption is a function of concen-
Irttliotm of atones in the vapour. The absorption lines of most elements
lie between l90nui to 850 null.
Arrangement of an AAS consists of the following parts: spectral
source of hollow cahode lamp, atomizer, flame (single slot burner),
monochromator, radiation detector, amplifier and read out, and other
facilities like signal integrator, scale expansion and curve corrector,
etc.
In an AAS, in addition to the flame in which the sample is at-
oinized and burnt, there is special source as hollow cathode lamp
which emits the characteristic light of the element to be analysed.
Amount of absorption of the characteristic light of the element (to
VIII-5

be analysed) in the flame is measured. Sensitivity of an AAS depends
upon the absorption of the characteristic line in the flame or the
iiiirirlrer of ground stale atones in the (lance. At the normal tempera-
fin-(- of the (lance, the rc(nciber of ground state atones are 101 to 101"
orders more than the number of atones In the excited state. Atomic
absorption technique is most selective because of the nature of
reasonance (selective) absorption of the characteristic line of the
element in the groundstale atomic vapour of the element present in
the flame. I3ackground noise is reduced by employing hollow
cathode lamps modulated at a suitable frequency and an amplifier
tuned exactly to this frequency.
SAMPLE COLLECTION FOR POLLUTION STUDIES
Air Pollution : It is necessary to distinguish between general air pol-
lution and specific air pollution. Pollution encountered in almost
in-ban and industrial zones, primarily as a result of combustion
processes. which include c•arloir urenoxide, sulphur dioxide, oxides of
nitrogen, oxidants, hydrocarbons, suspended particulates and lead, is
general pollution. The latter type arises primarily from identified in-
dustrial sources and may include specific gaseous and particulate pol-
lr_rtants, such as chlorine from caustic soda factories, iron oxide from
steel mills, cotton dust from textile mills and so on. Table-II gives
details of sources of particulate emissions.
For the examination of air, a distinction is made bcwtween gase-
ous metals or metallic c•onrpouncds and particulate matter such as
dust, flyash, and aerosols. The various forms of aggregations require
differing collection and sample preparation techniques. While the
physical chemical examination of gases down to the trace range is
nowadays generally well under control, the analysis of airborne dust
and aerosols, (lust from emissions, and smoke or fog presents con-
siderable difficulties.
VIII-G

I)cist lrnliclcs ill air ale generally collected by filtration techiligiies
with a twenty -lour lwtir collection time, Coarse dust particles that
settle out are collected in containers over a 4-week period and meas-
ured by weighing. Glass fibre fillers permit a large air throughput,
but. because of the highly fluctuating element blank values, this type
of filter is more suitable for the gravimetric determination of the
airborne dust cxmcentraticnt rather than for the elemental analysis of
airborne diist. I)tic to Ilteir low and constant metal blank values,
ccc•iliilose membrane filters are excellently suited for nlulticlentent
determinations using the most varied analytical techniques . Elements
like Pb, Cd, Fe, Zn and other elements can be determined by extract-
ing the filters with acid , or by low temperature or oxygen plasma
aching of the filter and taking up the residue in acid , and nebulizing
the solution into the. flame.
Industrial effluent : Suspended matter in the sample is first
separated, or if it contains any of the elements to be determined, it
trust be homogenized and dissolved or extracted with nitric acid. In
extreme cases, the solid matter is centrifuged off and treated
separately as sludge. Clear or clarified water is acidified to about
1% with nitric acid and can be aspirated in the atomic absorption
spectrometer without lima ther treat uncut in the concentrations ranges
present can be handled. Samples with a high suspended solids
content must be digested by heating with nitric acid for 30 min.
Calibration slatularcls should also be acidified 1% with nitric acid if
the concentrations are too high and alternative line can be used or
solutions are brought within t he best range by dilution with
deionized water also acidfied with ],% of nitric acid. If the concen-
trations are too low, the sample may be evaporated to a lower
volume, or the wanted metals extracted into an organic solvents.
Sludges : Sludges containing organic matter are wet or dry-ashed like
other organic matrices and takenup in mineral acid. If the inorganic
residue contains siliceous material, the silica can either be removed
Wit Ii hydrochoric acid and pcrchloric acids or the residue completely
solublized by a method generally applicable to silicates. Alternatively,
sludges and sediments can be extracted for, heavy element analysis
with hydrochloric/nitric acid mixtures. This is effective for several
elements including cobalt. copper, chromium, iron, manganese, nickel,
lead and zinc.
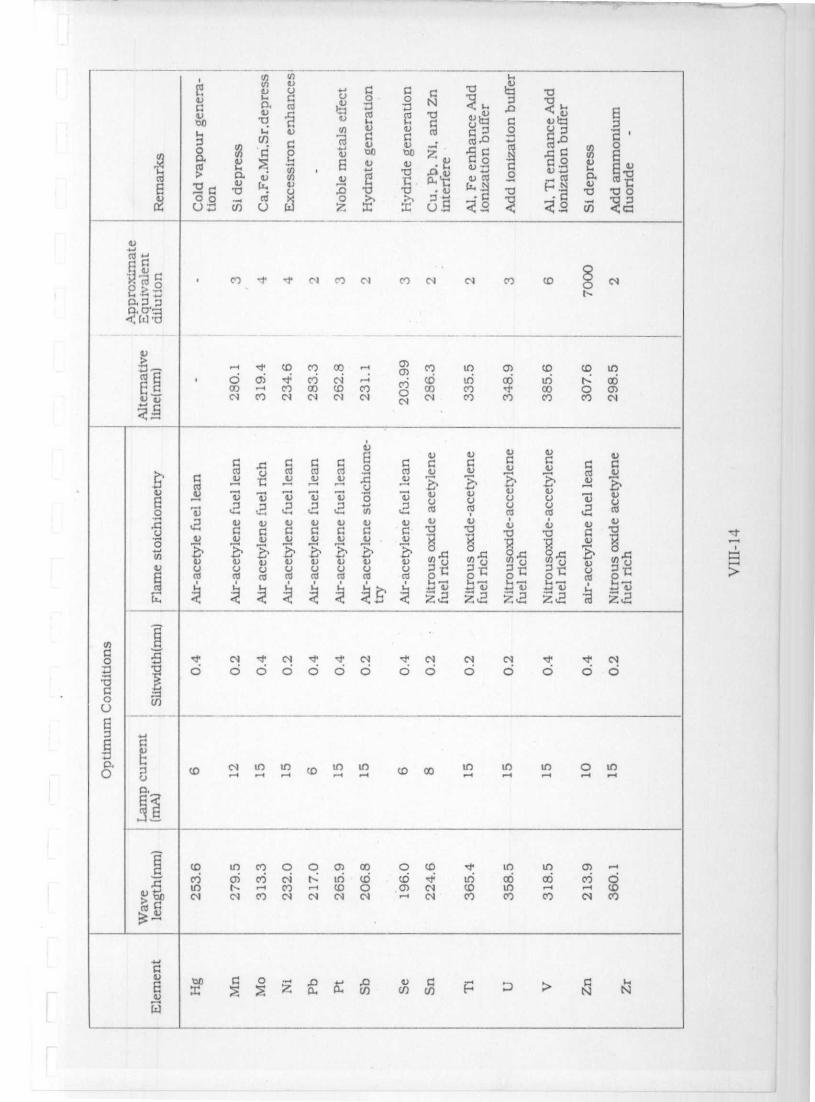
" SIHORT CUTS" IN AAS
Over recent years. the demands placed upon AAS have increased
steadily . The fact that speed and simplicity are much improved
compared to the methods of thirty years ago is no longer relevant.
It. is appropriate at this point to consider the 'shortcuts' which allow
for urore rapid rise of flame spectroscopy , and possibility of saving
(irtre. They are :
Sample preparation , including separation and/or
preconcent rat ion
2) Addition of releasing agents or ionisation buffers
3) Dilution to an appropriate approximate concentration
4) Instrument warm -rep and optimization
5) Finding approximate concent . rtions if not already known
6) Routine use, including (-la processing
Errors from losses and contamination : Because of the inherently
low limits of detection of AAS, dilute solutions are used not only
for determining substances at trace levels, but also for determining
major constituents at dilutions where the effects of interferences
are reduced or eliminated. This advantage of working with dilute
solutions, however, is unavoidably associated with errors due to losses
(rru ►stly (Inc to aclsorp(ioii), contaiiiination from reagents, and contami-
nation from the walls of the containers. In the past, these sources of
VIII-8

cr ► M11 have I ►cen relatively unir►► port,ult except for the most sensitive
chemical methods. Ali instclious type of loss results from the adsorp-
tion of metallic ions from dilute solutions on the walls of the
container . These losses, which may or may not be significant for a
parIicc ► lar detcrnain,11iu ►► . will depend on the' p11 of the solution, the
concentration of the ionic species present. and the history of the
container surface . To avoid losses of this type of AAS procedures,
frequent use is made of' a " ► i ► astcr" staiidard solution from which
dilute solution are made tiwl are not stored more than two weeks.
Polyethylene is evidently one of the best container materials
because of its low nict.allic content and the nonpolar nature of its
surface. Many of the common elements (Mn, V. Ba, Mg, etc.) can be
stored in polyethylene containers in concentrations of only 3 pprn for
at. least one year without loss. The pII of the solution should be
low enough to prevent hydrolysis of tlce metallic ions, and a pI1 of 2
or less would be best.
Cori tantination : Contamination becomes a problem when elements
are cicter ►nincc) al. concentration levels below approximately 0.01 per
cent. At the 0.01 percent (100 ppm) concentration level, there are
about. 10,000 atones present for each atone of the element to be de-
termined (if they have the same atomic weight). Because of the over-
whehiiing preponderance of other substances present, relatively large
quantities of reagent chemicals are required to dissolve the sample;
in addition. the solution is exposed to relatively large surface areas
of the containers during the processing of the sample.
Reagent -grade acids cootai ►► traces of metals (Table-III), some of
which originate from the glass bottles used for storage. Although
the concentration of each of the metals present is specified to be
below the I ppm level, the acids used must be included in a study
VIII-9

cif' reagent blanks. 'I1iis source of contamination may be significant,
as in the dissolution of I g of a sample that requires 15 ml of acid.
For example, a contaminating metal when present at the 1 ppm level
in the acid (sp.g. 1.3) will contribute a blank (20 ug) equivalent to
20 ppm in the 1-g sample.
131 RI JOGRA1'1ItY
1. Spevlroc •bemical Analysis by Atomic Absrptioii by W.J. Price John,published by Wiley & Sons, 1979
2. Atomic Absorption Spectrometry by Bernhard Wclz, published byVCI I, (1985).
3. "A History of AAS from An Academic Perspective " S.R.Koirtyollunn,Analytical Clieniislry. 63, 1021A ( 1991).
4. AAS deleriniiiatinn of (race metals in suspended particulate mat-ter by CI3S Sagar. Ray Johnson. Animesh Kumar and A.L. Aggar-wal, Indian, J.Enviromnental Protection, 10, 614, Aug (1990).
5. A Critical appraisal of short cuts in flame spectroscopy byM.S.Cresscr , C.E.C)'Gracly and I.L. Marr . Prog . In Analytical AtomicSpectroscopy 8.19 (1985).
G. Atomic Absorption SpecIn niclry - Applications and problems byL.11. Lewis, Modern Classics in Analytical Chemistry, AmericanChemical Society p.82 (1970).
7. Atomic Absorption Spectroscopy - Present and future aspects byR.E. Sturgeon , Analyst 117, 233.( 1992).
8. Impact of trace clement air polutiotl on human health byA. Dubey. Indian J.Envirornnental Protection 12, 512 .July (1992).
9. Vinci. Ilurtclboolc of Spectroscopy by J.W.Robinson CRC Press,(1991).
10. Atomic Absorption data Book, by Peter J.Whiteside, published byPye Unicani. Oct.(1979).
1 1. Atomic Spectroscopy by James W.Robinson, published by MarcelDekker Inc. (1990).
Vlll-l0

Table-1
Non-Critical
Na C F
K P Li
Mg Fe Rb
Ca S Sr
11 Cl Al
0 Br Se
N
Table-2
Industry & Process
lion and sled mills
Iron foundaries
Non-ferrous metallurgy
coke manufacture
Acid manufacture
Portland cement
Petroleum refineries
Toxic but vary rareVery toxic and
relatively accessible
Ti Ga Be As Au
Hf La Co Se Hg
Zr Os Ni Te TI
W Rh Cu Pd Pb
Nb Jr Zn Ag Sb
Ta Ru Sn cd B1
Re Ba Pt
Source of emission
Blast furnaces. steelmaking furnaces, sinter-ing machines
Cupolas, shake -out mak-ing
smelters and furnaces
Oven operation, quench-ing materials handling
Thermal processes rockacidulating grinding
kilns, driers, materialhandling system
catalyst regeneratorssludge incinerators
Particulate matter
Iron oxide, dust smoke
Iron oxide , smoke,oildust, metal fumes
Smoke, metal fumes, oilgrease
Coal and coke dust coaltars
Acid mist, dust
Alkali and process dusts
Catalyst dust, ash fromsludge
V11I-11

Table-3
Trace Metal Concentration (µg/kg) in some Acids
1ICI 11NO3 11C10^
Al; 0.2 0.1 0.5
Ca 24 30 1.7
Cd 0.5 0.2 4
C r 0.3 130 18
Cu 1 4 3
Fe 7 55 10
K 10 11 9
Mg 20 4
Ni 3 3 0.5
Pb <1 0.3 16
Sn <6 1 <1
Zn 4 8 17

NomQ)
E
O41
) i7 U)
.^px b
o^ 0 0.
0
^ 'v tip 4) 4) tiF,
do ° Cl) u)m w^
N Cl Cl c1r) Cl N Cl co N
O
QW+:+
N C. n ^ 0)
cd N. c0 CDC-4
NLO
LOcli
N.C14
r-+ t.coM C?) 1-4 CO co Cl d' `•) N '
U4)
p cd cti^".,,
c d4)
coU U
c^U U 4)
IO 4) ,^ R, w IR
0
4) r-^ 4) 4)
C
4) 4) 4) U
C
y 4)
om
U
CU
CO N
C
• CU
C) C
Cc
fem id cd cU id Cd.
m
0,C, d' d d d d' N N Cl d'
p b C7 O O O O CO O O O O0U
Cl)
O
U d 00 CD CD LO9 10 ui LO
cC1,
O p Oh ri O0 h CY). 00 c0
N O
c+) 00 O t^10 4 OO ti
ppa)
e') MO)-4 N N N CY) CO N
N
W ^4 U0
U U tL4 0
uL) O p
nD TS y^ o v^ a'U)
cd a I
Vi i UD to q O
a^ ^ av°a^ co CU
oo. b
a^w b E" v 'vo
a>1
0
NC13Co -! -Y N Co N o l Cl CD $
O O! C C) N
:JN
1 1v
u-^ d tD co 00 -4 Co to a) CO CD LOOCO
O-
d'COC 7CO
NcD Co
CDco
1nCo
06-t
to00
NO
CO0)
N co N Cl N Cl N N Co co Co M N
[CC
CC CO C'CIJ
y
4)4)
^
u
n^
u
a^
_u l:yG
4) u u u u V p V V
ca clU
8
u( w
N
Ra
w4)
u
u Vv
u
u
u
a)
U
a)
u
u
i
4)
q
4)
40v a)
Z^'A
o o g O g 44)uo
4)Q u u v
Vu u
zao
Q a r 5 o fc cv co Co co ca cl c 0 o cD o
cx.
O0 -i N 'f' N N 'd N N N d' d' N"++ O O O O O O O O O O O O O O
O uj
o.0
O CD ct in r, D n ^n "D 00 in to to to
a
CD Cn Ch O O 0) 00 O to Id, to to 0)
^-! to ° n )CO
^n
CD 0 CD N COCOLO° 1-
o64
cj-COO
yCd
N N CO N N Cl Cl r-+ Cl Co CO CO Cl Cl)
V4x 5 a a cn ^% H J 7 N N
Related Documents