In-Depth Survey Report EVALUATION OF ENCLOSING HOOD AND DOWNFLOW ROOM FOR NANOCOMPOSITE MANUFACTURING William A. Heitbrink, Ph. D., C.I.H. Li-Ming Lo, Ph. D. Daniel R. Farwick Division of Applied Research and Technology Engineering and Physical Hazards Branch EPHB Report No. 356-16a October 2012 DEPARTMENT OF HEALTH AND HUMAN SERVICES Centers for Disease Control and Prevention National Institute for Occupational Safety and Health

Welcome message from author
This document is posted to help you gain knowledge. Please leave a comment to let me know what you think about it! Share it to your friends and learn new things together.
Transcript

In-Depth Survey Report
EVALUATION OF ENCLOSING HOOD AND DOWNFLOW ROOM FOR NANOCOMPOSITE MANUFACTURING
William A. Heitbrink, Ph. D., C.I.H.
Li-Ming Lo, Ph. D.
Daniel R. Farwick
Division of Applied Research and Technology Engineering and Physical Hazards Branch EPHB Report No. 356-16a
October 2012
DEPARTMENT OF HEALTH AND HUMAN SERVICES Centers for Disease Control and Prevention National Institute for Occupational Safety and Health

Draft EPHB Report No. 356-16a
Page ii
Site Surveyed: Nanomaterial manufacturing facility, Eastern USA
NAICS Code: 325199
Survey Dates: November 15−16 2011 and January 6, 2012
Surveys Conducted By: William A. Heitbrink, NIOSH/DART/EPHB Li-Ming Lo, NIOSH/DART/EPHB
Daniel R. Farwick, NIOSH/DART/EPHB
Employer Representatives Contacted
Contractor Representatives:

Draft EPHB Report No. 356-16a
Page iii
Disclaimer
The findings and conclusions in this report are those of the authors and do not necessarily represent the views of NIOSH. Mention of any company or product does not constitute endorsement by NIOSH. In addition, citations to websites external to NIOSH do not constitute NIOSH endorsement of the sponsoring organizations or their programs or products. Furthermore, NIOSH is not responsible for the content of these websites. All Web addresses referenced in this document were accessible as of the publication date.
Draft EPHB Report No. 356-16a
Page iv
Table of Contents Disclaimer .......................................................................................... iii Abstract .............................................................................................. v
Introduction ......................................................................................... 1
Background ....................................................................................... 1
Potential Health Effects ....................................................................... 1
Published Regulations ......................................................................... 3
Plant Description .................................................................................. 4
Manufacturing Processes ..................................................................... 4
Control Measures ............................................................................... 4
(1) Downflow Room ....................................................................... 4
(2) Ventilated Hood ....................................................................... 7
Methodology ........................................................................................ 9
Ventilation Measurements ................................................................... 9
Aerosol Measurements ...................................................................... 10
Results .............................................................................................. 12
Ventilation Measurements ................................................................. 12
Aerosol Measurement ....................................................................... 14
Weigh-out Hood ............................................................................ 14
Cutting Composite Paper ................................................................ 18
Grinding Composite Paper inside the Hood ........................................ 20
Cutting Composite with Bandsaw ....................................................... 22
Conclusions and Recommendations ....................................................... 24
Air Contaminant Control in the Downflow Room ................................... 24
Cutting Composite with Bandsaw ....................................................... 25
References ........................................................................................ 26
Acknowledgements ............................................................................. 29
Appendix ........................................................................................... 30

Draft EPHB Report No. 356-16a
Page v
Abstract
Engineered nanomaterials, specifically carbon nanotubes, graphene platelets, and other ingredients are used to manufacture a nanocomposite paper at this site. National Institute for Occupational Safety and Health (NIOSH), Division of Applied Research and Technology (DART), Engineering and Physical Hazards Branch (EPHB) researchers studied the combined use of a downflow dilution ventilation room and a ventilated booth for controlling worker exposure to dusts that can contain engineered nanomaterials. Fan-powered filter units supplied air from the ceiling, and this air was drawn out of the room through filters located on one wall, just above the floor. This room was used for preparing slurries containing engineered nanomaterials and other ingredients. To produce the slurry, containers of dry powders are placed in the ventilated booth. Then, the containers are opened, and the dry ingredients are quantitatively transferred to a beaker on a weighing scale. After adding the desired mass of material to the beaker, a solvent is added to convert the dry powder to a slurry for subsequent handling outside of the booth. Other activities that can occur in this room include manual cutting of the nanocomposite paper and grinding of the nanocomposite paper in the hood.
During this study, an aerosol photometer (Dustrak Model 8533, TSI, Inc,) and a fast mobility particle sizer (FMPS, Model 3091, TSI Inc.) were used to measure concentrations in the worker’s breathing zone and near emission sources as a function of time. This time-series data was examined to evaluate whether the operation or process caused noticeable concentration increases as compared to some background period prior to the work tasks or equipment operations that might increase concentrations. In this study and report, background concentrations refer to concentrations measured before the work-place event occurred.
Measurements made with an aerosol photometer (Dustrak Model 8533, TSI, Inc,) and a fast mobility particle sizer (FMPS, Model 3091, TSI Inc.) showed that powder weigh out and grinder operations within the weigh out booth did not cause a meaningful increase in aerosol concentrations measured in the worker’s breathing zone. In addition, the manual cutting of the nanocomposite paper did not cause a meaningful increase in aerosol concentrations. The low concentration measurements were attributed to the downflow ventilation and the operation of the booth. The downflow ventilation avoided the formation of eddies which can transport air contaminants directly into the worker’s breathing zone. The workers positioned the powders and equipment within the booth so that eddies would not transport dust out of the booth. Although the downflow provided by the
Draft EPHB Report No. 356-16a
Page vi
fan-powered filters appeared to effectively control worker dust exposure, maintenance of this system may become problematic as pressure loss across the filters could not be accurately measured to determine when filters need to be changed.
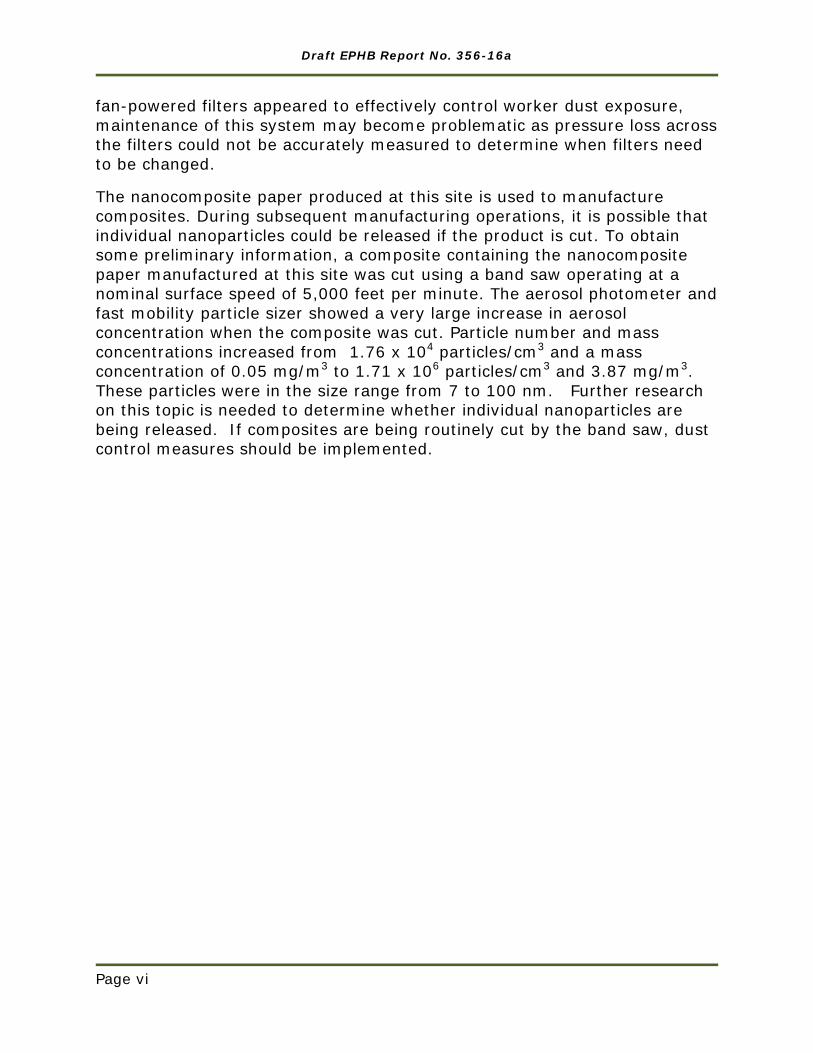
The nanocomposite paper produced at this site is used to manufacture composites. During subsequent manufacturing operations, it is possible that individual nanoparticles could be released if the product is cut. To obtain some preliminary information, a composite containing the nanocomposite paper manufactured at this site was cut using a band saw operating at a nominal surface speed of 5,000 feet per minute. The aerosol photometer and fast mobility particle sizer showed a very large increase in aerosol concentration when the composite was cut. Particle number and mass concentrations increased from 1.76 x 10⁴ particles/cm3 and a mass concentration of 0.05 mg/m3 to 1.71 x 10⁶ particles/cm3 and 3.87 mg/m3. These particles were in the size range from 7 to 100 nm. Further research on this topic is needed to determine whether individual nanoparticles are being released. If composites are being routinely cut by the band saw, dust control measures should be implemented.

Draft EPHB Report No. 356-16a
Page 1
Introduction
Background The purpose of this study, funded by the NIOSH Nanotechnology Research Center (NTRC), is to investigate the effectiveness of control measures used by nanomaterial manufacturers. This site survey was conducted by NIOSH researchers from the Engineering and Physical Hazards Branch (EPHB).
EPHB researchers are focused on hazard control, specifically the control of worker exposure to air contaminants, and this report addresses the findings from their measurements. Potential risks associated with nanoparticle exposure from toxicological research of engineered nanomaterials have been reported [Buzea et al., 2007; ISO, 2008; European Agency for Safety and Health at Work, 2009; Safe Work Australia, 2009a]. Consequently, workplace controls have been recommended to prevent or minimize exposure to engineered nanomaterials [Safe Work Australia, 2009b]. At this site, ventilation measurements and real-time instruments were used to monitor nanoparticle emissions from the tasks and processes and to assess the ability of ventilation to control the emission of nanomaterials into the workplace air. This report presents results and findings that address the control of worker exposure to airborne nanomaterials. The study results will lead to increased understanding and better recommendations for nano-specific engineering controls during manufacturing and handling of nanomaterials in workplaces.
Objectives:
• Evaluate the ability of a ventilated hood and down flow room to control worker exposure to nanomaterials during various operations.
• Investigate the potential for individual nanoparticles to be released when cutting composites made from nanopaper.
Potential Health Effects A review report from the Institute of Occupational Medicine has identified many similarities between asbestos and high aspect ratio nanoparticles (HARN) [Tran et al., 2008]. Asbestos fibers have been classified by the International Agency for Research on Cancer as carcinogenic for humans. This suggests that HARN (e.g., CNTs) could have similar characteristics as pathogenic fibers. From animal in vivo exposure studies and cell-culture-based in vitro experiments, toxicological research on CNTs has shown that these nanomaterials at high doses can contribute to fibrotic lung response, inflammation, and granulomas, and can induce oxidative stress and cellular

Draft EPHB Report No. 356-16a
Page 2
toxicity. Good summary reports of risk assessment of CNTs are available to the public [Kobayashi et al., 2009; Safe Work Australia, 2009a; Nanotechnology Citizen Engagement Organization, 2011].
Based on the conclusions drawn by these toxicological studies, we can readily identify some interesting findings:
(1) Cytotoxicity order: Asbestos, recognized as carcinogenic to humans, has fewer toxicological effects than single-walled CNTs (SWCNTs) but is more toxic than multi-walled CNTs (MWCNTs) [Jia et al., 2005; Murr et al., 2005; Tian et al., 2006; Inoue et al., 2008].
(2) CNT purification: Purified CNTs are more toxic than their unrefined counterparts [Carrero-Sánchez et al., 2006; Wick et al., 2007]. Moreover, the cytotoxicity of purified MWCNTs can be increased to be more toxic than asbestos [Muller et al., 2005].
(3) Surface area and surface chemistry of CNTs: Tian et al. has found that the material with the smallest surface area (SWCNTs in this case) is more toxic than other tested materials [Tian, et al., 2006]. Their results also give a good explanation for the effect of CNT purification: the refining process changes the aggregation state of CNTs and then modifies the surface chemistry.
(4) CNT structure: Long MWCNTs exhibit asbestos-like hazards, but short and tangled MWCNTs do not show any significant toxicity [Poland et al., 2008]. The presumption of the risk associated with long CNTs is that macrophages cannot completely engulf (or phagocytose) long fibers to clear them from tissues; however, effective phagocytosis is completed for short or tangled CNTs to clear them through the lymphatic system [Kostarelos, 2008].
Due to their high demand and wide market applications, the rate or incidence of adverse effects on occupational safety and health from exposure to CNTs could potentially increase. In 2008, the U.S. Environmental Protection Agency (EPA) formally issued a notice to CNT manufacturers to show its intention to consider CNTs as new chemicals and therefore potentially subject to regulation under the Toxic Substances Control Act (TSCA). Meanwhile, NIOSH provided interim guidance about specific medical screening for workers exposed to engineered nanoparticles including SWCNTs [NIOSH, 2009].
Nano graphene platelets (NGP) are new types of nanoparticles made from graphite, and their typical dimensions are 0.34−100 nm in thickness and 0.5−20 µm in length. NGPs are similar to carbon nanotubes (CNTs), but

Draft EPHB Report No. 356-16a
Page 3
their thermal/mechanical properties and characteristics are superior to other carbon-based nanomaterials [Jang & Zhamu, 2008; Rafiee et al., 2009]. Some promising applications of NGPs have been reported including storage of hydrogen for energy production [Heine et al., 2004], composite thin films as electrical conductors [Watcharotone et al., 2007], and electrodes for lithium ion batteries [Cheekati et al., 2010].
Some research has been done for NGP applications in biosensing, drug delivery, and biological imaging, but the toxicological data on NGPs or NGP composites are limited. A research group conducted a long-term in vivo study of nanographene sheets intravenously administered to mice at 20 milligram per kilogram (mg/kg) for 3 months [Yang et al., 2011]. The results showed that nanographene sheets did not cause appreciable toxicity to the treated mice. These nanomaterials accumulated in the liver and spleen and were gradually cleared by excretion.
Published Regulations Currently, no regulatory occupational exposure limit (OEL) for engineered nanomaterials exists. The OSHA 8-hour time-weighted average (TWA) Permissible Exposure Limit (PEL) and the ACGIH Threshold Limit Value (TLV) for carbon black is 3.5 milligrams per cubic meter (mg/m3) [OSHA; ACGIH, 2011]. In the British Standards Institute guide [BSI, 2007], a benchmark exposure level (BEL) of 0.01 fiber per milliliter (fiber/mL) for insoluble fibrous nanomaterials (such as carbon nanotubes and nanowires) has been recommended.
In the absence of governmental or consensus guidance on exposure limits, some manufacturers have developed suggested OELs for their products. For example, Bayer has established an OEL of 0.05 mg/m3 for Baytubes® (multiwalled CNTs) [Bayer MaterialScience, 2010]. For Nanocyl CNTs, the no-effect concentration in air was estimated to be 2.5 μg/m³ for an 8 hr/day exposure [Nanocyl, 2009]. NIOSH is considering a recommended exposure limit of 7 µg/m3 for carbon nanotubes [NIOSH, 2010].

Draft EPHB Report No. 356-16a
Page 4
Plant Description
Manufacturing Processes The study site is a small business with fewer than 10 employees. Their main product is a thin, paper-like membrane of carbon nanotubes, nanofiber, nanoplatelets and/or other carbon nanomaterial supplied by various manufacturers. This product is termed a nanocomposite paper. By optimizing the formulation, properties of interest such as conductivity, handleability, thickness, weight, and other properties can also be customized to meet end-user requirements. At this facility, the materials are combined into a liquid suspension. The liquid suspension is carried to a production room where the customized sheets of carbon-membrane are prepared.
The dry, individual components are quantitatively transferred to a beaker on a weighing scale. This scale is in the back of a ventilated hood. Typically, a 2.5 liter beaker is used. To read the scale, the hood ventilation is momentarily turned off, because air movement affects the accuracy of the scale. Solid ingredients in plastic bags or bottles are set in the hood and opened. A scoop is used to transfer the specified mass of various ingredients to the beaker. The total volume of material transferred to the beaker is about 1 liter. Then, a volatile solvent is added to suppress aerosol generation. The beaker is taken out of the hood; more solvent is added to the wet material which has the appearance of a slurry or paste. The wet handling of the nanomaterials is a process choice which should suppress dust emissions during subsequent handling outside of the hood. Finally, the beaker is transferred to the production room.
Control Measures
(1) Downflow Room Handling dry nanomaterials is restricted to the downflow room. Generally, dry powders are stored in closed containers, and these containers are opened and closed in ventilated hood where the nanomaterials are gravimetrically transferred to a beaker. The room is 14 feet wide and 28 feet long and 9 feet high. As illustrated in Figure 1, the exhaust air flow for this is room is provided by a laboratory hood that has an exhaust volume of 1100 cubic feet per minute (cfm). Because this room does not have provisions for make-up air, the owners believe that make-up air will enter this system through leakage as the plenum is not tightly constructed.

Draft EPHB Report No. 356-16a
Page 5
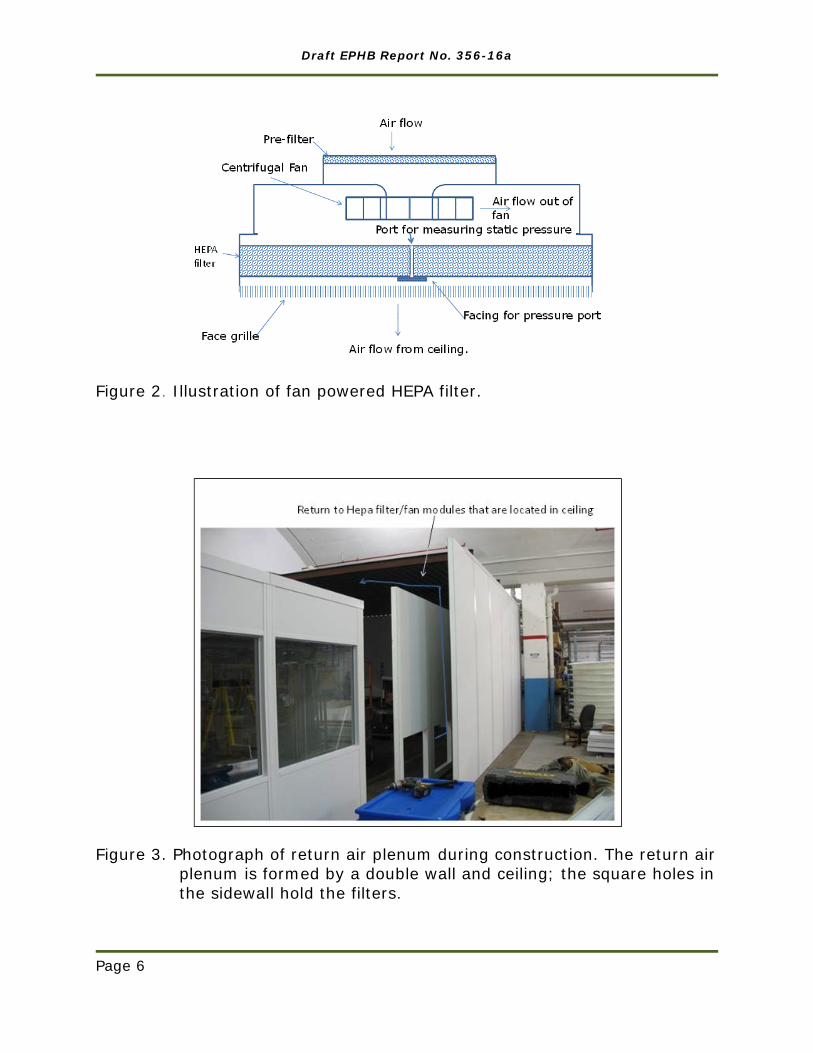
The ceiling is divided into panels that are 2 feet by 4 feet. There are 7 rows of 7 panels, and 36 of these panels are fan-powered HEPA filters (Model No.SAM 24 MS GS, Clean Rooms International). As shown schematically in Figure 2, these fan-powered HEPA filters recirculate 19,000 cfm of air through the room. In this unit, air is drawn through a prefilter just upstream of the fan, and the fan pushes air through a HEPA filter. The unit is capable of air flows from 340 to 640 CFM. Based upon the manufacturer’s drawings, each fan requires 185 watts of electrical power, which, as discussed in the Appendix, increases the room temperature. The flow rate is controlled electronically. The air flow is not uniformly distributed across the filter outlet per manufacturer’s verbal comments. The port for measuring static pressure is plugged with a screw and a grommet. The air flow for this room is exhausted through 7 filters located in the wall, beneath a perforated work bench. The air flow is returned to the fan-powered HEPA filters through the plenum that is pictured in Figure 3. This return air plenum is formed using double wall construction for the ceiling and side wall.
Figure 1. Side view of the downflow room with directional laminar flow ventilation used in the facility.
Draft EPHB Report No. 356-16a
Page 6
Figure 2. Illustration of fan powered HEPA filter.
Figure 3. Photograph of return air plenum during construction. The return air plenum is formed by a double wall and ceiling; the square holes in the sidewall hold the filters.

Draft EPHB Report No. 356-16a
Page 7
Figure 4. Fan-powered HEPA filters in relationship to the downflow room layout. Some of the metal ceiling panels contained lights while other panels are removable to provide access to the plenum above the room.
(2) Ventilated Hood As shown in Figures 1 and 4, the ventilated hood is located in the middle of the perforated bench. The hood details are included in Figure 5 (Xpert Filtered Balance system, Labconco, Kansas City, Missouri). The face of the hood is usually partially closed so that the worker inserts objects and hands through an opening that is 8 inches by 34 inches. This unit includes a fan that exhausts air through slots in the back of the hood and discharges air through HEPA filters towards the ceiling of the room. Thus, the air from this unit is re-circulated. The manual for this hood specifies a preventative maintenance plan and periodic filter changes.

Draft EPHB Report No. 356-16a
Page 8
Figure 5. Side view of ventilated hood used for weigh-out and other activities.
The hood is located in accordance with the product manual recommendations to avoid:
1. High traffic areas where walking might cause an air disturbance or be a nuisance to balance readings.
2. Overhead or wall HVAC diffusers, fans, radiators or other lab equipment producing air currents.
3. Next to doorways or windows that may be opened.
As shown in Figure 4, the hood is positioned below a section of the ceiling that does not have a fan-powered unit. As documented later, smoke tubes were used to determine whether eddies might transport air contaminants into the worker’s breathing zone.

Draft EPHB Report No. 356-16a
Page 9
When hoods, as exemplified by Figure 5, are used to control worker air contaminant exposures, air flow around a worker can cause wakes. These wakes can recirculate air into the worker breathing zone, and these wakes can elevate worker exposure to air contaminants [ACGIH, 2010]. This exposure scenario happens when air flows from behind the worker into an exhaust take-off. Air can be supplied from the ceiling to minimize the formation of these wakes. ACGIH notes that supply air velocities of under 50 fpm can provide effective air contaminant control when coupled with a local exhaust ventilation hood.
Several researchers have supplied air from the ceiling to help control dust exposures at powder weigh-out booths. Floura and Kremer [2008] evaluated a booth that had about 100 fpm of makeup air supplied from the ceiling and exhausted from the lower half of the back of the booth. They reported that exposures were reduced from 2200 to less than 2 µg/m3. In another study of powder weigh-out, Heinonen et al [1996] used local exhaust ventilation at table level and air supplied from the ceiling, directly over the worker, at a velocity of 35 fpm (0.18 m/sec). As a result, worker dust exposure was reduced from 42 to 0.08 mg/m3, a reduction of 99.8%. Clearly, supply air arrangements that avoid creating recirculation zones around the worker are an important aspect of dust control. The available literature suggests that ceiling air flows of 35-100 fpm can be used to suppress the generation of eddies that elevate worker dust exposure.
Methodology
Ventilation Measurements Smokes tubes (Gastec model no. 9501) were used to trace air flow patterns around the weigh-out hood and in the downflow room. The smoke movement was recorded as observations. The air flow around the hood was examined for eddies and recirculation zones that could transport air contaminants out of the hood and into the worker’s breathing zone.
Air velocities were measured using a hotwire anemometer (Velocicalc plus model 8386, TSI Inc, Shoreview MN). These measurements were made by placing the anemometer at the hood face and recording the velocity. Details for the air flow measurements are listed below:

Draft EPHB Report No. 356-16a
Page 10
1. For the laboratory fume hood (not used for any manufacturing process during data collection), nine air velocity measurements were made that were equally spaced.
2. For the weigh-out hood, seven equally spaced air velocity measurements were made.
3. For each of the 36 fan-powered units in the down flow room, air flow was obtained by using a flow hood (model 8371, TSI, Shoreview, MN) or a hot wire anemometer (Velocicalc plus, TSI, Shoreview, MN) when obstructions prevented the use of the flow hood.
To obtain volumetric air flow, the flow hood which had a face area of 2 by 4 feet was set against the border of the face grill so that all the air flows through this instrument. For some fan-powered HEPA filter units, obstructions prevented the use of the flow hood. In this case, the hot wire anemometer was used to measure filter face velocities. The face grille obstructs the air flow from the fan-powered HEPA filters and causes the air flow to accelerate. Furthermore, the manufacturer noted that the air flow was not uniformly distributed across the filter’s face. Thus, an empirical correction factor is needed to adjust for this air flow acceleration. At five filters, both anemometer and air flow hood measurements were made. For these measurements, a correction factor (CF) was computed: air flow from the flow hood/(8 ft2 X average air velocity from the anemometer). The following formula was used to compute air flow from hot wire anemometer measurements:
𝑎𝑖𝑟 𝑓𝑙𝑜𝑤 = 𝐶𝐹 ∗ 8 𝑓𝑡2 ∗ 𝑎𝑣𝑒𝑟𝑎𝑔𝑒 𝑣𝑒𝑙𝑜𝑐𝑖𝑡𝑦.
Static pressures relative to the downflow room were measured with the Velocicalc plus which incorporates an electronic manometer. For two of the fan powered units, the pressure was measured by inserting a probe in the port shown in Figure 2. To obtain the static pressure in the plenum, the pressure probe was inserted into a hole in the ceiling. To obtain the static pressure at the inlet to the fan, the hose was inserted through the filter. These measurements were conducted this way to avoid drilling holes in the equipment.
Aerosol Measurements Direct-reading instruments used in real-time mode can help identify major emission sources to assess the efficiency of control measures in the nanomanufacturing workplace. They provide continuous measurements of

Draft EPHB Report No. 356-16a
Page 11
concentrations that can be correlated with the specific production equipment and work processes. Because of the lack of established exposure criteria, measurements of number, size, mass, and surface area concentrations of nanomaterials are needed [Mark, 2007]. The instruments used to measure particle concentrations in this survey were the Fast Mobility Particle Sizer (FMPS) spectrometer, Aerodynamic Particle Sizer (APS) spectrometer, and a DustTrak aerosol monitor (Table 1).
Table 1. Direct-reading instruments used in this study
Instrument Name Metrics Specifications FMPS (Model 3091, TSI Inc.)
Number (1) Determining number size distributions with an array of electrometers.
(2) Size range from 5.6 to 560 nm
APS (Model 3022, TSI Inc.)
Number (1) Measuring number size distributions with light-scattering technique.
(2) Size range from 0.5 to 20 µm.
DustTrak (Model 8533, TSI, Inc.)
Mass (1) Single channel basic photometric instrument.
(2) Size range from 0.1 to ~15 µm (size segregated mass fractions for PM1, PM2.5, respirable, PM10 and total) for concentration range from 0.001 to 150 mg/m3.
The three real-time direct-reading instruments (FMPS, APS, and DustTrak) were mounted on a cart. Approximately, a 3-foot length of conductive plastic hose was positioned as described below:
1. During weigh-out in the hood, the hose was positioned near the worker’s face.
2. During grinding operations in the hood, the hose was positioned near the worker’s face.

Draft EPHB Report No. 356-16a
Page 12
3. When strips of composite paper were cut on the table in the downflow room, the hose was positioned near the blade of a manual, swing-arm, guillotine cutter.
4. When a nanoparticle-containing composite paper was cut using a band saw, the hose was positioned near the source.
During the first three measurements, the worker activities during the aerosol measurements were video-taped. The times on the camera and instruments were synchronized to within 1-2 seconds. The videotapes were reviewed to identify the tasks that occurred during exposure peaks. Tasks 1-3 were conducted in the ventilated booth shown in Figure 5. Task 4 took place in a machine shop area without dust control measures.
Results
Ventilation Measurements The air flow patterns in the downflow room are presented in Figure 1. The room ventilation did not appear to create eddies outside of the hood that would transport air contaminants into the breathing zone. When an investigator sat in front of the weigh-out hood, smoke tube traces did not identify wakes or recirculation zones around the individual’s torso. However, some wakes and recirculation zones were observed inside the weigh-out hood as shown in Figure 5.
Based upon face velocities, the following airflows were measured at this facility:
1. The weigh-out booth air flow was 200 cfm. 2. The laboratory fume hood air was 1,100 cfm.
The air flow from the fan-powered supply units is summarized in Figure 6. Thirty-one of the thirty-six units had air flows in excess of 400 cfm that were consistent with manufacturer’s specifications. However, 5 of the units had air flows below 300 cfm, which differed from the manufacturer’s specification. As presented later, the static pressure in the plenum above the room was -0.2 inches of water. If the fan were not functioning, air could flow back into the plenum through these filters. Eliminating the air flows which were less than 300 cfm, the total air flow for the ventilated booth was 19,700 cfm.
The measurements taken with the hot wire anemometer have more variability than the measurements taken with the air flow hood. For

Draft EPHB Report No. 356-16a
Page 13
measurements greater than 400 cfm taken with the flow hood, the coefficient of variation was 0.045. The pooled coefficient of variation for air velocities measured by the velometer was 0.173. For an average of six measurements, the standard error is 0.077. The value of CF used in the computation of air flow from velometer readings was 0.51 with a coefficient of variation of 0.11. Applying propagation of error formulas [NIST, 2010], the coefficient of variation for air flows estimated from hot wire anemometer measurements and CF is estimated to be 0.14. Thus, one could expect air flows obtained from velometer measurements to have errors as large as 30%.
The static pressure measurements made on the two units are summarized in Table 2. The measured static pressures differed noticeably from the manufacturer’s specifications. The objective of making the static pressure measurements was to determine whether the amount of air moved was explained by the pressure losses in the system. The air flows were consistent with manufacturer’s specifications. To access the pressure port on the filter, the grille needed to be removed to insert a probe into the pressure well. If the probe was inserted too far into the hole, the probe could hit the fan as there were only a few inches between the filter and the bottom of the fan. Consequently, an erroneous low pressure reading could be caused by an insertion distance that is too short and/or by possible turbulence.
Figure 6. Air flows (cfm) from fan-powered HEPA filter. The air flow through five of the fan-powered HEPA filters may be reversed because of fan failure and the negative static pressure in the plenum.
473.4, V b 823.0, V 212.3 V, ? 140 ? 610 630
576.8, V b 160.3, V, ? 135 ? 670 b 610
625 b 280, ? b 650 b 635
590 600, P 660 650 650 650 650
645.8, V b 660 b 665 b 667.5, V
635 b 615 b 650, P b 720.9, V
b 555 600 677.6, V 600 630 640
b – metal ceiling panel. V - air flow volume estimated from filter face velocities (cfm).? – air flow could be reversed due to fan failure.
P – location of static pressure measurements reported in Table 2.

Draft EPHB Report No. 356-16a
Page 14
Table 2. Static pressures (inches of water) relative to the room.
Location Measured pressure
loss
Expected pressure
losses from manufacturer
Comment
Upstream of HEPA filter at 590-670 cfm
0.3 0.55 to 0.6
Discrepancy between manufacturer’s data and measurement may be due to turbulence or, perhaps, an inadequate insertion depth.
Pressure at fan inlet -0.25
Plenum static pressure -0.2
The manufacturer was concerned that this was too high as it would limit air flow provided by the fan powered HEPA filter. However, the filter at the inlet to the plenum appeared to be more substantial than the prefilters, causing additional pressure loss.
Pressure loss across fan prefilter
0.05 0.15 to 0.2
One could see through the filters. These may not be the filters specified by the manufacturer.
Aerosol Measurement
Weigh-out Hood
Table 3 summarizes aerosol concentration during powder weigh-out. During powder stirring, the mass concentration measured with the Dustrak increased to 0.024 mg/m3 from a background concentration of 0.002 mg/m3. This higher mass concentration is probably due to the generation of mist droplets that contain solvent and solid particles. This mist generation would produce sizes that are too large to detect by the FMPS. All other measurements did not differ noticeably from background concentration measurements. In Table 3, the particle number concentration during stirring was 13 particles/cm3 versus 16 particles/cm3 during background

Draft EPHB Report No. 356-16a
Page 15
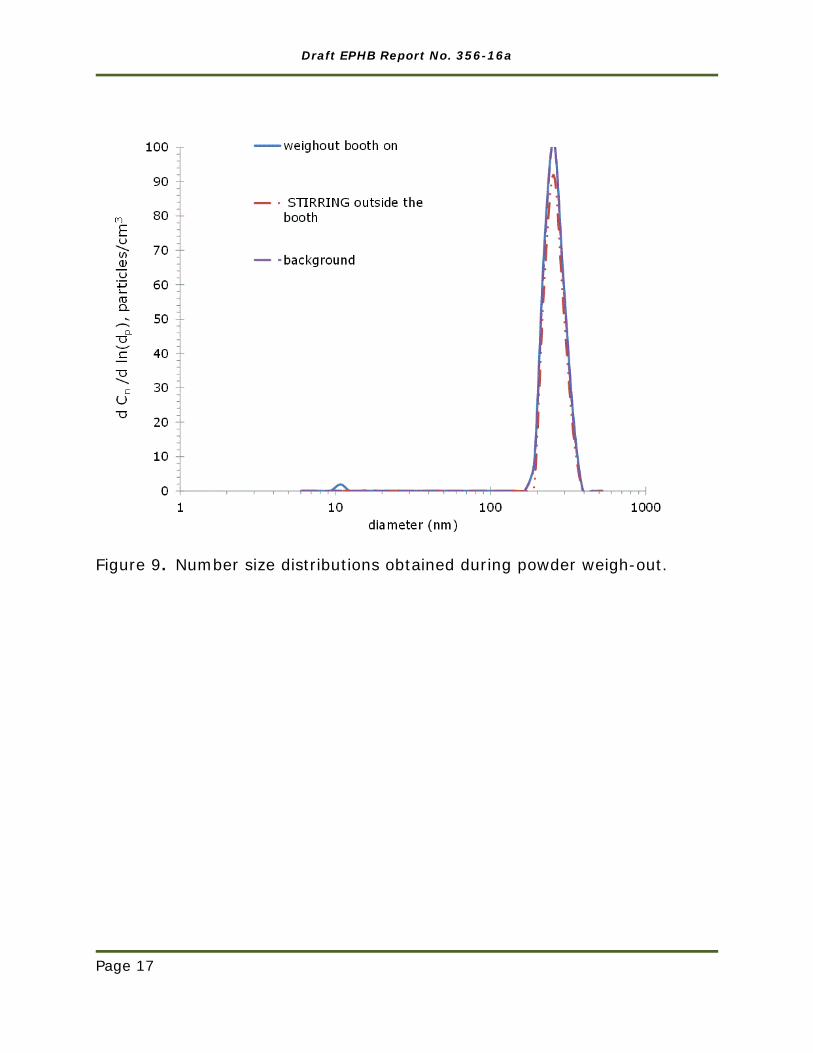
measurements. This difference is probably due to statistical fluctuations in concentration. Figures 7−9 plot mass and particle number concentration as a function of time. Most of the time, concentrations were at background levels with some sharp, noticeable concentration peaks that were typically less than 0.1 mg/m3. Worker motion may pull some aerosol out of the hood. Generally, the mass concentrations were below 0.1 mg/m3. As shown in Figure 9, the size-dependent number concentrations did not differ from background measurements.
Table 3. Average concentrations during powder weigh-out.
Activity Total mass concentration from DustTrak [mg/m3]
Particle number concentration from FMPS [particles/cm3]
Background 0.002 16
Weigh-out 0.002 17 Stirring outside of booth 0.024 14

Draft EPHB Report No. 356-16a
Page 16
Figure 7. Mass concentration during powder weigh-out with hood ventilation on.
Figure 8. Particle number concentration during powder weigh-out with the hood ventilation on.
Draft EPHB Report No. 356-16a
Page 17
Figure 9. Number size distributions obtained during powder weigh-out.
Draft EPHB Report No. 356-16a
Page 18
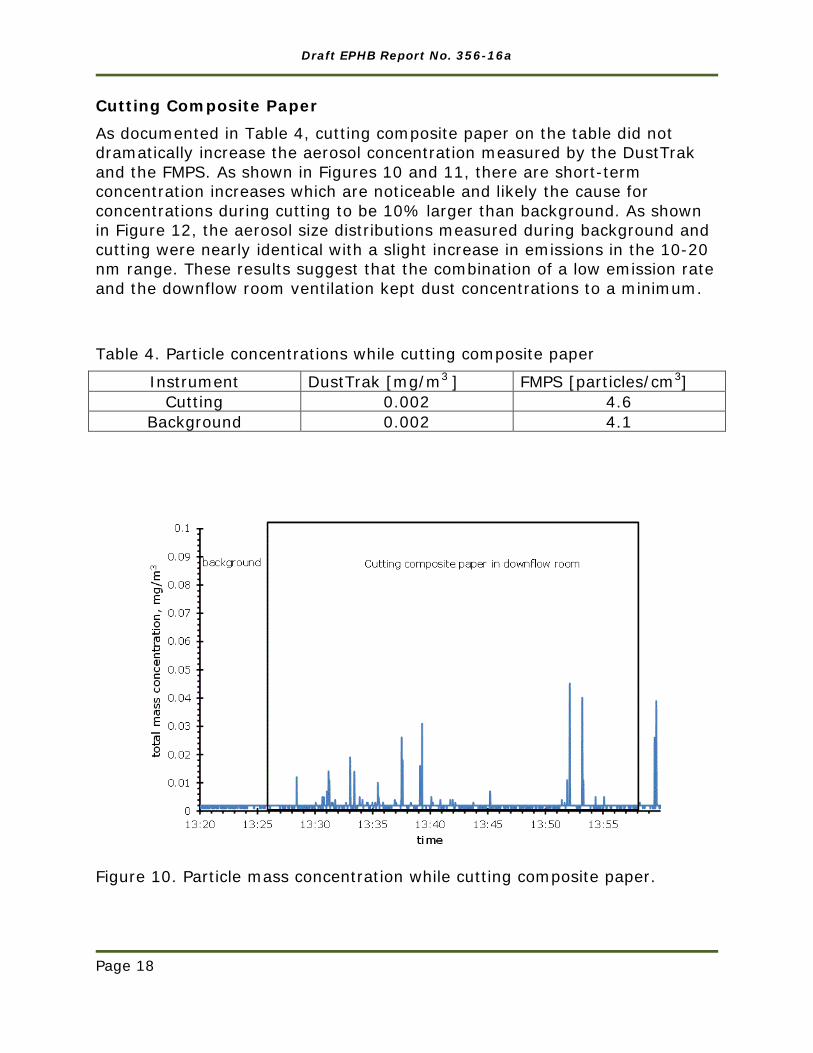
Cutting Composite Paper
As documented in Table 4, cutting composite paper on the table did not dramatically increase the aerosol concentration measured by the DustTrak and the FMPS. As shown in Figures 10 and 11, there are short-term concentration increases which are noticeable and likely the cause for concentrations during cutting to be 10% larger than background. As shown in Figure 12, the aerosol size distributions measured during background and cutting were nearly identical with a slight increase in emissions in the 10-20 nm range. These results suggest that the combination of a low emission rate and the downflow room ventilation kept dust concentrations to a minimum.
Table 4. Particle concentrations while cutting composite paper
Instrument DustTrak [mg/m3 ] FMPS [particles/cm3] Cutting 0.002 4.6
Background 0.002 4.1
Figure 10. Particle mass concentration while cutting composite paper.

Draft EPHB Report No. 356-16a
Page 19
Figure 11. Number concentration while cutting composite paper.
Figure 12. Manual cutting of composite paper.

Draft EPHB Report No. 356-16a
Page 20
Grinding Composite Paper inside the Hood
The cut composite paper was recycled using a grinder located in the weigh-out hood (Figure 5). As shown in Table 5, the operation of the grinder did not markedly increase aerosol concentrations. In Figure 13, the operation of the grinder did not noticeably affect the particle number concentrations. As documented in Figure 14, some activities caused transient increases in concentration measured by the DustTrak. Somewhat energetic worker motions appeared to cause noticeable emissions. Transferring material in and out of the hood will likely drag some airborne dust out of the hood. The aerosol size distribution measured in the worker’s breathing zone was unaffected by the operation of the grinder. Figure 15 shows that grinding within the hood did not affect size-dependent particle number concentration.
Table 5. Aerosol concentrations during grinding in the hood.
Instrument DustTrak (mg/m3) FMPS (particles/cm3) Average during grinding 0.002 3.4
Background 0.002 5.6
Figure 13. Grinding in the hood.

Draft EPHB Report No. 356-16a
Page 21
Figure 14. Operating grinder in the hood.
Figure 15. The observed aerosol size distributions during grinding.

Draft EPHB Report No. 356-16a
Page 22
Cutting Composite with Bandsaw
The composite material was cut with an unventilated bandsaw that had a nominal surface speed of 5,000 fpm. As shown in Table 6, cutting the composite caused relatively high particle mass and number concentrations. Figure 16 presents aerosol concentrations plotted as a function of time. Particle number and mass concentrations appeared to quickly jump from a background of 1.76 x 10⁴ particles/cm3 and a mass concentration of 0.05 mg/m3 to 1.71 x 10⁶ particles/cm3 and 3.87 mg/m3. The band saw induces much air motion, and this motion disperses the contaminants throughout the facility. As shown in Figure 17, the dust concentration increased in the 7 to 100 nm range with three modes at about 10, 20, and 30 nm.
High speed cutting and grinding operations generate ultrafine aerosols (particles smaller than 100 nm) [Maynard & Zimmer, 2002]. In addition, it was found that a granulator used for size reduction of plastic parts also produced very high concentrations of particles smaller than 100 nm [Raynor et al., 2012]. The granulator involves rotating knives that are used for particle size reduction. In both studies, there was a mode in the observed size distribution at about 10-20 nm. High surface speeds can involve frictional heating. For example, the frictional forces involved in grinding may result in surface temperatures in excess of 550◦C [Zarudi & Zhang, 2002]. This suggests that thermal decomposition is also a possibility.
Table 6. Particle concentrations measured before and during cutting the composite with a band saw.
Instrument DustTrak [mg/m3] FMPS [particles/cm3]
Cutting 3.87 1.71 x 10⁶ Background 0.05 1.76 x 10⁴

Draft EPHB Report No. 356-16a
Page 23
Figure 16. Cutting composites with a band saw.
Figure 17. Cutting the composite with a band saw increased the particle num- ber concentration in the 7-100 nm range [modes of 10, 20, and 30 nm.]

Draft EPHB Report No. 356-16a
Page 24
Conclusions and Recommendations
Air Contaminant Control in the Downflow Room The ventilation in the downflow room appears to create a relatively good environment for handling dry nanomaterials. The available literature suggests that supplying air from the ceiling at air velocities between 35 and 100 fpm should minimize the formation of wakes caused by the flow of air around workers that are positioned in front of hoods. Such wakes were not found when an individual was seated at the hood illustrated in Figure 5. In addition, this room appeared to minimize the formation of wakes which can transport dust particles out of the hood. The workers handle material in the back of the hood to avoid wakes. During routine operations, some dust particles will escape from the hood as the worker’s hands and arms move out of the hood. However, during weighing operations and during the operation of the grinder, air contaminant concentrations did not increase as summarized in Tables 3 and 5.
Before the nanomaterials were removed from the hood shown in Figure 5, the nanomaterials were suspended in a thick paste or slurry. Additional solvent was added outside of the hood. As summarized in Table 3 and Figure 8, this activity did not cause an increase in the particle number concentration as measured by the FMPS. However this caused the particle mass concentration to increase from 0.002 to 0.02 mg/m3. Apparently there was a slight increase in the response of the aerosol photometer to aerosol suspended by adding solvent and stirring. This aerosol is likely to be a combination of agglomerated materials and solvent with a particle size larger than 0.5 µm which is too large to be detected by the FMPS. Consequently, stirring the mixture did not increase the number concentration of particles detected by the FMPS (see Figure 8).
In applying the fan-powered HEPA filters to create a downflow room illustrated by Figure 1, the practical issue of maintenance needs to be addressed:
Maintenance of fan-powered HEPA filter units. The cost of replacing the filters is not trivial. HEPA filters cost more than $350 per unit, so replacing 36 filters would exceed $12,600. Furthermore, lost production time may be an issue. Thus, users will only replace the HEPA filters when needed. As debris accumulates in the HEPA filters, air flows will decrease. Air flows could also decrease due to fan failure. Thus, there is a need to periodically check air flows. Monitoring the pressure loss across the filters and the fan’s static pressure is often used to monitor airflows and to determine when filters

Draft EPHB Report No. 356-16a
Page 25
need to be changed. Measuring the pressure loss across the HEPA filter (essentially the static pressure at the outlet of the fan) was awkward and the static pressure measurements may have been affected by turbulence that caused an inaccuracy. As reported by the manufacturer, the configuration of the fan described in Figure 2 may cause fan system effects due to an inefficient fan discharge. This complicates the relationship between air flow and measured fan static pressure. (During ventilation system design, fan system effects are addressed as an additional pressure loss that cannot be measured [ACGIH, 2010].) More convenient provisions for monitoring the air flow provided these fan-powered HEPA filters should be built into the product by the manufacturer. These measurements are needed to determine when the filters need to be changed.
Cutting Composite with Bandsaw Using a bandsaw to cut composite containing nanomaterials increases the ultrafine aerosol concentration by two orders of magnitude in the 7 to 30 nm range. Particle number concentrations exceeded 106 particles/cm3. Electron microscopy is needed to determine whether this aerosol involves individual nanoparticles or small pieces of composite that contain nanomaterials. Because the band saw had a nominal speed of about 5,000 feet per minute, frictional heating may also cause some thermal decomposition. These data show that cutting composites at relatively high tool speeds can generate ultrafine aerosol that may contain nanomaterials.
Manual paper cutting and the use of a band saw to cut composites resulted in grossly different emissions and concentrations. The difference may be explained by the mechanical energy involved in the cutting process. Further research should seek to understand how tool speed and mechanical energy affects size-dependent particle emission rates.

Draft EPHB Report No. 356-16a
Page 26
References
ACGIH. (2010). Industrial ventilation: a manual of recommended practice for design (27th ed.). Cincinnati, Ohio.: American Conference of Governmental Industrial Hygienists.
ACGIH. (2011). TLVs and BEIs: threshold limit values for chemical substances and physical agents and biological exposure indices. Cincinnati, OH: American Conference of Governmental Industrial Hygienists.
Bayer MaterialScience. (2010). Occupational exposure limit (OEL) for Baytubes defined by Bayer MaterialScience. Leverkusen, Germany: Bayer MaterialScience.
BSI. (2007). Nanotechnologies - Part 2: Guide to safe handling and disposal of manufactured nanomaterials. PD 6699-2:2007: British Standards Institute.
Buzea, C., Blandino, I. I. P., & Robbie, K. (2007). Nanomaterials and nanoparticles: Sources and toxicity. Biointerphases, 2(4), MR17-MR172. doi: Doi 10.1116/1.2815690
Carrero-Sánchez, J. C., Elías, A. L., Mancilla, R., Arrellín, G., Terrones, H., Laclette, J. P., & Terrones, M. (2006). Biocompatibility and Toxicological Studies of Carbon Nanotubes Doped with Nitrogen. Nano Letters, 6(8), 1609-1616.
Cheekati, S. L., Xing, Y., Zhuang, Y., & Huang, H. (2010). Nano-graphene platelets and their composites for Li-ion batteries. Paper presented at the 218th ECS Meeting, Las Vegas, Nevada.
European Agency for Safety and Health at Work. (2009). Literature review: workplace exposure to nanoparticles. 89 pages.
Floura, H., & Kremer, J. (2008). Performance verification of a downflow booth via surrogate testing. Pharmaceutical Engineering, 28(6), 9 pp.
Heine, T., Zhechkov, L., & Seifert, G. (2004). Hydrogen storage by physisorption on nanostructured graphite platelets. Phys. Chem. Chem. Phys, 6, 980-984.
Heinonen, K., Kulmala, I., & Saamanene, A. (1996). Local exhaust ventilation for powder handling-combination of local supply and exhaust air. AIHA Journal 57, 356-364.
Inoue, K., Takano, H., Koike, E., Yanagisawa, R., Sakurai, M., Tasaka, S., Ishizaka, A., & Shimada, A. (2008). Effects of Pulmonary Exposure to Carbon Nanotubes on Lung and Systemic Inflammation with Coagulatory Disturbance Induced by Lipopolysaccharide in Mice. Experimental Biology and Medicine, 233(12), 1583-1590. doi: Doi 10.3181/0805-Rm-179

Draft EPHB Report No. 356-16a
Page 27
ISO. (2008). Nanotechnologies -- Health and safety practices in occupational settings relevant to nanotechnologies. ISO/TR 12885:2008: International Organization for Standardization.
Jang, B. Z., & Zhamu, A. (2008). Processing of nanographene platelets (NGPs) and NGP nanocomposites: a review. J Mater Sci, 43, 5092-5101.
Jia, G., Wang, H. F., Yan, L., Wang, X., Pei, R. J., Yan, T., Zhao, Y. L., & Guo, X. B. (2005). Cytotoxicity of carbon nanomaterials: Single-wall nanotube, multi-wall nanotube, and fullerene. Environmental Science & Technology, 39(5), 1378-1383. doi: Doi 10.1021/Es048729l
Kobayashi, N., Ogura, I., Gamo, M., Kishimoto, A., & Nakanishi, J. (2009). Risk Assessment of manufactured nanomaterials - Carbon Nanotubes (CNTs). New Energy and Industrial Technology Development Organization, 46 pages.
Kostarelos, K. (2008). The long and short of carbon nanotube toxicity. Nature Biotech, 26(7), 774-776.
Mark, D. (2007). Occupational exposure to nanoparticles and nanotubes. In R. E. Hester & R. M. Harrison (Eds.), Nanotechnology: consequences for human health and the environment (pp. 50-80): RSC Publishing.
Maynard, A. D., & Zimmer, A. T. (2002). Evalution of grinding aerosols in terms of alveolar dose: the significance of using mass, surface area, and number metrics. Ann. Occupa. Hyg., 46(Supplement 1), 315-319.
Muller, J., Huaux, F., Moreau, N., Misson, P., Heilier, J. F., Delos, M., Arras, M., Fonseca, A., Nagy, J. B., & Lison, D. (2005). Respiratory toxicity of multi-wall carbon nanotubes. Toxicology and Applied Pharmacology, 207(3), 221-231. doi: DOI 10.1016/j.taap.2005.01.008
Murr, L. E., Garza, K. M., Soto, K. F., Carrasco, A., Powell, T. G., Ramirez, D. A., Guerrero, P. A., Lopez, D. A., & Venzor III, J. (2005). Cytotoxicity assessment of some carbon nanotubes and related carbon nanoparticle aggregates and the implications for anthropogenic carbon nanotube aggregates in the environment. Int J Environ Res Public Health, 2(1), 31-42.
Nanocyl. (2009). Resonsible care and nanomaterials case study Paper presented at the European Responsible Care Conference, Prague. www.cefic.be/Files/Downloads/04_Nanocyl.pdf
Nanotechnology Citizen Engagement Organization. (2011). Carbon nanotubes, carbon nano fibers, graphene, from http://www.nanoceo.net/nanorisks/carbon-nanotubes.
NIOSH. (2009). Current Intelligence Bulletin 60: Interim Guidance for Medical Screening and Hazard Surveillance for Workers Potentially Exposure to Engineered Nanoparticles. (DHHS (NIOSH) Publication NO. 2009-16).
Draft EPHB Report No. 356-16a
Page 28
NIOSH. (2010). NIOSH Current Intelligence Bulletin: Occupational Exposure to Carbon Nanotubes and Nanofibers (DHHS (NIOSH) Publication No. 2010-XXX (draft)). Retrieved from http://www.cdc.gov/niosh/docket/review/docket161A/.
OSHA. Standards - 29 CFR PART 1910 Occupational Safety and Helth Stanards: Occupational Safety & Health Adminstration.
Poland, C. A., Duffin, R., Kinloch, I., Maynard, A., Wallace, W. A. H., Seaton, A., Stone, V., Brown, S., MacNee, W., & Donaldson, K. (2008). Carbon nanotubes introduced into the abdominal cavity of mice show asbestos-like pathogenicity in a pilot study. Nature Nanotechnology, 3(7), 423-428. doi: DOI 10.1038/nnano.2008.111
Rafiee, M., Rafiee, J., Wang, Z., Song, H., Yu, Z. Z., & Korakar, N. (2009). Enhanced mechanical properties of nanocomposites at low graphene content. ACS Nano, 3(12), 3884-3890.
Raynor, P. C., Cebula, J. I., Spangenberger, J. S., Olson, B. A., Jean, M., Dach, J. M., & D'Arcy, J. B. (2012). Accessing potential nanoparticle release during nanocomposites shredding using direct-reading instruments. J. Occupational and Environmental Hygiene, 9, 1-13.
Safe Work Australia. (2009a). Engineered nanomaterials: a review of the toxicology and health hazards. 163 pages.
Safe Work Australia. (2009b). Engineered Nanomaterials: Evidence on the Effectiveness of Workplace Controls to Prevent Exposure. 75 pages.
Tian, F. R., Cui, D. X., Schwarz, H., Estrada, G. G., & Kobayashi, H. (2006). Cytotoxicity of single-wall carbon nanotubes on human fibroblasts. Toxicology in Vitro, 20(7), 1202-1212. doi: DOI 10.1016/j.tiv.2006.03.008
Tran, C. L., Hankin, S. M., Ross, B., Aitken, R. J., Jones, A. D., Donaldson, K., Stone, V., & Tantra, R. (2008). An outline scoping study to determine whether high aspect ratio nanoparticles (HARN) should raise the same concerns as do asbestos fibres. Institute of Occupational Medicine (IOM)(54 pages).
Watcharotone, S., Dikin, D. A., Stankovich, S., Piner, R., Jung, I., Dommett, G. H. B., Evmenenko, G., Wu, S. E., Chen, S. F., Liu, C. P., Nguyen, S. T., & Ruoff, R. S. (2007). Graphene-silica composite thin films as transparent conductors. Nano Letters, 7(7), 1888-1892.
Wick, P., Manser, P., Limbach, L. K., Dettlaff-Weglikowska, U., Krumeich, F., Roth, S., Stark, W. J., & Bruinink, A. (2007). The degree and kind of agglomeration affect carbon nanotube cytotoxicity. Toxicol Lett, 168, 121-131.
Yang, K., Wan, J., Zhang, S., Zhang, Y., Lee, S. T., & Liu, Z. (2011). In vivo pharmacokinetics, long-term biodistribution, and toxicology of PEGylated graphene in Mice. ACS Nano, 5(1), 516-522.

Draft EPHB Report No. 356-16a
Page 29
Zarudi, I., & Zhang, L. C. (2002). A revisit to some wheel-workpiece interaction problems in surface. Int. J. Machine Tools Manufacture, 42, 905-913.
Acknowledgements
The authors would like to acknowledge the support and cooperation from the management and staff of the study site.

Draft EPHB Report No. 356-16a
Page 30
Appendix
Estimated temperature increase due to power consumption
The electrical power supply to the room and the recirculation system described by Figure 1 is ultimately converted to thermal energy. A thermal energy balance (thermal energy in =thermal energy out) can be stated as:
𝑃 + 𝑀𝑎𝑖𝑟𝐶𝑝𝑇𝑖𝑛 = 𝑀𝑎𝑖𝑟𝐶𝑝𝑇𝑜𝑢𝑡
Where;
P = electrical power supplied to the room, kilowatts (kW) or kilo-Joules/sec;
Mair = Mass flow of air through the room and recirculation system, Kg/sec; and,.
Cp = heat capacity of air, 1.012 kilo-Joules/kg/°K.
Mair was taken to be the air flow provided the lab hood. In reality, the system did not appear to be very tight, and there are probably other sources of leakage out of the room. In addition, this model neglects heat loss through the walls, ceiling and floors. The term P is a heat generation term and it ignores the metabolic heat generation of about 0.1 kW per person. This is much smaller than the power consumption of the fans which is 6.6 kW (36 fans X 185 watts/fan).
The thermal energy balance can be rearranged to compute the air temperature increase:
∆𝑇 = 𝑇𝑜𝑢𝑡 − 𝑇𝑖𝑛 =𝑃
𝑀𝑎𝑖𝑟𝐶𝑝
The air flow out of the room is 1100 cfm or 0.63 Kg/sec. Thus, the estimated temperature rise is 10 °C.

Delivering on the Nation’s promise: Safety and health at work for all people through research and prevention.
To receive NIOSH documents or other information about occupational safety and health topics, contact NIOSH at
1-800-CDC-INFO (1-800-232-4636)
TTY: 1-888-232-6348
E-mail: [email protected]
or visit the NIOSH Web site at www.cdc.gov/niosh
For a monthly update on news at NIOSH, subscribe to NIOSH eNews by visiting www.cdc.gov/niosh/eNews
SAFER ● HEALTHIER ● PEOPLE
Related Documents