In-Depth Evaluation of the REACHING EVERY DISTRICT APPROACH in the African Region 2007

Welcome message from author
This document is posted to help you gain knowledge. Please leave a comment to let me know what you think about it! Share it to your friends and learn new things together.
Transcript
In‐depth Evalu 007 ation of Reaching Every District Approach, 2
In-Depth Evaluation of the REACHING EVERY DISTRICT APPROACH
in the African Region
2007

In‐depth Evaluation of Reaching Every District Approach, 2007
i
Acknowledgement In 2006, WHO/AFRO invited key partners (WHO/HQ, UNICEF, CDC and USAID's IMMUNIZATIONbasics) to Harare, to discuss how to proceed in responding to a Task Force on Immunization (TFI) recommendation to evaluate the Reaching Every District (RED) approach. We want to express our deepest appreciations to these partners, as the evaluation could not have been possible without their commitment and support. We would wish to thank Government officials, local immunization partners and most importantly, health workers in the nine countries who willingly accepted to be interviewed and to provide needed information. The WHO Country Offices of Benin, Cameroon, DRC, Ethiopia, Ghana, Madagascar, Sierra Leone, Togo and Uganda deserve special mentions for their efforts at organizing and participation in the field visits. We thankfully acknowledge the contributions of all partners who supported the three phases of the workshop– Desk Review, Country Visits and AFRO Report Writing, in particularly, USAID's IMMUNIZATIONbasics, CDC and UNICEF. Your support was invaluable. We also wish to thank our WHO colleagues at the WHO Inter‐country Support Team who spent valuable hours to ensure the success of the evaluation exercise. A core team of partners has worked assiduously to see this evaluation to its completion, and we are grateful to them (see list below). In a major undertaking like this, it is not possible to name all who contributed to its success. Hence, we want to thank all who contributed in one way or another in making this evaluation a success.

In‐depth Evaluation of Reaching Every District Approach, 2007
ii
Core Planning and Reporting Writing Team Rose Macauley, WHO/AFRO Adiele Onyeze, WHO/AFRO Modibo Dicko, WHO/AFRO Matthieu Kamwa, WHO/AFRO Richard Mihigo, WHO/AFRO Bernard Ntsama, WHO/AFRO Rudi Eggers, WHO/Geneva Diana Chang Blanc, WHO/Geneva Bob Davis, UNICEF/ESARO
Karen Wilkins, CDC Margaret Watkins, CDC Tove Ryman, CDC Anupama Tantri, CDC Maureen Kolasa, CDC Patricia Taylor, USAID/IMMbasics Jenny Sequeira, USAID/IMMbasics Michel Othepa, USAID/IMMbasics Natasha Hsi, USAID/IMMbasics Remy Mwamba, USAID/IMMbasics Ellen Dassaboute, USAID/IMMbasics Andrew Medley, USAID/IMMbasics

In‐depth Evaluation of Reaching Every District Approach, 2007
Foreword
iii

In‐depth Evaluation of Reaching Every District Approach, 2007
iv
Acronyms
AFR WHO Africa Region ANC Antenatal Care APRs Annual Progress Reports cMYP comprehensive Multi‐Year Plan CDC United States Centers for Disease Control and Prevention DANIDA Danish International Development Agency DHMT District Health Management Team DQA Data Quality Audit DRC Democratic Republic of the Congo DPT Diphtheria‐ Pertussis‐Tetanus Vaccine EPI Expanded Programme on Immunisation FSP Financial Sustainability Plan GAVI GAVI Alliance, formerly Global Alliance for Vaccines and Immunisation GDP Gross Domestic Product GNI Gross National Income GIVS Global Immunisation Vision and Strategy HepB Hepatitis B HEW Health Extension Worker HF Health Facility Hib Haemophilus Influenza Type B HIPC Highly Indebted Poor Countries HSS GAVI Health Systems Strengthening ICC Inter‐agency Coordinating Committee IEC Information, Education and Communication JRF Joint Reporting Form IMMbasics IMMUNIZATIONbasics project of USAID IMR Infant Mortality Rate ISS GAVI Immunisation Services Support ITN Insecticide Treated Nets MDG Millennium Development Goals MoH Ministry of Health NGO Non‐Governmental Organisation OPV Oral Polio Vaccine PDA Personal Digital Assistant REC Reaching Every Child RED Reaching Every District RI Routine Immunisation TFI African Regional Task Force on Immunisation UNICEF United Nations Children’s Fund USAID United States Agency for International Development WHO World Health Organization
In‐depth Evaluation of Reaching Every District Approach, 2007
v
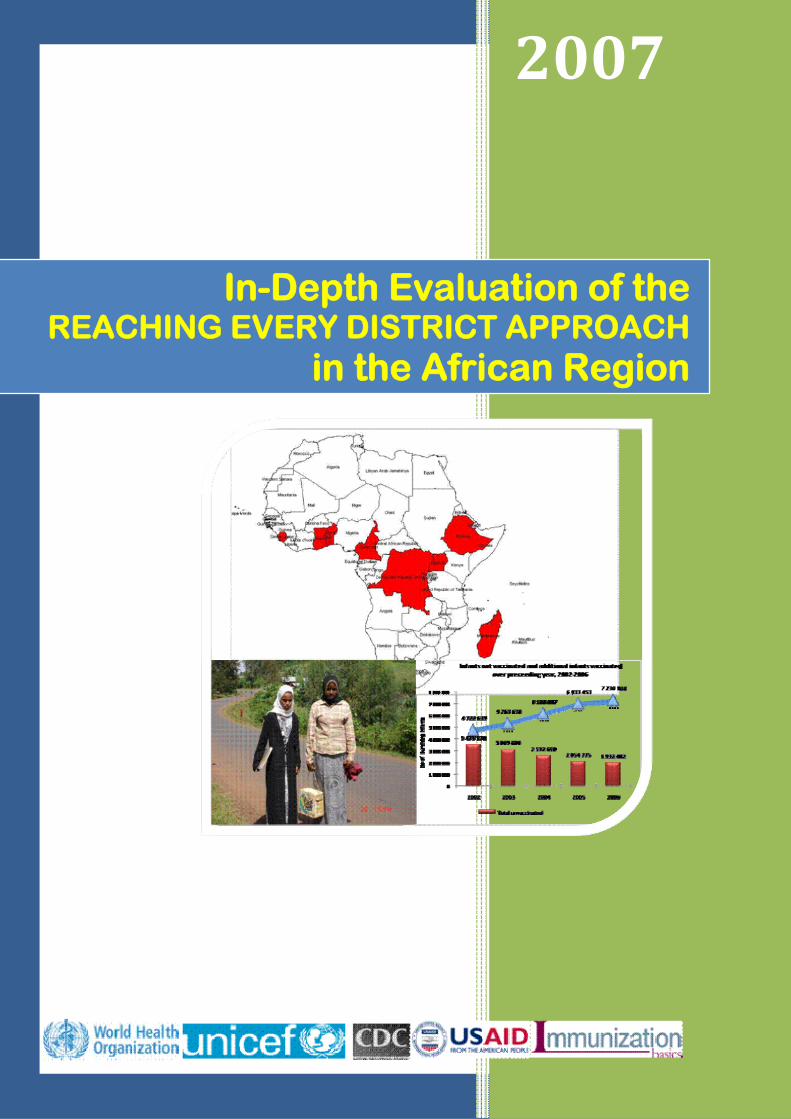
TABLE OF CONTENTS
EXECUTIVE SUMMARY .................................................................................................. 1
1. BACKGROUND ..................................................................................................... 4
2. GOALS AND OBJECTIVES ...................................................................................... 5
3. METHODOLOGY ................................................................................................... 6
4. PROGRAMME CONTEXT ....................................................................................... 8
5. FINDINGS ........................................................................................................... 10
5.1 RED APPROACH INTRODUCTION AND SCALE‐UP ........................................................... 10
5.2 RED COMPONENTS ................................................................................................ 12
5.2.1 PLANNING AND MANAGEMENT OF RESOURCES ......................................................... 12
5.2.2 SUPPORTIVE SUPERVISION ................................................................................... 14
5.2.3 RE‐ESTABLISHING OUTREACH SERVICES ................................................................... 16
5.2.4 LINKING SERVICES WITH COMMUNITIES .................................................................. 18
5.2.5 MONITORING FOR ACTION ................................................................................... 20
5.3 INTEGRATION OF OTHER HEALTH SERVICES WITH ROUTINE IMMUNISATION ........................ 23
5.4 COSTS AND FINANCING OF IMMUNISATION AND THE RED APPROACH ................................ 23
5.5 IMMUNISATION SERVICES: ACCESS AND UTILISATION ..................................................... 26
6. CONCLUSION, KEY LESSONS, RECOMMENDATIONS ........................................... 29
6.1 KEY FINDINGS AND LESSONS LEARNED ........................................................................ 29
6.2 KEY RECOMMENDATION ‐ PARTNERS .......................................................................... 31
6.3 KEY RECOMMENDATIONS ‐ COUNTRIES ....................................................................... 32
ANNEXES .................................................................................................................... 33
ANNEX 1–RED EVALUATION FRAMEWORK ................................................................... 33
ANNEX 2– NUMBER OF DISTRICTS AND HEALTH FACILITIES VISITED BY COUNTRY ........ 34
ANNEX 3 – NINE RED COUNTRY PROFILES .................................................................... 35
BENIN 36
CAMEROON 37
DEMOCRATIC REPUBLIC OF CONGO (DRC) 38
ETHIOPIA 39

In‐depth Evaluation of Reaching Every District Approach, 2007
vi
GHANA 40
MADAGASCAR 41
SIERRA LEONE 42
TOGO 43
UGANDA 44
ANNEX 4 – EVALUATION TEAM MEMBERS BY COUNTRY .............................................. 45
LIST OF TABLES
Table 1: Socio‐demographic Characteristics of Evaluated Countries .............................................. ......8
Table 2: RED Introduction & Scale‐Up Profile ........................................................................................ 10
Table 3: GAVI ISS funding disbursed to countries 2002‐2006 ............................................................... 24
LIST OF FIGURES
Figure 1: Map of Africa Showing Countries Selected for the Evaluation .......................................... ......8
Figure 2: RED Introduction and Scale‐Up .............................................................................................. 11
Figure 3: Surviving Infants in RED Districts ............................................................................................ 12
Figure 4: Percent Involvement of community volunteers in supporting immunisation activities ........ 19
Figure 5: Health Facilities Integrating Services with Routine Immunisation ......................................... 23
Figure 6: GAVI ISS funding – Investment Decisions ............................................................................... 25
Figure 7: DPT and Measles Coverage .................................................................................................... 26
Figure 8: Trend of DPT3 Coverage by District ........................................................................................ 26
Figure 9: Infants Vaccinated and Not Vaccinated with DPT3................................................................ 27

In‐depth Evaluation of Reaching Every District Approach, 2007
1
EXECUTIVE SUMMARY Background
The Reaching Every District (RED) approach emerged from a search for innovative strategies to improve stagnating immunisation coverage. RED focuses on the district as the operational level and includes five components: 1) planning and management of resources; 2) supportive supervision; 3) re‐establishing outreach services; 4) linking services with communities; and 5) monitoring for action. The RED approach addresses the ambitious goals of the Global Immunisation Vision and Strategy (GIVS) and Millennium Development Goal (MDG) #4, which calls for the reduction of child mortality by two‐thirds by 2015. In 2005, the World Health Organization (WHO) and partners conducted a rapid assessment of RED implementation in five countries. This more comprehensive evaluation, conducted in 2007, reviews the status of RED implementation to determine progress toward improving immunisation services and coverage. The evaluation’s results will be used to further strengthen routine immunisation (RI) and sustain past coverage gains.
Methodology
The evaluation was conducted over a one‐year period and carried out in three phases: a desk review, nine country visits, followed by regional analysis and report writing. Twenty‐seven countries provided district coverage data for the desk review. Nine countries, at least one from each of the WHO Africa subregions, were selected from this group for in‐depth evaluation—Benin, Cameroon, Democratic Republic of the Congo (DRC), Ethiopia, Ghana, Madagascar, Sierra Leone, Togo and Uganda. All had implemented RED for at least 24 months and were available during the evaluation period. Standardised questionnaires were used in the nine countries at national, district and health facility levels. A total of 68 districts and 133 heath facilities (HFs) were visited. Country evaluation teams included both international and national team members.
Key findings
Introduction and scaling up of RED. There was considerable variation across countries and districts in their approach to implementation of the five RED components. Countries differed in how quickly they expanded RED, with a few launching nationally and others prioritising and phasing‐in new districts more gradually. By 2006, 90% of districts in the nine countries had introduced RED. All countries introduced RED as a package, but some gave more attention to some components than others. In 80% of districts, outreach was the component mentioned most often by staff in describing what RED meant in their districts. The most notable changes since the introduction of the RED approach, as noted by district staff, were additional outreach sites and community meetings.
Planning and resource management. Annual immunisation plans were available in all countries at the national level, in most districts and in 59% of HFs. Only half of district microplans indicated hard‐to‐reach populations and plans for reaching them. Catchment area maps were found in more than two‐thirds of HFs, but they commonly lacked details such as population, landmarks and hard‐to‐reach populations. Stockouts of measles or Diphtheria-Pertussis-Tetanus (DPT) vaccine occurred within the last year at the district and HF levels in all but one of the nine countries. About half of HFs with a stockout reported having to turn children away from sessions due to stockouts; 24% of facilities cancelled sessions. Training and managerial capacity gaps exist in many districts. Few district or HF staff had received recent immunisation training and the rapid turnover of staff in several countries will result in an increasing proportion of untrained health workers in the future.

In‐depth Evaluation of Reaching Every District Approach, 2007
2
Supportive supervision. The majority (65%) of districts included supervision in their annual work plans. However, only about a third of districts reported receiving supervision visits from the national level in the preceding three months. Visits from districts to HFs facilities occurred more frequently (70% of HFs reported visits in the preceding three months). Supervisory checklists were commonly used (82% of HFs) and supervision of the Expanded Programme on Immunisation (EPI) was integrated with that of other health services in six of the nine countries. While the majority of HFs (78%) reported receiving immediate verbal feedback, written supervisory feedback was documented less often, in only about a third of facilities, as was follow‐up on recommendations. District review meetings occurred in almost all districts, providing opportunities for training which may be under‐utilised for this purpose.
Outreach. District and HF staff identified outreach sessions as a positive contributor to immunisation service delivery. Most countries reported an increase in the number of outreach sessions planned and held since the introduction of RED, and outreach was commonly linked to other maternal and child health interventions. Although a majority (62%) of HFs reported conducting >80% of planned outreach sessions, less than a third of districts were able to show catchment area maps indicating outreach sites. Health facility staff in approximately one‐third of facilities reported that communities were involved in outreach session scheduling. However, staff in approximately one in four districts and facilities reported that they had not yet reached all communities with fixed, outreach or mobile sessions, mostly due to limited transportation and/or inadequate numbers of health personnel. Many districts and facilities combined fixed and outreach session data when reporting to higher administrative levels. This makes analysis of progress and coverage achieved through outreach difficult and creates challenges related to resource allocation.
Community. The community component, found to be among the weakest RED components in 2005, now shows improvement with community volunteers active in all countries, typically assisting with defaulter tracking, outreach and community education. Two‐thirds of HFs reported holding regular meetings with the community, and the majority (74%) of facilities reported that community volunteers had been trained to assist with immunisation activities. Approximately half of HFs with community volunteers reported providing some form of incentive (such as training or transportation re‐imbursement). Increases in the number of community meetings were also reported.
Monitoring for action. Immunisation monitoring charts were displayed in the majority of districts and HFs, and most were correct and up‐to‐date. Health workers in 70% of those facilities with monitoring charts were able to explain their facility’s performance. Ninety‐five percent of districts reported conducting review meetings with their HFs during the past year, at which time immunisation data were discussed. In half of the HFs, staff perceived that denominator estimates, mostly based on census data, were inaccurate. Fewer than half of the HFs had methods other than immunisation registers for tracking defaulters. Although data quality has improved across the countries, the desk review found that problems at district level continue.
Integration. Provision of immunisation with other maternal and child health services was common in HFs and outreach sessions. Interventions reported included Vitamin A supplementation, family planning, antenatal care, bednet distribution, deworming, growth monitoring and curative care.
Financing RED and RI. Countries have used national and district health budgets, WHO and United Nations Children’s Fund (UNICEF) grants, in‐kind support from Non‐Governmental Organisation (NGO) partners and GAVI Immunisation Services Support (ISS) funding to introduce and scale‐up the RED approach. The GAVI Alliance has provided significant new discretionary funding for RI to eight of the nine countries evaluated, funding that most have used to introduce and expand RED. Declining ISS
In‐depth Evaluation of Reaching Every District Approach, 2007
3
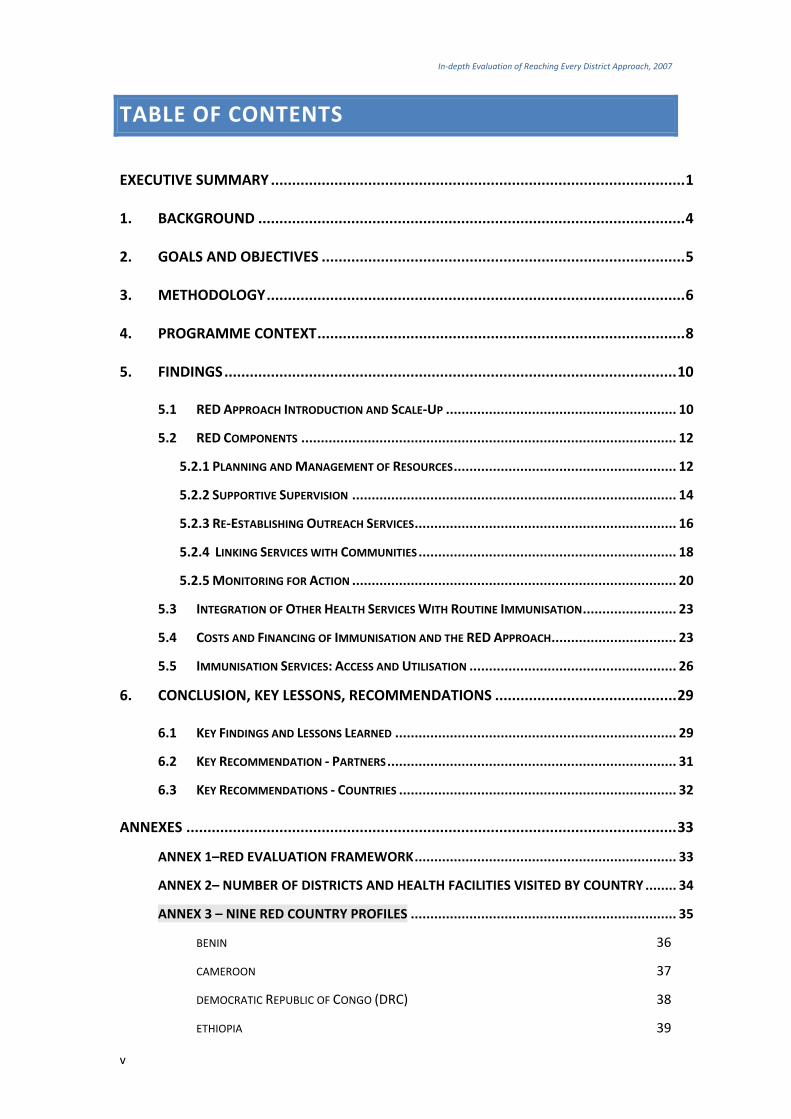
funding in some countries could affect the sustainability of coverage gains, but new sources of support may also be available.
Access and utilisation. Although not necessarily attributable to RED, immunisation coverage increases among the nine countries are encouraging. DPT1 coverage (the principal indicator of access to immunisation services) increased from an estimated 69% of children under one year of age in 2002, to 87% in 2006. Utilisation, as measured by DPT3 coverage, also increased from 57% to 79% over the same period.
Conclusion. Although regional immunisation coverage has increased steadily since 2002, intensified efforts are needed to achieve the ambitious GIVS immunisation coverage goals and the MDG mortality reduction goal. The RED approach can be an important tool for addressing immunisation performance and strengthening the district management of immunisation and other health services.
Recommendations
Building on the many achievements and lessons learned with the RED approach, the evaluation team recommends that the global and regional partners of national immunisation programmes:
1. Revise the RED approach guidelines to include specific standards and indicators for all five RED components.
2. Support a regional or multi‐country forum on RED and RI strengthening to share lessons learned, best practices and challenges.
3. Support countries to document the costs and to advocate for new funding for RI.
4. Support WHO/AFRO’s ongoing efforts to define and determine the impact of integrating immunisation and other priority health services.
5. Under AFRO’s leadership, continue to work across countries to improve the availability and use of reliable district coverage data.
Likewise, the evaluation team recommends that countries and their national immunisation programmes:
1. Keep up the good work in implementing RED, particularly in reinvigorating outreach, improving community linkages and increasing immunisation coverage.
2. Ensure that all districts implementing RED are provided sufficient funding, training and technical support. Advocate with Ministries of Finance and external donors to secure sufficient funding for RI.
3. Systematically assess and address reasons for stockouts. Training of EPI staff should include methods for accurate vaccine forecasting and use of stock management records.
4. Ensure adequate planning for supervision, improved feedback mechanisms and sufficient resources for the transportation and allowances of supervisors. Adequate time for supervision and on‐the‐job training should be a priority.
5. Address barriers to the provision of outreach services to communities; work with districts and facilities to analyse and address the reasons behind why up to one quarter of HFs report that they are failing to reach all of their communities.
6. Evaluate and continue to strengthen linkages between HFs and communities. The opinions of communities and families should guide future changes in immunisation services. Document lessons learned working with community volunteers and develop standard tools for defaulter tracking and community education.
7. Improve the quality of immunisation data and encourage its regular analysis and use. Continue to hold regular review meetings at district level. Report separately on vaccinations given at fixed and outreach sessions and track the integrated delivery of immunisation and other priority services.
In‐depth Evaluation of Reaching Every District Approach, 2007
1. BACKGROUND mmunisation coverage declined or stagnated in the Africa region in the 1990’s. As a result, in 2002, the region accounted for 11 of the estimated 33.4 million children globally who did not receive at least three doses of DPT vaccine by 12 months of age1. To reach these unimmunised
children, partners searched for innovative strategies to improve childhood immunisation coverage. The RED approach was borne out of this search.
IThe RED approach focuses on the district as the operational level and builds capacity at the district, HF and community levels to address common obstacles to routine immunisation (RI). The RED approach emphasizes five components:
• Planning and management of resources
• Supportive supervision
• Re‐establishment of outreach services
• Community links with service delivery
• Monitoring and use of data for action
Beginning in late 2002, countries across Africa were introduced to the RED approach during workshops and technical meetings. Many began the introduction of RED shortly thereafter. Based on its initial success, the strategy has been scaled up and is now being implemented in whole or in part across the WHO Africa Region (WHO/AFR).
The RED approach addresses the ambitious MDG of reducing child mortality by two‐thirds before the end of 2015, and the equally challenging immunisation coverage goals set forth by WHO and UNICEF in the 2005 GIVS. GIVS states that by 2010, all countries will achieve at least 90% national and 80% immunisation coverage in all districts (measured by coverage among infants with three doses of DPT, or DPT3).
Progress towards the GIVS goals has been steady across the 46 AFR countries. In 2006, 15 countries2 reported 90% or higher DPT3 coverage nationally, compared to only eight countries in 2002. Moreover, 14 countries3 reported that 80% of their districts had achieved DPT3 coverage of 80% or higher, again an increase over the nine countries reporting this level of coverage in 2002. Although these achievements are encouraging, if all of the countries in the region are to meet the GIVS and MDGs, it is clear that further efforts will be required to increase and sustain coverage.
In 2005, WHO and its partners conducted a rapid assessment in five countries where the RED approach had been implemented for at least 12 months–DRC, Ethiopia, Kenya, Madagascar, and Zimbabwe. Assessment findings revealed that districts implementing the approach had made significant progress in raising immunisation coverage and that in some cases they were also using RED‐inspired immunisation outreach sessions to deliver other child survival services. The assessment hinted at some of the contextual factors affecting countries, but implementation time was too limited
4
1 Source: WHO/UNICEF coverage estimates 1980‐2006, August 2007 2 Algeria, Benin, Botswana, Burkina Faso, Egypt, Gambia, Malawi, Morocco, Rwanda, San Tome and Principe, Seychelles, South Africa, Tunisia, Tanzania, Zimbabwe – based on WHO‐UNICEF estimates, Joint Reporting Forms 2006. 3 Sao Tome Principe, Rwanda, Burkina Faso, Cape Verde, Niger, Togo, Botswana, Madagascar, Lesotho, Malawi, Mauritius, Mozambique, Seychelles and Zambia.

In‐depth Evaluation of Reaching Every District Approach, 2007
5
at that point and the assessment visits were too brief to draw any major conclusions about the success of the approach or the constraints to its implementation.
The Regional Task Force on Immunisation (TFI) therefore recommended in 2006 that partners conduct a more comprehensive evaluation of the RED approach to explore lessons learned in implementing countries. In response, WHO and key partners (UNICEF, the United States Centers for Disease Control and Prevention [CDC] and the IMMUNIZATIONbasics Project of the United States Agency for International Development [USAID]) met in August 2006 to begin planning for the 2007 evaluation reported in this document.
2. GOALS AND OBJECTIVES ith an aim toward strengthening the RED approach, the general objectives of this evaluation were to review the implementation status of the approach in a sample of AFR countries and to determine country progress toward improving their immunisation
services and coverage. Specifically, the evaluation team set out to document:
W
• the socio‐economic and health system contexts within which immunisation programmes operate
• the degree of implementation of each of the five RED components
• lessons learned, including factors influencing the completeness/effectiveness of RED implementation
• the overall success of the RED approach in improving immunisation services since its introduction in each country
• the costs of sustaining gains made through the RED approach
• the additional childhood interventions that are being delivered with EPI
A set of actionable recommendations for strengthening the RED approach and sustaining past coverage gains was defined from the start as an important product of this evaluation.
In‐depth Evaluation of Reaching Every District Approach, 2007
3. METHODOLOGY his in‐depth evaluation of the RED approach in the Africa Region was conducted over a one‐year period. The evaluation framework (see Annex 1) called attention to the context, processes, outputs and outcomes of the RED approach. All partners contributed to the design
of the fieldwork and the development of the data collection instruments. Evaluation activities were carried out in three phases, which included a desk review, nine country visits, and regional analysis and report writing. Major activities conducted during each of the three phases were as follows:
TPhase I ‐ Desk Review and Country Selection (September 2006 to March 2007). The desk review involved the collection and analysis of district immunisation data. Of the 46 countries in the WHO/AFR, 27 provided information covering 2002‐2005. Eleven of the 27 countries, including eight of those visited during the evaluation, also provided 2006 data. Data items included: number of surviving infants, number of vaccination doses given by 12 months of age for BCG, DPT1‐3, measles, annual coverage for each antigen, and the date of RED introduction, if RED was introduced, in each district. Analysis of these data helped to inform the selection of countries for Phase II.
Using information from the desk review and expert opinion on which countries would contribute the most lessons learned, the following criteria were applied to select the countries visited for in‐depth evaluation:
• implementation of the RED approach for at least 24 months
• implementation of RED in at least 50% of districts
• geographic balance within the Africa region
• country’s contribution to total regional target population (at least two of the 'Big 4' countries4)
• availability of key country officials to participate at the time of the country visits
Based on this process, the following nine countries were selected for evaluation: Benin, Cameroon, DRC, Ethiopia, Ghana, Madagascar, Sierra Leone, Togo and Uganda.
Phase II – Country Visits (April 2007 to July 2007). Nine teams were identified and country evaluation missions occurred simultaneously from 16 ‐ 27 July 2007. Each country team included international and national evaluators (see list of team members in Annex 4), including at least one WHO international and/or UNICEF staff member and one international partner agency representative (CDC, IMMbasics)—with the exception of Sierra Leone which had neither CDC nor IMMbasics represented. The number of national team members varied across countries. WHO offices and national team members took responsibility for preparations prior to the arrival of the international team members in the nine countries.
During the country visits, information was collected at national, district and HF levels using standardised questionnaires designed for each level. Districts were selected based on DPT3 coverage in 2002 and 2006. The study design included a matrix in which districts were grouped as high, medium or low in 2002 and 2006. Certain cells within the matrix were prioritised as having potential to provide valuable information regarding maintaining high coverage, improving coverage or losing ground on coverage over the past four years. However, not all countries had districts that met these parameters, resulting in slight modification of the selection parameters in several countries. Additionally, in‐
6
4 Angola, Democratic Republic of Congo, Ethiopia, and Nigeria.

In‐depth Evaluation of Reaching Every District Approach, 2007
7
country discussions resulted in some districts being removed from the selection list, as not all districts were considered accessible in terms of security or time available to the teams. In most countries, two HFs were selected in each district based on performance: one higher performing, the other lower performing. In Ethiopia, one HF per district was selected.
All country teams visited at least six districts. Across the nine countries, a total of 68 districts and 133 HFs were evaluated (Annex 2). Each team debriefed the country Inter‐agency Coordination Committee (ICC) or high‐level Ministry of Health (MoH) officials and submitted a preliminary country report of its findings before departure.
Phase III – Regional Data Analysis and Report Writing (August 2007 to October 2007). Country reports, including additional data analysis, were refined and completed. This included updating coverage data for the nine countries and reviewing secondary data sources to supplement information from country reports and questionnaires (e.g., Annual Progress Reports [APRs] to the GAVI Alliance, WHO/UNICEF Joint Reporting Forms [JRFs] and comprehensive Multi‐Year Plans [cMYPs], where available). A comparative analysis of all country findings was performed and the results compiled. A draft regional report was prepared by a team representing each of the evaluation partners.
Limitations of the Evaluation. This evaluation of the RED strategy is subject to limitations, including the following:
• Country selection for the evaluation was not random and, as such, the conclusions cannot be generalised to all AFR countries implementing the RED strategy. Selection depended on the availability and willingness of countries to participate in the evaluation.
• Although criteria relating to changes in DPT3 coverage between 2002 and 2006 were used to ensure inclusion of districts with both increases and decreases in coverage, selection was also based on factors such as geographic and security accessibility.
• Because more districts or HFs were visited in some countries, those countries are overrepresented in aggregate findings (districts visited per country ranged from 4 – 14; HFs per country ranged from 12‐20).
• Comparison (control) districts were explicitly not included in the evaluation. Comparison districts would have permitted more definitive conclusions about the association between RED and immunisation coverage.
• Data quality issues relative to coverage (e.g., non‐availability of data for some districts, changing denominators, etc.) limit Interpretation of coverage trends. Interpretation of the findings is also complicated by the fact that data quality may have changed over time, in part due to the attention focused on data quality by the data quality audit (DQA) process required by the GAVI Alliance.
• Time limitations did not allow for in‐depth explorations of some components, i.e., the linking of communities with HFs, which would have required interviews with community representatives.

In‐depth Evaluation of Reaching Every District Approach, 2007
4. PROGRAMME CONTEXT
8
s shown in Figure 1, the nine countries evaluated were selected from all of the WHO/AFR geographic sub‐regions (West Africa ‐ Benin, Ghana, Sierra Leone, Togo; Central Africa – Cameroon, DRC; Southeast Africa –
Ethiopia, Madagascar, Uganda). The 2006 total population of the selected countries was over 250 million, representing about 33% of the population of the Africa region. The total birth cohort (live births) was just over 10.5 million, ranging from only 242,000 in Togo to over three million in both Ethiopia and DRC (Table 1).
A
Other contextual factors that could have affected the provision of RI services in the evaluated countries include:
• Geography and security: DRC, Sierra Leone, Uganda and Ethiopia all have either extremely mountainous and hard‐to‐reach populations and/or insecure, conflict‐affected or post‐conflict affected areas.
• Size/administrative complexity: The number of districts (or equivalent administrative units) in 2006 ranged from 14 in Sierra Leone to 503 in DRC (Table 2).
Table 1: Socio‐demographic Characteristics of Evaluated Countries , 2006 5
• Economic situation: The 2006 Gross National Income (GNI) per capita ranged from US$ 120 (DRC) to US$ 1,000 (Cameroon).
• Health sector resources: Since 2002, there has been significant focus on routine immunisation in the region, with additional resources available from GAVI and other donors to
complement government funds. Eight of the nine countries received GAVI ISS funding during the period evaluated. All participated in the World Bank programme of debt relief for Highly Indebted Poor Countries (HIPC), although the amount of new funding that this made available for immunisation is not known. Increased health sector budgets and budgetary reforms also
Country Live Births (2006)
Infant Mortality Rate/
1,000 Live Births
GNI PerCapita (US$)
Benin 358,000 101 510
Cameroon 649,000 89 1,000
Congo (DRC) 3,026,000 115 120
Ethiopia 3,159,000 89 160
Ghana 700,000 59 450
Madagascar 714,000 68 290
Sierra Leone 262,000 162 220
Togo 242,000 90 350
Uganda 1,406,000 79 280
Figure 1: Map of Africa Showing Countries Selected for the Evaluation
5 Source : http://www.who.int/vaccines/globalsummary/immunization/countryprofileselect.cfm Live births and Infant Mortality Rates from “World Population Prospects: The 2006 Revision”, New York, United Nations, 2007. GNI per capita from "The 2007 World Bank Development Indicators Online".

In‐depth Evaluation of Reaching Every District Approach, 2007
9
permitted greater ease in securing government funds for immunisation in several of the countries. However, the delayed release of allocated funds continued to be a common problem.
• Introduction of new vaccines: In addition to the traditional vaccines (BCG, DPT, OPV and measles), all evaluated countries with the exception of Togo introduced at least one new or underutilised vaccine (HepB, Hib or Yellow Fever) during the period studied. The health systems in all of the selected countries are decentralised, with the district level serving as the focus for planning and delivery of immunisation services. Five of the nine countries have divided districts since the introduction of the RED approach and faced the related challenges of denominator accuracy (under‐ and over‐estimated target populations) and the need to redistribute available resources. Insufficient numbers of qualified health personnel as well as rapid turnover of trained health personnel remain important challenges in all evaluated countries.
Measles, polio, pertussis, tetanus, Hib‐related diseases and hepatitis are important vaccine‐preventable diseases that contribute significantly to disability, morbidity and mortality in the Africa region. The Infant Mortality Rate (IMR) in all selected countries ranged from 68/1,000 live births in Ghana to 165/1,000 live births in Sierra Leone. The RED approach not only aims to revitalise the RI system, but also to reduce infant and child mortality by providing a platform for the delivery of additional maternal and child survival interventions.
In‐depth Evaluation of Reaching Every District Approach, 2007
5. FINDINGS 5.1 RED APPROACH INTRODUCTION AND SCALE‐UP
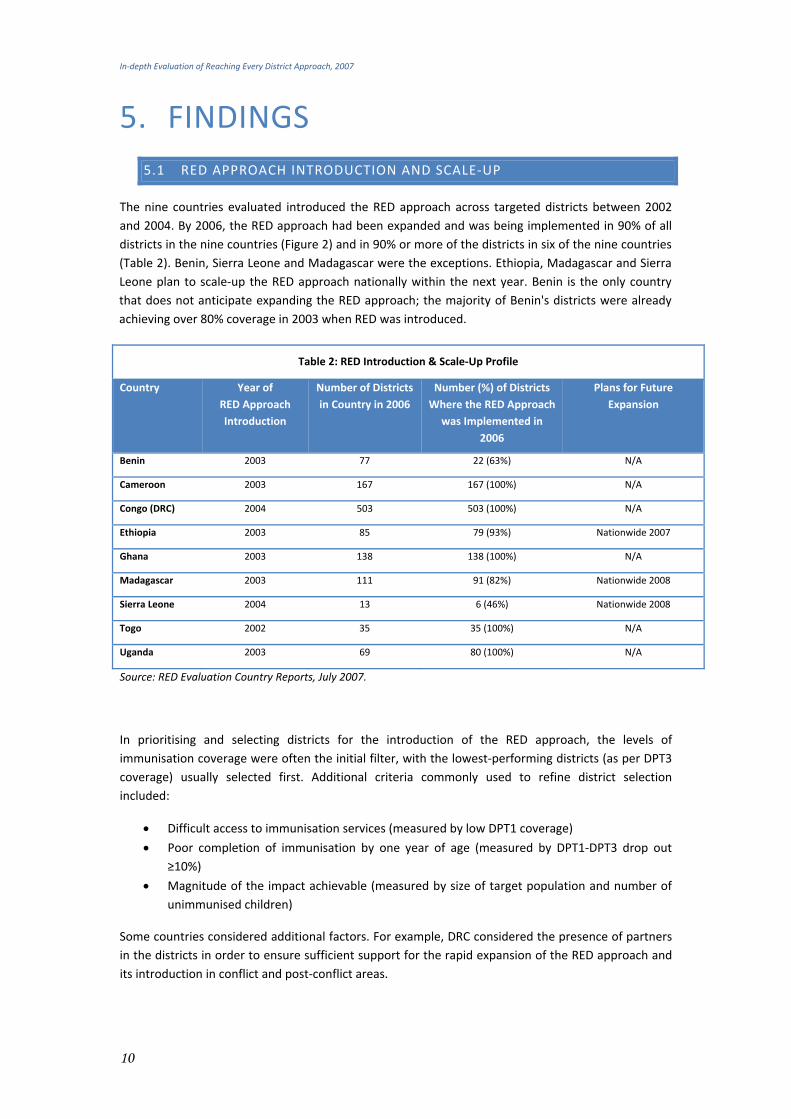
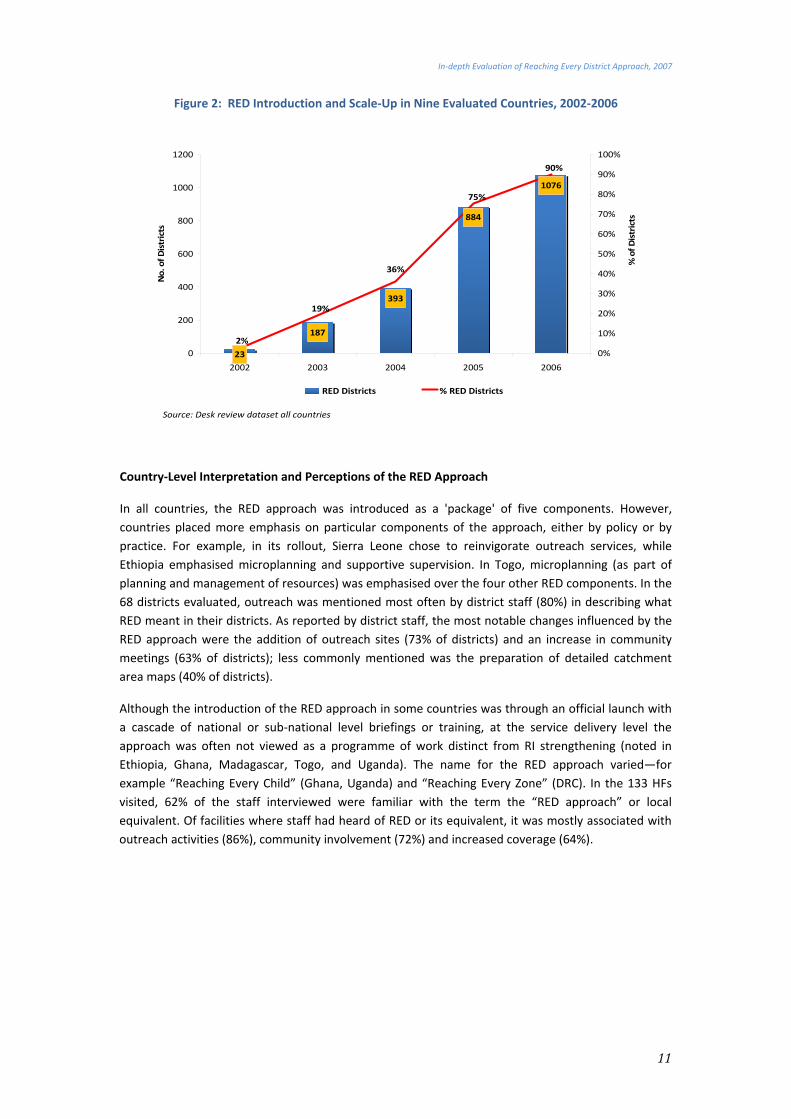
The nine countries evaluated introduced the RED approach across targeted districts between 2002 and 2004. By 2006, the RED approach had been expanded and was being implemented in 90% of all districts in the nine countries (Figure 2) and in 90% or more of the districts in six of the nine countries (Table 2). Benin, Sierra Leone and Madagascar were the exceptions. Ethiopia, Madagascar and Sierra Leone plan to scale‐up the RED approach nationally within the next year. Benin is the only country that does not anticipate expanding the RED approach; the majority of Benin's districts were already achieving over 80% coverage in 2003 when RED was introduced.
Source: RED Evaluation Country Reports, July 2007.
Table 2: RED Introduction & Scale‐Up Profile
Country Year of RED Approach Introduction
Number of Districts in Country in 2006
Number (%) of Districts Where the RED Approach
was Implemented in 2006
Plans for Future Expansion
Benin 2003 77 22 (63%) N/A
Cameroon 2003 167 167 (100%) N/A
Congo (DRC) 2004 503 503 (100%) N/A
Ethiopia 2003 85 79 (93%) Nationwide 2007
Ghana 2003 138 138 (100%) N/A
Madagascar 2003 111 91 (82%) Nationwide 2008
Sierra Leone 2004 13 6 (46%) Nationwide 2008
Togo 2002 35 35 (100%) N/A
Uganda 2003 69 80 (100%) N/A
In prioritising and selecting districts for the introduction of the RED approach, the levels of immunisation coverage were often the initial filter, with the lowest‐performing districts (as per DPT3 coverage) usually selected first. Additional criteria commonly used to refine district selection included:
• Difficult access to immunisation services (measured by low DPT1 coverage)
• Poor completion of immunisation by one year of age (measured by DPT1‐DPT3 drop out ≥10%)
• Magnitude of the impact achievable (measured by size of target population and number of unimmunised children)
Some countries considered additional factors. For example, DRC considered the presence of partners in the districts in order to ensure sufficient support for the rapid expansion of the RED approach and its introduction in conflict and post‐conflict areas.
10
In‐depth Evaluation of Reaching Every District Approach, 2007
11
Figure 2: RED Introduction and Scale‐Up in Nine Evaluated Countries, 2002‐2006
187
393
884
1076
23
36%
2%
19%
90%
75%
0
200
400
600
800
1000
1200
2002 2003 2004 2005 2006
No. of D
istricts
0%
10%
20%
30%
40%
50%
60%
70%
80%
90%
100%
% of D
istricts
RED Districts % RED Districts
Source: Desk review dataset all countries
Country‐Level Interpretation and Perceptions of the RED Approach
In all countries, the RED approach was introduced as a 'package' of five components. However, countries placed more emphasis on particular components of the approach, either by policy or by practice. For example, in its rollout, Sierra Leone chose to reinvigorate outreach services, while Ethiopia emphasised microplanning and supportive supervision. In Togo, microplanning (as part of planning and management of resources) was emphasised over the four other RED components. In the 68 districts evaluated, outreach was mentioned most often by district staff (80%) in describing what RED meant in their districts. As reported by district staff, the most notable changes influenced by the RED approach were the addition of outreach sites (73% of districts) and an increase in community meetings (63% of districts); less commonly mentioned was the preparation of detailed catchment area maps (40% of districts).
Although the introduction of the RED approach in some countries was through an official launch with a cascade of national or sub‐national level briefings or training, at the service delivery level the approach was often not viewed as a programme of work distinct from RI strengthening (noted in Ethiopia, Ghana, Madagascar, Togo, and Uganda). The name for the RED approach varied—for example “Reaching Every Child” (Ghana, Uganda) and “Reaching Every Zone” (DRC). In the 133 HFs visited, 62% of the staff interviewed were familiar with the term the “RED approach” or local equivalent. Of facilities where staff had heard of RED or its equivalent, it was mostly associated with outreach activities (86%), community involvement (72%) and increased coverage (64%).
In‐depth Evaluation of Reaching Every District Approach, 2007
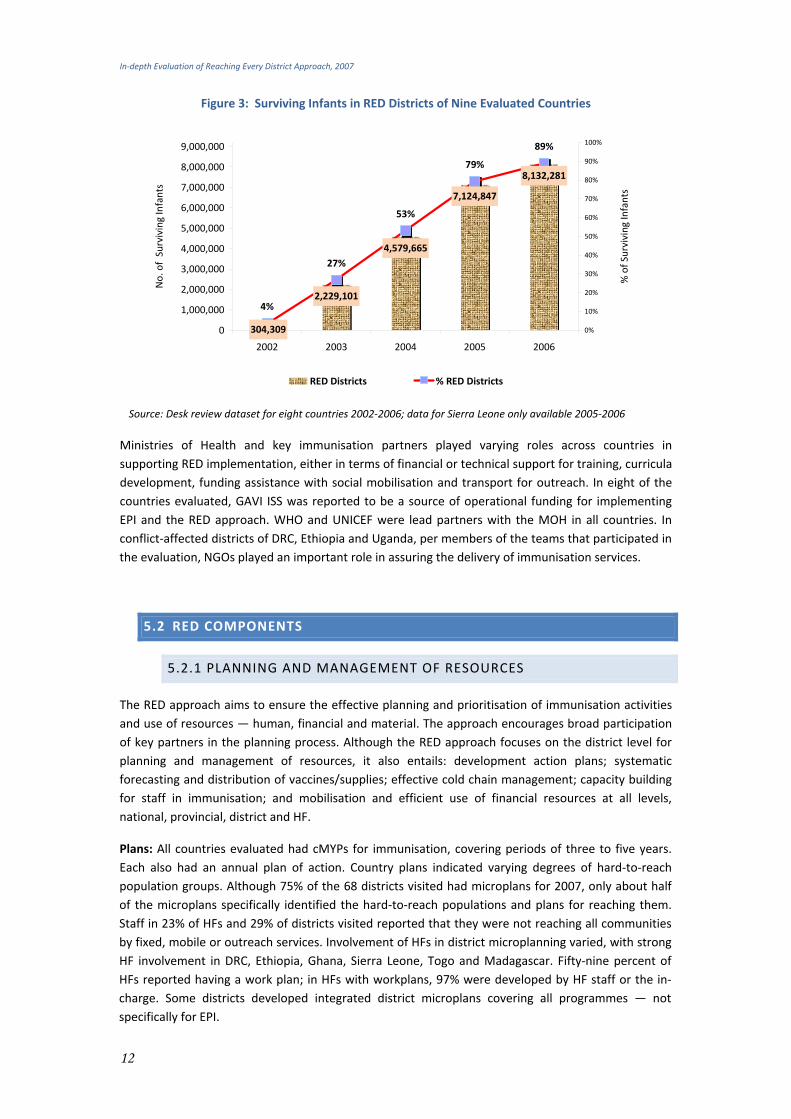
Figure 3: Surviving Infants in RED Districts of Nine Evaluated Countries
2,229,101
4,579,665
7,124,847
8,132,281
304,309
4%
27%
53%
79%
89%
0
1,000,000
2,000,000
3,000,000
4,000,000
5,000,000
6,000,000
7,000,000
8,000,000
9,000,000
2002 2003 2004 2005 2006
No. of Surviving Infants
0%
10%
20%
30%
40%
50%
60%
70%
80%
90%
100%
% of Surviving
Infants
RED Districts % RED Districts
Source: Desk review dataset for eight countries 2002‐2006; data for Sierra Leone only available 2005‐2006
Ministries of Health and key immunisation partners played varying roles across countries in supporting RED implementation, either in terms of financial or technical support for training, curricula development, funding assistance with social mobilisation and transport for outreach. In eight of the countries evaluated, GAVI ISS was reported to be a source of operational funding for implementing EPI and the RED approach. WHO and UNICEF were lead partners with the MOH in all countries. In conflict‐affected districts of DRC, Ethiopia and Uganda, per members of the teams that participated in the evaluation, NGOs played an important role in assuring the delivery of immunisation services.
5.2 RED COMPONENTS
5.2.1 PLANNING AND MANAGEMENT OF RESOURCES
The RED approach aims to ensure the effective planning and prioritisation of immunisation activities and use of resources — human, financial and material. The approach encourages broad participation of key partners in the planning process. Although the RED approach focuses on the district level for planning and management of resources, it also entails: development action plans; systematic forecasting and distribution of vaccines/supplies; effective cold chain management; capacity building for staff in immunisation; and mobilisation and efficient use of financial resources at all levels, national, provincial, district and HF.
Plans: All countries evaluated had cMYPs for immunisation, covering periods of three to five years. Each also had an annual plan of action. Country plans indicated varying degrees of hard‐to‐reach population groups. Although 75% of the 68 districts visited had microplans for 2007, only about half of the microplans specifically identified the hard‐to‐reach populations and plans for reaching them. Staff in 23% of HFs and 29% of districts visited reported that they were not reaching all communities by fixed, mobile or outreach services. Involvement of HFs in district microplanning varied, with strong HF involvement in DRC, Ethiopia, Ghana, Sierra Leone, Togo and Madagascar. Fifty‐nine percent of HFs reported having a work plan; in HFs with workplans, 97% were developed by HF staff or the in‐charge. Some districts developed integrated district microplans covering all programmes — not specifically for EPI.
12

In‐depth Evaluation of Reaching Every District Approach, 2007
13
Maps: Most districts had district catchment area maps; however, in some districts, maps lacked details such as population, major landmarks and delineation of hard‐to‐reach communities. Although a majority of HFs (69%) also had catchment area maps, they commonly lacked details such as population, landmarks and hard‐to‐reach populations. HFs displayed activity plans showing days of both fixed and outreach sessions. Problems with accurate data for the target population (denominator), particularly at the district level, were common across all countries—with a common concern expressed that the population data obtained from the central statistics offices did not always reflect the actual number of children seen ‘on the ground’.
Cold chain: Although not always sufficient, cold chain equipment was functioning at all levels across the evaluated countries. Eighty‐six percent of districts had conducted a cold chain inventory of the district store and HFs in the past two years. Eighty‐two percent of inventory lists were up‐ to‐date.
Vaccine stockouts: All countries with the exception of Benin reported at least one DPT or measles stockout at the district level during the previous year. Benin was also the only country not reporting at least one stockout at the HF level. Eleven districts reported at least one stockout of DPT vaccine and 10 districts reported at least one stockout of measles vaccine, with mean durations of five and four weeks respectively. Of the 133 HFs visited, at least one stockout was reported of DPT by 17 HFs and of measles vaccines by 16 HFs. Because stockouts at the HF level may not interrupt services on days or weeks when immunisation sessions are not scheduled, additional questions were asked. Of the HFs reporting a stockout of any antigen, 54% reported having to turn children away at least once and 24% reported cancelling immunisation sessions.
Transportation: While transportation was mentioned as a problem, only 18% of districts said that lack of transportation disrupted the distribution of vaccines and materials.
Training: Twenty‐four of the 68 districts (35%) indicated that at least 75% of District Health Management Team (DHMT) staff had been trained or oriented on EPI in the last 24 months. Training in RI was not occurring regularly either at district or HF levels. Training for rollout of RED often consisted of a one‐day workshop/orientation or briefing. Initial RED districts were provided with much more orientation for the RED approach than were later ones. Rapid turnover of staff was frequently cited as a training challenge.
Key Strengths
• Planning was found to be strong in countries evaluated with most districts and health facilities able to present some level of service plans, area maps and acceptable cold chain.
• Districts and health facilities have prepared ‘catchment area maps’.

In‐depth Evaluation of Reaching Every District Approach, 2007
Best Practice Madagascar
Appropriate and realistic planning are important parts of implementing immunisation programs. In Madagascar, where planning and budgeting are decentralized to the district level, 100% of the districts visited included specific descriptions for supportive supervision activities in their annual plans. Six out of the seven districts visited had a 2007 microplan, and 100% of the districts visited included social mobilisation activities in their annual plans. Outlining key events in annual plans can improve budgeting and flow of funding for activities.
Areas for improvement
• Despite improved planning and the RED emphasis on hard‐to‐reach populations, one in five facilities still lacks plans for reaching some hard to reach areas.
• Five of the nine countries evaluated have undergone division of districts, in most cases more than once within the last three years. This has led to changed denominators and made setting targets and monitoring achievements difficult in both old and new districts—but more so in the new districts.
• Although districts and health facilities are using catchment area maps, the maps lack sufficient details to facilitate effective planning for reaching the hard‐to‐reach populations and for improving monitoring.
• Ensuring the availability of vaccines is crucial for the implementation of the RED approach. Shortages or stockouts of vaccines lead to the interruption of immunisation sessions, which compromises the credibility of the EPI programme and threatens achievement of programme goals.
• Many of the staff interviewed had not received recent training in EPI or RED.
5.2.2 SUPPORTIVE SUPERVISION
Supportive supervision, a key component of the RED approach, aims to help health workers continuously improve their performance in providing quality immunisation services. With an emphasis on “supportive,” the supervision performed using this technique encourages an individualised, open, two‐way dialogue and focuses on using data to guide decisions. Critical to successful supportive supervision are clear objectives and standards, consistent feedback (both verbal and written), provision of on‐the‐job training to fill observed gaps and regular follow‐up on recommendations. We note that it is difficult to assess the supportive aspect of supervision, particularly retrospectively, and especially when soliciting information from staff whose supervisors were present during the evaluation.
Planning and implementation: Supportive supervision requires regular, detail‐oriented follow‐up with staff to ensure that tasks are being implemented correctly. Approximately 65% of the districts visited included supervision in their annual work plans. In DRC, Madagascar and Sierra Leone, plans
14
In‐depth Evaluation of Reaching Every District Approach, 2007
15
were incorporated in 100% of the districts visited. There were written guidelines for supervision reported in 65% of districts. Thirty‐eight percent of districts reported receiving supervision visits from the national level in the previous three months. Fifty‐nine percent of HFs received visits from the district level in the previous month, with 70% receiving visits in the last three months. All nine countries were using integrated supervision. Similar to findings from the 2005 evaluation, logistics for supervision remains an ongoing challenge, specifically in relation to transport, fuel and human resources. However, in 79% of the districts, supervision had been included in district budgets. Records of visits planned versus conducted were frequently not available.
were incorporated in 100% of the districts visited. There were written guidelines for supervision reported in 65% of districts. Thirty‐eight percent of districts reported receiving supervision visits from the national level in the previous three months. Fifty‐nine percent of HFs received visits from the district level in the previous month, with 70% receiving visits in the last three months. All nine countries were using integrated supervision. Similar to findings from the 2005 evaluation, logistics for supervision remains an ongoing challenge, specifically in relation to transport, fuel and human resources. However, in 79% of the districts, supervision had been included in district budgets. Records of visits planned versus conducted were frequently not available.
Tools: Most districts (82%) utilised a checklist, including 100% of districts in Madagascar, Sierra Leone, Togo and Uganda. Sixty‐four percent of districts were found to have written guidelines or standards for supportive supervision available in the district health office.
Tools: Most districts (82%) utilised a checklist, including 100% of districts in Madagascar, Sierra Leone, Togo and Uganda. Sixty‐four percent of districts were found to have written guidelines or standards for supportive supervision available in the district health office.
Training: During the previous 24 months, supervisors had been training in 63% of districts. During supervision visits, 41% of HFs reported receiving on‐the‐job training, and 36% of HFs reported that visits included observation of immunisation sessions (which provides opportunities for individualising on‐the‐job training).
Training: During the previous 24 months, supervisors had been training in 63% of districts. During supervision visits, 41% of HFs reported receiving on‐the‐job training, and 36% of HFs reported that visits included observation of immunisation sessions (which provides opportunities for individualising on‐the‐job training).
Follow‐up and feedback: Of the 133 HFs interviewed, 78% reported receiving immediate verbal feedback; 38% reported receiving written feedback in supervisory logbooks or notebooks; 11% reported receiving formal reports following supervision visits; and 38% responded that recommendations had been followed‐up. District review meetings were carried out in almost all districts, providing opportunities for training, albeit underutilised.
Follow‐up and feedback: Of the 133 HFs interviewed, 78% reported receiving immediate verbal feedback; 38% reported receiving written feedback in supervisory logbooks or notebooks; 11% reported receiving formal reports following supervision visits; and 38% responded that recommendations had been followed‐up. District review meetings were carried out in almost all districts, providing opportunities for training, albeit underutilised.
Key Strengths Key Strengths
• Supervision is occurring, with the majority of health facilities receiving supervisory visits within the three months prior to the evaluation. Over 75% of health facilities reported receiving at least verbal feedback.
• Most districts have the tools necessary to conduct supervision (e.g., copies of standards and checklists) and while transport was reported as a challenge, most health facilities are being supervised.
Best Practice Democratic Republic of Congo
During regular visits, supervisors use logbooks to record strengths and weaknesses observed as well as recommendations. The logbooks remain at the health facility for use by the staff and can be made available the next time a supervisor visits to review progress being made at that facility.
While countries may make logbooks or notebooks available, they are not always put to practical use.
In‐depth Evaluation of Reaching Every District Approach, 2007
16
Areas for improvement
• The regularity and supportive aspects of supervision require attention. At the health facility level, many supervisors do not provide written feedback with clearly outlined recommendations. Maintaining the regularity of supervision visits and providing constructive written as well as verbal feedback promote improved performance by ensuring consistency.
• Less than half of health facilities received on‐the‐job training, which is a critical component of building health workers' competency and stimulating their learning. High‐quality supportive supervision requires regular refresher training; it can be further enhanced if pre‐service training itself includes emphasis on the key components of supportive supervision.
5.2.3 RE‐ESTABLISHING OUTREACH SERVICES
As a major component of the RED approach, re‐establishing outreach services involves the following steps: (1) situation analysis; (2) identifying and prioritising hard‐to‐reach communities; (3) preparing outreach session plans; and (4) implementing and monitoring planned outreach sessions. It is important to schedule outreach to reach the largest concentrations of unreached children at least four times per year, with logical intervals between visits. Particularly when facing financial and human resource constraints, it is critical to maximise HF staff time and resources by determining which other child survival interventions can feasibly be added on to immunisation outreach services.
The evaluation found this component to be the most widely recognised and applied of all RED components. Seven out of the nine countries reported a general increase in outreach services since introduction of the RED approach, and outreach was commonly linked to other maternal and child health interventions. In 54% of the districts visited, new outreach sites were reported to have been added since the approach was introduced. This may have been the case in a greater percentage of districts, but recordkeeping has not been systematic.
Outreach Planning: The most commonly cited criteria that districts used for selection of outreach sites included hard‐to‐reach populations (72%) and population size (57%); HFs also cited hard‐to‐reach populations (48%) and population size (38%) as their top two selection criteria. The scheduling decision as to when to visit a site was determined by HF in‐charges or other staff in 67% of HFs conducting outreach. Communities were involved in 35% of HFs.
Implementation: In 2006, over half (62%) of the HFs conducted more than 80% of planned outreach sessions. Seventy‐six percent of the facilities conducted outreach to each site at least once a month. However, only 29% of the districts were able to show catchment area maps identifying outreach/ mobile sites. It should be noted that 22% of the districts visited offered mobile services (in Cameroon, DRC, Ethiopia and Madagascar). Twenty‐three percent of HFs and 29% of districts reported that they had not yet reached all communities with fixed, outreach or mobile sessions. Districts in all countries reported offering additional services during outreach immunisation sessions (e.g., some but not all of the following: vitamin A supplementation, distribution of bed nets, deworming, growth monitoring and promotion, family planning, antenatal consultation). In 73% of districts and 60% of HFs visited, health workers received allowances for conducting outreach services.
In‐depth Evaluation of Reaching Every District Approach, 2007
17
Logistics for outreach services: Fifty percent of HFs used motorbikes to conduct outreach, 29% went on foot and 22% used bicycles. Fuel shortages and lack of transport (transport unavailable or broken down) are often cited by immunisation programmes as key reasons for cancellation of outreach/mobile services; however according to evaluation results, less than a quarter of HFs (22%) reported cancellation of outreach sessions in 2006 due to breakdown of transport equipment. In addition, even fewer facilities (9%) reported cancellation of sessions in 2006 due to fuel shortages.
Logistics for outreach services: Fifty percent of HFs used motorbikes to conduct outreach, 29% went on foot and 22% used bicycles. Fuel shortages and lack of transport (transport unavailable or broken down) are often cited by immunisation programmes as key reasons for cancellation of outreach/mobile services; however according to evaluation results, less than a quarter of HFs (22%) reported cancellation of outreach sessions in 2006 due to breakdown of transport equipment. In addition, even fewer facilities (9%) reported cancellation of sessions in 2006 due to fuel shortages.
Use of outreach service data: Data on outreach/mobile services were disaggregated during outreach sessions in 70% of both districts and HFs, however the disaggregated data were reported to the national level in only 22% of districts. Because districts in most countries combine or aggregate fixed and outreach data when reporting to higher administrative levels, it is not always possible to analyse progress, resources needed, or coverage achieved through outreach. Tracking of defaulters at outreach sites is sometimes assisted by community health workers or volunteers. As mentioned in the Planning and Management of Resources component, detailed HF catchment area maps, which are often found lacking, are essential in enabling facilities to determine gaps in the coverage of outreach services (e.g., hard‐to‐reach populations being missed). This includes scheduling of sessions during the rainy season and overcoming transport constraints to less accessible sites.
Use of outreach service data: Data on outreach/mobile services were disaggregated during outreach sessions in 70% of both districts and HFs, however the disaggregated data were reported to the national level in only 22% of districts. Because districts in most countries combine or aggregate fixed and outreach data when reporting to higher administrative levels, it is not always possible to analyse progress, resources needed, or coverage achieved through outreach. Tracking of defaulters at outreach sites is sometimes assisted by community health workers or volunteers. As mentioned in the Planning and Management of Resources component, detailed HF catchment area maps, which are often found lacking, are essential in enabling facilities to determine gaps in the coverage of outreach services (e.g., hard‐to‐reach populations being missed). This includes scheduling of sessions during the rainy season and overcoming transport constraints to less accessible sites.
Key Strengths Key Strengths
• An increase in the number of outreach sites has occurred since the implementation of RED in countries visited.
• Sites are chosen following RED guidelines and most planned sessions are held
Best Practice Ethiopia
Ethiopia’s Ministry of Health initiated the RED approach in late 2003 to improve immunisation coverage. Shortly thereafter, the Government of Ethiopia introduced the Health Extension Worker (HEW), a new cadre of female health professionals who are trained, paid and based in their communities. After receiving one year of training, HEWs are supported by health facility staff in the delivery of an integrated package of primary health services that includes immunisation.
A 2005 assessment of RED in Ethiopia pointed to the community component as one of the weakest and recommended special attention to improve the links between communities and health services. Great emphasis has been placed on outreach and community involvement since that time, most recently with the help of the HEWs. Rollout of the HEW cadre started in significant numbers in 2006/2007. Since the introduction of RED, national DPT3 coverage has increased from 51% (2001) to 72% (2006) and utilisation of other services has increased as well.
Ethiopia has embarked upon a grand initiative to bring immunisation closer to its people through RED and its HEWs. The RED evaluation concluded that HEWs are making an important contribution to community mobilization and the success of immunization outreach.
In‐depth Evaluation of Reaching Every District Approach, 2007
18
Areas for improvement
• At present, the numbers of children immunised in fixed and outreach sessions are not systematically monitored in most of the countries. Monitoring the number of vaccinations given at outreach versus fixed sessions is critical to improve planning, understand the target population and more effectively allocate resources.
• Records of planned versus actual outreach sessions are not maintained at all levels. Keeping such records is important to help identify the challenges associated with outreach, which in turn can lead to identifying better solutions for the problems cited (e.g., transport, fuel, human resources, seasonal issues, etc.).
5.2.4 LINKING SERVICES WITH COMMUNITIES
Linking services with communities, as one of the five RED components, aims to improve and sustain immunisation coverage by involving the community in all aspects of immunisation services (planning, implementation, monitoring and evaluation). Evaluated countries planned and implemented a number of activities at the district and HF levels in order to reinforce linkages between communities and health services.
Active involvement of community volunteers was reported to be key in increasing immunisation demand, particularly for outreach in rural areas.
Planning/coordination: In 73% of districts visited, the district microplans included social mobilisation workplans and other community activities. Only Madagascar had community linkages included in the microplans in all districts visited. Microplans in 57% of districts visited included an annual district budget specifying an amount available for community activities (e.g., meetings with community leaders, trainings, incentives for community volunteers, social mobilisation, etc.). Togo was the only country in which the microplans of all districts visited included a budgeted amount for community links.
Community meetings: Of the 133 HFs visited, 90 (68%) HFs indicated they held regular meetings with the community. Community meetings were co‐financed by communities and partners. A greater proportion of evaluated districts reported holding regular meetings with the community in Benin, DRC, Ghana, Madagascar, Sierra Leone and Uganda.
Training, retention and incentives: Seventy‐four percent (99 of 133) of HFs responded that community mobilisers or volunteers had been trained to promote or assist with immunisation activities. In 56% of HFs with trained volunteers, volunteers were reported as still being active. About half of the HFs with community volunteers reported providing some form of incentive (such as training and transportation reimbursement).
Activities: Community volunteers were involved in immunisation services in all countries at the district and HF level, but activities in which they were involved varied by country. Activities in which volunteers were most frequently reported as involved include education/mobilisation (86% district, 84% HF), tracking of defaulters (72% district, 58% HF) and newborn registration (49% district, 33% HF). At the HF level, community volunteers were also involved in assisting during outreach sessions (62%), planning (47%), reporting of disease cases (46%) and providing resources (e.g., funds, materials, transport).
In‐depth Evaluation of Reaching Every District Approach, 2007
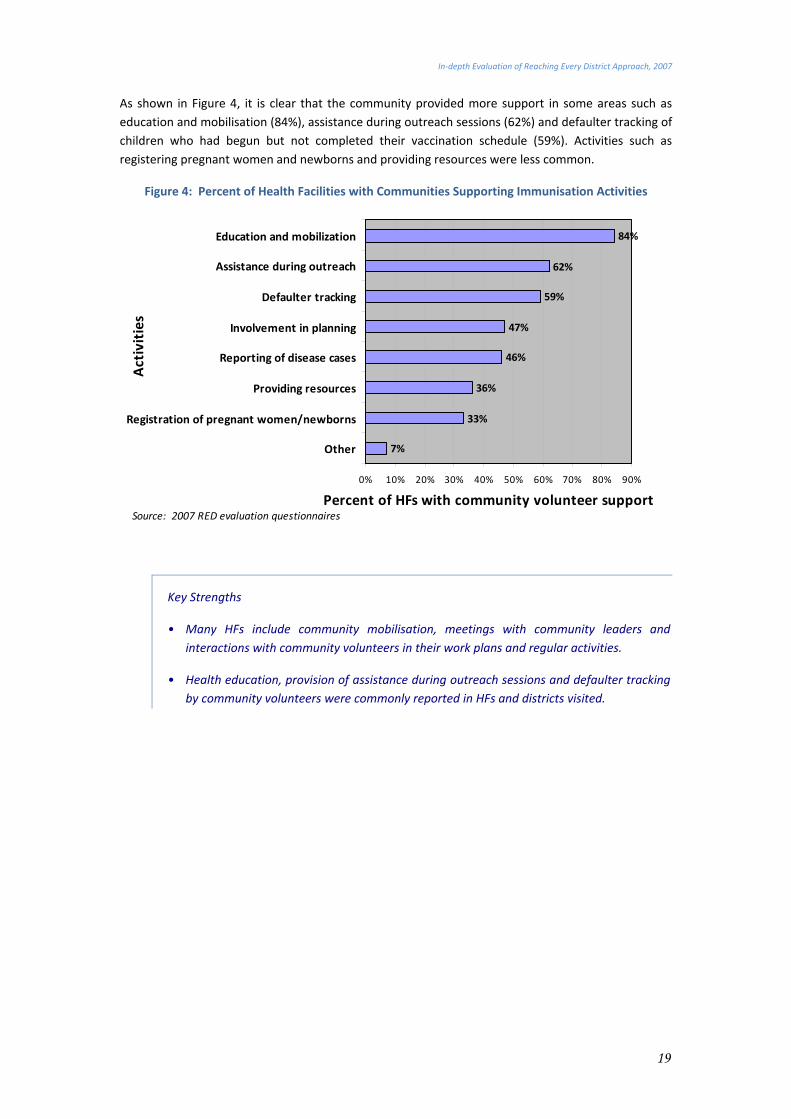
As shown in Figure 4, it is clear that the community provided more support in some areas such as education and mobilisation (84%), assistance during outreach sessions (62%) and defaulter tracking of children who had begun but not completed their vaccination schedule (59%). Activities such as registering pregnant women and newborns and providing resources were less common.
Figure 4: Percent of Health Facilities with Communities Supporting Immunisation Activities
7%
33%
36%
46%
47%
59%
62%
84%
0% 10% 20% 30% 40% 50% 60% 70% 80% 90%
Other
Registration of pregnant women/newborns
Providing resources
Reporting of disease cases
Involvement in planning
Defaulter tracking
Assistance during outreach
Education and mobilization
Activities
Percent of HFs with community volunteer supportSource: 2007 RED evaluation questionnaires
Key Strengths
• Many HFs include community mobilisation, meetings with community leaders and interactions with community volunteers in their work plans and regular activities.
• Health education, provision of assistance during outreach sessions and defaulter tracking by community volunteers were commonly reported in HFs and districts visited.
19
In‐depth Evaluation of Reaching Every District Approach, 2007
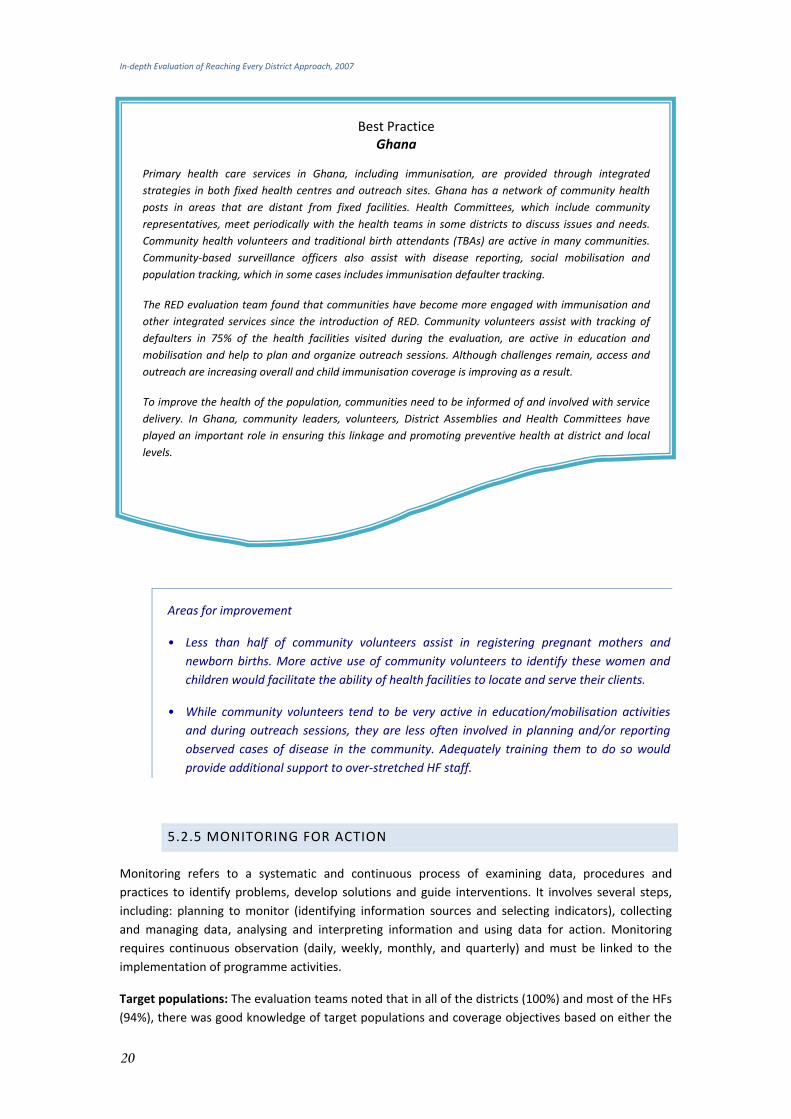
Best Practice Ghana
Primary health care services in Ghana, including immunisation, are provided through integrated strategies in both fixed health centres and outreach sites. Ghana has a network of community health posts in areas that are distant from fixed facilities. Health Committees, which include community representatives, meet periodically with the health teams in some districts to discuss issues and needs. Community health volunteers and traditional birth attendants (TBAs) are active in many communities. Community‐based surveillance officers also assist with disease reporting, social mobilisation and population tracking, which in some cases includes immunisation defaulter tracking.
The RED evaluation team found that communities have become more engaged with immunisation and other integrated services since the introduction of RED. Community volunteers assist with tracking of defaulters in 75% of the health facilities visited during the evaluation, are active in education and mobilisation and help to plan and organize outreach sessions. Although challenges remain, access and outreach are increasing overall and child immunisation coverage is improving as a result.
To improve the health of the population, communities need to be informed of and involved with service delivery. In Ghana, community leaders, volunteers, District Assemblies and Health Committees have played an important role in ensuring this linkage and promoting preventive health at district and local levels.
Areas for improvement
• Less than half of community volunteers assist in registering pregnant mothers and newborn births. More active use of community volunteers to identify these women and children would facilitate the ability of health facilities to locate and serve their clients.
• While community volunteers tend to be very active in education/mobilisation activities and during outreach sessions, they are less often involved in planning and/or reporting observed cases of disease in the community. Adequately training them to do so would provide additional support to over‐stretched HF staff.
5.2.5 MONITORING FOR ACTION
Monitoring refers to a systematic and continuous process of examining data, procedures and practices to identify problems, develop solutions and guide interventions. It involves several steps, including: planning to monitor (identifying information sources and selecting indicators), collecting and managing data, analysing and interpreting information and using data for action. Monitoring requires continuous observation (daily, weekly, monthly, and quarterly) and must be linked to the implementation of programme activities.
Target populations: The evaluation teams noted that in all of the districts (100%) and most of the HFs (94%), there was good knowledge of target populations and coverage objectives based on either the
20

In‐depth Evaluation of Reaching Every District Approach, 2007
21
previous year’s achievements or district orientations. Targets did not always differentiate between fixed and outreach sites and, as previously mentioned, the number of children vaccinated through outreach services was not reported separately in most of the HFs. Additionally, programme support elements such as immunisation tracking and monitoring tools were not uniformly used and data collection tools in some countries (e.g., Sierra Leone) need to be revised to reflect newly introduced vaccines (pentavalent). Systems of tracking defaulters besides the register were available in 48% of visited HFs. Official census estimates were found to be the major source of population data in most countries visited (84% at district and 72% at HF level). Census data upon which denominators were based were reported to be more than 10 years old and annual target populations were estimated using growth rate projections. In half of the HFs, staff perceived that these denominator estimates were inaccurate.
Reporting and review meetings: The majority of HFs submitted reports to districts by hand. Reports are collected monthly in all districts. The number and regularity of district level review meetings has increased since RED implementation began. Ninety‐five percent of districts conducted review meetings with their HFs during the past year, at which time immunisation data were discussed (e.g., correcting errors, ensuring consistency and validity of data, analysing trends and reviewing surveillance indicators) and actions were taken to make necessary programme adjustments based on results of the monitoring.
Monitoring charts: Immunisation monitoring charts were displayed in 76% of HFs visited, of which 83% were up‐to‐date and 75% were charted correctly. Seventy percent of health workers were able to explain their facility’s performance using the monitoring chart. As mentioned in the Planning and Resource component, maps of catchment areas exist in the majority of districts and HFs visited but do not often include important details and are not used for clearly identifying outreach sites or hard‐to‐reach population groups.
Data quality: The desk review found problems with district data in several countries. The most common problems were erroneous and or changing denominators; coverage rates well over 100% in a higher proportion of districts than should be expected; negative DPT1‐3 drop‐out rates; unknown target populations in some years because of the division of districts; incomplete reporting; and the failure to archive the district data used in calculating and reporting national immunisation coverage.
Key Strengths
• Monitoring of information was occurring in the field, with information being collected, charted and in most cases interpreted at health facility and district level.
• Over 90% of districts are holding regular review meetings that are an important opportunity to use that information and provide a potential platform for ongoing technical updates and training.

In‐depth Evaluation of Reaching Every District Approach, 2007
22
Areas for improvement
•Denominator estimates are typically based on official census data that dates beyond ten years. Inaccurate denominators lead to imprecise calculations of immunisation coverage and erroneous estimates of vaccine needs.
•A tickler system for tracking immunisation defaulters is used in less than half of health facilities. Interpreting immunisation registers to identify defaulters can be difficult, tedious, and lead to mistakes
•Only 30% of districts had 100% of their district health staff trained in the past 24 months. Without ongoing training for new staff, or regular refresher training for existing staff, high levels of staff turnover leave the EPI programme vulnerable to poor quality performance.
•While the majority of districts and health facilities display catchment area maps, these maps are not used as powerful tools to identify outreach sites and hard‐to‐reach populations.
Best Practice Benin
In Benin, most districts and health centres had vaccination coverage charts that were drawn according to national standards and correctly interpreted by health workers. Health facility vaccination reports were sent to the district each month and discussed at regularly held monthly meetings. During these meetings, staff members in charge of immunisation and the heads of HFs discussed calculation errors, the consistency of immunisation data, trends in cumulative coverage, completeness and timeliness of reports and monitoring of diseases. This systematic monitoring for action at both the HF and district levels contributed to the success of improving immunisation service delivery.
Monitoring for action can be used to improve the quality of immunisation service delivery as well as the knowledge and skills of EPI managers and health workers.

In‐depth Evaluation of Reaching Every District Approach, 2007
5.3 INTEGRATION OF OTHER HEALTH SERVICES WITH ROUTINE IMMUNISATION
The RI infrastructure provides a platform for the delivery of additional services during fixed and outreach vaccination sessions. All nine countries integrate immunisation and other health services to some degree. HFs in seven of the countries reported delivering one or more of the following services during immunisation outreach: antenatal care (ANC), family planning, growth monitoring, deworming, distribution of insecticide treated nets (ITNs), treatment of sick adults, treatment of sick children, or vitamin A supplementation (see Figure 5). These same services were reportedly provided on the same day as immunisation at fixed sites as well. HFs report that services are more frequently combined at fixed sites than during outreach sessions. In both fixed and outreach sessions, the services combined with immunisation varied, even within the same country. For all services except the treatment of ill adults, at least 20% of the HFs reported integrating the services mentioned above and shown in Figure 5. Many HFs said they used immunisation sessions to provide general health education to the community as well.
Figure 5: Health Facilities Integrating Services with Routine Immunisation
0%20%40%60%80%
100%
Antenatal
care
Family
planning
Growth
mon
itorin
g
Dew
orming
Insecticide
treated
bed nets
Treat
adults
Treat kids
Vitamin A
Integrated Service
% of sites in
tegratin OR (N=111) Fixed (N=133)
Source: 2007 RED evaluation questionnaires
5.4 COSTS AND FINANCING OF IMMUNISATION AND THE RED APPROACH
The national and district level evaluation questionnaires included structured questions about: (1) availability of funding for the introduction and continuation of RED; (2) sources of funding used in support of RED; (3) types of costs supported; and (4) amounts of additional funding available each year. In four of the nine countries, financing experts also joined the evaluation teams and an additional in‐depth question guide was developed for their use.
Country teams had varying degrees of success in their attempts to collect and interpret financial information.6 Interviews, even at national level in most countries, produced an incomplete picture either because reliable information was not available about funding transfers and actual expenditures
6 All country teams, with the exception of the Togo team, submitted financial findings that were used in this analysis.
23
In‐depth Evaluation of Reaching Every District Approach, 2007
24
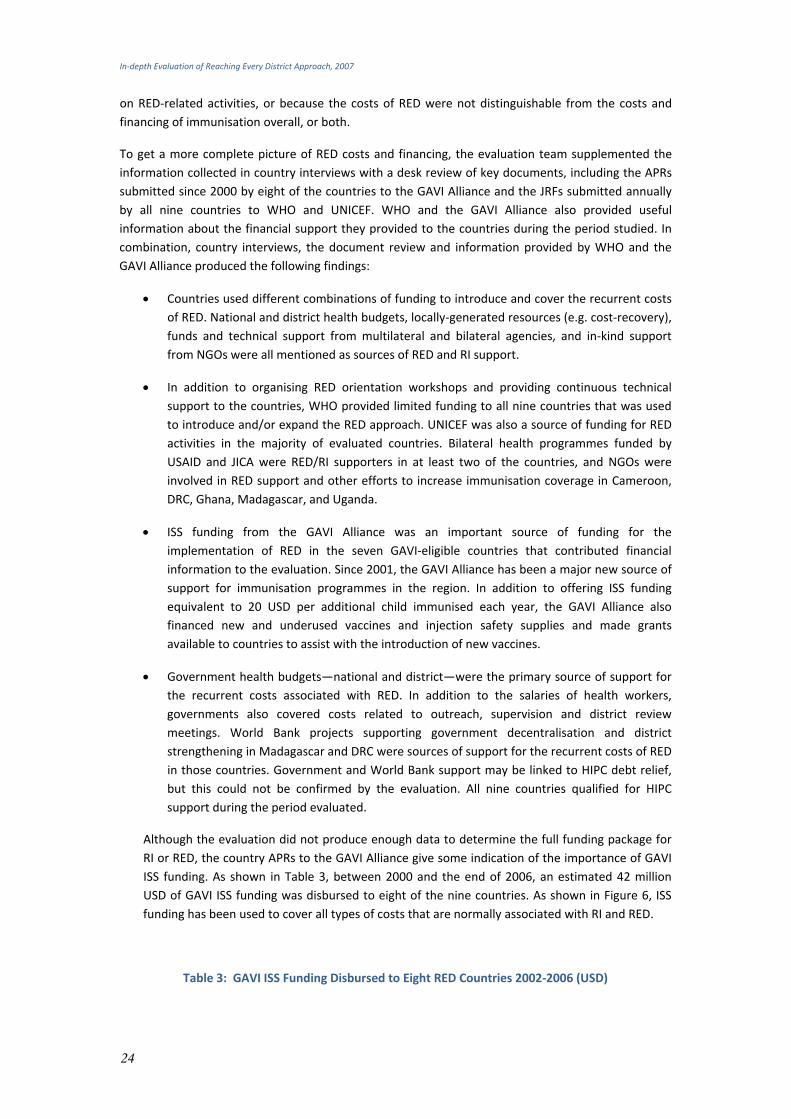
on RED‐related activities, or because the costs of RED were not distinguishable from the costs and financing of immunisation overall, or both.
To get a more complete picture of RED costs and financing, the evaluation team supplemented the information collected in country interviews with a desk review of key documents, including the APRs submitted since 2000 by eight of the countries to the GAVI Alliance and the JRFs submitted annually by all nine countries to WHO and UNICEF. WHO and the GAVI Alliance also provided useful information about the financial support they provided to the countries during the period studied. In combination, country interviews, the document review and information provided by WHO and the GAVI Alliance produced the following findings:
• Countries used different combinations of funding to introduce and cover the recurrent costs of RED. National and district health budgets, locally‐generated resources (e.g. cost‐recovery), funds and technical support from multilateral and bilateral agencies, and in‐kind support from NGOs were all mentioned as sources of RED and RI support.
• In addition to organising RED orientation workshops and providing continuous technical support to the countries, WHO provided limited funding to all nine countries that was used to introduce and/or expand the RED approach. UNICEF was also a source of funding for RED activities in the majority of evaluated countries. Bilateral health programmes funded by USAID and JICA were RED/RI supporters in at least two of the countries, and NGOs were involved in RED support and other efforts to increase immunisation coverage in Cameroon, DRC, Ghana, Madagascar, and Uganda.
• ISS funding from the GAVI Alliance was an important source of funding for the implementation of RED in the seven GAVI‐eligible countries that contributed financial information to the evaluation. Since 2001, the GAVI Alliance has been a major new source of support for immunisation programmes in the region. In addition to offering ISS funding equivalent to 20 USD per additional child immunised each year, the GAVI Alliance also financed new and underused vaccines and injection safety supplies and made grants available to countries to assist with the introduction of new vaccines.
• Government health budgets—national and district—were the primary source of support for the recurrent costs associated with RED. In addition to the salaries of health workers, governments also covered costs related to outreach, supervision and district review meetings. World Bank projects supporting government decentralisation and district strengthening in Madagascar and DRC were sources of support for the recurrent costs of RED in those countries. Government and World Bank support may be linked to HIPC debt relief, but this could not be confirmed by the evaluation. All nine countries qualified for HIPC support during the period evaluated.
Although the evaluation did not produce enough data to determine the full funding package for RI or RED, the country APRs to the GAVI Alliance give some indication of the importance of GAVI ISS funding. As shown in Table 3, between 2000 and the end of 2006, an estimated 42 million USD of GAVI ISS funding was disbursed to eight of the nine countries. As shown in Figure 6, ISS funding has been used to cover all types of costs that are normally associated with RI and RED.
Table 3: GAVI ISS Funding Disbursed to Eight RED Countries 2002‐2006 (USD)
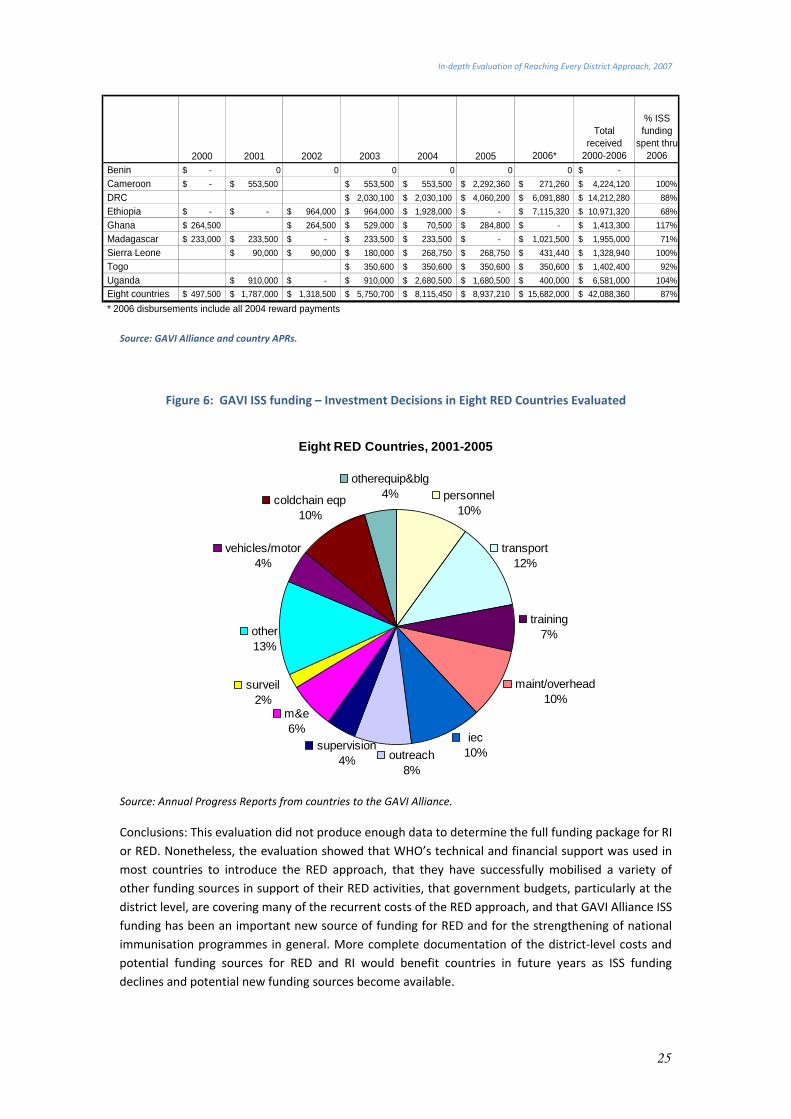
In‐depth Evaluation of Reaching Every District Approach, 2007
2000 2001 2002 2003 2004 2005 2006*
Total received
2000-2006
% ISS funding
spent thru 2006
Benin -$ 0 0 0 0 0 0 -$ Cameroon -$ 553,500$ 553,500$ 553,500$ 2,292,360$ 271,260$ 4,224,120$ 100%DRC 2,030,100$ 2,030,100$ 4,060,200$ 6,091,880$ 14,212,280$ 88%Ethiopia -$ -$ 964,000$ 964,000$ 1,928,000$ -$ 7,115,320$ 10,971,320$ 68%Ghana 264,500$ 264,500$ 529,000$ 70,500$ 284,800$ -$ 1,413,300$ 117%Madagascar 233,000$ 233,500$ -$ 233,500$ 233,500$ -$ 1,021,500$ 1,955,000$ 71%Sierra Leone 90,000$ 90,000$ 180,000$ 268,750$ 268,750$ 431,440$ 1,328,940$ 100%Togo 350,600$ 350,600$ 350,600$ 350,600$ 1,402,400$ 92%Uganda 910,000$ -$ 910,000$ 2,680,500$ 1,680,500$ 400,000$ 6,581,000$ 104%Eight countries 497,500$ 1,787,000$ 1,318,500$ 5,750,700$ 8,115,450$ 8,937,210$ 15,682,000$ 42,088,360$ 87%
* 2006 disbursements include all 2004 reward payments
Source: GAVI Alliance and country APRs.
Figure 6: GAVI ISS funding – Investment Decisions in Eight RED Countries Evaluated
Eight RED Countries, 2001-2005
training7%
coldchain eqp10%
iec10%outreach
8%
supervision4%
m&e6%
surveil2%
other13%
vehicles/motor4%
otherequip&blg4% personnel
10%
transport12%
maint/overhead10%
Source: Annual Progress Reports from countries to the GAVI Alliance.
Conclusions: This evaluation did not produce enough data to determine the full funding package for RI or RED. Nonetheless, the evaluation showed that WHO’s technical and financial support was used in most countries to introduce the RED approach, that they have successfully mobilised a variety of other funding sources in support of their RED activities, that government budgets, particularly at the district level, are covering many of the recurrent costs of the RED approach, and that GAVI Alliance ISS funding has been an important new source of funding for RED and for the strengthening of national immunisation programmes in general. More complete documentation of the district‐level costs and potential funding sources for RED and RI would benefit countries in future years as ISS funding declines and potential new funding sources become available.
25
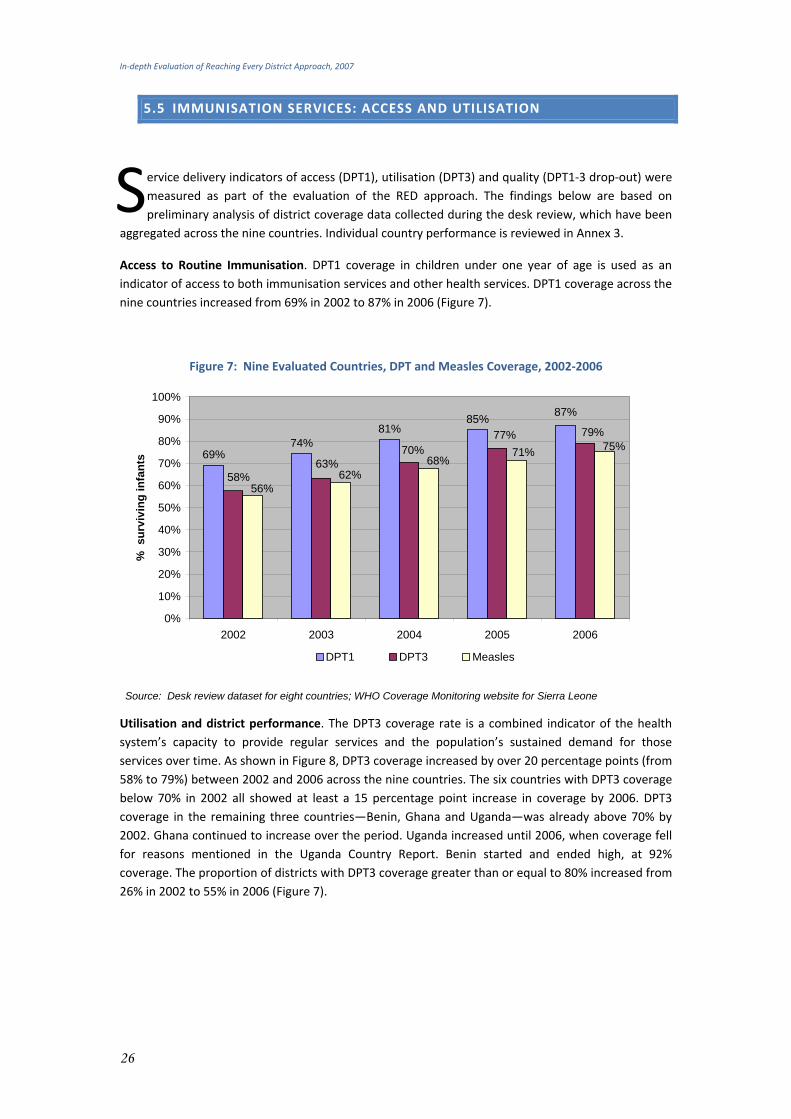
In‐depth Evaluation of Reaching Every District Approach, 2007
5.5 IMMUNISATION SERVICES: ACCESS AND UTILISATION
ervice delivery indicators of access (DPT1), utilisation (DPT3) and quality (DPT1‐3 drop‐out) were measured as part of the evaluation of the RED approach. The findings below are based on preliminary analysis of district coverage data collected during the desk review, which have been
aggregated across the nine countries. Individual country performance is reviewed in Annex 3.
SAccess to Routine Immunisation. DPT1 coverage in children under one year of age is used as an indicator of access to both immunisation services and other health services. DPT1 coverage across the nine countries increased from 69% in 2002 to 87% in 2006 (Figure 7).
Figure 7: Nine Evaluated Countries, DPT and Measles Coverage, 2002‐2006
69%63%
58%68%
62%56%
0%
10%
20%
30%
40%
50%
60%
70%
2002 2003 2004 2005 2006
% s
urvi
ving
infa
nts
74%81%
85% 87%
79%77%70% 75%71%
80%
90%
100%
DPT1 DPT3 Measles
Source: Desk review dataset for eight countries; WHO Coverage Monitoring website for Sierra Leone
Utilisation and district performance. The DPT3 coverage rate is a combined indicator of the health system’s capacity to provide regular services and the population’s sustained demand for those services over time. As shown in Figure 8, DPT3 coverage increased by over 20 percentage points (from 58% to 79%) between 2002 and 2006 across the nine countries. The six countries with DPT3 coverage below 70% in 2002 all showed at least a 15 percentage point increase in coverage by 2006. DPT3 coverage in the remaining three countries—Benin, Ghana and Uganda—was already above 70% by 2002. Ghana continued to increase over the period. Uganda increased until 2006, when coverage fell for reasons mentioned in the Uganda Country Report. Benin started and ended high, at 92% coverage. The proportion of districts with DPT3 coverage greater than or equal to 80% increased from 26% in 2002 to 55% in 2006 (Figure 7).
26
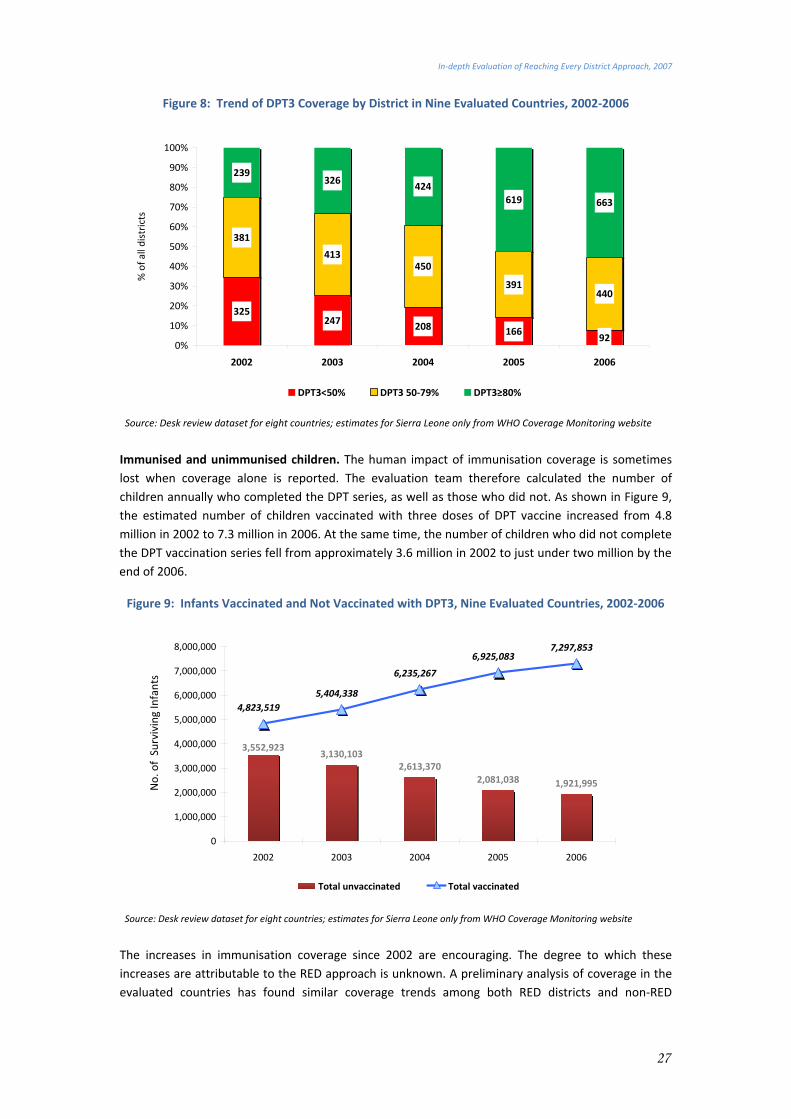
In‐depth Evaluation of Reaching Every District Approach, 2007
Figure 8: Trend of DPT3 Coverage by District in Nine Evaluated Countries, 2002‐2006
325247 208 166
92
381
413450
391440
239326 424
619 663
0%
10%
20%
30%
40%
50%
60%
70%
80%
90%
100%
2002 2003 2004 2005 2006
% of all districts
DPT3<50% DPT3 50‐79% DPT3≥80%
Source: Desk review dataset for eight countries; estimates for Sierra Leone only from WHO Coverage Monitoring website
Immunised and unimmunised children. The human impact of immunisation coverage is sometimes lost when coverage alone is reported. The evaluation team therefore calculated the number of children annually who completed the DPT series, as well as those who did not. As shown in Figure 9, the estimated number of children vaccinated with three doses of DPT vaccine increased from 4.8 million in 2002 to 7.3 million in 2006. At the same time, the number of children who did not complete the DPT vaccination series fell from approximately 3.6 million in 2002 to just under two million by the end of 2006.
Figure 9: Infants Vaccinated and Not Vaccinated with DPT3, Nine Evaluated Countries, 2002‐2006
3,130,1032,613,370
2,081,038 1,921,995
3,552,923
4,823,519 5,404,338
6,235,267
6,925,083 7,297,853
0
1,000,000
2,000,000
3,000,000
4,000,000
5,000,000
6,000,000
7,000,000
8,000,000
2002 2003 2004 2005 2006
No. of Surviving Infants
Total unvaccinated Total vaccinated
Source: Desk review dataset for eight countries; estimates for Sierra Leone only from WHO Coverage Monitoring website
The increases in immunisation coverage since 2002 are encouraging. The degree to which these increases are attributable to the RED approach is unknown. A preliminary analysis of coverage in the evaluated countries has found similar coverage trends among both RED districts and non‐RED
27
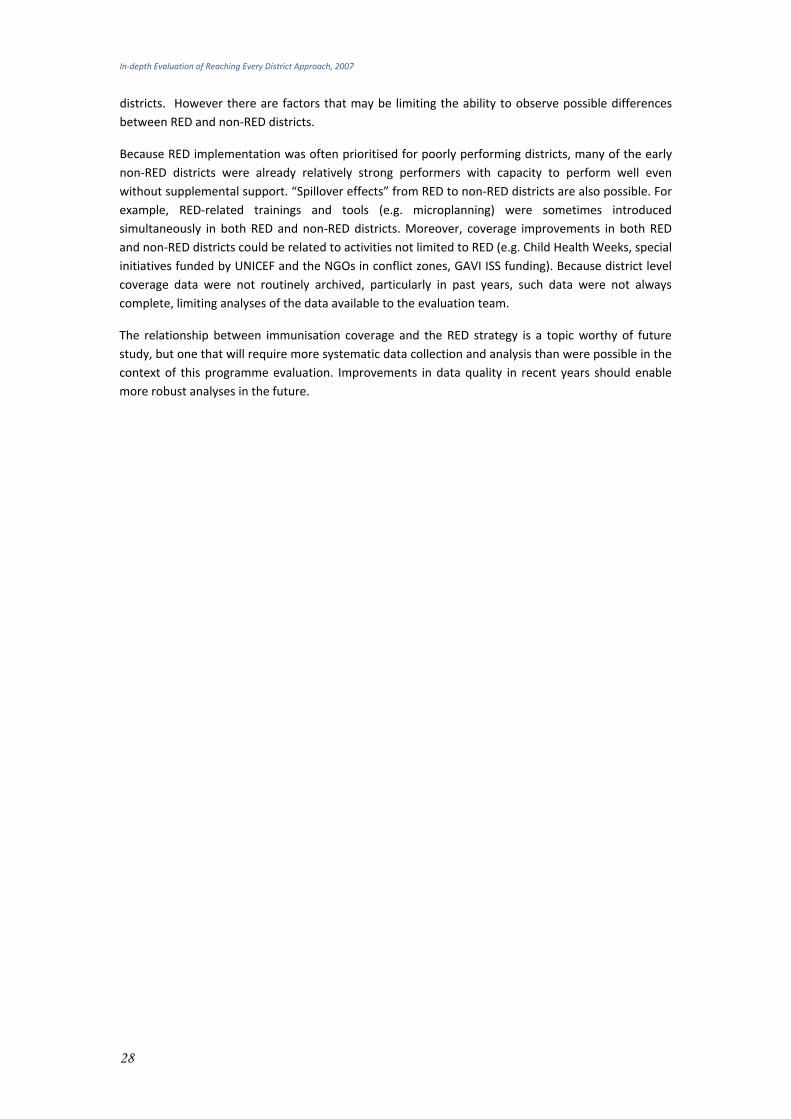
In‐depth Evaluation of Reaching Every District Approach, 2007
28
districts. However there are factors that may be limiting the ability to observe possible differences between RED and non‐RED districts.
Because RED implementation was often prioritised for poorly performing districts, many of the early non‐RED districts were already relatively strong performers with capacity to perform well even without supplemental support. “Spillover effects” from RED to non‐RED districts are also possible. For example, RED‐related trainings and tools (e.g. microplanning) were sometimes introduced simultaneously in both RED and non‐RED districts. Moreover, coverage improvements in both RED and non‐RED districts could be related to activities not limited to RED (e.g. Child Health Weeks, special initiatives funded by UNICEF and the NGOs in conflict zones, GAVI ISS funding). Because district level coverage data were not routinely archived, particularly in past years, such data were not always complete, limiting analyses of the data available to the evaluation team.
The relationship between immunisation coverage and the RED strategy is a topic worthy of future study, but one that will require more systematic data collection and analysis than were possible in the context of this programme evaluation. Improvements in data quality in recent years should enable more robust analyses in the future.
In‐depth Evaluation of Reaching Every District Approach, 2007
29
6. CONCLUSION, KEY LESSONS, RECOMMENDATIONS 6.1 KEY FINDINGS AND LESSONS LEARNED
• Context. There is generally strong government commitment for immunisation and broad‐based partnerships between government and key national and international partners in all nine countries. Government commitment and the involvement of partners (WHO, UNICEF, NGOs, etc.) is crucial for the successful introduction and scaling up of the RED approach. The evaluation showed that NGO partners have been particularly important in conflict‐affected districts.
• Introduction and scaling up of RED. There was considerable variation across countries and districts in their approach to implementation of the five RED components. Countries differed in how quickly they expanded RED, with a few launching nationally and others prioritising and phasing in new districts more gradually. All countries introduced RED as a package, but some gave more attention to some components than others. In 80% of districts evaluated, outreach was the component mentioned most often by district staff in describing what RED meant in their districts. As noted by district staff, the most notable changes since the introduction of the RED approach were the addition of outreach sites and an increase in community meetings.
• Planning and resource management. Annual immunisation plans were available in all countries at the national level, and in most districts and HFs. However, only half of district microplans indicated hard‐to‐reach populations and plans for reaching them. Although catchment area maps were found in more than two‐thirds of HFs, they commonly lacked details such as population, landmarks and hard‐to‐reach populations. Vaccine management remains an area for improvement. Stockouts of measles or DPT vaccine occurred within the last year at the district level in all but one of the nine countries and at the HF level in all but one country. DPT vaccine stockouts occurred in 16% of districts; measles vaccine stockouts in 15% of districts. Stockouts lasted an average of 4‐5 weeks. About half of HFs with a stockout reported having to turn children away from sessions due to stockouts; 24% of facilities cancelled sessions.
• Training. Training and managerial capacity gaps exist in many districts. Few current staff had
received recent immunisation training. Approximately one‐third of districts reported that at least 75% of district health management staff had been trained on EPI in the preceding two years. Rapid turnover of staff in most countries evaluated will result in an increasing proportion of untrained health workers in the near future.
• Supportive supervision. The majority (65%) of districts included supervision in their annual work
plans. However, only about a third of districts reported receiving supervision visits from the national level in the preceding three months. Visits from districts to HFs occurred more frequently (70% of facilities reported visits in the preceding three months). Supervisory checklists were commonly used (82% of facilities) and supervision of EPI was integrated with that of other health services in six of the nine countries. While the majority of HFs (78%) reported receiving immediate verbal feedback, written supervisory feedback was documented less often, in only about a third of facilities, as was follow‐up on recommendations. However, district review meetings occurred in almost all districts, providing opportunities for training, albeit underutilised.
• Outreach. District and HF staff identified outreach sessions as a positive contributor to
immunisation service delivery. Most countries reported an increase in the number of outreach sessions planned and held since the introduction of RED, and outreach was commonly linked to other maternal and child health interventions. Although a majority (62%) of HFs reported

In‐depth Evaluation of Reaching Every District Approach, 2007
30
conducting >80% of planned outreach sessions, less than a third of districts were able to show catchment area maps indicating outreach sites. HF staff in approximately one‐third of facilities reported that communities were involved in outreach session scheduling. However, staff in approximately one in four districts and facilities reported that they had not yet reached all communities with fixed, outreach or mobile sessions, mostly due to limited transportation and/or inadequate numbers of health personnel. Because many districts and facilities combined fixed and outreach session data when reporting to higher administrative levels, analysis of progress and coverage achieved through outreach is difficult, creating challenges for resource allocation.
• Community. The community component, found to be among the weakest RED components in
2005, now shows improvement with community volunteers active in all countries, typically assisting with defaulter tracking, outreach, and community education. Two‐thirds of HFs reported holding regular meetings with the community, and the majority (74%) of facilities reported that community volunteers had been trained to assist with immunisation activities. Approximately half of HFs with community volunteers reported providing some form of incentive (such as training and transportation reimbursement). Increases in the number of community meetings were also reported.
• Monitoring for action. Immunisation monitoring charts were displayed in most districts, HFs.
Eighty‐three percent of HF charts were up‐to‐date, 75% were correct, and 70% of health workers were able to explain their facility’s performance using the chart. Ninety‐five percent of districts reported conducting review meetings with their HFs during the past year, at which time immunisation data were discussed. In half of the HFs, staff perceived that denominator estimates, mostly based on census data, were inaccurate. Fewer than half of the HFs had methods other than immunisation registers for tracking defaulters. Although data quality has improved across the countries, the desk review found that problems at district level continue, including erroneous and/or changing denominators, division of districts into new districts with unknown target populations, incomplete reporting and/or the failure to archive district data at national level.
• Integration. Provision of immunisation services with other maternal and child health services was
reported as common in HFs and outreach sessions. Interventions reported included Vitamin A supplementation, family planning, antenatal care, bednet distribution, deworming, growth monitoring and curative care. However, the characteristics differ from one country to another (definition, impact on resource utilisation and service quality, best practices, content, etc.).
• Financing RED and RI. Countries have used a variety of funding sources to introduce and scale up
the RED approach. These include their national and district health budgets, WHO and UNICEF grants, in‐kind support from NGO partners and GAVI ISS funding. The GAVI Alliance has provided significant new discretionary funding for RI to eight of the nine countries evaluated, funding that several countries have used to introduce and expand RED. GAVI has also created an incentive for improved performance by rewarding countries for each additional child immunised before one year of age.
• Access and utilisation of immunisation services. Although not necessarily attributable to RED,
immunisation coverage increases among the nine countries are encouraging. DPT1 coverage (the principal indicator of access to immunisation services) increased from an estimated 69% of children less than one year of age in 2002, to 87% in 2006. Utilisation, as measured by DPT3 coverage, increased across the nine countries as well, from 57% to 79% over the same period. Since the RED approach was introduced in 2002, there have been impressive gains in RI coverage, not only in these nine countries, but also across the entire WHO Africa Region.
• General. Although regional immunisation coverage has increased steadily since 2002, intensified
efforts are needed to achieve the ambitious immunisation coverage goals set forth in the GIVS and the mortality reduction goals set forth in the MDGs. This evaluation has shown that the RED approach can be an important tool for addressing immunisation performance and strengthening the district management of immunisation and other maternal and child health services.

In‐depth Evaluation of Reaching Every District Approach, 2007
31
6.2 KEY RECOMMENDATION ‐ PARTNERS
The following recommendations are directed at the partners of national immunisation programmes, including WHO, UNICEF, the GAVI Alliance, bilateral agencies and national and international NGOs:
1. Revise the RED approach guidelines to include specific standards and indicators for all five RED components. The evaluation team recommends a region‐wide review and standardisation of indicators and monitoring tools so that countries are better able to monitor and assess district progress toward full implementation of the RED components. Examples of indicators can be drawn from existing tools.
2. Support a regional or multi‐country forum on RED and RI strengthening to share lessons
learned, best practices and challenges. Opportunities for countries to share and discuss their experiences and tools with each other should be supported by the partners in order to focus attention on RI. For example, sharing best practices on methods and tools used in tracking newborns and defaulters (a need reflected in the finding that half of facilities reported no default tracking method other than facility registers) could benefit countries. The forum could be added days to an existing, annual regional conference on RI. Providing more time for RI topics during annual EPI managers’ meetings is also recommended.
3. Support countries to document costs and advocate for new funding for RI. Countries
studied used national and district health budgets, grants from WHO and other partners, as well as GAVI Alliance ISS funding for implementation of RED. As coverage levels improve, these countries will be eligible for smaller amounts of ISS funding each year. Declining ISS funding in some countries could affect the sustainability of the coverage gains, but potential new sources of support for immunisation (through GAVI HSS, HIPC, World Bank, and other sources) should also be tapped. In order to advocate for necessary resources, managers at national and district levels must be prepared with accurate estimates of their financial needs and knowledge of potential funding sources. They may also require improved advocacy skills.
4. Support WHO’s Africa Regional Office ongoing efforts to define and determine the impact
of integrating immunisation and other priority health services. The evaluation team recommends that the characteristics and impact of integrated services be evaluated to enable adoption of best practices and ensure optimal delivery of both immunisation and other services. The team further recommends documentation and definition of the different integration approaches to facilitate future communication on the subject.
5. Under WHO’s Africa Regional Office leadership, continue to work across countries to
improve the availability and use of reliable district coverage data. Although data quality has improved across the countries, problems at district level continue, as described in the “Monitoring for action” finding. WHO’s Africa Regional Office efforts, through the ICSTs (spell out and add to acronym list), and country efforts through Data Quality Self Assessment exercises should improve immunisation data quality over time, but this will require attention and support by all partners.

In‐depth Evaluation of Reaching Every District Approach, 2007
32
6.3 KEY RECOMMENDATIONS ‐ COUNTRIES
Building on the many achievements and lessons learned with the RED approach, intensified efforts are now required to ensure that coverage continues to improve and past gains are sustained. The following recommendations are directed at national immunisation programmes:
1. Keep up the good work! There has been very encouraging progress across the AFR countries in implementing RED, particularly in reinvigorating outreach, improving community linkages and increasing immunisation coverage. To guarantee that the GIVS and MDG goals are met, countries are encouraged to ensure that all RED components are fully implemented.
2. Ensure that all districts implementing RED are provided sufficient funding, training and technical support. To ensure that districts have the support they need, advocacy within Ministries of Health and with Ministries of Finance and external donors will be required to secure necessary budget. EPI managers and ICC members should prepare themselves with information about programme costs and possible new sources of funding for immunisation (GAVI ISS, HIPC, World Bank and others). The evaluation noted that in several countries, districts that were early adopters of the RED approach received greater attention and more detailed orientation than did the districts added in more recent years. Careful monitoring of performance in these new RED districts is suggested. In line with the GIVS’ aim of achieving a minimum of four immunisation contacts with all infants, country plans should include specific strategies for assisting districts and HFs to access their hard‐to‐reach populations.
3. Systematically assess and address reasons for stockouts. Take steps to identify reasons for stockouts and develop plans to minimise their frequency and duration. Training of EPI staff should include methods for accurate vaccine forecasting and use of stock management records to track stock levels, vaccine usage and wastage rates.
4. Ensure adequate planning for supervision, improved feedback mechanisms, and sufficient resources for the transportation and allowances of supervisors. Supervision visits provide opportunities for on‐the‐job training. Integrated supervision should not compromise the quality of and time spent on supervision of immunisation services. Strategies to ensure adequate time for supervision and on‐the‐job training should be identified by country, province and district staff and tested (e.g., alternate schedules for longer but less frequent visits, personal digital assistant (PDA) use, and peer‐review methods).
5. Address barriers to provision of outreach services to communities. Because staff in a quarter of HFs and districts indicated that they are not reaching all populations or communities with outreach, countries should work with districts and facilities to analyse the challenges and reasons for failing to reach communities and to design and implement strategies to address the barriers.
6. Evaluate and continue to strengthen links between health facilities and communities. In an effort to further strengthen links, community leaders and volunteers should be interviewed. The opinions of communities and families should guide future changes in immunisation services. Lessons learned working with community volunteers should be documented. To improve the effectiveness of their joint work, districts, HFs and community volunteers would benefit from a standard set of tools and guidelines for newborn and defaulter tracking and additional community‐appropriate IEC materials.
7. Improve the quality of immunisation data and encourage its regular analysis and use. The current practice of holding regular review meetings at district level should be encouraged. National review meetings should also be held. To enable optimal planning, districts should be encouraged to report separately on vaccinations given at fixed and outreach sessions. To better track the integrated delivery of immunisation and other priority services, WHO’s Africa Regional Office is developing an integrated tally sheet that should be tested before widespread introduction. Future training should include a focus on data interpretation and use.

In‐depth Evaluation of Reaching Every District Approach, 2007
33
ANNEXES
ANNEX 1–RED EVALUATION FRAMEWORK
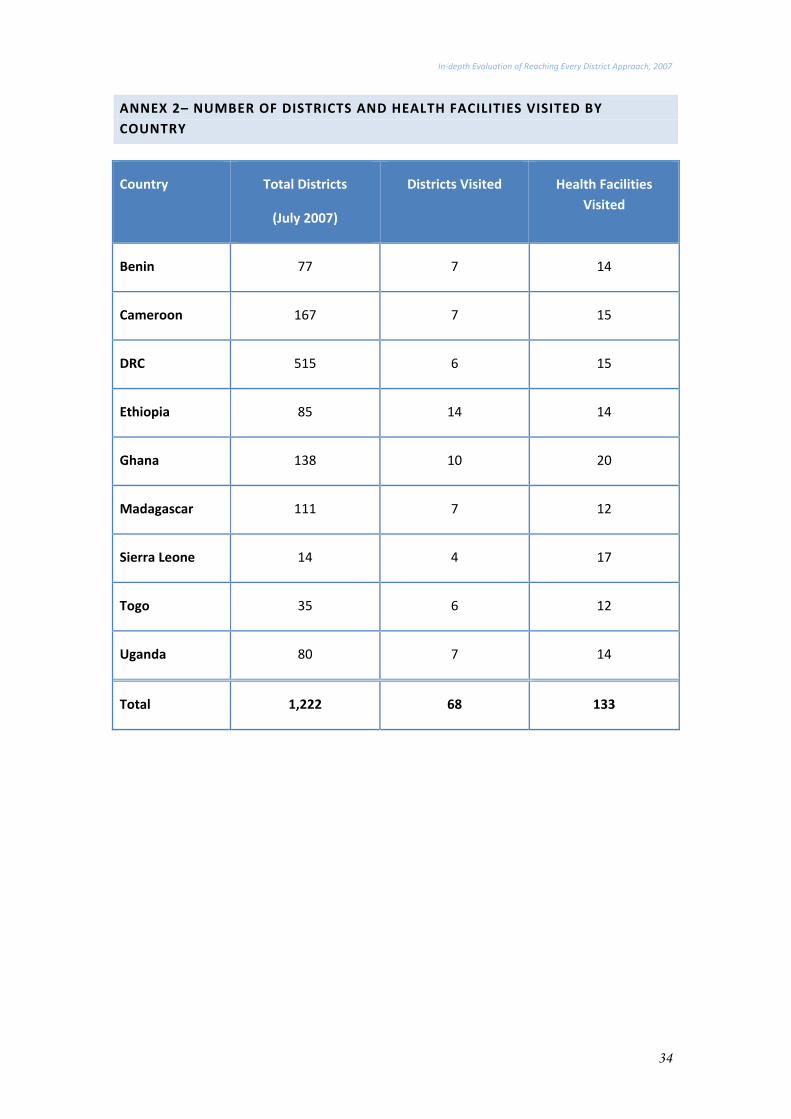
In‐depth Evaluation of Reaching Every District Approach, 2007
34
ANNEX 2– NUMBER OF DISTRICTS AND HEALTH FACILITIES VISITED BY COUNTRY
Country Total Districts
(July 2007)
Districts Visited Health Facilities Visited
Benin 77 7 14
Cameroon 167 7 15
DRC 515 6 15
Ethiopia 85 14 14
Ghana 138 10 20
Madagascar 111 7 12
Sierra Leone 14 4 17
Togo 35 6 12
Uganda 80 7 14
Total 1,222 68 133

In‐depth Evaluation of Reaching Every District Approach, 2007
35
ANNEX 3 – NINE RED COUNTRY PROFILES
The following country profiles are based on reports from each of the nine country evaluation visits and data from the RED evaluation desk review. The country reports include information gathered in mid‐2007, and thus may differ slightly from the desk review dataset, which ends in 2006. Where differences occur, country profiles include explanatory footnotes.
The desk review dataset includes district‐by‐district population and coverage information for all of the countries in each year, except Sierra Leone because district target populations were available for only two of the five years. Data from the WHO Coverage Monitoring website were therefore used to generate rates for Sierra Leone. Discrepancies between the estimates in these profiles and those reported on the WHO/UNICEF JRFs may be related to missing or combined district data, adjustments made after the JRFs were submitted and other factors.
Not all countries visited use the term “district”. The country evaluation teams used the term to describe the closest comparable administrative level in countries where this was the case (e.g., DRC’s “zones” are the district equivalent).
For more detailed findings and recommendations, see the country‐specific RED evaluation reports.

In‐depth Evaluation of Reaching Every District Approach, 2007
BENIN Benin has a population of 7,560,930 (2005), of which over 30% live under conditions of extreme poverty. The number of children under age one in 2006 was estimated to be 284,808. Benin has a high‐performing immunisation programme, with DPT3 coverage in both 2005 and 2006 above 90%. The RED approach has been in place since its introduction in 22 of the country’s 777 districts in 2003. (Figure A). The number of districts reporting DPT3 coverage of at least 80% increased from 56 in 2003 to 67 in 2006 (Figure B). Between these years, the number of unimmunised children decreased from 30,766 to 23,340 (Figure C).
Figure A. RED Introduction and Scale‐up: Benin
27 27 27
0
22
36% 36% 36%
0%
29%
0
10
20
30
40
50
60
70
2002 2003 2004 2005 2006
No. of D
istricts
0%10%20%30%40%50%60%70%80%90%100%
% of T
otal Districts
RED Districts % RED Districts (Cumulative)
Source: Desk review dataset
Planning and managing resources. Four of seven districts had plans of action, which are drafted by the district staff in collaboration with community representatives and health centre heads. Comprehensive microplans at the facility level were rarely present. Catchment area maps were present in 57% of the facilities visited. All districts had functioning and adequate cold chain equipment with good temperature monitoring, but there was a lack of trained personnel in cold chain equipment maintenance.
Figure B. Benin: Trend of District Performance(DPT3 Coverage)
11 2031
12
6456
44
64 67
11 0 0 09
0%10%20%30%40%50%60%70%80%90%100%
2002 2003 2004 2005 2006
% of a
ll districts
DPT3<50% DPT3 50‐79% DPT3≥80%
Source: Desk review dataset
Re‐establishing outreach services. Since the launch of the RED approach, 80% of facilities have increased the number of outreach sites. Data are not disaggregated by fixed or outreach sessions. Supportive supervision. District plans of action incorporate supportive supervision activities, with the national budget covering the costs for per diem and gas. However, a detailed calendar of scheduled facility visits was rarely observed, and most facilities reported being supervised only once or twice in 12 months. Supervision visits tended to be integrated and feedback was verbal or short notes were written in the supervision register.
Figure C. Infants vaccinated and not vaccinated with DPT3 Benin, 2002‐2006
18,263 30,764 43,74321,901 23,340
214,069 228,819 217,044
247,630 261,468
0
50,000
100,000
150,000
200,000
250,000
300,000
2002 2003 2004 2005 2006
No. of Surviving Infants
Total unvaccinated Total vaccinated
Source: Desk review dataset
Linking services and communities. District plans of action refer to strengthening community linkages, but meetings with community leaders are irregular. At the facility level, routine meetings are held with community representatives, community health volunteers and traditional healers to address health issues. Volunteers raise community awareness on vaccination, register births and deaths, track defaulters and prepare outreach sites. Through district level cost‐recovery schemes, they are offered small incentives, which raise concerns about sustainability. Monitoring for action. The majority of sites visited had coverage monitoring charts which could be correctly interpreted by staff. There was no vaccination register to track individual children, as EPI cards were used. Facility reports are submitted and reviewed monthly at district review meetings. In 2006, five of seven districts visited reported dropout rates higher than 10%.
7 The country report reflects 77 districts and the district data set reflects 76 districts.
36

In‐depth Evaluation of Reaching Every District Approach, 2007
CAMEROON A central African country with a surface area of 475 650 km2, Cameroon’s population was estimated to be about 18 million with 722,138 under the age of one in 2006. Ten administrative provinces, 58 departments, 269 “arrondisements” and 54 administrative districts subdivide the country. The RED approach was introduced in 2003 in a phased manner, first in 22 health districts8 and then expanded in 2005 to cover all of Cameroon’s 167 health districts (Figure A). For the first two years, districts were selected using the following criteria: population size, number of unvaccinated children and feasibility of implementation.
Figure A. RED Introduction and Scale‐up: Cameroon
0 22 22
167159
0%
15% 14%
100% 100%
0
20
40
60
80
100
120
140
160
2002 2003 2004 2005 2006
No. of Districts
0%
20%
40%
60%
80%
100%
% of T
otal Districts
RED Districts % RED Districts (Cumulative)
Source: Desk review dataset
DPT3 coverage increased from 63% in 2002 to 81% in 2006. Districts achieving >80% coverage increased from 27 in 2002 to 83 in 2006 (Figure B). Between these years, the number of unimmunised children decreased from 235,597 to 138,125 (Figure C). The following are key findings from the eight districts and 15 HFs visited: Figure B. Cameroon: Trend of District Performance
(DPT3 Coverage)
399 9 5 5
78
91 108
73 79
2744 42
81 83
0%10%20%30%40%50%60%70%80%90%100%
2002 2003 2004 2005 2006
% of a
ll districts
DPT3<50% DPT3 50‐79% DPT3≥80%
Source: Desk review dataset
Planning and management of resources. All districts had microplans and district and health catchment areas had maps. A high proportion of district staff were trained, and a functional cold chain exists. However, microplanning was not implemented at the HF level, district and health facility maps do not show essential information and vaccine stockouts were observed. Re‐establishing outreach services. Since the introduction of the RED approach, outreach sessions have increased; regular outreach sessions and vaccinations given are reported separately (fixed versus outreach). However, outreach sessions conducted by health catchment area were not effective. Portions of hard‐to‐reach populations remain unreached.
upportive supervision. Integrated supervision is being
inking services and communities. Community health
onitoring for action. Data collection tools and
Figure C. Infants vaccinated and not vaccinated with DPT3 Cameroon, 2002‐2006
235,597181,272 187,149
142,435 138,125
408,596 481,605 494,951
559,439 584,012
0
100,000
200,000
300,000
400,000
500,000
600,000
700,000
2002 2003 2004 2005 2006
No. of Surviving Infants
Total unvaccinated Total vaccinated
Source: Desk review dataset
Sconducted using checklists, and verbal and written feedback is provided. However, supervision remains ineffective and of poor quality in most areas. Lvolunteers are active and working with different health programmes; however, not all health workers understand the role they may play. Mreporting forms such as monthly monitoring charts are available. However, defaulters and newborns are not tracked. In most cases, data are not used for guiding decisions.
8 The country report states 24 priority RED districts in 2003. However, the district dataset reflects 22.
37
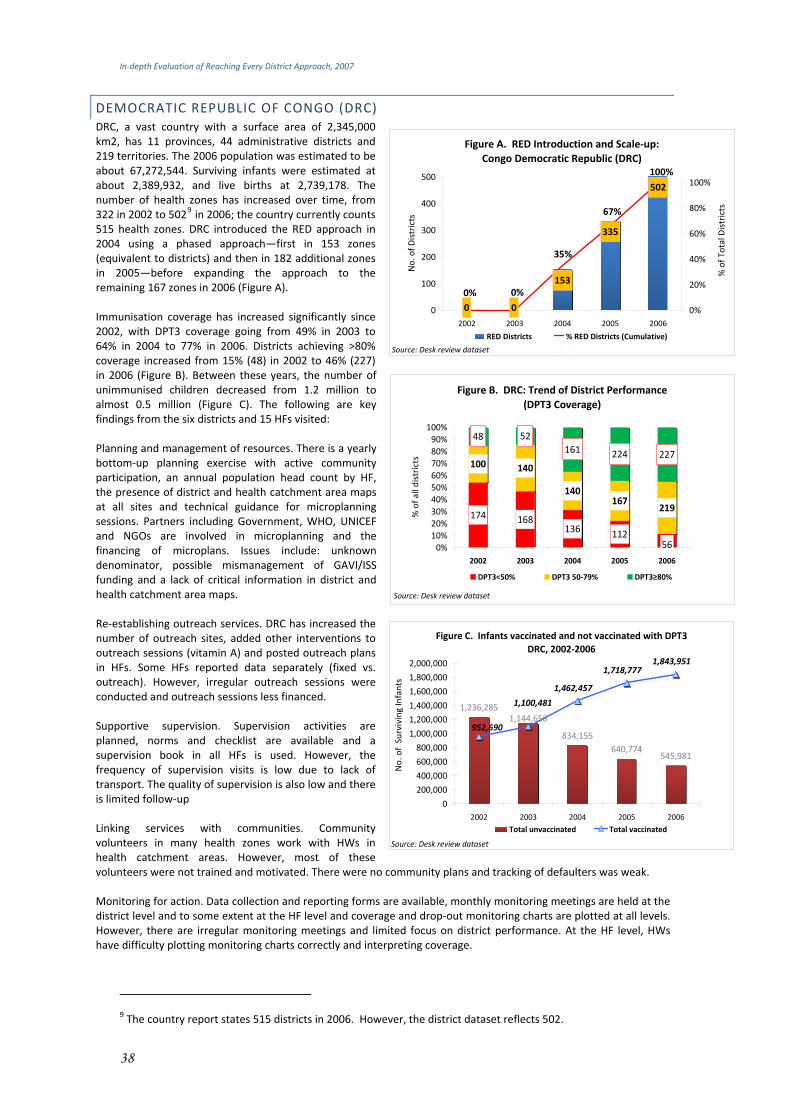
In‐depth Evaluation of Reaching Every District Approach, 2007
DEMOCRATIC REPUBLIC OF CONGO (DRC) DRC, a vast country with a surface area of 2,345,000 km2, has 11 provinces, 44 administrative districts and 219 territories. The 2006 population was estimated to be about 67,272,544. Surviving infants were estimated at about 2,389,932, and live births at 2,739,178. The number of health zones has increased over time, from 322 in 2002 to 5029 in 2006; the country currently counts 515 health zones. DRC introduced the RED approach in 2004 using a phased approach—first in 153 zones (equivalent to districts) and then in 182 additional zones in 2005—before expanding the approach to the remaining 167 zones in 2006 (Figure A).
Figure A. RED Introduction and Scale‐up: Congo Democratic Republic (DRC)
153
335
502
0 0
100%
67%
35%
0%0%
0
100
200
300
400
500
2002 2003 2004 2005 2006
No. of D
istricts
0%
20%
40%
60%
80%
100%
% of T
otal Districts
RED Districts % RED Districts (Cumulative)
Source: Desk review dataset
Immunisation coverage has increased significantly since 2002, with DPT3 coverage going from 49% in 2003 to 64% in 2004 to 77% in 2006. Districts achieving >80% coverage increased from 15% (48) in 2002 to 46% (227) in 2006 (Figure B). Between these years, the number of unimmunised children decreased from 1.2 million to almost 0.5 million (Figure C). The following are key findings from the six districts and 15 HFs visited:
Figure B. DRC: Trend of District Performance(DPT3 Coverage)
174 168136 112
100 140
140167
219
48 52161 224 227
560%10%20%30%40%50%60%70%80%90%
100%
2002 2003 2004 2005 2006
% of a
ll districts
DPT3<50% DPT3 50‐79% DPT3≥80%
Source: Desk review dataset
Planning and management of resources. There is a yearly bottom‐up planning exercise with active community participation, an annual population head count by HF, the presence of district and health catchment area maps at all sites and technical guidance for microplanning sessions. Partners including Government, WHO, UNICEF and NGOs are involved in microplanning and the financing of microplans. Issues include: unknown denominator, possible mismanagement of GAVI/ISS funding and a lack of critical information in district and health catchment area maps. Re‐establishing outreach services. DRC has increased the number of outreach sites, added other interventions to outreach sessions (vitamin A) and posted outreach plans in HFs. Some HFs reported data separately (fixed vs. outreach). However, irregular outreach sessions were conducted and outreach sessions less financed.
Figure C. Infants vaccinated and not vaccinated with DPT3 DRC, 2002‐2006
1,236,285
834,155640,774
545,981
1,144,656
1,462,457
1,718,777 1,843,951
952,690
1,100,481
0
200,000
400,000
600,000
800,000
1,000,000
1,200,000
1,400,000
1,600,000
1,800,000
2,000,000
2002 2003 2004 2005 2006
No. of Surviving Infants
Total unvaccinated Total vaccinated
Source: Desk review dataset
Supportive supervision. Supervision activities are planned, norms and checklist are available and a supervision book in all HFs is used. However, the frequency of supervision visits is low due to lack of transport. The quality of supervision is also low and there is limited follow‐up Linking services with communities. Community volunteers in many health zones work with HWs in health catchment areas. However, most of these volunteers were not trained and motivated. There were no community plans and tracking of defaulters was weak. Monitoring for action. Data collection and reporting forms are available, monthly monitoring meetings are held at the district level and to some extent at the HF level and coverage and drop‐out monitoring charts are plotted at all levels. However, there are irregular monitoring meetings and limited focus on district performance. At the HF level, HWs have difficulty plotting monitoring charts correctly and interpreting coverage.
9 The country report states 515 districts in 2006. However, the district dataset reflects 502.
38
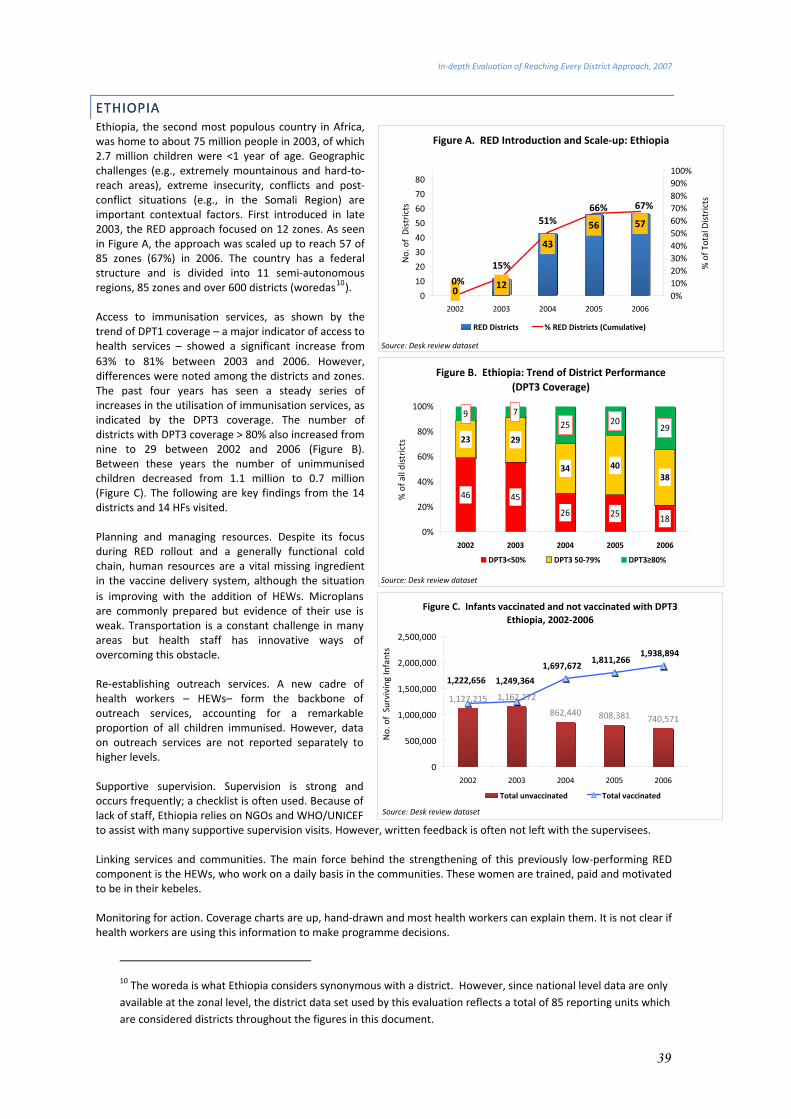
In‐depth Evaluation of Reaching Every District Approach, 2007
ETHIOPIA ETHIOPIA Ethiopia, the second most populous country in Africa, was home to about 75 million people in 2003, of which 2.7 million children were <1 year of age. Geographic challenges (e.g., extremely mountainous and hard‐to‐reach areas), extreme insecurity, conflicts and post‐conflict situations (e.g., in the Somali Region) are important contextual factors. First introduced in late 2003, the RED approach focused on 12 zones. As seen in Figure A, the approach was scaled up to reach 57 of 85 zones (67%) in 2006. The country has a federal structure and is divided into 11 semi‐autonomous regions, 85 zones and over 600 districts (woredas10).
Figure A. RED Introduction and Scale‐up: Ethiopia
12
43
56 57
0
15%
51%66% 67%
0%0
10
20
30
40
50
60
70
80
2002 2003 2004 2005 2006
No. of Districts
0%10%20%30%40%50%60%70%80%90%100%
% of T
otal Districts
RED Districts % RED Districts (Cumulative)
Source: Desk review dataset
Access to immunisation services, as shown by the trend of DPT1 coverage – a major indicator of access to health services – showed a significant increase from 63% to 81% between 2003 and 2006. However, differences were noted among the districts and zones. The past four years has seen a steady series of increases in the utilisation of immunisation services, as indicated by the DPT3 coverage. The number of districts with DPT3 coverage > 80% also increased from nine to 29 between 2002 and 2006 (Figure B). Between these years the number of unimmunised children decreased from 1.1 million to 0.7 million (Figure C). The following are key findings from the 14 districts and 14 HFs visited.
Figure B. Ethiopia: Trend of District Performance(DPT3 Coverage)
46 45
26 25 18
23 29
34 4038
9 725 20
29
0%
20%
40%
60%
80%
100%
2002 2003 2004 2005 2006
% of a
ll districts
DPT3<50% DPT3 50‐79% DPT3≥80%
Source: Desk review dataset
Planning and managing resources. Despite its focus during RED rollout and a generally functional cold chain, human resources are a vital missing ingredient in the vaccine delivery system, although the situation is improving with the addition of HEWs. Microplans are commonly prepared but evidence of their use is weak. Transportation is a constant challenge in many areas but health staff has innovative ways of overcoming this obstacle.
39
Re‐establishing outreach services. A new cadre of health workers – HEWs– form the backbone of outreach services, accounting for a remarkable proportion of all children immunised. However, data on outreach services are not reported separately to higher levels. Supportive supervision. Supervision is strong and occurs frequently; a checklist is often used. Because of lack of staff, Ethiopia relies on NGOs and HO/UNICEF to assist with many upport ve sup rvision isits. Howeve
Ws i e v r, written feedback is often not left with the supervisees.
Linking services and communities. The main force behind the strengthening of this previously low‐performing RED
onitoring for action. Coverage charts are up, hand‐drawn and most health workers can explain them. It is not clear if health workers are using this information to make programme decisions.
Figure C. Infants vaccinated and not vaccinated with DPT3 Ethiopia, 2002‐2006
1,127,215 1,162,272
862,440 808,381 740,571
1,697,672 1,811,266
1,938,894
1,222,656 1,249,364
0
500,000
1,000,000
1,500,000
2,000,000
2,500,000
2002 2003 2004 2005 2006
No. of Surviving Infants
Total unvaccinated Total vaccinated
Source: Desk review dataset
component is the HEWs, who work on a daily basis in the communities. These women are trained, paid and motivated to be in their kebeles. M
10 The woreda is what Ethiopia considers synonymous with a district. However, since national level data are only available at the zonal level, the district data set used by this evaluation reflects a total of 85 reporting units which are considered districts throughout the figures in this document.

In‐depth Evaluation of Reaching Every District Approach, 2007
40
GHANA Ghana has a total population of 22,300,915, with 892,157 children under the age of one (2006). The health system is decentralised, with 138 districts in the country. Starting in 2003, ‘Reaching Every Child’ (REC), as the RED approach is called in Ghana, was implemented in four priority districts using additional time‐limited funding from WHO. Although Ghana embraced the concept of REC, the approach was not introduced as such (Figure A). There was no orientation at any level, nor were guidelines or REC‐specific trainings introduced. All districts in the country are urged to improve their immunisation services through the expansion of outreach and improved static services. Districts achieving ≥ 80% Penta3 coverage increased from 51 in 2002 to 107 in 2006 (there were 28 more districts in 2006 than in 2002; see Figure B). Between these years the number of unimmunised children decreased from 175,519 to 142,187 (Figure C). The following are key findings from the ten districts and 20 HFs visited. Planning and management of resources. District microplans were available in slightly over half (60%) of the districts and 90% of the HFs evaluated. Fourteen of the HFs had maps, of which 50% included all elements. All districts had transportation and cold chain inventories. In half of the districts, the entire DHMT had received training in the past 24 months. However, only 20% of districts had a plan for training new staff. Re‐establishing outreach services. Outreach sessions were conducted by all HFs visited, with half of the facilities estimating that 100% of planned sessions were held. Outreach sites were generally visited monthly. Data from fixed and outreach sessions were not disaggregated for monitoring or reporting purposes. Supportive supervision. All districts conduct integrated supervision at least quarterly, with the majority using a checklist. However, checklists are not standardised. Written feedback was found in only 15% of the HFs; 90% reported verbal feedback. The supportive aspect of supervision is lacking. Linking services with communities. Community‐based surveillance volunteers are actively involved in immunisation services. These volunteers assist with defaulter tracking in 75% of the HFs. However, volunteers felt that they were not adequately compensated for their services. Community members are also actively involved in education and mobilisation, the conduct of outreach sessions and planning. NGO support is lacking in parts of the country. Monitoring for action. Monitoring tools were consistently found at sites, yet their use was sub‐optimal. Only half of the HFs and 70% of the districts visited had up‐to‐date wall charts. Less than half of the facilities (40%) had an up‐to‐date method, in addition to the register, for tracking defaulters. Private sector doses administered are not collected, which is particularly problematic in greater Accra. Data analysis is not adequately incorporated into supervisory visits. Regular quarterly review meetings are conducted in the majority of the districts.
Figure C. Infants vaccinated and not vaccinated with DPT3 Ghana, 2002‐2006
175,519 200,295 206,220134,496 142,187
623,292 620,886 637,881 733,261 752,097
0100,000200,000300,000400,000500,000600,000700,000800,000
2002 2003 2004 2005 2006
No. of Surviving Infants
Total unvaccinated Total vaccinated
Source: Desk review dataset
Figure B. Ghana: Trend of District Performance(DPT3 Coverage)
1 1 3
58 56 5535 31
51 53 55100 107
0 00%10%20%30%40%50%60%70%80%90%
100%
2002 2003 2004 2005 2006
No of all districts
DPT3<50% DPT3 50‐79% DPT3≥80%
Source: Desk review dataset
Figure A. RED Introduction and Scale‐up: Ghana
138 138
640
100%100%
0% 4% 5%
0
20
40
60
80
100
120
140
2002 2003 2004 2005 2006
No. of Districts
0%10%20%30%40%50%60%70%80%90%100%
% of Total Districts
RED Districts % RED Districts (Cumulative)
Source: Desk review dataset
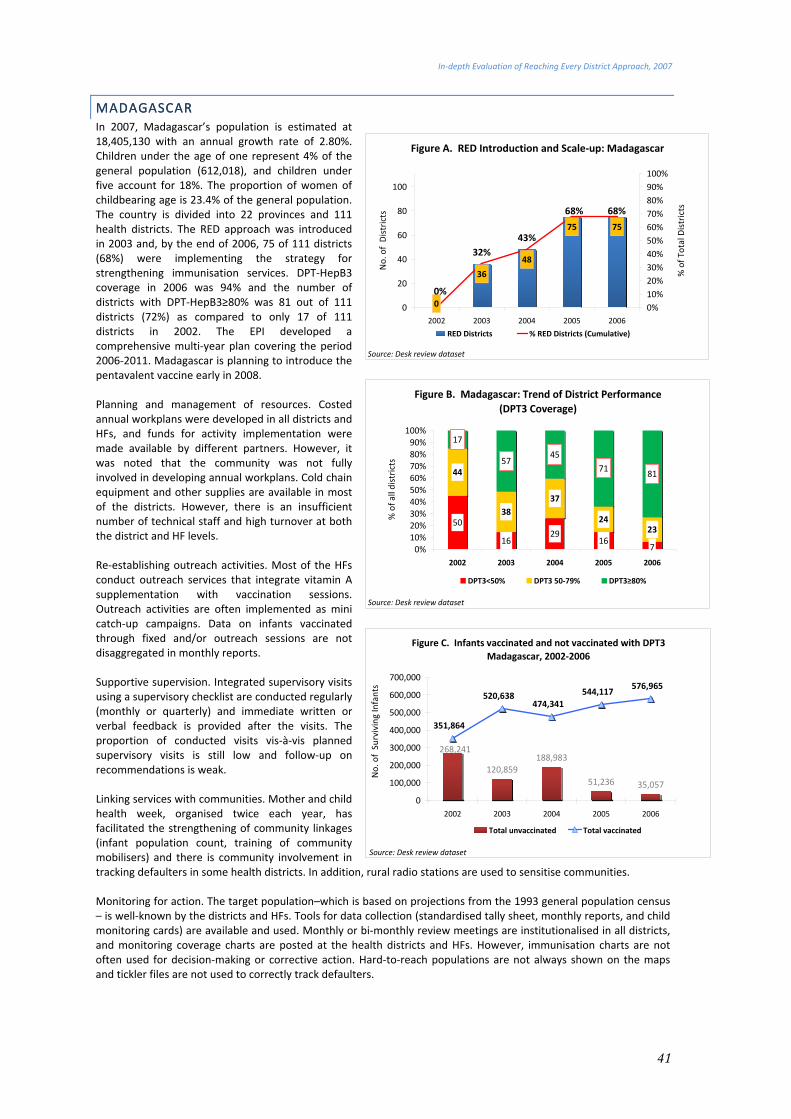
In‐depth Evaluation of Reaching Every District Approach, 2007
MADAGAMADAGA
41
SCAR SCAR In 2007, Madagascar’s population is estimated at 18,405,130 with an annual growth rate of 2.80%. Children under the age of one represent 4% of the general population (612,018), and children under five account for 18%. The proportion of women of childbearing age is 23.4% of the general population. The country is divided into 22 provinces and 111 health districts. The RED approach was introduced in 2003 and, by the end of 2006, 75 of 111 districts (68%) were implementing the strategy for strengthening immunisation services. DPT‐HepB3 coverage in 2006 was 94% and the number of districts with DPT‐HepB3≥80% was 81 out of 111 districts (72%) as compared to only 17 of 111 districts in 2002. The EPI developed a comprehensive multi‐year plan covering the period 2006‐2011. Madagascar is planning to introduce the pentavalent vaccine early in 2008. Planning and management of resourc
Figure A. RED Introduction and Scale‐up: Madagascar
36
48
75 75
0
32%43%
68%68%
0%
0
20
40
60
80
100
2002 2003 2004 2005 2006
No. of Districts
0%10%20%30%40%50%60%70%80%90%100%
% of T
otal Districts
RED Districts % RED Districts (Cumulative)
Source: Desk review dataset
es. Costed nnual workplans were developed in all districts and
‐establishing outreach activities. Most of the HFs
upportive supervision. Integrated supervisory visits t o e
onitoring for action. The target population–which is based on projections from the 1993 general population census
Figure B. Madagascar: Trend of District Performance(DPT3 Coverage)
50
1629
16
44
3837
2423
17
5745
71 81
70%10%20%30%40%50%60%70%80%90%
100%
2002 2003 2004 2005 2006
% of a
ll districts
DPT3<50% DPT3 50‐79% DPT3≥80%
Source: Desk review dataset
aHFs, and funds for activity implementation were made available by different partners. However, it was noted that the community was not fully involved in developing annual workplans. Cold chain equipment and other supplies are available in most of the districts. However, there is an insufficient number of technical staff and high turnover at both the district and HF levels. Reconduct outreach services that integrate vitamin A supplementation with vaccination sessions. Outreach activities are often implemented as mini catch‐up campaigns. Data on infants vaccinated through fixed and/or outreach sessions are not disaggregated in monthly reports. Susing a supervisory checklis are c nducted r gularly (monthly or quarterly) and immediate written or verbal feedback is provided after the visits. The proportion of conducted visits vis‐à‐vis planned supervisory visits is still low and follow‐up on recommendations is weak. Linking services with communities. Mother and child health week, organised twice each year, has facilitated the strengthening of community linkages (infant population count, training of community mobilisers) and there is community involvement in tracking defaulters in some health districts. In addition, rural radio stations are used to sensitise communities.
Figure C. Infants vaccinated and not vaccinated with DPT3 Madagascar, 2002‐2006
120,859188,983
51,236 35,057
268,241
351,864
520,638 474,341
544,117 576,965
0
100,000
200,000
300,000
400,000
500,000
600,000
700,000
2002 2003 2004 2005 2006
No. of Surviving Infants
Total unvaccinated Total vaccinated
Source: Desk review dataset
M– is well‐known by the districts and HFs. Tools for data collection (standardised tally sheet, monthly reports, and child monitoring cards) are available and used. Monthly or bi‐monthly review meetings are institutionalised in all districts, and monitoring coverage charts are posted at the health districts and HFs. However, immunisation charts are not often used for decision‐making or corrective action. Hard‐to‐reach populations are not always shown on the maps and tickler files are not used to correctly track defaulters.
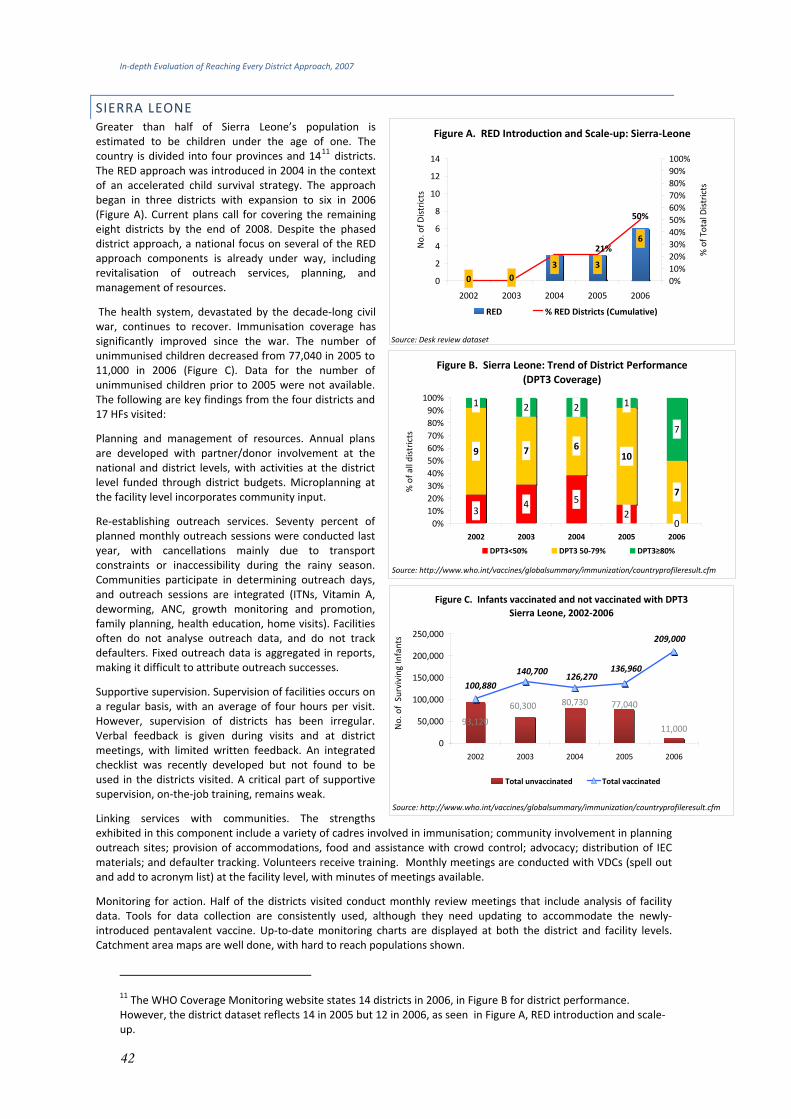
In‐depth Evaluation of Reaching Every District Approach, 2007
SIERRA LEONE Greater than half of Sierra Leone’s populationestimated to be children under the age of one. country is divided into four provinces and 1411 distriThe RED approach was introduced in 2004 in the conof an accelerated child survival strategy. The approbegan in three districts with expansion to six in 2(Figure A). Current plans call for covering the remaineight districts by the end of 2008. Despite the phadistrict approach, a national focus on several of the REDapproach components is already under way, revitalisation of outreach services, planning, management of resources.
The health system, devastated by the decade‐long war, continues to recover. Immunisation coverage significantly improved since the war. The numberunimmunised children decreased from 77,040 in 200511,000 in 2006 (Figure C). Data for the numbernimmunised children prior to 2005
Figure A. RED Introduction and Scale‐up: Sierra‐Leone
3 3
6
00
21%
50%
0
2
4
6
8
10
12
14
2002 2003 2004 2005 2006
No. of D
istricts
0%10%20%30%40%50%60%70%80%90%100%
% of Total Districts
RED % RED Districts (Cumulative)
Source: Desk review dataset
42
Figure C. Infants vaccinated and not vaccinated with DPT3 Sierra Leone, 2002‐2006
11,000
77,04080,730
93,120
60,300
209,000
100,880
140,700 126,270 136,960
0
50,000
100,000
150,000
200,000
250,000
2002 2003 2004 2005 2006
No. of Surviving Infants
Total unvaccinated Total vaccinated
Figure B. Sierra Leone: Trend of District Performance(DPT3 Coverage)
4 52
9 7 610
7
1 2 2 1
7
300%
10%20%30%40%50%60%70%80%90%100%
2002 2003 2004 2005 2006
% of a
ll districts
DPT3<50% DPT3 50‐79% DPT3≥80%
Source: http://www.who.int/vaccines/globalsummary/immunization/countryprofileresult.cfm
Source: http://www.who.int/vaccines/globalsummary/immunization/countryprofileresult.cfm
is The cts. text ach 006 ing sed
including
and
civil has of to of
were not available. and
ans the rict at
of sessions were conducted last
ear, with cancellations mainly due to transport on. ys,
e A, ion, ties ack
aggregated in reports, aking it difficult to attribute outreach successes.
r S on
rict d
ed but not found to be sed in the districts visited. A critical part of supportive
ths s involved in immunisation; community involvement in planning assistance with crowd control; advocacy; distribution of IEC
ll out
uThe following are key findings from the four districts 17 HFs visited:
Planning and management of resources. Annual plare developed with partner/donor involvement at national and district levels, with activities at the distlevel funded through district budgets. Microplanningthe facility level incorporates community input.
Re‐establishing outreach services. Seventy percentplanned monthly outreachyconstraints or inaccessibility during the rainy seasCommunities participate in determining outreach daand outreach sessions ar integrated (ITNs, Vitamindeworming, ANC, growth monitoring and promotfamily planning, health education, home visits). Facilioften do not analyse outreach data, and do not trdefaulters. Fixed outreach data is m
Suppo tive supervision. upervision of facilities occursa regular basis, with an average of four hours per visit.However, supervision of districts has been irregular.Verbal feedback is given during visits and at distmeetings, with limited written feedback. An integratechecklist was recently developusupervision, on‐the‐job training, remains weak.
Linking services with communities. The strengexhibited in this component include a variety of cadreoutreach sites; provision of accommodations, food andmaterials; and defaulter tracking. Volunteers receive training. Monthly meetings are conducted with VDCs (speand add to acronym list) at the facility level, with minutes of meetings available.
Monitoring for action. Half of the districts visited conduct monthly review meetings that include analysis of facility data. Tools for data collection are consistently used, although they need updating to accommodate the newly‐introduced pentavalent vaccine. Up‐to‐date monitoring charts are displayed at both the district and facility levels. Catchment area maps are well done, with hard to reach populations shown.
11 The WHO Coverage Monitoring website states 14 districts in 2006, in Figure B for district performance. However, the district dataset reflects 14 in 2005 but 12 in 2006, as seen in Figure A, RED introduction and scale‐up.
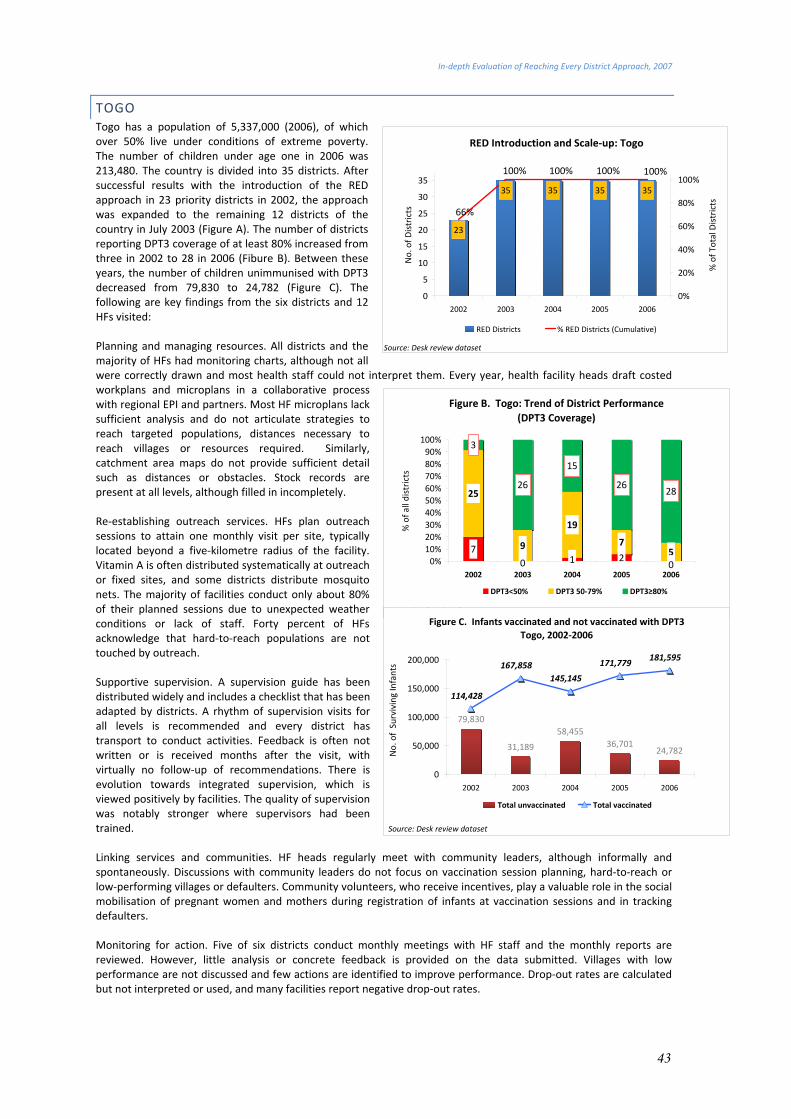
In‐depth Evaluation of Reaching Every District Approach, 2007
43
TOGO Togo has a population of 5,337,000 (2006), of which over 50% live under conditions of extreme poverty. The number of children under age one in 2006 was 213,480. The country is divided into 35 districts. After successful results with the introduction of the RED approach in 23 priority districts in 2002, the approach was expanded to the remaining 12 districts of the country in July 2003 (Figure A). The number of districts reporting DPT3 coverage of at least 80% increased from three in 2002 to 28 in 2006 (Fibure B). Between these years, the number of children unimmunised with DPT3 decreased from 79,830 to
24,782 (Figure C). The
is and do not articulate strategies to
.
d f e
ervision w
ves, play a valuable role in the social
HF staff and the monthly reports are reviewed. However, little analysis or concrete feedback is provided on the data submitted. Villages with low performance are not discussed and few actions are identified to improve performance. Drop‐out rates are calculated but not interpreted or used, and many facilities report negative drop‐out rates.
RED Introduction and Scale‐up: Togo
23
35 35 35 35
100%100%
66%
100% 100%
0
5
10
15
20
25
30
35
2002 2003 2004 2005 2006
No. of D
istricts
0%
20%
40%
60%
80%
100%
% of T
otal Districts
RED Districts % RED Districts (Cumulative)
Source: Desk review dataset
following are key findings from the six districts and 12 HFs visited: Planning and managing resources. All districts and the majority of HFs had monitoring charts, although not all were correctly drawn and most health staff could not intworkplans and microplans in a collaborative process with regional EPI and partners. Most HF microplans lack sufficient analys
erpret them. Every year, health facility heads draft costed
Figure B. Togo: Trend of District Performance(DPT3 Coverage)
71 2
25
9
19
75
3
26
15
2628
0 00%10%20%30%40%50%60%70%80%90%100%
2002 2003 2004 2005 2006
% of a
ll districts
reach targeted populations, distances necessary to reach villages or resources required. Similarly, catchment area maps do not provide sufficient detail such as distances or obstacles. Stock records are present at all levels, although filled in incompletely Re‐establishing outreach services. HFs plan outreach sessions to attain one monthly visit per site, typically locate beyond a five‐kilometre radius o th facility. Vitamin A is often distributed systematically at outreach or fixed sites, and some districts distribute mosquito nets. The majority of facilities conduct only about 80% of their planned sessions due to unexpected weather conditions or lack of staff. Forty percent of HFs acknowledge that hard‐to‐reach populations are not touched by outreach.
DPT3<50% DPT3 50‐79% DPT3≥80%
Source: Desk review dataset
Supportive supervision. A supervision guide has been distributed widely and includes a checklist that has been adapted by districts. A rhythm of supervision visits for all levels is recommended and every district has transport to conduct activities. Feedback is often not written or is received months after the visit, with virtually no follow‐up of recommendations. There is evolution towards integrated supervision, which is viewed positively by facilities. The quality of supwas notably stronger here supervisors had been trained. Linking services and communities. HF heads regularly meet with community leaders, although informally and spontaneously. Discussions with community leaders do not focus on vaccination session planning, hard‐to‐reach or w‐performing villages or defaulters. Community volunteers, who receive incenti
Figure C. Infants vaccinated and not vaccinated with DPT3 Togo, 2002‐2006
79,830
31,189
58,45536,701
24,782
114,428
167,858 145,145
171,779 181,595
0
50,000
100,000
150,000
200,000
2002 2003 2004 2005 2006
No. of Surviving Infants
Total unvaccinated Total vaccinated
Source: Desk review dataset
lomobilisation of pregnant women and mothers during registration of infants at vaccination sessions and in tracking defaulters. Monitoring for action. Five of six districts conduct monthly meetings with
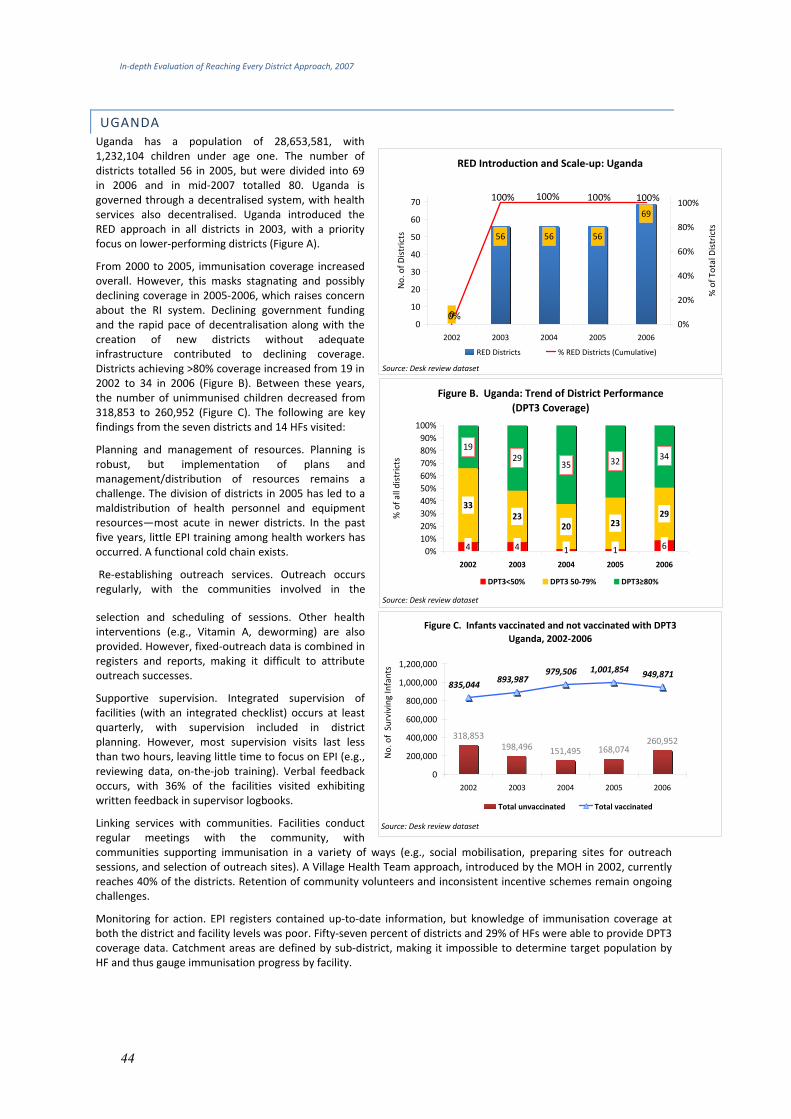
In‐depth Evaluation of Reaching Every District Approach, 2007
44
UGANDA Uganda has a population of 28,653,581, with 1,232,104 children under age one. The number of districts totalled 56 in 2005, but were divided into 69 in 2006 and in mid‐2007 totalled 80. Uganda is governed through a decentralised system, with health services also decentralised. Uganda introduced the RED approach in all districts in 2003, with a priority focus on lower‐performing districts (Figure A).
From 2000 to 2005, immunisation coverage increased overall. However, this masks stagnating and possibly declining coverage in 2005‐2006, which raises concern about the RI system. Declining government funding nd the rapid pace of decentralisation along with the
a aldistribution of health personnel and equipment
making it difficult to attribute
es smeetings with the community, with
action. EPI registers contained up‐to‐date information, but knowledge of immunisation coverage at oth the district and facility levels was poor. Fifty‐seven percent of districts and 29% of HFs were able to provide DPT3
RED Introduction and Scale‐up: Uganda
0
56 56 56
69
100%100%
0%
100% 100%
0
10
20
30
40
50
60
70
2002 2003 2004 2005 2006
No. of D
istricts
0%
20%
40%
60%
80%
100%
% of T
otal Districts
RED Districts % RED Districts (Cumulative)
acreation of new districts without adequate infrastructure contributed to declining coverage. Districts achieving >80% coverage increased from 19 in 2002 to 34 in 2006 (Figure B). Between these years, the number of unimmunised children decreased from 318,853 to 260,952 (Figure C). The following are key findings from the seven districts and 14 HFs visited:
Planning and management of resources. Planning is robust, but implementation of plans and management/distribution of resources remains a challenge. The division of districts in 2005 has led to
Source: Desk review dataset
Figure B. Uganda: Trend of District Performance(DPT3 Coverage)
4 4 1 1 6
3323
20 2329
1929
35 32 34
0%10%20%30%40%50%60%70%80%90%
100%
2002 2003 2004 2005 2006
% of a
ll districts
DPT3<50% DPT3 50‐79% DPT3≥80%
Source: Desk review dataset
mresources—most acute in newer districts. In the past five years, little EPI training among health workers has occurred. A functional cold chain exists.
Re‐establishing outreach services. Outreach occurs regularly, with the communities involved in the
selection and scheduling of sessions. Other health interventions (e.g., Vitamin A, deworming) are also provided. However, fixed‐outreach data is combined in egisters and reports,
Figure C. Infants vaccinated and not vaccinated with DPT3 Uganda, 2002‐2006
318,853198,496 151,495 168,074
260,952
835,044 893,987 979,506 1,001,854 949,871
0
200,000
400,000
600,000
800,000
1,000,000
1,200,000
2002 2003 2004 2005 2006
No. of Surviving Infants
Total unvaccinated Total vaccinated
Source: Desk review dataset
routreach successes.
Supportive supervision. Integrated supervision of facilities (with an integrated checklist) occurs at least quarterly, with supervision included in district planning. However, most supervision visits last less than two hours, leaving little time to focus on EPI (e.g., reviewing data, on‐the‐job training). Verbal feedback occurs, with 36% of the facilities visited exhibiting written feedback in supervisor logbooks.
Linking servic with communities. Facilitie conduct gular re
communities supporting immunisation in a variety of ways (e.g., social mobilisation, preparing sites for outreach sessions, and selection of outreach sites). A Village Health Team approach, introduced by the MOH in 2002, currently reaches 40% of the districts. Retention of community volunteers and inconsistent incentive schemes remain ongoing challenges.
Monitoring forbcoverage data. Catchment areas are defined by sub‐district, making it impossible to determine target population by HF and thus gauge immunisation progress by facility.

In‐depth Evaluation of Reaching Every District Approach, 2007
ANNEX 4 – EVALUATION TEAM MEMBERS BY COUNTRY
Benin Dr Matthieu Kamwa, WHO/AFRO Dr Désiré Toboe, WHO/PEV/Benin Mr Alexis Satoulou, WHO/IST‐West Dr Raoul Kamadjeu, CDC Atlanta Dr José Biey, WHO/PEV/Benin Dr Taibatoulaye Adjadi, Unicef/Benin Dr Aristide R. Sossou, WHO/PEV/Benin Mr Camille Lukadi, WHO/IST‐ Central
e
mbe, WHO/ DR Congo
tor Dr Edward Dede, National Programme Officer ‐
t O
r Dr Melkamo Wale, N.Gondar Health Dept
Ghana
Braka, WHO
Dr Issa Makumbi UNEPI
Dr Rose Macauley, WHO Mr Eric Adama Sawadogo, WHO/IST Dr Joseph Teye Nuertey, GOG Dr Akwasi Twumasi, GOG Mr Paapa Turkson Obimpeh, WHO Ms Rose Anne Amissah, GOG Ms Comfort Kwegyir‐Aggrey, GOG Ms Tove Ryman, CDC Atlanta Ms Lora Shimp, USAID/IMMbasics/JSI Ms Felicia Mahama, GOG Madagascar Dr Mihigo Richard, WHO Mr Mbengue Checkh, USAID/IMMbasics Dr Razaiarimanga Constance, PEV/WHO
Mr François Hodonou, DNPEV/SVAC/Benin Ms P.Germaine Toto, DNPEV/SSP/SVAC/ Benin Dr Marie‐Rose Nago, DNPEV‐SSP/Benin Dr Alexis Bokossa, DNPEV‐SSP/Benin Cam roonMr Souleyman Kone, WHO/HQ Dr Anya Blanche, WHO/Cameroun Mr Ofal J., GTC/PEV Dr Karen Wilkins, CDC Atlanta Dr Ticha Johnson, WHO/Cameroun Mr Até C., GTC/PEV
Dr Randriamiharisoa Haja Célestin, Min SPFPS Dr Kabano Augustin, UNICEF Dr Rabemanantena Jaurès, USAID/IMMbasics/JSI Mr Rakotonandrasana Alexandre, PEV/Min SPFPS Sierra Leone Dr Emmanuel Abanida, EPI/Nigeria Dr Michael N'dolie, WHO Mr Fode Kamara, MOHS Dr Nuhu Maksha, UNICEF Mr B C Terry, WHO Mr Joseph Abu, MoHS Ms Lidija Kamara, WHO/ HQ Mr Festus Amara, MoH Ms Aishata Conteh, WHO SL Ms Lidija Kamara, WHO/HQ
Dr Kandolo Wenye Pierre, IST/Centre Mr Temndemnou E., WHO/Cameroun Mr Athé, GTC/PEV Dr Bikoy J.T., GTC/PEV Dr Djumo Clement, UNICEF Mr Tsimi J., GTC/PEV Mr ZeZe F., GTC/PEV Democratic Republic of Congo Dr Brigitte Toure, UNICEF/WARO Ms Lisa Vandhei, CIDA / Canada Mr Bonny Sumaili, UNICEF/ DR Congo Dr Paul Lame, EPI/ DR Congo Dr Auguste Ambendet, IST‐Centre Dr Boubker Nouari, CDC/ Atlanta Ms Yolande MaseMr Claude Mangobo, EPI/ DR Congo Dr Michel Othepa, USAID/IMMbasics/JSI Dr Michel Nyembwe, EPI/DR Congo Mr Bwanamdogo, EPI/DR Congo Ethiopia Dr Adiele Onyeze, WHO Dr Assefu Lemlem, WHO/EPI Coordina
Routine EPI, Nigeria Dr Tesfaye Ume a, WH Routine EPI OfficerMs Yemesrach Tadesse, WHO Information and Communications Assistant Mr Alasdair Wylie, Consultant, USAID/IMMbasics/JSI
Dr Eva Kabwongera UNICEF Mr Pa Lamin Beyai, WHO/AFRO Ms Margaret Watkins CDC Dr Fiona
Mr Festus Amara, MoH Ms Aishata Conteh, WHO/SL Togo Mr Serge Ganivet, AFRO/IST/ESA/EPI Dr Akouete Afanou, UNICEF/Togo Ms Lydie Tena, DEPI Dr Denise Allen, CDC Atlanta Dr Kpinsaga, WHO/Togo Dr Toi Bafei, DEPI Uganda Ms Betty Irwasi, UNEPI Dr Kaushik Banerjee, WHO‐HQ Ms Jenny Sequeira, USAID/IMMbasics/JSI Dr Joan Brunkard CDC
Mr Moges Haile, WHO Routine EPI Officer Dr Tadele Bogale, M&E Adviser, USAID/ESHSE/JSI Ms Christie Billingsley, USAID/IMMbasics/JSI Dr Wendimagne Kegne, WHO Surveillance Office
Ms Winifred Tabaaro, UNEPI Dr Ahmadu Yakubu, UNICEF/ESARO Mr Rahman Kelani, WHO/AFRO
45

In‐depth Evaluation of Reaching Every District Approach, 2007
________________ ________
This evaluation is a collaborative effort between WHO and the following partners: UNICEF, USAID’s IMMUNIZATIONbasics Project , and CDC.
_
46
Related Documents