In-depth analysis of pedestrian serious injury crashes CURTIN-MONASH ACCIDENT RESEARCH CENTRE Faculty of Health Sciences Curtin University Hayman Road Bentley WA 6102 Michelle Hobday Lynn Meuleners Jennie Oxley David Logan March 2017

Welcome message from author
This document is posted to help you gain knowledge. Please leave a comment to let me know what you think about it! Share it to your friends and learn new things together.
Transcript
In-depth analysis of pedestrian serious injury crashes
CURTIN-MONASH ACCIDENT RESEARCH CENTRE
Faculty of Health Sciences
Curtin University
Hayman Road
Bentley WA 6102
Michelle Hobday Lynn Meuleners Jennie Oxley David Logan March 2017
ii
CURTIN-MONASH ACCIDENT RESEARCH CENTRE DOCUMENT RETRIEVAL INFORMATION
__________________________________________________________________________ Report No. Project No. Date Pages ISBN RR 16-xxx 16-xxx RSC March 2017 85+ N/A ___________________________________________________________________________ Title: In-depth analysis of pedestrian serious injury crashes _________________________________________________________________________ Author(s): Dr Michelle Hobday Professor Lynn Meuleners
A/Prof Jennie Oxley Dr David Logan
___________________________________________________________________________ Performing Organisation Curtin-Monash Accident Research Centre (C-MARC) Faculty of Health Sciences Curtin University Hayman Road BENTLEY WA 6102 Tel: (08) 9266-2304 Fax: (08) 9266-2958 www.c-marc.curtin.edu.au ___________________________________________________________________________ Sponsor Road Safety Commission Level 1, 151 Royal Street East Perth WA 6004 ___________________________________________________________________________ Abstract An in-depth case series examined eight pedestrian crashes occurring in the Perth metropolitan area between October 2015 and November 2016, to identify contributing factors to crash risk. Three participants had consumed alcohol to a level which put them at risk of short-term harm, while two had taken prescription drugs which may have affected their motor ability and alertness. Two pedestrians may have been affected by distraction. More than half of the pedestrians considered themselves to be either fully or partially at fault in the crash. This study highlights the preventable nature of some factors associated with pedestrian crashes. Road safety messages emphasise the role of substances and distraction for drivers; a similar message needs to be delivered to pedestrians.
Keywords Pedestrian, Injury, Crash, In-depth ___________________________________________________________________________ Disclaimer This report is disseminated in the interest of information exchange. The views expressed here are those of the authors and not necessarily those of Curtin University or Monash University. ___________________________________________________________________________
iii
TABLE OF CONTENTS
TABLE OF CONTENTS...................................................................................................... iii
LIST OF TABLES ................................................................................................................. v
EXECUTIVE SUMMARY ................................................................................................... vi
ACKNOWLEDGEMENTS .................................................................................................... x
1 INTRODUCTION .............................................................................................................. 1 1.1 Aims and objectives ..................................................................................................... 2
2 LITERATURE REVIEW ................................................................................................... 3 2.1 Introduction .................................................................................................................. 3 2.2 Benefits and risks to pedestrians ................................................................................... 4 2.3 Groups at higher risk of pedestrian injury ..................................................................... 4
Older pedestrians .......................................................................................................... 4 Child pedestrians .......................................................................................................... 6 Pedestrians under the influence of alcohol and drugs .................................................... 7 Other at-risk pedestrian groups ..................................................................................... 7 Population-level risk factors: ........................................................................................ 8
2.4 Crash types ................................................................................................................... 8 2.5 Crash causes ............................................................................................................... 10
Pedestrian behaviour and risk of crashes ..................................................................... 10 2.6 Driver behaviour ........................................................................................................ 11 2.7 Road design ................................................................................................................ 13 2.8 Environment ............................................................................................................... 13 2.9 Vehicle design ............................................................................................................ 14 2.10 Gaps in the literature ......................................................................................... 14
3 METHOD......................................................................................................................... 16 3.1 Ethics approval ........................................................................................................... 16 3.2 Type of research ......................................................................................................... 16 3.3 Literature review ........................................................................................................ 16 3.4 The case-series study .................................................................................................. 16 3.5 Participants ................................................................................................................. 16 3.6 Data collection ........................................................................................................... 17 3.7 Sample size ................................................................................................................ 18 3.8 Statistical analysis ...................................................................................................... 19
4 RESULTS ........................................................................................................................ 20 4.1 Demographic, health and licensing details of participants ........................................... 20 4.2 Usual travel habits of participants ............................................................................... 22 4.3 Pedestrian-related crash details ................................................................................... 23 4.4 Other characteristics of the crash ................................................................................ 27 4.5 Road environment characteristics of the crash ............................................................ 29 4.6 Trauma registry details on participants ....................................................................... 32 4.7 Virtual site inspections ............................................................................................... 32
Crash site one ............................................................................................................. 33 Crash site two ............................................................................................................. 33
iv
4.8 Individual cases studies .............................................................................................. 33 Case one ..................................................................................................................... 33 Case two ..................................................................................................................... 33 Case three ................................................................................................................... 34 Case four .................................................................................................................... 34 Case five .................................................................................................................... 34 Case six ...................................................................................................................... 34 Case seven .................................................................................................................. 34 Case eight ................................................................................................................... 35
5 DISCUSSION .................................................................................................................. 36 5.1 Demographic and health details .................................................................................. 36 5.2 Pedestrian-related crash details ................................................................................... 37 5.3 Road environment details ........................................................................................... 38 5.4 Injury types ................................................................................................................ 38 5.5 Limitations ................................................................................................................. 39
6 RECOMMENDATIONS .................................................................................................. 40 6.1 Recommendations relating to pedestrian safety ........................................................... 40 6.2 Recommendations relating to future studies ................................................................ 40 6.3 Conclusion ................................................................................................................. 41
7 REFERENCES ................................................................................................................. 42
8 APPENDICES .................................................................................................................. 53 8.1 Participant invitation letter, participant information statement and consent form ......... 53 8.2 In-depth pedestrian questionnaire ............................................................................... 60
v
LIST OF TABLES
Table 1: Details on pedestrians involved in crashes who were recruited ................................ 19
Table 2: Demographic characteristics of participants ............................................................ 20
Table 3: Self-reported health of participants ......................................................................... 21
Table 4: Driver’s licences of participants .............................................................................. 21
Table 5: Primary mode of travel of participants .................................................................... 22
Table 6: Usual walking distance per week by participants ..................................................... 22
Table 7: Usual trip purpose and trip purpose on the day of the crash by participants ............. 23
Table 8: Time and day of crashes .......................................................................................... 23
Table 9: Characteristics of the trip which resulted in a crash involving participants .............. 25
Table 10: Clothing worn by participants at the time of the crash ........................................... 26
Table 11: Visibility at the time of the crash ........................................................................... 27
Table 12: Physical and emotional stress experienced by participants prior to the crash ......... 28
Table 13: Road-related details of the crash ........................................................................... 29
Table 14: Crash type ............................................................................................................. 30
Table 15: Traffic conditions at the time of the crash.............................................................. 31
Table 16: Summary of participants' condition ....................................................................... 32
Table 17: Body regions injured among participants .............................................................. 32
vi
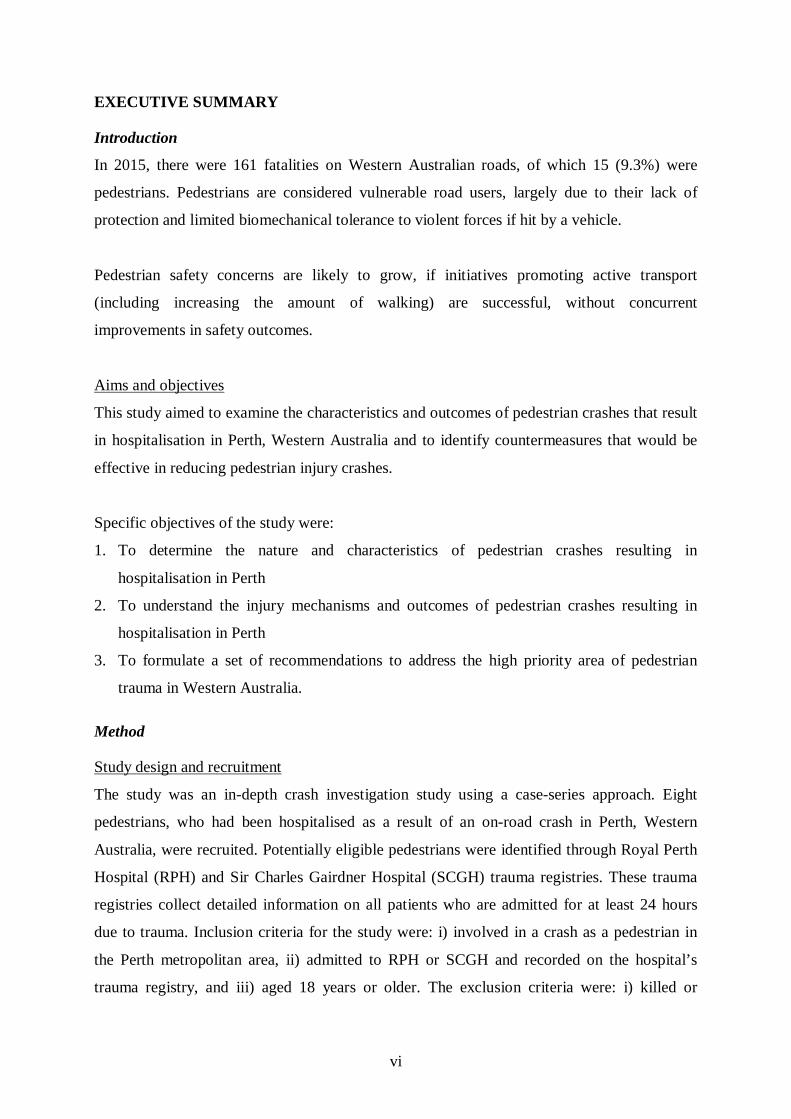
EXECUTIVE SUMMARY
Introduction
In 2015, there were 161 fatalities on Western Australian roads, of which 15 (9.3%) were
pedestrians. Pedestrians are considered vulnerable road users, largely due to their lack of
protection and limited biomechanical tolerance to violent forces if hit by a vehicle.
Pedestrian safety concerns are likely to grow, if initiatives promoting active transport
(including increasing the amount of walking) are successful, without concurrent
improvements in safety outcomes.
Aims and objectives
This study aimed to examine the characteristics and outcomes of pedestrian crashes that result
in hospitalisation in Perth, Western Australia and to identify countermeasures that would be
effective in reducing pedestrian injury crashes.
Specific objectives of the study were:
1. To determine the nature and characteristics of pedestrian crashes resulting in
hospitalisation in Perth
2. To understand the injury mechanisms and outcomes of pedestrian crashes resulting in
hospitalisation in Perth
3. To formulate a set of recommendations to address the high priority area of pedestrian
trauma in Western Australia.
Method
Study design and recruitment
The study was an in-depth crash investigation study using a case-series approach. Eight
pedestrians, who had been hospitalised as a result of an on-road crash in Perth, Western
Australia, were recruited. Potentially eligible pedestrians were identified through Royal Perth
Hospital (RPH) and Sir Charles Gairdner Hospital (SCGH) trauma registries. These trauma
registries collect detailed information on all patients who are admitted for at least 24 hours
due to trauma. Inclusion criteria for the study were: i) involved in a crash as a pedestrian in
the Perth metropolitan area, ii) admitted to RPH or SCGH and recorded on the hospital’s
trauma registry, and iii) aged 18 years or older. The exclusion criteria were: i) killed or
vii
severely disabled in the crash, ii) unable to recall the events of the crash, iii) admitted for less
than 24 hours and iv) crash took place in a residential driveway.
For RPH, the research nurse approached the patient and conducted a face-to-face interview
with the injured pedestrian during their hospital stay. Participants were provided a hard copy
of the participant information statement (PIS) and written consent was obtained from the
participant. When a patient was discharged prior to contact, a letter explaining the study, PIS
and consent form were posted to the potential participant. If the person agreed to participate,
a telephone interview was set up. All potential participants who had been patients at SCGH
were recruited using the letter and telephone follow-up method.
Data collection
Questionnaire: Each participant completed a researcher-administered questionnaire in person
or by phone. The questionnaire took 30-40 minutes to complete and included questions about
demographics, health, medications, walking habits and details of the crash (road, vehicle and
behavioural characteristics).
Trauma registry data: Health and injury information was obtained for each participant from
the hospital trauma registries. Variables included: previous illnesses, medications, injury
description, Injury Severity Score (ISS), blood toxicology results (if available), and length of
hospital stay.
Crash site inspections: A virtual inspection of the two pedestrian crash sites which had
sufficient detail on location was carried out using Nearmap software (Nearmap Ltd., 2016).
A total of 103 pedestrians, hospitalised between October 2015 and November 2016, were
identified. While we anticipated that a proportion of patients would be ineligible to participate
in the study, we found that a higher percentage of patients than expected were ineligible
(n=71, 69%), mainly due to having no memory of the crash (n=24, 23%). A total of 23%
(n=24) of those identified as possible participants declined to participate. As a result, the total
number of pedestrians recruited was much lower than expected (n=8, 8%).
viii
Statistical analysis
Descriptive statistics were used to describe the demographic, road design, temporal,
behavioural and crash-related characteristics of the pedestrian crashes.
Results
Of the eight participants, four were between 18 and 34 years old, and four were between 50
and 64 years old. Five were female. Three had a body mass index in the ‘normal’ range.
Six participants had a driver’s licence. Four usually drove, three used public transport and one
usually used a skateboard. Three usually walked 10km or more per week.
Three participants had consumed four or more standard drinks in the three hours before the
crash. Two had taken prescription medication which may have caused drowsiness or reduced
motor control on the day of the crash.
Six were travelling from home on the day of the crash, to a variety of destinations. Distances
intended to be travelled were up to 10km. Seven participants had been travelling for less than
10 minutes when the crash occurred. Participants dressed in a range of colours, with only one
participant wearing reflective clothing.
Five crashes occurred in daylight and three in the dark with street lights on. Five crashes took
place on weekdays. No participants reported that the weather conditions contributed to the
crash or that anything obstructed their visibility. The road surfaces were dry and debris-free at
the time of all crashes.
In two cases, participants may have been distracted (reading a text message, and dealing with
a stressful event prior to the trip). One participant had only three hours sleep in the 24 hours
before the crash.
Three crashes occurred while crossing at an intersection, and a traffic signal was in operation
at two of the intersections where crashes occurred. The level of traffic at the time of the crash
ranged from low to heavy. Three pedestrians felt the crash was the driver’s fault, three
thought it was the fault of themselves and the remainder felt that both were at fault.
ix
All participants were classified as having a minor injury (according to the Injury Severity
Score recorded), with six having injuries involving the lower extremities. Participants
remained in hospital for two to 17 days (mean=6.0).
Discussion and Recommendations
The study used a case series approach. The risk factors highlighted in the individual cases
were the involvement of alcohol, potentially sedative prescription medication, and distraction.
However, in five of the cases, the participant stated that the driver was either partially or
completely at fault, although in some of these crashes, the pedestrian had clear risk factors for
involvement in a pedestrian crash.
The study was limited by the small sample size, but this enabled analysis of each individual
crash. Although self-report bias is a potential issue in this type of study, participants appeared
open, and disclosed factors which may have contributed to their crashes.
Recommendations include prevention and education programs for both pedestrians and
drivers. These should include: increased awareness of road hazards (for both pedestrians and
drivers), promotion of clothing which improves visibility (especially at night), and education
about the risk posed by pedestrians using alcohol and other drugs (Constant and Lagarde,
2010). Engineering measures which separate road traffic from non-motorised road users,
including pedestrians (Retting et al., 2003) and increased street lighting (Beyer and Ker,
2009) would also reduce the risk of pedestrian crashes.
x
ACKNOWLEDGEMENTS
The authors would like to acknowledge Denice Wallis, Research Nurse at Royal Perth
Hospital, who checked the trauma registry for injured pedestrians, contacted potential
participants and conducted interviews with the participants.
1
1 INTRODUCTION
In 2015, there were 161 fatalities on Western Australian (WA) roads, of which 15 (9.3%)
were pedestrians. Pedestrians are considered vulnerable road users largely due to their lack of
protection and limited biomechanical tolerance to violent forces if hit by a motor vehicle. In a
crash with a vehicle, pedestrians are always the weakest party and are at a greater risk of
injury or death compared with other road users (Oxley et al., 2013).
Recently, concerns regarding the negative side effects of car usage have been raised in
relation to the impact on climate change, and the liveability of cities and towns. Consequently,
the benefits of active transport options such as walking and cycling have received wide
recognition, particularly in highly motorised countries (Pucher and Dijkstra, 2003, City of
Melbourne, 2013, Trapp et al., 2011).
In response, there has been a major push to promote safe walking and cycling in urban areas
in order to meet important goals in urban transport policy (i.e. access, mobility, social
inclusion and amenity). In WA, Main Roads Western Australia (the State road authority)
works with various WA Government agencies to promote the many benefits of walking and
cycling, and aims to achieve a safe and efficient road network as part of an integrated
transport system for all road users (2013).
Pedestrian safety concerns are, however, likely to grow if initiatives that promote active and
public transport are successful in increasing the amount of walking, without concurrent
improvements in safety outcomes (Oxley, 2009). It is essential that a safe walking
environment is provided. In particular, the design and operation of the transport and built
environment should allow for safe mobility of walking. This means providing ‘best-practice’
infrastructure and other provisions for pedestrians. Many measures have the potential to
quickly and effectively create a safer environment for active transport users (Oxley, 2009,
World Health Organisation, 2013b). There are also benefits in developing and implementing
effective enforcement and behavioural interventions. In-depth crash investigation studies that
examine the road environment, road user and vehicle-related risk factors for pedestrian
crashes can provide valuable information that can be used to formulate crash prevention
strategies.
2
1.1 Aims and objectives
The key research questions which this study sought to answer were:
1. What are the characteristics of pedestrian crashes that result in hospitalisation in Perth,
Western Australia?
2. What are the outcomes of pedestrian crashes that result in hospitalisation in Perth,
Western Australia?
3. What countermeasures would be effective in reducing pedestrian injury crashes?
The study aimed to identify innovative and effective ways to eliminate crashes resulting in
serious pedestrian trauma.
Specific objectives were to:
1. To determine the nature and characteristics of pedestrian crashes resulting in
hospitalisation in Perth.
2. To understand the injury mechanisms and outcomes of pedestrian crashes resulting in
hospitalisation in Perth.
3. To formulate a set of recommendations to address the high priority area of pedestrian
trauma in Western Australia.
3
2 LITERATURE REVIEW
2.1 Introduction
Globally, road injuries ranked fifth in the top 50 causes of lives lost in 2013, compared to a
ranking of 10th in 1990 (Naghavi et al., 2015). According to the Global Burden of Diseases
Study 2013, road injuries across the world led to approximately 1,395,800 deaths across all
ages, of which approximately 543,800 (39%) were pedestrian deaths. This equates to an age-
standardised death rate of 20 deaths per 100,000 population for all road injuries and eight
pedestrian deaths per 100,000 population (Naghavi et al., 2015).
According to the World Health Organisation (WHO), half of the world’s road traffic deaths
involve vulnerable road users (VRU). This group includes motorcyclists, pedestrians and
cyclists. VRUs are at higher risk of traffic crashes, particularly when traffic laws are not
enforced as vigorously (Zegeer and Bushell, 2012) because they are unprotected by an
external protective device that would “absorb energy in a collision” (Constant and Lagarde,
2010). Furthermore, the risk of death has been shown to be nine times greater when walking
than when travelling by car in the European Union (Breen, 2002).
Crashes involving pedestrians tend to be inadequately reported, with non-fatal pedestrian
injuries being poorly recorded even in high-income countries, while data on fatalities is more
reliable (World Health Organisation, 2013b, Adminaite et al., 2015). The proportion of
pedestrian fatalities to all road crash fatalities varies across different parts of the world [38%
in Africa compared to only 23% in the Americas] (World Health Organisation, 2013a) and
across regions [37% in Latvia and Romania compared to 10% in the Netherlands in the EU]
(Adminaite et al., 2015). This demonstrates that lower income countries and regions have
disproportionately high levels of pedestrian deaths compared to higher income countries.
In the Western Pacific region (a highly diverse region which includes Australia and China),
pedestrian fatalities constitute 25% of all road traffic deaths. In Australia, pedestrian fatalities
comprise approximately 13% of all road crash fatalities: 170 in 2012, 258 in 2013, 152 in
2014 and 164 in 2015; a mean of 186 pedestrian fatalities per year (Bureau of Infrastructure
Transport and Regional Economics, 2015, Department of Infrastructure and Regional
Development, 2016). Less recent data is available on serious pedestrian injuries in Australia.
In 2013, there were 2,672 pedestrians seriously injured in crashes (i.e., admitted to hospital,
4
excluding deaths) (Department of Infrastructure and Regional Development, 2016). This
equates to 7.6% of all those seriously injured due to road crashes in Australia.
Between 2004 and 2013, an average of 22 pedestrians were killed per year in Western
Australia (Road Safety Commission, 2014). Seventeen pedestrian fatalities occurred in
Western Australia in 2014: 9% of the 184 deaths on Western Australian roads (Government
of Western Australia, 2015), compared to 33 pedestrian fatalities in 2013: 20% of all road
deaths in that year (Bramwell et al., 2014). There were 179 seriously injured pedestrians in
2013:7.6% of all seriously injured road users (Government of Western Australia, 2015).
2.2 Benefits and risks to pedestrians
Across the world, walking is considered a basic form of transport which also has health
benefits, including improving cardiovascular health, reducing incidence of osteoporosis, type
2 diabetes mellitus and certain types of cancer, and reducing stress (Lee and Buchner, 2008).
However, as discussed above, pedestrians are vulnerable road users who are at increased risk
of both serious injury and death compared to other road users. Studies have shown that the
most commonly injured areas of pedestrians’ bodies are the upper and lower extremities, and
head, face and neck (Martin et al., 2011). The most severe injuries (Abbreviated Injury Score
– AIS 4+) tend to involve the head and thorax (Martin et al., 2011), with incidence of severe
trauma, particularly to these regions of the body, increasing with age (Demetriades et al.,
2004).
2.3 Groups at higher risk of pedestrian injury
Certain pedestrian groups are at greater risk of injury than others, including older adults,
children and those who consume alcohol and drugs (Fontaine and Gourlet, 1997).
Older pedestrians
Older pedestrians are disproportionately represented in pedestrian fatality statistics (Martin et
al., 2010, Fontaine and Gourlet, 1997, Prato et al., 2012, Haddon et al., 1961, Martin et al.,
2011), with excess mortality compared to younger adults (Holubowycz et al., 1994, Harruff et
al., 1998, Peng and Bongard, 1999, Siram et al., 2011, Tefft, 2013). This is partly due to the
relative physical frailty of older pedestrians compared to younger pedestrians (Martin et al.,
2010). Older pedestrians tend to sustain more severe injuries at lower impact speeds than
younger pedestrians (Davis, 2001, Demetriades et al., 2004, O’Hern et al., 2015), with those
over 65 years having higher rates of head injuries (Martin et al., 2011, Siram et al., 2011).
5
Those over 75 years old have higher rates of pelvic fractures, upper and lower extremity
injuries compared to younger groups (Siram et al., 2011), who tend to have dislocations,
sprains and strains or superficial injuries (O’Hern et al., 2015). O’Hern and colleagues
suggest that aggregating data on all older pedestrians together will mask differences between
the young-old and the old-old pedestrians, including higher hospitalisation rates (O’Hern et
al., 2015).
Older pedestrians are less likely to be intoxicated than younger pedestrians (Fontaine and
Gourlet, 1997) but because of the possibility of reduced cognitive skills due to ageing, older
pedestrians are more prone to making incorrect decisions about safe road crossing, and are
vulnerable to injury by reversing vehicles, even at low speeds (Oxley et al., 1997, Martin et
al., 2010). This is partly due to poor assessment of car speed (Oxley et al., 1997) and reduced
attention when crossing (Sparrow et al., 2002). Older pedestrians have a greater tendency to
make risky crossing decisions compared to younger participants (Oxley et al., 2005b).
Australian research has shown that those over 75 years old took longer to make decisions
about road crossing and chose insufficiently large gaps in experiments in a simulated traffic
environment, even given sufficient time. Older pedestrians with dementia are more likely to
be partially or completely responsible for the incident; injured during low complexity
situations; impacted during reversing, by a vehicle off-road; and be in the lane nearest the
kerb (Gorrie et al., 2008).
Furthermore, alterations to motor ability (such as slower walking speed, reduced agility and
balance) result in increased risk of involvement in a pedestrian crash (Oxley and Fildes,
2000). Crossing time increases, especially among those with a physical disability (Martin et
al., 2010). Older people are also more likely to have eye disorders (for example, cataract),
hearing loss and to use prescription medications, all of which may affect their road safety
(Oxley et al., 2005a). An experiment to investigate age-related declines in cognitive, motor
and perceptual abilities on gap selection demonstrated that walking speed was the most
important predictor of risky street crossing decisions (Dommes et al., 2013). Time-to-arrival
estimates, visual processing speed and attention shifting (allowing adaptation of crossing
strategy according to oncoming road traffic information) were also significant predictors of
dangerous gap choices, especially when vehicles were approaching at high speeds.
6
Moreover, older people are more exposed to travel as pedestrians than younger people. They
may reduce or stop driving, so are more likely to walk, or use public transport which involves
walking to reach a bus or train stop (Oxley and Fildes, 1999). Crashes involving older
pedestrians tend to occur in urban areas (Fontaine and Gourlet, 1997, Prato et al., 2012), close
to home or the shops, in daytime (Fontaine and Gourlet, 1997, Martin et al., 2010, Oxley and
Fildes, 1999), and when the weather and visibility is good, although older pedestrians are
over-represented in crashes in adverse weather conditions (Martin et al., 2010).
Child pedestrians
Due to their smaller size, developing motor and cognitive skills, and lower experience of
traffic, children are at higher risk of involvement in pedestrian crashes than most adults.
Research has shown that male children are at higher risk of hospitalisation than female
children (Poulos et al., 2012). An American study comparing the simulated road crossing
behaviour of children and adults showed that girls waited longer before crossing and paid
more attention to the traffic, while boys missed fewer opportunities to cross than girls (Barton
and Schwebel, 2007). Boys are also expected to take greater risks and tend to be more
impulsive than girls (Barton and Schwebel, 2007).
Younger children also have a higher risk of hospitalisation than older children. Statistics from
New South Wales between 2000 and 2005 demonstrated the highest crude hospitalisation
among one to four year olds, and five to nine year old boys (29.8 and 29.1 per 100, 000
children respectively) and the lowest among five to nine year old girls (16.2 per 100,000
children - Poulos et al., 2012). Younger children (aged five and six) have been shown to
display more risky behaviour and poorer decision-making regarding road crossing decisions
than older, more experienced children of eight to ten years old (Barton and Schwebel, 2007,
Oxley et al., 2005b).
Furthermore, children exposed to areas with a lower socio-economic status are at increased
risk of involvement in a pedestrian crash (Braddock et al., 1991, LaScala et al., 2000,
Rothman et al., 2014). This increased risk may be due to the exposure to and nature of the
road environment, including volume of traffic, presence of visible obstacles and absence of
footpaths (Stevenson et al., 1996). When roadway design variables (multi-family dwelling
density, traffic lights, traffic calming, one-way street density, and school crossing-guard
presence), school socio-economic status and population density were controlled for, increased
7
‘walking to school’ was not associated with increased risk of pedestrian crash (Rothman et al.,
2014). A meta-analysis demonstrated that the built environment was directly associated with
risk of pedestrian injury, and suggested that small changes to the roadway environment would
reduce young pedestrian crash and injury risk (DiMaggio and Li, 2012, Rothman et al., 2014).
Pedestrians under the influence of alcohol and drugs
Alcohol affects perceptual, cognitive and physical skills (Hutchinson et al., 2010), reducing
inhibitions and affecting the specific skills required to cross the road safely, and may lead to
risky road crossings and poor gap selection (Oxley et al., 2006).
Haddon’s classic case-control study of adult pedestrians demonstrated that middle-aged
pedestrians who had consumed alcohol were at increased risk of fatal injury (Haddon et al.,
1961). A later case-control study (Blomberg et al., 1979) showed that 50% of both fatally and
non-fatally injured pedestrians in the study had consumed alcohol, with half of pedestrians
having a blood alcohol concentration (BAC) of 0.20%. A dose-response effect was observed,
with a rapid increase in relative risk of pedestrian injury when pedestrians had a BAC of
above 0.20%. Alcohol involvement was more frequent among males, aged 30 to 59 years old,
with a prior arrest, at nights and on weekends.
More recent research has confirmed that intoxicated pedestrians involved in crashes tended to
be male, young to middle aged, walking at night-time (Holubowycz et al., 1994, Fontaine and
Gourlet, 1997) and over weekends (Öström and Eriksson, 2001, Cairney et al., 2004).
The use of other drugs, while not as extensively studied as the use of alcohol on road safety,
has also been associated with pedestrian injuries and death (Turk et al., 1974, Wilson and
Fang, 2000).
Other at-risk pedestrian groups
Certain characteristics appear to increase risk of pedestrian injury. Male pedestrians,
specifically young and middle-aged males (Holubowycz et al., 1994, Siram et al., 2011), are
more frequently involved in pedestrian crashes and are more severely injured than female
pedestrians (Martin et al., 2011, Road Safety Commission, 2014, Holubowycz et al., 1994).
Males have been shown to walk further than females per walking trip, thereby increasing their
exposure to traffic. They may demonstrate riskier behaviour and frequent more dangerous
areas than females (Clifton and Livi, 2004). Women also appeared to be more aware of issues
8
affecting traffic safety than men, specifically lighting and vehicle speed (Clifton and Livi,
2004).
Persons of Indigenous origin (Cairney et al., 2004) and minority groups (Cottrill and
Thakuriah, 2010) have been shown to be at higher risk of pedestrian crashes, as have those
with lower incomes and those from more deprived socio-economic areas (Laflamme and
Diderichsen, 2000, LaScala et al., 2004, Braddock et al., 1991).
People with both physical (e.g. mobility issues or visual impairment) and cognitive
disabilities are at increased risk of pedestrian injury. These pedestrians may not be able to
drive because of these impairments, instead using public transport, walking and family and
friends for transportation (Zegeer and Bushell, 2012). In an analysis of the road-crossing
behaviour of pedestrians with disabilities (hearing impairment and wheelchair users) in
Parma, Italy, Pecchini and Giuliani (2015) noted that these pedestrians, especially those in
wheelchairs, showed the most apprehension at roundabouts, exhibited longer waiting times
before crossing, and slower crossing speeds compared to unimpaired pedestrians. They
recommended reducing speed limits to allow this group of vulnerable road users more time to
cross and to encourage drivers to give way to pedestrians.
Population-level risk factors:
As discussed above, area-level socioeconomic status has been associated with pedestrian risk.
Specific socioeconomic factors which increase pedestrian risk include higher rates of
unemployment (LaScala et al., 2000, McMahon et al., 2002), lower proportion who have
completed high school or higher education (LaScala et al., 2000), household size (Celis et al.,
2003), lower income, lower rates of vehicle ownership (Noland et al., 2013) and higher
proportions of single parent families (McMahon et al.). Other population-level factors
associated with higher pedestrian injury risk are higher population density, a lower proportion
of children aged 15 years or less, and higher proportions of males (LaScala et al., 2000).
2.4 Crash types
Urban areas are associated with higher risk of pedestrian injury (Zegeer and Bushell, 2012,
Poulos et al., 2012, Haleem et al., 2015), probably due to a larger number of trips undertaken
in urban areas. However pedestrian injuries in rural areas are more likely to result in fatalities
due to higher vehicle speeds and greater distance from emergency departments (Zegeer and
Bushell, 2012).
9
Statistics from Victoria, New South Wales and Queensland showed that, while buses and
motorcycles had the highest rate of crash involvement by distance travelled, passenger
vehicles were involved in the highest absolute number of pedestrian crashes (Austroads Inc.,
2000).
Speed affects the likelihood and severity of pedestrian crashes: low speed crashes, affecting
primarily young children and older pedestrians, compared with high speed crashes, which
result in more severe injuries (Rosén et al., 2011, Tefft, 2013).
Analysis of data from Florida showed that three quarters of pedestrian crashes occur at mid-
block locations rather than at intersections, and that a higher proportion of midblock crashes
are fatal compared with pedestrian crashes occurring at intersections (Chu, 2006). Data from
Queensland, Victoria and New South Wales also demonstrated that more than half of
pedestrian crashes did not occur at intersections (Austroads Inc., 2000), while recent data
from South Australia indicated that only 29% of fatal and serious injury pedestrian crashes
occurred at intersections, with the remaining 71% occurring at midblock locations
(Department of Planning, 2014).
An analysis of 11 years of Victorian data showed that a high proportion of child pedestrian
crashes were either at midblocks (59%) or intersections (40%) (Oxley, 2012). Lightstone
(2001) demonstrated that children under five were more likely to be hit at a midblock
location, while older children were more likely to be hit at an intersection. Walking along the
carriageway was also associated with increased risk of pedestrian crash (Fontaine and
Gourlet, 1997, Haleem et al., 2015).
Analysis of six years of crash data (1991 to 1996) in Victoria revealed frequent types of
pedestrian crashes (Corben et al., 1998): i) pedestrians failed to select a safe gap in road
traffic; ii) pedestrians crossed during the ‘don’t walk’ phase or away from signalised cross-
walk lines; iii) pedestrians struck by turning vehicles at signals; iv) pedestrians struck while
crossing between queuing vehicles at intersections; v) pedestrians, especially older females,
struck by low speed reversing or manoeuvring vehicles; vi) pedestrians struck when emerging
from between parked vehicles; and vii) pedestrians struck by a turning vehicle at unsignalised
intersections.
10
2.5 Crash causes
The cause of pedestrian crashes is often multifaceted, consisting of a mix of human,
environmental and vehicular contributory factors (Peden et al., 2004).
Pedestrian behaviour and risk of crashes
Pedestrian behaviour and vulnerability varies across different at-risk groups. Older adults are
physically frailer, less agile and walk slower than younger adults (Oxley and Fildes, 2000).
Children are frequently injured when stepping out onto the street between two parked cars
(Leden et al., 2006) because of their smaller stature and consequent lower visibility. While
intoxicated pedestrians are not innately more vulnerable to being hit because of physical
limitations, their behaviour, for example, such as lying on the side of the road or walking
along the road, increases their risk of being hit.
Among older pedestrians, physical, perceptual and cognitive changes may result in
insufficient gap selection, especially given their slower walking times compared to younger
pedestrians (Oxley et al., 2005b). Among younger children, suboptimal road crossing
behaviour may be related to lack of experience and developing cognitive and physical skills..
In contrast, those under the influence of alcohol, especially the most intoxicated, may be
unaware of their impairment and have a tendency towards risky road crossing behaviour
(Oxley et al., 2006). All three vulnerable groups of pedestrians demonstrate an inability to
integrate information on the speed of vehicles relative to the distance from the pedestrian in
the time available (Oxley et al., 2006).
A further issue which increases the risk of crash is distraction due to mobile phone use
(talking or texting) by pedestrians. Mobile phone use is associated with increased distraction
which affects road crossing behaviour (Hatfield and Murphy, 2007) and with increased risk of
pedestrian injury, particularly in males and those 30 years and younger (Nasar and Troyer,
2013). Use of other electronic devices, such as personal music devices like iPods, may also be
associated with lack of attention (Mwakalonge et al.) because of reduced hearing, and result
in reduced safety for pedestrians (Lichenstein et al., 2012). An experimental study
demonstrated that mobile phone users walked more slowly, changed direction more often and
had poorer observational skills than other walkers, including those using a music player
(Hyman et al., 2010).
11
2.6 Driver behaviour
Driver behaviour can cause or contribute to pedestrian crashes. Two important factors include
whether drivers acknowledge the requirement to give way to pedestrians, and the speed at
which they approach areas with a high density of pedestrians (Preusser et al., 2002).
Early research showed that drivers slowed down or stopped for crossing pedestrians when: the
vehicle was approaching at a low speed; there was a larger distance between the oncoming
vehicle and the pedestrian; a group of pedestrians, rather than a single pedestrian, was
crossing; and if the pedestrian did not look at the approaching vehicle. Female and older
drivers tended to slow down more than other drivers (Katz et al., 1975). Later research
indicated that pedestrian distance from the kerb, city size, as well as the number of pedestrians
crossing and vehicle speed, influenced whether drivers slowed down or stopped for
pedestriansat pedestrian crossings (Himanen and Kulmala, 1988). Other research showed that
drivers’ willingness to yield for pedestrians at a roundabout was affected by whether they are
trying to cross at the entry or exit point of the roundabout (Geruschat and Hassan, 2005).
Drivers may refuse to stop or simply fail to see pedestrians and research has shown that using
hand gestures made drivers aware of a pedestrian’s presence (Crowley-Koch et al., 2011).
‘Staring’ by pedestrians (i.e., making eye contact with a driver who is approaching a
pedestrian crossing) has been shown in experiments to significantly increase the likelihood of
a driver stopping, with male drivers stopping more frequently, and drivers stopping more for
female pedestrians (Guéguen et al., 2015).
Furthermore, misunderstanding of the give way rules may lead to pedestrian crashes,
particularly when pedestrian and driver signals appear to contradict each other. For example, a
study in New South Wales demonstrated that, in some scenarios, 20% of both drivers and
pedestrians thought that the other party should give way (Hatfield et al., 2007).
The impact of vehicle speed on risk of pedestrian crash has been studied extensively (Rosén et
al., 2011). Vehicle stopping distance increases with speed (Zegeer and Bushell, 2012) and
reduces the time available to avoid a crash (Oxley and Corben, 2005). Higher driving speeds
reduce the driver’s ability to control the vehicle and make it more difficult for other road users
to ‘predict’ driver behaviour (Oxley and Corben, 2005, p. 21). Furthermore “Higher speed is
very often what converts a near miss into an injury, or an injury into death” (Hutchinson and
12
Lindsay, 2009, p. 37). A review of the literature demonstrated that risk of pedestrian fatality
increased monotonically with increasing vehicle impact speed (Rosén et al., 2011), with
improved risk functions for adults (correcting for the over-representation of severe injury
crashes in many earlier studies). It has been demonstrated that fatality risk at 50km/h is more
than five times higher than the risk at 30km/h (Rosén and Sander, 2009). Risk also varies with
age (Tefft, 2013), with older pedestrians (60+ years) tending to be more severely injured at
lower impact speeds than children and other adults (Davis, 2001).
Driver distraction is an additional factor which can lead to crashes, including those involving
pedestrians. When drivers in a Japanese experimental study were given a range of non-visual
tasks, the drivers’ ability to ‘track’ pedestrians decreased with more difficult secondary tasks
(Yoshizawa and Iwasaki, 2014). While there is little literature specifically on driver
distraction relating to pedestrian crashes, a body of research has demonstrated how distraction
in drivers can lead to behaviours which put pedestrians at risk. Mobile phones and use of
music players (MP3 devices) are sources of distraction, with mobile phone use being
associated with increased likelihood of driving through a yellow light, with young, novice
drivers being significantly more likely to do this than middle-aged drivers (Ohlhauser et al.,
2011). Text messaging by drivers affects visual and steering behaviour in young and middle-
aged drivers (Owens et al., 2011), and increases variability in lane position and following
distance among young drivers (Hosking et al., 2009). Doing a music search on an iPod was
shown to increase the time that drivers had their eyes off the road as well as reduce their
ability to maintain lane position (Young et al., 2012).
An anonymous online survey of 482 participants demonstrated that while texting and
speaking on a mobile phone were rated as most distracting while driving, interacting with
children, pets, using a music device and using a vehicle navigation system were the
distracting behaviours most frequently resulting in crashes (Lansdown, 2012). Surprisingly, a
study demonstrated that drivers of children were significantly more likely to spend more time
engaged in non-child-related distractions, with longer periods with their eyes off the road,
than in child-related distractions (Koppel et al., 2011, Macy et al., 2014).
Finally, lack of driver experience (novice drivers) is associated with poor vehicle control
skills, limited ability to anticipate and identify hazards, increased willingness to take risks and
13
vulnerability to the influence of peers (Lee, 2007). All of these factors increase the risk of
being involved in all crash types, including pedestrian crashes.
2.7 Road design
Road design is an important and potentially modifiable factor which can affect pedestrian
safety. As discussed earlier, more pedestrian crashes occur in urban environments, partly due
to higher numbers of pedestrians than in rural areas, and partly due to higher traffic volumes
which increase crash risk (Torbic et al., 2010, LaScala et al., 2000, McMahon et al., 2002),
especially among young pedestrians (Stevenson, 1997). Higher speed limits (McMahon et al.,
2002) and roads which encourage higher speeds increase risk of pedestrian crashes (Oxley
and Corben, 2005). Higher volumes of crossing pedestrians are also associated with more
pedestrian crashes (Zegeer et al., 2004, Torbic et al., 2010).
Pedestrians are at greater risk of being hit on roads which lack wide grassy walkable
shoulders and footpaths (McMahon et al., 2002), and on roads with multiple lanes to cross
(Zegeer et al., 2004, Torbic et al., 2010). However, crash risk is reduced if there is a raised
median such as a refuge island (Zegeer et al., 2004). Among child pedestrians, risk factors
included the presence of kerb side parking, higher traffic flow, higher traffic speed, and the
presence of footpaths. A meta-analysis looking specifically at the associations between built
roadway characteristics and child pedestrian injuries calculated a synthesised effect estimate:
Odds Ratio= 2.5.
The presence of a bus stop, school or alcohol establishment within 300m of an intersection
(Torbic et al., 2010) are additional factors that could alter the risk of pedestrian crashes.
2.8 Environment
Certain characteristics of the environment tend to be associated with a higher risk of
pedestrian crashes. Lower light conditions which result in reduced pedestrian visibility, are
partly responsible for a higher proportion of serious pedestrian crashes occurring at night
(Zegeer and Bushell, 2012, Department of Planning, 2014), especially on a Saturday (Cassell
et al., 2010b). In the Adelaide metropolitan area between 2003 and 2006, 57% of pedestrian
fatalities and 26% of casualties occurred at night (Hutchinson and Lindsay, 2009). American
research has shown that more fatal pedestrian crashes occur around twilight and the first hours
of darkness, especially Friday and Saturday nights in June during the US summer (Griswold
et al., 2011). These patterns are more noticeable among alcohol-impaired and teenage drivers.
14
A Cochrane systematic review indicated that while past studies on increased street lighting
were poorly designed (specifically the control group choices), overall they suggest that street
lighting might effectively reduce road traffic injuries (Beyer and Ker, 2009).
Studies indicate that the highest proportion of pedestrian crashes occur in the afternoon.
Australian statistics indicate a peak in numbers of pedestrian crashes between 3pm and 5pm,
with the highest proportion of crashes occurring on a Friday and the lowest proportion on a
Sunday (Austroads Inc., 2000, Department of Planning, 2014). More than half of Western
Australia’s serious crashes occur between 2pm and 7pm (Road Safety Commission, 2014).
Those aged 15 to 44 are more likely to be injured on a weekend (suggesting an increased
exposure over weekends while not working, and potentially the involvement of alcohol),
while other age-groups are more likely to be injured on a weekday (Cassell et al., 2010a).
2.9 Vehicle design
Most pedestrian injuries affect the head and the lower extremities (Hu and Klinich, 2015).
The frontal design of vehicles has an effect on both the location and severity of injuries to
pedestrians (Breen, 2002). Most head injuries result from impact with the bonnet (particularly
among children), windshield and A-pillars, while the majority of lower limb extremities
injuries are due to the front bumper (Hu and Klinich, 2015). The impact from low profile
passenger cars is below the pedestrian’s centre of gravity. However, for larger or taller
vehicles (multi-purpose vehicles or MPVs, light trucks or vans), the impact is above the
pedestrian’s centre of gravity, meaning the pedestrian may be propelled forward without
contacting the bonnet, and then be run over by the vehicle (Crandall et al., 2002). There is an
increased risk of fatality when a pedestrian is hit by a vehicle with a sloping bonnet (MPV-
style), with thoracic injuries being specifically involved (Martin et al., 2011, Hu and Klinich,
2015). Frontal design is particularly an issue for young pedestrians. For example, the height
of a SUV results in reduced visibility of shorter pedestrians, and more severe injuries
occurring to the chest and head areas (Breen, 2002). In addition to physical design, MPVs are
less compliant than low profile passenger vehicles, which increases the risk of more severe
injury should a pedestrian crash occur (Hu and Klinich, 2015).
2.10 Gaps in the literature
As discussed, a large body of research has explored the epidemiology of pedestrian crashes
including the anatomical location of injuries and specific groups of at-risk pedestrians
15
(children, older pedestrians, those with physical disabilities affecting mobility, hearing and
sight, and pedestrians under the influence of alcohol). Environmental factors, such as location
type, time of crash, weather and lighting conditions have been explored, and the behaviour of
drivers involved in pedestrian crashes has been examined. However, other than driving
simulator tests examining street crossing behaviour, much of the research in this area consists
of ecological studies.
Aspects of pedestrian crashes which require further understanding include distraction, relating
not only to the use of mobile phones and portable music devices but also to distraction by
other pedestrians, and the contribution of tiredness, excitement and stress. While the use of
alcohol by pedestrians has been demonstrated to contribute to risk of involvement in a crash,
the contribution of both prescription and illicit drugs is less well-researched. Further research
needs to be done into other details of these crashes such as avoidance strategies, the effect of
traffic flow and the effect of having a driver’s licence on pedestrian crashes. This in-depth
study aims to explore these gaps in the pedestrian research.
16
3 METHOD
3.1 Ethics approval
The Curtin Human Research Ethics Committee (HREC) approved the study on 23 July 2015
(Approval No: HR141/2015). The Royal Perth Hospital (RPH) HREC approved the study on
14 July 2015 (HREC Reference: 15-078). The study was also approved by the RPH Research
Governance Committee (RPH Trial No: 15-078-02) and the Sir Charles Gairdner Hospital
(SCGH) Research Governance Committee (SCGH Trial No: 2015-180).
3.2 Type of research
This study involved a literature review of factors associated with and contributing to
pedestrian crashes and an in-depth crash investigation study: case-series.
3.3 Literature review
Relevant published scientific literature was sourced and accessed using an extensive range of
search engines and databases, available through Curtin and Monash University library
services. The main databases and search engines that were used were: Transport databases -
TRID: TRIS and ITRD; Scopus; ProQuest; Transport; Psychology - PsychInfo; Ovid
MEDLINE; Web of Science, and The Cochrane Library. The review included international
statistics, contributing human and environmental factors, and countermeasures. In conducting
the literature search, a range of key search terms and their combinations were included in the
search (e.g., “pedestrians”, “safe mobility”, “crash risk”, “injury outcome” and appropriate
transportation and mobility option terms).
3.4 The case-series study
The case-series study design was used in this study. Cases-series do not include a comparison
group nor can they be used to draw inferences or test hypotheses (Carey and Boden, 2003,
Kooistra et al., 2009). However, case-series are useful in giving detailed accounts of
individual cases, and in hypothesis generation , which can then be tested in studies of more
rigorous design (Kooistra et al., 2009).
3.5 Participants
The study recruited eight pedestrians hospitalised as a result of an on-road crash in Perth,
Western Australia. Potentially eligible pedestrians were identified through RPH and SCGH
trauma registries. These trauma registries collect detailed information on all patients who are
17
admitted for at least 24 hours due to trauma. Trauma registry staff provided the contact details
of potentially eligible pedestrians to the RPH research nurse on a daily basis.
The inclusion criteria were:
• Involved in a crash as a pedestrian in the Perth metropolitan area
• Admitted to RPH or SCGH and recorded on the hospital’s trauma registry
• Aged 18 years or older
The exclusion criteria were:
• Killed or severely disabled in the crash
• Unable to recall the events of the crash
• Admitted for less than 24 hours
• Crash took place in a residential driveway
For pedestrians admitted to RPH, the research nurse approached the patient, during their
hospital stay where possible, and conducted a face-to-face interview with the injured
pedestrian. Before each interview was conducted, the research nurse explained the purpose of
the study; that there were no consequences for declining to participate or withdrawing from
the study; provided a copy of the participant information statement and consent form (PIS –
see Appendix 8.1); and received written consent from the participant. When a patient was
discharged prior to contact, a letter explaining the study (see Appendix 8.1), the PIS and
consent form were posted to the potential participant. Telephone contact was then made and
the research nurse answered the patient’s questions. If the patient agreed to participate, he or
she was asked to sign and return the consent form to the researcher and an appointment time
was made for a telephone interview. All potential participants who had been patients at
SCGH were recruited using the letter and telephone follow-up method.
3.6 Data collection
Data was collected as soon as possible following the crash and hospital admission. Data
collection tools included a researcher-administered questionnaire, trauma registry data review
and virtual crash site inspection using aerial photography.
Questionnaire: Participants completed a researcher-administered questionnaire in person or by
phone (see Appendix 8.2). The questionnaire took 30 to 40 minutes to complete and included
18
questions about demographics, health, medications, walking habits and details of the crash
(road, vehicle and behavioural characteristics).
Trauma registry data: Health and injury information was obtained for each participant from
the hospital trauma registries. Variables included: previous illnesses, medications, injury
description, Injury Severity Score (ISS), blood alcohol and toxicology results, length of stay
and hospital transfers.
Crash site inspections: Where sufficient detail on the position of the crash was available, an
inspection of the pedestrian crash site was undertaken using Nearmap software (Nearmap
Ltd., 2016). Variables collected included: posted speed limit, road curvature, number of lanes,
shoulder and median type, road markings, pedestrian facilities, roadside barriers, parking and
intersection or roundabout details (if relevant).
3.7 Sample size
It was anticipated that it would take approximately 12 months to recruit the required number
of pedestrians (up to 150 cases). A total of 103 pedestrians who had been hospitalised
between October 2015 and November 2016 were identified (Table 1). Based on previous in-
depth crash studies conducted by C-MARC, it was anticipated that 85% of identified
pedestrian crash victims would be eligible and a 90% response rate was expected. However, a
higher percentage of pedestrians than expected were not eligible (69% - Table 1), mainly due
to having no memory of the crash (n=24, 23%), the crash occurring outside Perth (n=11, 11%)
or not speaking English (n=9, 9%). Furthermore, 23% (n=24) of those hospitalised following
pedestrian crashes declined to participate. As a result, the total number of pedestrians
recruited was much lower than expected, numbering eight.
19
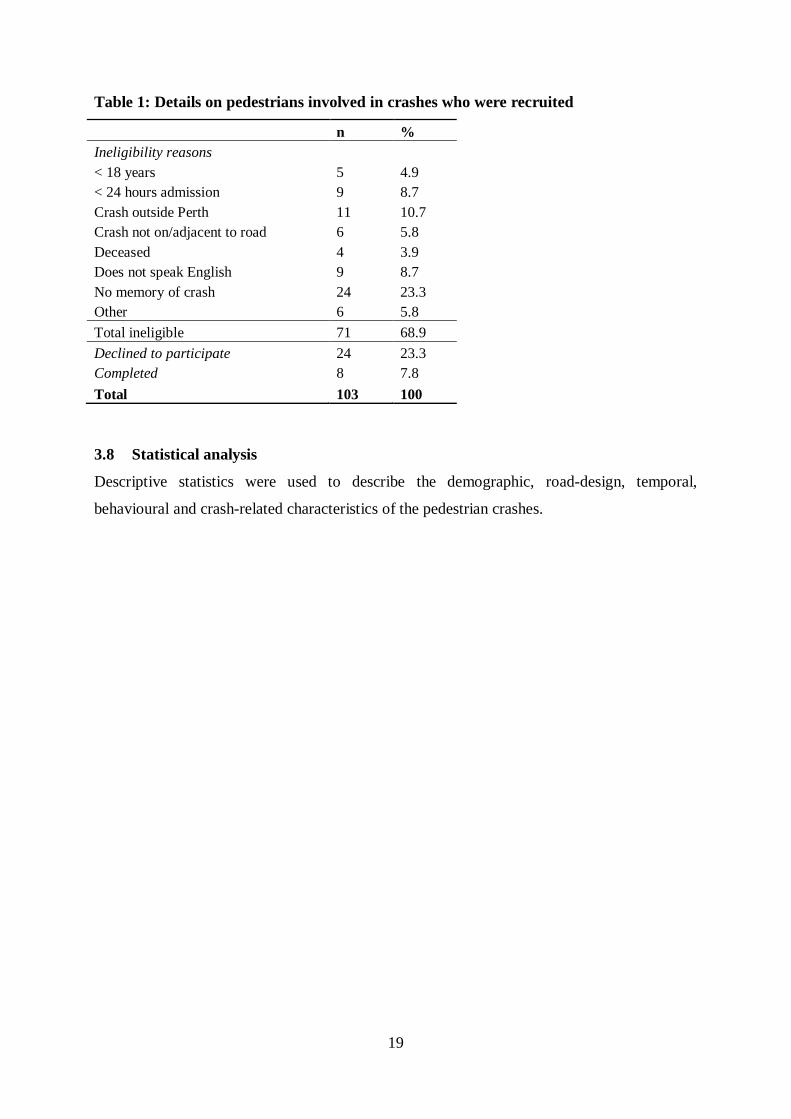
Table 1: Details on pedestrians involved in crashes who were recruited
n % Ineligibility reasons
< 18 years 5 4.9 < 24 hours admission 9 8.7 Crash outside Perth 11 10.7 Crash not on/adjacent to road 6 5.8 Deceased 4 3.9 Does not speak English 9 8.7 No memory of crash 24 23.3 Other 6 5.8 Total ineligible 71 68.9 Declined to participate 24 23.3 Completed 8 7.8 Total 103 100
3.8 Statistical analysis
Descriptive statistics were used to describe the demographic, road-design, temporal,
behavioural and crash-related characteristics of the pedestrian crashes.
20
4 RESULTS
The responses to the questionnaires by pedestrians involved in crashes in the Perth
metropolitan area are described below.
4.1 Demographic, health and licensing details of participants
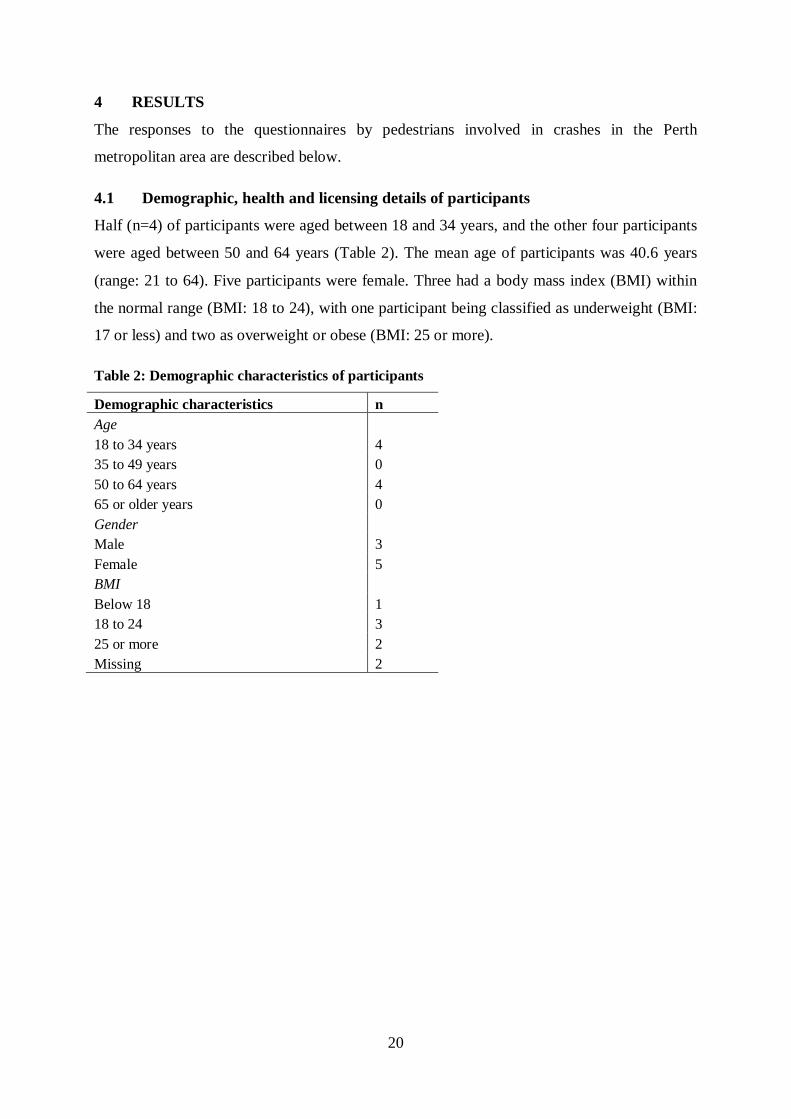
Half (n=4) of participants were aged between 18 and 34 years, and the other four participants
were aged between 50 and 64 years (Table 2). The mean age of participants was 40.6 years
(range: 21 to 64). Five participants were female. Three had a body mass index (BMI) within
the normal range (BMI: 18 to 24), with one participant being classified as underweight (BMI:
17 or less) and two as overweight or obese (BMI: 25 or more).
Table 2: Demographic characteristics of participants
Demographic characteristics n Age
18 to 34 years 4 35 to 49 years 0 50 to 64 years 4 65 or older years 0 Gender
Male 3 Female 5 BMI
Below 18 1 18 to 24 3 25 or more 2 Missing 2
21
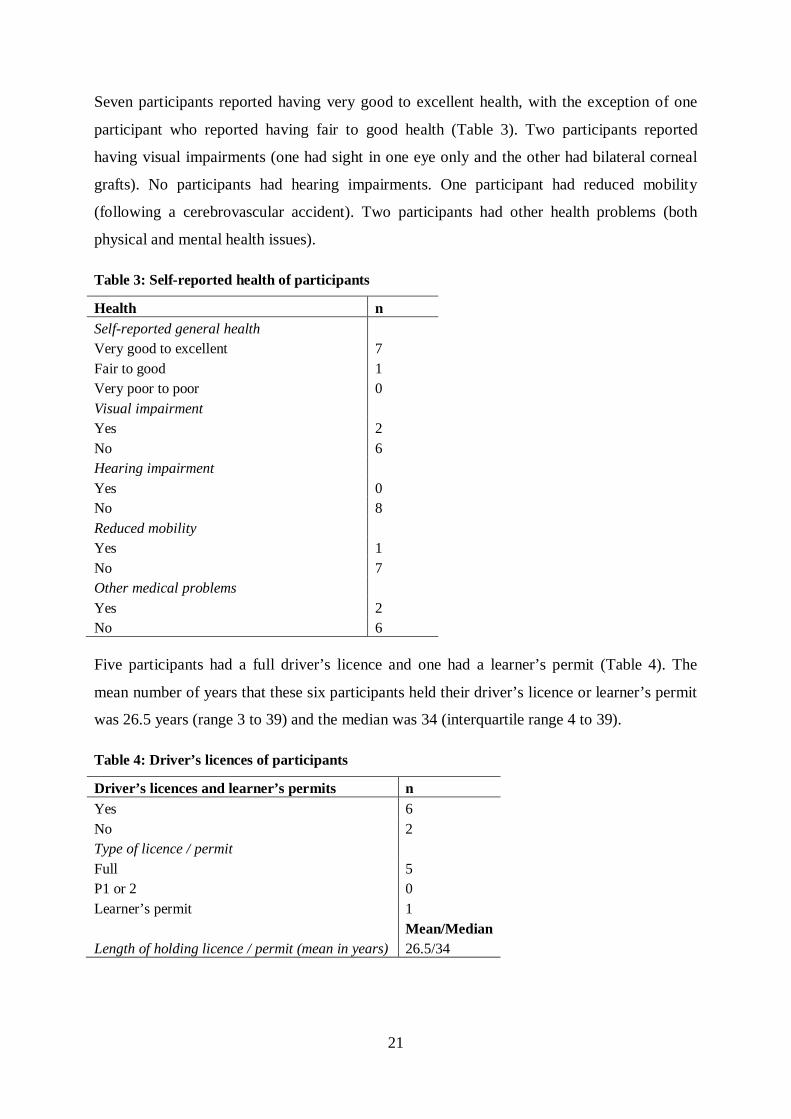
Seven participants reported having very good to excellent health, with the exception of one
participant who reported having fair to good health (Table 3). Two participants reported
having visual impairments (one had sight in one eye only and the other had bilateral corneal
grafts). No participants had hearing impairments. One participant had reduced mobility
(following a cerebrovascular accident). Two participants had other health problems (both
physical and mental health issues).
Table 3: Self-reported health of participants
Health n Self-reported general health
Very good to excellent 7 Fair to good 1 Very poor to poor 0 Visual impairment
Yes 2 No 6 Hearing impairment
Yes 0 No 8 Reduced mobility
Yes 1 No 7 Other medical problems
Yes 2 No 6 Five participants had a full driver’s licence and one had a learner’s permit (Table 4). The
mean number of years that these six participants held their driver’s licence or learner’s permit
was 26.5 years (range 3 to 39) and the median was 34 (interquartile range 4 to 39).
Table 4: Driver’s licences of participants
Driver’s licences and learner’s permits n Yes 6 No 2 Type of licence / permit
Full 5 P1 or 2 0 Learner’s permit 1 Mean/Median Length of holding licence / permit (mean in years) 26.5/34
22
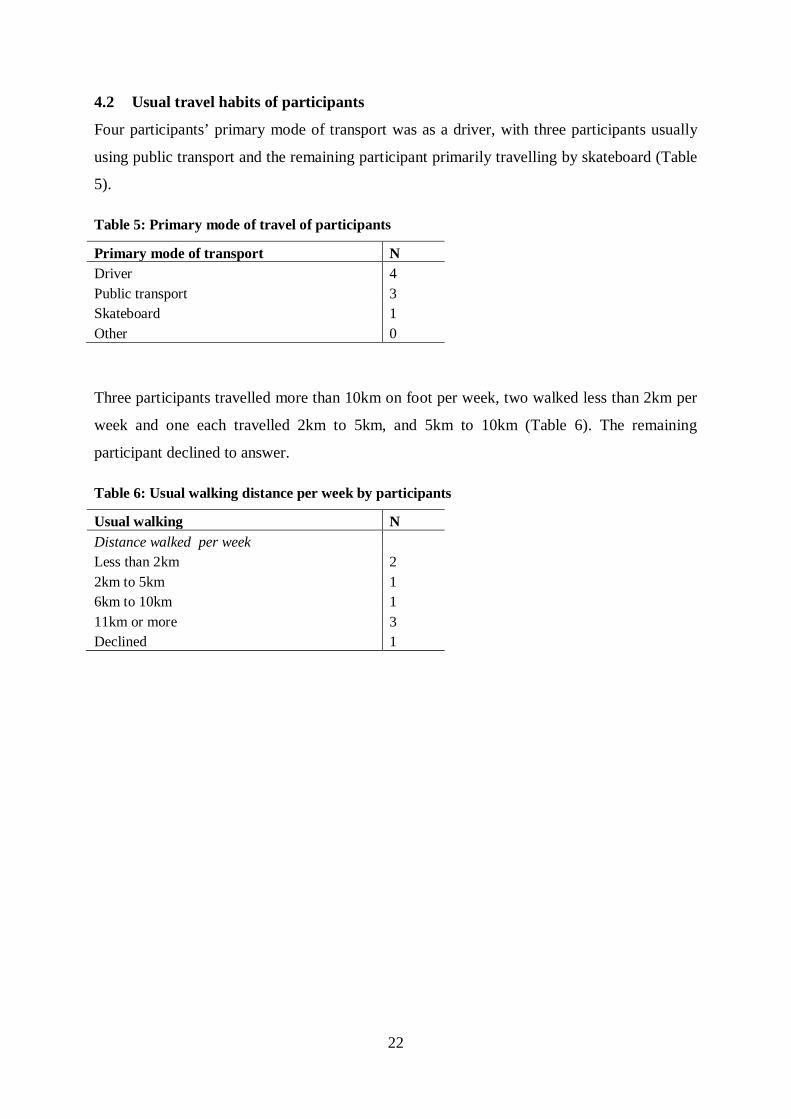
4.2 Usual travel habits of participants
Four participants’ primary mode of transport was as a driver, with three participants usually
using public transport and the remaining participant primarily travelling by skateboard (Table
5).
Table 5: Primary mode of travel of participants
Primary mode of transport N Driver 4 Public transport 3 Skateboard 1 Other 0
Three participants travelled more than 10km on foot per week, two walked less than 2km per
week and one each travelled 2km to 5km, and 5km to 10km (Table 6). The remaining
participant declined to answer.
Table 6: Usual walking distance per week by participants
Usual walking N Distance walked per week
Less than 2km 2 2km to 5km 1 6km to 10km 1 11km or more 3 Declined 1
23
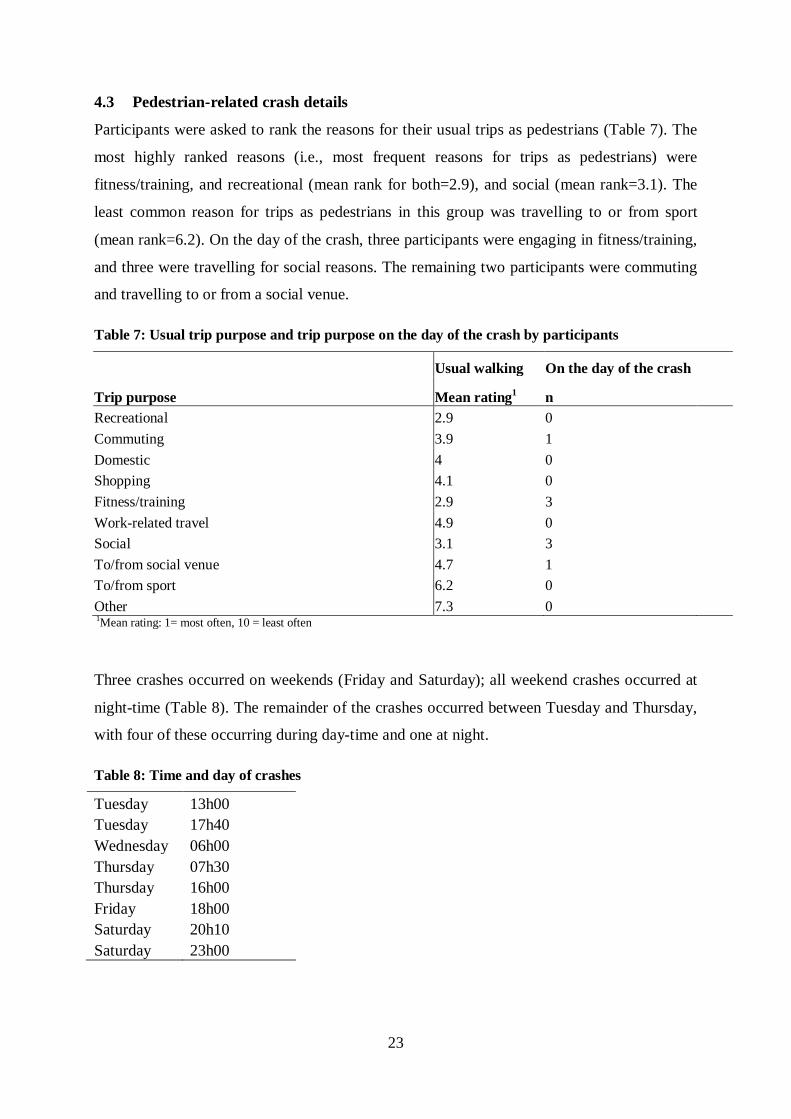
4.3 Pedestrian-related crash details
Participants were asked to rank the reasons for their usual trips as pedestrians (Table 7). The
most highly ranked reasons (i.e., most frequent reasons for trips as pedestrians) were
fitness/training, and recreational (mean rank for both=2.9), and social (mean rank=3.1). The
least common reason for trips as pedestrians in this group was travelling to or from sport
(mean rank=6.2). On the day of the crash, three participants were engaging in fitness/training,
and three were travelling for social reasons. The remaining two participants were commuting
and travelling to or from a social venue.
Table 7: Usual trip purpose and trip purpose on the day of the crash by participants
Usual walking On the day of the crash
Trip purpose Mean rating1 n Recreational 2.9 0 Commuting 3.9 1 Domestic 4 0 Shopping 4.1 0 Fitness/training 2.9 3 Work-related travel 4.9 0 Social 3.1 3 To/from social venue 4.7 1 To/from sport 6.2 0 Other 7.3 0 1Mean rating: 1= most often, 10 = least often
Three crashes occurred on weekends (Friday and Saturday); all weekend crashes occurred at
night-time (Table 8). The remainder of the crashes occurred between Tuesday and Thursday,
with four of these occurring during day-time and one at night.
Table 8: Time and day of crashes
Tuesday 13h00 Tuesday 17h40 Wednesday 06h00 Thursday 07h30 Thursday 16h00 Friday 18h00 Saturday 20h10 Saturday 23h00
24
Three participants reported consuming alcohol in the three hours before the crash. All three
had consumed four or more standard drinks which increased their risk of short-term harm due
to alcohol, according to the Australian alcohol drinking guidelines (National Health and
Medical Research Institute, 2009). No participants reported consuming recreational drugs, and
only one participant had taken prescription drugs in the three hours prior to the crash.
However, five took daily prescription drugs (ranging from one to six types of medication per
day). This included two who had taken diazepam either 3 hours before or within 24 hours of
their crash.
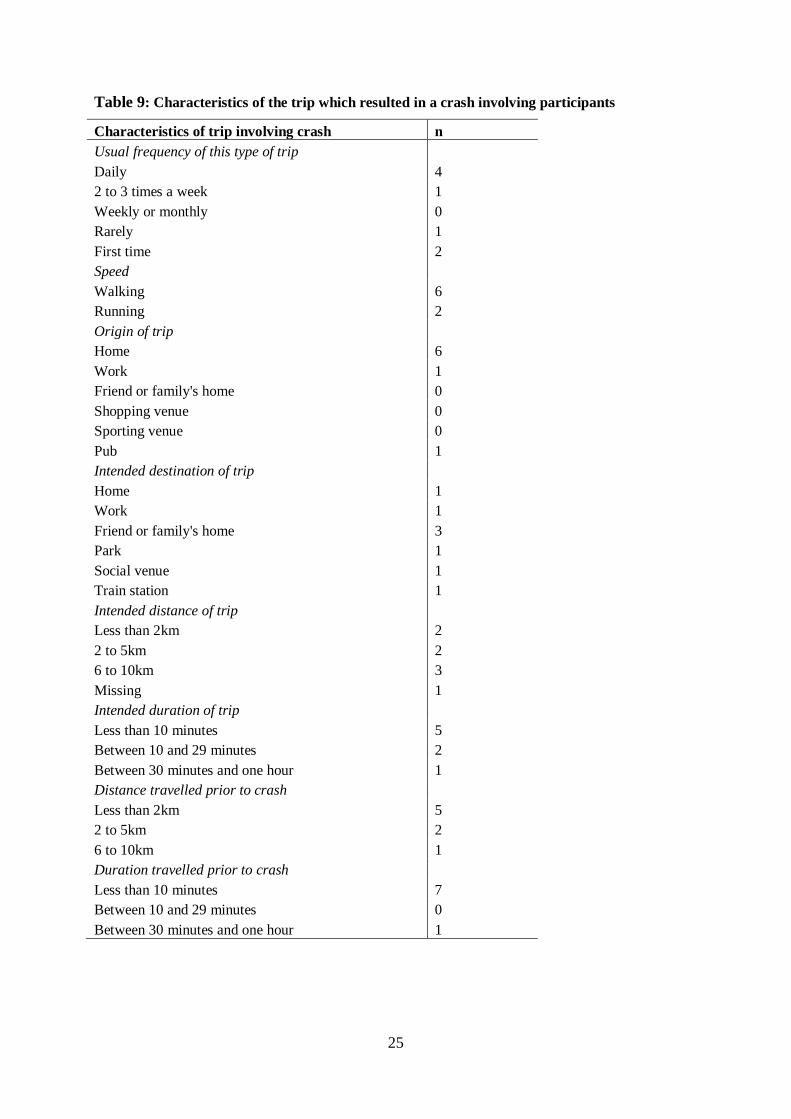
Five participants undertook the type of trip resulting in the crash on a daily basis, one
participant undertook it once or twice a week, and one participant undertook it rarely. Two
participants were undertaking this type of trip for the first time (Table 9).
Six participants commenced their trip at home, with one departing from work and the other
from a pub. Three participants were travelling to family or friends’ homes, while the
remaining five were travelling to home, work, the park, a social venue or the train station.
Three participants were intending to travel 5 to 10km, two were intending to travel less than
2km and a further two were intending to travel 2km to 5km in total.
Seven participants had travelled less than 10 minutes when the crash occurred, with the
remaining participant having travelled for half an hour to an hour.
25
Table 9: Characteristics of the trip which resulted in a crash involving participants
Characteristics of trip involving crash n Usual frequency of this type of trip
Daily 4 2 to 3 times a week 1 Weekly or monthly 0 Rarely 1 First time 2 Speed
Walking 6 Running 2 Origin of trip
Home 6 Work 1 Friend or family's home 0 Shopping venue 0 Sporting venue 0 Pub 1 Intended destination of trip
Home 1 Work 1 Friend or family's home 3 Park 1 Social venue 1 Train station 1 Intended distance of trip
Less than 2km 2 2 to 5km 2 6 to 10km 3 Missing 1 Intended duration of trip
Less than 10 minutes 5 Between 10 and 29 minutes 2 Between 30 minutes and one hour 1 Distance travelled prior to crash
Less than 2km 5 2 to 5km 2 6 to 10km 1 Duration travelled prior to crash
Less than 10 minutes 7 Between 10 and 29 minutes 0 Between 30 minutes and one hour 1
26
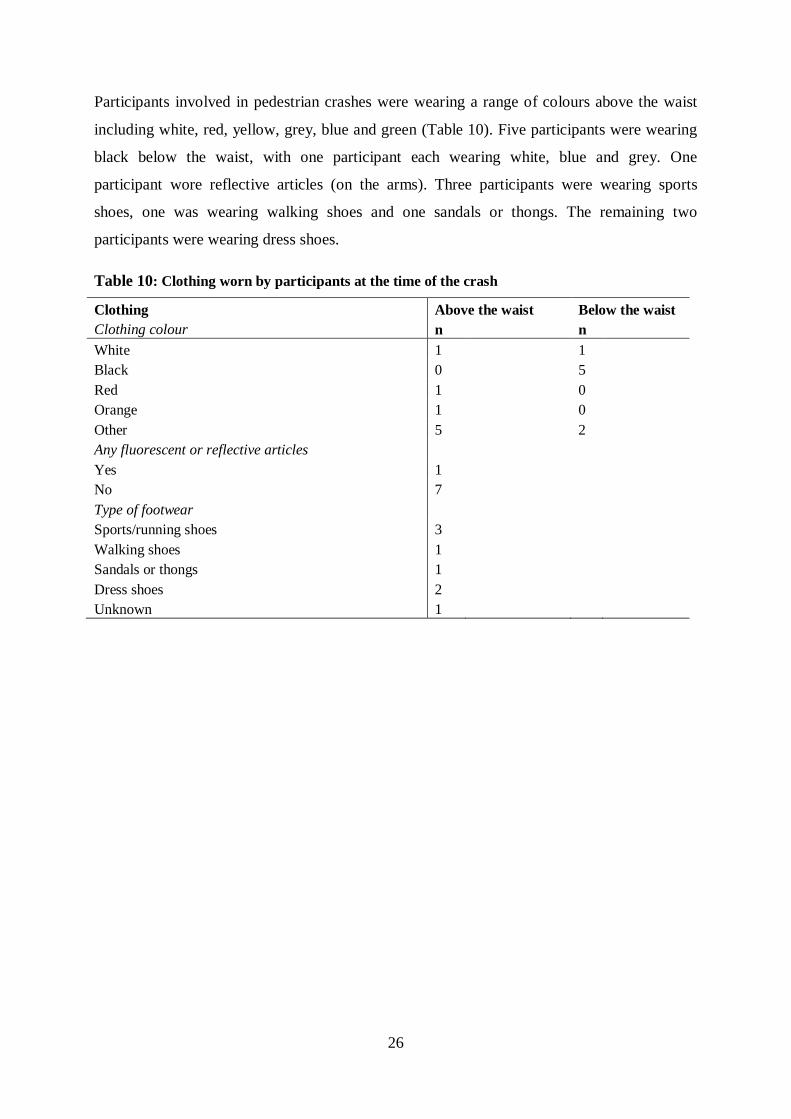
Participants involved in pedestrian crashes were wearing a range of colours above the waist
including white, red, yellow, grey, blue and green (Table 10). Five participants were wearing
black below the waist, with one participant each wearing white, blue and grey. One
participant wore reflective articles (on the arms). Three participants were wearing sports
shoes, one was wearing walking shoes and one sandals or thongs. The remaining two
participants were wearing dress shoes.
Table 10: Clothing worn by participants at the time of the crash
Clothing Above the waist Below the waist Clothing colour n n White 1 1 Black 0 5 Red 1 0 Orange 1 0 Other 5 2 Any fluorescent or reflective articles
Yes 1 No 7 Type of footwear
Sports/running shoes 3 Walking shoes 1 Sandals or thongs 1 Dress shoes 2 Unknown 1
27
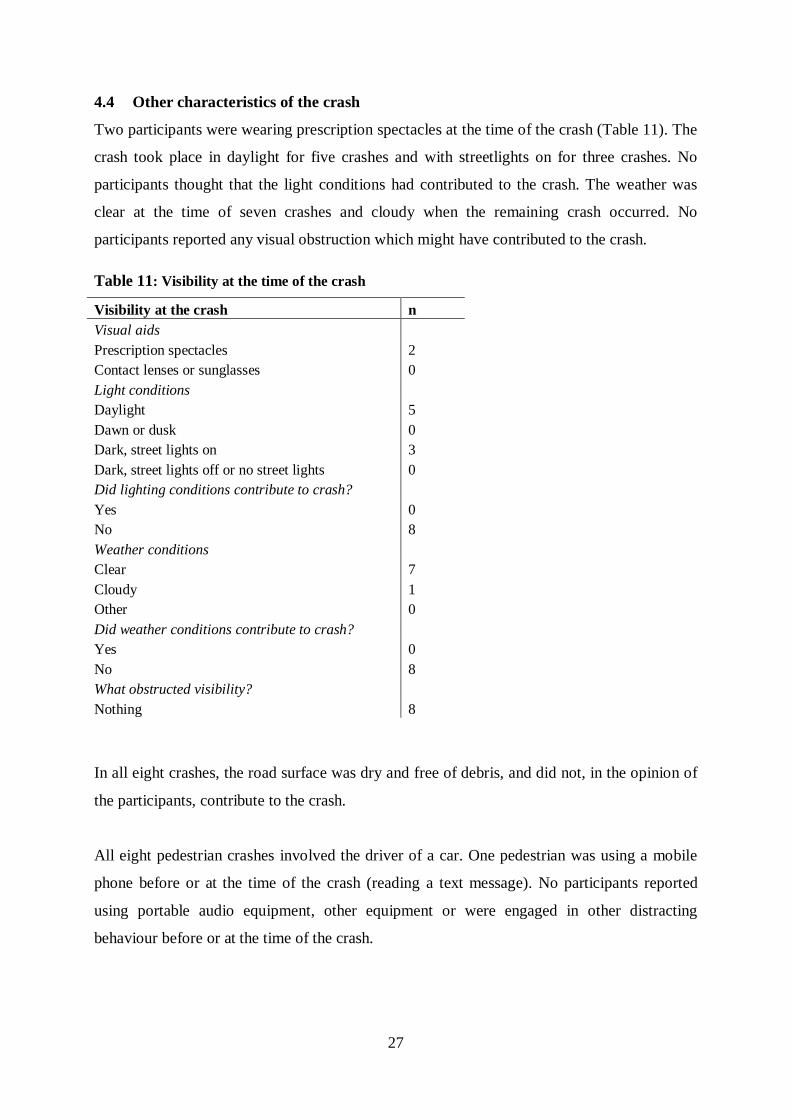
4.4 Other characteristics of the crash
Two participants were wearing prescription spectacles at the time of the crash (Table 11). The
crash took place in daylight for five crashes and with streetlights on for three crashes. No
participants thought that the light conditions had contributed to the crash. The weather was
clear at the time of seven crashes and cloudy when the remaining crash occurred. No
participants reported any visual obstruction which might have contributed to the crash.
Table 11: Visibility at the time of the crash
Visibility at the crash n Visual aids
Prescription spectacles 2 Contact lenses or sunglasses 0 Light conditions
Daylight 5 Dawn or dusk 0 Dark, street lights on 3 Dark, street lights off or no street lights 0 Did lighting conditions contribute to crash?
Yes 0 No 8 Weather conditions
Clear 7 Cloudy 1 Other 0 Did weather conditions contribute to crash?
Yes 0 No 8 What obstructed visibility?
Nothing 8
In all eight crashes, the road surface was dry and free of debris, and did not, in the opinion of
the participants, contribute to the crash.
All eight pedestrian crashes involved the driver of a car. One pedestrian was using a mobile
phone before or at the time of the crash (reading a text message). No participants reported
using portable audio equipment, other equipment or were engaged in other distracting
behaviour before or at the time of the crash.
28
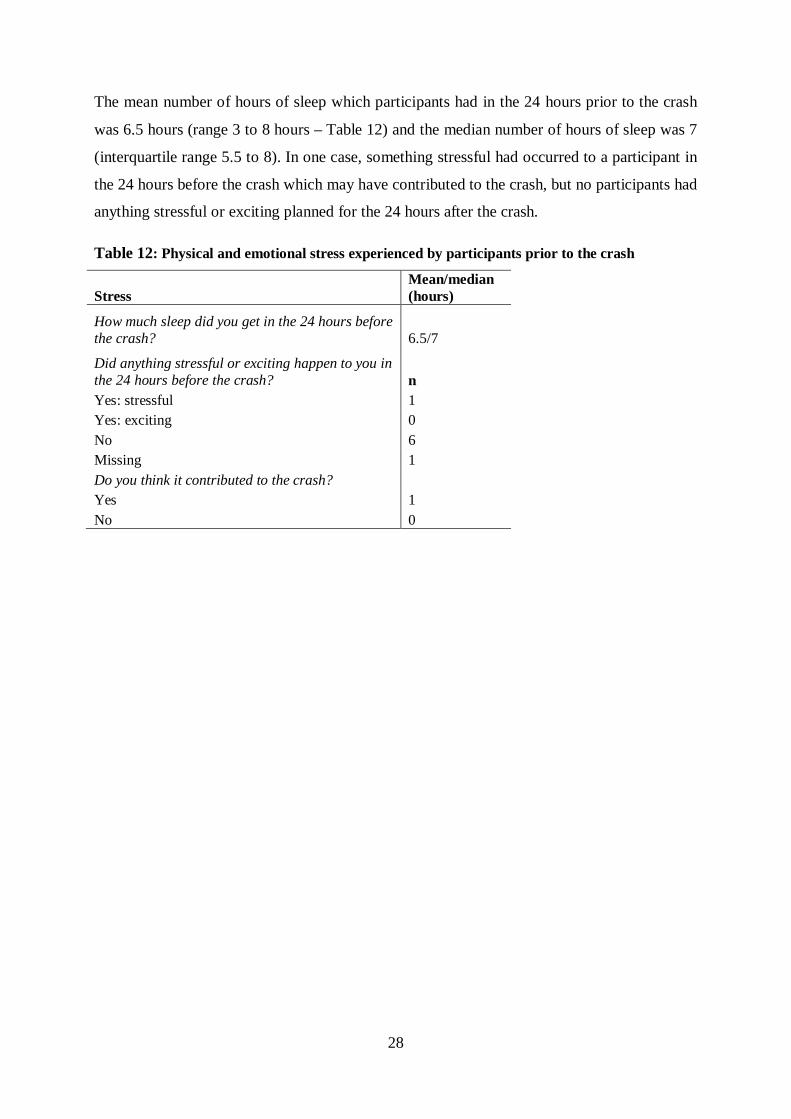
The mean number of hours of sleep which participants had in the 24 hours prior to the crash
was 6.5 hours (range 3 to 8 hours – Table 12) and the median number of hours of sleep was 7
(interquartile range 5.5 to 8). In one case, something stressful had occurred to a participant in
the 24 hours before the crash which may have contributed to the crash, but no participants had
anything stressful or exciting planned for the 24 hours after the crash.
Table 12: Physical and emotional stress experienced by participants prior to the crash
Stress Mean/median (hours)
How much sleep did you get in the 24 hours before the crash? 6.5/7
Did anything stressful or exciting happen to you in the 24 hours before the crash? n Yes: stressful 1 Yes: exciting 0 No 6 Missing 1 Do you think it contributed to the crash?
Yes 1 No 0
29
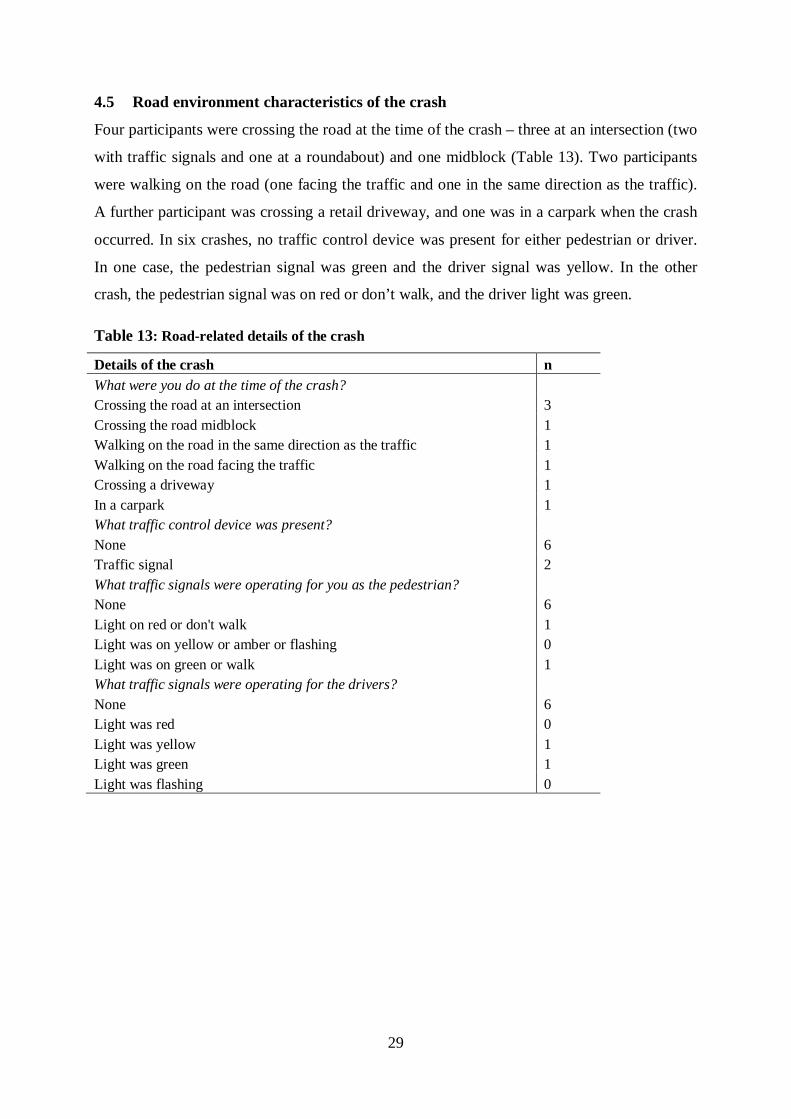
4.5 Road environment characteristics of the crash
Four participants were crossing the road at the time of the crash – three at an intersection (two
with traffic signals and one at a roundabout) and one midblock (Table 13). Two participants
were walking on the road (one facing the traffic and one in the same direction as the traffic).
A further participant was crossing a retail driveway, and one was in a carpark when the crash
occurred. In six crashes, no traffic control device was present for either pedestrian or driver.
In one case, the pedestrian signal was green and the driver signal was yellow. In the other
crash, the pedestrian signal was on red or don’t walk, and the driver light was green.
Table 13: Road-related details of the crash
Details of the crash n What were you do at the time of the crash?
Crossing the road at an intersection 3 Crossing the road midblock 1 Walking on the road in the same direction as the traffic 1 Walking on the road facing the traffic 1 Crossing a driveway 1 In a carpark 1 What traffic control device was present? None 6 Traffic signal 2 What traffic signals were operating for you as the pedestrian?
None 6 Light on red or don't walk 1 Light was on yellow or amber or flashing 0 Light was on green or walk 1 What traffic signals were operating for the drivers?
None 6 Light was red 0 Light was yellow 1 Light was green 1 Light was flashing 0
30
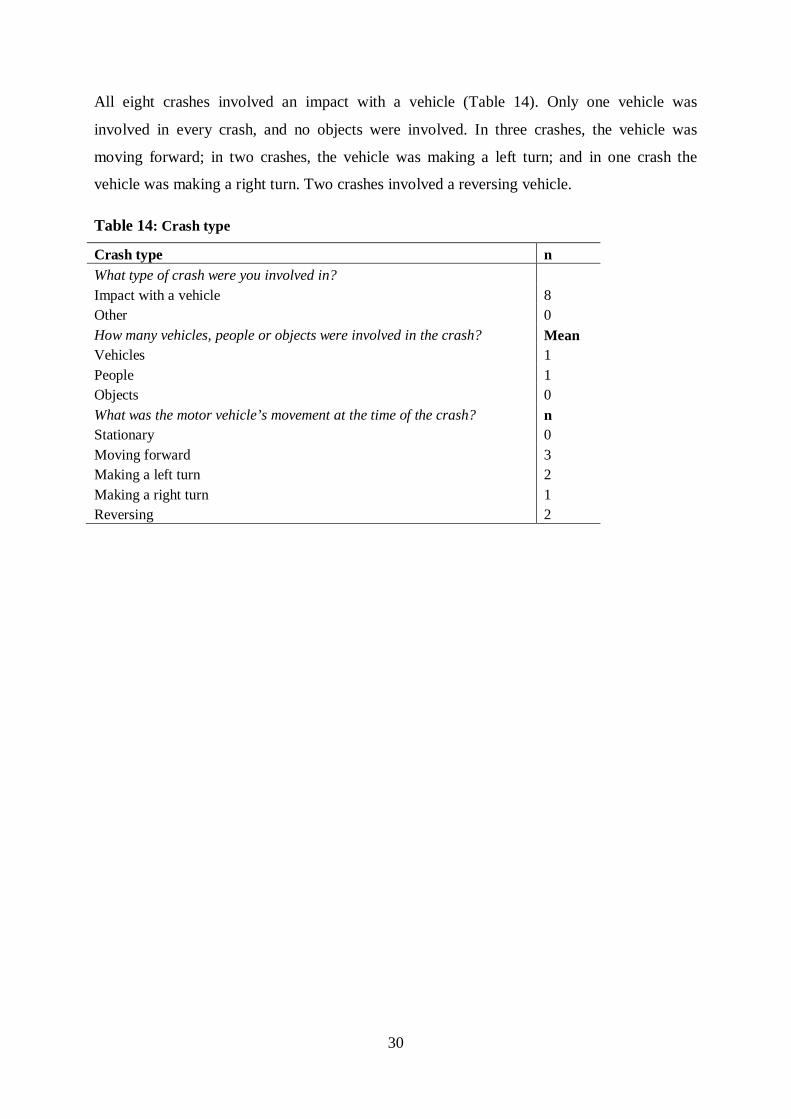
All eight crashes involved an impact with a vehicle (Table 14). Only one vehicle was
involved in every crash, and no objects were involved. In three crashes, the vehicle was
moving forward; in two crashes, the vehicle was making a left turn; and in one crash the
vehicle was making a right turn. Two crashes involved a reversing vehicle.
Table 14: Crash type
Crash type n What type of crash were you involved in? Impact with a vehicle 8 Other 0 How many vehicles, people or objects were involved in the crash? Mean Vehicles 1 People 1 Objects 0 What was the motor vehicle’s movement at the time of the crash? n Stationary 0 Moving forward 3 Making a left turn 2 Making a right turn 1 Reversing 2
31
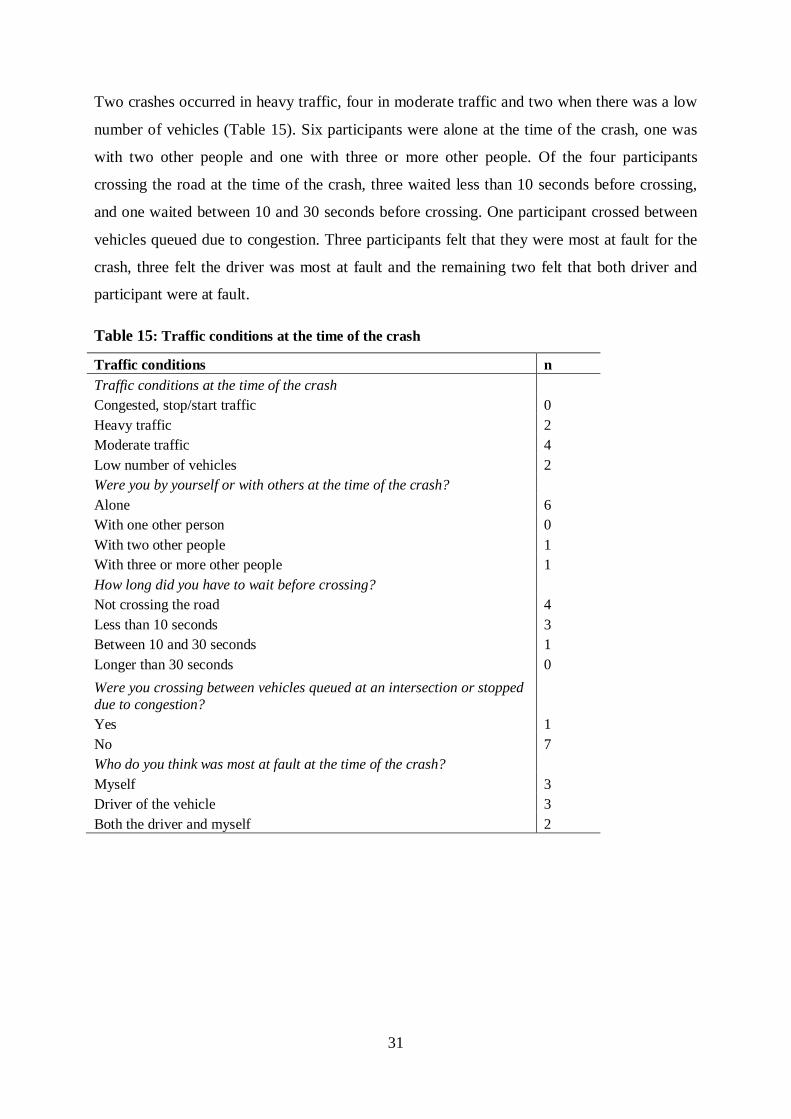
Two crashes occurred in heavy traffic, four in moderate traffic and two when there was a low
number of vehicles (Table 15). Six participants were alone at the time of the crash, one was
with two other people and one with three or more other people. Of the four participants
crossing the road at the time of the crash, three waited less than 10 seconds before crossing,
and one waited between 10 and 30 seconds before crossing. One participant crossed between
vehicles queued due to congestion. Three participants felt that they were most at fault for the
crash, three felt the driver was most at fault and the remaining two felt that both driver and
participant were at fault.
Table 15: Traffic conditions at the time of the crash
Traffic conditions n Traffic conditions at the time of the crash
Congested, stop/start traffic 0 Heavy traffic 2 Moderate traffic 4 Low number of vehicles 2 Were you by yourself or with others at the time of the crash?
Alone 6 With one other person 0 With two other people 1 With three or more other people 1 How long did you have to wait before crossing?
Not crossing the road 4 Less than 10 seconds 3 Between 10 and 30 seconds 1 Longer than 30 seconds 0 Were you crossing between vehicles queued at an intersection or stopped due to congestion?
Yes 1 No 7 Who do you think was most at fault at the time of the crash?
Myself 3 Driver of the vehicle 3 Both the driver and myself 2
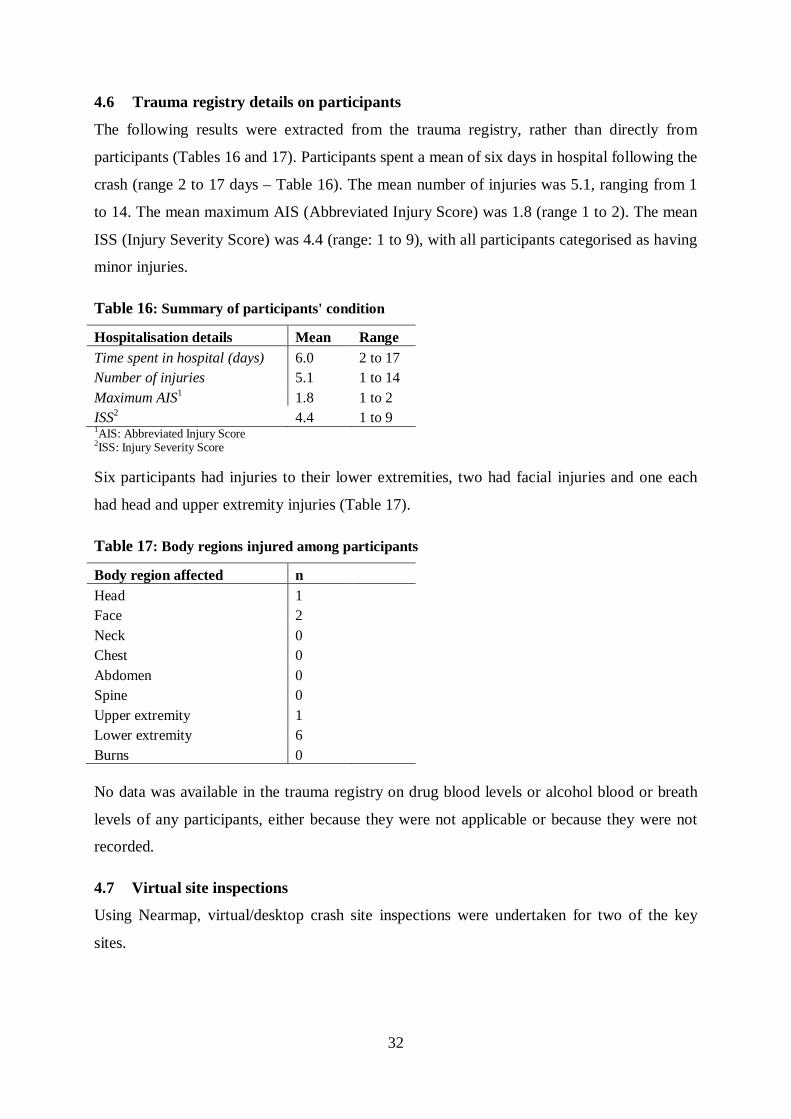
32
4.6 Trauma registry details on participants
The following results were extracted from the trauma registry, rather than directly from
participants (Tables 16 and 17). Participants spent a mean of six days in hospital following the
crash (range 2 to 17 days – Table 16). The mean number of injuries was 5.1, ranging from 1
to 14. The mean maximum AIS (Abbreviated Injury Score) was 1.8 (range 1 to 2). The mean
ISS (Injury Severity Score) was 4.4 (range: 1 to 9), with all participants categorised as having
minor injuries.
Table 16: Summary of participants' condition
Hospitalisation details Mean Range Time spent in hospital (days) 6.0 2 to 17 Number of injuries 5.1 1 to 14 Maximum AIS1 1.8 1 to 2 ISS2 4.4 1 to 9 1AIS: Abbreviated Injury Score 2ISS: Injury Severity Score Six participants had injuries to their lower extremities, two had facial injuries and one each
had head and upper extremity injuries (Table 17).
Table 17: Body regions injured among participants
Body region affected n Head 1 Face 2 Neck 0 Chest 0 Abdomen 0 Spine 0 Upper extremity 1 Lower extremity 6 Burns 0 No data was available in the trauma registry on drug blood levels or alcohol blood or breath
levels of any participants, either because they were not applicable or because they were not
recorded.
4.7 Virtual site inspections
Using Nearmap, virtual/desktop crash site inspections were undertaken for two of the key
sites.
33
Crash site one
The crash occurred during the daytime on a weekday afternoon. The site of the crash was a
driveway between two shops. It appears that the motor vehicle was paused to exit a car park,
turning left into the major road as the pedestrian crossed in front of the vehicle. As visualised
on Nearmap, it was a single lane exit entering a 60km/hour zone road. From the pedestrian’s
description, the driver appeared to be focused on finding a gap in the traffic, and to be looking
to the right to track the motor vehicle traffic, thus failing to realise that the pedestrian was
crossing in front of the vehicle.
Crash site two
This crash occurred on a weekday in the early morning in the dark. The crash site was in a
roundabout, where the driver of the motor vehicle did not indicate their intention of exiting
the roundabout. Because of this, the pedestrian crossed the roundabout. The pedestrian was
injured when the vehicle turned left without warning. The roundabout consisted of two lanes
and the road width (including the central island) was more than nine metres. The speed limit
on the road was 50km/hour and the crash occurred in a residential area.
4.8 Individual cases studies
Each individual case included in the study is briefly described, highlighting likely
contributing factors to the individual crashes.
Case one
Case one was a young female crossing midblock on a weekday. She had taken diazepam in
the three hours prior to the crash and had been involved in a stressful personal interaction
before going for a walk. Both of these factors could have contributed to her crash. She did not
have a driver’s licence and used public transport, so may have had less insight into the
movements of motor vehicles than a licensed driver. Heavy traffic at the time may have also
contributed to the crash.
Case two
Case two was a young male walking along a road in the same direction as the traffic on a
weekend in the evening. The direction of travel in low light conditions (although there were
streetlights present) may have contributed to poor visibility of the pedestrian to the
approaching vehicles. In addition, the pedestrian had consumed four to five standard drinks,
putting him at risk of short-term alcohol-related harms such as a road crash.
34
Case three
Case three was a young female, who was running in the morning as she was late for work.
She incorrectly crossed when the light was red for her, in heavy traffic. The distraction of
being late may have resulted in her making an incorrect crossing decision and probably led to
the crash.
Case four
Case four was a male in his late twenties. Several factors may have contributed to his crash
including: his daily use of diazepam, consumption of more than five standard drinks of
alcohol in the three hours prior to the crash, only three hours sleep in the previous twenty-four
hours, and reading a text message at the time of the crash. In addition, he had previously lost
sight in one eye, and had no driver’s licence, both of which could have contributed to the
crash. He did, however, consider the motor vehicle driver to be at fault.
Case five
Case five was a female in her mid-fifties. She had consumed four to five standard drinks of
alcohol prior to the crash and it occurred on a Saturday night, both of which probably
contributed to her crash. The motor vehicle reversed into her; reduced ambient light may have
led to her being less visible to the driver.
Case six
Case six was a male in his mid-fifties who was walking on the road facing the traffic on a
weekday afternoon when he was hit by a motor vehicle. He had previously had a
cerebrovascular accident which left him with residual muscle weakness (and possibly reduced
reaction times and balance). This may have contributed to his inability to avoid the vehicle
which reversed out of a driveway and collided with him.
Case seven
Case seven was a female in her late fifties, crossing a roadway between two shops on a
weekday afternoon. She incorrectly judged how much time she had to cross in front of a
stationary vehicle, and the vehicle moved off, colliding with her.
The site of the crash for case seven was described above (crash site one). The driveway/exit
between shops which was used by the pedestrian led to a higher speed (60km/hour) road. This
35
appeared to contribute to the crash as the driver was preoccupied with watching for motor
vehicle traffic, rather than potential pedestrian traffic.
Case eight
Case eight was a female in her mid-sixties running across a roundabout on a weekday in the
early morning before dawn. She was wearing reflective clothing on her arms. It is unclear
whether her lower visibility (due to ambient light conditions) may have contributed to the
crash, which she stated was entirely the driver’s fault.
The site of the crash for case eight was described above (crash site two). The road
infrastructure does not appear to have contributed to the crash.
36
5 DISCUSSION
This study included a comprehensive review of the current literature on pedestrian safety and
an in-depth case series study of pedestrian crashes in Western Australia. Data collection
included a questionnaire, trauma registry data, and virtual site inspections of the crash sites.
A total of eight pedestrians, involved in crashes requiring hospitalisation, were successfully
recruited, although difficulties with recruitment occurred. A sizeable number of pedestrians
are involved in crashes every year. A total of 467 pedestrian crashes occurred in 2014,
according to the Integrated Road Information System maintained by Main Roads Western
Australia). However, it may be that many of these police-reported crashes either did not result
in injuries or resulted in milder injuries which did not require admission to hospital for 24
hours (a pre-requisite for inclusion in the trauma registry, and therefore this study).
There was a much higher than expected ineligibility rate, mainly due to loss of memory of the
crash (nearly a quarter of all possible participants). It is likely that these pedestrians were
involved in more serious crashes, with more severe injuries. Other major reasons for
ineligibility were that: i) the crash occurred outside Perth, and was likely to be more severe as
the affected pedestrian was transferred some distance for treatment, and ii) the potential
participant was unable to speak English. Furthermore, a high percentage of potential
participants declined to participate: nearly a quarter of all potential participants, and three-
quarters of eligible pedestrians.
5.1 Demographic and health details
Half of the participants were aged between 21 and 27 years (two males and two females) and
half were in the 50 to 64 year old age-group (three females and one male), so none of the
participants fell in the higher risk group of older pedestrians (Fontaine and Gourlet, 1997).
However, since older pedestrians tend to sustain more serious injuries (O’Hern et al., 2015)
and have higher mortality rates (Tefft, 2013), it may be that older pedestrians injured in Perth
were unable to participate due to more severe injuries resulting in loss of memory or death.
Notably, no pedestrians of middle age were included in the study, possibly due to less
exposure (more car travel due to stage of life), greater driving experience than younger
pedestrians (more awareness of motor vehicle movement) and faster reaction times than older
pedestrians. Previous research has shown that male pedestrians are at higher risk of crash
involvement and tend to be more severely injured than females (Martin et al., 2011, Road
37
Safety Commission, 2014); however, in this study, more than half the participants were
females. This may relate to the small sample size or to the fact that the study included less
seriously injured, although still hospitalised, pedestrians.
5.2 Pedestrian-related crash details
Two of the participants did not have a driver’s licence, and one had a learner’s permit. The
rest of the participants had held their licences for a minimum of three years. Furthermore,
only half of the participants stated that their primary means of transportation was as a driver.
Because of the sample size, no conclusions could be drawn about the effect of driving
experience on pedestrian crash risk.
Three of the participants (two younger and one older) self-reported having consumed four or
more standard drinks in the three hours prior to the crash, which put them at risk of short-term
alcohol-related harm, including road traffic injury (National Health and Medical Research
Institute, 2009). The road safety literature has consistently found an increased risk of injury
among pedestrians who had consumed alcohol, including a dose-response effect (e.g.,
Blomberg et al., 1979). Other drugs have been associated with increased risk of crashes
among pedestrians (Wilson and Fang, 2000). Two participants had taken diazepam, a drug
known to potentially cause drowsiness, unsteadiness, confusion and blurred or double vision
(Apotex Pty Ltd, 2015), in the hours prior to the crash (one using it daily and one within three
hours of the crash). One participant used this in combination with alcohol, which is
contraindicated as it may intensify these side-effects (Apotex Pty Ltd, 2015).
A total of two participants (one younger and one older) had a visual impairment which may
have contributed to the crash. One participant had reduced mobility which may have led to
slower walking speed or reduced reaction time.
Various potential causes of distraction were explored. One participant was reading a text
message at the time of the crash and fell into the higher risk group for distraction from mobile
phones according to Nasar and Troyer (2013): young male and under 30 years old. Another
participant was distracted due to a stressful personal event which had occurred immediately
prior to the crash. It has been suggested that stress can increase crash risk among drivers
(Matthews et al., 1998) and among child pedestrians (Christoffel et al., 1996). One participant
had just three hours sleep and fatigue is a well-known risk factor for crashes among drivers
38
(Taoka, 1998, Bunn et al., 2005, Williamson et al., 2011). Fatigue may similarly affect
pedestrians’ alertness, judgement, and motor control, although there is at present little formal
reporting on this (Palamara and Broughton, 2013).
Only one participant was wearing reflective clothing on the arms and this was the oldest
participant. In lower light conditions (three of the examined conditions occurred at night),
wearing reflective clothing on the extremities to highlight ‘biological motion’ improves the
perception of pedestrians by drivers (Tyrrell et al., 2016).
5.3 Road environment details
There were no reported weather or lighting issues at the time of any of the crashes. The
crashes either took place during daytime, or at night when the street lights were on. The crash
times ranged from 06:00 in the morning to 23:00 at night. Previous research has shown that
lower light conditions reduce visibility and result in more serious crashes (Zegeer and
Bushell, 2012). Three crashes occurred on Friday or Saturday evenings, and the remaining
occurred from Tuesday to Thursday (three in daylight, one in the dark).
All crashes involved an impact with a single vehicle – and half of them occurred while the
pedestrian was crossing at an intersection. Two crashes occurred when traffic control devices
were present. In one case, the pedestrian incorrectly walked when they should have waited,
and the other case, the vehicle went through the intersection when the pedestrian signal was
green.
The vehicle movements at the time of the crash varied - moving forward, turning left, turning
right and reversing. The traffic conditions were also a mixture of low, moderate and heavy
traffic conditions.
5.4 Injury types
All participants had injuries classified as ‘minor’, as measured by the injury severity score. In
most cases, the lower limbs were injured, with the face, head and upper limbs being affected
for some participants. The severity and location of the injuries in this study was probably a
function of the sample, and is not generalisable.
39
5.5 Limitations
The major limitation of this study was the low number of participants who were recruited.
Only pedestrians who had been admitted to hospital for at least 24 hours were included in the
study. A relatively high proportion of potential participants were ineligible, mainly due to loss
of memory which suggests they had more severe injuries. This could have led to a bias in the
sample, with only pedestrians involved in moderately serious crashes (neither mild nor very
serious) being included in the study. Furthermore, a high proportion of eligible participants
declined to participate. This may have been due to an unwillingness to disclose factors which
might have revealed their contribution to the crash. Pedestrians, unlike cyclists, do not form a
coherent group with a shared identity. Thus the motivation to participate in research which
might improve conditions for fellow pedestrians does not exist, as it might for cyclists or even
motor vehicle drivers.
The questionnaire collected self-reported information on the crash, which relied on the
participants’ memories of the crash. Memory may have been affected by the trauma, by the
length of time between the crash and the interview, or by social desirability bias. The research
nurse attempted to conduct the interviews as close to the date of the crash as possible, and
ensured confidentiality, to reduce these effects. The eight participants did not appear to be
strongly affected by social desirability bias, since three reported using alcohol before the
crash, and five took partial or complete responsibility for the crash.
40
6 RECOMMENDATIONS
6.1 Recommendations relating to pedestrian safety
Prevention campaigns to protect pedestrians should include increased awareness of road
hazards - for both pedestrians and drivers (Constant and Lagarde, 2010). It is particularly
important to ensure minimum road safety education (Adminaite et al., 2015) for pedestrians
who do not drive or are vulnerable road users by virtue of their age, physical or cognitive
impairment.
The public needs to be educated about the risk posed by pedestrians using alcohol (Constant
and Lagarde, 2010). Alcohol consumption is a risk not only for drivers, but also for
pedestrians (Öström and Eriksson, 2001, Živković et al., 2016). In addition, pedestrians need
to be aware that the use of certain drugs (including prescription medication) can also lead to
impairment in pedestrians (Turk et al., 1974, Wilson and Fang, 2000).
There is increasing awareness of the dangers of distraction from electronic devices among
drivers (Divekar et al., 2012, Lam, 2002, Macy et al., 2014), but research is now showing that
pedestrians using mobile phones may be equally as distracted (Hatfield and Murphy, 2007,
Nasar and Troyer, 2013). As with drivers, pedestrians need to be made aware of the dangers
of using electronic devices and about other sources of distraction, including stress.
Potentially, policies need to be developed to enable the imposition of sanctions on pedestrians
under the influence of alcohol and other drugs, or distracted because of use of electronic
devices while crossing roads.
Clothing which improves visibility especially at night needs to be promoted, particularly the
use of retroreflective markings on the extremities (Tyrrell et al., 2016).
Traffic engineering measures, including segregation of road traffic from non-motorised road
users (including pedestrians), selectively reducing speed limits (Retting et al., 2003, Oxley
and Corben, 2005) and increased street lighting (Beyer and Ker, 2009) will reduce the risk
faced by pedestrians in high pedestrian areas (Constant and Lagarde, 2010).
6.2 Recommendations relating to future studies
One of the main issues with this in-depth case series was the low eligibility rate. This may be
because many pedestrians were not sufficiently seriously injured to be admitted for 24 hours
41
or too seriously injured to remember the crash. Future studies could recruit pedestrians using
emergency department records, involve further Western Australian cities or include other
Australian capital cities. A further option would be to collaborate with police so that a
research assistant was alerted every time a crash involving a pedestrian occurred, and could
follow up with the pedestrian directly.
6.3 Conclusion
Pedestrians are a diverse group of people, ranging from the very young to older pedestrians,
with a range of experience of traffic and different abilities. As such, a mix of education,
behaviour modification, and traffic engineering measures needs to be employed to protect
these vulnerable road users.
42
7 REFERENCES
2013. Main Roads Western Australia [Online]. Available:
http://www.mainroads.wa.gov.au/Pages/Welcome.aspx [Accessed 2013].
ADMINAITE, D., ALLSOP, R. & JOST, G. 2015. Making Walking and cycling on Europe's
roads safer: PIN flash report 29. Brussels.
APOTEX PTY LTD 2015. APO-Diazepam Tablets: Product Information - Australia.
AUSTROADS INC. 2000. Pedestrian and cyclist safety — comparison of pedestrian and
bicycle accidents in New South Wales,Victoria and Queensland Sydney.
BARTON, B. K. & SCHWEBEL, D. C. 2007. The Roles of Age, Gender, Inhibitory Control,
and Parental Supervision in Children's Pedestrian Safety. Journal of Pediatric
Psychology, 32, 517-526.
BEYER, F. & KER, K. 2009. Street lighting for preventing road traffic injuries. Cochrane
Database of Systematic Reviews.
BLOMBERG, R., PREUSER, D., HALE, A. & ULMER, R. 1979. A comparison of alcohol
involvement in pedestrians and pedestrian casualities. Darien, Connecticut: U.S.
Department of Transportation. National Highway Traffic Safety Administration.
BRADDOCK, M., LAPIDUS, G., GREGORIO, D., KAPP, M. & BANCO, L. 1991.
Population, income and ecological correlates of child pedestrian injury. Pediatrics, 88,
1242-1247.
BRAMWELL, J., BRUCE, S. A., HILL, D. L. & THOMPSON, P. E. 2014. Reported Road
Crashes in Western Australia 2013. Perth: Office of Road Safety and Main Roads
Western Australia.
BREEN, J. 2002. European priorities for pedestrian safety European Transport Safety Council
BUNN, T. L., SLAVOVA, S., STRUTTMANN, T. W. & BROWNING, S. R. 2005.
Sleepiness/fatigue and distraction/inattention as factors for fatal versus nonfatal
commercial motor vehicle driver injuries. Accident Analysis & Prevention, 37, 862-
869.
BUREAU OF INFRASTRUCTURE TRANSPORT AND REGIONAL ECONOMICS 2015.
Australian road deaths database.
CAIRNEY, P., STEPHENSON, W. & MACAULAY, J. 2004. Preventing crashes involving
intoxicated pedestrians. Stage 2—an analysis of Australian coronial records, 1999–
2001. Sydney: Austroads.
CAREY, T. S. & BODEN, S. D. 2003. A critical guide to case series reports. Spine, 28, 1631-
4.
43
CASSELL, E., CLAPPERTON, A., ALAVI, H. & JONES, S. 2010a. Traffic-related
pedestrian injury in Victoria (1): hospital-treated injury. Hazard, 71.
CASSELL, E., KERR, E., REID, N., CLAPPERTON, A. & ALAVI, H. 2010b. Traffic-
related pedestrian injury in Victoria (2): Fatal injury. Hazard, 72.
CELIS, A., GOMEZ, Z., MARTINEZ-SOTOMAYOR, A., ARCILA, L. & VILLASEÑOR,
M. 2003. Family characteristics and pedestrian injury risk in Mexican children. Injury
Prevention, 9, 58-61.
CHRISTOFFEL, K. K., DONOVAN, M., SCHOFER, J., WILLS, K., LAVIGNE, J. V.,
TANZ, R. R., WHITE, B., BARTHEL, M., JENQ, J., KLINGER, C. &
MALMSTROM, K. 1996. Psychosocial factors in childhood pedestrian injury: A
matched case-control study. Pediatrics, 97, 33-42.
CHU, X. 2006. Pedestrian safety at midblock locations. Center for Urban Transportation
Research.
CITY OF MELBOURNE 2013. Transport Strategy 2012: Planning for future growth.
Melbourne, Victoria. Melbourne, Victoria: City of Melbourne, Victoria.
CLIFTON, K. J. & LIVI, A. D. Gender Differences in Walking Behavior, Attitudes About
Walking, and Perceptions of the Environment in Three Maryland Communities.
Confernce on Research on Women's Issues in Transportation, 18-20 November 2004
Chicago, Illinois. 79-88.
CONSTANT, A. & LAGARDE, E. 2010. Protecting vulnerable road users from injury. PLoS
Medicine, 7, 1-4.
CORBEN, B., DEERY, H., DIAMANTOPOULOU, K. & DYTE, D. 1998. A methodology
for understanding pedestrian safety problems and for developing solutions. 19th ARRB
Transport Research Ltd Conference. Sydney.
COTTRILL, C. D. & THAKURIAH, P. 2010. Evaluating pedestrian crashes in areas with
high low-income or minority populations. Accident Analysis & Prevention, 42, 1718-
1728.
CRANDALL, J. R., BHALLA, K. S. & MADELEY, N. J. 2002. Designing road vehicles for
pedestrian protection. BMJ, 324, 1145-1148.
CROWLEY-KOCH, B. J., VAN HOUTEN, R. & LIM, E. 2011. Effects of pedestrian
prompts on motorist yielding at crosswalks. Journal of Applied Behavior Analysis, 44,
121-126.
44
DAVIS, G. A. 2001. Relating severity of pedestrian injury to impact speed in vehicle-
pedestrian crashes: simple threshold model. Transportation Research Record, 1773,
108-113.
DEMETRIADES, D., MURRAY, J., MARTIN, M., VELMAHOS, G., SALIM, A., ALO, K.
& RHEE, P. 2004. Pedestrians injured by automobiles: Relationship of age to injury
type and severity 1. Journal of the American College of Surgeons, 199, 382-387.
DEPARTMENT OF INFRASTRUCTURE AND REGIONAL DEVELOPMENT 2016. Road
Trauma Australia 2015 Statistical summary. Canberra, Australia.
DEPARTMENT OF PLANNING, T. A. I. G. O. S. A. 2014. Pedestrians involved in road
crashes in South Australia.
DIMAGGIO, C. & LI, G. 2012. Roadway characteristics and pediatric pedestrian injury.
Epidemiologic Reviews, 34, 46-56.
DIVEKAR, G., PRADHAN, A., POLLATSEK, A. & FISHER, D. 2012. Effect of external
distractions. Transportation Research Record, 2321, 15-22.
DOMMES, A., CAVALLO, V. & OXLEY, J. 2013. Functional declines as predictors of risky
street-crossing decisions in older pedestrians. Accident Analysis and Prevention, 59,
135-143.
FONTAINE, H. & GOURLET, Y. 1997. Fatal pedestrian accidents in France: A typological
analysis. Accident Analysis and Prevention, 29, 303-312.
GERUSCHAT, D. R. & HASSAN, S. E. 2005. Driver behavior in yielding to sighted and
blind pedestrians at roundabouts. Journal of Visual Impairment and Blindness, 99,
286-302.
GORRIE, C. A., BROWN, J. & WAITE, P. M. E. 2008. Crash characteristics of older
pedestrian fatalities: dementia pathology may be related to ‘at risk’ traffic situations.
Accident Analysis & Prevention, 40, 912-919.
GOVERNMENT OF WESTERN AUSTRALIA 2015. Preliminary Fatal and Critical Injuries
on Western Australian Roads: 2014 Summary. WA Police and Office of Road Safety.
GRISWOLD, J., FISHBAIN, B., WASHINGTON, S. & RAGLAND, D. R. 2011. Visual
assessment of pedestrian crashes. Accident Analysis & Prevention, 43, 301-306.
GUÉGUEN, N., MEINERI, S. & EYSSARTIER, C. 2015. A pedestrian's stare and drivers'
stopping behavior: A field experiment at the pedestrian crossing. Safety Science, 75,
87-89.
45
HADDON, W., VALIEN, P., MCCARROLL, J. R. & UMBERGER, C. J. 1961. A controlled
investigation of the characteristics of adult pedestrians fatally injured by motor
vehicles in Manhattan. Journal of Chronic Diseases, 14, 655-678.
HALEEM, K., ALLURI, P. & GAN, A. 2015. Analyzing pedestrian crash injury severity at
signalized and non-signalized locations. Accident Analysis and Prevention, 81, 14-23.
HARRUFF, R. C., AVERY, A. & ALTER-PANDYA, A. S. 1998. Analysis of circumstances
and injuries in 217 pedestrian traffic fatalities. Accident Analysis & Prevention, 30,
11-20.
HATFIELD, J., FERNANDES, R., JOB, R. F. S. & SMITH, K. 2007. Misunderstanding of
right-of-way rules at various pedestrian crossing types: Observational study and
survey. Accident Analysis and Prevention, 39, 833-842.
HATFIELD, J. & MURPHY, S. 2007. The effects of mobile phone use on pedestrian crossing
behaviour at signalised and unsignalised intersections. Accident Analysis and
Prevention, 39, 197-205.
HIMANEN, V. & KULMALA, R. 1988. An application of logit models in analysing the
behaviour of pedestrians and car drivers on pedestrian crossings. Accident Analysis
and Prevention, 20, 187-197.
HOLUBOWYCZ, O. T., KLOEDEN, C. N. & MCLEAN, A. J. 1994. Age, sex, and blood
alcohol concentration of killed and injured drivers, riders, and passengers. Accident
Analysis and Prevention, 26, 483-492.
HOSKING, S. G., YOUNG, K. L. & REGAN, M. A. 2009. The effects of text messaging on
young drivers. Human Factors, 51, 582-592.
HU, J. & KLINICH, K. D. 2015. Toward designing pedestrian-friendly vehicles.
International Journal of Vehicle Safety, 8, 22-54.
HUTCHINSON, T. P., KLOEDEN, C. N. & LINDSAY, V. L. 2010. Countermeasures to the
problem of accidents to intoxicated pedestrians. Journal of Forensic and Legal
Medicine, 17, 115-119.
HUTCHINSON, T. P. & LINDSAY, V. L. 2009. Pedestrian and cyclist crashes in the
Adelaide Metropolitan Area. Adelaide: Centre for Automotive Safety Research,
University of Adelaide.
HYMAN, I. E., BOSS, S. M., WISE, B. M., MCKENZIE, K. E. & CAGGIANO, J. M. 2010.
Did you see the unicycling clown? Inattentional blindness while walking and talking
on a cell phone. Applied Cognitive Psychology, 24, 597-607.
46
KATZ, A., ZAIDEL, D. & ELGRISHI, A. 1975. An experimental study of driver and
pedestrian interaction during the crossing conflict. Human Factors, 17, 514-527.
KOOISTRA, B., DIJKMAN, B., EINHORN, T. & BHANDARI, M. 2009. How to design a
good case series. Journal of Bone and Joint Surgery 91-A Suppl, 21-26.
KOPPEL, S., CHARLTON, J., KOPINATHAN, C. & TARANTO, D. 2011. Are child
occupants a significant source of driving distraction? Accident Analysis and
Prevention, 43, 1236-1244.
LAFLAMME, L. & DIDERICHSEN, F. 2000. Social differences in traffic injury risks in
childhood and youth—a literature review and a research agenda. Injury Prevention, 6,
293-298.
LAM, L. T. 2002. Distractions and the risk of car crash injury: The effect of drivers' age.
Journal of Safety Research, 33, 411-419.
LANSDOWN, T. C. 2012. Individual differences and propensity to engage with in-vehicle
distractions - A self-report survey. Transportation Research Part F: Traffic
Psychology and Behaviour, 15, 1-8.
LASCALA, E. A., GERBER, D. & GRUENEWALD, P. 2000. Demographic and
environmental correlates of pedestrian injury collisions: a spatial analysis. Accident
Analysis and Prevention, 32, 651-658.
LASCALA, E. A., GRUENEWALD, P. J. & JOHNSON, F. W. 2004. An ecological study of
the locations of schools and child pedestrian injury collisions. Accident Analysis and
Prevention, 36, 569-576.
LEDEN, L., GÅRDER, P. & JOHANSSON, C. 2006. Safe pedestrian crossings for children
and elderly. Accident Analysis and Prevention, 38, 289-294.
LEE, I. M. & BUCHNER, D. M. 2008. The importance of walking to public health. Medicine
and Science in Sports and Exercise, 40, S512-S518.
LEE, J. D. 2007. Technology and teen drivers. Journal of Safety Research, 38, 203-213.
LICHENSTEIN, R., SMITH, D. C., AMBROSE, J. L. & MOODY, L. A. 2012. Headphone
use and pedestrian injury and death in the United States: 2004-2011. Injury
Prevention, 18, 287-290.
LIGHTSTONE, A. S., DHILLON, P. K., PEEK-ASA, C. & KRAUS, J. F. 2001. A
geographic analysis of motor vehicle collisions with child pedestrians in Long Beach,
California: comparing intersection and midblock incident locations. Injury Prevention,
7, 155-160.
47
MACY, M. L., CARTER, P. M., BINGHAM, C. R., CUNNINGHAM, R. M. & FREED, G.
L. 2014. Potential distractions and unsafe driving behaviors among drivers of 1- to 12-
year-old children. Academic Pediatrics, 14, 279-286.
MARTIN, A. J., HAND, E. B., TRACE, F. & O'NEILL, D. 2010. Pedestrian Fatalities and
Injuries Involving Irish Older People. Gerontology, 56, 266-71.
MARTIN, J. L., LARDY, A. & LAUMON, B. 2011. Pedestrian injury patterns according to
car and casualty characteristics in France. Annals of Advances in Automotive
Medicine, 55, 137-146.
MATTHEWS, G., DORN, L., HOYES, T. W., DAVIES, D. R. & ET AL. 1998. Driver stress
and performance on a driving simulator. Human Factors, 40, 136.
MCMAHON, P., DUNCAN, C., STEWART, J., ZEGEER, C. & KHATTAK, A. 2002.
Analysis of factors contributing to "Walking Along Roadway" crashes. Transportation
Research Record: Journal of the Transportation Research Board, 1674.
MWAKALONGE, J., SIUHI, S. & WHITE, J. 2015. Distracted walking: examining the
extent to pedestrian safety problems. Journal of Traffic and Transportation
Engineering (English Edition).
NAGHAVI, M., WANG, H. D., LOZANO, R., DAVIS, A., LIANG, X., ZHOU, M. G.,
VOLLSET, S., OZGOREN, A. A., ABDALLA, S., ABD-ALLAH, F., AZIZ, M. I. A.,
ABERA, S., ABOYANS, V., ABRAHAM, B., ABRAHAM, J. P., ABUABARA, K.,
ABUBAKAR, I., ABU-RADDAD, L., ABU-RMEILEH, N., ACHOKI, T.,
ADELEKAN, A., ADEMI, Z., ADOFO, K., ADOU, A., ADSUAR, J., ARNLOV, J.,
AGARDH, E. E., AKENA, D., AL KHABOURI, M., ALASFOOR, D., ALBITTAR,
M., ALEGRETTI, M. A., ALEMAN, A., ALEMU, Z., ALFONSO-CRISTANCHO,
R., ALHABIB, S., ALI, M., ALI, R., ALLA, F., AL LAMI, F., ALLEBECK, P.,
ALMAZROA, M. A., SALMAN, R., ALSHARIF, U., ALVAREZ, E., ALVIZ-
GUZMAN, N., AMANKWAA, A. A., AMARE, A., AMELI, O., AMINI, H.,
AMMAR, W., ANDERSON, H., ANDERSON, B., ANTONIO, C., ANWARI, P.,
APFEL, H., CUNNINGHAM, S. A., ARSENIJEVIC, V., AL, A., ASAD, M. M.,
ASGHAR, R., ASSADI, R., ATKINS, L., ATKINSON, C., BADAWI, A., BAHIT,
M. C., BAKFALOUNI, T., BALAKRISHNAN, K., BALALLA, S., BANERJEE, A.,
BARBER, R. M., BARKER-COLLO, S., BARQUERA, S., BARREGARD, L.,
BARRERO, L. H., BARRIENTOS-GUTIERREZ, T., BASU, A., BASU, S.,
BASULAIMAN, M., BEARDSLEY, J., BEDI, N., BEGHI, E., BEKELE, T., BELL,
M., BENJET, C., BENNETT, D., BENSENOR, I., BENZIAN, H., BERTOZZI-
48
VILLA, A., BEYENE, T., BHALA, N., BHALLA, A., BHUTTA, Z., BIKBOV, B.,
BIN ABDULHAK, A., BIRYUKOV, S., BLORE, J. D., BLYTH, F., BOHENSKY,
M. A., BORGES, G., et al. 2015. Global, regional, and national age-sex specific all-
cause and cause-specific mortality for 240 causes of death, 1990-2013: a systematic
analysis for the Global Burden of Disease Study 2013. Lancet, 385, 117-171.
NASAR, J. L. & TROYER, D. 2013. Pedestrian injuries due to mobile phone use in public
places. Accident Analysis and Prevention, 57, 91-95.
NATIONAL HEALTH AND MEDICAL RESEARCH INSTITUTE 2009. Australian
guidelines to reduce health risks from drinking alcohol. Canberra: Commonwealth of
Australia.
NEARMAP LTD. 2016. Nearmap Australia.
NOLAND, R. B., KLEIN, N. J. & TULACH, N. K. 2013. Do lower income areas have more
pedestrian casualties? Accident Analysis & Prevention, 59, 337-345.
O’HERN, S., OXLEY, J. & LOGAN, D. 2015. Older adults at increased risk as pedestrians in
Victoria, Australia: an examination of crash characteristics and injury outcomes.
Traffic Injury Prevention, 16, 161-167.
OHLHAUSER, A. D., BOYLE, L. N., MARSHALL, D. & AHMAD, O. Drivers' behavior
through a yellow light: Effects of distraction and age. Proceedings of the Human
Factors and Ergonomics Society, 2011. 1919-1923.
ÖSTRÖM, M. & ERIKSSON, A. 2001. Pedestrian fatalities and alcohol. Accident Analysis &
Prevention, 33, 173-180.
OWENS, J. M., MCLAUGHLIN, S. B. & SUDWEEKS, J. 2011. Driver performance while
text messaging using handheld and in-vehicle systems. Accident Analysis and
Prevention, 43, 939-947.
OXLEY, J. 2009. Walking for older road users: A safe alternative travel mode to the car? In:
ODELL, M. (ed.) Older Road Users. Arizona: Lawyers and Judges Publishing Co.
OXLEY, J. 2012. Understanding the challenges facing child pedestrian trauma in Victoria
2000-2010. J. Aust. Coll. Road Safety, 23, 23-30.
OXLEY, J. & CORBEN, B. 2005. Pedestrian safety and vehicle speeds - Clayton Campus.
Melbourne: Monash University Accident Research Centre, Monash University.
OXLEY, J. & FILDES, B. Safety of Older Pedestrians. Transportation in an aging society: a
decade of experience, 7-9 November 1999 Bethesda, Maryland. 167-191.
49
OXLEY, J. & FILDES, B. Older pedestrian safety issues. Road Safety Issues for Older Road
Users, 26 November 2000 Brisbane, Australia. Centre for Accident Research and
Road Safety - Queensland, 81-88.
OXLEY, J., FILDES, B., IHSEN, E., CHARLTON, J. & DAY, R. 1997. Differences in traffic
judgements between young and old adult pedestrians. Accident Analysis and
Prevention, 29, 839-847.
OXLEY, J., LENNÉ, M. & CORBEN, B. 2006. The effect of alcohol impairment on road-
crossing behaviour. Transportation Research Part F: Traffic Psychology and
Behaviour, 9, 258-268.
OXLEY, J., YUEN, J., CORBEN, B., HOAREAU, E. & LOGAN, D. Reducing pedestrian
collisions in Melbourne's Central Business District. Australasian Road Safety
Research, Policing & Education Conference, 28-30 August 2013 Brisbane.
OXLEY, J. A., CHARLTON, J. L., KOPPEL, S. N., SCULLY, J. & FILDES, B. N. Crash
risk of older female drivers - Contributing factors. Annual Proceedings - Association
for the Advancement of Automotive Medicine, 2005a. 345-360.
OXLEY, J. A., IHSEN, E., FILDES, B. N., CHARLTON, J. L. & DAY, R. H. 2005b.
Crossing roads safely: An experimental study of age differences in gap selection by
pedestrians. Accident Analysis & Prevention, 37, 962-971.
PALAMARA, P. & BROUGHTON, M. 2013. An investigation of pedestrian crashes at
traffic intersections in the Perth Central Business District 2008-2012. Bentley,
Australia: C-MARC.
PECCHINI, D. & GIULIANI, F. 2015. Street-crossing behavior of people with disabilities.
Journal of Transportation Engineering, 141.
PEDEN, M., SCURFIELD, R. & SLEET, D. 2004. World Report on Road Traffic Injury
Prevention. Geneva: World Health Organisation.
PENG, R. Y. & BONGARD, F. S. 1999. Pedestrian versus motor vehicle accidents: an
analysis of 5,000 patients. Journal of the American College of Surgeons, 189, 343-
348.
POULOS, R. G., CHONG, S. S. S., OLIVIER, J. & JALALUDIN, B. 2012. Geospatial
analyses to prioritize public health interventions: A case study of pedestrian and pedal
cycle injuries in New South Wales, Australia. International Journal of Public Health,
57, 467-475.
PRATO, C. G., GITELMAN, V. & BEKHOR, S. 2012. Mapping patterns of pedestrian fatal
accidents in Israel. Accident Analysis & Prevention, 44, 56-62.
50
PREUSSER, D. F., WELLS, J. K., WILLIAMS, A. F. & WEINSTEIN, H. B. 2002.
Pedestrian crashes in Washington, DC and Baltimore. Accident Analysis &
Prevention, 34, 703-710.
PUCHER, J. & DIJKSTRA, L. 2003. Promoting Safe Walking and Cycling to Improve Public
Health: Lessons From The Netherlands and Germany. American Journal of Public
Health, 93, 1509-1516.
RETTING, R. A., FERGUSON, S. A. & MCCARTT, A. T. 2003. A Review of Evidence-
Based Traffic Engineering Measures Designed to Reduce Pedestrian–Motor Vehicle
Crashes. American Journal of Public Health, 93, 1456-1463.
ROAD SAFETY COMMISSION 2014. Pedestrians - fact sheet.
ROSÉN, E. & SANDER, U. 2009. Pedestrian fatality risk as a function of car impact speed.
Accident Analysis & Prevention, 41, 536-542.
ROSÉN, E., STIGSON, H. & SANDER, U. 2011. Literature review of pedestrian fatality risk
as a function of car impact speed. Accident Analysis & Prevention, 43, 25-33.
ROTHMAN, L., MACARTHUR, C., TO, T., BULIUNG, R. & HOWARD, A. 2014. Motor
vehicle-pedestrian collisions and walking to school: The role of the built environment.
Pediatrics, 133, 776-784.
SIRAM, S. M., SONAIKE, V., BOLORUNDURO, O. B., GREENE, W. R., GERALD, S. Z.,
CHANG, D. C., CORNWELL III, E. E. & OYETUNJI, T. A. 2011. Does the pattern
of injury in elderly pedestrian trauma mirror that of the younger pedestrian? Journal of
Surgical Research, 167, 14-18.
SPARROW, W. A., BRADSHAW, E. J., LAMOUREUX, E. & TIROSH, O. 2002. Ageing
effects on the attention demands of walking. Human movement science, 21, 961-972.
STEVENSON, M. 1997. Childhood pedestrian injuries: What can changes to the road
environment achieve? Australian and New Zealand Journal of Public Health, 21, 33-
37.
STEVENSON, M., JAMROZIK, K. & BURTON, P. 1996. A case-control study of childhood
pedestrian injuries in Perth, Western Australia. Journal of Epidemiology and
Community Health, 50, 280-287.
TAOKA, G. T. 1998. Asleep at the wheel: A review of research related to driver fatigue.
Transportation Quarterly, 52, 85-92.
TEFFT, B. C. 2013. Impact speed and a pedestrian's risk of severe injury or death. Accident
Analysis and Prevention, 50, 871-878.
51
TORBIC, D., HARWOOD, D., BOKENKROGER, C., SRINIVASAN, R., CARTER, D.,
ZEGEER, C. & LYON, C. 2010. Pedestrian Safety Prediction Methodology for Urban
Signalized Intersections. Transportation Research Record: Journal of the
Transportation Research Board, 2198, 65-74.
TRAPP, G. S. A., GILES-CORTI, B., CHRISTIAN, H. E., BULSARA, M., TIMPERIO, A.
F., MCCORMACK, G. R. & VILLANEUVA, K. P. 2011. On your bike! a cross-
sectional study of the individual, social and environmental correlates of cycling to
school. International Journal of Behavioral Nutrition and Physical Activity, 8.
TURK, R. F., MCBAY, A. J. & HUDSON, P. 1974. Drug involvement in automobile driver
and pedestrian fatalities. Journal of Forensic Sciences, 19, 90-97.
TYRRELL, R. A., WOOD, J. M., OWENS, D. A., WHETSEL BORZENDOWSKI, S. &
STAFFORD SEWALL, A. 2016. The conspicuity of pedestrians at night: a review.
Clinical and Experimental Optometry, 99, 425-434.
WILLIAMSON, A., LOMBARDI, D. A., FOLKARD, S., STUTTS, J., COURTNEY, T. K.
& CONNOR, J. L. 2011. The link between fatigue and safety. Accident Analysis &
Prevention, 43, 498-515.
WILSON, R. J. & FANG, M. 2000. Alcohol and drug impaired pedestrians killed or injured
in motor vehicle collisions. 15th International Conference on Alcohol, Drugs and
Traffic Safety. Stockholm.
WORLD HEALTH ORGANISATION 2013a. Global status report on road safety 2013:
supporting a decade of action. Geneva: World Health Organisation.
WORLD HEALTH ORGANISATION 2013b. Pedestrian safety: a road safety manual for
decision-makers and practitioners. Geneva, Switzerland.
YOSHIZAWA, A. & IWASAKI, H. Effects of nonvisual secondary tasks on driver's gazing
behavior for pedestrians. Proceedings of 2014 IEEE 13th International Conference on
Cognitive Informatics and Cognitive Computing, ICCI*CC 2014, 2014. 281-288.
YOUNG, K. L., MITSOPOULOS-RUBENS, E., RUDIN-BROWN, C. M. & LENNÉ, M. G.
2012. The effects of using a portable music player on simulated driving performance
and task-sharing strategies. Applied Ergonomics, 43, 738-746.
ZEGEER, C. V. & BUSHELL, M. 2012. Pedestrian crash trends and potential
countermeasures from around the world. Accident Analysis and Prevention, 44, 3-11.
ZEGEER, C. V., ESSE, C. T., STEWART, J. R., HUANG, H. F. & LAGERWEY, P. 2004.
Safety analysis of marked versus unmarked crosswalks in 30 cities. ITE Journal
(Institute of Transportation Engineers), 74, 34-41.

52
ŽIVKOVIĆ, V., LUKIĆ, V. & NIKOLIĆ, S. 2016. The influence of alcohol on pedestrians:
A different approach to the effectiveness of the new traffic safety law. Traffic Injury
Prevention, 1-5.

53
8 APPENDICES
8.1 Participant invitation letter, participant information statement and consent form
54
Name: Address: Address: Date:
Dear Mr/Mrs
Re. In-depth pedestrian collision study
We are a team of researchers and doctors from the Curtin-Monash Accident Research Centre at Curtin University, Royal Perth, Sir Charles Gairdner and Fiona Stanley Hospitals. We are conducting an important research study with the aim of finding effective ways to reduce trauma and would like to invite you to take part.
You have been identified as eligible to participate in this study because you were recently admitted to hospital following a collision as a pedestrian. Participation in the study involves a telephone interview about you, your health, your walking habits and details of your recent collision. If you are available and interested, we would most appreciate your participation. We have included a detailed Participant Information Sheet about the study with this letter and we will give you a follow up call next week. If you have any queries please contact the RPH research nurse Denice Wallis on 0418 650 700 or [email protected] or myself on 9266 4636 or [email protected]. This study has been approved by the Curtin University (approval number: HR141/2015) and Royal Perth Hospital (approval number: HR141/2015) Ethics Committees.
Thank you.
Yours sincerely,
Professor Lynn Meuleners
Curtin University
Professor Lynn Meuleners Curtin-Monash Accident Research Centre
Curtin University GPO Box U1987
Perth WA 6845

55
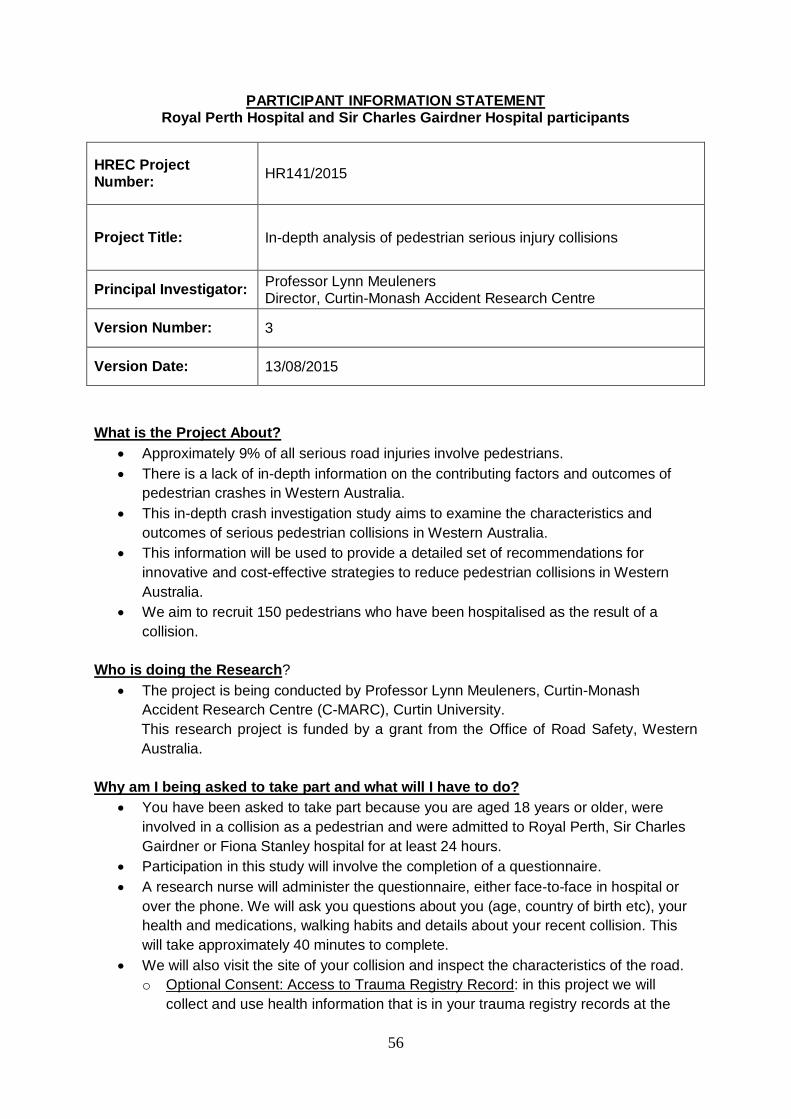
56
PARTICIPANT INFORMATION STATEMENT Royal Perth Hospital and Sir Charles Gairdner Hospital participants
HREC Project Number: HR141/2015
Project Title: In-depth analysis of pedestrian serious injury collisions
Principal Investigator: Professor Lynn Meuleners Director, Curtin-Monash Accident Research Centre
Version Number: 3
Version Date: 13/08/2015
What is the Project About?
• Approximately 9% of all serious road injuries involve pedestrians. • There is a lack of in-depth information on the contributing factors and outcomes of
pedestrian crashes in Western Australia. • This in-depth crash investigation study aims to examine the characteristics and
outcomes of serious pedestrian collisions in Western Australia. • This information will be used to provide a detailed set of recommendations for
innovative and cost-effective strategies to reduce pedestrian collisions in Western Australia.
• We aim to recruit 150 pedestrians who have been hospitalised as the result of a collision.
Who is doing the Research?
• The project is being conducted by Professor Lynn Meuleners, Curtin-Monash Accident Research Centre (C-MARC), Curtin University. This research project is funded by a grant from the Office of Road Safety, Western Australia.
Why am I being asked to take part and what will I have to do?
• You have been asked to take part because you are aged 18 years or older, were involved in a collision as a pedestrian and were admitted to Royal Perth, Sir Charles Gairdner or Fiona Stanley hospital for at least 24 hours.
• Participation in this study will involve the completion of a questionnaire. • A research nurse will administer the questionnaire, either face-to-face in hospital or
over the phone. We will ask you questions about you (age, country of birth etc), your health and medications, walking habits and details about your recent collision. This will take approximately 40 minutes to complete.
• We will also visit the site of your collision and inspect the characteristics of the road. o Optional Consent: Access to Trauma Registry Record: in this project we will
collect and use health information that is in your trauma registry records at the
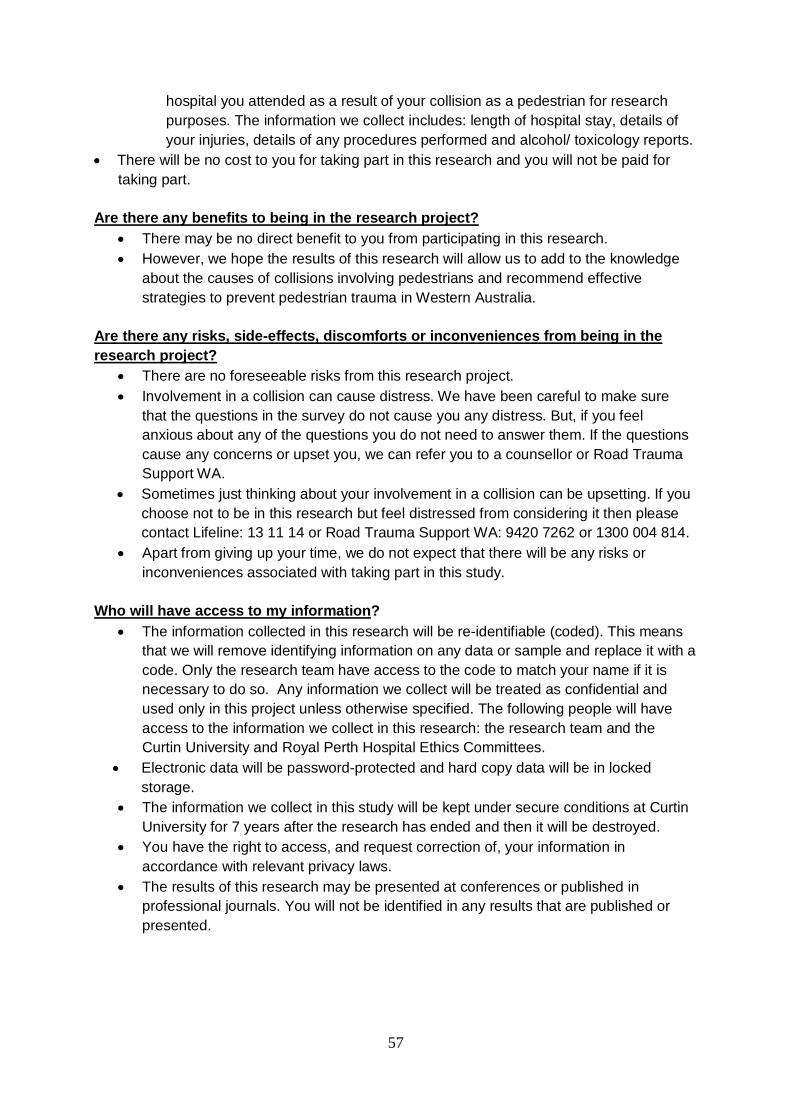
57
hospital you attended as a result of your collision as a pedestrian for research purposes. The information we collect includes: length of hospital stay, details of your injuries, details of any procedures performed and alcohol/ toxicology reports.
• There will be no cost to you for taking part in this research and you will not be paid for taking part.
Are there any benefits to being in the research project?
• There may be no direct benefit to you from participating in this research. • However, we hope the results of this research will allow us to add to the knowledge
about the causes of collisions involving pedestrians and recommend effective strategies to prevent pedestrian trauma in Western Australia.
Are there any risks, side-effects, discomforts or inconveniences from being in the research project?
• There are no foreseeable risks from this research project. • Involvement in a collision can cause distress. We have been careful to make sure
that the questions in the survey do not cause you any distress. But, if you feel anxious about any of the questions you do not need to answer them. If the questions cause any concerns or upset you, we can refer you to a counsellor or Road Trauma Support WA.
• Sometimes just thinking about your involvement in a collision can be upsetting. If you choose not to be in this research but feel distressed from considering it then please contact Lifeline: 13 11 14 or Road Trauma Support WA: 9420 7262 or 1300 004 814.
• Apart from giving up your time, we do not expect that there will be any risks or inconveniences associated with taking part in this study.
Who will have access to my information?
• The information collected in this research will be re-identifiable (coded). This means that we will remove identifying information on any data or sample and replace it with a code. Only the research team have access to the code to match your name if it is necessary to do so. Any information we collect will be treated as confidential and used only in this project unless otherwise specified. The following people will have access to the information we collect in this research: the research team and the Curtin University and Royal Perth Hospital Ethics Committees.
• Electronic data will be password-protected and hard copy data will be in locked storage.
• The information we collect in this study will be kept under secure conditions at Curtin University for 7 years after the research has ended and then it will be destroyed.
• You have the right to access, and request correction of, your information in accordance with relevant privacy laws.
• The results of this research may be presented at conferences or published in professional journals. You will not be identified in any results that are published or presented.

58
Will you tell me the results of the research? • We will write to you at the end of the research (in about 18 months) and let you know
the results of the research. Results will not be individual but based on all the information we collect and review as part of the research.
Do I have to take part in the research project?
• Taking part in a research project is voluntary. It is your choice to take part or not. You do not have to agree if you do not want to. If you decide to take part and then change your mind, that is okay, you can withdraw from the project. You do not have to give us a reason; just tell us that you want to stop. Please let us know you want to stop so we can make sure you are aware of any thing that needs to be done so you can withdraw safely. If you chose not to take part or start and then stop the study, it will not affect your relationship with the University, hospital, staff or colleagues. If you chose to leave the study we will use any information collected unless you tell us not to.
What happens next and who can I contact about the research?
• If you would like further information or to ask questions about the project, please contact Professor Lynn Meuleners Ph: (08) 9266 4636 Email: [email protected]
• If you decide to take part in this research we will ask you to sign the consent form. By signing it is telling us that you understand what you have read and what has been discussed. Signing the consent indicates that you agree to be in the research project and have your health information used as described. Please take your time and ask any questions you have before you decide what to do. You will be given a copy of this information and the consent form to keep.
All research in Australia involving humans is reviewed by an independent group of people called a Human Research Ethics Committee (HREC). The ethical aspects of this research project have been approved by the Curtin University and Royal Perth Hospital HRECs. This project will be carried out according to the National Statement on Ethical Conduct in Human Research (2007). Curtin University Human Research Ethics Committee (HREC) has approved this study (HREC number HR141/2015). Should you wish to discuss the study with someone not directly involved, in particular, any matters concerning the conduct of the study or your rights as a participant, or you wish to make a confidential complaint, you may contact the Ethics Officer on (08) 9266 9223 or the Manager, Research Integrity on (08) 9266 7093 or email [email protected] This study has also been approved by the Royal Perth Hospital Human Research Ethics Committee (Approval number REG 15-078) which can be contacted on (08) 6151 1180 or [email protected]
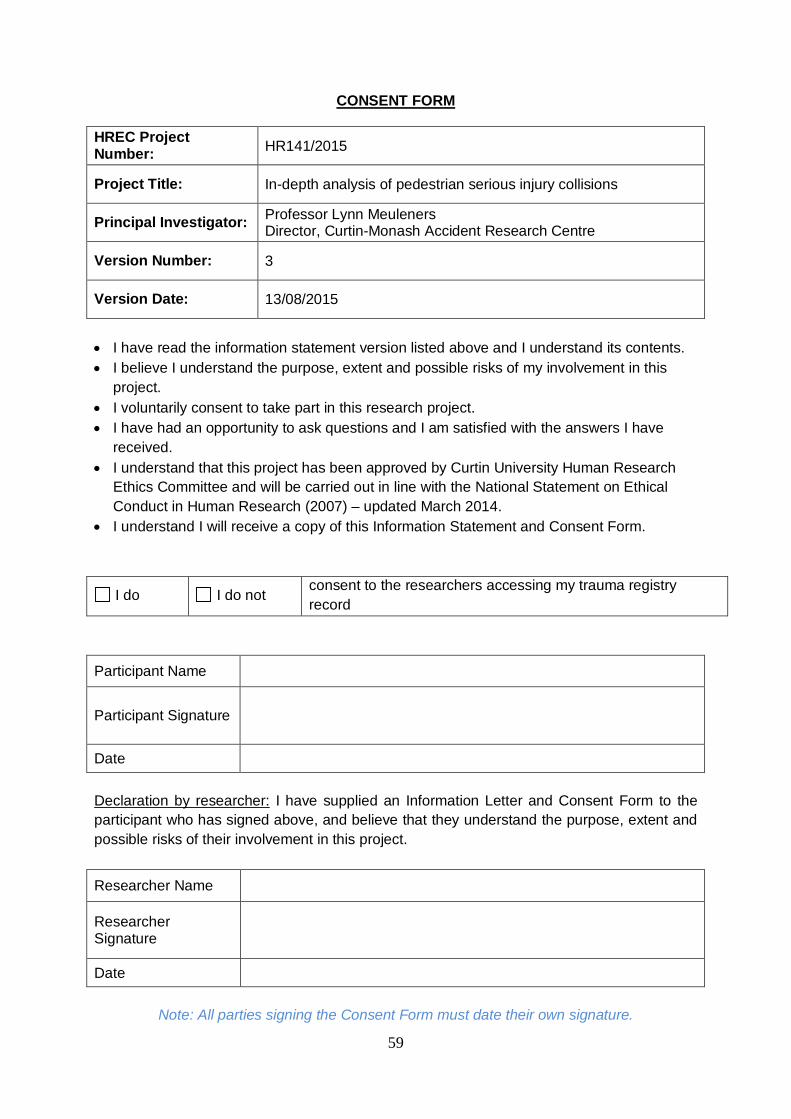
59
CONSENT FORM HREC Project Number: HR141/2015
Project Title: In-depth analysis of pedestrian serious injury collisions
Principal Investigator: Professor Lynn Meuleners Director, Curtin-Monash Accident Research Centre
Version Number: 3
Version Date: 13/08/2015
• I have read the information statement version listed above and I understand its contents. • I believe I understand the purpose, extent and possible risks of my involvement in this
project. • I voluntarily consent to take part in this research project. • I have had an opportunity to ask questions and I am satisfied with the answers I have
received. • I understand that this project has been approved by Curtin University Human Research
Ethics Committee and will be carried out in line with the National Statement on Ethical Conduct in Human Research (2007) – updated March 2014.
• I understand I will receive a copy of this Information Statement and Consent Form.
I do I do not consent to the researchers accessing my trauma registry record
Participant Name
Participant Signature
Date
Declaration by researcher: I have supplied an Information Letter and Consent Form to the participant who has signed above, and believe that they understand the purpose, extent and possible risks of their involvement in this project.
Researcher Name
Researcher Signature
Date
Note: All parties signing the Consent Form must date their own signature.
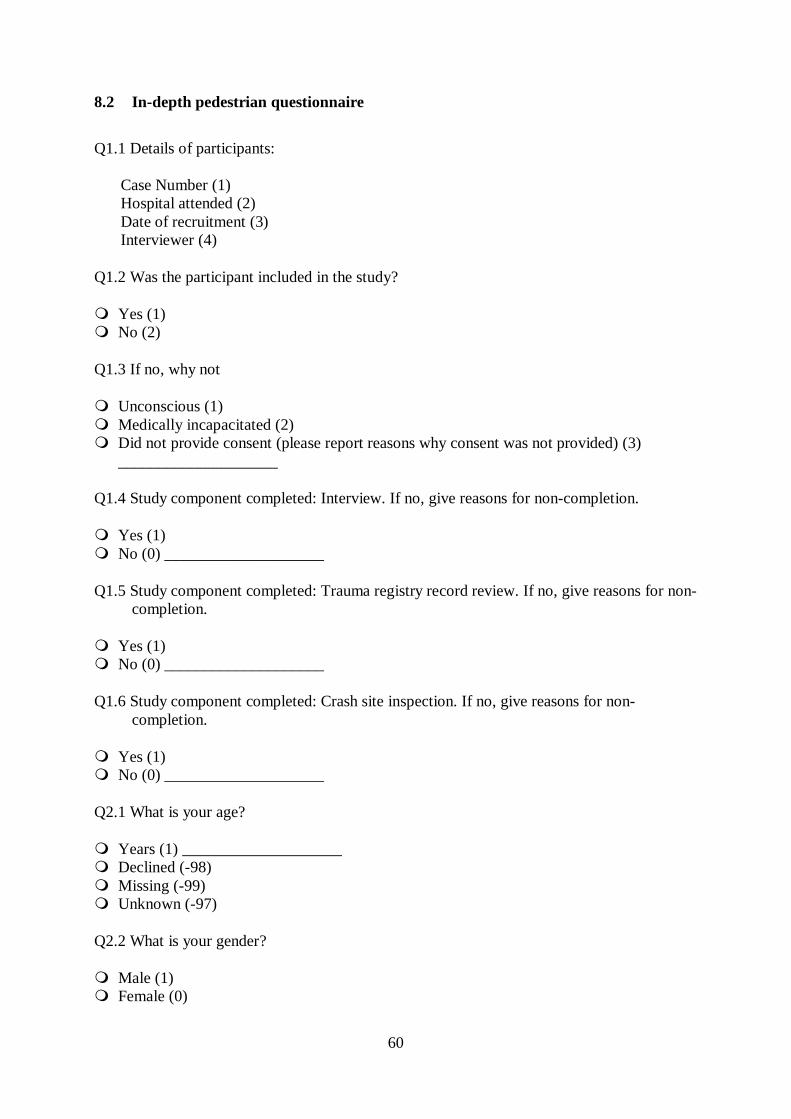
60
8.2 In-depth pedestrian questionnaire
Q1.1 Details of participants:
Case Number (1) Hospital attended (2) Date of recruitment (3) Interviewer (4)
Q1.2 Was the participant included in the study?
Yes (1) No (2)
Q1.3 If no, why not
Unconscious (1) Medically incapacitated (2) Did not provide consent (please report reasons why consent was not provided) (3)
____________________
Q1.4 Study component completed: Interview. If no, give reasons for non-completion.
Yes (1) No (0) ____________________
Q1.5 Study component completed: Trauma registry record review. If no, give reasons for non-completion.
Yes (1) No (0) ____________________
Q1.6 Study component completed: Crash site inspection. If no, give reasons for non-completion.
Yes (1) No (0) ____________________
Q2.1 What is your age?
Years (1) ____________________ Declined (-98) Missing (-99) Unknown (-97)
Q2.2 What is your gender?
Male (1) Female (0)
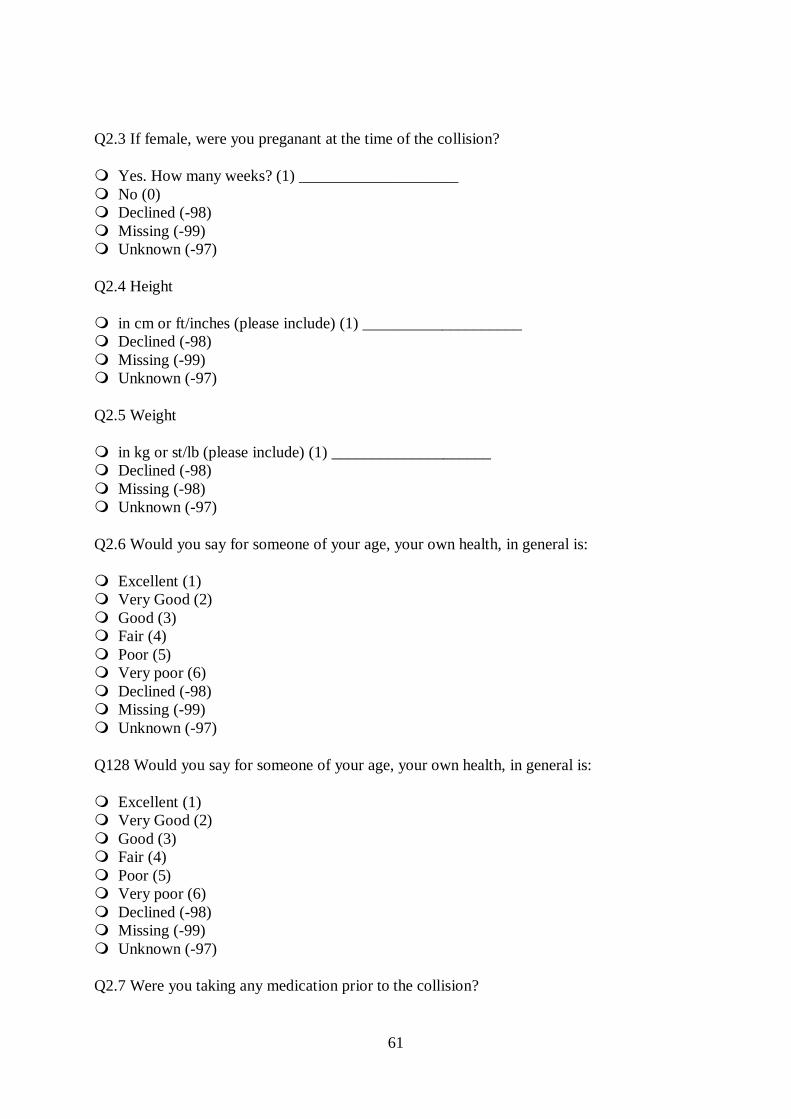
61
Q2.3 If female, were you preganant at the time of the collision?
Yes. How many weeks? (1) ____________________ No (0) Declined (-98) Missing (-99) Unknown (-97)
Q2.4 Height
in cm or ft/inches (please include) (1) ____________________ Declined (-98) Missing (-99) Unknown (-97)
Q2.5 Weight
in kg or st/lb (please include) (1) ____________________ Declined (-98) Missing (-98) Unknown (-97)
Q2.6 Would you say for someone of your age, your own health, in general is:
Excellent (1) Very Good (2) Good (3) Fair (4) Poor (5) Very poor (6) Declined (-98) Missing (-99) Unknown (-97)
Q128 Would you say for someone of your age, your own health, in general is:
Excellent (1) Very Good (2) Good (3) Fair (4) Poor (5) Very poor (6) Declined (-98) Missing (-99) Unknown (-97)
Q2.7 Were you taking any medication prior to the collision?
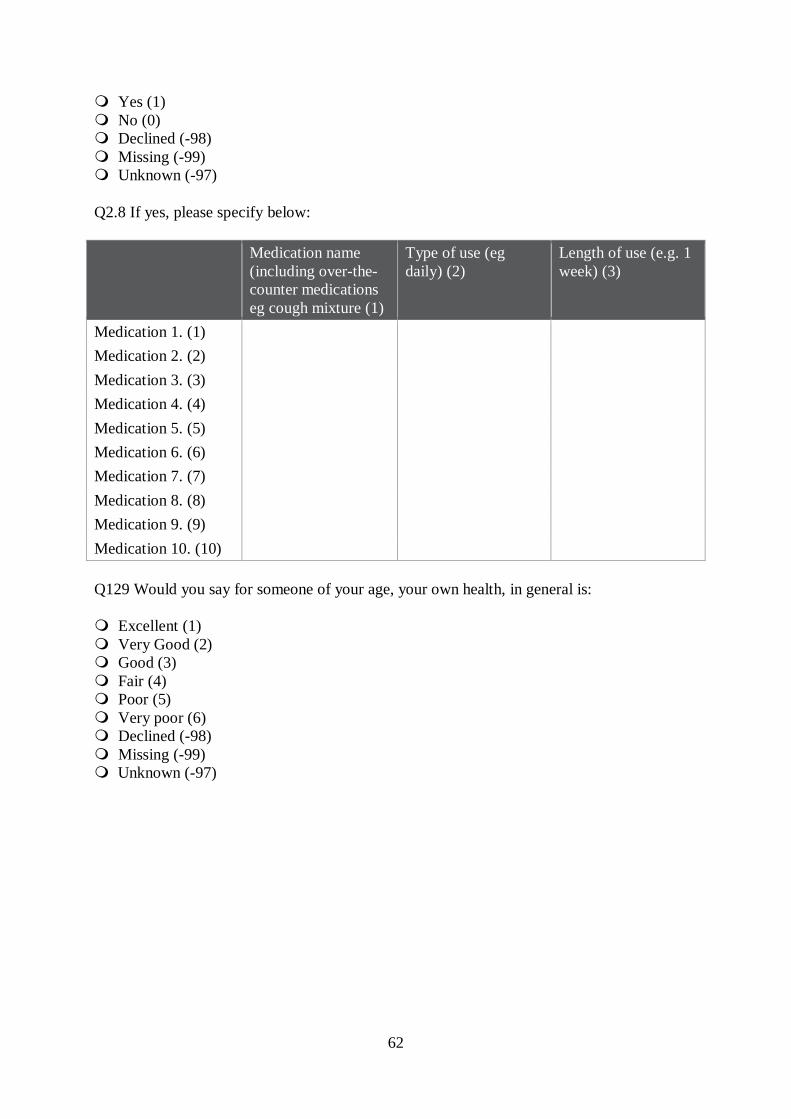
62
Yes (1) No (0) Declined (-98) Missing (-99) Unknown (-97)
Q2.8 If yes, please specify below:
Medication name (including over-the-counter medications eg cough mixture (1)
Type of use (eg daily) (2)
Length of use (e.g. 1 week) (3)
Medication 1. (1) Medication 2. (2) Medication 3. (3) Medication 4. (4) Medication 5. (5) Medication 6. (6) Medication 7. (7) Medication 8. (8) Medication 9. (9) Medication 10. (10)
Q129 Would you say for someone of your age, your own health, in general is:
Excellent (1) Very Good (2) Good (3) Fair (4) Poor (5) Very poor (6) Declined (-98) Missing (-99) Unknown (-97)
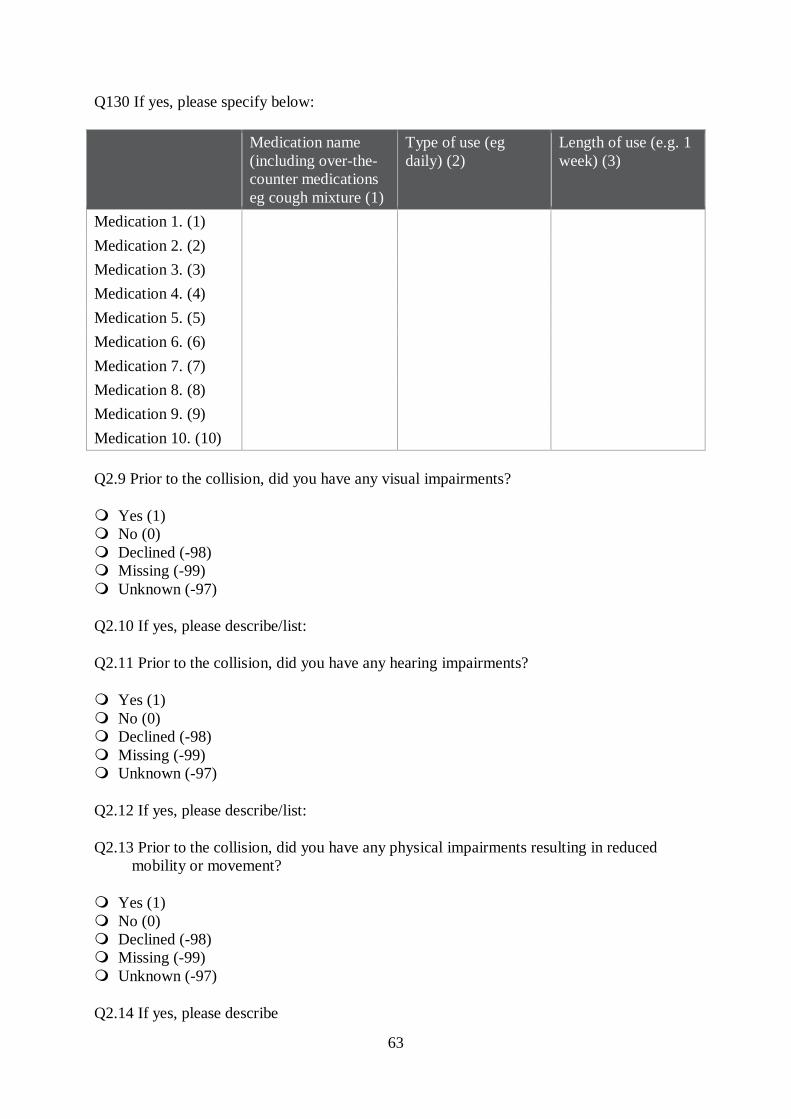
63
Q130 If yes, please specify below:
Medication name (including over-the-counter medications eg cough mixture (1)
Type of use (eg daily) (2)
Length of use (e.g. 1 week) (3)
Medication 1. (1) Medication 2. (2) Medication 3. (3) Medication 4. (4) Medication 5. (5) Medication 6. (6) Medication 7. (7) Medication 8. (8) Medication 9. (9) Medication 10. (10)
Q2.9 Prior to the collision, did you have any visual impairments?
Yes (1) No (0) Declined (-98) Missing (-99) Unknown (-97)
Q2.10 If yes, please describe/list:
Q2.11 Prior to the collision, did you have any hearing impairments?
Yes (1) No (0) Declined (-98) Missing (-99) Unknown (-97)
Q2.12 If yes, please describe/list:
Q2.13 Prior to the collision, did you have any physical impairments resulting in reduced mobility or movement?
Yes (1) No (0) Declined (-98) Missing (-99) Unknown (-97)
Q2.14 If yes, please describe
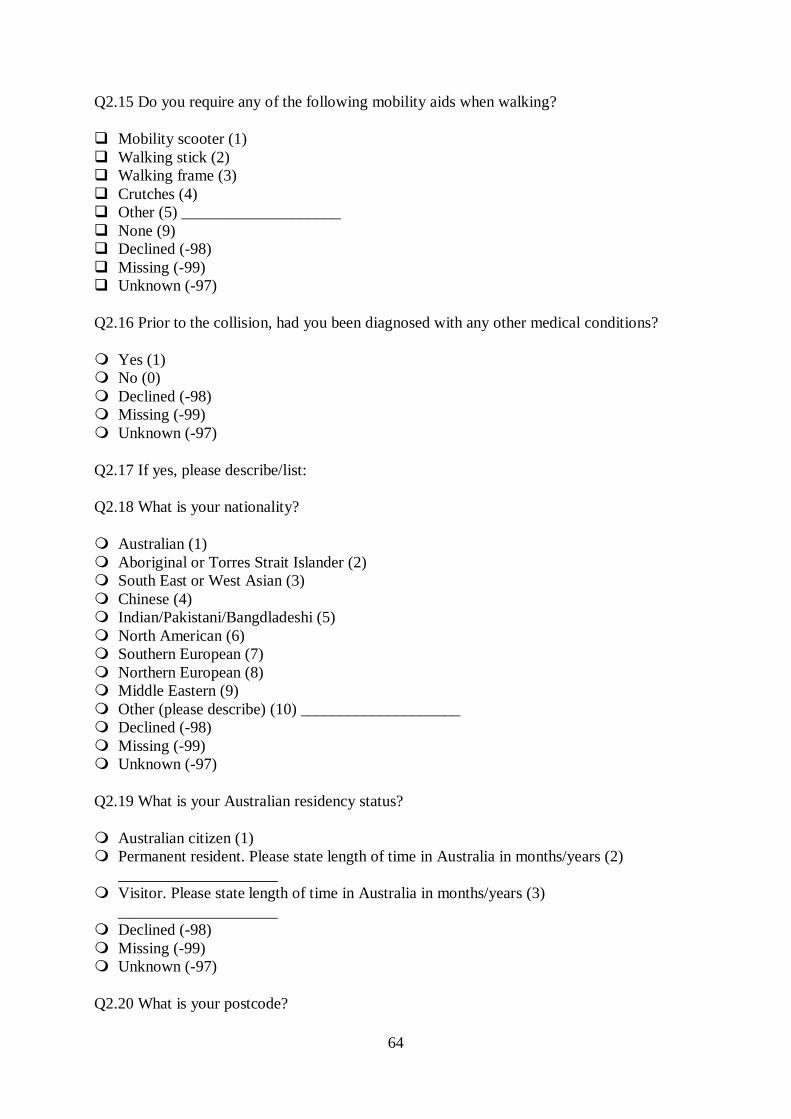
64
Q2.15 Do you require any of the following mobility aids when walking?
Mobility scooter (1) Walking stick (2) Walking frame (3) Crutches (4) Other (5) ____________________ None (9) Declined (-98) Missing (-99) Unknown (-97)
Q2.16 Prior to the collision, had you been diagnosed with any other medical conditions?
Yes (1) No (0) Declined (-98) Missing (-99) Unknown (-97)
Q2.17 If yes, please describe/list:
Q2.18 What is your nationality?
Australian (1) Aboriginal or Torres Strait Islander (2) South East or West Asian (3) Chinese (4) Indian/Pakistani/Bangdladeshi (5) North American (6) Southern European (7) Northern European (8) Middle Eastern (9) Other (please describe) (10) ____________________ Declined (-98) Missing (-99) Unknown (-97)
Q2.19 What is your Australian residency status?
Australian citizen (1) Permanent resident. Please state length of time in Australia in months/years (2)
____________________ Visitor. Please state length of time in Australia in months/years (3)
____________________ Declined (-98) Missing (-99) Unknown (-97)
Q2.20 What is your postcode?
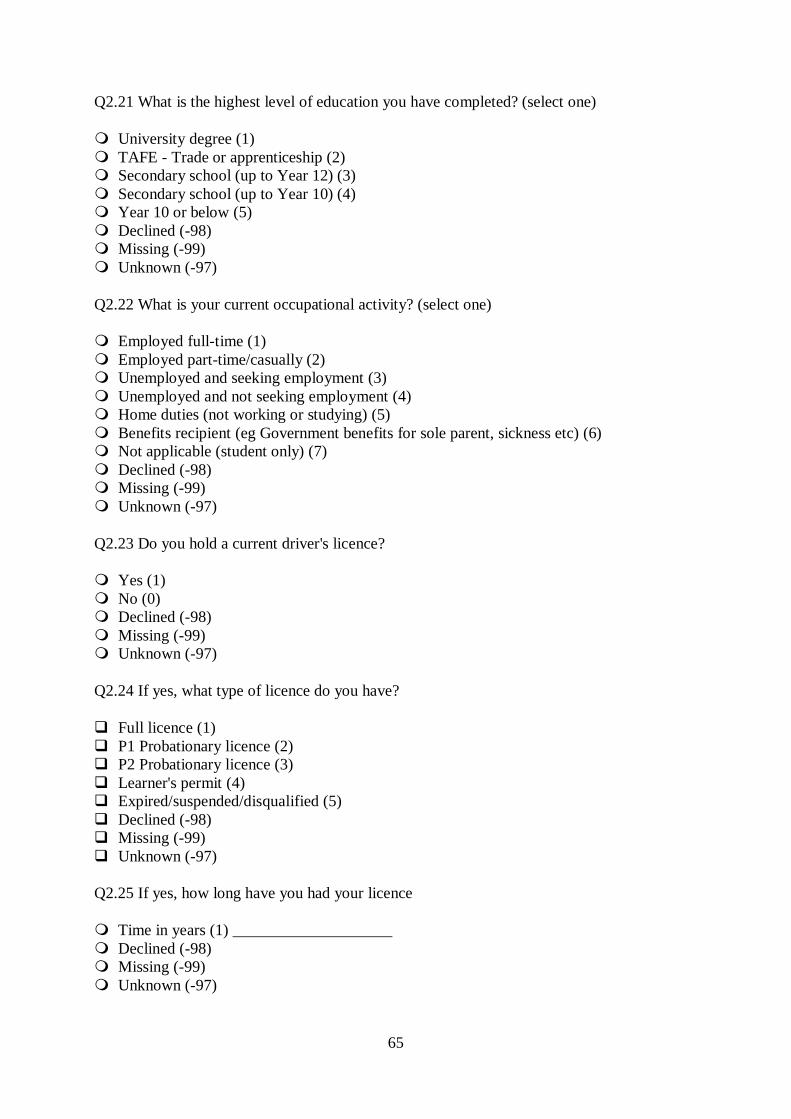
65
Q2.21 What is the highest level of education you have completed? (select one)
University degree (1) TAFE - Trade or apprenticeship (2) Secondary school (up to Year 12) (3) Secondary school (up to Year 10) (4) Year 10 or below (5) Declined (-98) Missing (-99) Unknown (-97)
Q2.22 What is your current occupational activity? (select one)
Employed full-time (1) Employed part-time/casually (2) Unemployed and seeking employment (3) Unemployed and not seeking employment (4) Home duties (not working or studying) (5) Benefits recipient (eg Government benefits for sole parent, sickness etc) (6) Not applicable (student only) (7) Declined (-98) Missing (-99) Unknown (-97)
Q2.23 Do you hold a current driver's licence?
Yes (1) No (0) Declined (-98) Missing (-99) Unknown (-97)
Q2.24 If yes, what type of licence do you have?
Full licence (1) P1 Probationary licence (2) P2 Probationary licence (3) Learner's permit (4) Expired/suspended/disqualified (5) Declined (-98) Missing (-99) Unknown (-97)
Q2.25 If yes, how long have you had your licence
Time in years (1) ____________________ Declined (-98) Missing (-99) Unknown (-97)
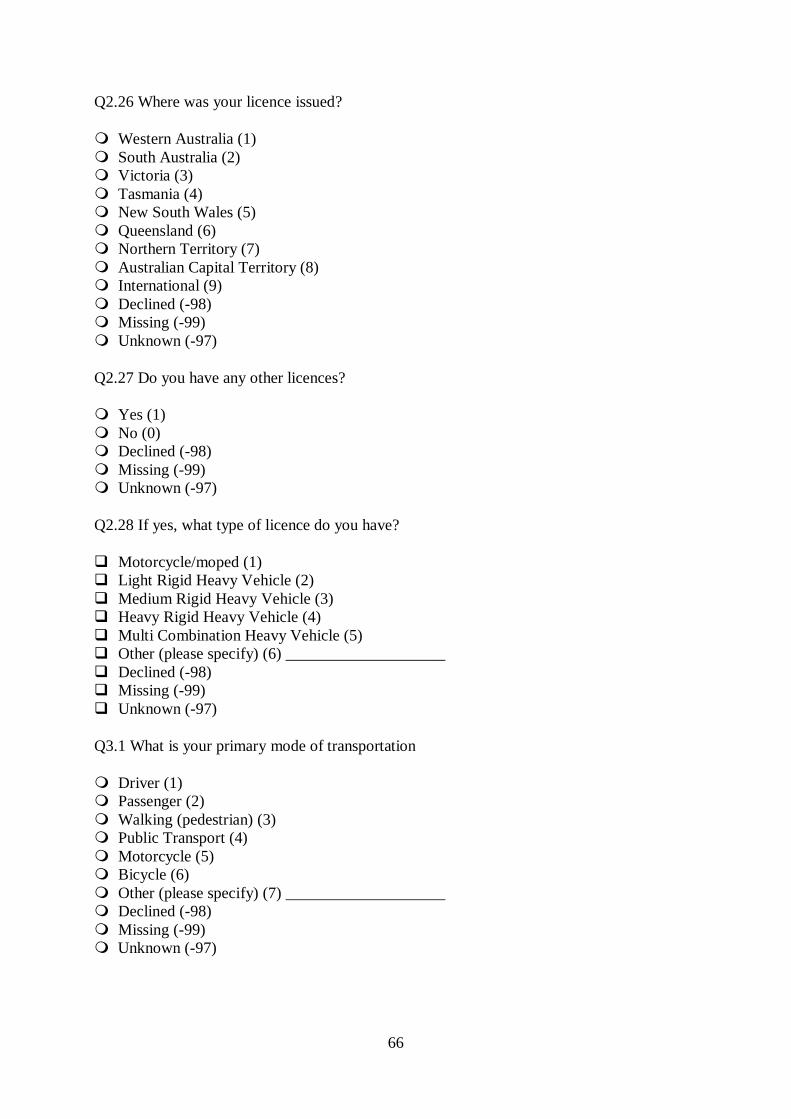
66
Q2.26 Where was your licence issued?
Western Australia (1) South Australia (2) Victoria (3) Tasmania (4) New South Wales (5) Queensland (6) Northern Territory (7) Australian Capital Territory (8) International (9) Declined (-98) Missing (-99) Unknown (-97)
Q2.27 Do you have any other licences?
Yes (1) No (0) Declined (-98) Missing (-99) Unknown (-97)
Q2.28 If yes, what type of licence do you have?
Motorcycle/moped (1) Light Rigid Heavy Vehicle (2) Medium Rigid Heavy Vehicle (3) Heavy Rigid Heavy Vehicle (4) Multi Combination Heavy Vehicle (5) Other (please specify) (6) ____________________ Declined (-98) Missing (-99) Unknown (-97)
Q3.1 What is your primary mode of transportation
Driver (1) Passenger (2) Walking (pedestrian) (3) Public Transport (4) Motorcycle (5) Bicycle (6) Other (please specify) (7) ____________________ Declined (-98) Missing (-99) Unknown (-97)
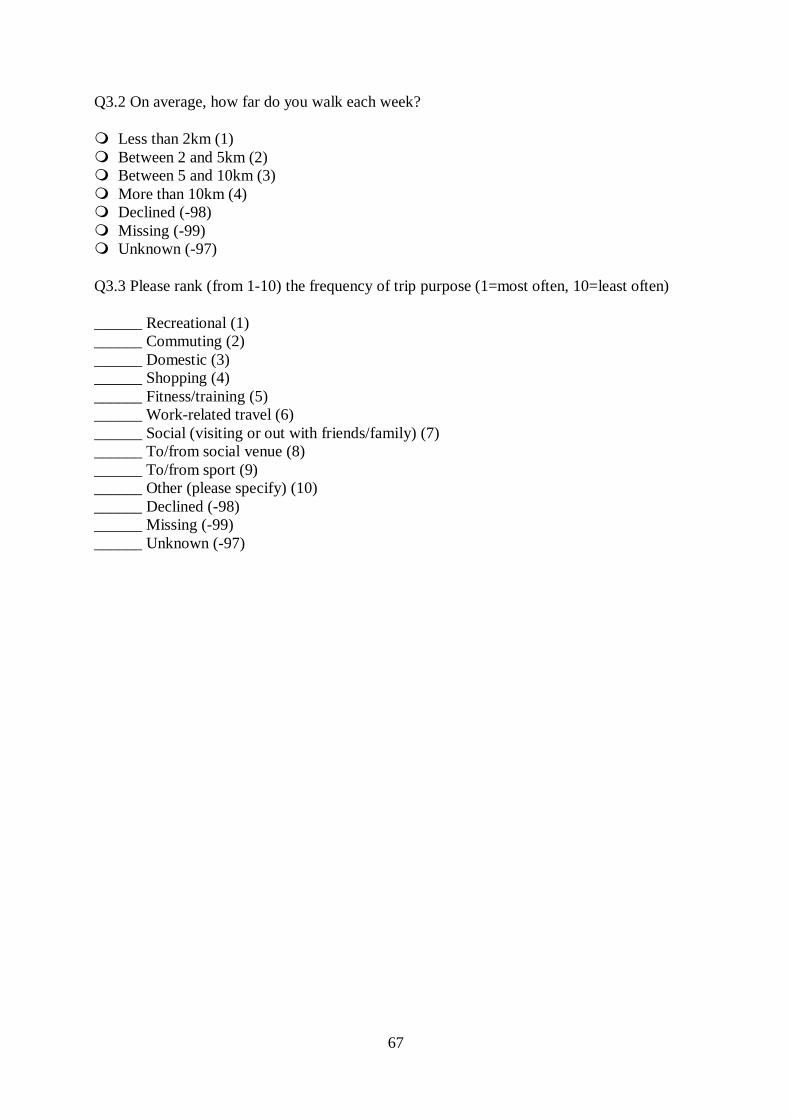
67
Q3.2 On average, how far do you walk each week?
Less than 2km (1) Between 2 and 5km (2) Between 5 and 10km (3) More than 10km (4) Declined (-98) Missing (-99) Unknown (-97)
Q3.3 Please rank (from 1-10) the frequency of trip purpose (1=most often, 10=least often)
______ Recreational (1) ______ Commuting (2) ______ Domestic (3) ______ Shopping (4) ______ Fitness/training (5) ______ Work-related travel (6) ______ Social (visiting or out with friends/family) (7) ______ To/from social venue (8) ______ To/from sport (9) ______ Other (please specify) (10) ______ Declined (-98) ______ Missing (-99) ______ Unknown (-97)
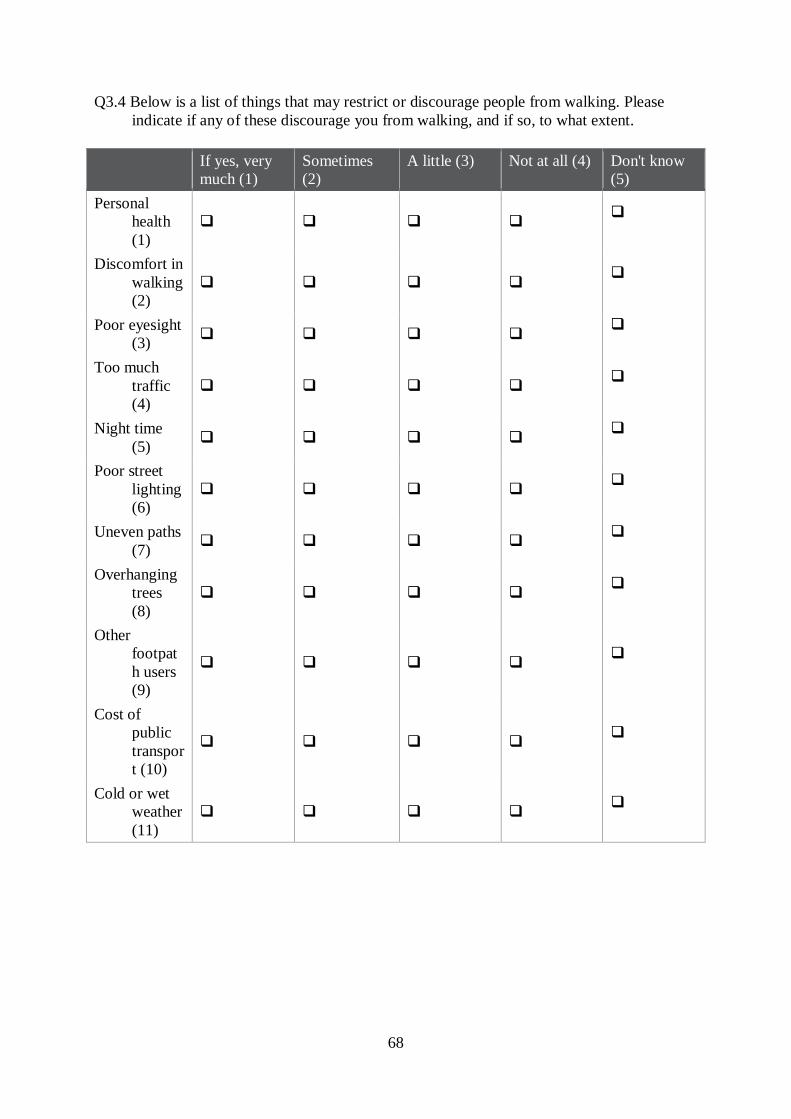
68
Q3.4 Below is a list of things that may restrict or discourage people from walking. Please indicate if any of these discourage you from walking, and if so, to what extent.
If yes, very much (1)
Sometimes (2)
A little (3) Not at all (4) Don't know (5)
Personal health (1)
Discomfort in walking (2)
Poor eyesight (3)
Too much traffic (4)
Night time (5)
Poor street lighting (6)
Uneven paths (7)
Overhanging trees (8)
Other footpath users (9)
Cost of public transport (10)
Cold or wet weather (11)
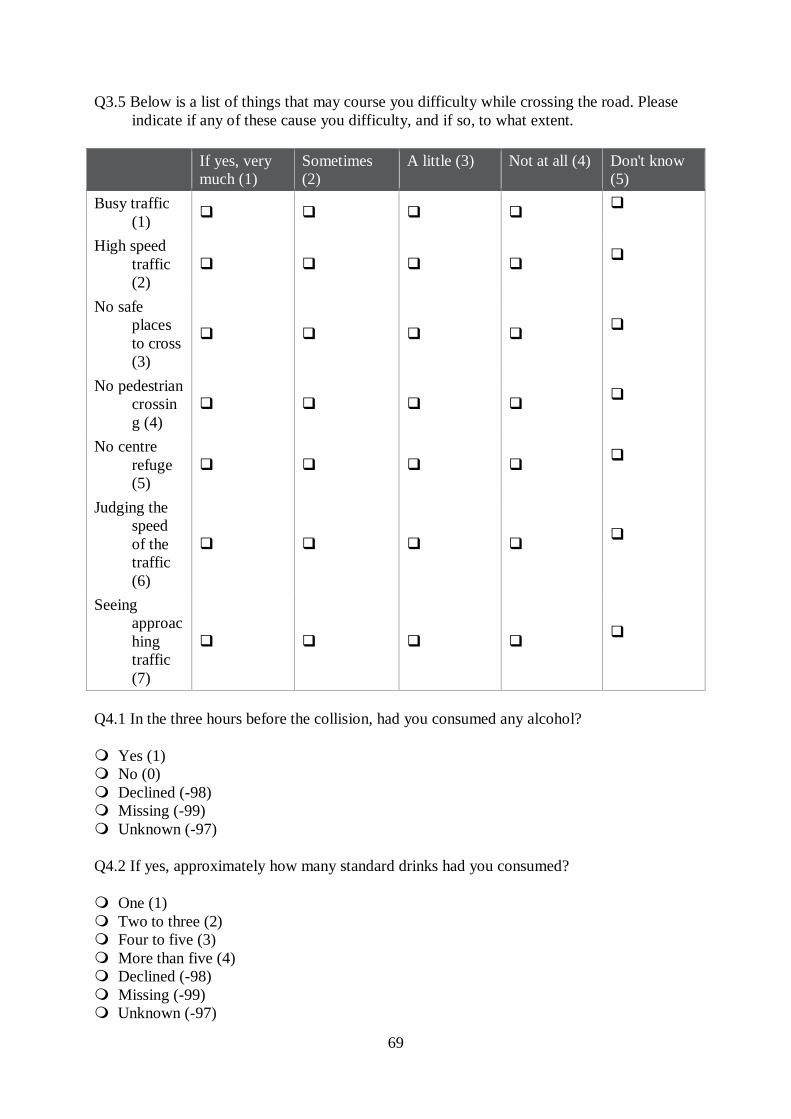
69
Q3.5 Below is a list of things that may course you difficulty while crossing the road. Please indicate if any of these cause you difficulty, and if so, to what extent.
If yes, very much (1)
Sometimes (2)
A little (3) Not at all (4) Don't know (5)
Busy traffic (1)
High speed traffic (2)
No safe places to cross (3)
No pedestrian crossing (4)
No centre refuge (5)
Judging the speed of the traffic (6)
Seeing approaching traffic (7)
Q4.1 In the three hours before the collision, had you consumed any alcohol?
Yes (1) No (0) Declined (-98) Missing (-99) Unknown (-97)
Q4.2 If yes, approximately how many standard drinks had you consumed?
One (1) Two to three (2) Four to five (3) More than five (4) Declined (-98) Missing (-99) Unknown (-97)
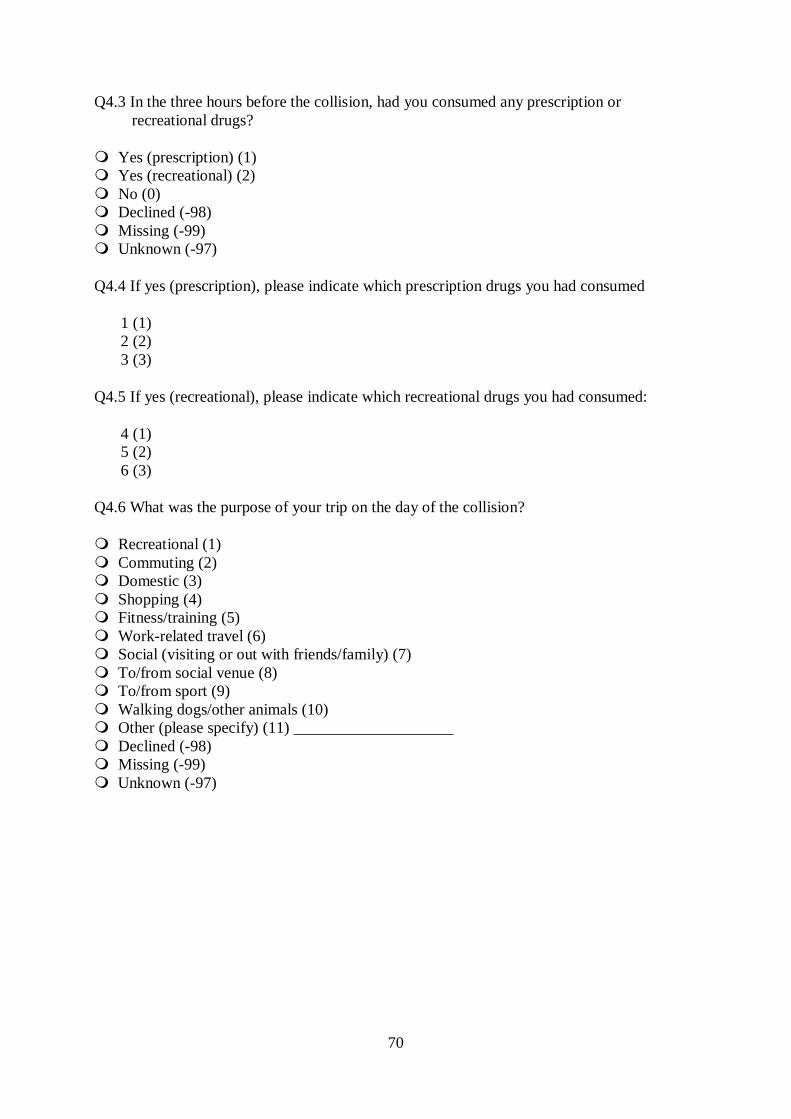
70
Q4.3 In the three hours before the collision, had you consumed any prescription or recreational drugs?
Yes (prescription) (1) Yes (recreational) (2) No (0) Declined (-98) Missing (-99) Unknown (-97)
Q4.4 If yes (prescription), please indicate which prescription drugs you had consumed
1 (1) 2 (2) 3 (3)
Q4.5 If yes (recreational), please indicate which recreational drugs you had consumed:
4 (1) 5 (2) 6 (3)
Q4.6 What was the purpose of your trip on the day of the collision?
Recreational (1) Commuting (2) Domestic (3) Shopping (4) Fitness/training (5) Work-related travel (6) Social (visiting or out with friends/family) (7) To/from social venue (8) To/from sport (9) Walking dogs/other animals (10) Other (please specify) (11) ____________________ Declined (-98) Missing (-99) Unknown (-97)
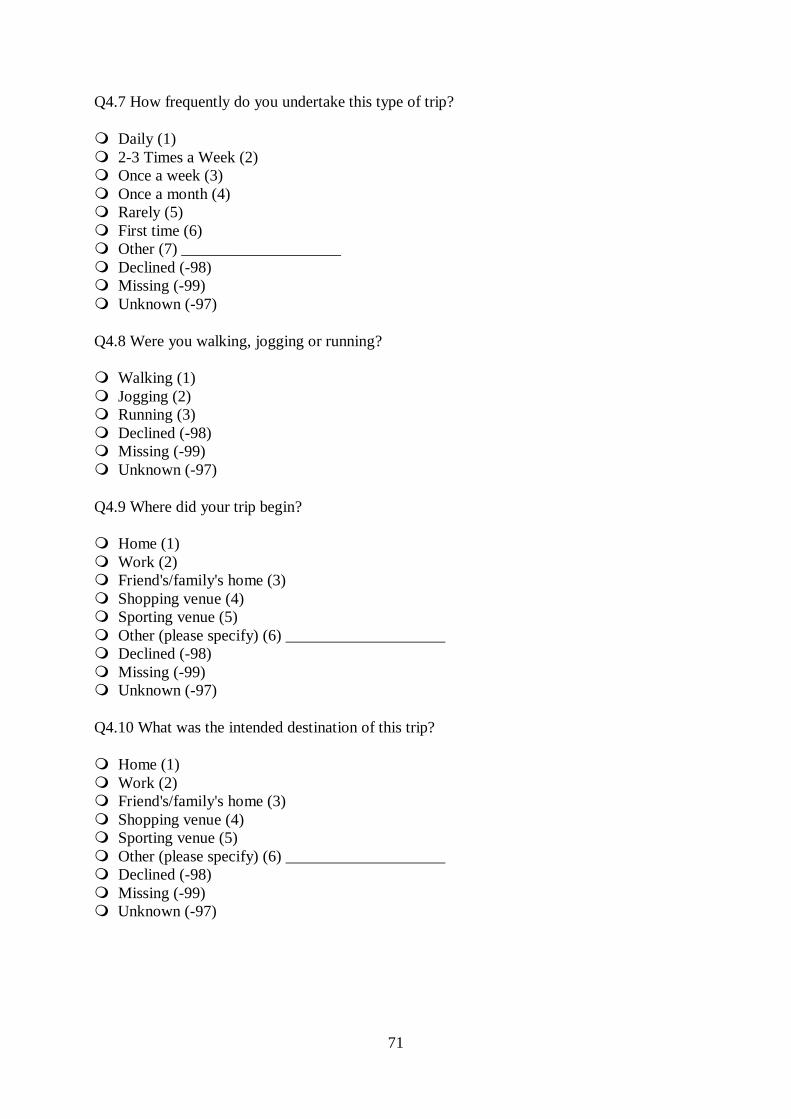
71
Q4.7 How frequently do you undertake this type of trip?
Daily (1) 2-3 Times a Week (2) Once a week (3) Once a month (4) Rarely (5) First time (6) Other (7) ____________________ Declined (-98) Missing (-99) Unknown (-97)
Q4.8 Were you walking, jogging or running?
Walking (1) Jogging (2) Running (3) Declined (-98) Missing (-99) Unknown (-97)
Q4.9 Where did your trip begin?
Home (1) Work (2) Friend's/family's home (3) Shopping venue (4) Sporting venue (5) Other (please specify) (6) ____________________ Declined (-98) Missing (-99) Unknown (-97)
Q4.10 What was the intended destination of this trip?
Home (1) Work (2) Friend's/family's home (3) Shopping venue (4) Sporting venue (5) Other (please specify) (6) ____________________ Declined (-98) Missing (-99) Unknown (-97)
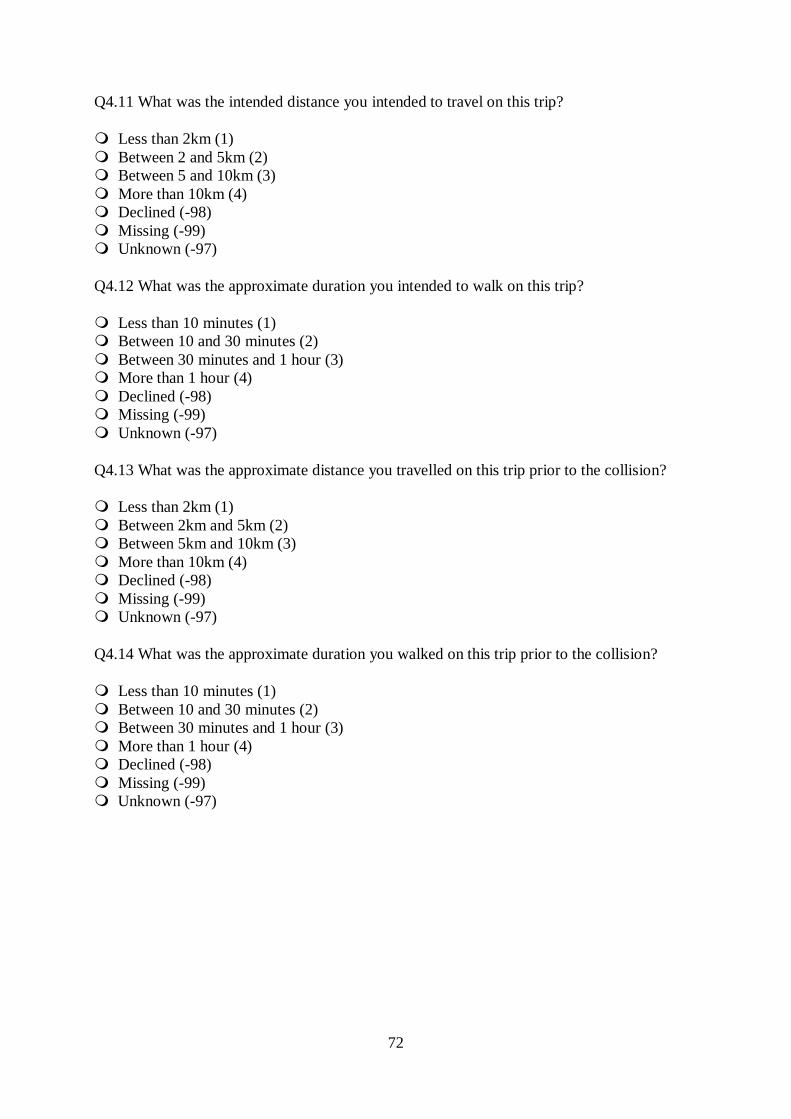
72
Q4.11 What was the intended distance you intended to travel on this trip?
Less than 2km (1) Between 2 and 5km (2) Between 5 and 10km (3) More than 10km (4) Declined (-98) Missing (-99) Unknown (-97)
Q4.12 What was the approximate duration you intended to walk on this trip?
Less than 10 minutes (1) Between 10 and 30 minutes (2) Between 30 minutes and 1 hour (3) More than 1 hour (4) Declined (-98) Missing (-99) Unknown (-97)
Q4.13 What was the approximate distance you travelled on this trip prior to the collision?
Less than 2km (1) Between 2km and 5km (2) Between 5km and 10km (3) More than 10km (4) Declined (-98) Missing (-99) Unknown (-97)
Q4.14 What was the approximate duration you walked on this trip prior to the collision?
Less than 10 minutes (1) Between 10 and 30 minutes (2) Between 30 minutes and 1 hour (3) More than 1 hour (4) Declined (-98) Missing (-99) Unknown (-97)
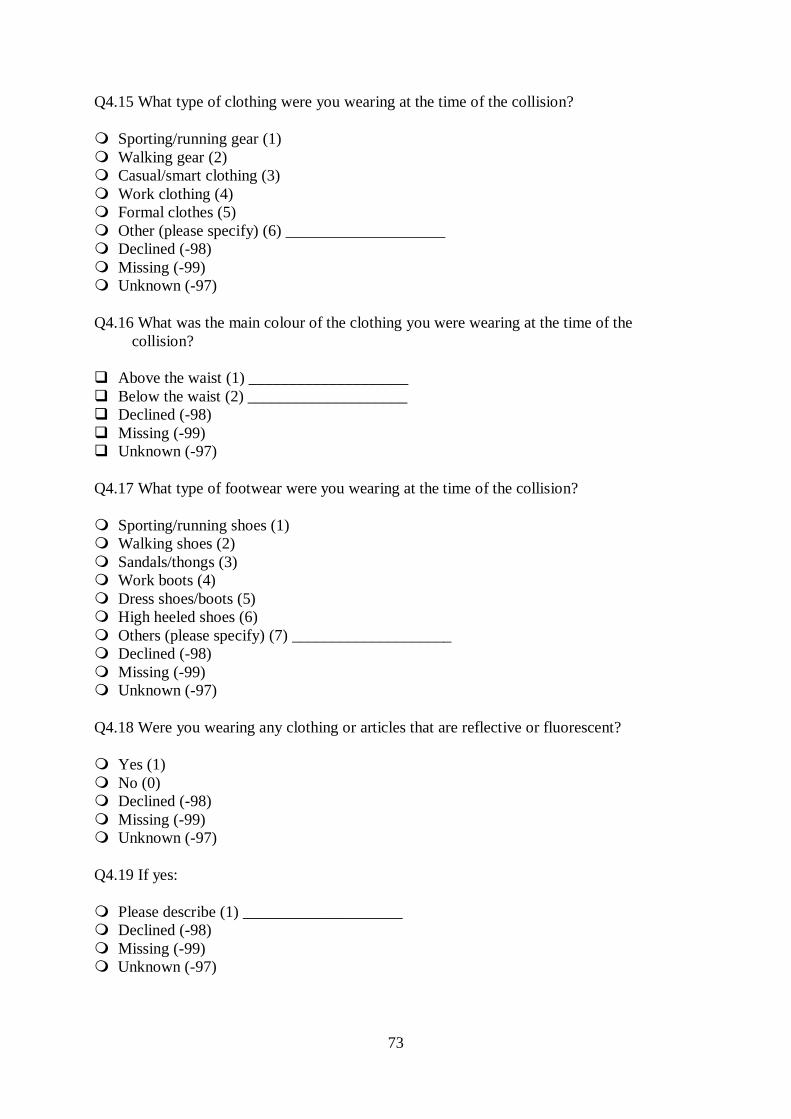
73
Q4.15 What type of clothing were you wearing at the time of the collision?
Sporting/running gear (1) Walking gear (2) Casual/smart clothing (3) Work clothing (4) Formal clothes (5) Other (please specify) (6) ____________________ Declined (-98) Missing (-99) Unknown (-97)
Q4.16 What was the main colour of the clothing you were wearing at the time of the collision?
Above the waist (1) ____________________ Below the waist (2) ____________________ Declined (-98) Missing (-99) Unknown (-97)
Q4.17 What type of footwear were you wearing at the time of the collision?
Sporting/running shoes (1) Walking shoes (2) Sandals/thongs (3) Work boots (4) Dress shoes/boots (5) High heeled shoes (6) Others (please specify) (7) ____________________ Declined (-98) Missing (-99) Unknown (-97)
Q4.18 Were you wearing any clothing or articles that are reflective or fluorescent?
Yes (1) No (0) Declined (-98) Missing (-99) Unknown (-97)
Q4.19 If yes:
Please describe (1) ____________________ Declined (-98) Missing (-99) Unknown (-97)
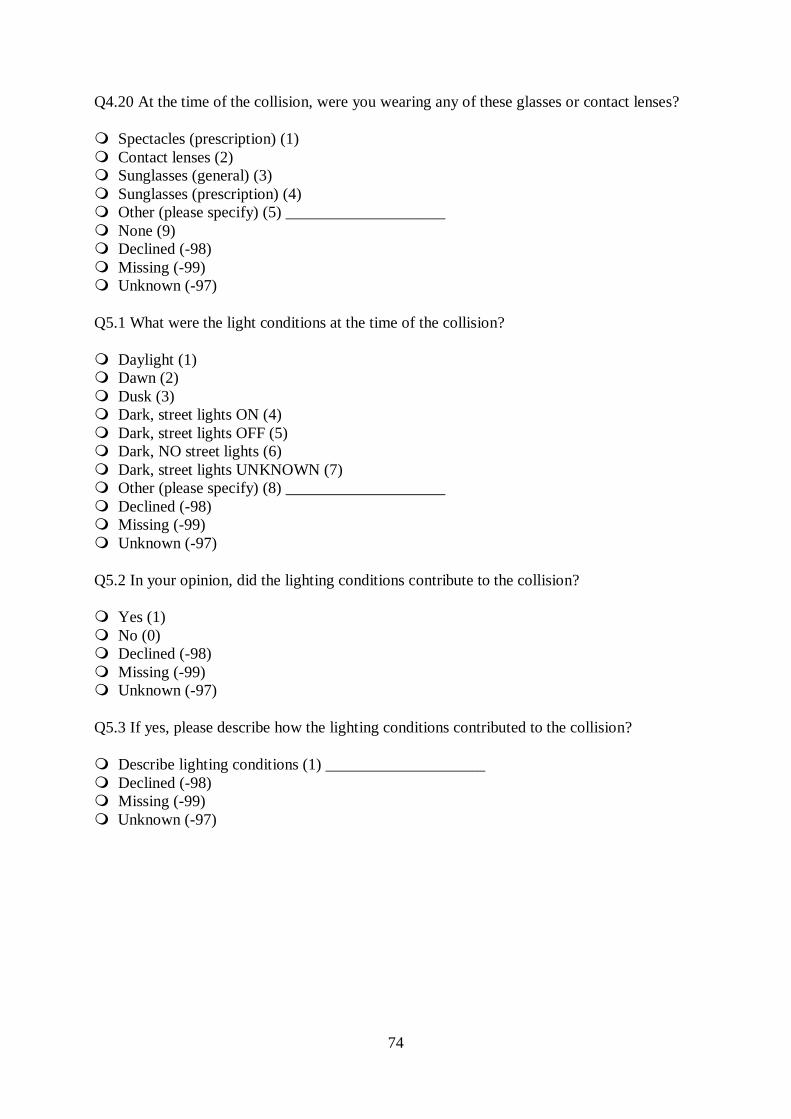
74
Q4.20 At the time of the collision, were you wearing any of these glasses or contact lenses?
Spectacles (prescription) (1) Contact lenses (2) Sunglasses (general) (3) Sunglasses (prescription) (4) Other (please specify) (5) ____________________ None (9) Declined (-98) Missing (-99) Unknown (-97)
Q5.1 What were the light conditions at the time of the collision?
Daylight (1) Dawn (2) Dusk (3) Dark, street lights ON (4) Dark, street lights OFF (5) Dark, NO street lights (6) Dark, street lights UNKNOWN (7) Other (please specify) (8) ____________________ Declined (-98) Missing (-99) Unknown (-97)
Q5.2 In your opinion, did the lighting conditions contribute to the collision?
Yes (1) No (0) Declined (-98) Missing (-99) Unknown (-97)
Q5.3 If yes, please describe how the lighting conditions contributed to the collision?
Describe lighting conditions (1) ____________________ Declined (-98) Missing (-99) Unknown (-97)
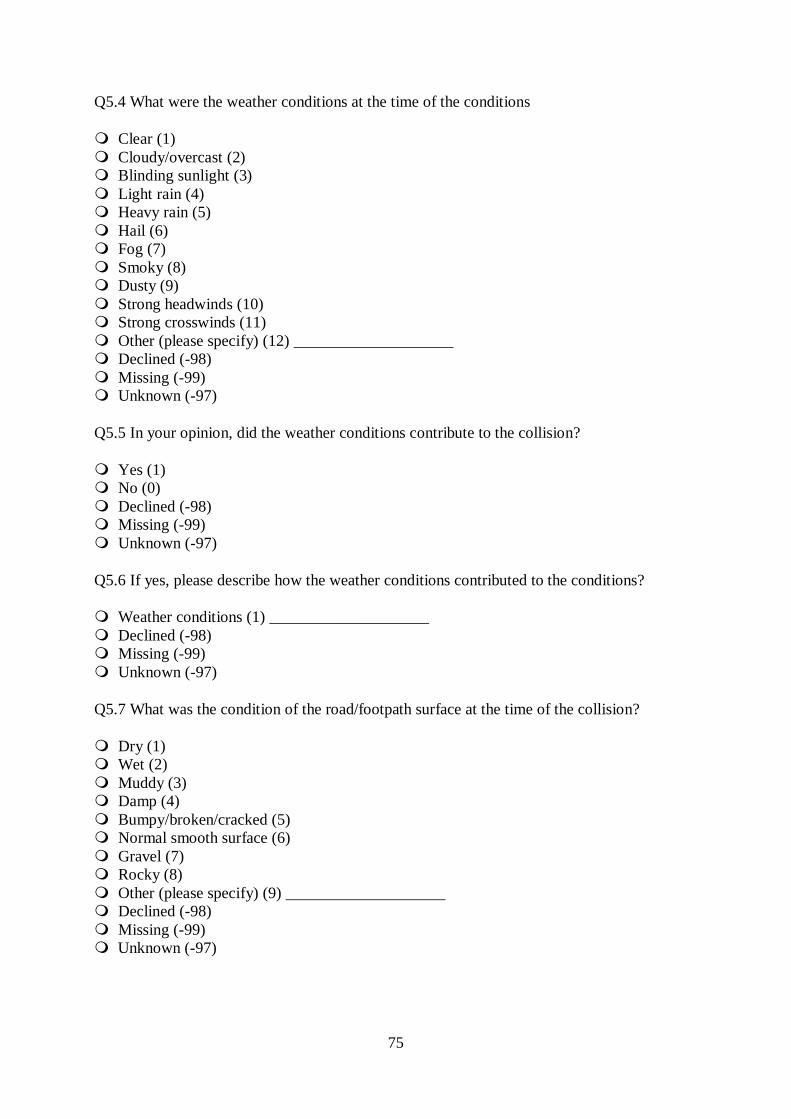
75
Q5.4 What were the weather conditions at the time of the conditions
Clear (1) Cloudy/overcast (2) Blinding sunlight (3) Light rain (4) Heavy rain (5) Hail (6) Fog (7) Smoky (8) Dusty (9) Strong headwinds (10) Strong crosswinds (11) Other (please specify) (12) ____________________ Declined (-98) Missing (-99) Unknown (-97)
Q5.5 In your opinion, did the weather conditions contribute to the collision?
Yes (1) No (0) Declined (-98) Missing (-99) Unknown (-97)
Q5.6 If yes, please describe how the weather conditions contributed to the conditions?
Weather conditions (1) ____________________ Declined (-98) Missing (-99) Unknown (-97)
Q5.7 What was the condition of the road/footpath surface at the time of the collision?
Dry (1) Wet (2) Muddy (3) Damp (4) Bumpy/broken/cracked (5) Normal smooth surface (6) Gravel (7) Rocky (8) Other (please specify) (9) ____________________ Declined (-98) Missing (-99) Unknown (-97)
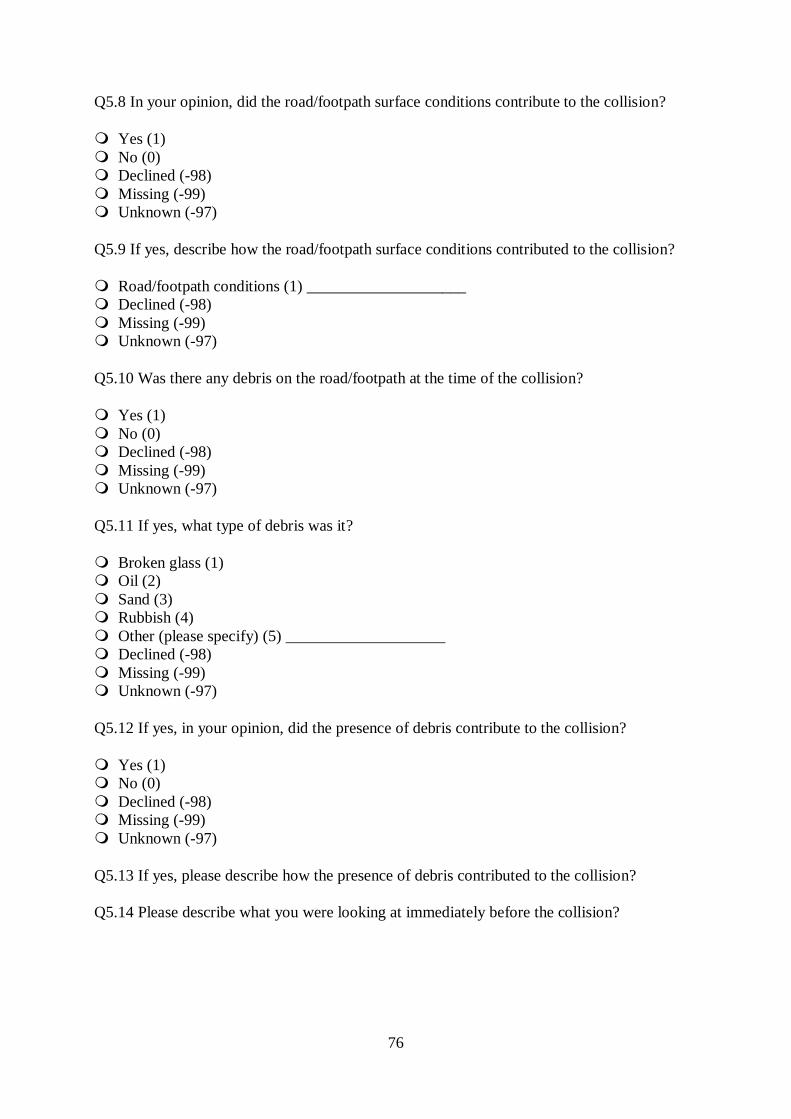
76
Q5.8 In your opinion, did the road/footpath surface conditions contribute to the collision?
Yes (1) No (0) Declined (-98) Missing (-99) Unknown (-97)
Q5.9 If yes, describe how the road/footpath surface conditions contributed to the collision?
Road/footpath conditions (1) ____________________ Declined (-98) Missing (-99) Unknown (-97)
Q5.10 Was there any debris on the road/footpath at the time of the collision?
Yes (1) No (0) Declined (-98) Missing (-99) Unknown (-97)
Q5.11 If yes, what type of debris was it?
Broken glass (1) Oil (2) Sand (3) Rubbish (4) Other (please specify) (5) ____________________ Declined (-98) Missing (-99) Unknown (-97)
Q5.12 If yes, in your opinion, did the presence of debris contribute to the collision?
Yes (1) No (0) Declined (-98) Missing (-99) Unknown (-97)
Q5.13 If yes, please describe how the presence of debris contributed to the collision?
Q5.14 Please describe what you were looking at immediately before the collision?
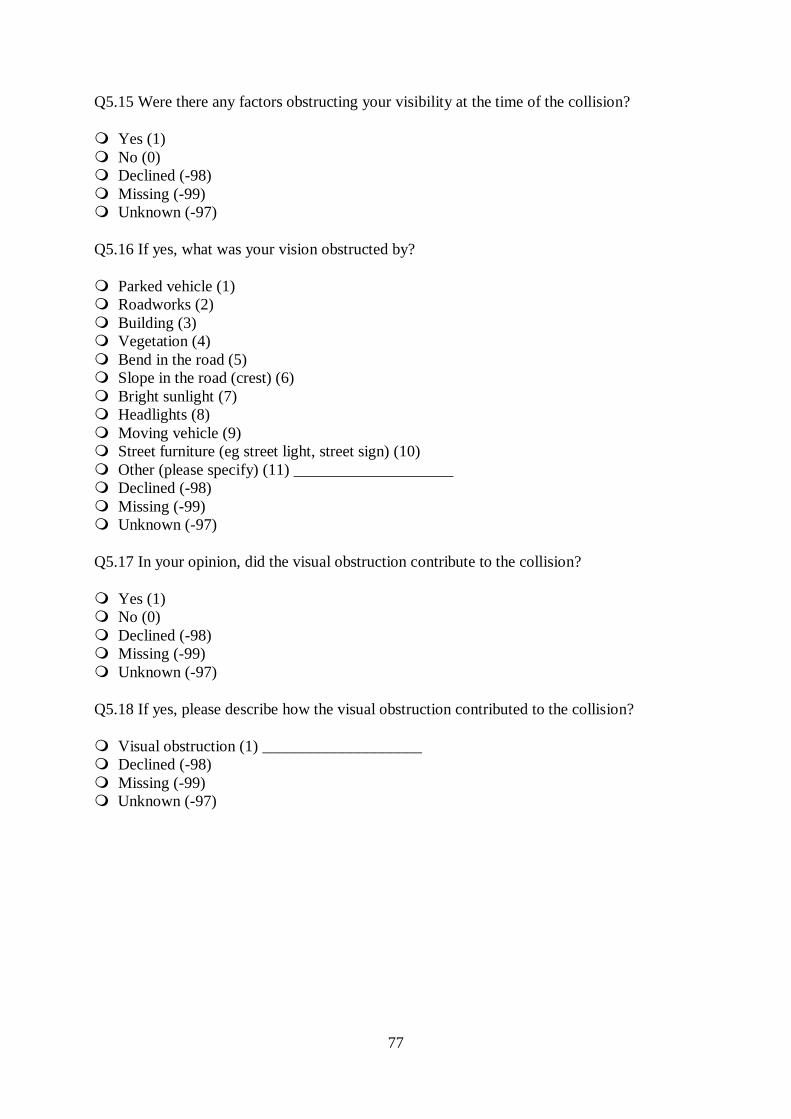
77
Q5.15 Were there any factors obstructing your visibility at the time of the collision?
Yes (1) No (0) Declined (-98) Missing (-99) Unknown (-97)
Q5.16 If yes, what was your vision obstructed by?
Parked vehicle (1) Roadworks (2) Building (3) Vegetation (4) Bend in the road (5) Slope in the road (crest) (6) Bright sunlight (7) Headlights (8) Moving vehicle (9) Street furniture (eg street light, street sign) (10) Other (please specify) (11) ____________________ Declined (-98) Missing (-99) Unknown (-97)
Q5.17 In your opinion, did the visual obstruction contribute to the collision?
Yes (1) No (0) Declined (-98) Missing (-99) Unknown (-97)
Q5.18 If yes, please describe how the visual obstruction contributed to the collision?
Visual obstruction (1) ____________________ Declined (-98) Missing (-99) Unknown (-97)
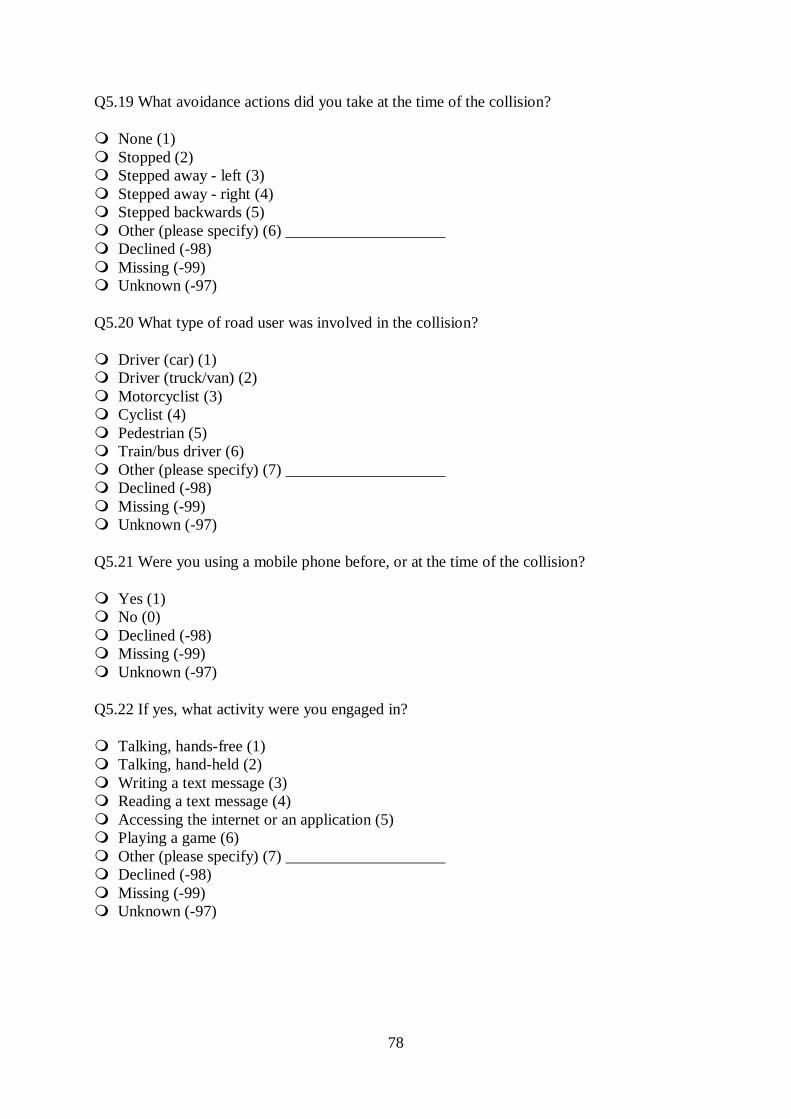
78
Q5.19 What avoidance actions did you take at the time of the collision?
None (1) Stopped (2) Stepped away - left (3) Stepped away - right (4) Stepped backwards (5) Other (please specify) (6) ____________________ Declined (-98) Missing (-99) Unknown (-97)
Q5.20 What type of road user was involved in the collision?
Driver (car) (1) Driver (truck/van) (2) Motorcyclist (3) Cyclist (4) Pedestrian (5) Train/bus driver (6) Other (please specify) (7) ____________________ Declined (-98) Missing (-99) Unknown (-97)
Q5.21 Were you using a mobile phone before, or at the time of the collision?
Yes (1) No (0) Declined (-98) Missing (-99) Unknown (-97)
Q5.22 If yes, what activity were you engaged in?
Talking, hands-free (1) Talking, hand-held (2) Writing a text message (3) Reading a text message (4) Accessing the internet or an application (5) Playing a game (6) Other (please specify) (7) ____________________ Declined (-98) Missing (-99) Unknown (-97)
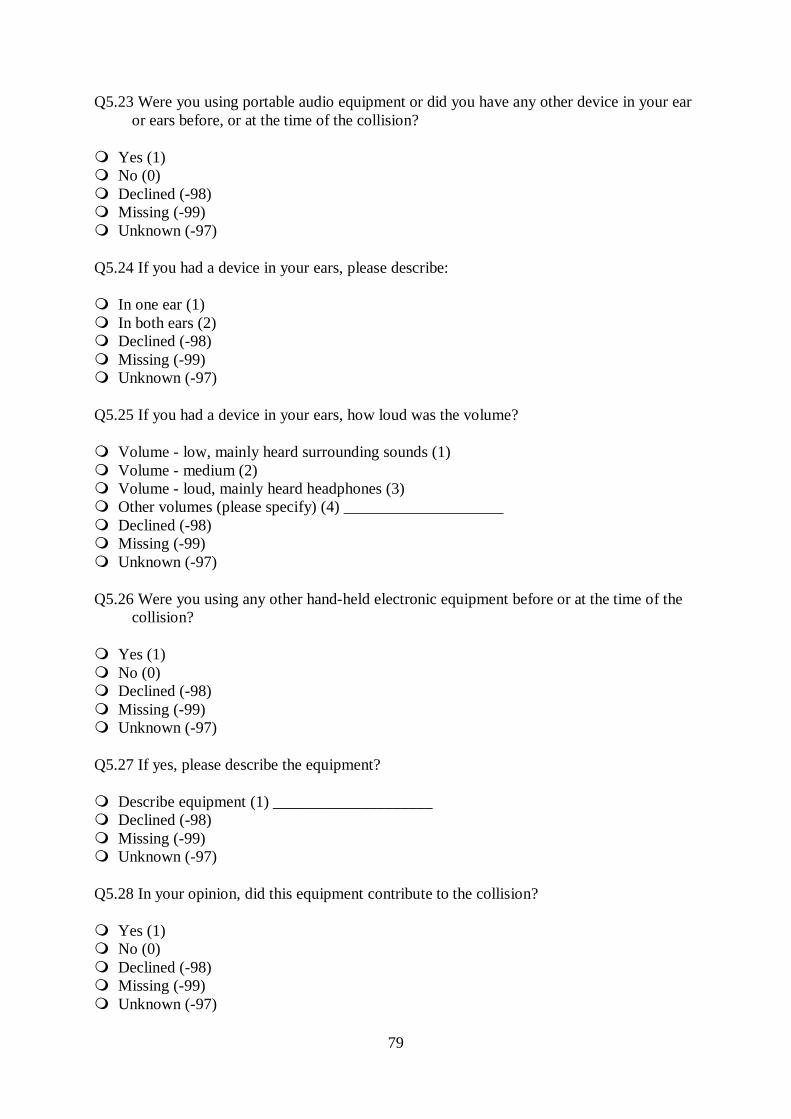
79
Q5.23 Were you using portable audio equipment or did you have any other device in your ear or ears before, or at the time of the collision?
Yes (1) No (0) Declined (-98) Missing (-99) Unknown (-97)
Q5.24 If you had a device in your ears, please describe:
In one ear (1) In both ears (2) Declined (-98) Missing (-99) Unknown (-97)
Q5.25 If you had a device in your ears, how loud was the volume?
Volume - low, mainly heard surrounding sounds (1) Volume - medium (2) Volume - loud, mainly heard headphones (3) Other volumes (please specify) (4) ____________________ Declined (-98) Missing (-99) Unknown (-97)
Q5.26 Were you using any other hand-held electronic equipment before or at the time of the collision?
Yes (1) No (0) Declined (-98) Missing (-99) Unknown (-97)
Q5.27 If yes, please describe the equipment?
Describe equipment (1) ____________________ Declined (-98) Missing (-99) Unknown (-97)
Q5.28 In your opinion, did this equipment contribute to the collision?
Yes (1) No (0) Declined (-98) Missing (-99) Unknown (-97)
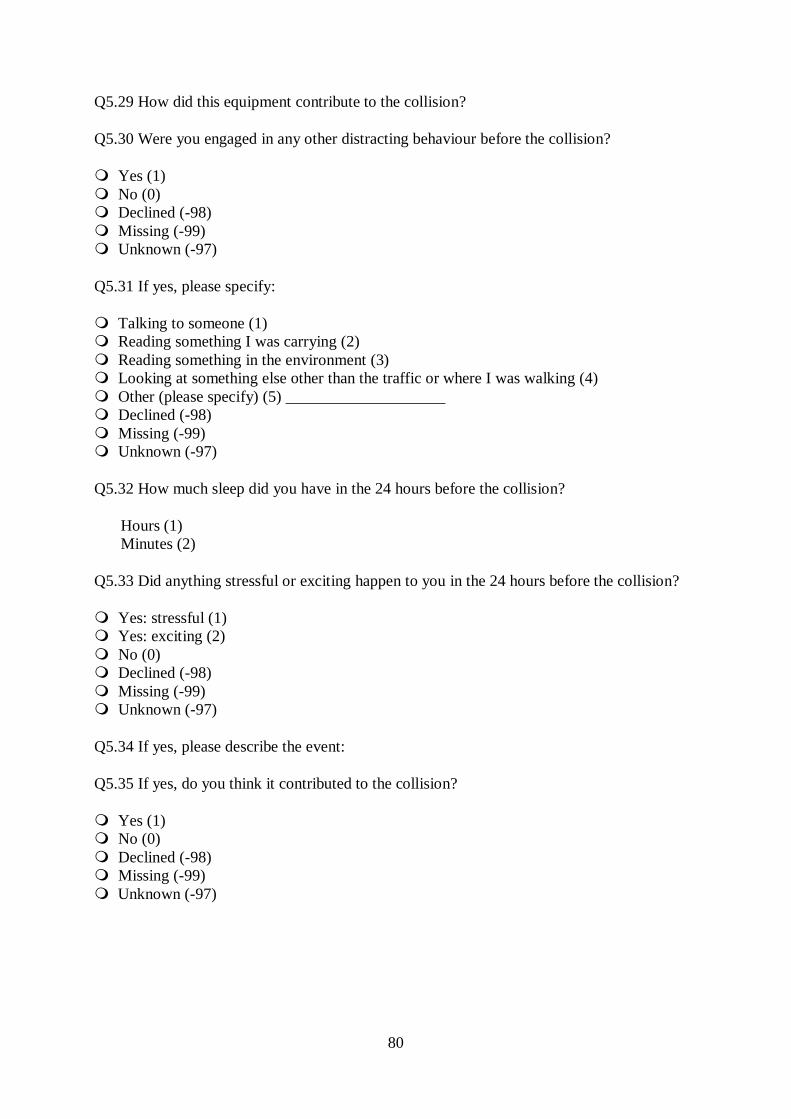
80
Q5.29 How did this equipment contribute to the collision?
Q5.30 Were you engaged in any other distracting behaviour before the collision?
Yes (1) No (0) Declined (-98) Missing (-99) Unknown (-97)
Q5.31 If yes, please specify:
Talking to someone (1) Reading something I was carrying (2) Reading something in the environment (3) Looking at something else other than the traffic or where I was walking (4) Other (please specify) (5) ____________________ Declined (-98) Missing (-99) Unknown (-97)
Q5.32 How much sleep did you have in the 24 hours before the collision?
Hours (1) Minutes (2)
Q5.33 Did anything stressful or exciting happen to you in the 24 hours before the collision?
Yes: stressful (1) Yes: exciting (2) No (0) Declined (-98) Missing (-99) Unknown (-97)
Q5.34 If yes, please describe the event:
Q5.35 If yes, do you think it contributed to the collision?
Yes (1) No (0) Declined (-98) Missing (-99) Unknown (-97)
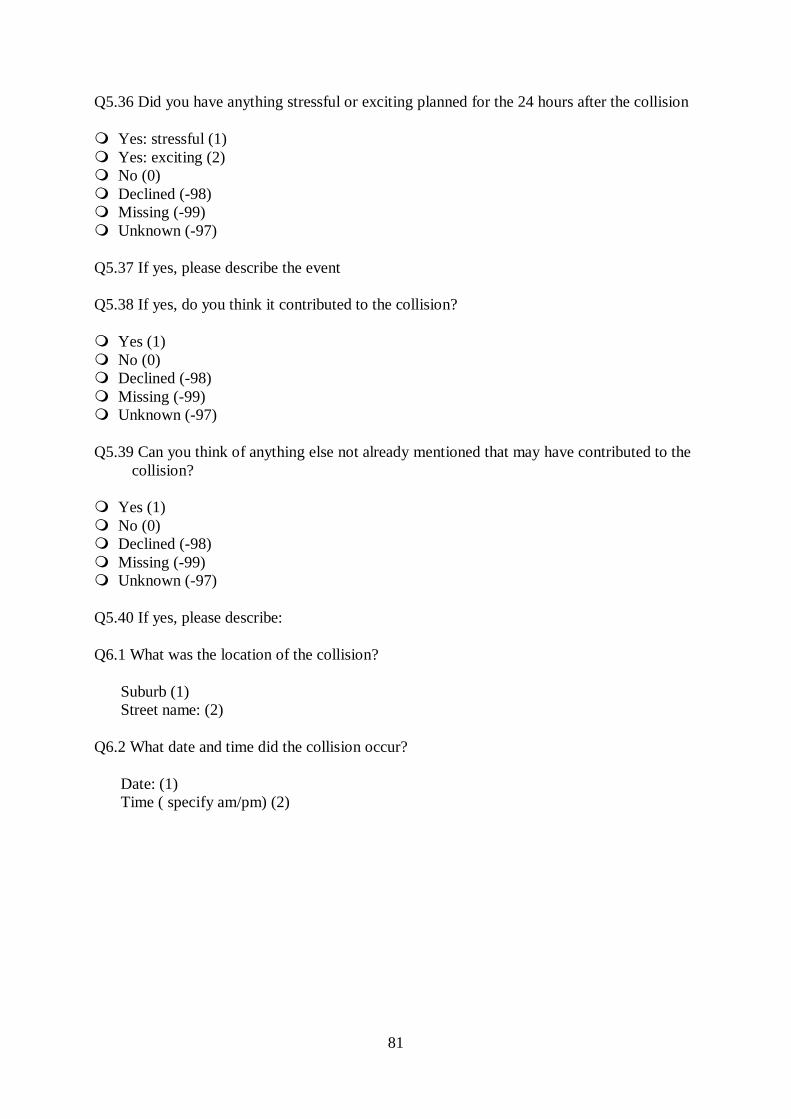
81
Q5.36 Did you have anything stressful or exciting planned for the 24 hours after the collision
Yes: stressful (1) Yes: exciting (2) No (0) Declined (-98) Missing (-99) Unknown (-97)
Q5.37 If yes, please describe the event
Q5.38 If yes, do you think it contributed to the collision?
Yes (1) No (0) Declined (-98) Missing (-99) Unknown (-97)
Q5.39 Can you think of anything else not already mentioned that may have contributed to the collision?
Yes (1) No (0) Declined (-98) Missing (-99) Unknown (-97)
Q5.40 If yes, please describe:
Q6.1 What was the location of the collision?
Suburb (1) Street name: (2)
Q6.2 What date and time did the collision occur?
Date: (1) Time ( specify am/pm) (2)
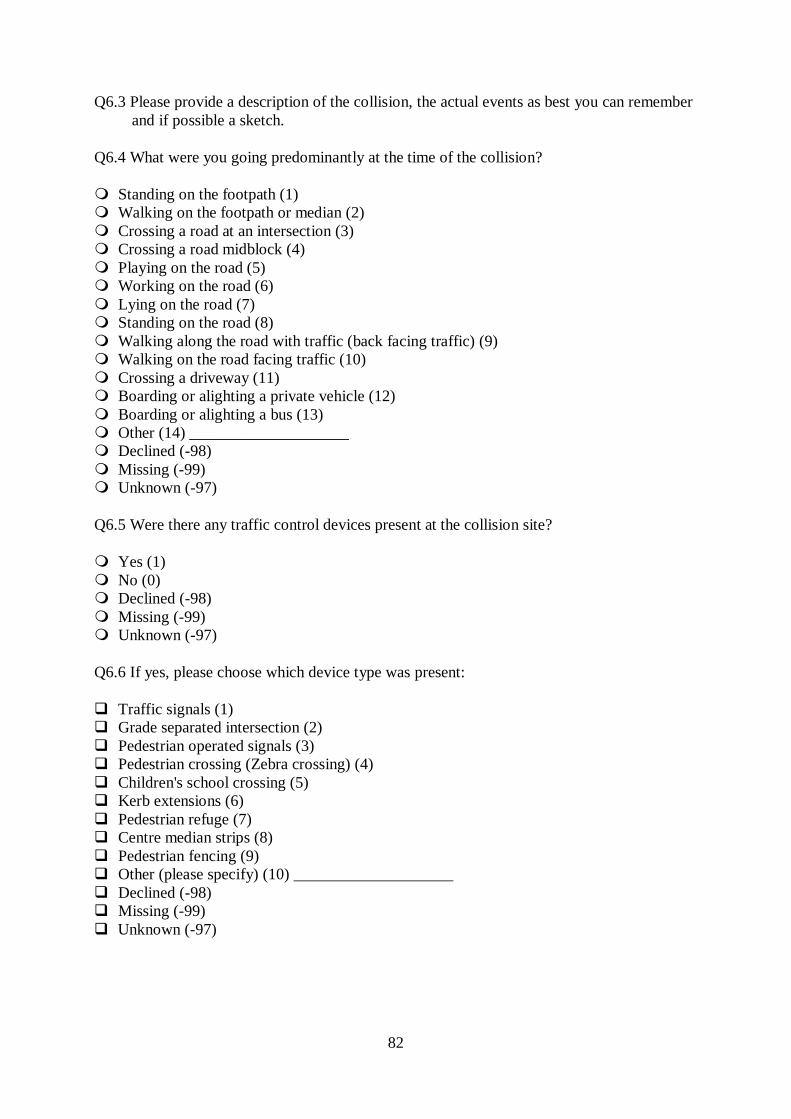
82
Q6.3 Please provide a description of the collision, the actual events as best you can remember and if possible a sketch.
Q6.4 What were you going predominantly at the time of the collision?
Standing on the footpath (1) Walking on the footpath or median (2) Crossing a road at an intersection (3) Crossing a road midblock (4) Playing on the road (5) Working on the road (6) Lying on the road (7) Standing on the road (8) Walking along the road with traffic (back facing traffic) (9) Walking on the road facing traffic (10) Crossing a driveway (11) Boarding or alighting a private vehicle (12) Boarding or alighting a bus (13) Other (14) ____________________ Declined (-98) Missing (-99) Unknown (-97)
Q6.5 Were there any traffic control devices present at the collision site?
Yes (1) No (0) Declined (-98) Missing (-99) Unknown (-97)
Q6.6 If yes, please choose which device type was present:
Traffic signals (1) Grade separated intersection (2) Pedestrian operated signals (3) Pedestrian crossing (Zebra crossing) (4) Children's school crossing (5) Kerb extensions (6) Pedestrian refuge (7) Centre median strips (8) Pedestrian fencing (9) Other (please specify) (10) ____________________ Declined (-98) Missing (-99) Unknown (-97)
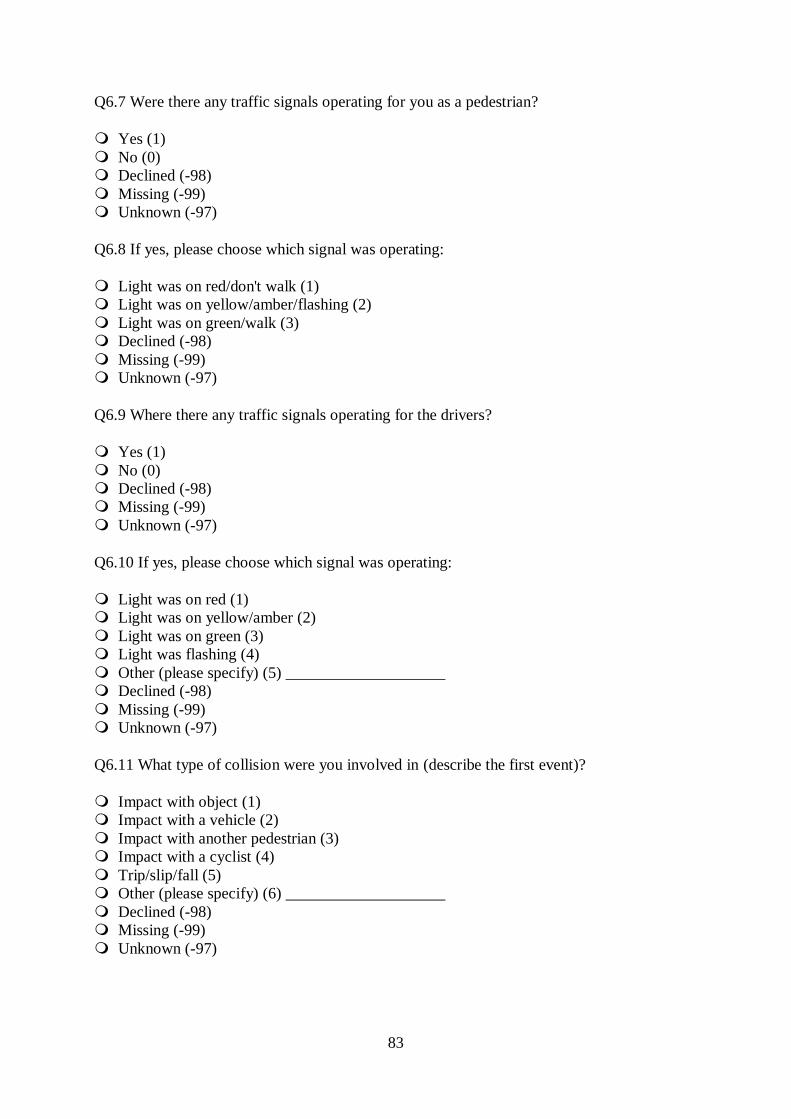
83
Q6.7 Were there any traffic signals operating for you as a pedestrian?
Yes (1) No (0) Declined (-98) Missing (-99) Unknown (-97)
Q6.8 If yes, please choose which signal was operating:
Light was on red/don't walk (1) Light was on yellow/amber/flashing (2) Light was on green/walk (3) Declined (-98) Missing (-99) Unknown (-97)
Q6.9 Where there any traffic signals operating for the drivers?
Yes (1) No (0) Declined (-98) Missing (-99) Unknown (-97)
Q6.10 If yes, please choose which signal was operating:
Light was on red (1) Light was on yellow/amber (2) Light was on green (3) Light was flashing (4) Other (please specify) (5) ____________________ Declined (-98) Missing (-99) Unknown (-97)
Q6.11 What type of collision were you involved in (describe the first event)?
Impact with object (1) Impact with a vehicle (2) Impact with another pedestrian (3) Impact with a cyclist (4) Trip/slip/fall (5) Other (please specify) (6) ____________________ Declined (-98) Missing (-99) Unknown (-97)
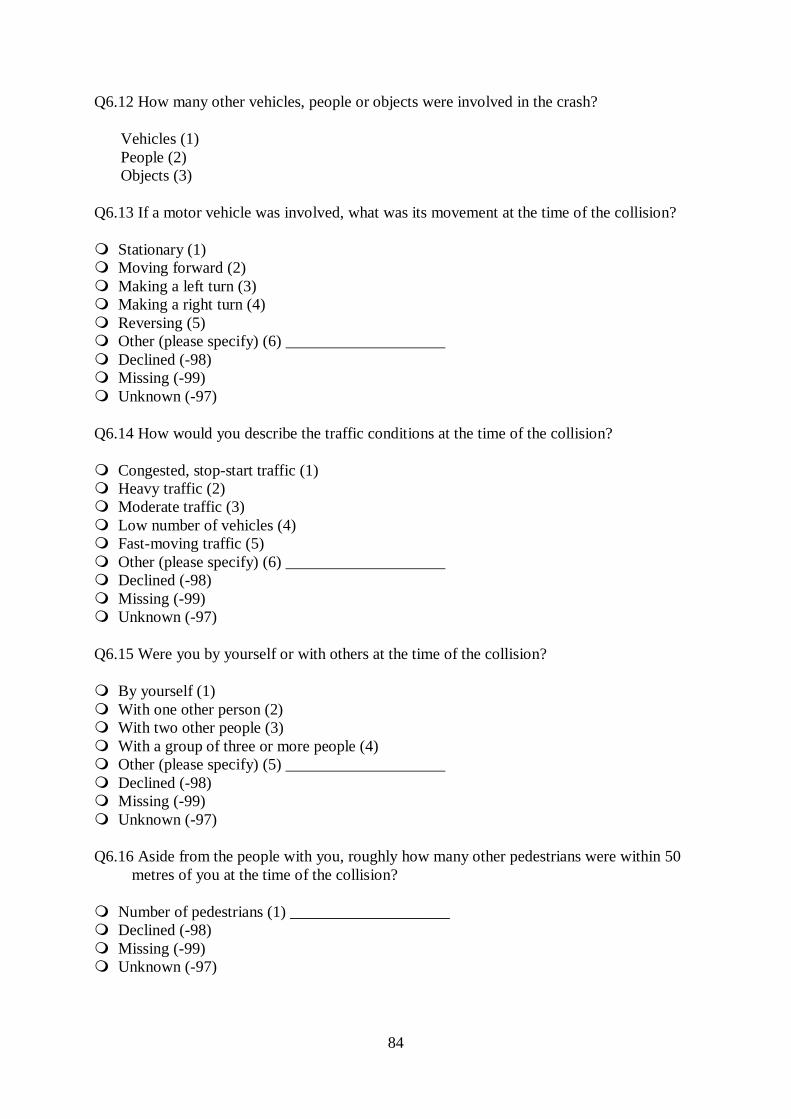
84
Q6.12 How many other vehicles, people or objects were involved in the crash?
Vehicles (1) People (2) Objects (3)
Q6.13 If a motor vehicle was involved, what was its movement at the time of the collision?
Stationary (1) Moving forward (2) Making a left turn (3) Making a right turn (4) Reversing (5) Other (please specify) (6) ____________________ Declined (-98) Missing (-99) Unknown (-97)
Q6.14 How would you describe the traffic conditions at the time of the collision?
Congested, stop-start traffic (1) Heavy traffic (2) Moderate traffic (3) Low number of vehicles (4) Fast-moving traffic (5) Other (please specify) (6) ____________________ Declined (-98) Missing (-99) Unknown (-97)
Q6.15 Were you by yourself or with others at the time of the collision?
By yourself (1) With one other person (2) With two other people (3) With a group of three or more people (4) Other (please specify) (5) ____________________ Declined (-98) Missing (-99) Unknown (-97)
Q6.16 Aside from the people with you, roughly how many other pedestrians were within 50 metres of you at the time of the collision?
Number of pedestrians (1) ____________________ Declined (-98) Missing (-99) Unknown (-97)
85
Q6.17 If you were crossing the road, roughly how long did you have to wait before crossing?
Not crossing the road (1) Less than 10 seconds (2) Between 10 and 30 seconds (3) Between 30 and 60 seconds (4) Longer than 60 seconds (5) Other (6) ____________________ Declined (-98) Missing (-99) Unknown (-97)
Q6.18 In your opinion, were there sufficient gaps in the traffic to allow pedestrians to cross safely?
Yes (1) No (0) Declined (-98) Missing (-99) Unknown (-97)
Q6.19 Were you crossing between vehicles that were queued up at an intersection or stopped due to congestion?
Yes (1) No (0) Declined (-98) Missing (-99) Unknown (-97)
Q6.20 Please describe why you were crossing the road at the particular location where you had your collision
Q6.21 Overall, who do you think was most at fault at the time of the collision?
You (1) The driver of the vehicle (2) The other road user (pedestrian or cyclist) (3) Other (please specify) (4) ____________________ Declined (-98) Missing (-99) Unknown (-97)
86
Q7.1 For the purposes of further research, would you agree to us contacting you again in the future?
Yes (1) No (0) Declined (-98) Missing (-99) Unknown (-97)
Q7.2 If you agree to be contacted in the future, please provide the following contact details. Preferred contact method:
Phone (1) Email (2)
Q7.3 Click to write the question text
Best contact phone number (1) Preferred contact time (2) Preferred contact day (3) Best email contact (4) Participant name (5)
Q8.1 Other details
Times spent in hospital (1) Number of injuries (2) Injury type (3) Injury severity (4) Maximum AIS (5) Maximum AIS by body region (6) ISS (7) Glasgow Coma Score (8)
Q8.2 Body region injured (mark all applicable)
Head (1) Face (2) Neck (3) Chest (4) Abdomen (5) Spine (6) Upper extremity (7) Lower extremity (8) Burns (9)
87
Q8.3 Description of main injuries
Q8.4 Alcohol and drug readings
Blood Alcohol Concentration (1) ____________________ Breath alcohol level (2) ____________________ Drug reading (3) ____________________
Related Documents