Danish Energy Authority · Amaliegade 44 · DK-1256 København K Tel.: +45 33 92 67 00 · Fax: +45 33 11 47 43 e-mail: [email protected] www.ens.dk In 1966, the first discovery of oil and natural gas was made in Denmark. Since 1986, the Danish Energy Authority has published its annual report "Oil and Gas Production in Denmark". As in previous years, the report for 2003 describes explora- tion and development activities in the Danish area. The report also contains a review of production and the health, safety and environmental aspects of oil and gas production activities. In addition, the report contains an assessment of Danish oil and gas reserves and a section on the impact of hydrocarbon production on the Danish economy. This year’s report also includes a special section on Denmark’s hydrocarbon potential. The report can be obtained from the Danish State Informa- tion Centre, tel. +45 7010 1881, an official telephone service directly connecting callers to anywhere in the public sector, or from the Danish Energy Authority’s Internet bookstore, www.danmark.dk/netboghandel. The report is also available on the Danish Energy Authority’s homepage, www.ens.dk. ISBN 87-7844-433-0 Oil and Gas production in Denmark 2003 Oil and Gas Production in Denmark 2003

Welcome message from author
This document is posted to help you gain knowledge. Please leave a comment to let me know what you think about it! Share it to your friends and learn new things together.
Transcript

Danish Energy Authority · Amaliegade 44 · DK-1256 København KTel.: +45 33 92 67 00 · Fax: +45 33 11 47 43
e-mail: [email protected]
www.ens.dk
In 1966, the first discovery of oil and natural gas was madein Denmark. Since 1986, the Danish Energy Authority haspublished its annual report "Oil and Gas Production inDenmark".
As in previous years, the report for 2003 describes explora-tion and development activities in the Danish area. Thereport also contains a review of production and the health,safety and environmental aspects of oil and gas productionactivities.
In addition, the report contains an assessment of Danish oiland gas reserves and a section on the impact of hydrocarbonproduction on the Danish economy.
This year’s report also includes a special section onDenmark’s hydrocarbon potential.
The report can be obtained from the Danish State Informa-tion Centre, tel. +45 7010 1881, an official telephone servicedirectly connecting callers to anywhere in the public sector,or from the Danish Energy Authority’s Internet bookstore,www.danmark.dk/netboghandel. The report is also availableon the Danish Energy Authority’s homepage, www.ens.dk.
ISBN 87-7844-433-0
Oil and G
as production in Denm
ark 2003
Oil and Gas Productionin Denmark 2003
Established by law in 1976, the Danish Energy Authority is an authority under the
Ministry of Economic and Business Affairs that deals with matters relating to the
production, supply and use of energy. On behalf of the Government, its task is to
ensure that the Danish energy sector develops in a manner appropriate to society,
the environment and safety.
The Danish Energy Authority prepares and administers Danish energy legislation,
analyzes and evaluates developments in the energy sector, and makes forecasts
and assessments of Danish oil and gas reserves.
The Danish Energy Authority works closely with local, regional and national aut-
horities, energy distribution companies and licensees, etc. At the same time, the
Danish Energy Authority maintains relations with international partners in the
energy area, including the EU, IEA, as well as the Nordic Council of Ministers.
The Danish Energy Authority
44 Amaliegade
DK-1256 Copenhagen K
Telephone + 45 33 92 67 00
Fax + 45 33 11 47 43
Homepage: www.ens.dk
Published: June 2004
Number printed: 1,500
Front page: Photos made available by DONG E&P A/S
Editor: Helle Halberg, the Danish Energy Authority
Maps and
illustrations: Lise Ott, the Danish Energy Authority
Print: Rosendahls Bogtrykkeri
Printed on: 100% recycled paper. Cover: 250 g Cyclus offset. Content: 130 g
Cyclus print
Layout: Advice A/S and the Danish Energy Authority
Translation: Rita Sunesen
ISBN 87-7844-433-0
ISSN 0907-2675
Reprinting allowed if source is credited. The report, including figures and tables, is
also available on the Danish Energy Authority’s homepage, www.ens.dk. ISBN 87-
7844-434-9.
C O L O P H O N
541 Printedmatter 457

3
P R E F A C E
PREFACE
Activity and growth continue to characterize the Danish oil and gas sector. Thus, three
new fields were brought on stream in 2003, a development that kept oil production
at the same high level as in 2002.
In September 2003, the Danish state and A.P. Møller-Mærsk concluded an agreement
regarding a continuation of the company’s existing Sole Concession until 2042. This
agreement has created a long-term basis for optimizing production from the numerous
accumulations in the concession area, while also generating larger revenue for the
state.
Recovering oil and natural gas from the North Sea remains attractive, and major
investments will continue to be made in the Danish sector of the North Sea in the
years ahead.
The Danish Energy Authority has carried out an assessment of prospective resources
in the Danish area, which shows that considerable unidentified hydrocarbon resources
may still be present. Consequently, the upcoming 6th Licensing Round is considered
to offer major exploration opportunities. Continuous exploration is essential if the
oil and gas sector is to contribute positively to the Danish economy also in the
future.
In November 2002, the Government presented an action plan with initiatives aimed
at safety on board the North Sea installations. The action plan underscores that safety
standards on Danish offshore installations must continue to rank among the highest
in the North Sea countries. The action plan involves intensifying the Danish Energy
Authority’s safety supervision. Thus, in 2003, the Danish Energy Authority made
targeted efforts to implement the initiatives set out in the action plan. The Danish
Energy Authority believes that the action plan has helped maintain the high level of
health and safety in the Danish sector of the North Sea.
Copenhagen, June 2004
Ib Larsen
Director

4
C O N V E R S I O N F A C T O R S
CONVERSION FACTORS
TEMP. PRESSURE
Crude oil m3 (st) 15°C 101.325 kPa
stb 60°F 14.73 psiaii
Natural gas m3 (st) 15°C 101.325 kPa
Nm3 0°C 101.325 kPa
scf 60°F 14.73 psia
ii) The reference pressure used in Denmark and in US FederalLeases and in a few states in the USA is 14.73 psia
iii) γ: Relativ vægtfylde i forhold til vand.
Reference pressure and temperature for the
units mentioned:
Some abbreviations:
kPa kilopascal. Unit of pressure. 100 kPa = 1 bar
Nm3 normal cubic metre. Unit of measurement used for natural gas in the reference state 0°C and 101.325 kPa.
m3 (st) standard cubic metre. Unit of measurement used for natural gas and crude oil in a reference state of15°C and 101.325 kPa.
Btu British Thermal Unit. Other thermal units areJ (= Joule) and cal (calorie).
bbl blue barrel. In the early days of the oil industry when oil was traded in physical barrels, different barrel sizes soon emerged. To avoid confusion, Standard Oil painted their standard-volume barrels blue.
kg · mol kilogrammol; the mass of a substance whose mass in kilograms is equal to the molecular mass of the substance.
γ gamma; relative density.
in inch; British unit of length. 1 inch = 2.54 cm
ft foot/feet; British unit of length. 1 ft = 12 in.
t.o.e. tons oil equivalent; this unit is internationally defined as 1 t.o.e. = 10 Gcal.
*) Exact valuei) Average value for Danish fields
In the oil industry, two different systems of units are frequently used: SI units
(metric units) and the so-called oil field units, which were originally introduced in
the USA. This report uses SI units. The SI units are based on international defini-
tions, whereas the use of oil field units may vary from one country to another,
being defined by tradition.
The abbreviations used for oil field units are those recommended by the SPE
(Society of Petroleum Engineers).
Quantities of oil and natural gas may be indicated by volume or energy content. As
gas, and, to some extent, oil are compressible, the volume of a specific amount
varies according to pressure and temperature. Therefore, measurements of volume
are only unambiguous if the pressure and temperature are indicated.
The composition, and thus the calorific value, of crude oil and natural gas vary
from field to field and with time. Therefore, the conversion factors for t and GJ are
dependent on time. The table below shows the average for 2003 based on figures
from refineries. The lower calorific value is indicated.
The SI prefixes m (million), k (kilo), M (mega), G (giga), T (tera) and P (peta)
stand for 10-3, 103, 106, 109, 1012 and 1015, respectively.
A somewhat special prefix is used for oil field units: M (roman numeral 1,000).
Thus, the abbreviated form of one million stock tank barrels is 1 MMstb, and the
abbreviation used for one billion standard cubic feet is 1 MMMscf or 1 Bscf.
FROM TO MULTIPLY BY
Crude oil m3 (st) stb 6.293
m3 (st) GJ 36.3
m3 (st) t 0.86i
Natural gas Nm3 scf 37.2396
Nm3 GJ 0.03994
Nm3 t.o.e. 953.95 x 10⁻⁶
Nm3 kg.mol 0.0446158
m3 (st) scf 35.3014
m3 (st) GJ 0.03786
m3 (st) kg.mol 0.0422932
Units of volume m3 bbl 6.28981
m3 ft3 35.31467
US gallon in3 231*
bbl US gallon 42*
Energy t.o.e. GJ 41.868*
GJ Btu 947817
cal J 4.1868*
FROM TO CONVERSION
Density °API kg/m3 141364.33/(°API + 131.5)
°API γ 141.5/(°API + 131.5)

5
C O N T E N T S
Preface 3
Conversion factors 4
1. Licences and exploration 6
2. Development 14
3. Production 20
4. The environment 26
5. Health and safety 29
6. Reserves 36
7. Hydrocarbon potential 44
8. Economy 53
Appendix A Amounts produced and injected 62
Appendix B Producing fields 65
Appendix C Financial key figures 94
Appendix D Financial conditions applicable 95
Maps of licence area

6
The Government’s agreement with A.P. Møller–Mærsk to extend the Sole
Concession made 2003 a crucial year for the future exploitation of Danish oil and
gas resources.
The level of exploration activity in the Danish sector was satisfactory, particularly
compared to the other North Sea countries. In 2003, a total of ten exploration and
appraisal wells were drilled, leading to one new oil discovery. The Danish Energy
Authority expects the activity level to be sustained throughout 2004.
CONTINUATION OF A.P. MØLLER-MÆRSK’S SOLE CONCESSIONDuring a debate on questions in the Danish Parliament in February 2003, the
Government was asked to present a statement on the options for securing a larger
share of the North Sea oil and gas production values for the state. In making this
request, the Danish Parliament presupposed that a discussion was to be held with
A.P. Møller-Mærsk to investigate the possibilities for a continuation of the 1962
Sole Concession.
On 29 September 2003, the Government entered into an agreement with A.P.
Møller-Mærsk, and presented a statement on the North Sea to the Danish
Parliament on 7 October 2003. Both the agreement and the statement are avail-
able on the Danish Energy Authority’s website at www.ens.dk.
The main elements of the agreement of 29 September 2003 are outlined in Box 1
below. Fig. 1.1 shows the areas comprised by the agreement of 29 September 2003.
Box 1. Main elements of the agreement of 29 September 2003
Continuation of Sole Concession until 2042A continuation of the Sole Concession for the period from 1 January 2004 to 8
July 2042 is in the process of being granted to A.P. Møller–Mærsk (the
Concessionaires). The agreement includes provisions to the effect that the
Concessionaires are to continue active exploration efforts and currently report to
the public authorities on their plans for future production and the closure of
fields. Any dispute about the scope or content of such work is to be settled by
arbitration.
State participationAs from 1 January 2004 and through 8 July 2012, the Concessionaires and their
partners are to pay the state an annual amount corresponding to 20% of the profit
before tax and before net interest expenses. As from 9 July 2012, the state will
become a partner of DUC, taking over a 20% share of all installations (platforms,
processing plant, pipelines, etc.). The state will not pay for this takeover.
Hydrocarbon taxWith effect from the 2004 accounting year, the special investment allowance pro-
vided for in the Danish Hydrocarbon Tax Act – the hydrocarbon allowance – will
be reduced to 5% over six years instead of 25% over ten years. For investments
made prior to 1 January 2004, the hydrocarbon allowance will be reduced from
L I C E N C E S A N D E X P L O R A T I O N
1. LICENCES AND EXPLORATION
Fig. 1.1 Sole Concession of 8 July 1962
6°15'
Sole Concession
Other licences
6°15'
Fig. 1.2 Unlicensed areas
Existing licences
Unlicensed areas, January 2004

25% to 10% a year. Deductibility stops when the investment is more than ten
years old. The hydrocarbon tax rate will be reduced from 70% to 52%. The field-
based tax assessment will be abolished as from the 2004 accounting year.
Unutilized losses on fields are to be determined at the end of the 2003 accounting
year and can be deducted at the rate of 2.5% in each of the years 2004-2005 and
at the rate of 6% in each of the years 2006-2016. The remaining 29% cannot be
deducted. The special pay-back rule in the Hydrocarbon Tax Act has been abol-
ished with effect from 1 January 2004.
Royalty and pipeline tariff The provision regarding payment of royalty laid down in Section 10(1) of the
1962 Concession has been abolished with effect from 1 January 2004. The
pipeline tariff payable according to the 1981 agreement between the Minister for
Energy and A.P. Møller will be abolished with effect from 9 July 2012. The
pipeline tariff is to be offset against hydrocarbon tax as from 1 January 2004 and
not against the income base for either hydrocarbon tax or corporate income tax.
Allowances not utilized in any one year may be carried forward to subsequent years.
Removal costsRemoval costs are payable by DUC and its partners. For tax purposes, removal
costs can be deducted in the year defrayed. In the event that the allowance can-
not be utilized in full due to insufficient positive hydrocarbon income at the time
production is discontinued under the Concession, the state will reimburse the tax
value of the unutilized allowance. However, the amount reimbursed cannot
exceed the accumulated hydrocarbon tax payments less any amounts previously
reimbursed in respect of removal costs under the same scheme.
Compensatory schemeThe DUC companies will be compensated for the effects of any amendments to
existing or new legislation and other rules specifically impacting on hydrocarbon
producers in the Danish part of the North Sea. The compensation will be fixed
with a view to restoring the financial balance between the state and the Concession-
aires and their partners, and cannot exceed the net benefit achieved by the state
from the agreement of 29 September 2003. Any disputes in this respect are to be
referred to arbitration. This scheme will not affect the state’s general right of taxation.
In autumn 2003 and spring 2004, the Danish Parliament adopted amendments to
the Danish Subsoil Act, Pipeline Act and Hydrocarbon Tax Act, and thus all the
elements of the agreement have been implemented into legislation.
The statutory amendments will also become effective for future licences for the
exploration and production of hydrocarbons.
6TH LICENSING ROUNDSix years have passed since areas were offered for licensing in the Central Graben
and adjoining areas, i.e. west of 6o 15’ eastern longitude.
7
L I C E N C E S A N D E X P L O R A T I O N
8
Most of the work obligations undertaken by the oil companies in the 5th Licensing
Round in 1998 have been fulfilled. Four out of the 12 exploration wells drilled
under the licences awarded in the 5th Licensing Round have led to hydrocarbon
discoveries. Cecilie came on stream in 2002, Connie is expected to be developed in
2004, while the Svane and Hejre discoveries are currently under appraisal.
The wells drilled in the Siri Fairway have confirmed the exploration model for
Paleogene deposits, while the wells in the Central Graben have also shown new
exploration potential in deep Jurassic sandstone deposits. Although exploration in
the Danish sector of the North Sea commenced almost 40 years ago, results con-
tinue to show attractive exploration potential.
The most recent amendments to the Danish Subsoil Act, Pipeline Act and Hydro-
carbon Tax Act have set the basic conditions for future licences. The Danish
Energy Authority is now completing the terms and conditions for the 6th Licensing
Round, expected to be opened in the course of 2004. Once applications have
been invited in the new licensing round, the oil companies will have a time limit
of about six months to submit offers for the unlicensed areas west of 6° 15’ eastern
longitude. Fig. 1.2 shows the areas available as of April 2004.
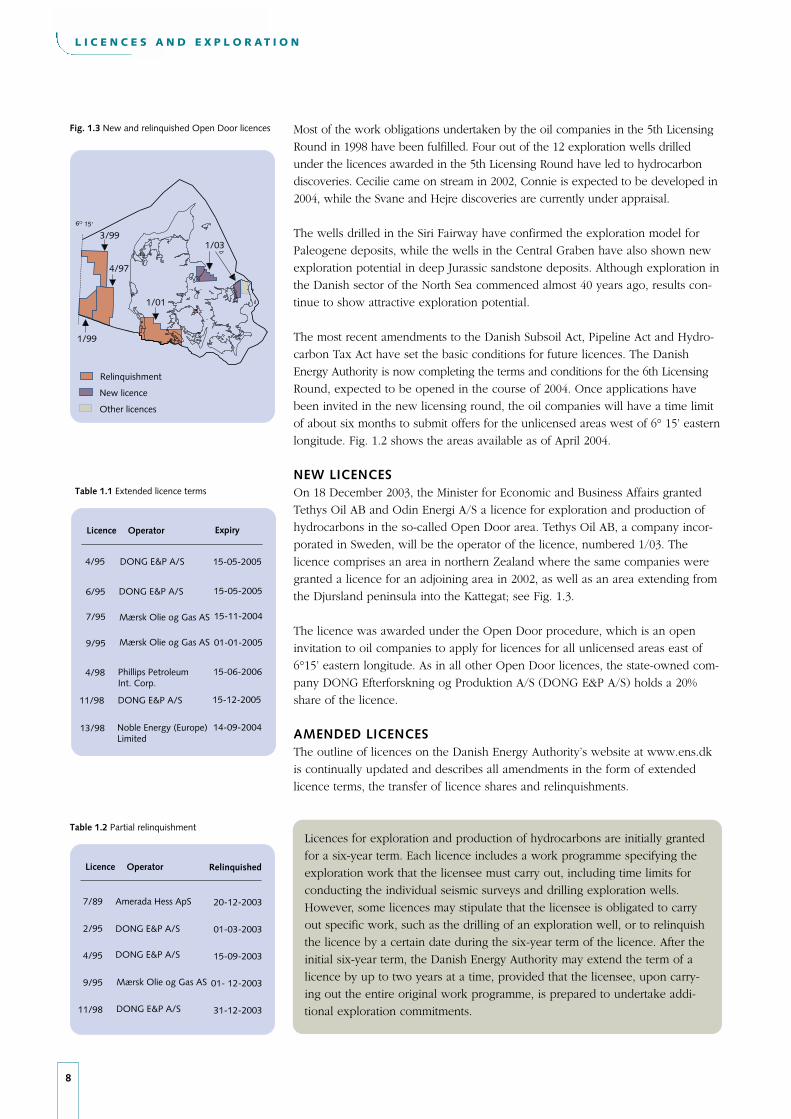
NEW LICENCESOn 18 December 2003, the Minister for Economic and Business Affairs granted
Tethys Oil AB and Odin Energi A/S a licence for exploration and production of
hydrocarbons in the so-called Open Door area. Tethys Oil AB, a company incor-
porated in Sweden, will be the operator of the licence, numbered 1/03. The
licence comprises an area in northern Zealand where the same companies were
granted a licence for an adjoining area in 2002, as well as an area extending from
the Djursland peninsula into the Kattegat; see Fig. 1.3.
The licence was awarded under the Open Door procedure, which is an open
invitation to oil companies to apply for licences for all unlicensed areas east of
6°15’ eastern longitude. As in all other Open Door licences, the state-owned com-
pany DONG Efterforskning og Produktion A/S (DONG E&P A/S) holds a 20%
share of the licence.
AMENDED LICENCESThe outline of licences on the Danish Energy Authority’s website at www.ens.dk
is continually updated and describes all amendments in the form of extended
licence terms, the transfer of licence shares and relinquishments.
L I C E N C E S A N D E X P L O R A T I O N
Fig. 1.3 New and relinquished Open Door licences
New licence
1/99
Relinquishment
Other licences
4/97
5606
6O 15'
1/033/99
1/01
Licence Operator Expiry
Mærsk Olie og Gas AS
DONG E&P A/S
DONG E&P A/S
Table 1.1 Extended licence terms
4/95
6/95
7/95
9/95
4/98
11/98
13/98
15-05-2005
15-05-2005
15-11-2004
01-01-2005
15-06-2006
15-12-2005
14-09-2004
DONG E&P A/S
Mærsk Olie og Gas AS
Phillips PetroleumInt. Corp.
Noble Energy (Europe)Limited
Licences for exploration and production of hydrocarbons are initially granted
for a six-year term. Each licence includes a work programme specifying the
exploration work that the licensee must carry out, including time limits for
conducting the individual seismic surveys and drilling exploration wells.
However, some licences may stipulate that the licensee is obligated to carry
out specific work, such as the drilling of an exploration well, or to relinquish
the licence by a certain date during the six-year term of the licence. After the
initial six-year term, the Danish Energy Authority may extend the term of a
licence by up to two years at a time, provided that the licensee, upon carry-
ing out the entire original work programme, is prepared to undertake addi-
tional exploration commitments.
7/89
2/95
4/95
9/95
11/98
20-12-2003
01-03-2003
15-09-2003
01- 12-2003
31-12-2003
Table 1.2 Partial relinquishment
Licence Operator Relinquished
Amerada Hess ApS
Mærsk Olie og Gas AS
DONG E&P A/S
DONG E&P A/S
DONG E&P A/S
Extended licence termsIn 2003, the Danish Energy Authority granted an extension of the terms of the
licences indicated in Table 1.1. The licence terms were extended on the condition
that the licensees undertake to carry out additional exploration work in the rele-
vant licence areas.
Approved transfersAll contemplated transfers of licences and the relevant transfer conditions must be
submitted to the Danish Energy Authority for approval.
Effective 1 January 2003, Odin Energi A/S increased its 10% share in licence 1/02
by taking over a 5% share from Tethys Oil AB.
Other amendments with regard to licence shares, etc. are mentioned in the out-
line of licences at the Danish Energy Authority’s website.
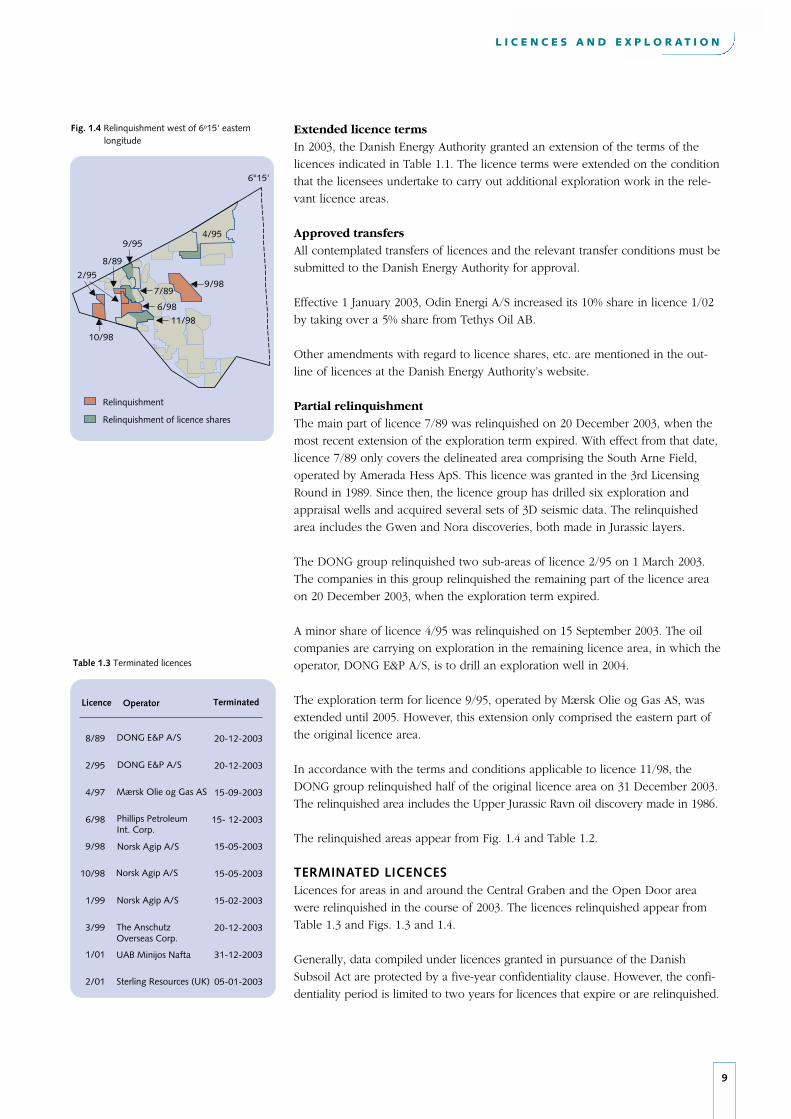
Partial relinquishmentThe main part of licence 7/89 was relinquished on 20 December 2003, when the
most recent extension of the exploration term expired. With effect from that date,
licence 7/89 only covers the delineated area comprising the South Arne Field,
operated by Amerada Hess ApS. This licence was granted in the 3rd Licensing
Round in 1989. Since then, the licence group has drilled six exploration and
appraisal wells and acquired several sets of 3D seismic data. The relinquished
area includes the Gwen and Nora discoveries, both made in Jurassic layers.
The DONG group relinquished two sub-areas of licence 2/95 on 1 March 2003.
The companies in this group relinquished the remaining part of the licence area
on 20 December 2003, when the exploration term expired.
A minor share of licence 4/95 was relinquished on 15 September 2003. The oil
companies are carrying on exploration in the remaining licence area, in which the
operator, DONG E&P A/S, is to drill an exploration well in 2004.
The exploration term for licence 9/95, operated by Mærsk Olie og Gas AS, was
extended until 2005. However, this extension only comprised the eastern part of
the original licence area.
In accordance with the terms and conditions applicable to licence 11/98, the
DONG group relinquished half of the original licence area on 31 December 2003.
The relinquished area includes the Upper Jurassic Ravn oil discovery made in 1986.
The relinquished areas appear from Fig. 1.4 and Table 1.2.
TERMINATED LICENCESLicences for areas in and around the Central Graben and the Open Door area
were relinquished in the course of 2003. The licences relinquished appear from
Table 1.3 and Figs. 1.3 and 1.4.
Generally, data compiled under licences granted in pursuance of the Danish
Subsoil Act are protected by a five-year confidentiality clause. However, the confi-
dentiality period is limited to two years for licences that expire or are relinquished.
9
L I C E N C E S A N D E X P L O R A T I O N
Relinquishment
Relinquishment of licence shares
10/98
2/959/98
11/98
4/95
6/98
9/95
7/89
8/89
6°15'
Fig. 1.4 Relinquishment west of 6o15' easternlongitude
8/89
2/95
4/97
6/98
9/98
10/98
1/99
3/99
1/01
2/01
20-12-2003
20-12-2003
15-09-2003
15- 12-2003
15-05-2003
15-05-2003
15-02-2003
20-12-2003
31-12-2003
05-01-2003
Table 1.3 Terminated licences
Licence Operator Terminated
Mærsk Olie og Gas AS
Norsk Agip A/S
Phillips PetroleumInt. Corp.
DONG E&P A/S
Norsk Agip A/S
Norsk Agip A/S
UAB Minijos Nafta
The AnschutzOverseas Corp.
DONG E&P A/S
Sterling Resources (UK)

10
Once the confidentiality period has expired, other oil companies have an oppor-
tunity to procure data for the exploration wells drilled and extensive 3D seismic
surveys carried out in the relinquished areas. As a result, the companies are better
able to map the subsoil and assess oil exploration potential in the relinquished
areas.
All information about released well data, including seismic surveying data, etc.
acquired in connection with exploration and production activities, is provided by
the Geological Survey of Denmark and Greenland.
EXPLORATORY SURVEYSThe level of activity and the areas where seismic surveys were performed appear
from Figs. 1.5 and 1.7.
In August-September 2003, Denerco Oil A/S carried out a 3D seismic survey in
the Norwegian-Danish Basin, due south of the area comprised by licence 16/98.
In June-July 2003, PGS Petrophysical AS performed a 2D seismic survey in the
Norwegian-Danish Basin. Most of the seismic lines were shot in Norwegian terri-
tory, but several of the lines were extended into Danish territory.
WELLSIn 2003, five exploration wells and five appraisal wells were drilled; see Fig. 1.6.
These statistics include wells spudded in 2003.
The location of the wells described below appears from Fig. 1.8. The appraisal wells
drilled in the producing fields are also shown in the field maps in Appendix B.
An outline of all Danish exploration and appraisal wells is available at the Danish
Energy Authority’s website.
Exploration wellsOlga-1X (5505/21-4) Under licence 5/99, Mærsk Olie og Gas AS drilled the exploration well Olga-1X in
January-June 2003. The licence area is situated due south of the Kraka Field in
the North Sea. Olga-1X was drilled as a vertical well, terminating at a depth of
4,695 metres below sea level. The well encountered the expected Triassic sand-
stone reservoir, but no hydrocarbons were produced in a subsequent production
test.
Jette-1 (5604/29-7)As operator for the oil companies holding licence 7/89, Amerada Hess ApS drilled
the exploration well Jette-1 in cooperation with DONG E&P A/S in April-June
2003. This well was drilled at a position west of the South Arne Field. Jette-1 was
drilled as a vertical well and terminated at a depth of 4,402 metres below sea
level in Triassic layers. The Jette-1 well encountered the expected Upper Jurassic
sandstone reservoir, but no hydrocarbons were discovered.
Sofie-1 (5605/13-3)The Sofie-1 exploration well was drilled about 20 km northeast of the Siri Field.
DONG E&P A/S, the operator for the oil companies holding licence 6/95, drilled
the well in just over 14 days in May 2003. Sofie-1 was drilled as a vertical well,
L I C E N C E S A N D E X P L O R A T I O N
5000
4000
3000
2000
1000
0
8000
6000
4000
2000
0
km km2
10000
Fig. 1.5 Annual seismic surveying activities
2D seismics in km3D seismics in km2
95 97 99 01 03
Fig. 1.6 Exploration and appraisal wells
Exploration wellsAppraisal wells
Number
95 97 01 03990
2
4
6
8
10
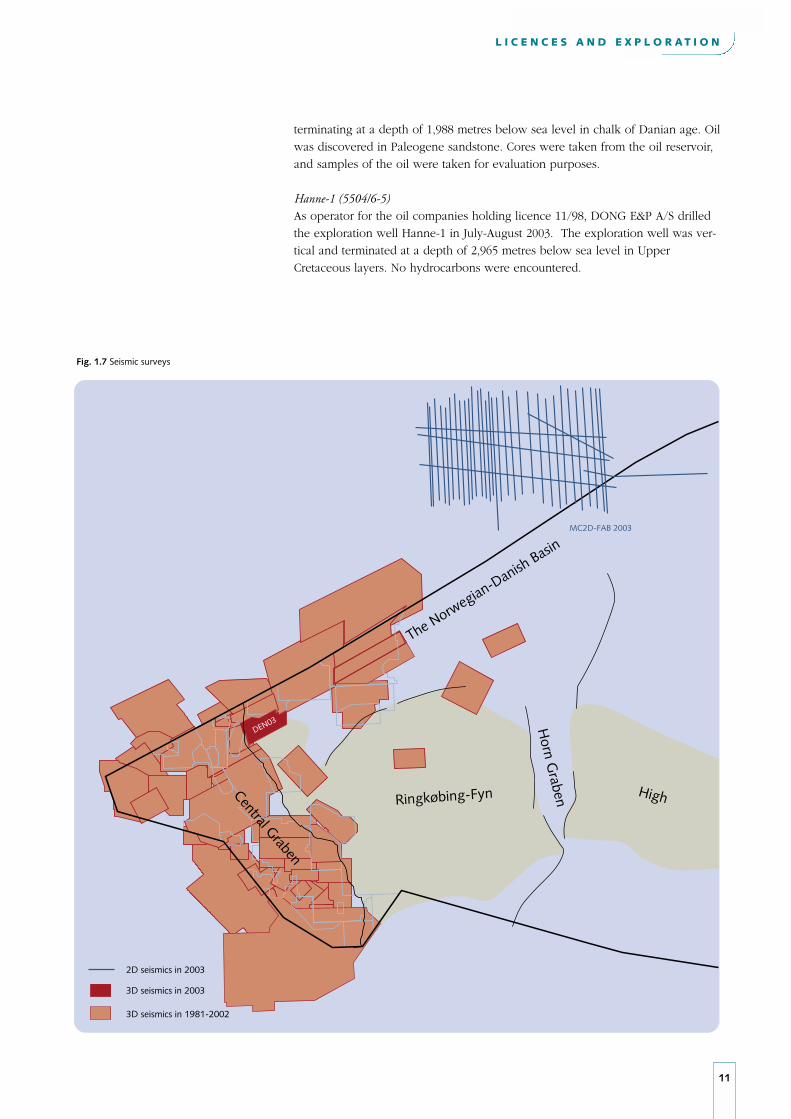
terminating at a depth of 1,988 metres below sea level in chalk of Danian age. Oil
was discovered in Paleogene sandstone. Cores were taken from the oil reservoir,
and samples of the oil were taken for evaluation purposes.
Hanne-1 (5504/6-5)As operator for the oil companies holding licence 11/98, DONG E&P A/S drilled
the exploration well Hanne-1 in July-August 2003. The exploration well was ver-
tical and terminated at a depth of 2,965 metres below sea level in Upper
Cretaceous layers. No hydrocarbons were encountered.
11
L I C E N C E S A N D E X P L O R A T I O N
2D seismics in 2003
3D seismics in 2003
3D seismics in 1981-2002
Fig. 1.7 Seismic surveys
Horn G
rabenRingkøbing-Fyn
The Norwegian-Danish Basin
Central Graben
MC2D-FAB 2003
DEN03
High
12
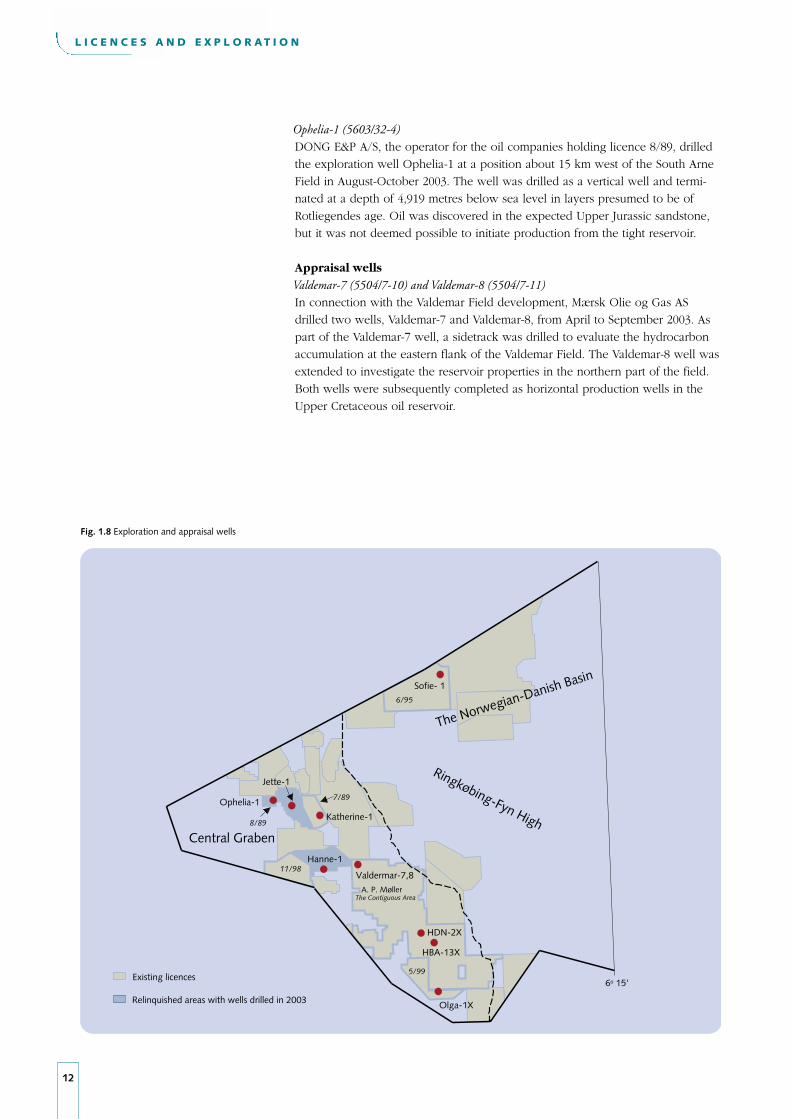
Ophelia-1 (5603/32-4)DONG E&P A/S, the operator for the oil companies holding licence 8/89, drilled
the exploration well Ophelia-1 at a position about 15 km west of the South Arne
Field in August-October 2003. The well was drilled as a vertical well and termi-
nated at a depth of 4,919 metres below sea level in layers presumed to be of
Rotliegendes age. Oil was discovered in the expected Upper Jurassic sandstone,
but it was not deemed possible to initiate production from the tight reservoir.
Appraisal wellsValdemar-7 (5504/7-10) and Valdemar-8 (5504/7-11)In connection with the Valdemar Field development, Mærsk Olie og Gas AS
drilled two wells, Valdemar-7 and Valdemar-8, from April to September 2003. As
part of the Valdemar-7 well, a sidetrack was drilled to evaluate the hydrocarbon
accumulation at the eastern flank of the Valdemar Field. The Valdemar-8 well was
extended to investigate the reservoir properties in the northern part of the field.
Both wells were subsequently completed as horizontal production wells in the
Upper Cretaceous oil reservoir.
L I C E N C E S A N D E X P L O R A T I O N
Fig. 1.8 Exploration and appraisal wells
6o 15'
The Norwegian-Danish Basin
Ringkøbing-Fyn HighCentral Graben
Sofie- 16/95
A. P. MøllerThe Contiguous Area
Valdermar-7,8
8/89
HBA-13X
7/89
Jette-1
Hanne-1
Olga-1X
5/99
11/98
Ophelia-1
Katherine-1
Existing licences
HDN-2X
Relinquished areas with wells drilled in 2003
HBA-13X (5505/13-9)In May-June 2003, Mærsk Olie og Gas AS drilled the HBA-13X appraisal well. This
well was drilled from the HBA platform in the Halfdan Field, where oil and gas
have been discovered in both Danian and Maastrichtian chalk. HBA-13X was
drilled as a horizontal well, penetrating Danian and Maastrichtian layers.
Subsequent test production yielded satisfactory results. This well will be used as a
production well in connection with the planned exploitation of the gas accumula-
tion in the Halfdan and Sif Fields.
HDN-2X (5504/16-10)In September 2003, Mærsk Olie og Gas AS drilled a vertical appraisal well, HDN-
2X. This well provided important information about the extension of hydrocar-
bons in Danian chalk in the northwestern part of the Halfdan Field.
Katherine-1 (5604/30-4)In cooperation with DONG E&P A/S, Amerada Hess ApS drilled the Katherine-1
appraisal well in the South Arne Field in September-December 2003. Katherine-1
was drilled as an almost vertical well in the crestal part of the chalk structure.
Moreover, Katherine-1A, a deviated sidetrack, and Katherine-1B, an almost hori-
zontal sidetrack, penetrated the eastern flank of the field.
All three well sections fulfilled their objectives, encountering oil in both the crest
of the structure and at the eastern flank of the field. The new data will be used
for planning future production wells in the South Arne Field.
Geothermal wellMargretheholm-2 (5512/11-2)As operator for HGS, Hovedstadsområdets Geotermiske Samarbejde (DONG,
Energi E2, CTR, VEKS and Københavns Energi), DONG E&P A/S drilled the
Margretheholm-2 well in June 2003. It was drilled at the Amagerværket power sta-
tion to a depth of 2,750 metres below sea level. The well is not included in the
statistics in Fig. 1.7.
Together with the Margretheholm-1 well, Margretheholm-2 will form part of a
demonstration plant for exploiting geothermal energy. This plant is scheduled for
commissioning in autumn 2004.
13
L I C E N C E S A N D E X P L O R A T I O N

14
Development activity in the Danish sector of the North Sea remained high through-
out 2003.
Production from three new fields commenced during 2003. Two new fields, Nini
and Cecilie came on stream in August 2003, with DONG E&P A/S as operator; see
Fig. 2.1. In spring 2003, platforms and pipelines were installed in the fields, and
by the end of 2003 a total of five development wells had been completed.
Concurrently, production commenced from the Sif Field; see Fig. 2.3. At end-
2003, a production test was carried out in the first well, and permanent produc-
tion from the area will be initiated in the course of 2004. Production will take
place from the installations in the nearby Halfdan Field.
New development wells were also drilled in a number of existing fields in 2003.
A total of 24 development wells were drilled in 2003, corresponding to the level
in preceding years. The number of drilling rigs operating in the Danish sector was
lower than in previous years, as three rigs were used for accommodation purposes
in the Halfdan and Siri Fields.
Fig. 2.2 shows existing production facilities in the Danish sector of the North Sea
at the beginning of 2004.
Appendix B provides a survey of all the producing fields, including factual infor-
mation about the fields and maps. Wells drilled in 2003 are marked with a light
colour on the maps.
NEW FIELD DEVELOPMENTSThe Cecilie FieldThe Cecilie Field, discovered in 2000, is situated in the so-called Siri Fairway in
the northern part of the Danish sector; see Fig. 2.1.
In 2003, the field was developed as an unmanned satellite to the Siri platform.
With the help of the world’s largest crane vessel, Saipem 7000, the Cecilie plat-
form was installed in the summer of 2003, and production from one well com-
menced in August 2003. An additional well was drilled at the beginning of 2004.
Development plans also include the drilling of an injection well, as production
from the field is based on water injection in order to maintain the reservoir pres-
sure. DONG E&P A/S is the operator.
The Siri platform supplies injection water and lift gas to the Cecilie Field, while
the gas produced is injected into the Siri reservoir to enhance recovery from the
Siri Field.
Production from the Cecilie Field is conveyed to the Siri platform for processing,
storage and further transport.
In January 2004, the Danish Energy Authority also received a plan for exploiting
the Connie oil accumulation, located in the Cecilie licence area, by means of the
installations in the Cecilie Field.
D E V E L O P M E N T
2. DEVELOPMENT
Fig. 2.1 Field development in the Siri Fairway
Nini
4/95
Cecilie
16/98Siriplatform

15
D E V E L O P M E N T
DagmarGorm
Harald
South Arne
Roar
Rolf
Tyra
Skjold
Regnar
Kraka
Dan
Valdemar
Siri
9 km
13 km
Svend
Lulita
SiriHarald / Lulita
20 k
m
65 km
Gas (80 km
)
to Fredericia
Oil (330 km)
Gas (235 km)
to Nybro
Svend
11 km
9 km
17 km
Rolf
Dagmar
Skjold
A
BC
Gorm
A
B
CD
E
F
12 km
B
A
to Nybro
Gas (260 km)
Oil pipeline
Pipelines owned by DONG
Gas pipeline
Multi-phase pipeline
Gas
(29
km
)
Fig. 2.2 Production facilities in the North Sea 2003
Valdemar
20 km
11 km
11 km
Roar
3 km
3 km
3 kmTyra West
AD
EB
C
Tyra East
A
B
C
DEF
Halfdan
South Arne
Kraka
D
Regnar
32 km
2 km
A B
C
E Dan
16 k
m
19 km
33 km
26 km
Oil field
Gas field
Tyra Southeast
Tyra Southeast
Halfdan
2 km
HBA
HDA
HDB
HDC
Nini
Cecilie
Nini
Cecilie
FGPlanned
13 km
9 km
13 km
32 km
FC
FB
FD
FA
FE
FF
Dan
3 km
SCA
SCB
A
BPlanned
Pipelines owned 50/50 by DONG and the DUC companies
29 km
Gas
(29
km
)
to N
OG
AT

16
The Nini FieldLike the Cecilie Field, the Nini Field was discovered in 2000. In July 2003, an
unmanned platform was installed by means of the crane vessel Saipem 7000. The
field was brought on stream in August 2003, with DONG E&P A/S as operator.
The field has been developed as a satellite to the Siri Field. Production from the
Nini Field is piped to the Siri platform for processing. The Siri platform supplies
injection water and lift gas to Nini, while the gas produced in the Nini Field is
injected into the Siri reservoir to enhance recovery from the Siri Field.
By the end of 2003, a total of four development wells had been drilled in the
field, three of which have been put into operation. Recovery is based on water
injection.
The Sif FieldThe Sif Field is part of a Danian gas accumulation extending across the Sif, Igor
and Halfdan field delineations.
In 2003, a development plan was approved for the area. The plan involves phased
development, with the first phases consisting of the drilling of development wells
from the existing HBA satellite platform in the Halfdan Field. The platform has
been extended with a gas-processing module. Mærsk Olie og Gas AS is the operator.
Spudded in the summer of 2003, the first well in the area, HBA-13X, reached a
reservoir length of about 4,800 metres, after which the well underwent a produc-
tion test. Temporary processing capacity limitations at the Halfdan platform mean
that permanent production from the Sif Field is not expected to commence until
the summer of 2004.
DEVELOPMENT OF EXISTING FIELDSThe Dan FieldThe Dan Field is the largest Danish field. Although the field has carried on pro-
duction since 1972, potential for further development continues to be found.
In 2001, a development plan was approved for the Dan Field, involving further
development of the western flank towards the Halfdan Field. Of the eight wells
planned, seven had been drilled by the end of 2003, four of them during 2003;
see the field map in Appendix B. At the same time, seven existing wells were
converted to water injection.
Towards the end of 2003, an updated well pattern for the western flank was
approved, which provides for the drilling of four additional wells.
In 2002, a plan to change recovery strategy was approved for the area under the
gas cap in the southeastern block of the field. Previously, production from this
area had been carried out with conventional water injection, i.e. at rates suffi-
ciently low to prevent the injection process from causing the reservoir rock to
fracture. However, as part of the changed recovery strategy, tests with high-rate
water injection have been initiated, which are expected to result in increased
recovery due to fracturing of the reservoir. The test period runs until 1 October
2004.
D E V E L O P M E N T
Fig. 2.3 Development of the Sif Field
Danian gas accumulation
Field delineation
Halfdan
Sif Igor
Halfdanplatform
HBA-13X
A planned, new platform in the field, Dan FG, and the associated bridge module
are to be equipped with new facilities, including a production separation system,
produced-water treatment system, a gas-treatment and compression system and a
water-injection system.
The Halfdan FieldDevelopment of the Halfdan Field continues. The field came on stream in 1999,
and has been developed in three phases to date. The overall development plan
envisages a total of 46 wells, 25 production wells and 21 water-injection wells. In
2003, a total of seven wells were drilled in the field, and an additional three pro-
duction wells were spudded.
As of end-2003, 26 wells were producing, while 13 wells were used for water
injection; see the field map in Appendix B. The injection wells are used for pro-
duction for a period of time before they are converted to water injection; see the
section Development.
In the summer of 2003, a new processing module was also installed on the
Halfdan HDA platform, along with an accommodation platform, HDB, and a flare
stack, HDC. At the same time, receiving facilities for production from the Sif Field
were installed, and a new gas pipeline was established from Halfdan HDA via
Halfdan HBA to Tyra West.
The Rolf FieldProduction in the Rolf Field was suspended for a large part of 2002, because the
Rolf-3 well had to be shut in due to a leak in the production tubing. The shut-in
of the Rolf-3 well caused a temperature drop in the pipeline to the Gorm Field,
which meant that production from Rolf-5, the only producing well in the field,
had to be stopped.
At the beginning of 2003, the Rolf-3 well was redrilled. The redrilled well, Rolf-
3A, targeted the central, southern part of the Rolf Field; see the field map in
Appendix B. The Rolf-3 well drained the Maastrichtian reservoir, whereas the new
well section terminates in the Danian reservoir.
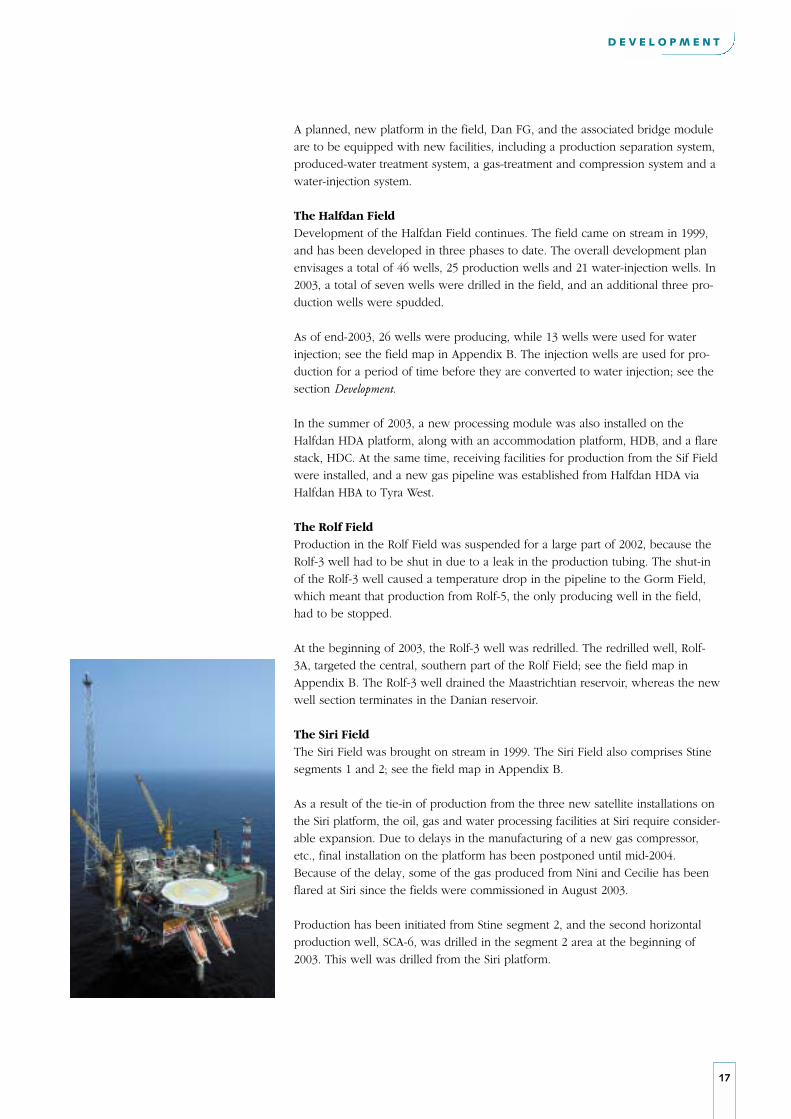
The Siri FieldThe Siri Field was brought on stream in 1999. The Siri Field also comprises Stine
segments 1 and 2; see the field map in Appendix B.
As a result of the tie-in of production from the three new satellite installations on
the Siri platform, the oil, gas and water processing facilities at Siri require consider-
able expansion. Due to delays in the manufacturing of a new gas compressor,
etc., final installation on the platform has been postponed until mid-2004.
Because of the delay, some of the gas produced from Nini and Cecilie has been
flared at Siri since the fields were commissioned in August 2003.
Production has been initiated from Stine segment 2, and the second horizontal
production well, SCA-6, was drilled in the segment 2 area at the beginning of
2003. This well was drilled from the Siri platform.
17
D E V E L O P M E N T

18
Production from Stine segment 1 is expected to commence in 2004. The develop-
ment of segment 1 provides for a subsea installation comprising a production
well and an injection well. A pipeline will convey the production to the Siri plat-
form for processing, storage and further transportation. Moreover, the Siri plat-
form will supply injection water via a branch of the pipeline used for transporting
water to the Nini Field.
The Skjold FieldIn the summer of 2003, a horizontal water-injection well was drilled in the south-
western flank of the Skjold Field; see the field map in Appendix B. The aim is to
increase pressure support in the area.
Moreover, according to the plan, the conversion of a few production wells to
water injection is still outstanding.
The South Arne FieldA development plan for the field from 2001 is still under implementation.
The ongoing phase of the plan involves the drilling of up to nine new wells.
In the spring of 2003, a production well was drilled in the northern part of the
field. During the subsequent break in drilling activity over the summer and
autumn, data acquired from the wells most recently drilled were evaluated. This
evaluation led to the resumption of drilling operations in December 2003.
At the same time, the well pattern planned for the development has been up-
dated. To date, hydrocarbons have been extracted from the Ekofisk formation
through fractures made from production wells in the underlying Tor formation.
But the updated well pattern means that wells are now also planned in the
Ekofisk formation in order to optimize production. The first well drilled since
drilling activity resumed is a dedicated Ekofisk well in the northern part of the
field. Additional development wells are scheduled for drilling in 2004.
At the end of 2003, the exploration and appraisal well Katherine-1 was drilled in
the South Arne Field; see the section Licences and exploration. The well was drilled
as an almost vertical well in the actual ridge of the structure, with sidetracks tar-
geting the eastern flank of the field. The aim was to compile data about the
extent of the oil zone and the production properties of the central and eastern
parts of the field. The new data from the Katherine wells will be used in planning
future production wells in the South Arne Field.
The Tyra Southeast FieldProduction from the Tyra Southeast Field commenced from five wells in 2002,
and a sixth gas production well was drilled in the field in 2003; see the field map
in Appendix B.
In addition, a plan for further developing the field with a seventh well was
approved in 2003. Approval was also granted for an expansion of the existing
water-processing facilities at Tyra East, which also treat the water produced at the
Tyra Southeast Field.
D E V E L O P M E N T

The Valdemar Field, the North Jens areaIn the Valdemar Field, two new wells were drilled in 2003, both terminating in
Upper Cretaceous layers. Appraisal sidetracks penetrating the Lower Cretaceous
reservoir were also drilled as part of these wells.
In November 2003, the Danish Energy Authority received a plan for further devel-
oping the North Jens area in the Valdemar Field. This plan involves major devel-
opment of the Lower Cretaceous reservoir and includes the drilling of eight hori-
zontal production wells. Drilling is expected to commence in mid-2005 from a
new unmanned platform with capacity for 12 wells. This platform will be bridge-
connected to the existing Valdemar A platform. Concurrently, separation facilities
will be established in the Valdemar Field, and the wet gas will be transported
through a new pipeline to Tyra West, while the liquids produced will be trans-
ported through the existing pipeline to Tyra East.
Pipeline for exporting gasA new 26" gas pipeline from Tyra West E to the F/3 platform in the Dutch sector
was established in the autumn of 2003. From there, gas will be conveyed through
the existing NOGAT pipeline to the Netherlands. The pipeline is expected to start
operating in 2004.
The new pipeline, with a capacity of 15 million Nm3 per day, will be owned by
DONG (50%), Shell (23%), A.P. Møller (19.5 %) and Texaco (7.5%) and operated
by Mærsk Olie og Gas AS.
FUTURE FIELDSA number of minor fields, viz. Adda, Alma, Amalie, the Boje area, Elly and Freja,
are expected to undergo development in the coming years.
Details about the fields, including planned commissioning dates, are available
from the Danish Energy Authority’s website at www. ens.dk.
19
D E V E L O P M E N T
NOGAT
A6 Tyra West
F/3
The Netherlands
Fig. 2.4 New pipeline trajectory

20
OIL PRODUCTIONDanish fields in the North Sea produced 21.3 million m3 of oil in 2003. This is 1%
less than in 2002, when Denmark set a production record.
Production from the Halfdan Field increased by a substantial 17% in 2003 com-
pared to 2002, see Fig. 3.1, due to the continued development with new wells.
However, a number of fields recorded declining production in 2003, so the year’s
total production was close to the production figure for 2002.
At end-2003, there were 20 producing oil and gas fields in Denmark. Three minor
fields, Nini, Cecilie and Sif, were brought on stream during the year, see the sec-
tion entitled Development, accounting for 2.6% of total production for the year.
Danish fields have a total of 240 wells from which oil and gas can be produced,
while 113 wells can be used for injecting water and/or gas.
In 2003, ten companies received and sold oil and natural gas from the Danish
fields. Fig. 3.2 shows each company’s percentage contribution to total oil produc-
tion in 2003.
NATURAL GAS PRODUCTIONIn 2003, Danish fields produced 10.21 billion Nm3 of natural gas, of which 2.43
billion Nm3 was reinjected, while 0.65 billion Nm3 was utilized to operate produc-
tion facilities offshore. Moreover, 0.23 billion Nm3 was flared for technical reasons.
The section The Environment provides a detailed description of fuel consumption
and gas flaring offshore.
Thus, 6.90 billion Nm3 of natural gas from the North Sea fields was sold in 2003,
5% less than total gas supplies in 2002.
P R O D U C T I O N
3. PRODUCTION
Fig. 3.1 Oil production from the Halfdan Field
103 m3 per month
0
400
500
200
100
300
0
400
500
200
100
300
Monthly oil production
1999 2000 2001 2002 2003
103 m3 per month
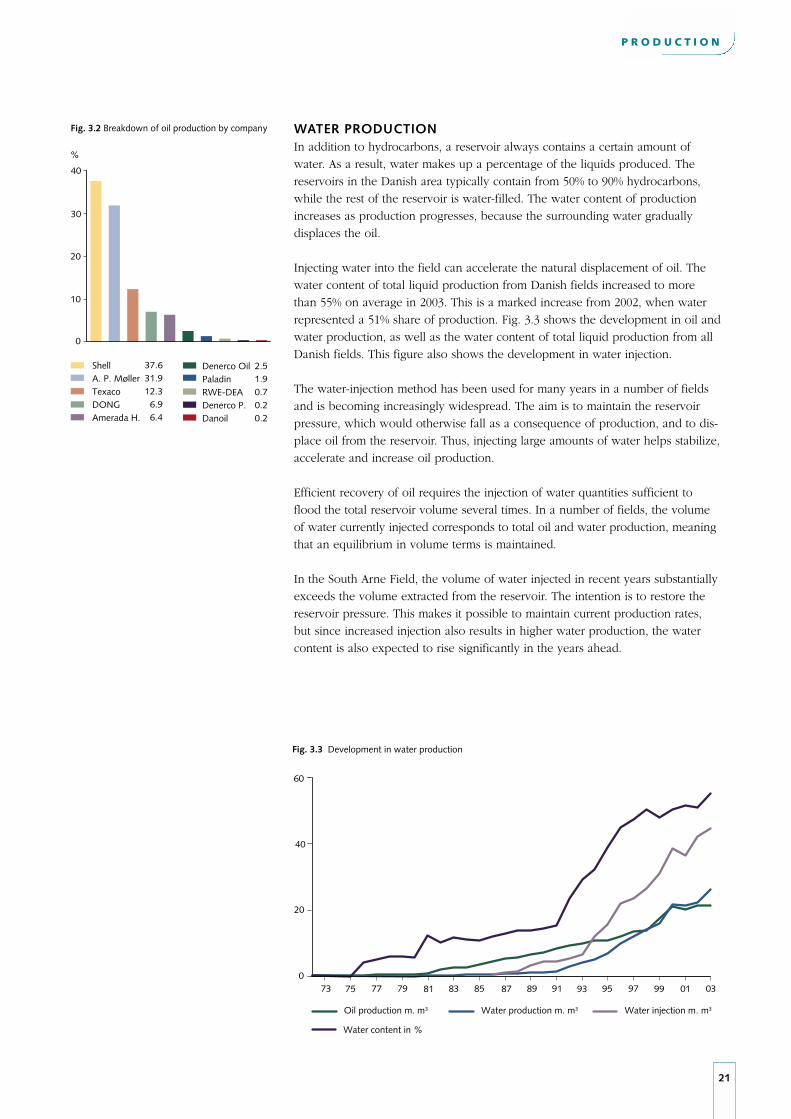
WATER PRODUCTIONIn addition to hydrocarbons, a reservoir always contains a certain amount of
water. As a result, water makes up a percentage of the liquids produced. The
reservoirs in the Danish area typically contain from 50% to 90% hydrocarbons,
while the rest of the reservoir is water-filled. The water content of production
increases as production progresses, because the surrounding water gradually
displaces the oil.
Injecting water into the field can accelerate the natural displacement of oil. The
water content of total liquid production from Danish fields increased to more
than 55% on average in 2003. This is a marked increase from 2002, when water
represented a 51% share of production. Fig. 3.3 shows the development in oil and
water production, as well as the water content of total liquid production from all
Danish fields. This figure also shows the development in water injection.
The water-injection method has been used for many years in a number of fields
and is becoming increasingly widespread. The aim is to maintain the reservoir
pressure, which would otherwise fall as a consequence of production, and to dis-
place oil from the reservoir. Thus, injecting large amounts of water helps stabilize,
accelerate and increase oil production.
Efficient recovery of oil requires the injection of water quantities sufficient to
flood the total reservoir volume several times. In a number of fields, the volume
of water currently injected corresponds to total oil and water production, meaning
that an equilibrium in volume terms is maintained.
In the South Arne Field, the volume of water injected in recent years substantially
exceeds the volume extracted from the reservoir. The intention is to restore the
reservoir pressure. This makes it possible to maintain current production rates,
but since increased injection also results in higher water production, the water
content is also expected to rise significantly in the years ahead.
21
P R O D U C T I O N
Oil production m. m3
60
40
20
073 75 77 79 81 83 85 87 89 91 93 95 97 99 01 03
Fig. 3.3 Development in water production
Water production m. m3 Water injection m. m3
Water content in %
Fig. 3.2 Breakdown of oil production by company
Shell A. P. MøllerTexaco DONGAmerada H.
37.631.912.36.96.4
40
30
20
10
0
%
2.51.90.7
0.20.2
Denerco Oil Paladin RWE-DEA Denerco P.Danoil

22
The water content of oil production from new wells is generally low at the outset.
Oil production will then gradually decline, and the water content increases in
step with the oil being produced. In an oil field where pressure support has been
established by means of water injection, the high production rate can be main-
tained for a longer period of time. However, at some point, water injection will
result in a substantially higher water content.
PRODUCING FIELDSDanish oil production started in 1972 and was augmented as an increasing num-
ber of fields began producing; see Fig. 3.5. In the second half of 2003, another
three minor fields came on stream, Nini, Cecilie and Sif. However, production
from the Sif Field was limited to short-term test production. Once the installation
of processing equipment on the Halfdan platform has been completed, regular
production from the Sif Field can commence.
Appendix A shows figures for the production of oil and gas from the individual
fields. Appendix A also provides figures for water production and injection, fuel
consumption and gas flaring and gas injection, as well as a table of CO2 emissions
from the North Sea installations. Annual production figures since 1972 can be
obtained from the Danish Energy Authority’s website www.ens.dk.
P R O D U C T I O N
6o 15'
Producing oil field
Producing gas field
Commercial oil field
Commercial gas field
Field delineation
Fig. 3.4 Danish oil and gas fields
Amalie
Siri
Lulita
SvendFreja
South Arne
Valdemar
Boje area
EllyRoar
Adda
Tyra
Tyra SoutheastRolf
Gorm
SkjoldDan
IgorSifHalfdan
Alma
Regnar
Nini
Cecilie
Harald
Dagmar
Kraka
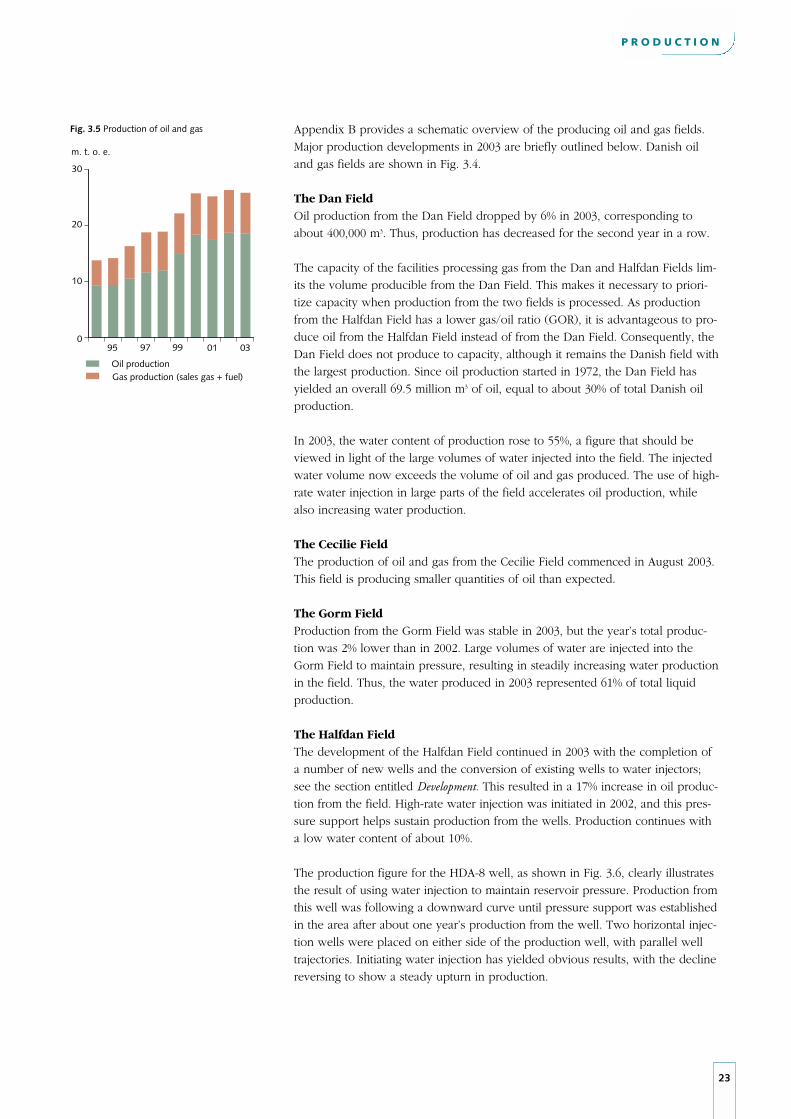
Appendix B provides a schematic overview of the producing oil and gas fields.
Major production developments in 2003 are briefly outlined below. Danish oil
and gas fields are shown in Fig. 3.4.
The Dan FieldOil production from the Dan Field dropped by 6% in 2003, corresponding to
about 400,000 m3. Thus, production has decreased for the second year in a row.
The capacity of the facilities processing gas from the Dan and Halfdan Fields lim-
its the volume producible from the Dan Field. This makes it necessary to priori-
tize capacity when production from the two fields is processed. As production
from the Halfdan Field has a lower gas/oil ratio (GOR), it is advantageous to pro-
duce oil from the Halfdan Field instead of from the Dan Field. Consequently, the
Dan Field does not produce to capacity, although it remains the Danish field with
the largest production. Since oil production started in 1972, the Dan Field has
yielded an overall 69.5 million m3 of oil, equal to about 30% of total Danish oil
production.
In 2003, the water content of production rose to 55%, a figure that should be
viewed in light of the large volumes of water injected into the field. The injected
water volume now exceeds the volume of oil and gas produced. The use of high-
rate water injection in large parts of the field accelerates oil production, while
also increasing water production.
The Cecilie FieldThe production of oil and gas from the Cecilie Field commenced in August 2003.
This field is producing smaller quantities of oil than expected.
The Gorm FieldProduction from the Gorm Field was stable in 2003, but the year’s total produc-
tion was 2% lower than in 2002. Large volumes of water are injected into the
Gorm Field to maintain pressure, resulting in steadily increasing water production
in the field. Thus, the water produced in 2003 represented 61% of total liquid
production.
The Halfdan FieldThe development of the Halfdan Field continued in 2003 with the completion of
a number of new wells and the conversion of existing wells to water injectors;
see the section entitled Development. This resulted in a 17% increase in oil produc-
tion from the field. High-rate water injection was initiated in 2002, and this pres-
sure support helps sustain production from the wells. Production continues with
a low water content of about 10%.
The production figure for the HDA-8 well, as shown in Fig. 3.6, clearly illustrates
the result of using water injection to maintain reservoir pressure. Production from
this well was following a downward curve until pressure support was established
in the area after about one year’s production from the well. Two horizontal injec-
tion wells were placed on either side of the production well, with parallel well
trajectories. Initiating water injection has yielded obvious results, with the decline
reversing to show a steady upturn in production.
23
P R O D U C T I O N
m. t. o. e.
30
20
10
095 97 99 01 03
Oil productionGas production (sales gas + fuel)
Fig. 3.5 Production of oil and gas

24
The development of the Halfdan Field is based on Fracture Aligned Sweep
Technology, termed FAST by the operator, Mærsk Olie og Gas AS. The FAST tech-
nology involves drilling a pattern of alternating production and injection wells
with long, parallel well trajectories. Future water injectors will first be used for
production in order to benefit from high initial production rates and to reduce the
reservoir pressure. Water is subsequently injected at low pressure. During this
process, a parallel pattern of high- and low-pressure zones is established, which
affects the principal stress directions in the reservoir rock, causing the minimum
principal stress to run perpendicular to the wells.
Once the water-injection pressure is increased, the source rock fractures along the
well trajectory, thus allowing an almost free flow of water into the fractures. This
generates a continuous water front along the entire length of the well, which drives
the oil in the direction of the production wells. This displaces the oil effectively
and relatively swiftly. The disadvantage of this method is that, at some point, it
will cause a rapid increase in water production, once the water front has reached
the production wells.
To some extent, production from the Halfdan Field is limited by the capacity of
production facilities in the Dan and Gorm Fields, which handle the Halfdan pro-
duction. The Halfdan installations are used to separate the hydrocarbons pro-
duced. After separation, the gas is conveyed to the Dan Field processing facilities,
while the oil from Halfdan is transported to the Gorm Field facilities for further
processing. This practice will be discontinued upon the commissioning of the
processing facilities in the Halfdan Field.
The Nini FieldThe production of oil and gas from the Nini Field was initiated in August 2003.
This field is producing larger quantities of oil than expected.
The Rolf FieldProduction from the Rolf Field increased considerably once the Rolf-3 well had
been redrilled. Thus, oil production in 2003 exceeded the volumes produced from
Rolf in 2001 and 2002 together. However, the Rolf Field remains a minor Danish
oil field.
The Siri FieldThe Siri Field produces oil and gas from sandstone layers, with the combined
injection of gas and water providing pressure support. Oil production declined by
38% in 2003, and the water content of production rose from 67% to 76% in 2003.
Extensive installation works were carried out in the Siri Field in 2003 as a result of
the tie-in of the Nini and Cecilie Fields. These installation works involved a number
of planned shutdowns of the processing facilities.
Moreover, the Nini and Cecilie Fields began producing in August 2003, before the
expansion of the platform processing facilities had been completed. The installa-
tion of a new gas compressor and other equipment in the field is not expected to
be completed until mid-2004.
To provide capacity for processing the gas from Nini and Cecilie, the production
from Siri and Stine segment 2 was reduced considerably. This reduction was carried
out to limit the extent of temporary gas flaring on the Siri platform.
P R O D U C T I O N
Fig. 3.6 Oil production from HDA-8
m3 per month
2000
1500
1000
500
0200320022001
Cumulative voidage
Oil production per month
1000
800
600
400
200
0
103 reservoir m3

The Skjold FieldOil production from the Skjold Field fell by 8% in 2003, in keeping with the trend
from previous years. At the same time, water production continued to rise in
2003, the water content of production from Skjold now totalling 70%.
The South Arne FieldOil production from the South Arne Field went up by 3% in 2003, due to the drilling
of one new production well in the field. Moreover, water is injected at a very high
rate. Thus, the amount of water injected is now almost double the total amount of
liquids produced. Water production is more than twice as high as in the preceding
year, now representing 26% of total liquid production.
The Tyra Southeast FieldAfter the field came on stream in March 2002, production decreased by 31% in
2003 compared to the year before. Water production has climbed substantially
and now accounts for 63% of the liquid production.
The Valdemar FieldTwo new wells were drilled in the Valdemar Field in 2003 to supplement the two
successful production wells drilled in 2002. These wells have contributed to the
23% growth in oil production. Natural water production in the field remained stable
in 2003 because of the new wells, which produce oil with a lower water content
than average. A development plan for the Valdemar Field provides for the drilling
of eight new wells in the Lower Cretaceous reservoir.
25
P R O D U C T I O N
26
T H E E N V I R O N M E N T
4. THE ENVIRONMENT
CO2 ALLOWANCE TRADINGAn EU Directive on a proposed scheme for greenhouse gas allowance trading
was adopted in October 2003 as part of the duty of EU countries to meet the Kyoto
Protocol targets for reducing greenhouse gas emissions. Initially covering CO2emissions only, the Directive will be implemented in Denmark by an Act on CO2allowances to become effective on 1 January 2005.
The Directive means that a number of enterprises carrying out activities comprised
by the Directive must turn in allowances corresponding to their CO2 emissions
for the year. The activities falling under the new Act account for the equivalent of
half all Danish CO2 emissions in 2003. Energy consumption for generating elec-
tricity, power and heating in connection with oil and gas production and gas flar-
ing is one of the activities covered by the allowance system. In Danish territory,
installations in seven fields will be comprised by the allowance system.
In the Danish Bill for implementation of the Directive, the principle for allocating
allowances to oil and gas production companies corresponds to the principles used
for other Danish industries. For most types of production, energy consumption
based on a given technology is proportionate to the size of production. In con-
trast, the energy consumption per t.o.e. increases over the lifespan of an oil or
gas field due to natural conditions. Under this allocation model, oil companies are
not compensated for this difference.
According to the Bill presented, allowances representing the emission of 2.3 mil-
lion tons of CO2 per year will be granted to oil and gas production companies. In
addition, companies establishing new installations can apply for additional
allowances from a pool. The new Act is expected to result in a 7.4% reduction of
CO2 emissions compared to the emissions expected if no measures had been
taken. To meet the target set for 2008-12, the allocation of allowances will be
reduced starting in 2008. How the individual activities will contribute to this
reduction will be decided in 2006.
The Danish Energy Authority expects that it will be possible to modify some of
the offshore installations to reduce CO2 emissions, with the activities continuing
unchanged. However, it is less probable that the sector overall will be able to
carry out sufficient reductions so that the purchase of additional allowances can
be avoided. Therefore, the Danish Energy Authority will follow the measures
taken by oil companies to reduce CO2 emissions.
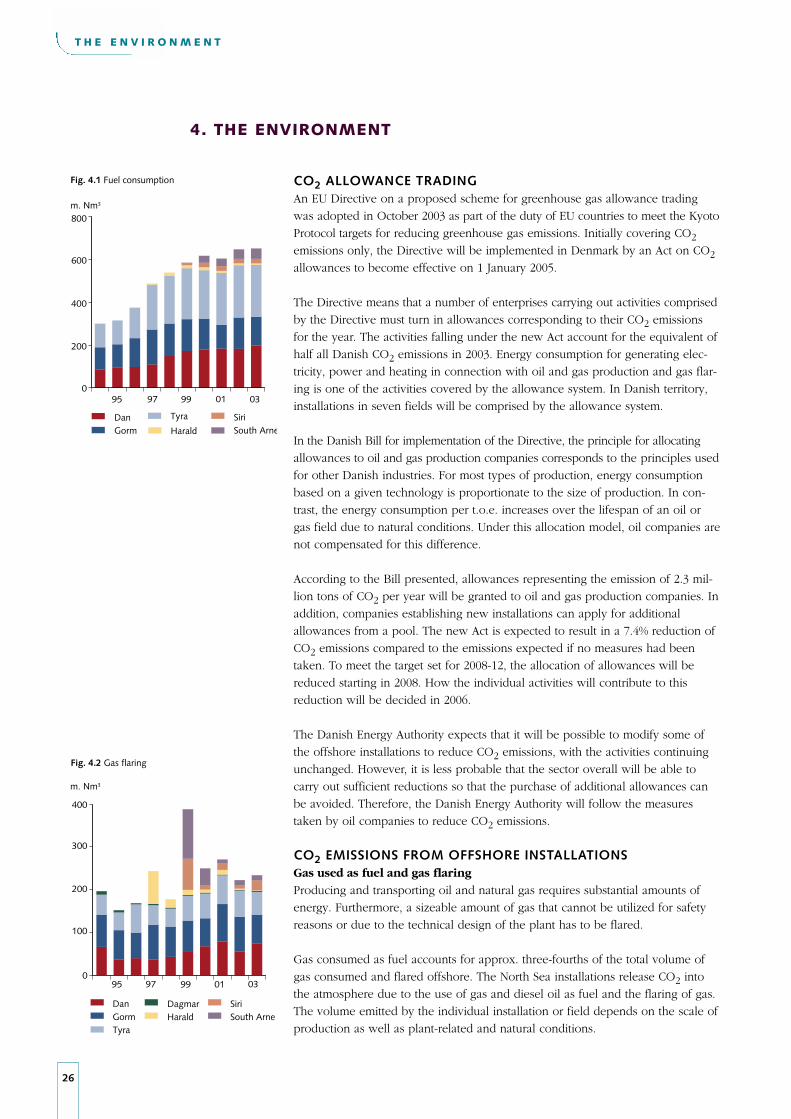
CO2 EMISSIONS FROM OFFSHORE INSTALLATIONSGas used as fuel and gas flaringProducing and transporting oil and natural gas requires substantial amounts of
energy. Furthermore, a sizeable amount of gas that cannot be utilized for safety
reasons or due to the technical design of the plant has to be flared.
Gas consumed as fuel accounts for approx. three-fourths of the total volume of
gas consumed and flared offshore. The North Sea installations release CO2 into
the atmosphere due to the use of gas and diesel oil as fuel and the flaring of gas.
The volume emitted by the individual installation or field depends on the scale of
production as well as plant-related and natural conditions.
SiriSouth Arne
DanGormTyra
DagmarHarald
m. Nm3
400
300
200
100
095 97 99 01 03
Fig. 4.2 Gas flaring
m. Nm3
95 97 99 01 03
Fig. 4.1 Fuel consumption
600
400
200
0
800
HaraldDanGorm
Tyra SiriSouth Arne

27
T H E E N V I R O N M E N T
Figs. 4.1 and 4.2 show the amounts of gas used as fuel in the processing facilities
and the gas flared in the past ten years. It appears from these figures that rising
production and the general ageing of the fields have caused the use of gas as fuel
to increase considerably on the Danish production facilities during the past decade.
From 2002 to 2003, the amounts of gas flared increased slightly by some 12 million
Nm3, or about 5%. The DUC fields recorded a minor reduction in total gas flaring,
but there were major variations among the individual processing centres.
In 2003, gas flaring in the South Arne Field remained at the same low level as the
year before, while flaring in the Siri Field increased significantly compared to the
period 2000-2002. This increase is mainly attributable to the tie-in of production
from the Nini and Cecilie Fields on the Siri platform. Extraordinary amounts of
gas had to be flared due to a delay in the expansion of the processing facilities
on the Siri platform.
CO2 emissions in 2003The development in the emission of CO2 from the North Sea production facilities
since 1994 appears from Fig. 4.3. This figure shows that CO2 emissions totalled
about 2.1 million tons in 2003, virtually the same as in the period 2000-2002. The
production facilities in the North Sea account for 3-4% of total CO2 emissions in
Denmark.
Fig. 4.4 shows the past ten years’ development in CO2 emissions associated with
the consumption of fuel, relative to the volume of hydrocarbons produced.
It appears from this figure that CO2 emissions due to fuel consumption have gen-
erally increased relative to the size of production, from about 50,000 tons of CO2per million t.o.e. to about 60,000 tons of CO2 per million t.o.e. over the past
decade. One reason is the rising average age of the Danish fields. Energy con-
sumption per produced t.o.e. increases over the life of a field due to natural condi-
tions.
Fig. 4.5 shows that emissions of CO2 from gas flaring relative to the size of produc-
tion have declined steadily since the early 1990s, except in 1997 and 1999 when the
commissioning of the Harald, Siri and South Arne Fields resulted in extraordinary
amounts of gas being flared temporarily. Both in 2002 and 2003, gas flaring relative
to the volume of production reached the lowest level recorded in the past decade.
Compared to other North Sea countries and the scale of production, the Danish
sector has relatively many production facilities. All things being equal, this limits
the possibility to improve energy efficiency, thus increasing the CO2 emission per
produced t. o. e. However, the choice of technical equipment also plays a pivotal
role for the energy efficiency of the facilities and the need for flaring. The intro-
duction of CO2 allowances as part of the overall climate strategy underscores the
need to continue improving energy efficiency and reducing gas flaring at the
North Sea production facilities.
Appendix A includes a table of the amounts of gas used annually as fuel at the
individual production centres, the amounts of gas flared annually and calculated
CO2 emissions. In this connection, it should be noted that the figures indicated
have undergone minor corrections compared to previous years. The most signifi-
103 tons CO2
95 97 99 01 03
1500
1000
500
0
2000
2500
Fuel (gas)Gas flared
in the North Sea
Fig. 4.3 CO2 emissions from production facilities
103 tons CO2
80
60
40
20
095 97 99 01 03
Fuel
Fig. 4.4 CO2 emissions from consumption of fuel per m. t.o.e.

cant correction concerns the calorific value of the gas produced in the South Arne
Field, resulting in an upward adjustment of 75% compared to previous years. The
table does not include CO2 emissions deriving from the consumption of diesel oil
at the production facilities.
DISCHARGES INTO THE SEAA range of chemicals is needed for the work of exploring and exploiting North
Sea oil and gas reservoirs. These chemicals may occur naturally or be manufac-
tured with special properties, and they must be used with due consideration for
the working environment and the impact on the surrounding environment. The
same applies to products extracted from the subsoil, i.e. hydrocarbons and any
natural substances associated with hydrocarbons.
Substances extracted from the subsoil are generally handled in closed systems,
while the chemicals used are transported from land and added to the processes.
Residual products from production are transported to shore for processing, re-
cycling or waste disposal or are discharged at the site, depending on the environ-
mental assessments made.
The Danish Energy Authority supervises the storage and use of chemicals in the
working environment on drilling rigs and production facilities in the Danish sector
of the North Sea, while the Danish Environmental Protection Agency supervises
the impact of chemicals on the surrounding environment. The two authorities work
together to regulate this area.
The Danish Environmental Protection Agency grants permission for marine discharges
based on various requirements, including those laid down in international coop-
eration with the other North Sea countries. This cooperation takes place under
the auspices of the Oslo-Paris convention from 1992 (OSPAR), which entered into
force in 1998. The OSPAR Offshore Industry Committee (OIC) deals with conditions off-
shore. At the same time, international efforts to formulate an EU strategy for the
marine environment are ongoing.
OIC’s current work includes establishing environmental goals for marine discharges
of chemicals from drilling operations and production activities, as well as imple-
menting these goals. Moreover, the work on goals and requirements for the dis-
charge of oil with produced water continues.
At its most recent meeting in March 2004, OIC decided to implement programmes
to measure the content of dissolved, light oil components in water discharged
from production platforms, as well as the content of natural oil in cuttings from
drilling operations in reservoir layers. This initiative was taken to evaluate the
need for supplementing the existing requirements for the discharge of dispersed
oil (oil droplets) and the total discharge of oil. The work on chemicals currently
concentrates on identifying the chemicals used, introducing a harmonized en-
vironmental hazard classification and determining the quantities used.
The OSPAR activities include work on long-term generation goals for 2020, and a
number of recommendations have been adopted to meet them. As a result, in 2006
the concentration of dispersed oil is to be reduced from 40 mg per litre to 30 mg per
litre in discharged, treated production water. At the same time, the total discharge of
oil into the sea is to be reduced by 15% compared to the amount discharged in 2000.
28
T H E E N V I R O N M E N T
103 tons CO2
80
60
40
20
095 97 99 01 03
Gas flared
Fig. 4.5 CO2 emissions from gas flaringper m. t.o.e.
EIA for offshore activities
Approval of new offshore oil and
gas development activities or
major alterations to existing facili-
ties require an evaluation of how
the planned activities will affect
the environment, a so-called
Environmental Impact Assessment
(EIA).
In 2003, no new Environmental
Impact Assessments were prepared
in connection with oil and gas
development activities in the
North Sea. All of the development
activities approved by the Danish
Energy Authority during the year
were covered by previously pre-
pared EIAs that have been sub-
mitted to public hearings.
In this connection, reference is
made to previous editions of "Oil
and Gas Production in Denmark".

The high level of exploration and development activity in the Danish sector of
the North Sea increased the focus on safety on offshore installations and the need
for temporary accommodation in conjunction with the fixed offshore installations.
It also resulted in increased transport to and from the individual installations.
In November 2002, the Government presented an action plan on the safety of oil
and gas activities in the Danish sector of the North Sea. As part of implementing
the action plan in 2003, the Danish Energy Authority increased its inspection
activity and focus on the oil companies’ efforts to improve safety and the working
environment on oil and gas offshore installations.
ACTION PLAN In May 2001, a gas explosion in the Gorm Field injured two persons and caused
an oil production loss of more than DKK 1 billion; see the report "Oil and Gas
Production in Denmark 2001".
At the Danish Energy Authority’s request, the Norwegian SINTEF institute investi-
gated safety conditions in the Gorm Field in 2002. Based on SINTEF’s report, the
Government presented an action plan in November 2002 with measures regarding
safety on board the North Sea installations. The action plan underscores that safety
standards on Danish offshore installations must continue to rank among the highest
in the North Sea countries, and that safety may not be disregarded due to other
interests.
In 2003, the Danish Energy Authority focused on implementing the seven initia-
tives set out in the action plan. The Danish Energy Authority believes that the
action plan has contributed to maintaining the high level of health and safety on
the installations in the Danish sector of the North Sea.
Information about the action plan is available in Danish at the Danish Energy
Authority’s website www.ens.dk, including reports on the individual elements of
the action plan, outlines of inspections carried out in 2003, and a comprehensive
statement to the Energy Policy Committee of the Danish Parliament on the imple-
mentation of the action plan.
Elements of the action planThe action plan involved stepped-up inspection activity. In 2003, the Danish
Energy Authority carried out 31 offshore inspections on fixed and mobile offshore
units and seven onshore inspections, including reviews of information about the
North Sea facilities on file at the oil companies’ offices.
At the inspections, the Danish Energy Authority evaluated the oil companies’
follow-up of the safety recommendations made by SINTEF, and found no major
safety lapses.
The frequency of inspections at manned production installations will be stepped
up starting in 2004, averaging once every eight months compared to about every
15 months in 2002 and prior to that.
29
H E A LT H A N D S A F E T Y
5. HEALTH AND SAFETY
30
As part of the action plan, the Danish Energy Authority conducted an audit of the
North Sea operators’ safety management and similar control systems in 2003. The aim
of these systems is to ensure and document compliance with the statutory require-
ments for health and safety on the North Sea installations. The audit showed that the
companies’ safety management systems generally meet statutory requirements.
Safety cases must be prepared for all offshore installations to describe and document
safety conditions on board. Safety cases include an assessment of the risks of major
accidents and a description of the measures taken to minimize these risks. A review
of the safety cases for all fixed offshore installations made in autumn 2003 showed
that the safety cases are largely in compliance with statutory requirements.
Using information on injuries and "Near-miss" occurrences is an important element
in preventing accidents and injuries. A review of the oil companies’ registration
and follow-up of "Near-miss" occurrences in 2003 showed that on the whole the
companies attempt to investigate underlying causes and are alert to the need for
technical improvements or changes in procedures, for example.
As part of the action plan, efforts are ongoing to update health and safety rules
and improve their efficiency, including updating the Danish Energy Authority’s
guidelines for the design of fixed offshore installations. A new Offshore
Installations Act is also being drafted.
Measuring the effectThe intensified efforts regarding inspections as well as other types of supervision
will be continued in the years ahead. The Danish Energy Authority is working on
a new initiative to develop indicators to measure the effect of supervision. In
2004, the Danish Energy Authority will attempt to establish a basis for developing
measures of effect in the following areas:
Simplifying regulationsThe existing set of regulations, developed since the Offshore Installations Act
entered into force on 1 January 1982, has become increasingly impenetrable for
users, i.e. companies and employees in the offshore oil and gas industry. The
administration of these rules has also become relatively complex from the point
of view of users as well as the authorities.
In 2002, a working group under the Coordination Committee on Offshore
Installations began mapping existing legislation. The Committee is composed of
representatives of the two sides of industry and the public authorities involved.
The Committee assists the Danish Energy Authority in coordinating the supervisory
authorities’ work and drafting rules.
H E A LT H A N D S A F E T Y
• Inspection of fixed, manned offshore installations
• Prevention of gas leaks
• Visibility and perceived effect of the Danish Energy Authority’s inspec-
tions (Questionnaire survey conducted offshore in 2004)
• Prevention of work-related accidents
• Maintenance of safety-critical equipment
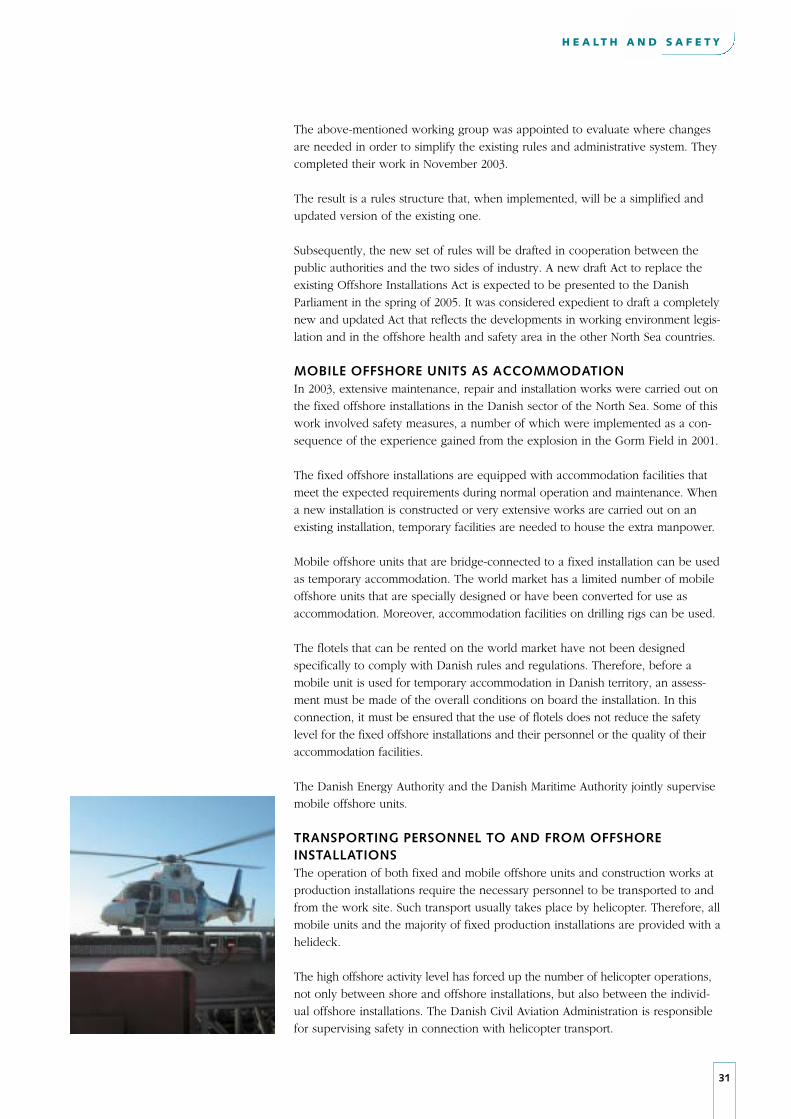
The above-mentioned working group was appointed to evaluate where changes
are needed in order to simplify the existing rules and administrative system. They
completed their work in November 2003.
The result is a rules structure that, when implemented, will be a simplified and
updated version of the existing one.
Subsequently, the new set of rules will be drafted in cooperation between the
public authorities and the two sides of industry. A new draft Act to replace the
existing Offshore Installations Act is expected to be presented to the Danish
Parliament in the spring of 2005. It was considered expedient to draft a completely
new and updated Act that reflects the developments in working environment legis-
lation and in the offshore health and safety area in the other North Sea countries.
MOBILE OFFSHORE UNITS AS ACCOMMODATIONIn 2003, extensive maintenance, repair and installation works were carried out on
the fixed offshore installations in the Danish sector of the North Sea. Some of this
work involved safety measures, a number of which were implemented as a con-
sequence of the experience gained from the explosion in the Gorm Field in 2001.
The fixed offshore installations are equipped with accommodation facilities that
meet the expected requirements during normal operation and maintenance. When
a new installation is constructed or very extensive works are carried out on an
existing installation, temporary facilities are needed to house the extra manpower.
Mobile offshore units that are bridge-connected to a fixed installation can be used
as temporary accommodation. The world market has a limited number of mobile
offshore units that are specially designed or have been converted for use as
accommodation. Moreover, accommodation facilities on drilling rigs can be used.
The flotels that can be rented on the world market have not been designed
specifically to comply with Danish rules and regulations. Therefore, before a
mobile unit is used for temporary accommodation in Danish territory, an assess-
ment must be made of the overall conditions on board the installation. In this
connection, it must be ensured that the use of flotels does not reduce the safety
level for the fixed offshore installations and their personnel or the quality of their
accommodation facilities.
The Danish Energy Authority and the Danish Maritime Authority jointly supervise
mobile offshore units.
TRANSPORTING PERSONNEL TO AND FROM OFFSHORE INSTALLATIONSThe operation of both fixed and mobile offshore units and construction works at
production installations require the necessary personnel to be transported to and
from the work site. Such transport usually takes place by helicopter. Therefore, all
mobile units and the majority of fixed production installations are provided with a
helideck.
The high offshore activity level has forced up the number of helicopter operations,
not only between shore and offshore installations, but also between the individ-
ual offshore installations. The Danish Civil Aviation Administration is responsible
for supervising safety in connection with helicopter transport.
31
H E A LT H A N D S A F E T Y
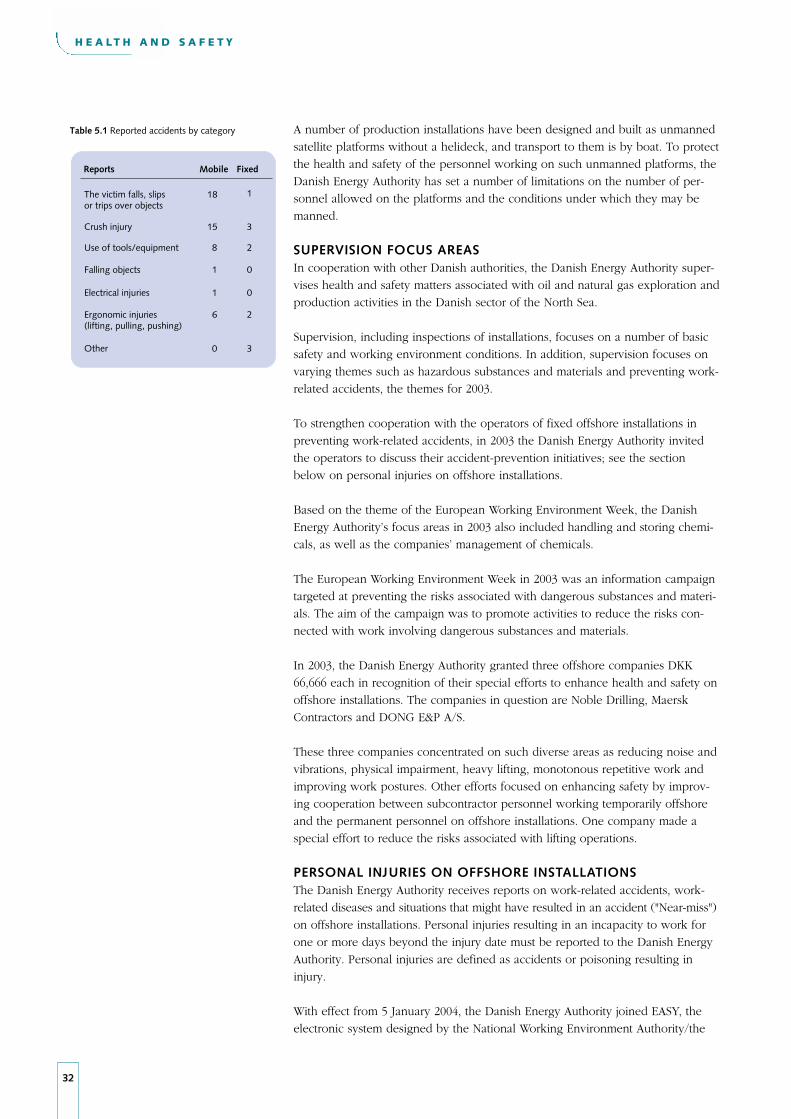
32
A number of production installations have been designed and built as unmanned
satellite platforms without a helideck, and transport to them is by boat. To protect
the health and safety of the personnel working on such unmanned platforms, the
Danish Energy Authority has set a number of limitations on the number of per-
sonnel allowed on the platforms and the conditions under which they may be
manned.
SUPERVISION FOCUS AREAS In cooperation with other Danish authorities, the Danish Energy Authority super-
vises health and safety matters associated with oil and natural gas exploration and
production activities in the Danish sector of the North Sea.
Supervision, including inspections of installations, focuses on a number of basic
safety and working environment conditions. In addition, supervision focuses on
varying themes such as hazardous substances and materials and preventing work-
related accidents, the themes for 2003.
To strengthen cooperation with the operators of fixed offshore installations in
preventing work-related accidents, in 2003 the Danish Energy Authority invited
the operators to discuss their accident-prevention initiatives; see the section
below on personal injuries on offshore installations.
Based on the theme of the European Working Environment Week, the Danish
Energy Authority’s focus areas in 2003 also included handling and storing chemi-
cals, as well as the companies’ management of chemicals.
The European Working Environment Week in 2003 was an information campaign
targeted at preventing the risks associated with dangerous substances and materi-
als. The aim of the campaign was to promote activities to reduce the risks con-
nected with work involving dangerous substances and materials.
In 2003, the Danish Energy Authority granted three offshore companies DKK
66,666 each in recognition of their special efforts to enhance health and safety on
offshore installations. The companies in question are Noble Drilling, Maersk
Contractors and DONG E&P A/S.
These three companies concentrated on such diverse areas as reducing noise and
vibrations, physical impairment, heavy lifting, monotonous repetitive work and
improving work postures. Other efforts focused on enhancing safety by improv-
ing cooperation between subcontractor personnel working temporarily offshore
and the permanent personnel on offshore installations. One company made a
special effort to reduce the risks associated with lifting operations.
PERSONAL INJURIES ON OFFSHORE INSTALLATIONSThe Danish Energy Authority receives reports on work-related accidents, work-
related diseases and situations that might have resulted in an accident ("Near-miss")
on offshore installations. Personal injuries resulting in an incapacity to work for
one or more days beyond the injury date must be reported to the Danish Energy
Authority. Personal injuries are defined as accidents or poisoning resulting in
injury.
With effect from 5 January 2004, the Danish Energy Authority joined EASY, the
electronic system designed by the National Working Environment Authority/the
H E A LT H A N D S A F E T Y
Reports Mobile Fixed
The victim falls, slipsor trips over objects
Crush injury
Use of tools/equipment
Falling objects
Electrical injuries
Ergonomic injuries(lifting, pulling, pushing)
Other
18
15
8
1
1
6
1
3
2
0
0
2
3
Table 5.1 Reported accidents by category
0

National Board of Injuries for reporting work-related accidents. The EASY elec-
tronic reporting system can be used for more systematic accident prevention, as
the system also includes information about accidents on board the offshore instal-
lations, detailed descriptions of such accidents, and follow-up forms for use by
safety committees on the offshore installations. Work-related accidents offshore can
be reported via the Danish Energy Authority’s website, which has a link to EASY.
Work-related accidentsIn 2003, the Danish Energy Authority received 60 reports on work-related acci-
dents, of which 49 occurred in connection with operation, maintenance and
installation works on board fixed production installations and accommodation
units. The remaining 11 accidents occurred on mobile units (drilling rigs). None
of the accidents reported in 2003 were fatal.
In 2003, the number of reported work-related accidents on fixed production
installations increased, while the number of reports on accidents on mobile units,
comprising drilling rigs, pipe-laying barges, crane barges and other vessels,
declined compared to the year before.
The accidents can be broken down by category, as shown in Table 5.1.
The expected periods of absence from work on fixed installations and mobile
units reported by operators are indicated in Tables 5.2 and 5.3, respectively.
Accident frequencyEvery year, the Danish Energy Authority calculates the overall accident frequency,
which is defined as the number of accidents per million working hours.
The companies operating in the Danish sector of the North Sea in 2003 have report-
ed that the number of working hours totalled 3.88 million for fixed production
installations and associated accommodation units, while the comparable figure is
2.82 million working hours for mobile offshore units.
Thus, the accident frequency for 2003 can be calculated at 12.6 per million work-
ing hours for fixed production installations and accommodation units, while the
corresponding figure for mobile offshore units is 3.9 per million working hours.
Development in work-related accidentsFrom 2002 to 2003, the number of reported work-related accidents on fixed pro-
duction installations rose from 30 to 49, which corresponds to an increase in acci-
dent frequency from 9.1 to 12.6 per million working hours.
In contrast, the number of reported work-related accidents on mobile offshore
units dropped from 2002 to 2003. In 2002, the Danish Energy Authority received
22 reports on work-related accidents, as compared to 11 reports in 2003. This cor-
responds to a decline in accident frequency from 8.9 to 3.9 per million working
hours. Fig. 5.1 shows the annual accident frequency for the past ten years.
For the second year in a row, the accident frequency increased for fixed produc-
tion installations, based on the work-related accidents reported. In 2003, the
Danish Energy Authority asked the operators whether they could see a pattern in
who was being injured. In the opinion of the operators, people with limited off-
shore experience are over-represented. Moreover, the Danish Energy Authority’s
33
H E A LT H A N D S A F E T Y
No. of reports
0
1
4
2
4
Duration
1-3 days
4-14 days
2-5 weeks
More than 5 weeks
Undisclosed
Tabel 5.3 Expected absence due to accidents on mobile offshore units, 2003
No. of reports
6
18
16
9
Duration
1-3 days
4-14 days
2-5 weeks
More than 5 weeks
Tabel 5.2 Expected absence due to accidents on fixed offshore installations, 2003
Fig. 5.1 Accident frequency on offshore installations
Accidents per million working hours
95 97 99 01 03
15
10
5
0
Mobile offshore units
Fixed offshore installations

34
assessment shows that there is an over-representation of people not employed by
the operator, i.e. contractor employees.
In 2003, the Danish Energy Authority also discussed with the three operators how
targeted efforts can be made to prevent work-related accidents effectively. The
operators have given an account of the measures initiated to prevent work-related
accidents, including new measures specially aimed at the past two years’ increase
in accident frequency.
The preventive measures include a two-hour behavioural safety course in con-
junction with the statutory safety course, focus on new employees, checklists for
safe job performance, an increase in meeting frequency between operators and
contractors, as well as follow-up meetings between the operator and employer
after each work-related accident where the injured person is a contractor employee.
Based on discussions with operators, the Danish Energy Authority considers these
measures to be focused and proactive, particularly with regard to contractor
employees.
The number of accidents on offshore installations is relatively low, and is there-
fore subject to great statistical uncertainty. Consequently, it is not possible to con-
clude on the basis of the figures alone whether the increased number of accidents
is attributable to an actual decrease in safety level.
The reports on expected periods of absence on fixed offshore installations in
2003 include 24 reports with periods of absence of 1-14 days and 25 reports with
more than two weeks’ absence. This represents a shift towards longer periods of
expected absence compared to the previous year. Thus, nine reports with an
expected period of absence exceeding five weeks have been received, five of
them attributable to fractured bones or sprains.
Following up on these reports is one of the means to prevent accidents. The
Danish Energy Authority subjects each report received to an individual assessment.
Moreover, during its inspection visits to the offshore installations, the Danish Energy
Authority follows up on all accidents reported. As in 2003, the Danish Energy
Authority’s supervision in 2004 will focus on measures to prevent accidents.
Work-related diseasesIn 2003, the Danish Energy Authority received a total of 11 reports of suspected
or diagnosed work-related diseases that were attributable to work on an offshore
installation.
An outline of the percentage distribution by main diagnosis of all the work-relat-
ed diseases reported to the Danish Energy Authority since 1993 is shown at the
Danish Energy Authority’s website www.ens.dk.
"Near-miss" occurrences In 2003, the Danish Energy Authority received nine reports on "Near-miss" occur-
rences on offshore installations, of which eight can be attributed to fixed produc-
tion installations and one to a drilling rig. All the "Near-miss" occurrences report-
ed are due to disregard of safety procedures. One of the "Near-miss" occurrences
reported described a situation in which a heavy object weighing 2.2 kg dropped 6
H E A LT H A N D S A F E T Y

metres and landed in front of someone. This situation could have led to serious
personal injury or even death. Another occurrence concerned a gas leak.
Following the gas explosion in the Gorm Field in May 2001, the Danish Energy
Authority agreed with Mærsk Olie og Gas AS that the company would report all
gas leaks. Thus, Mærsk Olie og Gas AS reported 43 leaks in processing piping in
2003. None of these leaks presented an immediate danger to persons and/or
installations in either scope or nature, for which reason they were not reported as
"Near-miss" occurrences.
As part of the Government’s action plan, the Danish Energy Authority has investi-
gated whether the operators’ registration and handling of "Near-miss" occurrences
meet the recommendations made in the SINTEF report. The Danish Energy
Authority considers that the operators’ follow-up goes beyond looking into the
immediate causes of the occurrences. See also the section above on the elements
of the action plan.
During its inspections of the platforms, the Danish Energy Authority reviews the
reports on "Near-miss" occurrences together with the reports on work-related
accidents. Moreover, the Danish Energy Authority closely follows the operators’
reporting and utilization of the information contained in their reports on "Near-
miss" occurrences.
35
H E A LT H A N D S A F E T Y
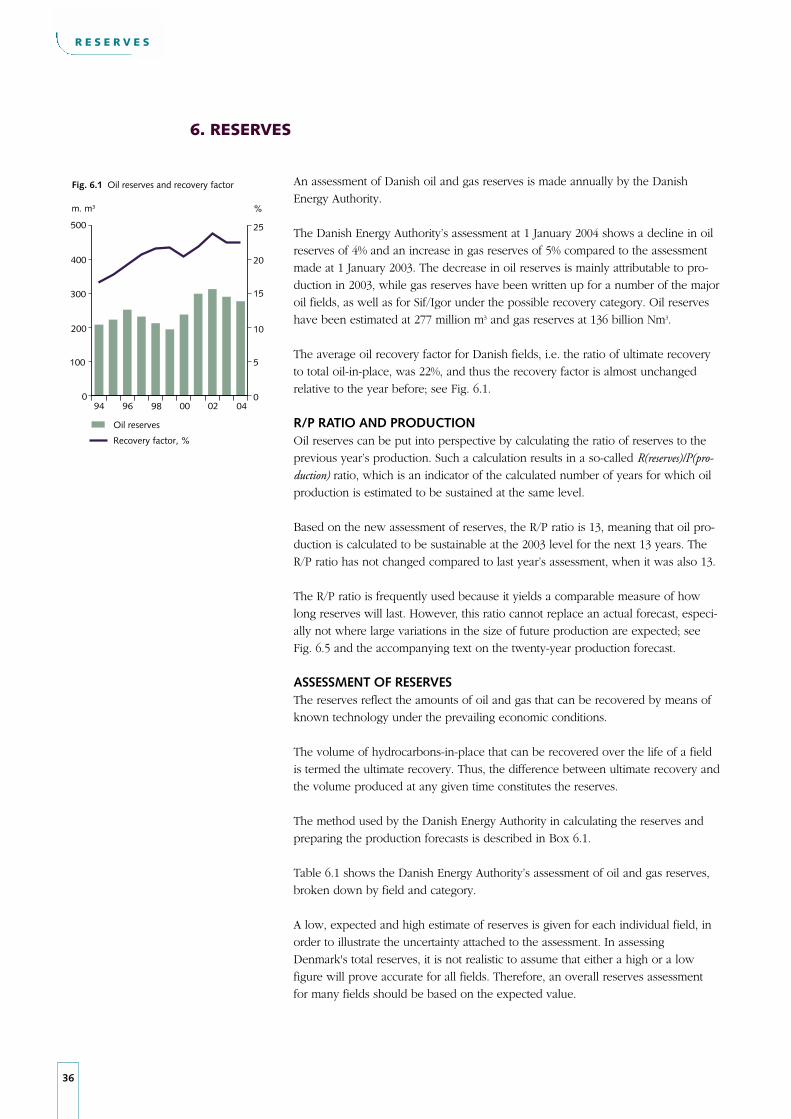
36
An assessment of Danish oil and gas reserves is made annually by the Danish
Energy Authority.
The Danish Energy Authority’s assessment at 1 January 2004 shows a decline in oil
reserves of 4% and an increase in gas reserves of 5% compared to the assessment
made at 1 January 2003. The decrease in oil reserves is mainly attributable to pro-
duction in 2003, while gas reserves have been written up for a number of the major
oil fields, as well as for Sif/Igor under the possible recovery category. Oil reserves
have been estimated at 277 million m3 and gas reserves at 136 billion Nm3.
The average oil recovery factor for Danish fields, i.e. the ratio of ultimate recovery
to total oil-in-place, was 22%, and thus the recovery factor is almost unchanged
relative to the year before; see Fig. 6.1.
R/P RATIO AND PRODUCTION Oil reserves can be put into perspective by calculating the ratio of reserves to the
previous year’s production. Such a calculation results in a so-called R(reserves)/P(pro-duction) ratio, which is an indicator of the calculated number of years for which oil
production is estimated to be sustained at the same level.
Based on the new assessment of reserves, the R/P ratio is 13, meaning that oil pro-
duction is calculated to be sustainable at the 2003 level for the next 13 years. The
R/P ratio has not changed compared to last year’s assessment, when it was also 13.
The R/P ratio is frequently used because it yields a comparable measure of how
long reserves will last. However, this ratio cannot replace an actual forecast, especi-
ally not where large variations in the size of future production are expected; see
Fig. 6.5 and the accompanying text on the twenty-year production forecast.
ASSESSMENT OF RESERVESThe reserves reflect the amounts of oil and gas that can be recovered by means of
known technology under the prevailing economic conditions.
The volume of hydrocarbons-in-place that can be recovered over the life of a field
is termed the ultimate recovery. Thus, the difference between ultimate recovery and
the volume produced at any given time constitutes the reserves.
The method used by the Danish Energy Authority in calculating the reserves and
preparing the production forecasts is described in Box 6.1.
Table 6.1 shows the Danish Energy Authority’s assessment of oil and gas reserves,
broken down by field and category.
A low, expected and high estimate of reserves is given for each individual field, in
order to illustrate the uncertainty attached to the assessment. In assessing
Denmark's total reserves, it is not realistic to assume that either a high or a low
figure will prove accurate for all fields. Therefore, an overall reserves assessment
for many fields should be based on the expected value.
R E S E R V E S
6. RESERVES
Fig. 6.1 Oil reserves and recovery factor
96 98 00 02 04
m. m3
500
400
300
200
100
0
25
20
15
10
5
0
%
94
Oil reserves
Recovery factor, %

37
R E S E R V E S
The method used by the Danish Energy Authority in calculating the reserves
makes allowance for the uncertainty involved in all the parameters used in the
calculation. For each oil and gas field, the reserves assessed are expressed by
three values: low, expected and high, reflecting the margins of uncertainty tied to
the oil and gas reserves in the relevant field.
Ongoing RecoveryThis category includes the reserves that are recoverable with the use of exist-
ing production facilities and wells. It is assumed that ordinary maintenance
and workover operations are performed to ensure the continued functioning
of the existing facilities.
Approved RecoveryIf production has not yet been initiated under an approved development plan
or any part of an approved plan, the reserves assessed to be recoverable are
categorized as approved recovery.
This applies to the development of new fields as well as extensions and mod-
ifications of existing installations.
Planned RecoveryPlanned recovery denotes projects described in a development plan that is
being considered by the authorities. Likewise, the reserves attributable to dis-
coveries for which a declaration of commerciality has been filed are termed
planned recovery.
Possible RecoveryPossible recovery denotes reserves recoverable with the use of known tech-
nology, i.e. technology which is currently used in areas where the conditions
are comparable to those prevailing in the North Sea. For instance, this includes
water injection on a larger scale than before or wider application of horizontal
wells.
For discoveries for which a declaration of commerciality has not yet been
filed, the recoverable reserves are categorized as possible recovery. This cate-
gory also includes recovery from discoveries considered to be non-commercial.
Box 6.1 Categories of Reserves

38
R E S E R V E S
Table 6.1 Production and Reserves at 1 January 2004
OIL, million m3 GAS, billion Nm3
Ultimate Recovery Ultimate Recovery
Produced Reserves Produced Reserves
Low Exp. High Low Exp. High
Ongoing and Ongoing and Approved Recovery: Approved Recovery:
Adda - 0 1 1 Adda - 0 0 0
Alma - 0 1 1 Alma - 1 1 2
Boje area - 1 1 1 Boje area - 0 0 0
Cecilie 0 1 3 4 Cecilie - - - -
Dagmar 1 0 0 0 Dagmar 0 0 0 0
Dan 69 34 63 90 Dan 19 6 8 11
Elly - 1 1 1 Elly - 4 4 4
Gorm 48 8 12 15 Gorm 6 1 1 2
Halfdan 12 31 69 106 Halfdan 3 7 9 12
Harald 7 1 1 2 Harald 16 4 5 8
Kraka 4 1 1 1 Kraka 1 1 1 2
Lulita 1 0 0 0 Lulita 0 0 0 0
Nini 0 3 4 6 Nini - - - -
Regnar 1 0 0 0 Regnar 0 0 0 0
Roar 2 0 1 2 Roar 11 3 6 9
Rolf 4 0 1 1 Rolf 0 0 0 0
Sif/Igor 0 0 1 2 Sif/Igor 0 5 11 21
Siri 8 2 3 5 Siri - - - -
Skjold 36 4 9 12 Skjold 3 0 1 1
Svend 5 1 1 1 Svend 1 0 0 0
South Arne 10 * 21 * South Arne 3 * 7 *
Tyra 21 2 5 9 Tyra 35 22 26 29
Tyra Southeast 1 2 3 5 Tyra Southeast 1 7 11 14
Valdemar 2 2 2 4 Valdemar 1 1 2 4
Subtotal 232 203 Subtotal 100 94
Planned recovery: Planned recovery:
Amalie - * 2 3 Amalie - * 3 5
Freja - 1 1 2 Freja - 0 0 0
Lulita - 0 0 1 Lulita - 0 0 1
Valdemar - 2 3 4 Valdemar - 1 2 3
Subtotal 7 Subtotal 6
Possible recovery: Possible recovery:
Prod. fields - 24 47 77 Prod. fields - 16 25 32
Other fields - 0 1 2 Other fields - 0 0 0
Discoveries - 7 19 43 Discoveries - 3 11 22
Subtotal 67 Subtotal 36
Total 232 277 Total 100 136
January January
2003 211 290 2003 92 129
* Not assessed

It appears from Fig. 6.2 that the expected amount of oil reserves ranges from 210 to
277 million m3. The difference between the two figures, 67 million m3, equals the
reserves in the possible recovery category. The reserves assessed for the planned
and possible recovery categories, respectively, reflect the increasing uncertainty as
to whether such reserves can be exploited commercially.
Likewise, Fig. 6.3 illustrates that the expected amount of gas reserves ranges from
100 to 136 billion Nm3. Gas production figures represent the net production, i.e.
produced gas less reinjected gas. It should be noted that the amounts of gas stated
deviate from the amounts that can be marketed as natural gas. The difference (10-
15%) represents the amounts consumed or flared on the platforms in the produc-
tion process.
There have been several revisions of the Danish Energy Authority's assessment of
reserves compared to the assessment made in January 2003. These revisions are
attributable to more production experience and new reservoir models of some of
the fields resulting from improved knowledge of the fields.
The areas where significant revisions have been made are described below.
Ongoing and approved recoveryIn the planned recovery category, the reserves assessment made in January 2003 inclu-
ded the reserves recoverable from the development of Sif/Igor (Halfdan Northeast).
In June 2003, this development plan was approved, and the pertinent reserves have
therefore been included under ongoing and approved recovery.
The reserves of the Cecilie Field have been written down due to new well data. In
April 2004, a plan for developing the Connie accumulation as part of the Cecilie
Field was approved, so the reserves of this accumulation have been included in the
Cecilie reserves.
The Dan Field reserves have been written up on the basis of production experience
and further development of the western flank of the field.
Positive production experience has led the Danish Energy Authority to write up the
reserves of the Gorm Field.
The Dan and Halfdan Fields are estimated to have the largest oil reserves in this
category, and the estimated reserves of these two fields account for about two-thirds
of the category’s total reserves.
Planned recoveryDue to the installation of water-processing facilities in the Lulita Field, reserves have
been included in the planned recovery category for this field.
In November 2003, a plan was submitted for further development of the Valdemar
Field. The Danish Energy Authority is currently reviewing this plan, for which
reason the pertinent reserves have been included in the planned recovery category.
Possible recoveryThe Danish Energy Authority has reviewed a number of options for enhancing
recovery with the use of known technology, i.e. technology that is used today
under conditions comparable to those prevailing in the North Sea.
39
R E S E R V E S
203
232
67
7
Fig. 6.2 Oil recovery, m. m3
Produced
Possiblerecovery
Planned
recovery
Ongoing and
approved
reserves
Fig. 6.3 Gas recovery, bn. Nm3
36
6
94100
Produced
Possiblerecovery
Planned
recovery
Ongoing and
approved
reserves

40
Based on reservoir calculations and general estimates of investments, operating
costs and oil price developments, it is assessed that the recoverable oil reserves can
be augmented by implementing water-injection projects in a number of fields.
The Danish Energy Authority has made a significant upward revision of hydro-
carbons-in-place in the Gorm Field, but has so far made only a minor write-up of
the reserves based on these hydrocarbons-in-place.
The drilling of horizontal wells is considered to further increase the production
potential of the Sif/Igor and Valdemar Fields.
Finally, discoveries that are under appraisal are included in this category, e.g. Hejre
and Svane. This category also includes discoveries that are considered to be non-
commercial based on current technology and prices.
It is characteristic that a few fields only have produced the bulk of Danish oil, and
that the oil reserves are concentrated in relatively few fields.
Dan, Gorm and Skjold are the three oldest, producing Danish fields. These fields
account for about two-thirds of total oil production, and due to their development
with horizontal wells and water injection, they still contain considerable reserves.
The reserves of the Dan, Gorm, Skjold, Halfdan and South Arne Fields are estima-
ted to represent about 80% of total Danish oil reserves. The remaining 20% of reser-
ves derive from more than 30 fields and discoveries.
On average, the overall recovery factor for all Danish fields and discoveries is esti-
mated at 22%. In fields like Dan, Gorm and Skjold, where the production condi-
tions are favourable, an average recovery factor of 35% is expected, based on such
recovery methods as water and gas injection. The recovery factor for these fields
was 38% according to last year’s assessment, and the decline in recovery factor
compared to last year is chiefly attributable to the above-mentioned write-up of the
hydrocarbons-in-place in the Gorm Field. However, the assessment also includes
contributions from the relatively large oil accumulations in the Tyra and Tyra
Southeast Fields, where the recovery factors are fairly low due to difficult produc-
tion conditions.
PRODUCTION FORECASTSBased on the assessment of reserves, the Danish Energy Authority prepares produc-
tion forecasts for the recovery of oil and natural gas in the next five and 20 years,
respectively.
Five-year production forecastThe five-year forecast uses the same categorization as the assessment of reserves,
and includes the categories ongoing, approved, planned and possible recovery.
Fields are incorporated into the production forecast from the time production start-
up is approved or from the earliest date on which production can be commenced.
Expected oil production appears from Table 6.2. In this table, the oil production
figures including planned recovery illustrate the planned course of production, while
the figures including possible recovery illustrate the possible course of production.
R E S E R V E S
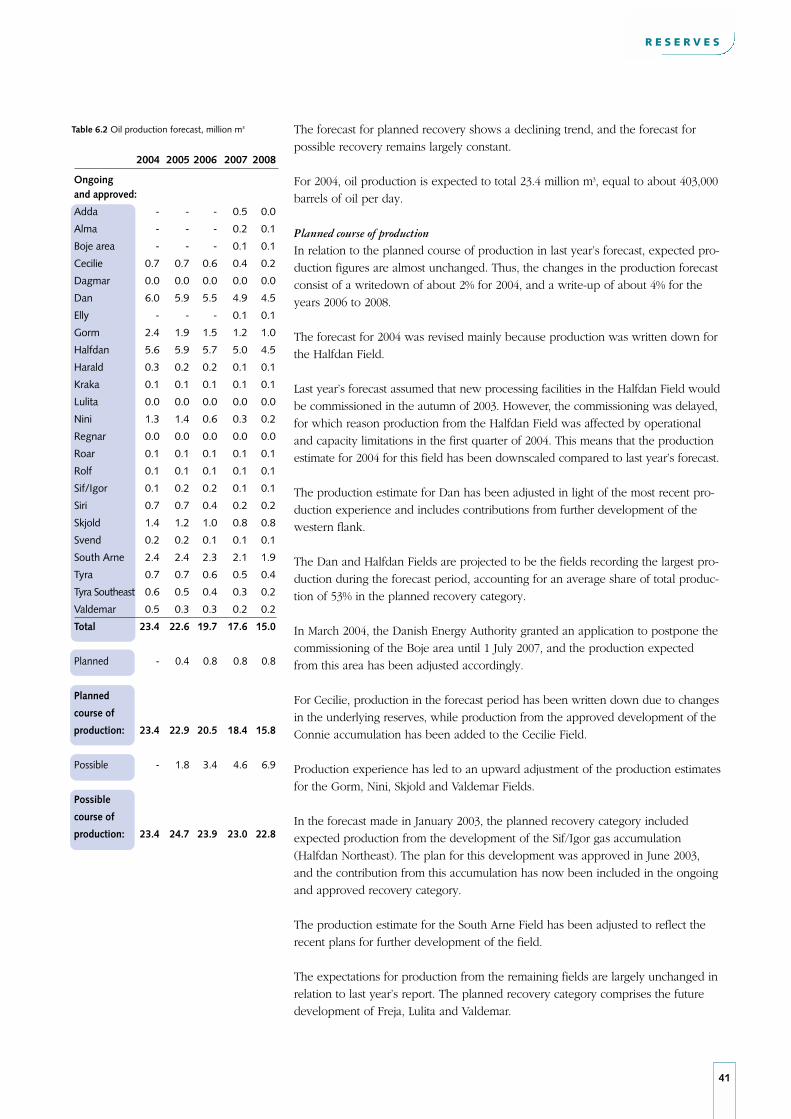
The forecast for planned recovery shows a declining trend, and the forecast for
possible recovery remains largely constant.
For 2004, oil production is expected to total 23.4 million m3, equal to about 403,000
barrels of oil per day.
Planned course of productionIn relation to the planned course of production in last year’s forecast, expected pro-
duction figures are almost unchanged. Thus, the changes in the production forecast
consist of a writedown of about 2% for 2004, and a write-up of about 4% for the
years 2006 to 2008.
The forecast for 2004 was revised mainly because production was written down for
the Halfdan Field.
Last year’s forecast assumed that new processing facilities in the Halfdan Field would
be commissioned in the autumn of 2003. However, the commissioning was delayed,
for which reason production from the Halfdan Field was affected by operational
and capacity limitations in the first quarter of 2004. This means that the production
estimate for 2004 for this field has been downscaled compared to last year’s forecast.
The production estimate for Dan has been adjusted in light of the most recent pro-
duction experience and includes contributions from further development of the
western flank.
The Dan and Halfdan Fields are projected to be the fields recording the largest pro-
duction during the forecast period, accounting for an average share of total produc-
tion of 53% in the planned recovery category.
In March 2004, the Danish Energy Authority granted an application to postpone the
commissioning of the Boje area until 1 July 2007, and the production expected
from this area has been adjusted accordingly.
For Cecilie, production in the forecast period has been written down due to changes
in the underlying reserves, while production from the approved development of the
Connie accumulation has been added to the Cecilie Field.
Production experience has led to an upward adjustment of the production estimates
for the Gorm, Nini, Skjold and Valdemar Fields.
In the forecast made in January 2003, the planned recovery category included
expected production from the development of the Sif/Igor gas accumulation
(Halfdan Northeast). The plan for this development was approved in June 2003,
and the contribution from this accumulation has now been included in the ongoing
and approved recovery category.
The production estimate for the South Arne Field has been adjusted to reflect the
recent plans for further development of the field.
The expectations for production from the remaining fields are largely unchanged in
relation to last year’s report. The planned recovery category comprises the future
development of Freja, Lulita and Valdemar.
41
R E S E R V E S
Table 6.2 Oil production forecast, million m3
2004 2005 2006 2007 2008
Ongoing and approved:
Adda - - - 0.5 0.0
Alma - - - 0.2 0.1
Boje area - - - 0.1 0.1
Cecilie 0.7 0.7 0.6 0.4 0.2
Dagmar 0.0 0.0 0.0 0.0 0.0
Dan 6.0 5.9 5.5 4.9 4.5
Elly - - - 0.1 0.1
Gorm 2.4 1.9 1.5 1.2 1.0
Halfdan 5.6 5.9 5.7 5.0 4.5
Harald 0.3 0.2 0.2 0.1 0.1
Kraka 0.1 0.1 0.1 0.1 0.1
Lulita 0.0 0.0 0.0 0.0 0.0
Nini 1.3 1.4 0.6 0.3 0.2
Regnar 0.0 0.0 0.0 0.0 0.0
Roar 0.1 0.1 0.1 0.1 0.1
Rolf 0.1 0.1 0.1 0.1 0.1
Sif/Igor 0.1 0.2 0.2 0.1 0.1
Siri 0.7 0.7 0.4 0.2 0.2
Skjold 1.4 1.2 1.0 0.8 0.8
Svend 0.2 0.2 0.1 0.1 0.1
South Arne 2.4 2.4 2.3 2.1 1.9
Tyra 0.7 0.7 0.6 0.5 0.4
Tyra Southeast 0.6 0.5 0.4 0.3 0.2
Valdemar 0.5 0.3 0.3 0.2 0.2
Total 23.4 22.6 19.7 17.6 15.0
Planned - 0.4 0.8 0.8 0.8
Planned
course of
production: 23.4 22.9 20.5 18.4 15.8
Possible - 1.8 3.4 4.6 6.9
Possible
course of
production: 23.4 24.7 23.9 23.0 22.8

42
Possible course of productionTable 6.2 includes contributions from the possible recovery category.
Within the possible recovery category, the production potential is based on the
Danish Energy Authority's assessment of possibilities for initiating further produc-
tion not based on development plans submitted. The forecast for the possible reco-
very category is more or less constant, with annual oil production averaging 23.6
million m3, equal to about 407,000 barrels of oil per day, during the forecast period.
In last year’s report, the possible production scenario included an assumed capacity
extension of the oil pipeline to shore. This extension has not been initiated, and the
difference between this year’s and last year’s forecast is mainly attributable to this
change in the forecast assumptions.
The possible recovery category includes the future further development of the Dan,
Halfdan, Gorm, Skjold, Tyra Southeast, Valdemar and South Arne Fields.
Natural gas production estimates are given in Fig. 6.4, broken down by processing
centre. The forecast includes natural gas production resulting from new contracts
for the export of gas through the pipeline from Tyra to the European continent.
The section on Development gives a more detailed description of this pipeline. The
production forecast in Table 6.2 includes additional condensate production resul-
ting from increased gas production under new export contracts.
Twenty-year production forecastThe method used for making the 20-year forecast for the planned and possible
courses of production is the same as for the five-year forecast. A forecast covering
20 years is most reliable in the first part of the period. Moreover, the methods used
in making the forecasts imply that production must be expected to decline after a
short number of years.
Planned and possible course of productionThe forecast for planned recovery shows a downward trend, while the forecast for
possible recovery is virtually constant until 2008, after which production is expected
to decline; see Fig. 6.5.
R E S E R V E S
Fig. 6.5 Production forecasts for the period 2004-2023
m. m3
Planned course of production
0
10
20
30
2005 2007 2009 2011 2013 2015 2017 2019 2021 2023
Possible course of production with technology contributions
Possible course of production
Fig. 6.4 Natural gas production broken down by processing centre and estimated future sale of natural gas
South Arne C.
bn. Nm3
10
8
6
4
2
00806040200
Tyra C.
Harald C.
Dan C.
Gorm C. Forecast

Mid-way through and at the end of the forecast period, production according to the
possible recovery scenario is estimated to constitute about 50% and 10% of the pro-
duction estimate for 2004, respectively. Thus, the forecast projects a downward
plunge in oil production. This decline can possibly be curbed as a result of techno-
logical development and any new discoveries made as part of the ongoing explora-
tion activity. A more detailed description of the exploration potential in Denmark is
given in the section on Hydrocarbon potential.
Contributions from technological developmentIt is estimated that technological development will contribute significantly to pro-
duction, particularly in the latter half of the forecast period. As a supplement to the
reserves assessment, the Danish Energy Authority has assessed the volumes that
may be recovered by means of new technology.
It should be noted that the method used for the Danish Energy Authority’s reserves
assessment does not take potential technological development into account, as the
reserves assessed are assumed to be recoverable by means of known technology.
In other words, there is reason to believe that the quantities that can be produced
are higher than the reserves indicated.
Future technological development is expected to take two paths: firstly, existing
techniques will be further developed and the cost reduced, and secondly, technolo-
gical leaps will generate new techniques.
The fact that no-one can foresee the new techniques that will result from technolo-
gical leaps makes it more difficult to estimate with any certainty how technological
development will contribute to the forecast. Consequently, the Danish Energy
Authority has chosen to estimate the contribution from technological development
on the basis of a set of general assumptions, in contrast to the Authority’s traditional
forecasts, which are based on specific assessments of each individual field.
Natural gas productionAs opposed to the production of oil, which can always be sold at the current market
price, the production of natural gas requires that long-term sales contracts have
been concluded.
Since the start of gas sales in 1984, natural gas produced under A.P. Møller’s Sole
Concession has been supplied under gas sales contracts concluded between the DUC
companies and DONG Naturgas A/S. The present gas sales contracts do not stipulate a
fixed total volume, but rather an annual volume that will be supplied for as long as DUC
considers it technically and financially feasible to carry on production at this level.
In 1997, a contract was concluded between the Amerada Hess group and DONG
Naturgas A/S for the sale of gas from the South Arne Field, and, in 1998, a contract
was concluded with DONG Naturgas A/S for the sale of the DONG group’s share
of gas produced from the Lulita Field.
In addition, the forecast includes the natural gas production resulting from new con-
tracts for the export of gas through the pipeline from Tyra to the European continent.
The Danish Energy Authority's forecast for the planned course of production is based
on the contracts with DUC, providing for total gas supplies of approx. 155 billion
Nm3 until the year 2019. In addition, the planned course of production for the
South Arne Field accounts for 5 billion Nm3.
43
R E S E R V E S

44
H Y D R O C A R B O N P O T E N T I A L
7. HYDROCARBON POTENTIAL
In Denmark, source rocks and reservoir rocks occur at various depths and vary
widely in age. An assessment of such source rocks and reservoirs, and thus their
hydrocarbon potential, shows that the Danish area holds considerable potential
before the upcoming 6th Licensing Round.
HYDROCARBON MIGRATION INTO RESERVOIRSFor hydrocarbon exploration to be successful, many factors must combine in
exactly the right way. A crucial factor is the presence of underground rock strata
in which hydrocarbons have originated at some point in time. This type of rock is
called source rock. Hydrocarbon generation is based on organic matter present in
the source rock. At the right depth, and thus with the right conditions of pressure
and temperature, this organic matter is transformed into hydrocarbons.
The hydrocarbons may now leave the source rock and move towards areas with
lower pressure. This hydrocarbon movement, also referred to as migration, takes
place in permeable rocks or along faults and fractures in the subsurface.
The hydrocarbons may be retained or trapped in rocks. Rocks in which hydrocar-
bons are retained are called reservoirs. If a reservoir is encased in surrounding
rocks with considerably lower permeability, the hydrocarbons cannot escape,
even at very high reservoir pressures, and are thus caught in a trap. Such low-per-
meable rocks with ability to encase reservoir rocks are called sealing rocks.
There are several types of traps capable of retaining hydrocarbons. Structural traps
are formed as a result of tectonic movements creating various types of pillow
structures or fault traps. Stratigraphic traps originate in areas where major changes
in rock porosity occur. This type of trap is independent of the structure. Further,
there are an infinite number of possible combinations of structural and stratigraphic
traps.
Two main types of reservoir rock are found in the Danish area, viz. chalk and
sandstone. The chalk covers the entire Danish territory, except the island of
Bornholm. With this type of reservoir, successful hydrocarbon exploration is a
matter of identifying the areas in the chalk where hydrocarbons may have accu-
mulated. Sandstone occurrences, on the other hand, are not nearly as extensive,
and reservoir sediments may be limited to small areas. Successful hydrocarbon
exploration in this type of reservoir is therefore rather a question of locating the
sandstone targets.
EXPLORATION POTENTIAL Continued exploration, even in well-known reservoirs, such as the Central Graben
chalk, is revealing new traps, and thus potential for new hydrocarbon discoveries.
The Danish area therefore offers broad scope for exploration, in both chalk plays
and other types of reservoir.
In connection with the upcoming 6th Licensing Round, the Danish Energy
Authority has assessed the hydrocarbon potential in the Danish part of the Central
The section on Hydrocarbon potentialis based on the article cited below.
For more detailed information, see
the full article at the Danish Energy
Authority’s website (www.ens.dk).
Unless stated otherwise, the resour-
ce estimation and numeric data
given are based on information
available to the Danish Energy
Authority up to and including sum-
mer 2003.
Hemmet, M. 2003: The hydrocarbonpotential of the Danish ContinentalShelf. Petroleum Geology of NorthwestEurope: Proceedings of the 6thConference. Geological Society, London,In Print.
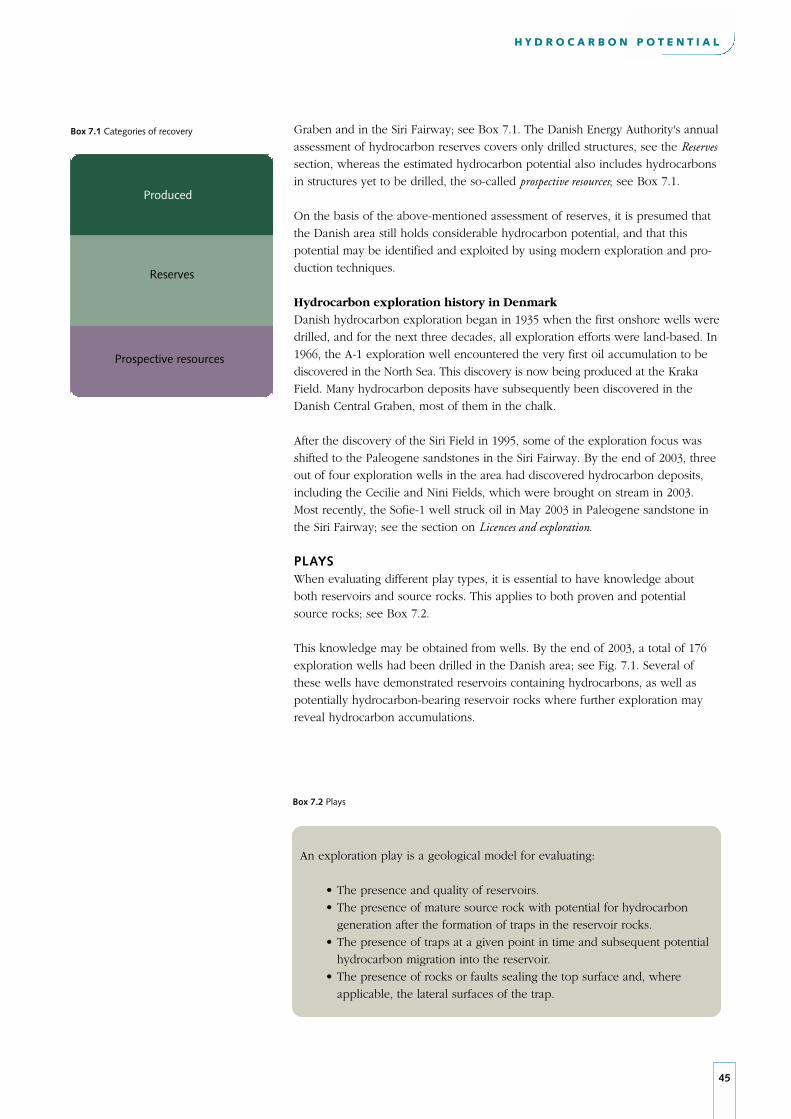
Graben and in the Siri Fairway; see Box 7.1. The Danish Energy Authority's annual
assessment of hydrocarbon reserves covers only drilled structures, see the Reservessection, whereas the estimated hydrocarbon potential also includes hydrocarbons
in structures yet to be drilled, the so-called prospective resources; see Box 7.1.
On the basis of the above-mentioned assessment of reserves, it is presumed that
the Danish area still holds considerable hydrocarbon potential, and that this
potential may be identified and exploited by using modern exploration and pro-
duction techniques.
Hydrocarbon exploration history in DenmarkDanish hydrocarbon exploration began in 1935 when the first onshore wells were
drilled, and for the next three decades, all exploration efforts were land-based. In
1966, the A-1 exploration well encountered the very first oil accumulation to be
discovered in the North Sea. This discovery is now being produced at the Kraka
Field. Many hydrocarbon deposits have subsequently been discovered in the
Danish Central Graben, most of them in the chalk.
After the discovery of the Siri Field in 1995, some of the exploration focus was
shifted to the Paleogene sandstones in the Siri Fairway. By the end of 2003, three
out of four exploration wells in the area had discovered hydrocarbon deposits,
including the Cecilie and Nini Fields, which were brought on stream in 2003.
Most recently, the Sofie-1 well struck oil in May 2003 in Paleogene sandstone in
the Siri Fairway; see the section on Licences and exploration.
PLAYSWhen evaluating different play types, it is essential to have knowledge about
both reservoirs and source rocks. This applies to both proven and potential
source rocks; see Box 7.2.
This knowledge may be obtained from wells. By the end of 2003, a total of 176
exploration wells had been drilled in the Danish area; see Fig. 7.1. Several of
these wells have demonstrated reservoirs containing hydrocarbons, as well as
potentially hydrocarbon-bearing reservoir rocks where further exploration may
reveal hydrocarbon accumulations.
45
H Y D R O C A R B O N P O T E N T I A L
Produced
Reserves
Prospective resources
Box 7.1 Categories of recovery
Box 7.2 Plays
An exploration play is a geological model for evaluating:
• The presence and quality of reservoirs.
• The presence of mature source rock with potential for hydrocarbon
generation after the formation of traps in the reservoir rocks.
• The presence of traps at a given point in time and subsequent potential
hydrocarbon migration into the reservoir.
• The presence of rocks or faults sealing the top surface and, where
applicable, the lateral surfaces of the trap.
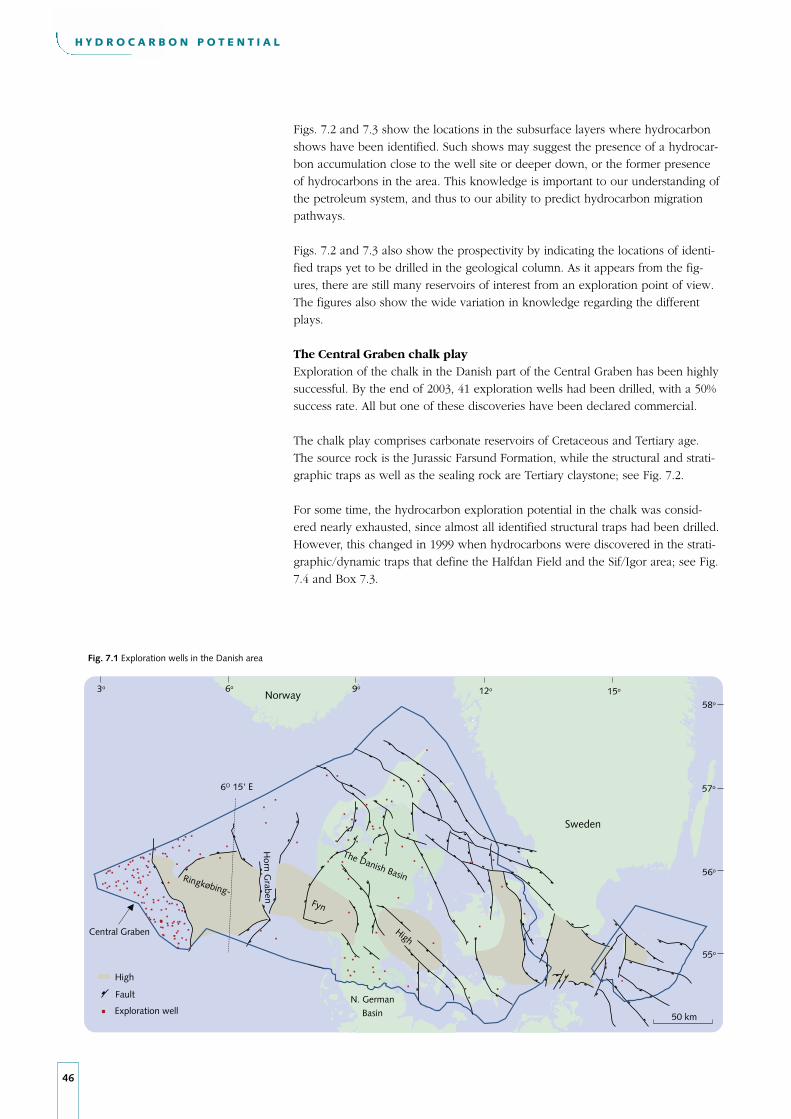
46
H Y D R O C A R B O N P O T E N T I A L
58o
57o
56o
3o 6o 9o 12o 15o
6O 15' E
55o
The Danish Basin
Horn G
raben
Ringkøbing-Fyn
High
50 km
Fig. 7.1 Exploration wells in the Danish area
Central Graben
N. GermanBasin
Norway
Sweden
High
Fault
Exploration well
Figs. 7.2 and 7.3 show the locations in the subsurface layers where hydrocarbon
shows have been identified. Such shows may suggest the presence of a hydrocar-
bon accumulation close to the well site or deeper down, or the former presence
of hydrocarbons in the area. This knowledge is important to our understanding of
the petroleum system, and thus to our ability to predict hydrocarbon migration
pathways.
Figs. 7.2 and 7.3 also show the prospectivity by indicating the locations of identi-
fied traps yet to be drilled in the geological column. As it appears from the fig-
ures, there are still many reservoirs of interest from an exploration point of view.
The figures also show the wide variation in knowledge regarding the different
plays.
The Central Graben chalk playExploration of the chalk in the Danish part of the Central Graben has been highly
successful. By the end of 2003, 41 exploration wells had been drilled, with a 50%
success rate. All but one of these discoveries have been declared commercial.
The chalk play comprises carbonate reservoirs of Cretaceous and Tertiary age.
The source rock is the Jurassic Farsund Formation, while the structural and strati-
graphic traps as well as the sealing rock are Tertiary claystone; see Fig. 7.2.
For some time, the hydrocarbon exploration potential in the chalk was consid-
ered nearly exhausted, since almost all identified structural traps had been drilled.
However, this changed in 1999 when hydrocarbons were discovered in the strati-
graphic/dynamic traps that define the Halfdan Field and the Sif/Igor area; see Fig.
7.4 and Box 7.3.
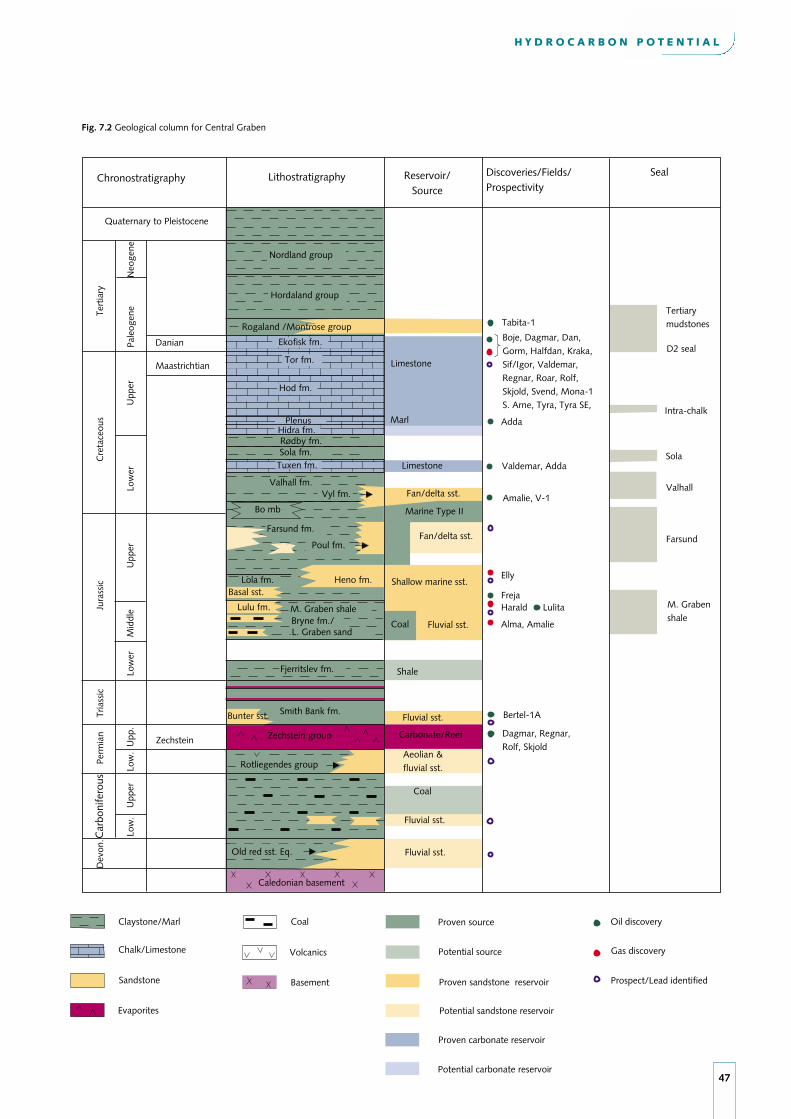
H Y D R O C A R B O N P O T E N T I A L
47
Danian
Maastrichtian
Zechstein
Smith Bank fm.
Zechstein group Carbonate/Reef
Bunter sst.
Heno fm.Basal sst.
Lulu fm.
Caledonian basement
Hidra fm.
Dev
on.
Perm
ian
Low
.M
iddl
eU
pper
Low
.U
pp.
Low
erU
pper
Low
erU
ppe r
Tor fm.
Hod fm.
Ekofisk fm.
Nordland group
Hordaland group
Bo mb
Tuxen fm.
Valhall fm.
Farsund fm.
Poul fm.
Bryne fm./
Fjerritslev fm.
Adda
Boje, Dagmar, Dan, Gorm, Halfdan, Kraka,Sif/Igor, Valdemar, Regnar, Roar, Rolf, Skjold, Svend, Mona-1S. Arne, Tyra, Tyra SE,
Valdemar, Adda
Amalie, V-1
Elly
Freja
Dagmar, Regnar,Rolf, Skjold
Harald Lulita
Bertel-1A
Alma, Amalie
Fluvial sst.
Aeolian & fluvial sst.
Fluvial sst.
Coal
Fluvial sst.
Plenus
L. Graben sand
Sola fm.
Vyl fm.
Lola fm.
M. Graben shale
Rotliegendes group
Old red sst. Eq.
Limestone
Coal
Fan/delta sst.
Limestone
Fan/delta sst.
Marine Type II
Shale
Tabita-1
Shallow marine sst.
Fluvial sst.
Rødby fm.
Rogaland /Montrose group
Fig. 7.2 Geological column for Central Graben
Marl
LithostratigraphyChronostratigraphy
Quaternary to Pleistocene
Reservoir/Source
Discoveries/Fields/ Prospectivity
Seal
Tria
ssic
Jura
ssic
Cre
tace
ous
Tert
iary
Chalk/Limestone
Claystone/Marl
Sandstone
Coal
Evaporites
Volcanics
Basement
Proven source
Potential source
Proven sandstone reservoir
Potential sandstone reservoir
Proven carbonate reservoir
Oil discovery
Gas discovery
Prospect/Lead identified
Potential carbonate reservoir
Tertiarymudstones
Intra-chalk
Valhall
Farsund
Sola
D2 seal
M. Grabenshale
Pale
ogen
eN
eoge
ne
Car
boni
fero
us
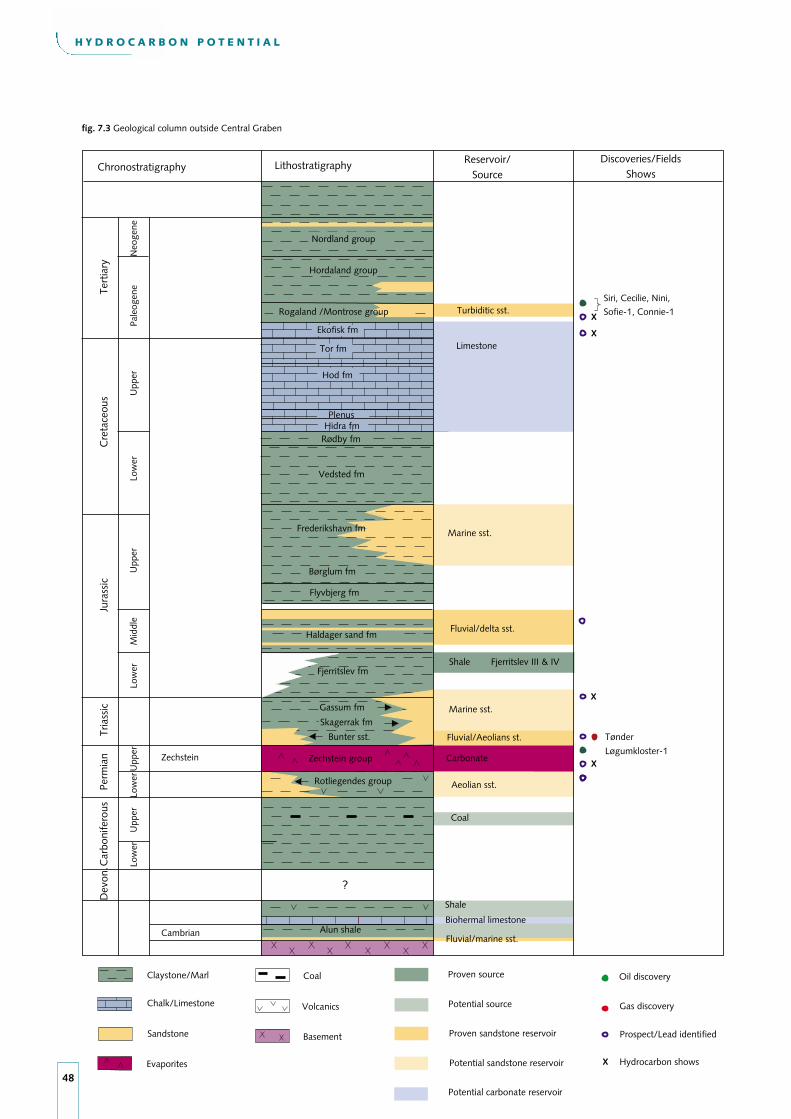
H Y D R O C A R B O N P O T E N T I A L
48
Zechstein Carbonate
Coal
Bunter sst.
Dev
on.C
arbo
nife
rous
Perm
ian
Tria
ssic
Low
erM
iddl
eU
pper
Low
erU
pper
Low
erU
pper
Pale
ogen
eN
eoge
neLo
wer
Upp
e r
Tor fm
Ekofisk fm
Cambrian
Siri, Cecilie, Nini,Sofie-1, Connie-1
Fjerritslev III & IV
Rogaland /Montrose group
Frederikshavn fm
Biohermal limestone
Shale
Marine sst.
Shale
Fluvial/marine sst.
Nordland group
Hordaland group
Hod fm
Vedsted fm
Flyvbjerg fm
Haldager sand fm
Fjerritslev fm
Gassum fm
Skagerrak fm
Rotliegendes group
Alun shale
Zechstein group
Plenus Hidra fm
Fluvial/Aeolians st.
X
X
X
X
X
?
Marine sst.
Limestone
Fluvial/delta sst.
Aeolian sst.
Rødby fm
Børglum fm
Tønder
Løgumkloster-1
Turbiditic sst.
fig. 7.3 Geological column outside Central Graben
LithostratigraphyChronostratigraphy
Reservoir/Source
Discoveries/FieldsShows
Jura
ssic
Cre
tace
ous
Tert
iary
Chalk/Limestone
Claystone/Marl
Sandstone
Coal
Evaporites
Volcanics
Basement
Proven source
Potential source
Proven sandstone reservoir
Potential sandstone reservoir
Potential carbonate reservoir
Hydrocarbon shows
Oil discovery
Gas discovery
Prospect/Lead identified

49
H Y D R O C A R B O N P O T E N T I A L
Fig. 7.4 Oil and gas fields as well as referenced exploration wells
Mona-1
Nini
Siri
Cecillie
Amalie
Lulita
Harald
Svend
South Arne
Freja
Elly Valdemar
RolfGorm
Roar
AddaBoje area
Tyra
Tyra SE
Dagmar
SkjoldHalfdan
Sif
Dan
Alma
Kraka
Regnar
Producing oil field
Producing gas field
Commercial oil field
Commercial gas field
Referenced wells
Siri Fairw
ay
25 km
6O 15'
Bertel-1
Hejre-1
Elly-1
Amalie-1
Tabita-1
Svane-1
Adda-1
Olga-1
V-1
Alma-1
Sofie-1
Connie-1
Identification of this new type of traps changed our understanding of the petroleum
system of the chalk, since the system is now considered to be dynamic. The
hydrocarbons in the chalk are not in equilibrium, and therefore continue to
migrate extremely slowly (a few kilometres per million years). The lack of equi-
librium in the petroleum system is due to the very slow fluid flow, the relatively
late entry of the hydrocarbons into the chalk and continued tectonic movements.
Such a dynamic system exists in the Halfdan and Dan area. Even today, hydrocar-
bons continue to migrate into the Halfdan Field and from there into the Dan Field.
Insight into the history of hydrocarbon migration in the chalk is considered critical
to the future success of chalk exploration. Shifting the focus to the combined
stratigraphic/dynamic traps and using improved exploration, development and
production technology will most certainly increase reserves in the chalk.
50
H Y D R O C A R B O N P O T E N T I A L
Box 7.3 Definition of stratigraphic and dynamic traps in the chalk
Stratigraphic traps in the chalk:Stratigraphic traps in the chalk are defined by areas of increased porosity. The
porosity of the reservoir in well-defined structural traps has been preserved by
the presence of hydrocarbons. As a result of later structural movements, the
trap ‘opened’, but the lower porosity of the surrounding chalk now acted as a
sealing mechanism.
Dynamic traps in the chalk:Dynamic traps occur because of the low permeability of the chalk, which cau-
ses the hydrocarbons to migrate extremely slowly. They are therefore not actu-
al, permanent traps, but the result of this very slow rate of pore fluid flow,
which means that it will take millions of years for the hydrocarbons to migrate
out of the area.
Jurassic sandstones in the Central GrabenSandstones of Jurassic age constitute highly successful plays in the British and
Norwegian sectors of the North Sea. To date, exploration has been less successful
in the Danish Central Graben. By the end of 2003, 46 exploration wells had been
drilled, with a success rate of 35%. Only two fields, Harald and Lulita, have been
brought on stream, while the Alma, Elly and Freja Fields have been declared
commercial; see Figs. 7.2 and 7.4.
The plays cover various sandstone reservoirs of Jurassic age. The Jurassic Farsund
Formation and the Bryne Formation are source rocks, whereas the structural and
stratigraphic traps as well as the sealing rock are Jurassic claystone; see Fig. 7.2.
All hydrocarbon deposits in the Jurassic sandstone in the Danish Central Graben
were discovered by drilling into traps with largely structural closures, while many
Jurassic accumulations in the remaining part of the North Sea occur in pure strati-
graphic traps. Thus, Jurassic discoveries in stratigraphic traps seem to be under-
represented in the Danish Central Graben. This indicates lower exploration matu-
rity for sandstones in this area.
The sandstones were deposited in a variety of depositional environments, ranging
from fluvial to deep marine. This means that the types of sand bodies to be iden-
tified vary widely. Previously, identifying individual sand bodies presented techni-
cal difficulties, but recent years’ developments in seismic techniques offer great
improvements in this respect.
The deep exploration wells Hejre-1 and Svane-1, drilled in 2001 and 2002, respec-
tively, show that sandstone can retain high porosity at great depths; see Fig. 7.4.
The Hejre-1 and Svane-1 wells were both drilled to depths of more than 5,200
metres and discovered the deepest deposits of oil and gas/condensate found to
date in Denmark. The success of these two wells therefore considerably increased
the prospectivity of the Jurassic sandstone.
It is estimated that the future success of exploration activities in Jurassic sand-
stones depends on the ability to predict their location and reservoir quality.

51
H Y D R O C A R B O N P O T E N T I A L
276
232
152136
100
205
Oil m. m3
Gas bn. Nm3
Produced
at 1 January 2004
Reserves total
at 1 January 2004
Prospective
resources
at 1 August 2003
Produced
at 1 January 2004
Reserves total
at 1 January 2004
Prospective
resources
at 1 August 2003
Fig. 7.5 Reserves and resources in the Central Graben and the Siri Fairway
Plays in the area east of 6o15’As already mentioned, hydrocarbon exploration in Denmark was at first conduct-
ed on land. Since 1935, 83 exploration wells have been drilled in the Danish area
outside the Central Graben, primarily onshore; see Fig. 7.1. Exploration activities
in the area east of 6o15’ have mainly targeted Jurassic and Triassic sandstones and
Zechstein carbonates; see Fig. 7.3.
To date, no commercial hydrocarbon accumulations have been discovered in the
area east of 6o15’, but, for example, the Kiel area includes several producing
Jurassic fields, the Rügen–Mecklenburg area has oil-producing Zechstein fields,
and in Kaliningrad, hydrocarbons are produced from reservoirs of Cambrian age.
The sedimentary deposits in the area east of 6o15’ generally have very good reser-
voir properties, and many structural traps have been identified here. Traditionally,
however, their hydrocarbon potential has been considered low due to the uncer-
tainty with regard to sourcing. The Cambrian alum shale has excellent source
quality. But as the period of hydrocarbon generation in the Danish area probably
predated the formation of structural traps, there was nothing to retain the hydro-
carbons in the shale.
Claystone of Jurassic age from the Fjerritslev Formation is also believed to have
good source rock potential. However, the burial depth of the layers is considered
insufficient to allow other than local hydrocarbon generation around salt domes.
Where present in the area, claystone of Carboniferous age is believed to have
good hydrocarbon potential.
Several hydrocarbon shows have been found in the area east of 6o15’, mainly in
Jurassic and Triassic sandstone and in Zechstein carbonates. Most data from this
area are relatively old, since more than half of the wells were drilled before 1970.
Modern exploration methods may have major impact on our understanding of the
petroleum systems in this area, and hence on the prospectivity of eastern
Denmark.
EXISTING HYDROCARBON POTENTIAL In connection with the upcoming 6th Licensing Round, the Danish Energy
Authority has estimated the existing hydrocarbon potential, the so-called prospectiveresources, as already mentioned. The prospective resources have been assessed
exclusively for the Central Graben in the Danish sector and for the Siri Fairway.
This is due to the fact that these areas cover all the producing fields and commer-
cial deposits present in Danish territory. Moreover, the two areas form part of the
same petroleum system, which is sourced mainly from the Jurassic claystones of
the Farsund Formation.
The prospective resources include an estimate of resources in identified traps yet
to be drilled (prospects and leads) at all stratigraphic levels. The estimate is based
on assessments of risked resources forwarded by the oil companies. The estimate
further includes a risk-based assessment of ‘yet-to-find’ resources in non-identified
traps in known and less known plays; see Box 7.3 and Fig. 7.2. This assessment
is based on knowledge of the structures in the Danish Central Graben and the Siri
Fairway, as well as on hydrocarbon discoveries and plays in areas adjoining the
Danish sector.
52
H Y D R O C A R B O N P O T E N T I A L
At mid-2003, prospective resources were estimated at 205 million m3 of oil and
152 billion Nm3 of gas; see Fig. 7.5. This indicates that up to 30% of total hydro-
carbons-in-place in the Danish part of the Central Graben and the Siri Fairway
still remains to be found. This is quite an impressive volume, considering that the
Danish part of the North Sea has been explored for almost 40 years.
The estimate does not include potential hydrocarbon accumulations under a com-
mercial threshold of 0.8 million m3 of oil and 0.8 billion Nm3 of gas.
POTENTIAL IN THE 6TH LICENSING ROUNDDanish territory still offers many exploration opportunities. Thus, prospective
hydrocarbon resources may be located in the successful and potentially still pro-
ductive chalk reservoirs in the Central Graben and in the less known Jurassic
sandstones.
Other plays in the Danish area are also being investigated. Successful exploration
of Triassic sandstone reservoirs has been carried out in the Dutch part of the
Central Graben. Exploration activities targeting the same reservoirs in the Danish
part of the Central Graben have been hampered by uncertainty as to whether this
sandstone extends into Danish territory. But in 2003, it was actually encountered
by the Olga-1 exploration well; see the section on Licences and exploration. This may
spark increased interest in this particular play.
It is estimated that the highest number of less mature plays in the Central Graben
is found in the Danish part. This is partly because hydrocarbon exploration in the
Danish Central Graben has focused largely on a single type of reservoir rock, viz.
the chalk. These less mature plays may hold a potential for increased hydrocar-
bon resources.
As mentioned above, the prospective resources in the Danish part of the Central
Graben and the Siri Fairway are estimated at 205 million m3 of oil and 152 billion
Nm3 of gas. By comparison, the reserves of the entire Danish area were assessed
at 276 million m3 of oil and 136 billion Nm3 of gas at 1 January 2004. It should be
noted, however, that the prospective resources are subject to a relatively high
uncertainty, and that not all of these resources can be expected to be identified.
The prospective resources estimate shows that considerable unidentified hydro-
carbon resources may still be present in the Danish sector. The Danish area there-
fore offers major exploration opportunities in the upcoming 6th Licensing Round.

Since 1997, Denmark has been more than self-sufficient in energy by virtue of the
production of oil and gas in the North Sea. The production of hydrocarbons
generates a surplus in socio-economic terms and thus has a positive impact on
the Danish economy. The Danish state gets a share of this surplus through taxa-
tion and direct participation in the production activities.
The agreement made between the Government and A. P. Møller-Mærsk in 2003,
which allows the company’s Sole Concession to continue, means the state will
obtain a larger share of the overall earnings. The agreement has provided a fixed
framework for the Concessionaires, enabling them to make the long-term invest-
ments and plans that are crucial to efficient use of the resources.
OIL PRICE AND DOLLAR EXCHANGE RATEThe production value of oil and gas depends on the development of the interna-
tional oil price and the dollar exchange rate.
The average oil price, as quoted for Brent oil, was USD 28.9 per barrel in 2003.
This is considerably higher than the level for 2002, when oil prices averaged USD
24.9 per barrel. Fig. 8.1 shows the development in the oil price in 2003.
In 2003, the average dollar exchange rate was DKK 6.6 per USD. This represents a
fall compared to 2002, when the average dollar exchange rate was DKK 7.9 per USD.
VALUE OF OIL AND GAS PRODUCTIONThe total value of Danish oil and gas production was calculated at about DKK
31.1 billion in 2003, the same level as in 2002. Relative to 2002, production decli-
ned slightly, and the dollar exchange rate dropped. Therefore, the sustained high
production value is attributable to the hike in oil prices in 2003. When viewed in
a historical perspective, the production value estimated for 2003 is still considered
to be very high.
The estimates for 2003 show that oil production represented a value of DKK 25.5
billion, and gas production a value of DKK 5.6 billion. The breakdown of produc-
tion in 2003 on the ten producing companies appears from Fig. 3.2 in the section
on Production.
How the production value will develop in the years ahead depends on the pro-
duction volume, the trend in oil and gas prices and the dollar exchange rate. The
Danish Energy Authority prepares oil and gas production forecasts based on
known and possible reserves; see the section on Reserves. However, the develop-
ment in the oil price and dollar exchange rate is more difficult to predict, so any
estimate concerning how production value will develop in the next few years will
be subject to great uncertainty.
DEGREES OF SELF-SUFFICIENCYDenmark has been self-sufficient in energy since 1997. The total production of
oil, gas and renewable energy in 2003 was about 43% higher than total energy
consumption. This is slightly less than the year before, when production exceed-
ed consumption by 46%. In 2003, oil and gas production alone exceeded total
energy consumption by 29% and total oil and gas consumption by 85%.
53
E C O N O M Y
8. ECONOMY
Fig. 8.1 Oil price development in 2003
Oil price
Feb Apr Jun Aug Oct Dec
20
10
0
USD per barrel
30
40
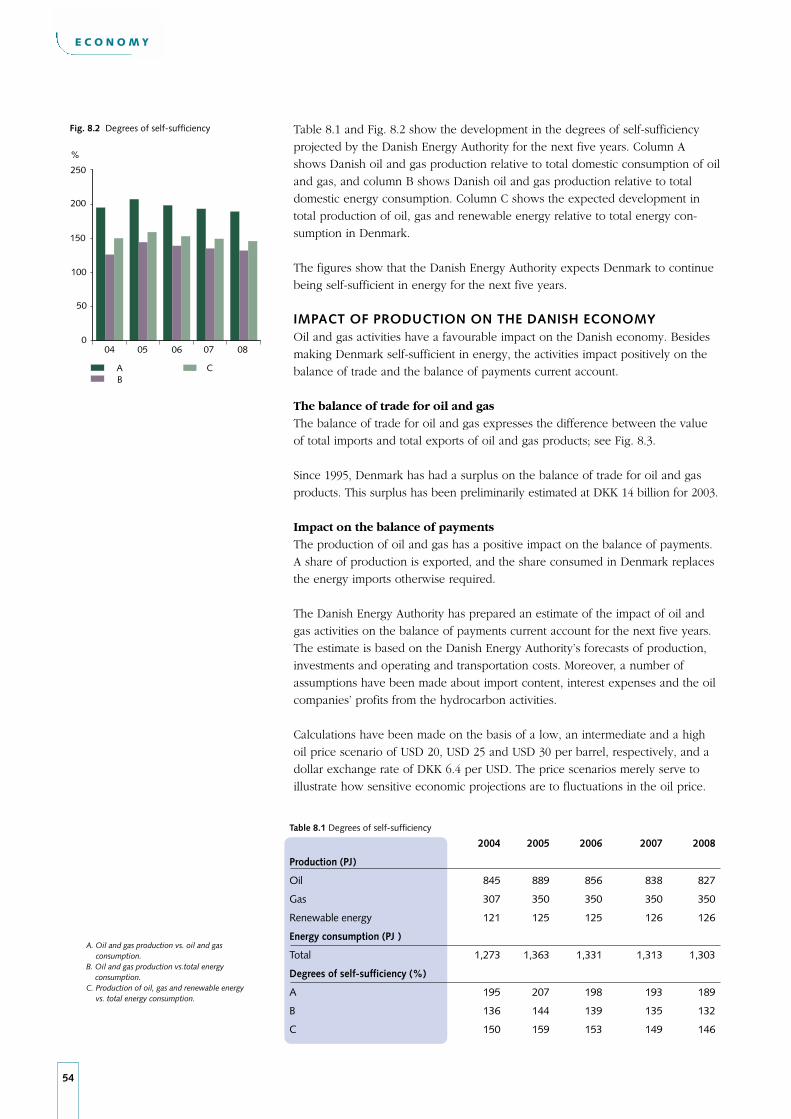
54
E C O N O M Y
%
Fig. 8.2 Degrees of self-sufficiency
A CB
04 05 06 07 08
250
200
150
100
50
0
Table 8.1 Degrees of self-sufficiency
2004 2005 2006 2007 2008
Production (PJ)
Oil 845 889 856 838 827
Gas 307 350 350 350 350
Renewable energy 121 125 125 126 126
Energy consumption (PJ )
Total 1,273 1,363 1,331 1,313 1,303
Degrees of self-sufficiency (%)
A 195 207 198 193 189
B 136 144 139 135 132
C 150 159 153 149 146
A. Oil and gas production vs. oil and gas consumption.
B. Oil and gas production vs.total energy consumption.
C. Production of oil, gas and renewable energy vs. total energy consumption.
Table 8.1 and Fig. 8.2 show the development in the degrees of self-sufficiency
projected by the Danish Energy Authority for the next five years. Column A
shows Danish oil and gas production relative to total domestic consumption of oil
and gas, and column B shows Danish oil and gas production relative to total
domestic energy consumption. Column C shows the expected development in
total production of oil, gas and renewable energy relative to total energy con-
sumption in Denmark.
The figures show that the Danish Energy Authority expects Denmark to continue
being self-sufficient in energy for the next five years.
IMPACT OF PRODUCTION ON THE DANISH ECONOMYOil and gas activities have a favourable impact on the Danish economy. Besides
making Denmark self-sufficient in energy, the activities impact positively on the
balance of trade and the balance of payments current account.
The balance of trade for oil and gasThe balance of trade for oil and gas expresses the difference between the value
of total imports and total exports of oil and gas products; see Fig. 8.3.
Since 1995, Denmark has had a surplus on the balance of trade for oil and gas
products. This surplus has been preliminarily estimated at DKK 14 billion for 2003.
Impact on the balance of paymentsThe production of oil and gas has a positive impact on the balance of payments.
A share of production is exported, and the share consumed in Denmark replaces
the energy imports otherwise required.
The Danish Energy Authority has prepared an estimate of the impact of oil and
gas activities on the balance of payments current account for the next five years.
The estimate is based on the Danish Energy Authority’s forecasts of production,
investments and operating and transportation costs. Moreover, a number of
assumptions have been made about import content, interest expenses and the oil
companies’ profits from the hydrocarbon activities.
Calculations have been made on the basis of a low, an intermediate and a high
oil price scenario of USD 20, USD 25 and USD 30 per barrel, respectively, and a
dollar exchange rate of DKK 6.4 per USD. The price scenarios merely serve to
illustrate how sensitive economic projections are to fluctuations in the oil price.

55
E C O N O M Y
Degree of self-sufficiency in %
Balance of trade for oil and gas, bn. DKK
Fig. 8.3 The balance of trade for oil and gas anddegree of self-sufficiency, 2003 prices
bn. DKK %
-10
0
10
50
100
150
0
200
89 93 95 97 99 01 0391
20 250
Table 8.2 Impact of oil/gas activities on the balance of payments, DKK billion, 2003 prices,intermediate price scenario (25 USD/bbl)
2004 2005 2006 2007 2008
Socio-economic production value 29 31 30 30 30
Import content 3 3 4 3 3
Balance of goods and services 26 29 26 27 27
Transfer of interest and dividends 6 7 6 7 7
Balance of payments current account 19 21 20 20 20
Balance of payments current account, low price
scenario (20 USD/bbl) 15 17 16 15 15
Balance of payments current account, high price
scenario (30 USD/bbl) 24 26 25 24 24
Table 8.2 shows the individual items used in calculating the impact of oil and gas
activities on the balance of payments in the intermediate oil price scenario. The
table also shows the calculated impact on the balance of payments current
account when the low and high oil price scenarios are used.
The socio-economic production value is defined as the sum total of the produc-
tion values of produced oil and gas. The import content of expected expenses is
then deducted from the socio-economic production value. Finally, dividends and
interest payments transferred abroad are deducted, thus yielding the impact of oil
and gas activities on the balance of payments current account.
Assuming that the oil price is USD 25 per barrel, the oil and gas activities will
have an estimated DKK 19-21 billion impact on the balance of payments current
account. In the low oil price scenario, the impact will be in the DKK 15-17 billion
range, compared to DKK 24-26 billion in the high oil price scenario. The three
scenarios show that oil prices greatly influence how the oil and gas activities
affect the Danish economy. An exchange rate of DKK 6.4 per USD was chosen
because the dollar exchange rate is low at present.
State revenueThe state generates direct revenue from North Sea oil and gas production via five
different taxes and fees: corporate income tax, hydrocarbon tax, royalty and oil pipelinetariff/compensatory fee. In addition, the state receives indirect revenue based on
DONG E&P A/S’ participation in the activities. At the end of 2003, the state’s
aggregate revenue from oil and gas production amounted to DKK 78.6 billion in
2003 prices, while the aggregate production value amounted to DKK 314.3 bil-
lion. The aggregate value of the licensees’ expenses for exploration, field devel-
opments and operations was DKK 175.8 billion.
The Government’s agreement of 29 September 2003 with A. P. Møller-Mærsk has
prompted various amendments to Danish tax legislation, effective 1 January 2004.
These amendments will impinge on the state’s future revenue from oil and gas
production. The main elements of the agreement are outlined in the section on
Licences and exploration.
Box 8.1 and appendix D specify the state’s revenue base in the form of taxes and
fees on hydrocarbon production.
56
E C O N O M Y
The taxes and fees imposed on the production of oil and gas secure an income for the state. Corporate income tax
and hydrocarbon tax are collected by the Danish Ministry of Taxation, Central Customs and Tax Administration,
while the collection of royalty, the oil pipeline tariff and the compensatory fee is administered by the Danish
Energy Authority. Moreover, the Danish Energy Authority supervises the metering of the amounts of oil and gas
produced on which the assessment of state revenue is based.
Below, an outline is given of the state’s sources of revenue, based on the statutory provisions applicable in 2003.
With effect from 1 January 2004, these provisions were amended. The amendments appear from Appendix D and
the section on Licences and exploration.
Corporate income tax paymentsCorporate income tax payments are the chief source of revenue related to oil and gas. Although hydrocarbon pro-
duction commenced in 1972, revenue from corporate income tax payments was not generated until the beginning
of the 1980s, because oil and gas activities require fairly heavy investments, which are deductible as depreciation
allowances over a number of years.
Hydrocarbon taxHydrocarbon tax was introduced in 1982 with the aim of taxing windfall profits, for example as a result of high oil
prices. To ensure fuller and better exploitation of the resources in the subsoil, the Hydrocarbon Tax Act was also
phrased in a manner that provides an incentive for the companies to invest in further exploration and development
activities. Hydrocarbon tax became payable for a few years during the first half of the 1980s and again in 2002 and
2003, with total hydrocarbon tax payments amounting to approx. DKK 1,039 million in 2003 prices.
RoyaltyUnder the terms of A.P. Møller-Mærsk’s Sole Concession, royalty is payable on the basis of production. For the Sole
Concession, royalty at the rate of 8.5% is payable on the total value produced after deducting transportation costs.
In addition, the holders of the Lulita share of licences 7/86 and 1/90 pay royalty based on the size of production
attributable to their share of the field. New licences contain no requirement for the payment of royalty.
Oil pipeline tariffThe oil pipeline tariff is a tax payable by DONG Olierør A/S, which owns the oil pipeline from the Gorm Field to
Fredericia. The users of the oil pipeline pay a fee to DONG Olierør A/S, which includes a profit element of 5% of
the value of the oil transported. DONG pays 95% of the proceeds from the 5% profit element to the state, termed
the oil pipeline tariff.
Compensatory feeAny parties granted an exemption from the obligation regarding connection to and transportation through the oil
pipeline are required to pay the state a fee amounting to 5% of the value of the oil and condensate comprised by
the exemption. At present, the compensatory fee is payable on the production from the South Arne, Siri, Nini and
Cecilie Fields.
DONG E&P A/SDONG E&P A/S is a fully paying participant in the licences granted in the 4th and 5th Licensing Rounds and in the
Open Door procedure, with a fixed 20% share. In some cases, DONG E&P A/S has supplemented this share on
commercial terms by purchasing additional licence shares. As DONG E&P A/S holds a share in the individual licen-
ces on the same terms as the other licensees, the company pays taxes and fees to the state at the current rates.
Since DONG E&P A/S is a wholly state-owned company, its financial result reflects the value of the state’s interest.
DONG E&P A/S’ profit after tax for 2003 amounts to DKK 201 million. The state’s revenue from its ownership of
DONG E&P A/S consists of dividend payments and the rising value of the company’s shares.
Box 8.1 State revenue from North Sea oil and gas production

57
E C O N O M Y
Royalty Oil pipeline tariffCorporate income tax
Fig. 8.4 Development in total state revenue from oil/gas production 1972-2003, DKK billion, 2003 prices
Hydrcarbon tax
75 77 79 81 83 85 87 89 91 93 95 97 99 01 03
12
9
6
3
0
bn. DKK
73
Table 8.3 State revenue over the past five years, DKK million, nominal prices
1999 2000 2001 2002 2003*
Hydrocarbon tax - - - 65 64
Corporate income tax 2,082 6,170 6,273 6,794 5,943
Royalty 854 1,153 2,247 2,109 2,180
Oil pipeline tariff** 694 1,372 1,114 1,169 1,143
Total 3,630 8,695 9,634 10,137 9,331
* Estimate** Incl. 5% compensatory feeNote: Payments received during the year
Corporate income tax is a chief source of state revenue. During the period 1962-
2003, the state’s revenue from hydrocarbon production in the North Sea totalled
almost DKK 80 billion (2003 prices). Of this amount, corporate income tax
accounts for 58%, royalty for 28%, the oil pipeline tariff for 13% and hydrocarbon
tax for 1%.
Fig. 8.4 shows the development in total state revenue broken down on the indivi-
dual taxes and fees. It appears that from the year 2000 state revenue from hydro-
carbon production in the North Sea has increased substantially, an increase that is
due primarily to the positive development of production combined with high oil
prices. In the past three years, the state has generated revenue of about DKK 10
billion a year; see Table 8.3.
For the past five years, the state has received tax payments from companies other
than the DUC companies. These tax payments were made by the companies hol-
ding shares in the Siri and South Arne Fields as well as a share of the Lulita Field.
An outline of the companies holding shares in the individual licences is available
at the Danish Energy Authority’s website.
Based on the USD 25 oil price scenario, the Ministry of Taxation’s five-year reve-
nue forecast shows that the state’s total revenue will come to DKK 12 billion in
2004, then hovering at around DKK 11.5 billion until the year 2008. The USD 30
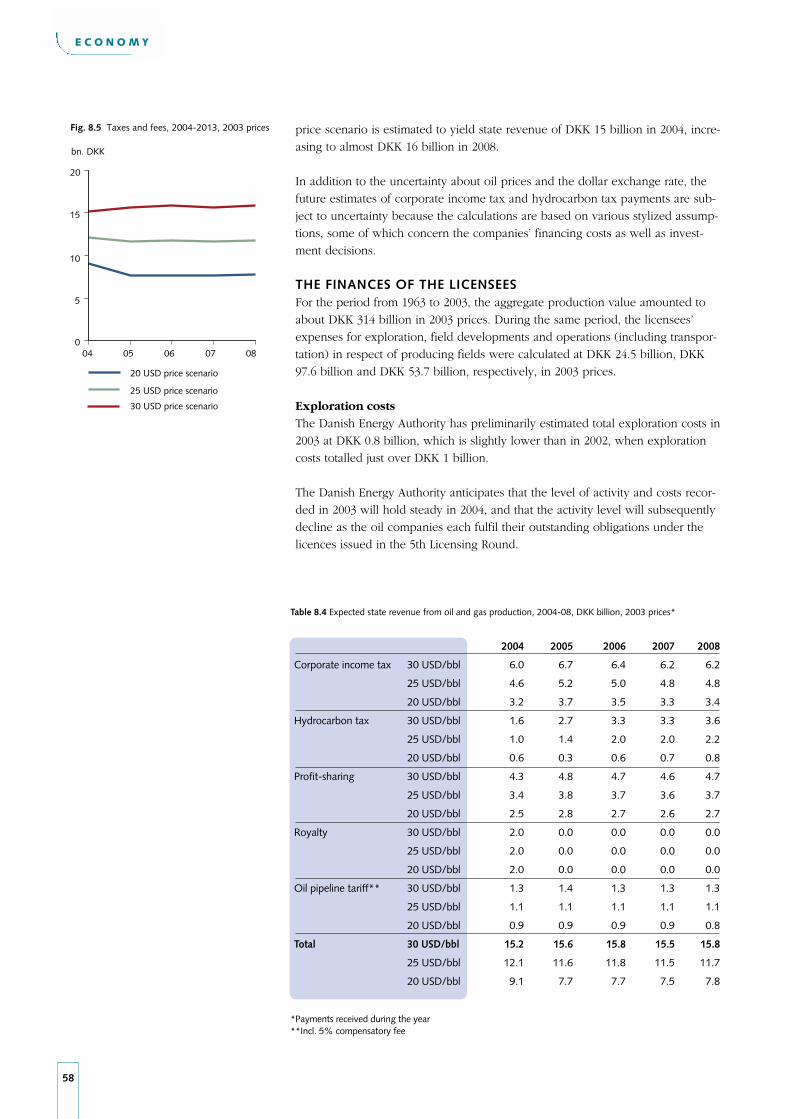
58
E C O N O M Y
Table 8.4 Expected state revenue from oil and gas production, 2004-08, DKK billion, 2003 prices*
2004 2005 2006 2007 2008
Corporate income tax 30 USD/bbl 6.0 6.7 6.4 6.2 6.2
25 USD/bbl 4.6 5.2 5.0 4.8 4.8
20 USD/bbl 3.2 3.7 3.5 3.3 3.4
Hydrocarbon tax 30 USD/bbl 1.6 2.7 3.3 3.3 3.6
25 USD/bbl 1.0 1.4 2.0 2.0 2.2
20 USD/bbl 0.6 0.3 0.6 0.7 0.8
Profit-sharing 30 USD/bbl 4.3 4.8 4.7 4.6 4.7
25 USD/bbl 3.4 3.8 3.7 3.6 3.7
20 USD/bbl 2.5 2.8 2.7 2.6 2.7
Royalty 30 USD/bbl 2.0 0.0 0.0 0.0 0.0
25 USD/bbl 2.0 0.0 0.0 0.0 0.0
20 USD/bbl 2.0 0.0 0.0 0.0 0.0
Oil pipeline tariff** 30 USD/bbl 1.3 1.4 1.3 1.3 1.3
25 USD/bbl 1.1 1.1 1.1 1.1 1.1
20 USD/bbl 0.9 0.9 0.9 0.9 0.8
Total 30 USD/bbl 15.2 15.6 15.8 15.5 15.8
25 USD/bbl 12.1 11.6 11.8 11.5 11.7
20 USD/bbl 9.1 7.7 7.7 7.5 7.8
*Payments received during the year**Incl. 5% compensatory fee
Fig. 8.5 Taxes and fees, 2004-2013, 2003 prices
bn. DKK
25 USD price scenario
20 USD price scenario
30 USD price scenario
15
005
20
10
5
04 06 07 08
price scenario is estimated to yield state revenue of DKK 15 billion in 2004, incre-
asing to almost DKK 16 billion in 2008.
In addition to the uncertainty about oil prices and the dollar exchange rate, the
future estimates of corporate income tax and hydrocarbon tax payments are sub-
ject to uncertainty because the calculations are based on various stylized assump-
tions, some of which concern the companies’ financing costs as well as invest-
ment decisions.
THE FINANCES OF THE LICENSEESFor the period from 1963 to 2003, the aggregate production value amounted to
about DKK 314 billion in 2003 prices. During the same period, the licensees’
expenses for exploration, field developments and operations (including transpor-
tation) in respect of producing fields were calculated at DKK 24.5 billion, DKK
97.6 billion and DKK 53.7 billion, respectively, in 2003 prices.
Exploration costs The Danish Energy Authority has preliminarily estimated total exploration costs in
2003 at DKK 0.8 billion, which is slightly lower than in 2002, when exploration
costs totalled just over DKK 1 billion.
The Danish Energy Authority anticipates that the level of activity and costs recor-
ded in 2003 will hold steady in 2004, and that the activity level will subsequently
decline as the oil companies each fulfil their outstanding obligations under the
licences issued in the 5th Licensing Round.

59
E C O N O M Y
Table 8.5 Investments, DKK million, nominal prices
1999 2000 2001 2002 2003*
Cecilie 200 661
Dan 273 403 367 437 956
Gorm 26 12 240 242 105
Halfdan 204 886 1,518 2,412 1,684
Harald 32 175 - 0 4
Kraka 0 0 61 3 -
Lulita - - - - 7
Nini - - - 285 1,697
Roar 80 17 - - 37
Rolf 1 0 - - 37
Sif / Igor - - - - 95
Siri 848 53 175 19 314
Skjold 399 404 89 5 91
Svend 189 - 115 223 -
South Arne 1,371 761 543 948 462
Tyra 152 330 198 - 414
Tyra SE - - 357 654 -
Valdemar - 60 316 -1 230
NOGAT pipeline - - - - 766
Not allocated -48 10 12 - 19
Total 3,528 3,111 3,991 5,427 7,579
* Estimate
Fig. 8.6 Total costs of all licensees, 1963-2003 DKK billion, 2003 prices
Exploration
Field development
Operations
24.5
97.6
53.7
Presumably, the 6th Licensing Round, expected to open in the course of 2004,
will counteract this downward trend in exploration activity. As the final terms and
conditions for the 6th Licensing Round are being prepared, it is not possible at
present to assess the scope and timing of the activities that will follow from the
licences awarded in the upcoming 6th Licensing Round.
Investments in field developments2003 was a year with major development activity. Thus, total investments in field
developments for 2003 have been preliminarily estimated at DKK 7.6 billion, an
increase of about DKK 2.2 billion compared to 2002.
In 2003, the DUC companies accounted for about 60% of total investments in
field developments and about 80% of total production.
The Cecilie, Dan, Halfdan and Nini Fields and the NOGAT pipeline represented
more than 75% of total investments in 2003. The two largest single investments in
2003 were the installation of an unmanned platform and the drilling of five wells
in the Nini Field and the continued development of the Halfdan Field. Other
investments include the development of the Cecilie Field, involving the addition
of an unmanned platform and the drilling of one well, plus the continued deve-
lopment of the Dan Field; see the section entitled Development.
The Danish Energy Authority has considerably written up investments in field
developments for the next few years, as compared to the forecast made at

60
E C O N O M Y
Table 8.6 Investments in development projects, DKK billion, 2003 prices
2004 2005 2006 2007 2008
Ongoing and approved
Adda - - 0.4 0.1 -
Alma - - 0.4 0.1 -
Cecilie 0.2 - - - -
Dan 1.1 0.4 - - 0.1
Elly - 0.0 0.4 0.2 -
Gorm 0.1 0.0 0.0 0.0 0.1
Halfdan 1.4 - - - -
Sif / Igor - 0.1 - - -
Nini 0.1 - - - -
Rolf - - - - -
Siri 0.2 - - - -
Skjold - - - - -
Svend - - - - -
South Arne 0.7 0.4 - - -
Tyra 0.1 0.1 0.1 0.0 -
Tyra SE 0.2 0.0 - - -
Valdemar - - - - -
NOGAT pipeline 0.1 - - - -
Total 4.2 1.1 1.3 0.5 0.2
Planned 0.4 0.8 0.5 0.4 0.3
Possible - 1.2 3.8 3.5 2.9
Expected 4.6 3.1 5.5 4.4 3.3
Investments
Transportation
Operations
bn. DKK
Fig. 8.7 Investments in fields, and operatingand oil transportation costs, 2003 prices
0604 05 08
10
5
0
15
07
1 January 2003. The reason is that this year’s investment forecast includes possible
field developments, whereas the forecast made at 1 January 2003 only included
ongoing, approved and planned field developments. The estimate of possible
investments in field developments is based on the Danish Energy Authority’s
assessment of the potential for initiating further production beyond the produc-
tion for which development plans have already been submitted; see the section
on Reserves.
Operating, administration and transportation costsOperating and administration costs have been preliminarily estimated at DKK 2.5
billion for 2003, which is higher than the comparable figure for 2002.
Total oil transportation costs consist of the operating costs and capital cost associ-
ated with the use of the oil pipeline from the Gorm Field to shore, as well as the
5% profit element, which is payable on the basis of the production value of the
oil transported. The Siri, South Arne, Nini and Cecilie Fields are exempt from the
obligation to use the oil pipeline, but must instead pay a compensatory fee con-
stituting 5% of the production value of the oil. The oil produced is transported to
shore by tanker.
Fig. 8.7 illustrates the Danish Energy Authority’s estimate of developments in ope-
rating and transportation costs for the years to come.
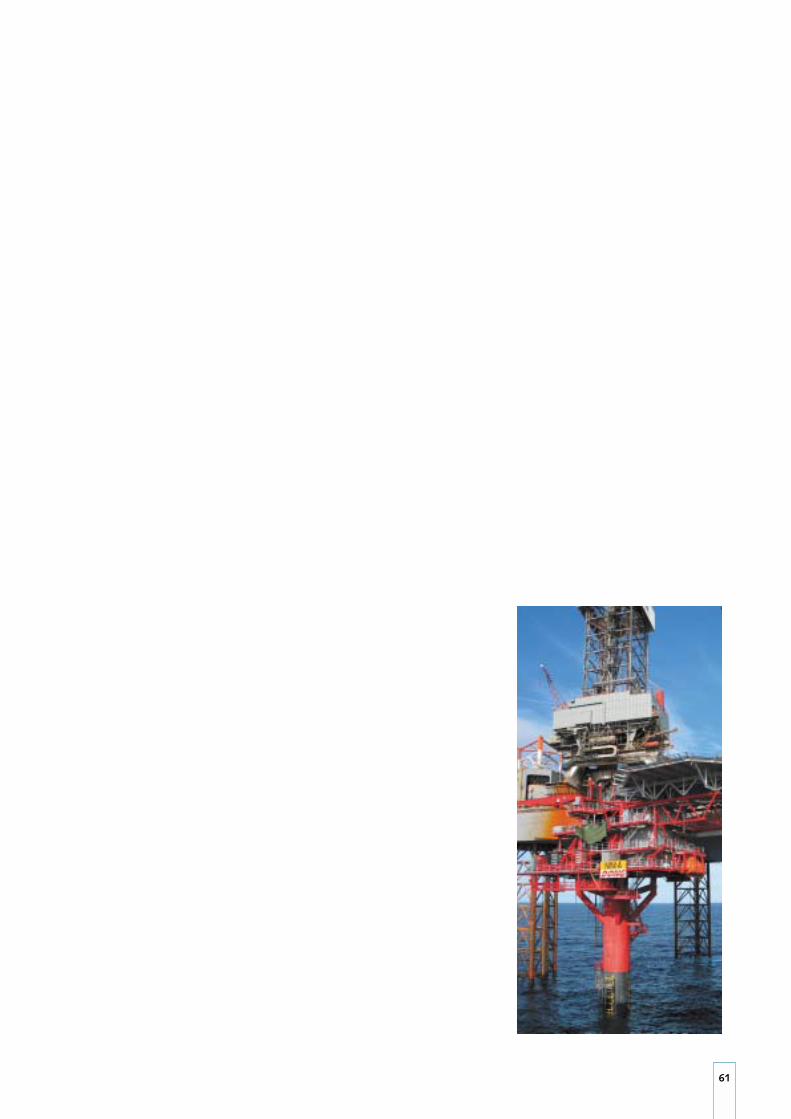
61

62
A P P E N D I X A
AMOUNTS PRODUCED AND INJECTED OIL thousand cubic metres
Tota
l
1972
-93
1994
1995
1996
1997
1998
1999
2000
2001
2002
2003
Dan 18,366 3,496 3,713 3,799 3,858 4,767 5,745 6,599 6,879 6,326 5,929 69,477
Gorm 19,847 2,421 2,494 2,879 3,045 2,865 3,384 3,110 2,180 2,887 2,838 47,950
Skjold 17,542 1,715 1,979 2,023 2,011 1,896 1,825 1,975 1,354 1,659 1,529 35,509
Tyra 9,609 1,748 1,631 1,447 1,263 931 892 1,000 872 801 918 21,111
Rolf 2,936 92 216 218 96 92 77 83 51 51 104 4,016
Kraka 739 490 469 340 315 314 404 350 253 157 139 3,970
Dagmar 848 33 35 23 17 13 10 8 4 6 7 1,003
Regnar 145 429 86 41 27 43 29 14 33 18 19 885
Valdemar 53 304 165 161 159 95 86 77 181 353 435 2,070
Roar - - - 319 427 327 259 285 317 175 121 2,231
Svend - - - 836 1,356 635 521 576 397 457 279 5,056
Harald - - - - 794 1,690 1,332 1,081 866 581 425 6,768
Lulita - - - - - 143 224 179 66 22 20 654
Halfdan - - - - - - 222 1,120 2,965 3,718 4,355 12,380
Siri - - - - - - 1,593 2,118 1,761 1,487 925 7,884
South Arne - - - - - - 757 2,558 2,031 2,313 2,383 10,042
Tyra SE - - - - - - - - - 493 343 835
Cecilie - - - - - - - - - - 166 166
Nini - - - - - - - - - - 391 391
Sif - - - - - - - - - - 1 1
Total 70,085 10,727 10,788 12,087 13,367 13,810 17,362 21,134 20,207 21,505 21,327 232,399
Production and sales
GAS million normal cubic metresProduction
Dan 7,419 1,263 1,331 1,249 1,116 1,343 1,410 1,186 1,049 945 786 19,099
Gorm 8,723 922 761 674 609 633 537 426 306 479 339 14,408
Skjold 1,528 185 188 160 189 146 154 158 104 124 92 3,026
Tyra 27,307 3,646 3,839 3,843 4,229 3,638 3,878 3,826 3,749 3,948 3,993 65,898
Rolf 124 4 9 9 4 4 3 4 2 2 4 169
Kraka 269 119 128 95 85 106 148 119 100 52 25 1,245
Dagmar 124 8 5 4 3 2 2 2 1 1 3 155
Regnar 8 25 7 4 2 4 2 1 3 1 2 59
Valdemar 29 96 52 57 89 54 49 55 78 109 151 819
Roar - - 0 1,327 1,964 1,458 1,249 1,407 1,702 1,052 917 11,076
Svend - - 0 85 152 84 65 75 48 61 43 612
Harald - - - 0 1,092 2,741 2,876 2,811 2,475 2,020 1,563 15,577
Lulita - - - - - 69 181 160 27 5 5 448
Halfdan - - - - - - 37 178 522 759 1,139 2,634
Siri - - - - - - 142 197 176 157 110 781
South Arne - - - - - - 167 713 774 681 544 2,879
Tyra SE - - - - - - - - - 447 452 898
Cecilie - - - - - - - - - - 14 14
Nini - - - - - - - - - - 29 29
Sif - - - - - - - - - - 3 3
Total 45,530 6,269 6,321 7,506 9,534 10,281 10,901 11,316 11,116 10,844 10,213 139,829
Tota
l
1972
-93
1994
1995
1996
1997
1998
1999
2000
2001
2002
2003
The monthly production figures for 2003 are available on the Danish Energy Authority’s homepage www.ens.dk
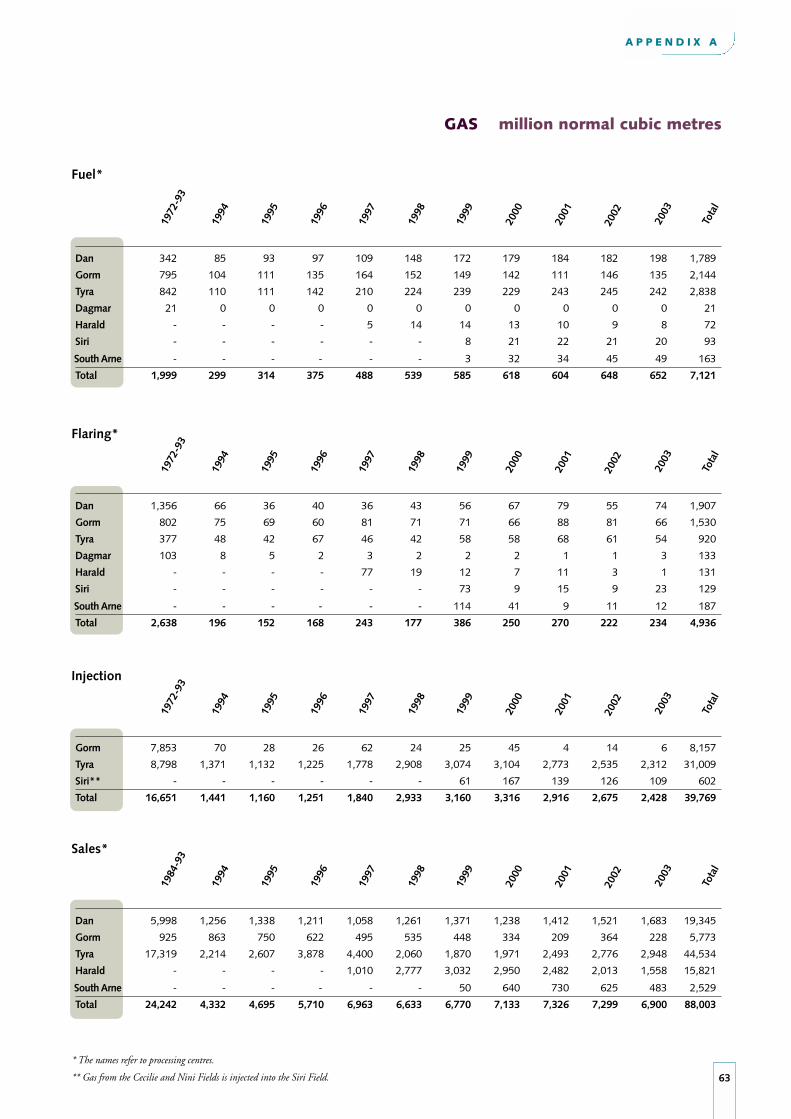
A P P E N D I X A
63
GAS million normal cubic metres
Fuel*
Flaring*
Injection
Sales*
Dan 342 85 93 97 109 148 172 179 184 182 198 1,789
Gorm 795 104 111 135 164 152 149 142 111 146 135 2,144
Tyra 842 110 111 142 210 224 239 229 243 245 242 2,838
Dagmar 21 0 0 0 0 0 0 0 0 0 0 21
Harald - - - - 5 14 14 13 10 9 8 72
Siri - - - - - - 8 21 22 21 20 93
South Arne - - - - - - 3 32 34 45 49 163
Total 1,999 299 314 375 488 539 585 618 604 648 652 7,121
Dan 1,356 66 36 40 36 43 56 67 79 55 74 1,907
Gorm 802 75 69 60 81 71 71 66 88 81 66 1,530
Tyra 377 48 42 67 46 42 58 58 68 61 54 920
Dagmar 103 8 5 2 3 2 2 2 1 1 3 133
Harald - - - - 77 19 12 7 11 3 1 131
Siri - - - - - - 73 9 15 9 23 129
South Arne - - - - - - 114 41 9 11 12 187
Total 2,638 196 152 168 243 177 386 250 270 222 234 4,936
Gorm 7,853 70 28 26 62 24 25 45 4 14 6 8,157
Tyra 8,798 1,371 1,132 1,225 1,778 2,908 3,074 3,104 2,773 2,535 2,312 31,009
Siri** - - - - - - 61 167 139 126 109 602
Total 16,651 1,441 1,160 1,251 1,840 2,933 3,160 3,316 2,916 2,675 2,428 39,769
Dan 5,998 1,256 1,338 1,211 1,058 1,261 1,371 1,238 1,412 1,521 1,683 19,345
Gorm 925 863 750 622 495 535 448 334 209 364 228 5,773
Tyra 17,319 2,214 2,607 3,878 4,400 2,060 1,870 1,971 2,493 2,776 2,948 44,534
Harald - - - - 1,010 2,777 3,032 2,950 2,482 2,013 1,558 15,821
South Arne - - - - - - 50 640 730 625 483 2,529
Total 24,242 4,332 4,695 5,710 6,963 6,633 6,770 7,133 7,326 7,299 6,900 88,003
Tota
l
1972
-93
1994
1995
1996
1997
1998
1999
2000
2001
2002
2003
Tota
l
1972
-93
1994
1995
1996
1997
1998
1999
2000
2001
2002
2003
Tota
l
1972
-93
1994
1995
1996
1997
1998
1999
2000
2001
2002
2003
Tota
l
1984
-93
1994
1995
1996
1997
1998
1999
2000
2001
2002
2003
* The names refer to processing centres.
** Gas from the Cecilie and Nini Fields is injected into the Siri Field.

A P P E N D I X A
Production
Dan 2,290 1,117 1,275 1,543 1,845 2,976 4,220 5,277 6,599 6,348 7,182 40,673
Gorm 5,495 824 948 1,921 2,906 3,177 3,468 3,980 3,353 4,017 4,420 34,510
Skjold 1,186 889 1,337 2,679 3,635 3,938 3,748 4,333 2,872 3,007 3,523 31,147
Tyra 2,847 1,290 1,749 2,161 2,215 2,020 2,033 3,046 2,545 2,261 3,038 25,205
Rolf 1,468 161 443 490 390 411 366 358 181 168 270 4,706
Kraka 371 188 251 272 287 347 329 256 352 306 208 3,166
Dagmar 623 367 464 507 408 338 246 241 102 160 375 3,831
Regnar 0 244 396 299 164 407 363 139 475 257 316 3,060
Valdemar 1 24 20 34 61 52 55 48 150 272 310 1,026
Roar - - - 14 96 146 199 317 386 301 477 1,937
Svend - - - 2 64 272 582 1,355 954 1,051 1,330 5,611
Harald - - - - - 5 15 39 98 78 43 279
Lulita - - - - - 3 5 11 23 15 16 74
Halfdan - - - - - - 56 237 493 367 500 1,653
Siri - - - - - - 319 1,868 2,753 3,041 2,891 10,872
South Arne - - - - - - 15 60 119 390 751 1,334
Tyra SE - - - - - - - - - 250 596 846
Cecilie - - - - - - - - - - 25 25
Nini - - - - - - - - - - 3 3
Sif - - - - - - - - - - 0 0
Total 14,281 5,103 6,882 9,922 12,072 14,093 16,020 21,566 21,456 22,289 26,274 169,958
Injection
Dan 2,838 3,808 5,884 8,245 8,654 11,817 14,964 17,464 18,176 16,123 18,063 126,035
Gorm 6,007 4,612 5,749 8,112 8,642 8,376 8,736 10,641 6,549 8,167 7,066 82,657
Skjold 18,194 3,511 3,985 5,712 6,320 6,291 5,866 6,520 4,805 6,411 6,115 73,730
Halfdan - - - - - - 82 13 620 2,532 5,162 8,410
Siri - - - - - - 1,236 3,778 4,549 4,507 3,383 17,453
South Arne - - - - - - - 52 1,991 4,397 5,316 11,755
Nini - - - - - - - - - - 71 71
Total 27,038 11,931 15,618 22,069 23,616 26,484 30,884 38,469 36,689 42,138 45,175 320,112
Tota
l
1972
-93
1994
1995
1996
1997
1998
1999
2000
2001
2002
2003
Tota
l
1972
-93
1994
1995
1996
1997
1998
1999
2000
2001
2002
2003
Water injection includes the injection of produced water and sea water. Most of the water produced in the Gorm, Skjold, Dagmar and Siri Fields is re-injected.
WATER thousand cubic metres
CO2 EMISSIONS thousand tons
Fuel 4,550 681 715 853 1,110 1,226 1,337 1,460 1,442 1,562 1,576 16,512
Flaring 6,005 448 345 382 553 402 1,074 641 637 531 549 11,567
Total 10,555 1,130 1,061 1,235 1,664 1,628 2,410 2,101 2,079 2,092 2,125 28,079
Tota
l
1972
-93
1994
1995
1996
1997
1998
1999
2000
2001
2002
2003
64
Calorific value of gas (South Arne) : 70 MJ/Nm3
Calorific value of gas (all other installations): 40 MJ/Nm3
Emission factor :
Before 2000 56.9 kg CO2/GJ
2001 57.25 kg CO2/GJ
2002 57.28 kg CO2/GJ
2003 57.19 kg CO2/GJ

A P P E N D I X B
65
REVIEW OF GEOLOGY The Cecilie Field is an anticlinal structure induced through salt tectonics. Faults
and shifted sands delimit the accumulation, which is thus a combined structural
and stratigraphic trap.
PRODUCTION STRATEGY Recovery is based on water injection to maintain reservoir pressure. The production
wells will be drilled in the crest of the structure, while water will be injected in the
flank of the field.
PRODUCTION FACILITIES Cecilie is a satellite development to the Siri Field with one unmanned wellhead
platform. The unprocessed production is transported to the Siri platform through
a 12" multiphase pipeline. The oil is processed at the Siri platform and exported
to shore via tanker. The gas produced is injected into the Siri Field. Injection water
is conveyed to the Cecilie Field through a 10" pipeline.
CECILIE FIELD
Location: Blocks 5604/19 and 20
Licence: 16/98
Operator: DONG E&P A/S
Discovered: 2000
Year on stream: 2003
Producing wells: 1
Water depth: 60 m
Field delineation: 13.4 km2
Reservoir depth: 2,200 m
Reservoir rock: Sandstone
Geological age: Paleocene
Reserves
at 1 January 2004:
Oil: 1.7 million m3
Gas: 0.0 billion Nm3
Cum. production
at 1 January 2004:
Oil: 0.17 million m3
Gas:* 0.01 billion Nm3
Water: 0.03 million m3
Production in 2003:
Oil: 0.17 million m3
Gas:* 0.01 billion Nm3
Water: 0.03 million m3
Total investments
at 1 January 2004:
2003 prices DKK 0.9 billion
2200
22152210
2205
2195
2190
2220
2215
2210
2220
22202210
22052190
2220
2195
2200
2210
CA-1ACecilie-1
Cecilie-1B
Cecilie-2
0 0.5 1 km
Drilled in 2003
Cecilie Field
Top PaleoceneDepth structure map in metres
CA-2
Closed oil well
Platform
Oil well
Cecilie-1A
CA-2C
PRODUCING FIELDS
*The gas has been injected into the Siri Field.

66
A P P E N D I X B
REVIEW OF GEOLOGYThe Dagmar field is an anticlinal structure, induced through Zechstein salt tectonics.
The uplift is so pronounced that the Dagmar oil reservoir is situated closer to the
surface than any other hydrocarbon reservoirs in Danish territory. The reservoir is
heavily fractured (compare Skjold, Rolf, Regnar and Svend). However, the water
zone does not appear to be particularly fractured.
PRODUCTION STRATEGYInitially, the oil production rates were high in the Dagmar Field, but it has not
been possible to sustain the good production performance characterizing the
Skjold, Svend and Rolf Fields.
PRODUCTION FACILITIESThe Dagmar Field is a satellite development to Gorm including one unmanned
wellhead platform of the STAR type. The unprocessed production is transported to
the Gorm F platform in the Gorm Field, where special facilities for handling the
sour gas from the Dagmar Field have been installed. The relatively small amount of
gas produced from Dagmar is flared due to the high content of hydrogen sulphide.
DAGMAR FIELD
Prospect: East Rosa
Location: Block 5504/15
Licence: Sole Concession
Operator: Mærsk Olie og Gas AS
Discovered: 1983
Year on stream: 1991
Producing wells: 2
Water depth: 34 m
Area: 9 km2
Reservoir depth: 1,400 m
Reservoir rock: Chalk and Carbonates
Geological age: Danian,
Upper Cretaceous
and Zechstein
Reserves
at 1 January 2004:
Oil: 0.1 million m3
Gas: 0.0 billion Nm3
Cum. production
at 1 January 2004:
Oil: 1.00 million m3
Gas: 0.16 billion Nm3
Water: 3.83 million m3
Production in 2003:
Oil: 0.01 million m3
Gas: 0.00 billion Nm3
Water: 0.38 million m3
Total investments
at 1 January 2004:
2003 prices DKK 0.4 billion
East Rosa-3A
East Rosa-3
4500
5500
5000
5000
4500
Dagmar-5
Dagmar-4AEast Rosa-1
Dagmar-7A/-7B
Dagmar-7P
Dagmar-7
East Rosa Fl.-1
Salt Pinnacle
East Rosa-2
Dagmar-6
4000
30003500
3000
3500
4000
5000
4500
Closed well trajectory
Platform
Oil well
0 1 km0.5
Dagmar Field
Depth structure map in feet
Top Chalk

A P P E N D I X B
67
DAN FIELD
Prospect: Abby
Location: Block 5505/17
Licence: Sole Concession
Operator: Mærsk Olie og Gas AS
Discovered: 1971
Year on stream: 1972
Producing wells: 56
Water-injection wells: 48
Water depth: 40 m
Field delineation: 121 km2
Reservoir depth: 1,850 m
Reservoir rock: Chalk
Geological age: Danian and Upper
Cretaceous
Reserves
at 1 January 2004:
Oil: 62.5 million m3
Gas: 8.2 billion Nm3
Cum. production
at 1 January 2004:
Oil: 69.48 million m3
Gas: 19.10 billion Nm3
Water: 40.67 million m3
Cum. injection
at 1 January 2004:
Water: 126.04 million m3
Production in 2003:
Oil: 5.93 million m3
Gas: 0.79 billion Nm3
Water: 7.18 million m3
Injection in 2003:
Water: 18.06 million m3
Total investments
at 1 January 2004:
2003 prices DKK 22.0 billion
REVIEW OF GEOLOGYDan is an anticlinal structure partly induced through salt tectonics. A major fault
divides the field into two reservoir blocks, which, in turn, are intersected by a
number of minor faults. The chalk reservoir has high porosity, although low perme-
ability. There is a gas cap in the field.
PRODUCTION STRATEGYRecovery from the field is based on the simultaneous production of oil and injection
of water. Water injection was initiated in 1989, and later high-rate water injection was
introduced in large sections of the field. The high pressure involved causes the inject-
ed water to fracture the chalk, ensuring the rapid distribution of water throughout
the reservoir. Injecting large amounts of water quickly stabilizes and builds up the
reservoir pressure in the oil zone. The recovery of oil is optimized by flooding the
largest possible reservoir volume with water.
In addition, production takes place in the western flank of the Dan Field.
Recovery is also based on water injection in this part of the field.
PRODUCTION FACILITIESThe Dan Field installations comprise six wellhead platforms (DA, DD, DE, DFA,
DFB and DFE), two processing/accommodation platforms (DB and DFC) and two
gas flare stacks (DC and DFD), as well as a combined wellhead and processing
platform (DFF).
At the Dan Field, there are receiving facilities for the production from the Kraka
and Regnar satellite fields. Moreover, the Dan Field installations handle gas pro-
duction from the Halfdan Field and also provide the Halfdan Field with injection
water.
After final processing, the oil is transported to shore via the booster platform,
Gorm E. The gas is pre-processed and transported to Tyra East for final processing.
In the Dan Field, there are accommodation facilities for 86 persons on the DFC
platform and five persons on the DB platform.
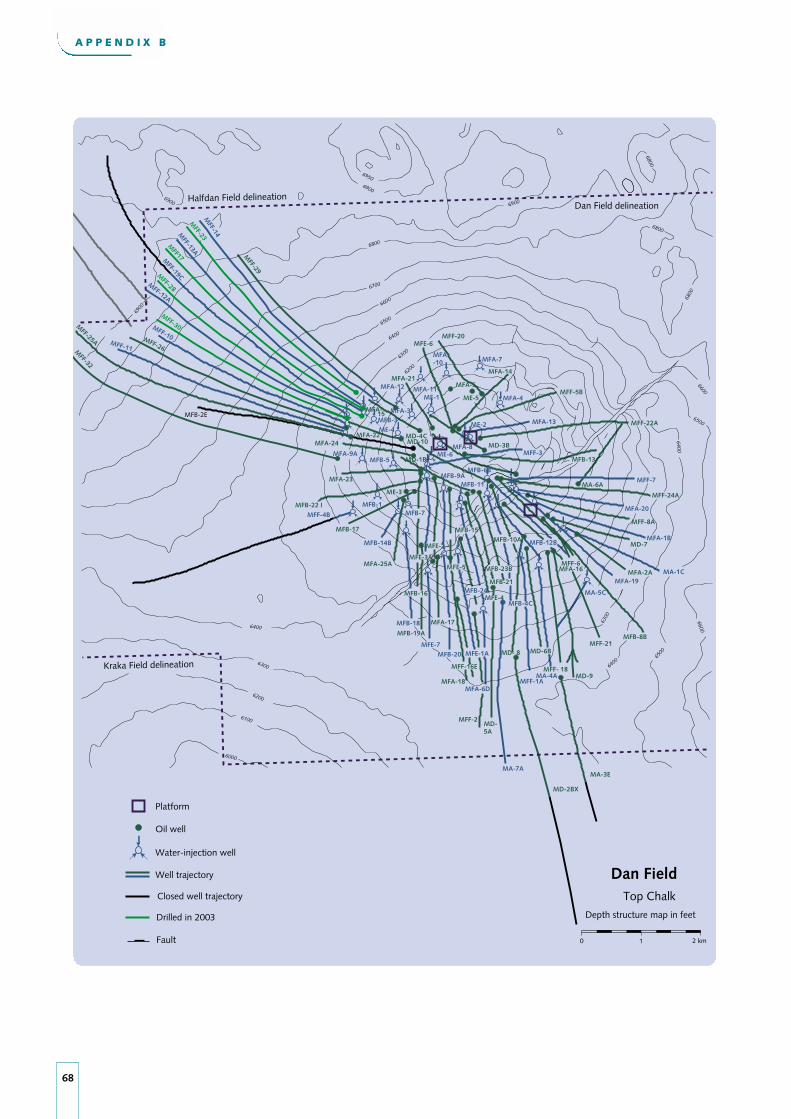
68
A P P E N D I X B
Halfdan Field delineationDan Field delineation
Kraka Field delineation
Closed well trajectory
Water-injection well
Oil well
Well trajectory
Fault
Drilled in 2003
Platform
Dan FieldTop Chalk
2 km0 1
Depth structure map in feet
6900
6900
6000
6100
6200
6300
6300
640065
00
6400
6900
6950
6800
6700
6600
6500
6400
6300
6200
6900
6800
6800
6800
6600
6500
6400
6600
MA-7A
MFB-4C
MD-5A
MFB-12BMFE-2
MFE-3A
MFB-24
MFB-7
MFA-6D
MFF-2
MFA-18
MFF-16E
MFE-1A
MFA-17
MFB-19A
MFB-16
MFB-5
MFB-1
ME-3
MFA-25A
MFB-14B
MFB-17
MFF-4B
MFB-22 I
MFA-23
MFA-9A
MFA-24MFA-22
MFB-2EMFB-3ME-4
MFA-12
MFA-3
ME-1
MFA-8ME-6
ME-2
MFA-4ME-5
MFA-5
MD-3B
MFA-21
MD-10MD-4C
MFE-6
MFA-7MFA-10
MFA-11
MFA-14
MFF-5B
MFA-13 MFF-22A
MFB-13MFF-3
MFF-1A
MFB-8B
MA-6AMFF-7
MFF-24A
MFA-20
MFF-8A
MFA-1B
MA-5C
MA-4A
MD-6BMD- 8
MD-9
MD-7
MFA-2AMFA-19
MA-1CMFA-16MFF-6
MFB-6B
MFB-10A
MFB-18
MFE-7MFB-20
MFB-11
MD-1B
MFB-15
MFB-9A
MFE-5
MFE-4
MFB-21
MFB-23B
MFF- 18
MFF-21
MFF-14M
FF-13A
MFF-12A
MFF-11
MFF-10
MFA-15
MA-3E
MD-2BX
MFF-20
MFF-25A
MFF-29
MFF-32
MFF-26
MFF-28
MFF-30
MFF-23
MFF17M
FF-19C
A P P E N D I X B
69
REVIEW OF GEOLOGYGorm is an anticlinal structure partly due to salt tectonics. A major fault extending
north-south divides the field into two reservoir blocks. The western reservoir block
is intersected by numerous, minor faults.
PRODUCTION STRATEGYIn 1989, water injection was initiated in the reservoir. Oil production from the
field is based on extending the use of water injection to the whole field. Water is
injected into the water and oil zones of the field.
If gas exports to Tyra are interrupted, the gas is injected into the Gorm Field.
PRODUCTION FACILITIESThe Gorm Field consists of two wellhead platforms (Gorm A and Gorm B), one
processing/accommodation platform (Gorm C), one gas flare stack (Gorm D), one
riser/booster platform (Gorm E), owned by DONG Olierør A/S, and one combined
wellhead/processing/booster platform (Gorm F).
Gorm receives production from the satellite fields, Skjold, Rolf and Dagmar, as
well as the liquids (hydrocarbons and water) produced in the Halfdan Field. The
Gorm Field installations supply the Skjold Field with injection water and lift gas
and the Rolf Field with lift gas. The gas produced is sent to Tyra East. The stabilized
oil from all DUC’s processing facilities is transported ashore via the booster plat-
form Gorm E.
The processing facilities on the Gorm C platform consist of an oil stabilization
plant, where the oil from the Rolf and Halfdan Fields is processed, produced-
water treatment plant and facilities for processing and compressing the gas pro-
duced.
The processing facilities on the Gorm F platform consist of two oil stabilization
plants, one receiving the sour oil and gas from the Dagmar Field, and the other
receiving the production from the Gorm and Skjold Fields.
The Gorm F platform houses wellhead compression facilities to reduce the well-
head pressure in the Gorm and Skjold wells.
There are accommodation facilities on the Gorm C platform for 98 persons.
GORM FIELD
Prospect: Vern
Location: Blocks 5504/15 and 16
Licence: Sole Concession
Operator: Mærsk Olie og Gas AS
Discovered: 1971
Year on stream: 1981
Producing wells: 35
Gas-injection wells: 2
Water-injection wells: 14
Water depth: 39 m
Field delineation: 33 km2
Reservoir depth: 2,100 m
Reservoir rock: Chalk
Geological age: Danian and Upper
Cretaceous
Reserves
at 1 January 2004:
Oil: 11.9 million m3
Gas: 1.2 billion Nm3
Cum. production
at 1 January 2004:
Oil: 47.95 million m3
Net gas: 6.25 billion Nm3
Water: 34.51 million m3
Cum. injection
at 1 January 2004:
Gas: 8.16 billion Nm3
Water: 82.66 million m3
Production in 2003:
Oil: 2.84 million m3
Net gas: 0.33 billion Nm3
Water: 4.42 million m3
Injection in 2003:
Gas: 0.01 billion Nm3
Water: 7.07 million m3
Total investments
at 1 January 2004:
2003 prices DKK 10.9 billion
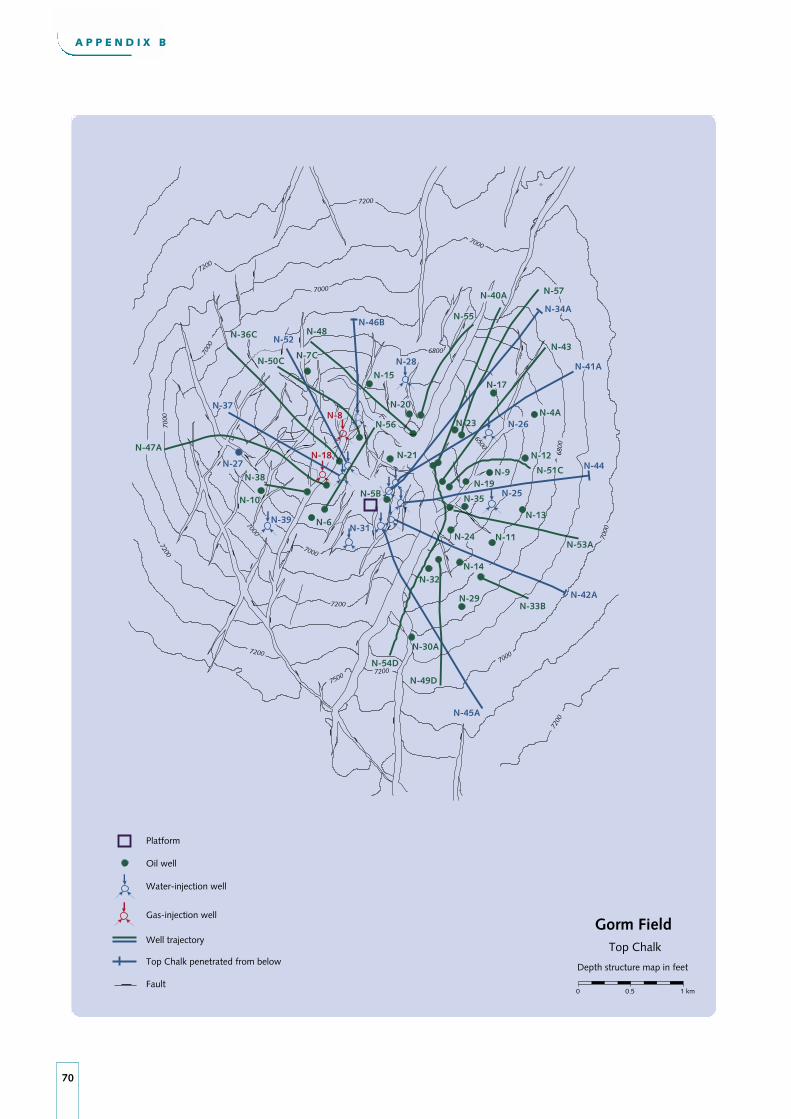
70
A P P E N D I X B
0 1 km0.5
7000
7000
7000
7000
6800
N-46BN-36C
N-50C
N-37
N-38
N-47A
N-10
N-6N-397000
7000
7200
7500 N-49D
N-45A
N-33BN-29 N-42A
N-14
N-11N-24N-31
N-21
N-5B
N-48
N-15
6500N-34A
N-43
N-41A
N-17
N-4A
N-44N-12
N-25
N-13
N-9
6800
7000
7000
7200
N-52
N-7CN-28
7200
7200
7200
N-53A
N-8
N-18
N-32
N-20
N-40A
N-35
N-26
N-19
N-30A7200
7200N-54D
N-51CN-27
N-55
N-56
N-57
N-23
Gorm FieldTop Chalk
Depth structure map in feet
Water-injection well
Gas-injection well
Fault
Oil well
Platform
Well trajectory
Top Chalk penetrated from below
A P P E N D I X B
71
REVIEW OF GEOLOGYThe Halfdan accumulation is found in a pocket in chalk layers and constituted a
structural trap in earlier geological times. Due to later movements in the reservoir
layers, the structure gradually disintegrated, and the oil began migrating away from
the area. This means that today the structure does not appear from maps of the chalk
surface, and that the oil continues to migrate. However, there is still an accumulation
of oil and gas due to the low permeability of the reservoir. This porous, unfractured
chalk is similar to that found in the western flank of the Dan Field. There is a gas
cap above the northeastern part of the oil accumulation.
PRODUCTION STRATEGYThe recovery of oil and gas from the field is based on pressure support from water
injection. The wells are arranged in a pattern of alternate production and injection
wells with parallel well trajectories, about 180 metres apart. The injection wells
are stimulated with acid, which makes it possible to inject large volumes of water.
The regular spacing of the wells optimizes the flooding of the reservoir, thus
enhancing recovery.
PRODUCTION FACILITIESThe installations in the field consist of a wellhead platform (HDA) with minimal
production facilities. The operation of the wellhead platform is supported by a
drilling rig. Production is separated into a gas and a liquid phase (oil and water).
The liquid production is conveyed by pipeline to the Gorm Field, and the gas
produced is transported through a pipeline to the Dan Field. The Gorm and Dan
Field installations process the production from the Halfdan Field. In addition, Dan
supplies the Halfdan Field with injection water. Another wellhead platform (HBA)
is placed about 2 km northeast of the HDA platform. As a temporary measure, the
separated hydrocarbons produced from the HBA platform are conveyed via the
HDA platform to the Gorm and Dan Fields for final processing.
The HDA platform installations have been further expanded by adding a processing
module for three-phase separation with water-processing and gas-processing/
compression facilities. Moreover, a 32-person accommodation platform (HDB)
and a flare stack (HDC) have been installed, both with bridge connection to the
HDA platform.
HALFDAN FIELD
Prospect: Nana
Location: Blocks 5505/13
and 5504/16
Licence: Sole Concession
Operator: Mærsk Olie og Gas AS
Discovered: 1999
Year on stream: 1999
Producing wells: 26
Water-injection wells: 13
Water depth: 43 m
Field delineation: 107 km2
Reservoir depth: 2,100 m
Reservoir rock: Chalk
Geological age: Danian and Upper
Cretaceous
Reserves
at 1 January 2004:
Oil: 69.4 million m3
Gas: 9.0 billion Nm3
Cum. production
at 1 January 2004:
Oil: 12.38 million m3
Gas: 2.63 billion Nm3
Water: 1.65 million m3
Cum. injection
at 1 January 2004:
Water: 8.41 million m3
Production in 2003:
Oil: 4.36 million m3
Gas: 1.14 billion Nm3
Water: 0.50 million m3
Injection in 2003:
Water: 5.16 million m3
Total investments
at 1 January 2004:
2003 prices DKK 6.7 billion

72
A P P E N D I X B
HDA-2X
HDA-6
Nana-1XD
6800
6900
6700
6800
7100
7000
650060005500
5300
7000
Skjold Field delineation
Sif FieldTop Chalk
0 1 2 km
Depth structure map in feet
Dan Field delineation
Halfdan Field delineationHBA-1HDA -7
HDA-13A
HDA-36HDA-38
HDA-32AHDA-34C
HDA-28
HDN-1X
HDA-11
HDA-16
Oil well
Well trajectory
Water-injection well
Drilled in 2003
Platform
Closed well trajectory
HDA- 3XA
HDA-22A
HDA-27
HDA-26
HDA-24HDA-8
HDA-15
HDA-4
HDA-5A
Sif-1X
HDA-17
HDA-37HBA-11
HDA-12
HBA
HBA-4
HBA-3HBA-2
HDA -23
HDA -18
HDA -35HDA -25
HDA-33
HDA-31
HBA-12
HBA-7HBA-5
Sif Field delineation
Tyra SE delineation
Halfdan Field
HBA-13X
HDN-2X
A P P E N D I X B
73
REVIEW OF GEOLOGYThe Harald Field consists of two accumulations, Lulu (Harald East) and West Lulu
(Harald West), which contain gas mainly.
The Lulu structure is an anticline induced through salt tectonics. The gas zone is
up to 75 metres thick and extends over an area of 6.5 km2.
The West Lulu structure is a tilted Jurassic fault block. The sandstone reservoir is
of Middle Jurassic age, and is situated at a depth of about 3,600 metres. The effec-
tive thickness of the sandstone is 100 metres.
PRODUCTION STRATEGYRecovery from both the Lulu and the West Lulu reservoir takes place by letting
the gas expand, supplemented by a moderate, natural influx of water into the
reservoir.
Production from the Harald Field is based on the aim of optimizing the production
of liquid hydrocarbons in the Tyra Field. This presupposes that the Tyra reservoir
pressure is stabilized by maximizing production from the other gas fields and thus
minimizing the drainage from the Tyra Field. Therefore, increased production
from the Harald Field helps optimize the Tyra production conditions.
PRODUCTION FACILITIESThe Harald Field installations comprise a combined wellhead and processing plat-
form (Harald A) and an accommodation platform (Harald B).
The processing facilities consist of a plant that separates the hydrocarbons produced,
as well as a plant for the final processing of the gas produced.
The unprocessed condensate and the processed gas are transported to Tyra East.
The Harald Field is hooked up to the gas pipeline that conveys gas from the South
Arne Field to Nybro. Normally, no gas is exported from Harald through the pipe-
line.
The Harald Field has accommodation facilities for 16 persons.
HARALD FIELD
Prospect: Lulu/West Lulu
Location: Blocks 5604/21 and 22
Licence: Sole Concession
Operator: Mærsk Olie og Gas AS
Discovered: 1980(Lulu)
1983(West Lulu)
Year on stream: 1997
Producing wells: 2 (Lulu), 2 (West Lulu)
Water depth: 64 m
Field delineation: 56 km2
Reservoir depth: 2,700 m and 3,650 m,
respectively
Reservoir rock: Chalk (Lulu)
Sandstone (West Lulu)
Geological age: Danian/Upper
Cretaceous (Lulu)
Middle Jurassic
(West Lulu)
Reserves
at 1 January 2004:
Oil and condensate: 1.2 million m3
Gas: 5.3 billion Nm3
Cum. production
at 1 January 2004:
Oil and condensate: 6.77 million m3
Gas: 15.58 billion Nm3
Water: 0.28 million m3
Production in 2003:
Oil and condensate: 0.43 million m3
Gas: 1.56 billion Nm3
Water: 0.04 million m3
Total investments
at 1 January 2004:
2003 prices DKK 3.2 billion

74
A P P E N D I X B
0 1 2 km
Depth structure map in feet
Harald Field Lulita Field
Oil well
Gas well
Well trajectory
Fault
Harald EastTop Chalk
Harald WestTop Middle Jurassic
Top Middle Jurassic
Lulita Field delineation
Harald Field delineation
Platform
Lulu-1
Lulu-2
9000
9100
9000
9100
92009300
9000
9100
12000
V. Lulu-3
V. Lulu-1
HWA-7AHWA-8B
V.Lulu-2
11500
1200
0
1220
0
12300
1200
0
1220
0
12000
12500
11500
11400
1150012500
12300
1250
0
12500
11700
12000
11500
9200
HEA-6
12300
9100
12100
12200
1200011900
11800
11500
Lulita-2
Lulita-1XC
Lulita
HEA-3E

A P P E N D I X B
75
REVIEW OF GEOLOGYKraka is an anticlinal structure induced through salt tectonics, which to a certain
degree has caused fracturing in the chalk. The chalk reservoir has reasonable
porosity, although low permeability. The thin oil pay zone is further characterized
by high water saturations. There is a minor gas cap in the reservoir.
PRODUCTION STRATEGYThe production of oil and gas from the field is based on natural depletion, meaning
no secondary recovery techniques are used, either in the form of gas or water
injection. Measures are continuously taken to optimize production so as to liberate
as much oil, and as little water, as possible from the tight chalk formation.
PRODUCTION FACILITIESKraka is a satellite development to the Dan Field, with an unmanned wellhead
platform of the STAR type. The produced oil and gas are transported to the Dan
FC platform for processing and export ashore. Lift gas is imported from the Dan
FF platform.
KRAKA FIELD
Prospect: Anne
Location: Block 5505/17
Licence: Sole Concession
Operator: Mærsk Olie og Gas AS
Discovered: 1966
Year on stream: 1991
Producing wells: 7
Water depth: 45 m
Field delineation: 81 km2
Reservoir depth: 1,800 m
Reservoir rock: Chalk
Geological age: Danian and Upper
Cretaceous
Reserves
at 1 January 2004:
Oil: 0.8 million m3
Gas: 0.9 billion Nm3
Cum. production
at 1 January 2004:
Oil: 3.97 million m3
Gas: 1.25 billion Nm3
Water: 3.17 million m3
Production in 2003:
Oil: 0.14 million m3
Gas: 0.03 billion Nm3
Water: 0.21 million m3
Total investments
at 1 January 2004:
2003 prices DKK 1.4 billion
Dan Field delineation
Kraka Field delineation
Kraka Field
0 1 2 km
Top Chalk
Depth structure map in feetOil well
Well trajectory
Platform
6300
A-5H I
A-4HA-4P
A-10C
A-5HA-10P
A-9A-6A-8 I
A-3
A-7C
A-1A-2
A-6AA-6 II
A-6 I
6000
6000
6500
6300
6800

REVIEW OF GEOLOGYThe Lulita Field is a structural fault trap with a Middle Jurassic sandstone reservoir.
The accumulation consists of oil with a gas cap.
PRODUCTION STRATEGYThe production of oil and gas is based on natural depletion.
PRODUCTION FACILITIESProduction from the Lulita Field takes place from the fixed installations in the
Harald Field. Thus, the Lulita wellheads are hosted by the Harald A platform, and
the Harald platform facilities also handle production from the Lulita Field.
Together with condensate from the Harald Field, the oil produced is conveyed
through a 16" pipeline to Tyra East for export ashore. The gas produced in the
Lulita Field is transported to Tyra through the 24" pipeline connecting Harald with
Tyra East, from where it is transported to shore.
The Harald A platform has special equipment for separate metering of the oil and
gas produced from the Lulita Field.
The map of the Harald Field includes the Lulita Field.
LULITA FIELD
Location: Blocks 5604/18 and 22
Licence: Sole Concession (50%),
7/86 (34.5%) and
1/90 (15.5%)
Operator: Mærsk Olie og Gas AS
Discovered: 1992
Year on stream: 1998
Producing wells: 2
Water depth: 65 m
Area: 3 km2
Reservoir depth: 3,525 m
Reservoir rock: Sandstone
Geological age: Middle Jurassic
Reserves
at 1 January 2004:
Oil: 0.2 million m3
Gas: 0.0 billion Nm3
Cum. production
at 1 January 2004:
Oil: 0.65 million m3
Gas: 0.45 billion Nm3
Water: 0.07 million m3
Production in 2003:
Oil: 0.02 million m3
Gas: 0.01 billion Nm3
Water: 0.02 million m3
Total investments
at 1 January 2004:
2003 prices DKK 0.1 billion
76
A P P E N D I X B

A P P E N D I X B
77
NINI FIELD
Location: Blocks 5605/10 and 14
Licence: 4/95
Operator: DONG E&P A/S
Discovered: 2000
Year on stream: 2003
Producing wells: 2
Water-injection wells: 1
Water depth: 60 m
Field delineation: 48.8 km2
Reservoir depth: 1,700 m
Reservoir rock: Sandstone
Geological age: Paleogene
Reserves
at 1 January 2004:
Oil: 3.9 million m3
Gas: 0.0 billion Nm3
Cum. production
at 1 January 2004:
Oil: 0.39 million m3
Gas:* 0.03 million Nm3
Water: 0.00 million m3
Cum. injection
at 1 January 2004:
Water: 0.07 million m3
Production in 2003:
Oil: 0.39 million m3
Gas:* 0.03 million Nm3
Water: 0.00 million m3
Injection in 2003:
Water: 0.07 million m3
Total investments
at 1 January 2004:
2003 prices DKK 2.0 billion
1760
1700
1720
1760
1760
1740
1720
1680
1720
1740
1760
1700
1680
1700
Drilled in 2003
Nini Field
Depth structure map in metres
Na-3B
Na-1
Fault0 0.5 1 km
Nini-1
Top of Paleogene reservoirs
Na-5
Na-2B
Na-2A
Na-4A
Nini West Nini
Closed well trajectory
Closed oil well
Platform
Oil well
* The gas has been injected into the Siri Field.
REVIEW OF GEOLOGY The Nini accumulation is defined by a combined structural and stratigraphic trap,
the anticlinal structure being induced through salt tectonics. The reservoir consists
of channel sands deposited in the Siri Fairway. The Nini Field also includes the
Nini West area.
PRODUCTION STRATEGY The production strategy is based on water injection to maintain reservoir pressure.
The gas produced is injected into the Siri Field.
PRODUCTION FACILITIES Nini is a satellite development to the Siri Field with one unmanned wellhead plat-
form. The unprocessed production is transported through a 14" multiphase pipeline
to the Siri platform where it is processed and exported to shore via tanker. Injection
water and lift gas are conveyed from the Siri platform to the Nini platform through
a 10" pipeline and a 4" pipeline, respectively.

78
A P P E N D I X B
REGNAR FIELD
Prospect: Nils
Location: Block 5505/17
Licence: Sole Concession
Operator: Mærsk Olie og Gas AS
Discovered: 1979
Year on stream: 1993
Producing wells: 1
Water depth: 45 m
Field delineation: 20 km2
Reservoir depth: 1,700 m
Reservoir rock: Chalk and Carbonates
Geological age: Upper Cretaceous
and Zechstein
Reserves
at 1 January 2004:
Oil: 0.1 million m3
Gas: 0.0 billion Nm3
Cum. production
at 1 January 2004:
Oil: 0.89 million m3
Gas: 0.06 billion Nm3
Water: 3.06 million m3
Production in 2003:
Oil: 0.02 million m3
Gas: 0.00 billion Nm3
Water: 0.32 million m3
Total investments
at 1 January 2004:
2003 prices DKK 0.2 billion
Oil well
Subsea installation
Fault
Regnar-3Nils-1
Nils-2
5600
5500
6000
5500
6000
6000
6500
6500
Regnar FieldTop Chalk
0 1 km0.5
Depth structure map in feet
REVIEW OF GEOLOGYThe Regnar Field is an anticlinal structure, induced through salt tectonics. The
structure is heavily fractured, resulting in favourable reservoir conductivity (com-
pare Skjold, Rolf, Dagmar and Svend).
PRODUCTION STRATEGYProduction in the Regnar Field is carried on from a vertical well drilled in the
crest of the structure. The oil is forced towards the production well by water flowing
in from the water zone. The production strategy is to displace and produce as
much of the oil as possible from the tight part of the formation, the matrix.
PRODUCTION FACILITIESThe Regnar Field has been developed as a satellite to the Dan Field. Production
takes place in a subsea-completed well. The hydrocarbons produced are conveyed
by pipeline in multi-phase flow to Dan FC for processing and export ashore.
The well is remotely monitored and controlled from the Dan FC platform.

A P P E N D I X B
79
REVIEW OF GEOLOGYRoar is an anticlinal structure, induced through tectonic uplift. The accumulation
consists of free gas containing condensate. The reservoir is only slightly fractured.
PRODUCTION STRATEGY Production from the Roar Field is based on the aim of optimizing the production
of liquid hydrocarbons in the Tyra Field. This presupposes that the Tyra reservoir
pressure is stabilized by maximizing production from the other gas fields and thus
minimizing the drainage from the Tyra Field. Therefore, increased production from
the Roar Field helps optimize the Tyra production conditions.
PRODUCTION FACILITIESThe Roar Field has been developed as a satellite to the Tyra Field with an unmanned
wellhead platform of the STAR type. After separation into a gas and a liquid phase,
the hydrocarbons produced are conveyed through two pipelines to Tyra East for
processing and export ashore.
ROAR FIELD
Prospect: Bent
Location: Block 5504/7
Licence: Sole Concession
Operator: Mærsk Olie og Gas AS
Discovered: 1968
Year on stream: 1996
Producing wells: 4
Water depth: 46 m
Field delineation: 41 km2
Reservoir depth: 2,025 m
Reservoir rock: Chalk
Geological age: Danian and Upper
Cretaceous
Reserves
at 1 January 2004:
Oil and condensate: 0.8 million m3
Gas: 5.9 billion Nm3
Cum. production
at 1 January 2004:
Oil and condensate: 2.23 million m3
Gas: 11.08 billion Nm3
Water: 1.94 million m3
Production in 2003:
Oil and condensate: 0.12 million m3
Gas: 0.92 billion Nm3
Water: 0.48 million m3
Total investments
at 1 January 2004:
2003 prices DKK 0.6 billion
Well trajectory
Gas well
Platform
Roar-1
Roar-7B
Roar-3C
Roar-5XA
Roar-2, 2A
H-1X
6600
67006800
6900
7000
7100
6600
6700
6800
6800
6700
6800
6500
Roar Field
0 1 2 km
Top Chalk
Depth structure map in feet
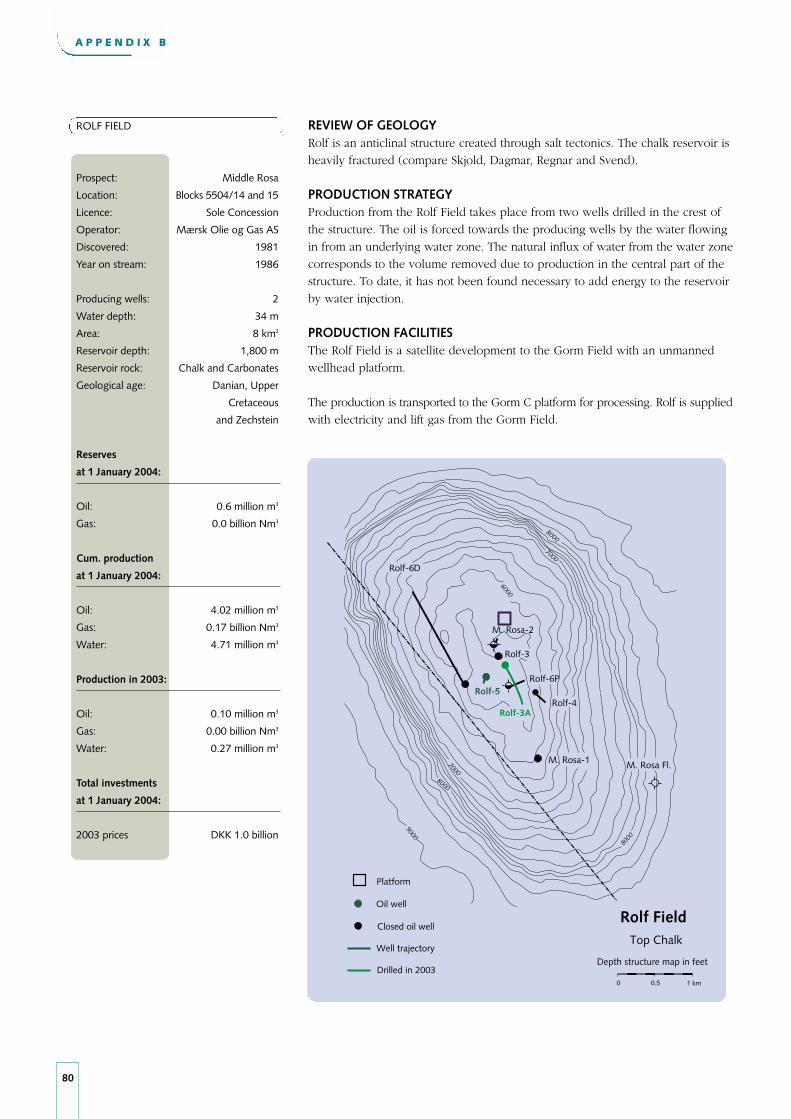
80
A P P E N D I X B
REVIEW OF GEOLOGYRolf is an anticlinal structure created through salt tectonics. The chalk reservoir is
heavily fractured (compare Skjold, Dagmar, Regnar and Svend).
PRODUCTION STRATEGYProduction from the Rolf Field takes place from two wells drilled in the crest of
the structure. The oil is forced towards the producing wells by the water flowing
in from an underlying water zone. The natural influx of water from the water zone
corresponds to the volume removed due to production in the central part of the
structure. To date, it has not been found necessary to add energy to the reservoir
by water injection.
PRODUCTION FACILITIESThe Rolf Field is a satellite development to the Gorm Field with an unmanned
wellhead platform.
The production is transported to the Gorm C platform for processing. Rolf is supplied
with electricity and lift gas from the Gorm Field.
ROLF FIELD
Prospect: Middle Rosa
Location: Blocks 5504/14 and 15
Licence: Sole Concession
Operator: Mærsk Olie og Gas AS
Discovered: 1981
Year on stream: 1986
Producing wells: 2
Water depth: 34 m
Area: 8 km2
Reservoir depth: 1,800 m
Reservoir rock: Chalk and Carbonates
Geological age: Danian, Upper
Cretaceous
and Zechstein
Reserves
at 1 January 2004:
Oil: 0.6 million m3
Gas: 0.0 billion Nm3
Cum. production
at 1 January 2004:
Oil: 4.02 million m3
Gas: 0.17 billion Nm3
Water: 4.71 million m3
Production in 2003:
Oil: 0.10 million m3
Gas: 0.00 billion Nm3
Water: 0.27 million m3
Total investments
at 1 January 2004:
2003 prices DKK 1.0 billion
Rolf Field
0 1 km0.5
Top Chalk
Depth structure map in feet
Oil well
Well trajectory
Platform
Closed oil well
Drilled in 2003
9000
6000
Rolf-6D
Rolf-4
Rolf-6PRolf-5
M. Rosa-2
Rolf-3
M. Rosa-1 M. Rosa Fl.
8000
7000
Rolf-3A
7000
8000
8000

A P P E N D I X B
81
REVIEW OF GEOLOGYThe Sif Field is part of a continuous gas accumulation in Danian layers, extending
over the Igor, Sif and Halfdan field delineations. The field is located at the crest and
down along the western flank of the Tyra-Igor inversion ridge. The accumulation is
not primarily structurally defined, but the distribution of hydrocarbons is mainly
determined by reservoir parameters.
PRODUCTION STRATEGYProduction is based on primary recovery, using the reservoir pressure.
PRODUCTION FACILITIESThe accumulation is exploited from the existing production facilities in the
Halfdan Field.
The map of the Halfdan Field includes the Sif Field.
SIF FIELD
Location: Block 5504/16
Licence: Sole Concession
Operator: Mærsk Olie og Gas AS
Discovered: 1999
Year on stream: Permanently in 2004
Producing wells: 1
Water depth: 44 m
Field delineation: 40 km2
Reservoir depth: 2,050 m
Reservoir rock: Chalk
Geological age: Danian and Upper
Cretaceous
Reserves
at 1 January 2004:
Oil: 1.3 million m3
Gas: 11.3 billion Nm3
Cum. production
at 1 January 2004:
Oil: 0.00 million m3
Gas: 0.00 billion Nm3
Water: 0.00 million m3
Production in 2003:
Oil: 0.00 million m3
Gas: 0.00 billion Nm3
Water: 0.00 million m3
Total investments
at 1 January 2004:
2003 prices DKK 0.1 billion
REVIEW OF GEOLOGYThe Siri Field is a structural trap with a Paleogene sandstone reservoir. The accu-
mulation consists of oil with a relatively low content of gas. Recovery takes place
from Siri Central as well as from the neighbouring Stine segment 2. In 2004, pro-
duction from Stine segment 1 will be commenced.
PRODUCTION STRATEGYRecovery from the field is based on the production of oil through the co-injection
of water and gas. Measures are taken to maintain the reservoir pressure at a level
close to the initial pressure, and the volume of water injected is balanced with the
volume of liquid produced from the reservoir.
In addition, gas from the Cecilie and Nini Fields is injected into the Siri Field.
PRODUCTION FACILITIESThe Siri Field installations comprise a combined wellhead, processing and accom-
modation platform. The processing facilities consist of a plant that separates the
hydrocarbons produced. The platform also houses equipment for co-injecting gas
and water. The planned Stine segment 1 development will consist of a subsea
installation and a 6" multiphase pipeline for transporting production to the Siri
platform. Lift gas and injection water will be supplied from the Siri platform.
The oil produced is conveyed to a 50,000 m3 storage tank on the seabed. When
the tank is full, the oil is transferred to a tanker by means of buoy loading facilities.
The Siri Field has accommodation facilities for 60 persons.
SIRI FIELD
Location: Block 5604/20
Licence: 6/95
Operator: DONG E&P A/S
Discovered: 1995
Year on stream: 1999
Producing wells: 5 (Siri Central)
2 (Stine segment 2)
Water- and gas-
injection wells: 2 (Siri Central)
Water depth: 60 m
Field delineation: 42 km2
Reservoir depth: 2,060 m
Reservoir rock: Sandstone
Geological age: Paleogene
Reserves
at 1 January 2004:
Oil: 2.7 million m3
Gas: 0.0 billion Nm3
Cum. production
at 1 January 2004:
Oil: 7.88 million m3
Net gas: 0.18 billion Nm3
Water: 10.87 million m3
Cum. injection
at 1 January 2004:
Gas:* 0.60 billion Nm3
Water: 17.45 million m3
Production in 2003:
Oil: 0.93 million m3
Net gas: 0.00 billion Nm3
Water: 2.89 million m3
Injection in 2003:
Gas:* 0.11 billion Nm3
Water: 3.38 million m3
Total investments
at 1 January 2004:
2003 prices DKK 4.0 billion
82
A P P E N D I X B
*Gas from the Cecilie and Nini Fields has been injected into the Siri Field.
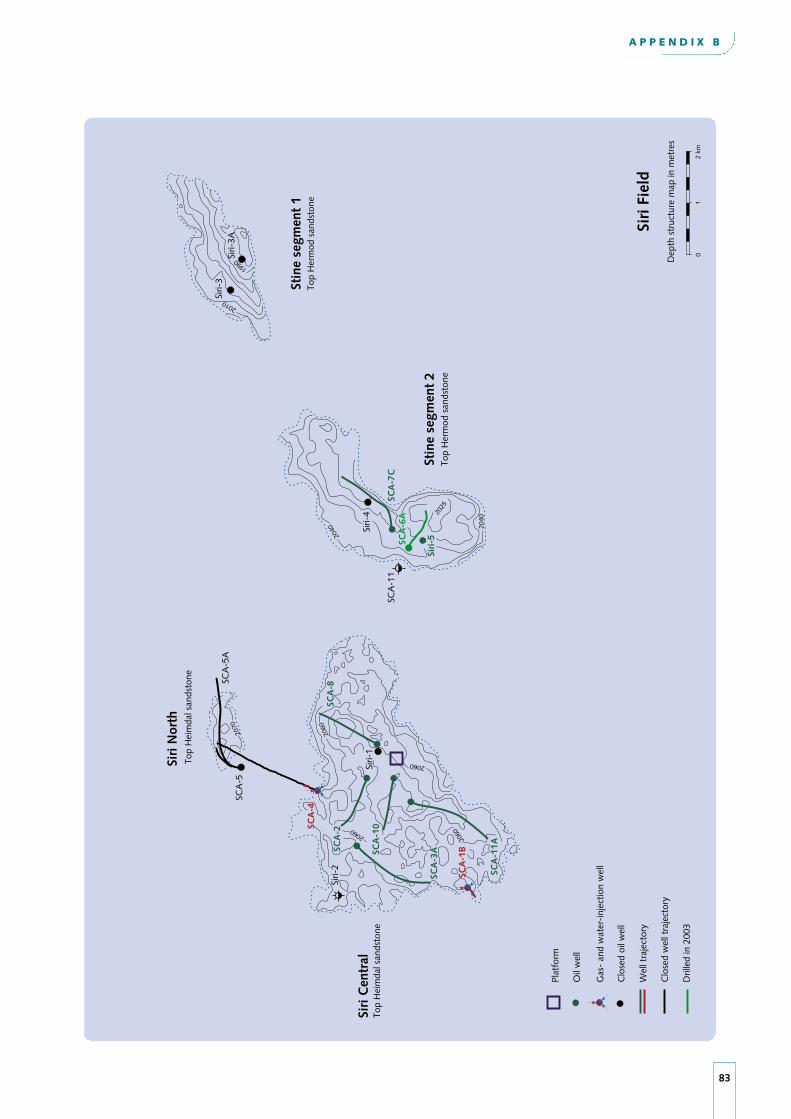
A P P E N D I X B
83
Clo
sed
wel
l tra
ject
ory
Clo
sed
oil w
ell
Siri
Fie
ld
Dep
th s
truc
ture
map
in m
etre
s
Plat
form
Oil
wel
l
Gas
- an
d w
ater
-inj
ectio
n w
ell
Dril
led
in 2
003
Wel
l tra
ject
ory
01
2 km
2040
2025
2040
2010
1990
2070
2060
2060
2060
2060
Siri
-5
Siri
Nor
th
Siri
Cen
tral
Stin
e se
gmen
t 2
Stin
e se
gmen
t 1
SCA
-6A
SCA
-1B
Siri-
2
Siri-
4
SCA
-11
Siri-
3ASi
ri-3
Top
Her
mod
san
dsto
ne
Top
Hei
mda
l san
dsto
ne SCA
-5A
SCA
-5
SCA
-4
SCA
-3ASC
A-2
SCA
-10
SCA
-11A
SCA
-8
Siri-
1
SCA
-7C
Top
Her
mod
san
dsto
ne
Top
Hei
mda
l san
dsto
ne
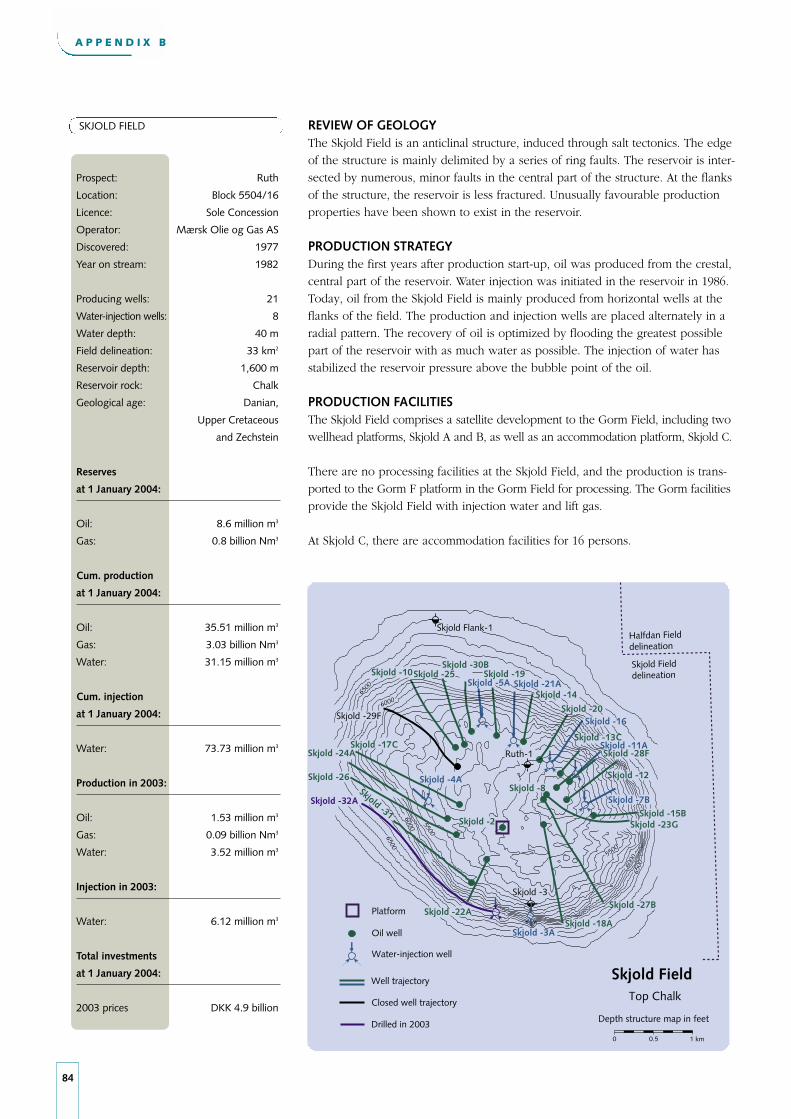
84
A P P E N D I X B
REVIEW OF GEOLOGYThe Skjold Field is an anticlinal structure, induced through salt tectonics. The edge
of the structure is mainly delimited by a series of ring faults. The reservoir is inter-
sected by numerous, minor faults in the central part of the structure. At the flanks
of the structure, the reservoir is less fractured. Unusually favourable production
properties have been shown to exist in the reservoir.
PRODUCTION STRATEGYDuring the first years after production start-up, oil was produced from the crestal,
central part of the reservoir. Water injection was initiated in the reservoir in 1986.
Today, oil from the Skjold Field is mainly produced from horizontal wells at the
flanks of the field. The production and injection wells are placed alternately in a
radial pattern. The recovery of oil is optimized by flooding the greatest possible
part of the reservoir with as much water as possible. The injection of water has
stabilized the reservoir pressure above the bubble point of the oil.
PRODUCTION FACILITIESThe Skjold Field comprises a satellite development to the Gorm Field, including two
wellhead platforms, Skjold A and B, as well as an accommodation platform, Skjold C.
There are no processing facilities at the Skjold Field, and the production is trans-
ported to the Gorm F platform in the Gorm Field for processing. The Gorm facilities
provide the Skjold Field with injection water and lift gas.
At Skjold C, there are accommodation facilities for 16 persons.
SKJOLD FIELD
Prospect: Ruth
Location: Block 5504/16
Licence: Sole Concession
Operator: Mærsk Olie og Gas AS
Discovered: 1977
Year on stream: 1982
Producing wells: 21
Water-injection wells: 8
Water depth: 40 m
Field delineation: 33 km2
Reservoir depth: 1,600 m
Reservoir rock: Chalk
Geological age: Danian,
Upper Cretaceous
and Zechstein
Reserves
at 1 January 2004:
Oil: 8.6 million m3
Gas: 0.8 billion Nm3
Cum. production
at 1 January 2004:
Oil: 35.51 million m3
Gas: 3.03 billion Nm3
Water: 31.15 million m3
Cum. injection
at 1 January 2004:
Water: 73.73 million m3
Production in 2003:
Oil: 1.53 million m3
Gas: 0.09 billion Nm3
Water: 3.52 million m3
Injection in 2003:
Water: 6.12 million m3
Total investments
at 1 January 2004:
2003 prices DKK 4.9 billion
0 1 km0.5
Skjold FieldTop Chalk
Depth structure map in feet
Skjold Field delineation
Halfdan Field delineation
Closed well trajectory
Skjold Flank-1
Skjold -10 Skjold -19
Skjold -14Skjold -21A
Skjold -17C
Skjold -20Skjold -16
Skjold -8
Skjold -13CSkjold -11A
Skjold -12
Skjold -23G
Skjold -7B
Ruth-1
Skjold -2
Skjold -18ASkjold -3A
Skjold -3
Skjold -4A
5500
6000
6500
6500
6000
5500
6000
6500
Skjold -15B
Skjold -24A
Skjold -26
Skjold -25Skjold -5A
Skjold -30B
Skjold -27B
Skjold -29F
Skjold -28F
Water-injection well
Platform
Oil well
Drilled in 2003
Well trajectory
Skjold -22A
Skjold -32ASkjold -31
A P P E N D I X B
85
SOUTH ARNE FIELD
Location: Blocks 5604/29 and 30
Licence: 7/89
Operator: Amerada Hess ApS
Discovered: 1969
Year on stream: 1999
Producing wells: 9
Water-injection wells: 5
Water depth: 60 m
Field delineation: 93 km2
Reservoir depth: 2,800 m
Reservoir rock: Chalk
Geological age: Danian, Upper
Cretaceous and
Lower Cretaceous
Reserves
at 1 January 2004:
Oil: 21.4 million m3
Gas: 7.1 billion Nm3
Cum. production
at 1 January 2004:
Oil: 10.04 million m3
Gas: 2.88 billion Nm3
Water: 1.33 million m3
Cum. injection
at 1 January 2004:
Water: 11.13 million m3
Production in 2003:
Oil: 2.38 million m3
Gas: 0.54 billion Nm3
Water: 0.75 million m3
Injection in 2003:
Water: 4.82 million m3
Total investments
at 1 January 2004:
2003 prices DKK 7.1 billion
REVIEW OF GEOLOGYSouth Arne is an anticlinal structure, induced through tectonic uplift (both of the
Danian/Upper Cretaceous and Lower Cretaceous), which has caused the chalk to
fracture. The structure contains oil with a relatively high content of gas. The field
is the deepest chalk field in Denmark.
PRODUCTION STRATEGY In the initial development phase, the recovery of oil and gas from the field was
based on natural depletion, i.e. without the use of gas or water injection. The
wells have good production properties. Pressure support from seawater injection
has subsequently been established.
PRODUCTION FACILITIESThe South Arne Field installations comprise a combined wellhead, processing and
accommodation platform.
The processing facilities consist of a plant that separates the hydrocarbons produced
as well as gas-processing facilities. The platform also houses equipment for water
injection. In order to prevent the depositing of sparingly soluble salts in and around
the injection wells, a system for removing the sulphate ions from the seawater prior
to injection has been installed.
The oil produced is conveyed to an 87,000 m3 storage tank on the seabed. When
the tank is full, the oil is transferred to a tanker by means of buoy loading facilities.
The gas produced is transported through a gas pipeline to Nybro on the west
coast of Jutland.
The South Arne Field has accommodation facilities for 57 persons.
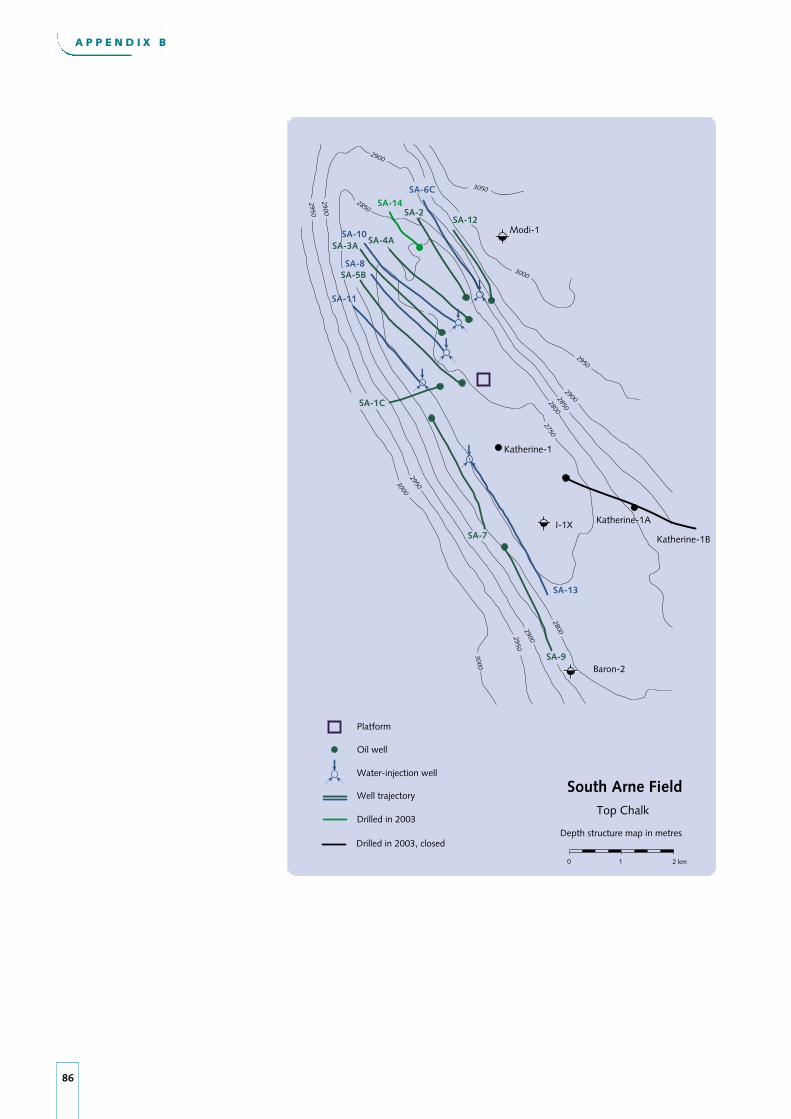
86
A P P E N D I X B
Modi-1
3000
I-1X
Baron-2
2950
2900
27502800
2850
3000
2800
2950
2950
2900
2850
3050
29002950
3000
SA-13
SA-7
SA-12
SA-6C
SA-2
SA-4ASA-10
SA-8
SA-3A
SA-5B
SA-11
SA-1C
SA-9
0 1 2 km
SA-14
Platform
Oil well
Water-injection well
Well trajectory
Drilled in 2003
Katherine-1B
2900
Drilled in 2003, closed
Katherine-1A
Katherine-1
South Arne FieldTop Chalk
Depth structure map in metres

A P P E N D I X B
87
REVIEW OF GEOLOGYThe Svend Field is an anticlinal structure, induced through salt tectonics. This led
to fracturing of the chalk in the reservoir and divided the field into a western and
an eastern block, separated by a major fault. The northern reservoir of the Svend
Field is situated about 250 metres higher than the southern reservoir. The northern
reservoir has proved to have unusually favourable production properties.
PRODUCTION STRATEGYOil and gas production from the Svend Field is based on primary recovery at a
pressure above the bubble point of the oil.
PRODUCTION FACILITIESThe Svend Field has been developed as a satellite to the Tyra Field, with an
unmanned STAR platform. The hydrocarbons produced are conveyed to Tyra East
for processing and export ashore. The Svend Field is connected to the 16" pipeline
from Harald to Tyra East.
SVEND FIELD
Prospect: North Arne/Otto
Location: Block 5604/25
Licence: Sole Concession
Operator: Mærsk Olie og Gas AS
Discovered: 1975 (North Arne)
and 1982 (Otto)
Year on stream: 1996
Producing wells: 4
Water depth: 65 m
Field delineation: 48 km2
Reservoir depth: 2,500 m
Reservoir rock: Chalk
Geological age: Danian and Upper
Cretaceous
Reserves
at 1 January 2004:
Oil: 1.1 million m3
Gas: 0.1 billion Nm3
Cum. production
at 1 January 2004:
Oil: 5.06 million m3
Gas: 0.61 billion Nm3
Water: 5.61 million m3
Production in 2003:
Oil: 0.28 million m3
Gas: 0.04 billion Nm3
Water: 1.33 million m3
Total investments
at 1 January 2004:
2003 prices DKK 1.1 billion
Svend FieldTop Chalk
0 1 2 km
Depth structure map in feet
Well trajectory
Fault
Oil well
900084008000
960010000
10400
10800
11000
8000
900010000
10200
90008200
9000
8800
1000
010
200
Svend-3D
T-3
T-1
Svend-4
Svend-1D
Svend-2XA
Platform
Svend Field delineation
Closed well trajectory
10000
Svend-6X
T-2(Otto-1)

88
A P P E N D I X B
REVIEW OF GEOLOGYThe Tyra Field is an anticlinal structure created by tectonic uplift. The accumulation
consists of free gas containing condensate, overlying a thin oil zone. The reservoir
is only slightly fractured.
PRODUCTION STRATEGYAttempts are made not to deteriorate condensate and oil production conditions
by reducing the reservoir pressure at too early a stage. Increased gas production
from DUC’s other fields, in particular the Harald and Roar gas fields, meets the
objective of optimizing the recovery of liquid hydrocarbons from the Tyra Field.
Any excess production of gas is reinjected into the Tyra Field in order to enhance
the recovery of oil and condensate. Thus, the Tyra Field acts as a buffer.
PRODUCTION FACILITIESThe Tyra Field installations comprise two platform complexes, Tyra West (TW)
and Tyra East (TE).
Tyra West consists of two wellhead platforms (TWB and TWC), one processing/
accommodation platform (TWA) and one gas flare stack (TWD), as well as a bridge
module installed at TWB and supported by a four-legged jacket (TWE).
The Tyra West processing facilities include plant for pre-processing oil and con-
densate production from the wells at Tyra West. Moreover, the Tyra West complex
houses processing and compression facilities for the injection and/or export of gas
and processing facilities for the water produced. Oil and condensate are transported
to Tyra East for final processing.
Tyra East consists of two wellhead platforms (TEB and TEC), one processing/
accommodation platform (TEA), one gas flare stack (TED), and one riser platform
(TEE), as well as a bridge module supported by a STAR jacket (TEF).
The Tyra East complex includes facilities for the final processing of gas, oil, con-
densate and water. The bridge module houses the facilities for receiving and
handling production from the Valdemar, Roar, Svend and Harald Fields, as well as
plant for processing the water produced by the satellite fields.
The two platform complexes in the Tyra Field are interconnected by pipelines in
order to generate the maximum operational flexibility and reliability of supply.
The oil and condensate produced at Tyra and its satellite fields are transported to
shore via Gorm E, while the gas produced at the Tyra Centre is transported to
shore via the TEE platform together with the gas production from the Dan, Gorm
and Harald Centres.
Tyra East has accommodation facilities for 96 persons, while there are accom-
modation facilities for 80 persons at Tyra West.
TYRA FIELD
Prospect: Cora
Location: Blocks 5504/11 and 12
Licence: Sole Concession
Operator: Mærsk Olie og Gas AS
Discovered: 1968
Year on stream: 1984
Producing wells: 43
Producing/
injection wells: 20
Water depth: 37-40 m
Area: 90 km2
Reservoir depth: 2,000 m
Reservoir rock: Chalk
Geological age: Danian and Upper
Cretaceous
Reserves
at 1 January 2004:
Oil and condensate: 5.3 million m3
Gas: 25.5 billion Nm3
Cum. production
at 1 January 2004:
Oil and condensate: 21.11 million m3
Net gas: 34.89 billion Nm3
Water: 25.21 million m3
Cum. injection
at 1 January 2004:
Gas: 31.01 billion Nm3
Production in 2003:
Oil and condensate: 0.92 million m3
Net gas: 1.68 billion Nm3
Water: 3.04 million m3
Injection in 2003:
Gas 2.31 billion Nm3
Total investments
at 1 January 2004:
2003 prices DKK 23.0 billion
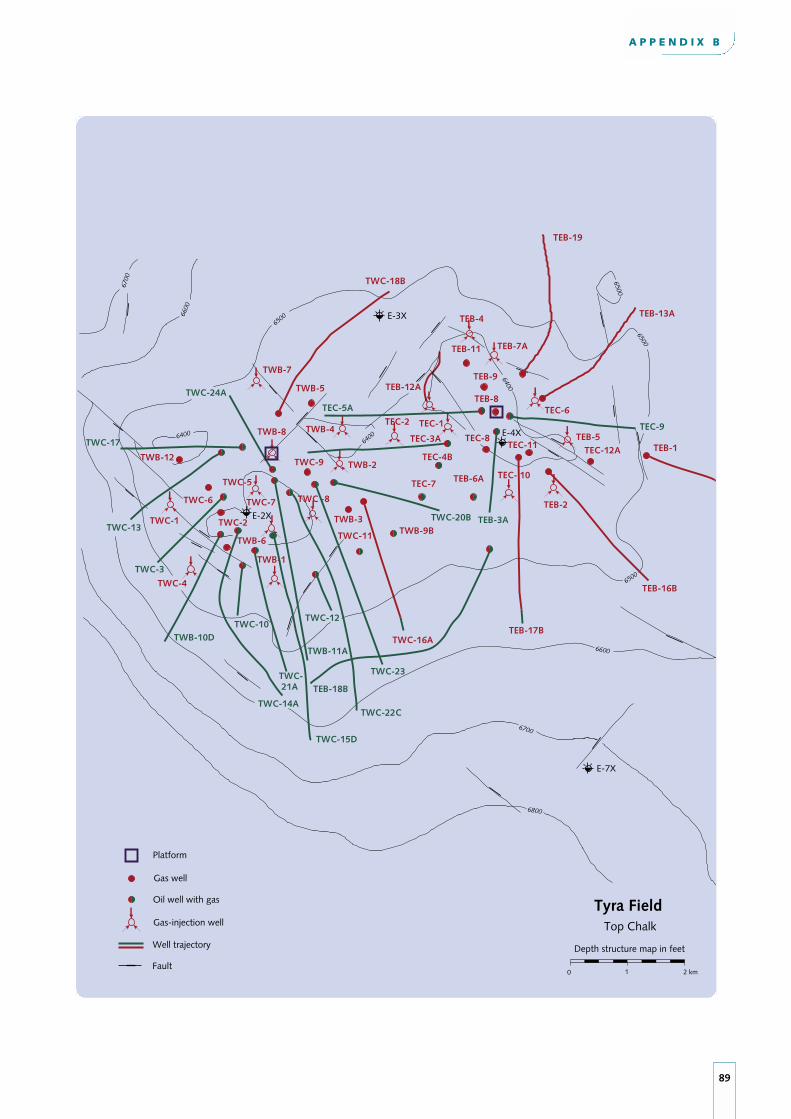
A P P E N D I X B
89
6700
6600
6500
TWC-17
TWC-13
TWC-3
TWB-7
TWB-5TWC-24A
6500
6500
6500
TWC-1 TWC-2
TWC-5
TWC-18B
TWB-8
TWC-7
TWB-6
TWC-4
TWC-10TWB-10D
TWB-1
TWB-11ATWC-16A
TWC-23
TWC-22C
TEB-17B
TEB-3ATWC-20BTEB-2
TEB-6A TEC- 10TEC-7
TWC -8
TWB-9BTWC-11
TEC-4B
TEC-3A
TWB-2TWC-9
TEC-2TWB-4
TEC-5A
6600
TEB-16B
TEB-1
TEC-9TEB-5
TEC-6
TEB-9
TEB-7A
TEC-8
TEB-11
TEB-4
TEB-12A
TEC-12ATEC-11
TEB-8
6700
TWB-12
TWC-6
TWC- 21A
TWC-12
TEB-18B
64006400
6400
TEC-1
TWC-15D
6800
E-3X
E-2X
E-4X
E-7X
TEB-13A
TEB-19
TWC-14A
TWB-3
Tyra FieldTop Chalk
0 1 2 km
Depth structure map in feet
Gas-injection well
Well trajectory
Fault
Oil well with gas
Gas well
Platform

90
A P P E N D I X B
REVIEW OF GEOLOGYThe Tyra Southeast Field is an anticlinal structure created by a slight tectonic uplift
of Upper Cretaceous chalk layers. The structure is divided into two blocks separated
by a northeastern-southwestern fault zone. The relief is less pronounced in this
formation than in the Tyra Field. The structure is part of the major northwestern-
southeastern uplift zone that also comprises the Roar, Tyra and Sif/Igor Fields.
The Tyra Southeast accumulation consists of free gas overlying an oil zone in the
southeastern part of the field.
PRODUCTION STRATEGYProduction from the Tyra Southeast Field is based on natural depletion.
PRODUCTION FACILITIESThe Tyra Southeast Field has been developed as a satellite to Tyra, including an
unmanned wellhead platform of the STAR type. After separation into a gas and a
liquid phase, the production is transported to Tyra East in two pipelines to be
processed and subsequently exported ashore.
TYRA SOUTHEAST FIELD
Location: Block 5504/12
Licence: Sole Concession
Operator: Mærsk Olie og Gas AS
Discovered: 1991
Year on stream: 2003
Producing wells: 6
Water depth: 38 m
Field delineation: 113 km2
Reservoir depth: 2,050 m
Reservoir rock: Chalk
Geological age: Danian and Upper
Cretaceous
Reserves
at 1 January 2004:
Oil: 3.2 million m3
Gas: 11.2 billion Nm3
Cum. production
at 1 January 2004:
Oil: 0.84 million m3
Gas: 0.90 billion Nm3
Water: 0.85 million m3
Production in 2003:
Oil: 0.34 million m3
Gas: 0.45 billion Nm3
Water: 0.60 million m3
Total investments
at 1 January 2004:
2003 prices DKK 1.0 billion

A P P E N D I X B
91
Closed well trajectory
Tyra Southeast FieldTop Chalk
Depth structure map in feet
Oil well
Gas well
Drilled in 20030 1 2 km
E-7XA
E-9XB
TSEA-6
6700
E-4X
6800
E-7X E-6XAE-5XB
6800
690071007000
Tyra Southeast Field delineation6700
6600
E-8X
E-1X
Well trajectory
Closed well
Platform
Gorm Field delineation
TSEA-7B
TSEA-4
TSEA-1
TSEA-3A
TSEA-5A
Tyra Field delineation
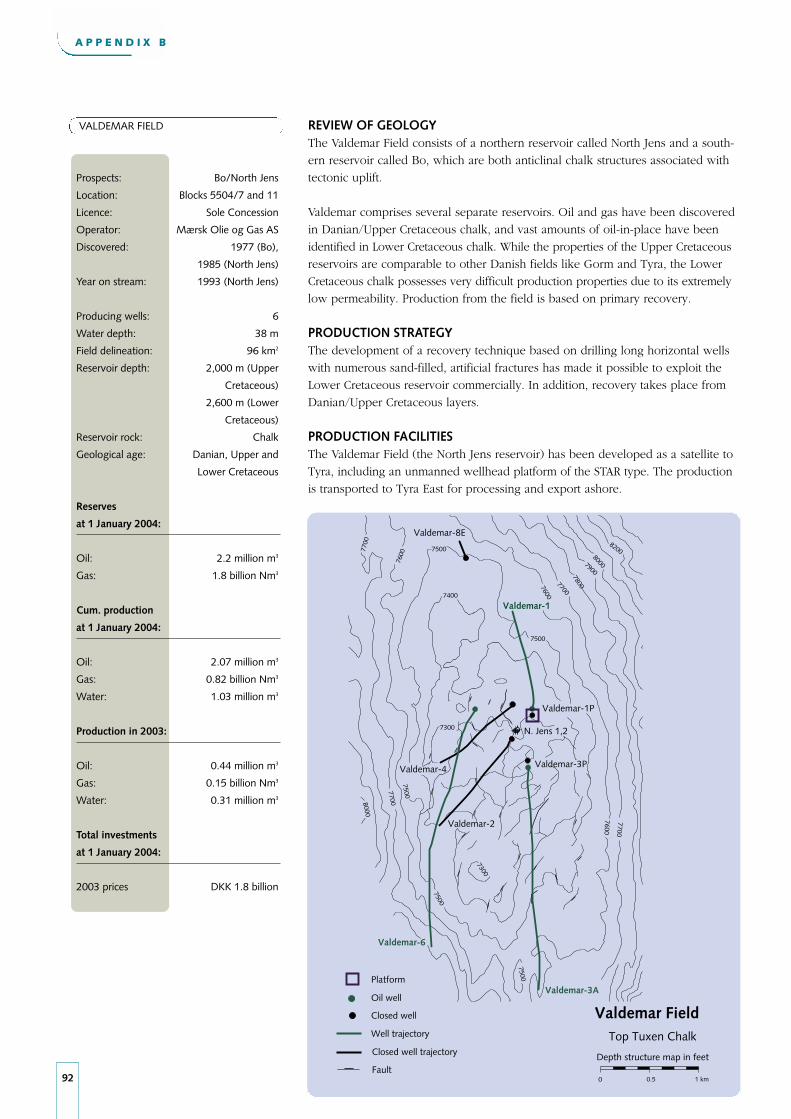
92
A P P E N D I X B
0 0.5 1 km
Valdemar FieldTop Tuxen Chalk
Depth structure map in feetFault
80007900
78007700
7600
7500
7700
7300
82007500
7400
7600
750077008000
7600
7500
7300
7500
7700
Valdemar-1
Valdemar-1P
N. Jens 1,2
Valdemar-2
Valdemar-4
Valdemar-6
Valdemar-3A
Valdemar-3P
Platform
Oil well
Closed well
Well trajectory
Valdemar-8E
Closed well trajectory
REVIEW OF GEOLOGYThe Valdemar Field consists of a northern reservoir called North Jens and a south-
ern reservoir called Bo, which are both anticlinal chalk structures associated with
tectonic uplift.
Valdemar comprises several separate reservoirs. Oil and gas have been discovered
in Danian/Upper Cretaceous chalk, and vast amounts of oil-in-place have been
identified in Lower Cretaceous chalk. While the properties of the Upper Cretaceous
reservoirs are comparable to other Danish fields like Gorm and Tyra, the Lower
Cretaceous chalk possesses very difficult production properties due to its extremely
low permeability. Production from the field is based on primary recovery.
PRODUCTION STRATEGYThe development of a recovery technique based on drilling long horizontal wells
with numerous sand-filled, artificial fractures has made it possible to exploit the
Lower Cretaceous reservoir commercially. In addition, recovery takes place from
Danian/Upper Cretaceous layers.
PRODUCTION FACILITIESThe Valdemar Field (the North Jens reservoir) has been developed as a satellite to
Tyra, including an unmanned wellhead platform of the STAR type. The production
is transported to Tyra East for processing and export ashore.
VALDEMAR FIELD
Prospects: Bo/North Jens
Location: Blocks 5504/7 and 11
Licence: Sole Concession
Operator: Mærsk Olie og Gas AS
Discovered: 1977 (Bo),
1985 (North Jens)
Year on stream: 1993 (North Jens)
Producing wells: 6
Water depth: 38 m
Field delineation: 96 km2
Reservoir depth: 2,000 m (Upper
Cretaceous)
2,600 m (Lower
Cretaceous)
Reservoir rock: Chalk
Geological age: Danian, Upper and
Lower Cretaceous
Reserves
at 1 January 2004:
Oil: 2.2 million m3
Gas: 1.8 billion Nm3
Cum. production
at 1 January 2004:
Oil: 2.07 million m3
Gas: 0.82 billion Nm3
Water: 1.03 million m3
Production in 2003:
Oil: 0.44 million m3
Gas: 0.15 billion Nm3
Water: 0.31 million m3
Total investments
at 1 January 2004:
2003 prices DKK 1.8 billion

A P P E N D I X B
93
7600
7500
7400
7300
7200
7100
7000
6900
6800
6700
6800
6900
7000
7100
Bo-1
0 0.5 1 km
Valdemar-2
Valdemar-5D
Valdemar-7D
Valdemar-8E
Drilled in 2003
Valdemar-1
Platform
Oil well
Well trajectory
Valdemar FieldTop Chalk
Depth structure map in feetClosed well trajectory

94
A P P E N D I X C
Investments in Field Operating Exploration Crude Oil Price Exchange Rate Inflation Net Foreign- State
Field Dev. Costs Costs USD/bbl2 DKK/USD %3 Currency Value Revenue
DKK million DKK million1 DKK million DKK billion4 DKK million
1972 105 29 30 3 7 6.6 -3.2
1973 9 31 28 4.6 6.1 9.4 -4.0 1
1974 38 57 83 11.6 6.1 15.2 -9.2 1
1975 139 62 76 12.3 5.8 9.7 -8.5 2
1976 372 70 118 12.9 6.1 9.0 -9.5 4
1977 64 85 114 14 6 11.1 -10.4 5
1978 71 120 176 14.1 5.5 10.1 -9.5 21
1979 387 143 55 20.4 5.3 9.6 -13.7 19
1980 956 163 78 37.5 5.6 12.3 -18.6 29
1981 1,651 320 201 37.4 7.1 11.7 -20.1 36
1982 3,884 534 257 34 8.4 10.2 -20.6 231
1983 3,554 544 566 30.5 9.1 6.9 -17.8 401
1984 1,598 1,237 1,211 28.2 10.4 6.3 -18.3 564
1985 1,943 1,424 1,373 27.2 10.6 4.7 -17.6 1,192
1986 1,651 1,409 747 14.9 8.1 3.6 -7.3 1,399
1987 930 1,380 664 18.3 6.8 4.0 -5.9 1,328
1988 928 1,413 424 14.8 6.7 4.6 -3.7 568
1989 1,162 1,599 366 18.2 7.3 4.8 -3.2 1,024
1990 1,769 1,654 592 23.6 6.2 2.6 -2.7 2,089
1991 2,302 1,898 985 20 6.4 2.4 -1.9 1,889
1992 2,335 1,806 983 19.3 6 2.1 -0.4 1,911
1993 3,307 2,047 442 16.8 6.5 1.2 -0.4 1,811
1994 3,084 2,113 151 15.6 6.4 2.0 -0.5 2,053
1995 4,164 1,904 272 7 5.6 2.1 0.3 1,980
1996 4,257 2,094 470 21.1 5.8 2.1 0.4 2,465
1997 3,781 2,140 515 18.9 6.6 2.2 1.4 3,171
1998 5,306 2,037 406 12.8 6.7 1.9 0.9 3,125
1999 3,531 2,157 563 17.9 7 2.5 3.5 3,630
2000 3,100 2,758 627 28.5 8.1 2.9 14.9 8,695
2001 3,991 2,710 1,076 24.4 8.3 2.4 12.5 9,634
2002 5,494 3,252 965 24.9 7.9 2.3 13.2 10,137
2003* 7,579 2,950 840 28.8 6.6 2.1 14.4 9,331
Nominal Prices 1) Including transportation costs2) Brent crude oil3) Consumer prices4) Oil products and natural gas*) Estimate
FINANCIAL KEY FIGURES
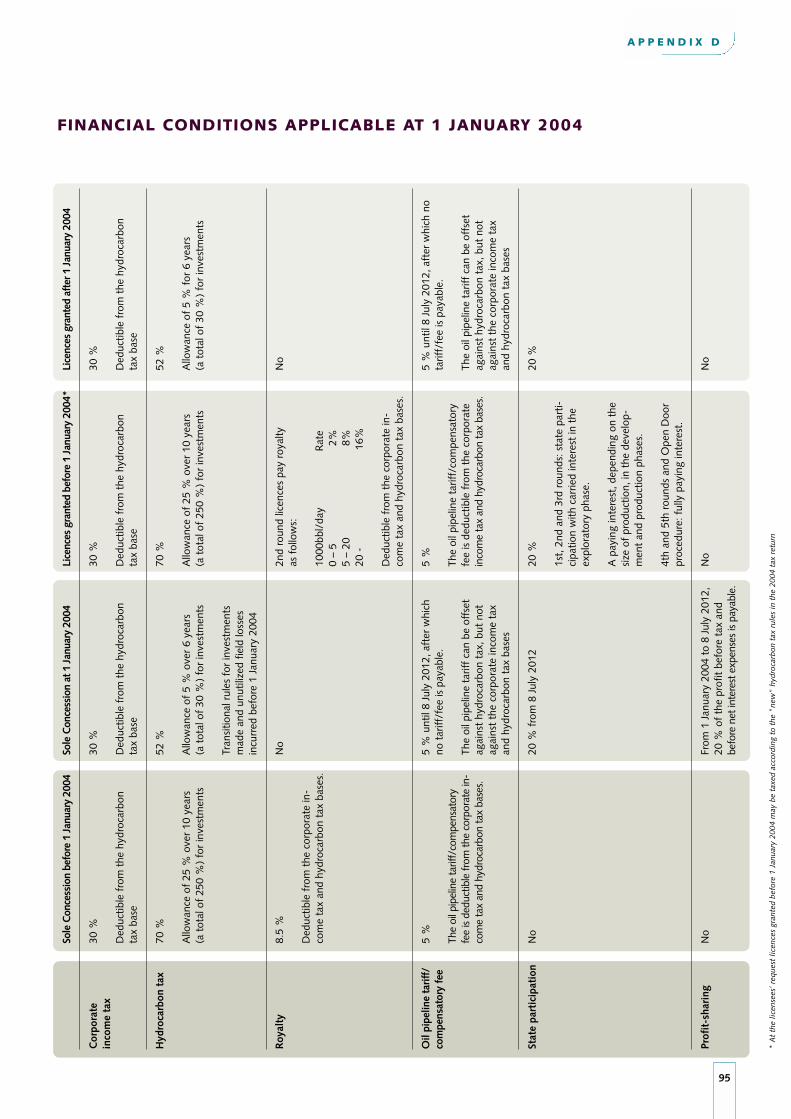
A P P E N D I X D
FINANCIAL CONDITIONS APPLICABLE AT 1 JANUARY 2004
Sole
Con
cess
ion
befo
re 1
Jan
uary
200
4So
le C
once
ssio
n at
1 J
anua
ry 2
004
Lice
nces
gra
nted
bef
ore
1 Ja
nuar
y 20
04*
Lice
nces
gra
nted
aft
er 1
Jan
uary
200
4
Cor
pora
te30
%30
%30
%30
%in
com
e ta
xD
educ
tible
fro
m t
he h
ydro
carb
on
Ded
uctib
le f
rom
the
hyd
roca
rbon
Ded
uctib
le f
rom
the
hyd
roca
rbon
Ded
uctib
le f
rom
the
hyd
roca
rbon
tax
base
tax
base
tax
base
tax
base
Hyd
roca
rbon
tax
70 %
52 %
70 %
52 %
Allo
wan
ce o
f 25
% o
ver
10 y
ears
A
llow
ance
of
5 %
ove
r 6
year
sA
llow
ance
of
25 %
ove
r 10
yea
rsA
llow
ance
of
5 %
for
6 y
ears
(a t
otal
of
250
%)
for
inve
stm
ents
(a t
otal
of
30 %
) fo
r in
vest
men
ts(a
tot
al o
f 25
0 %
) fo
r in
vest
men
ts(a
tot
al o
f 30
%)
for
inve
stm
ents
Tran
sitio
nal r
ules
for
inve
stm
ents
m
ade
and
unut
ilize
d fie
ld lo
sses
in
curr
ed b
efor
e 1
Janu
ary
2004
Roy
alty
8.5
%N
o2n
d ro
und
licen
ces
pay
roya
ltyN
oas
fol
low
s:D
educ
tible
fro
m t
he c
orpo
rate
in-
com
e ta
x an
d hy
droc
arbo
n ta
x ba
ses.
1000
bbl/
day
Rat
e0
– 5
2%
5 –
20
8
%20
-
16%
Ded
uctib
le f
rom
the
cor
pora
te in
-co
me
tax
and
hydr
ocar
bon
tax
base
s.
Oil
pipe
line
tarif
f/5
%5
% u
ntil
8 Ju
ly 2
012,
aft
er w
hich
5 %
5 %
unt
il 8
July
201
2, a
fter
whi
ch n
oco
mpe
nsat
ory
fee
no t
ariff
/fee
is p
ayab
le.
tarif
f/fe
e is
pay
able
.Th
e oi
l pip
elin
e ta
riff/
com
pens
ator
y Th
e oi
l pip
elin
e ta
riff/
com
pens
ator
yfe
e is
dedu
ctib
le fr
om th
e co
rpor
ate
in-
The
oil p
ipel
ine
tarif
f ca
n be
off
set
fee
is d
educ
tible
fro
m t
he c
orpo
rate
The
oil p
ipel
ine
tarif
f ca
n be
off
set
com
e ta
x an
d hy
droc
arbo
n ta
x ba
ses.
agai
nst
hydr
ocar
bon
tax,
but
not
in
com
e ta
x an
d hy
droc
arbo
n ta
x ba
ses.
agai
nst
hydr
ocar
bon
tax,
but
not
agai
nst
the
corp
orat
e in
com
e ta
x
agai
nst
the
corp
orat
e in
com
e ta
x
and
hydr
ocar
bon
tax
base
san
d hy
droc
arbo
n ta
x ba
ses
Stat
e pa
rtic
ipat
ion
No
20 %
fro
m 8
Jul
y 20
1220
%20
%
1st,
2nd
and
3rd
rou
nds:
sta
te p
arti-
cipa
tion
with
car
ried
inte
rest
in t
he
expl
orat
ory
phas
e.
A p
ayin
g in
tere
st, d
epen
ding
on
the
size
of
prod
uctio
n, in
the
dev
elop
-m
ent
and
prod
uctio
n ph
ases
.
4th
and
5th
roun
ds a
nd O
pen
Doo
r pr
oced
ure:
ful
ly p
ayin
g in
tere
st.
Prof
it-s
hari
ngN
oFr
om 1
Jan
uary
200
4 to
8 J
uly
2012
, N
oN
o20
% o
f th
e pr
ofit
befo
re t
ax a
nd
befo
re n
et in
tere
st e
xpen
ses
is pa
yabl
e.
* A
t th
e lic
ense
es’ r
eque
st li
cenc
es g
rant
ed b
efor
e 1
Janu
ary
2004
may
be
taxe
d ac
cord
ing
to t
he "
new
" hy
droc
arbo
n ta
x ru
les
in t
he 2
004
tax
retu
rn
95

Ope
n D
oor
Proc
edur
eLi
cenc
es is
sued
in 1
962-
2002
Dan
ish
Lice
nce
Are
a J
anua
ry 2
004
Lice
nce
issu
ed in
200
3
58o
57o
56o
55o
3o6o
9o12
o15
o
54o
6O 1
5'
58o
57o
56o
55o
5411
5412
5413
5513
5414
5415
5416
5514
5515
5516
5503
5505
5507
5508
5509
5510
5511
5512
5603
5604
5607
5608
5609
5612
5506
5611
5610
5809
5810
5706
5708
5709
5710
5711
5707
5605
5606
5408
5409
5410
5504
Teth
ysO
il
1/02
1/03
1/03
Teth
ys Oil
Teth
ys
Oil

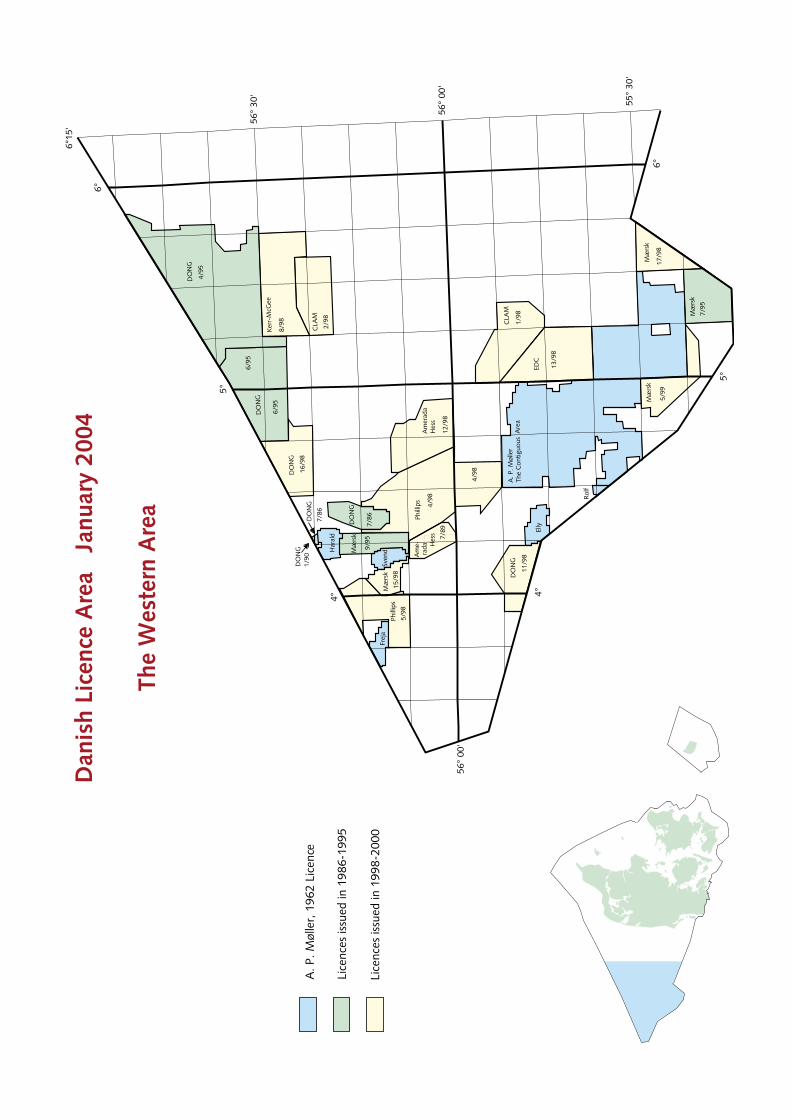
A. P
. Møl
ler,
196
2 Li
cenc
e
Lice
nces
issu
ed in
198
6-19
95
Lice
nces
issu
ed in
199
8-20
00
Dan
ish
Lice
nce
Are
a J
anua
ry 2
004
The
Wes
tern
Are
a Phill
ips
4/98
CLA
M
1/98
CLA
M
2/98
Phill
ips
5/98
Ker
r-M
cGee
8/98
DO
NG
11/9
8
EDC
13/9
8
Mæ
rsk
15/9
8
Mæ
rsk
17/9
8
Am
erad
a H
ess
12/9
8
Elly
Rol
f
Mæ
rsk
7/95
DO
NG
4/95
Sven
d
7/89
7/86
Mæ
rsk
9/95
Har
ald
DO
NG
6/95
DO
NG
1/90
7/86
DO
NG
Frej
a
Mæ
rsk
5/99
DO
NG
16/9
8
6/95
DO
NG
56°
00'
6°15
'
5°
6°
5°
6°
4°
56°
00'
56°
30'
55°
30'
4°
A. P
. Møl
ler
The
Con
tiguo
us A
rea
4/98
Am
e-ra
da Hes
s
Related Documents