In Bloom: Gender Differences in Preferences among Adolescents * Anna Dreber a , Emma von Essen b , and Eva Ranehill c First version: 2011-04-06 This version: 2011-04-06 Abstract We look at gender differences in preferences for altruism, risk and competition in math and word search among adolescents in Sweden. We find that girls are more altruistic and less risk taking than boys. We find no gender gap in performance change when comparing performance under non-competition with performance under competition. Boys and girls are equally likely to choose to compete in word search, but boys are significantly more likely to choose to compete in math. However, this gender gap diminishes and becomes non significant when we control for relative performance beliefs, indicating that some of the gender gap in our sample is not due to competition preferences per se. Keywords: competitiveness; risk preferences; altruism; adolescents; gender differences; experiment JEL codes: C91; D03; J16 * We are grateful for comments from Johan Almenberg, Uri Gneezy, Magnus Johannesson, Christoph Mathys, Astri Muren, Robert Östling, David G. Rand and seminar participants at Harvard Kennedy School, MOVE Workshop on Gender Differences in Competitiveness and Risk Taking, Stockholm School of Economics and Stockholm University. We further want to thank Aron Backström and Peter Gerlach for help with the data collection. Financial support from the Jan Wallander and Tom Hedelius Foundation and the Carl Silfvén Foundation (E.R) is gratefully acknowledged, as well as financial support from the Swedish Council for Working Life and Social Research (FAS). a Institute for Financial Research (SIFR), Stockholm. Email: [email protected] b Department of Economics, Stockholm University. Email: [email protected] c Department of Economics, Stockholm School of Economics. Email: [email protected]

Welcome message from author
This document is posted to help you gain knowledge. Please leave a comment to let me know what you think about it! Share it to your friends and learn new things together.
Transcript
In Bloom: Gender Differences in Preferences among
Adolescents*
Anna Drebera, Emma von Essen
b, and Eva Ranehill
c
First version: 2011-04-06
This version: 2011-04-06
Abstract
We look at gender differences in preferences for altruism, risk and competition in math and
word search among adolescents in Sweden. We find that girls are more altruistic and less risk
taking than boys. We find no gender gap in performance change when comparing
performance under non-competition with performance under competition. Boys and girls are
equally likely to choose to compete in word search, but boys are significantly more likely to
choose to compete in math. However, this gender gap diminishes and becomes non significant
when we control for relative performance beliefs, indicating that some of the gender gap in
our sample is not due to competition preferences per se.
Keywords: competitiveness; risk preferences; altruism; adolescents; gender differences;
experiment
JEL codes: C91; D03; J16
*We are grateful for comments from Johan Almenberg, Uri Gneezy, Magnus Johannesson, Christoph Mathys,
Astri Muren, Robert Östling, David G. Rand and seminar participants at Harvard Kennedy School, MOVE
Workshop on Gender Differences in Competitiveness and Risk Taking, Stockholm School of Economics and
Stockholm University. We further want to thank Aron Backström and Peter Gerlach for help with the data
collection. Financial support from the Jan Wallander and Tom Hedelius Foundation and the Carl Silfvén
Foundation (E.R) is gratefully acknowledged, as well as financial support from the Swedish Council for
Working Life and Social Research (FAS). a Institute for Financial Research (SIFR), Stockholm. Email: [email protected]
b Department of Economics, Stockholm University. Email: [email protected]
c Department of Economics, Stockholm School of Economics. Email: [email protected]

1
1. Introduction
Women today are in many countries at least as likely as men to pursue higher education and
to participate in the labor market. Yet, the wage gap and the segregation in the labor market
persist. One possible cause of gender differences in labor market outcomes is that men and
women differ in terms of economic preferences. In economic studies, men are typically found
to be less altruistic and more risk taking than women, as well as more competitive (see, e.g.,
Eckel and Grossman 2008a, 2008b, Croson and Gneezy 2009, Bertrand 2010, Engel 2010).
There is some evidence suggesting that gender differences in social preferences, risk
preferences and competitiveness may contribute to explaining the gender gap in labor market
outcomes (see e.g. Bertrand 2010 for further discussion). For example, Fortin (2008) finds
that four different non-cognitive traits among young employees, including a suggested
measure of competitiveness and a suggested measure of altruism, can explain some of the
gender gap in wages. Individuals that display more competitiveness and less altruism seem to
earn more. Some previous studies illustrate the connection between risk preferences and the
labor market. Manning and Swaffield (2008) explain some of the gender gap in earnings with
a set of psychological factors, including attitudes toward risk and competition.1 Bonin et al.
(2007) find that individuals who self-report that they are less willing to take risks also work in
occupations with more stable earnings, which tend to pay less on average due to
compensating wage differentials. Though quantitatively small, a related effect is found in
Manning and Saidi (2010) who find that there are fewer women in occupations and
establishments that use variable pay instead of fixed pay contracts in Britain.2 Flory et al.
(2010) test the relationship between labor market choices and competitiveness directly in a
large scale, randomized field experiment. They find that women are less likely than men to
choose to apply to jobs with competitive compensation regimes.
In this paper we explore the gender gap in preferences among adolescents. Little is known
about the development of the gender gap in economic preferences, and to what extent
adolescents exhibit the same type of gender differences in preferences as adults do. If gender
differences in preferences can explain part of the gender gap in labor market outcomes, it is
relevant to also assess gender differences before individuals enter the labor market. Many
important decisions that have implications for labor market outcomes, such as education
1 However, human capital factors are the most important variable explaining the gender wage gap.
2 Dohmen et al. (2011) also find that risk preferences elicited from lab measures have a significant and positive,
albeit low, predictive power for labor market behavior.
2
choices, are taken during adolescence. For this reason we set out to study gender differences
in economic preferences among individuals aged 16-18 years in Sweden. We focus on
preferences for altruism and risk, as well as competition.
A recent meta-analysis of dictator game giving among adults finds that women are more
altruistic than men (Engel 2010). There are by now a number of studies on gender differences
in altruism among children and adolescents. As with the adult literature, some of these studies
find that girls are more altruistic (Harbaugh et al. 2003, Gummerum et al. 2010) whereas
other studies find no gender gap (Benenson et al. 2007, Blake and Rand 2010) and one recent
study finds that girls are less altruistic (Fehr et al. 2011).3 Moreover, when it comes to social
preferences, adolescent girls are generally found to be more inequality averse and boys more
efficiency concerned (Almås et al. 2010, Sutter et al. 2010, Fehr et al. 2011, Martinsson et al.
forthcoming).4 In order to study altruism among adolescents, we have subjects play a dictator
game where the recipient is a charity.
We also explore the gender gap in risk preferences. Among adults, women are typically found
to be less risk taking than men. Previous literature on children finds either no gender gap
(Harbaugh et al. 2002), or that boys are more risk taking than girls (Borghans et al. 2009,
Sutter et al. 2010, Cárdenas et al. forthcoming).5 However, context or sample selection also
seems to influence the gender gap in risk taking. Booth and Nolen (2009b) look at single sex
and mixed schools and find that in this sample of children around 15 years old, boys are more
risk taking than girls in mixed schools but that there is no gender gap when comparing boys to
girls from single sex schools. Girls are also more risk taking when assigned to all-girl groups
than when assigned to mixed groups. When it comes to measuring risk preferences in our
study, we use two measures. The main measure consists of six choices where individuals
choose between a lottery in the form of a coin flip that gives SEK 100 or 0 with equal
probability and a safe option where the certain monetary amount increases successively in
(from SEK 20 to 75).6 We also use a survey question where individuals are asked to self-
report their general risk taking propensity. This measure has been shown to correlate with
both risk taking in an incentivized experiment and with gender (Dohmen et al. 2011).
3 However, Blake and Rand (2010) find that girls are more likely to give something compared to nothing than
boys. 4 Sutter et al. (2010) actually find that maximin preferences become more important with age for girls.
5 Harbaugh et al. (2002) have the smallest sample of the aforementioned studies on risk taking (129 children
aged 5-13 and 58 children aged 14-20). 6 When conducting the study 7 SEK corresponded to about 1 USD.

3
Competitiveness is typically measured as either the change in performance in a competitive
setting compared to a non-competitive setting, or as a preference for competition, such as self-
selecting into a tournament instead of a piece-rate payment scheme. Previous studies have
found that if there is a gender gap in any of these measures, men and boys are more
competitive (Gneezy et al. 2003, Gneezy and Rustichini 2004a, Datta Gupta et al. 2005,
Niederle and Vesterlund 2007, Sutter and Rützler 2010). However, the gender gap can be
influenced by both the task performed and the sample in which competitiveness is studied.
For example, Gneezy and Rustichini (2004b), Grosse and Riener (2010), Günther et al. (2010)
and Shurchkov (forthcoming) find that the gap in competitiveness varies or can even be
reversed depending on the task performed and the time constraint, whereas Wozniak et al.
(2010) find no effect of tasks. Yet other studies find that the existence of a gender gap in
competitiveness varies with the sample studied (Booth and Nolen 2009a, Gneezy et al. 2009,
Andersen et al. 2010, Zhang 2010). For example, Gneezy and Rustichini (2004a) find that
boys but not girls are competitive when it comes to performance change in running, whereas
Dreber et al. (2009) and Cárdenas et al. (forthcoming) find no gender gap with this measure in
the same task. In this paper we explore the role of both performance change and self-selection
into a competitive setting, in two different tasks: math and word search.
We find that adolescent girls are more altruistic and less risk taking than adolescent boys. We
find no gender difference in performance change under a competitive setting in comparison to
a non-competitive setting, in either math or word search. Boys and girls are equally likely to
choose to compete in word search, but boys are significantly more likely to choose to compete
in math. However, the gender gap in choosing to compete in math diminishes and is no longer
significant when controlling for relative performance beliefs. This indicates that among
adolescents, the gender gap in competitiveness is not always present, and when it is, it may
largely be due to other factors than a gender gap in preferences for competition per se. We
study adolescents in Sweden, a country which typically scores high on indexes of gender
equality, thus to what extent our findings are generalizable to other countries remains to be
explored.
The outline for our paper is the following. We present the experimental setup in section 2, and
move on to our results in section 3. We finish by a discussion in section 4.
4
2. Experimental setup
The study was conducted in 9 school classes in five high schools in the Stockholm area during
the fall of 2009. We contacted all schools in the cities of Stockholm, Uppsala and Västerås.
Though we may have some selection regarding which schools that decided to participate,
participation at the student level was compulsory.7 The school classes include a mix of
different specializations.8 A total of 216 adolescents in grades 10-12 participated in the study.
9
50% of the participants are female.
The experiment consisted of three parts conducted in the classroom, measuring
competitiveness, altruism and risk preferences. The subjects first competed in math and word
search, then participated in a dictator game and finally participated in a risk task. They were
informed that each of the three parts consisted of a chance to earn money. One of the three
parts would be randomly selected for payment, and the amount of money they could earn
depended on the outcome of the choices they made in this part. After completing all parts the
subjects were given a survey with additional questions.
The competition in the classroom consisted of two tasks, math exercises and word search, and
each task consisted of three stages. The order of math and word search was randomly chosen
between classes. The subjects did not get any feedback about their performance in any stage.
In the first stage, a piece-rate scheme, the subjects were told that they had two minutes to
solve as many exercises as possible, for which they would be given SEK 3 each. In the second
stage, a tournament, the subjects were again told that they would get two minutes to solve
exercises, but that they now would be randomly paired with three other individuals in the
class who solved the same type of task, and that if they solved more or the same amount of
exercises as these other individuals, they would get SEK 12 per exercise, whereas if they
solved fewer exercises they would get SEK 0. In the third stage, the subjects were told that
they were to solve exercises for another two minutes, and that they now could choose whether
they wanted to be given points according to the piece-rate scheme or the tournament (where
they would again compete against three random other individuals in their class). Our measure
of reaction to competition is the absolute change in performance between the first and second
7 The result for the gender gaps reported does not differ between schools, tested in a regression frame work.
8 The Swedish high school is optional and the students can choose programs with different specializations.
Specialization does not seem to explain our results when controlled for in a regression frame work. 9 Grade 10-12 represents the Swedish “gymnasium”. Among the participants, 56 attended the 10
th grade, 95 the
11th
and 50 the 12th
. 15 students attended a mixed class with students from grade 10 and 11. For these students
we have no information about which grade they actually attended at the moment of the study.

5
stages. The choice in the third stage gives us a measure of competitiveness as a preference for
competition. After the competitiveness task was over, we asked the subjects to guess where in
the performance distribution of their class they believed themselves to be, for both the piece-
rate scheme and the forced competition. This allows us to measure performance beliefs, or
over-/under-confidence.
Next the subjects took part in a dictator game, where they were asked to distribute 50 SEK
between themselves and a well known charity organization.10
They were informed that if this
part was selected for payment the money they gave to the charity would be sent by us to the
charity at the end of the study. The amount that the subjects give to the charity is our measure
of altruistic behavior.
The last part was a risk task consisting of six choices where the subjects could choose
between a lottery in the form of a coin flip that gives SEK 100 or 0 with equal probability and
a safe option where the certain amount increases successively in points (from SEK 20 to 75).
Our first measure of risk preferences relies on the unique switching point where the individual
switches from preferring the lottery to preferring the safe option. This measure excludes
inconsistent subjects, i.e. subjects with multiple switching points.11
To further analyze risk
preferences we include a survey question where the subjects are asked to self-report their
general risk taking propensity on a scale from 0 to 10, where 10 is “very risk taking” and 0 is
“not risk taking at all”. This second measure of risk preferences is not incentivized.
After the three parts of the study were conducted, a survey was included in order to measure
beliefs concerning the different tasks, as well as demographics.12
In the end, one part was
randomly selected for payment and the money was handed out in cash to the subjects.
To summarize; we analyze competitiveness as performance change in math and word search,
and as choosing to compete or not in math and word search; altruistic behavior via a dictator
game; and risk preferences through incentivized choices over lotteries and safe options as well
as self-reported risk taking. We further look at additional measures such as relative
performance beliefs.
10
The name of the charity organization was the Swedish section of “Save the children”. 11
14 of our subjects are inconsistent. We therefore also analyze risk taking as the number of times a person
chooses the risky option compared to the safe, in order to have a measure that includes the inconsistent subjects.
Using this measure of risk preferences in our analysis does not change our results. There is no gender difference
in the proportions of inconsistent subjects (p=0.1017). 12
We collected a variety of demographic variables, but age is the only demographic variable used in this paper.
The sample of this study is too small to use all demographics in the analysis of the present paper. We
nevertheless chose to include these in the questionnaire for the purpose of future research studies.

6
3. Results
This section consists of three parts, where we test whether there is a gender gap in altruism,
risk and competitiveness. All tests of the means throughout the paper are analyzed using the
non-parametric Mann-Whitney test and a two-sided t-test. Only the p-values for the Mann-
Whitney tests are displayed.13
We start by studying gender differences in altruism, followed
by an analysis of risk preferences. We then explore competitiveness in the two tasks using the
two measures of competitiveness. When exploring competitive preferences we control for risk
preferences and relative performance beliefs.
3.1 Altruism
Girls are significantly more altruistic than boys in our sample of adolescents (p=0.0137). Girls
give on average SEK 29 and boys SEK 23 out of SEK 50 to the charity organization that is
the recipient in our dictator game (see table 1).14
Table 1. Altruism.
N Average donation
Boys 107 23.20
Girls 109 29.32
P - 0.014
3.2 Risk preferences
In this section we explore the gender gap in risk preferences measured from incentivized
lotteries and self-reported non-incentivized risk taking. Analyzing the incentivized risk task
we corroborate most previous findings that boys are more risk taking than girls. The average
certainty equivalent to the lottery with equal probabilities of winning 100 and 0 is 45.2 for
boys. For girls the certainty equivalent is significantly lower, 37.1 (p=0.002).15
Our second
13
We present the Mann-Whitney test since none of our variables are normally distributed when using a skewness
and kurtosis test. When there is a difference between the tests in terms of significance we also report the p-values
for the t-test. We have also compared whether the distributions for each reported variable differ between boys
and girls using a Kolmogorov-Smirnov test. The results are similar to those reported for mean values. 14
In a regression analysis, the coefficient on gender is not influenced by the inclusion of the additional control
variables age and grades. The regression analysis is based on parametric assumptions that may not be fulfilled. A
correlation analysis between all the behaviors we examine also shows that altruism is positively related to risk
taking in the incentivized risk task (p<0.001), but not in the self-reported question. We also find no correlation
between altruism and competitive choices (p=0.255 for math and p=0.479 for word). 15
The result is qualitatively similar when analyzing the number of risky choices instead of the switching point in
order to include inconsistent individuals (those that switch back and forth between the lottery and the safe
points). Girls are still less risk taking compared to boys (p=0.0066).

7
measure of risk taking, self-reported risk propensity, supports this pattern.16
On a scale from 0
to 10, where 0 is not risk taking at all and 10 is very risk taking, boys rated their average risk
propensity to 6.15, whereas girls averaged on 5.59 (p=0.026).17
Table 2. Risk preferences.
N* Average certainty equivalent N General risk
Boys 103 45.22 107 6.15
Girls 98 37.12 109 5.59
P - 0.002 - 0.026
*One girl did not participate in this part and 14 participants made inconsistent choices.
3.3 Competitiveness
In this section we explore competitiveness as measured by absolute performance change and
as the choice whether to compete or not. All participants took part in both the math and the
word search exercises.18
We also include an analysis where we control for relative
performance beliefs.
3.3.1 Performance and choice
Table 3 compares the performance between boys and girls in the first stage (a piece-rate
scheme) and the second stage (a tournament). Studying performance in each stage separately,
boys perform significantly better than girls in math in both stages, whereas there is no gender
difference in performance in word search.
When it comes to absolute performance change, our first measure of competitiveness, we find
no increase in performance under the competitive compensation scheme for either gender. In
contrast to most previous literature measuring performance change, neither boys nor girls
react to the competitive environment by increasing their performance comparing the second
and the first stage. As a robustness check, we also analyze the relative performance change.19
This does not alter our results. Thus, there is no significant gender gap in competitiveness with
this measure in either task.
16
There is no gender difference in the variance of incentivized risk taking (p=0.210) 17
Our two risk measures are significantly correlated (Spearman‟s rho=0.2188, p=0.0018). 18
Randomly chosen, half of the classes performed the math task first and half performed the word task. A
regression analysis suggests that the order of the tasks does not influence our results. 19
Relative performance change is defined as ((performance in stage 2 – performance in stage 1)/performance in
stage 1). We also conduct a quantile regression on absolute performance change and find no gender gap in math
or word search in any part of the performance distribution.

8
Table 3. Average performance, stage 1 and 2.
N Math, stage 1 Math, stage 2 P Word, stage 1 Word, stage 2 P
Boys 107 8.79 8.82 0.948 8.79 8.57 0.546
Girls 109* 7.31 7.44 0.510 8.74 8.61 0.542
P 0.010 0.020 - 0.524 0.952 -
*One girl had to leave the class room and did not participate in the first part of the word task.
When it comes to the choice of competing or not, we find a significant gender gap in math but
not in word search although the point estimate goes in the same direction for both tasks (see
table 4).20
In math, 38 (36%) of the boys choose to compete compared to 18 (17%) of the girls
(p=0.001). The corresponding numbers in the word task are 34 (33%) and 29 (28%)
respectively (p=0.356).21
The difference in gender gaps between the two tasks is mainly due
to girls choosing differently across the two tasks: the share of girls choosing to compete in the
word task is significantly larger than the share choosing to compete in the math task
(p=0.050), whereas the proportion of boys competing is stable across the two tasks (p=0.701).
Table 4. Percentage choosing to compete in stage 3.
Task\Gender N % competing math N % competing word P
Boys 106 0.358 105 0.333 0.701
Girls 109 0.165 109 0.275 0.050
P - 0.001 - 0.356
3.3.2 Relative performance beliefs
Due to the gender gap in performance in the math task in each of the two stages, all or part of
the observed gender gap may be due to subjects correctly anticipating their probability of
winning the tournament should they choose to participate. We thus control for individual
performance in the second stage in a regression analysis (see Table 6 below). When doing so,
however, the gender coefficient remains significant.
Gender differences in competitive choices may also be due to gender differences in
performance in stage 3, if participants correctly anticipate this. However, there is no
significant difference in performance increase between boys and girls in either task (math:
20
One subject did not choose payment scheme for the third stage in math, and two did not perform in this stage.
In the word task, two participants did not choose payment scheme. When possible, these individuals are included
in the analysis. Including or excluding these participants has no effect on the results. 21
A sample size analysis indicates that 1978 observations would be needed to obtain a significant result for the
performance change in running, jumping and dancing respectively. The basis for the power calculation is a
significance level of 5% and a power of 80%.

9
p=0.450, word: p=0.749), nor is there a difference in performance increase dividing the
sample based on their competitive choice.
Individual risk preferences as well as relative performance beliefs have previously been found
to influence competitive choices (Niederle och Vesterlund 2007, Niederle and Yestrumskas
2008). Girls in our sample who self-select into competition are significantly more risk taking
than other girls in both math (p=0.0493) and the word task (p=0.0035). For boys, there is a
significant difference in risk taking between those that compete and those that do not only in
math (p=0.0089). However, exploring the self-reported risk measure, the only significant
difference is when comparing boys choosing to compete or not in math (p=0.0056).
Table 5 below report the number of correct guesses regarding relative performance, divided
by task and gender. Relative to their performance, we find that girls are underconfident in
terms of their performance beliefs (Math: p<0.001: Word: p<0.001), whereas there is some
evidence that boys are underconfident in math but not word search (Math: p=0.0652: Word:
p=0.6593).22
When we compare boys and girls, girls are significantly more underconfident in
word search (p=0.0004), and there is some evidence that girls are more underconfident in
math (p=0.0974). This is interesting given that most studies on college students find that both
boys and girls are overconfident.
22
A t-test indicates that boys are significantly underconfident in math (p=0.0413). Our measure of
over/underconfidence is the difference between relative performance beliefs and actual relative performance,
both in terms of quartile in the performance distribution. When assigning individuals to a quartile for actual
relative performance, we divide each separate class into four equal groups (roughly equal groups when the class
size cannot be divided by four). In some cases several individuals performed equally across groups. Those
individuals are given an expected quartile. For example, if four individuals perform similarly, and two needs to
be assigned to the worst quartile and two to the second to worst quartile, these individuals all received the
expected quartile 3.5.

10
Table 5. Distribution of guessed ranks.
Men Women
Guessed
rank
Over- Under- Guessed
rank
Over- Under-
confident confident confident confident
Math
1. Best 9 (5) 4 - 3 (2) 1 -
2. 23 (9) 8 6 16 (4) 8 4
3. 30 (10) 7 13 31 (5) 10 16
4. Worst 18 (6) - 12 41 (17) - 24
Total 80 91
Word
1. Best 11 (3) 8 - 1 (1) 0 -
2. 25 (7) 11 7 22 (6) 4 12
3. 30 (13) 8 9 46 (13) 9 24
4. Worst 14 (6) - 8 21 (10) - 11
Total 80 90
*Number of correct guessed in parenthesis.
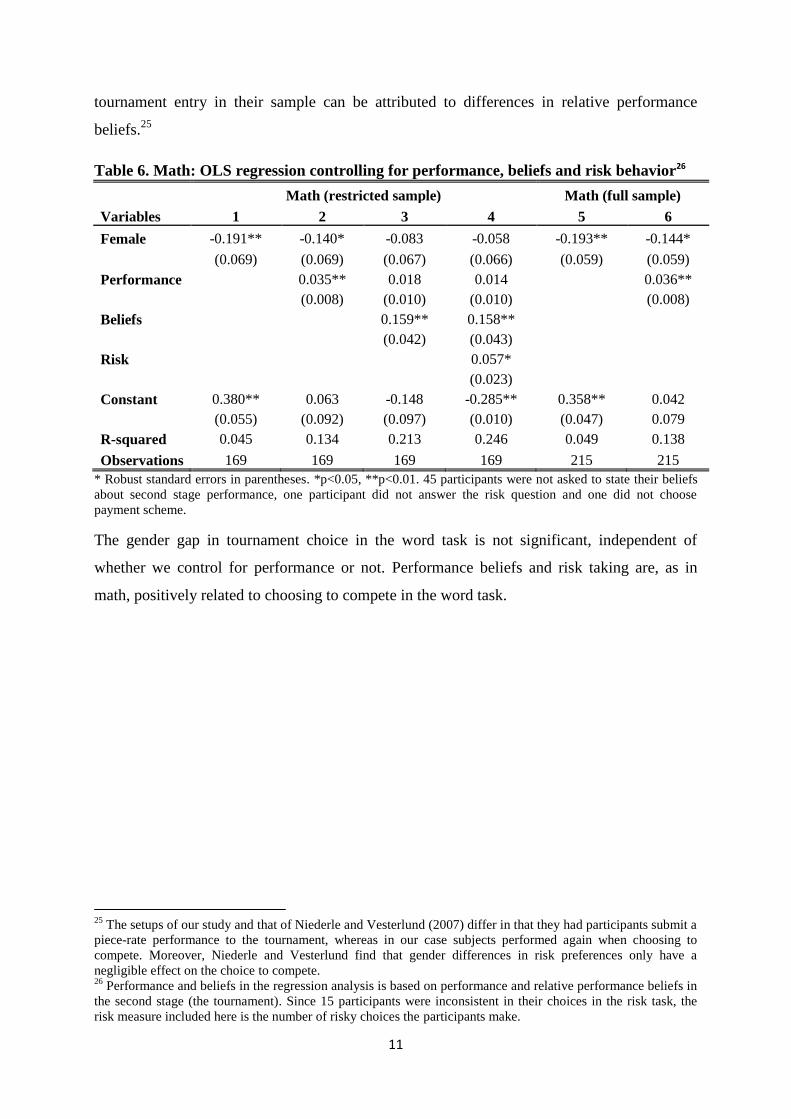
Conducting an OLS regression analysis23
analyzing the gender gap in competitive choices we
perform four regressions per task, stepwise including control variables as can be seen in table
6 (math) and 7 (word) below.24
We analyze the full sample of individuals, however 45
participants (two classes) were not asked to state their performance beliefs regarding stage 2
performance. We thus also analyze a limited sample excluding these individuals and those for
whom we don‟t have all control variables. The results are very similar. In math, we find that
controlling for actual performance diminishes the size of the observed gender gap with 27%
in the restricted sample (comparing the coefficients in regression 1 and regression 2 in Table
6). When comparing regression 1 with regression 4 in the restricted sample, i.e. also adding
controls for relative performance beliefs and risk preferences, we see that the gender
difference in competitive choice in math is no longer significant. The point estimate of the
female coefficient is lower, but still negative. The three control variables account for about
70% of the gender gap found in regression 1. Performance beliefs account for about 30% of
the observed gender gap and risk preferences for about 13%. This can be compared to the
results reported in Niederle & Vesterlund (2007), who find that 27% of the gender gap in
23
See Appendix table 1 for the same analysis using a logit regression. 24
When performing the regression analyses we also use a specification including variables from the short survey
that was distributed after the experiment. These variables measured for example how gendered the participants
found the tasks to be, and how important it was to win dependent on the gender of the opponent. None of these
variables were significant.
11
tournament entry in their sample can be attributed to differences in relative performance
beliefs.25
Table 6. Math: OLS regression controlling for performance, beliefs and risk behavior26
Math (restricted sample) Math (full sample)
Variables 1 2 3 4 5 6
Female -0.191** -0.140* -0.083 -0.058 -0.193** -0.144*
(0.069) (0.069) (0.067) (0.066) (0.059) (0.059)
Performance
0.035** 0.018 0.014
0.036**
(0.008) (0.010) (0.010)
(0.008)
Beliefs
0.159** 0.158**
(0.042) (0.043)
Risk
0.057*
(0.023)
Constant 0.380** 0.063 -0.148 -0.285** 0.358** 0.042
(0.055) (0.092) (0.097) (0.010) (0.047) 0.079
R-squared 0.045 0.134 0.213 0.246 0.049 0.138
Observations 169 169 169 169 215 215
* Robust standard errors in parentheses. *p<0.05, **p<0.01. 45 participants were not asked to state their beliefs
about second stage performance, one participant did not answer the risk question and one did not choose
payment scheme.
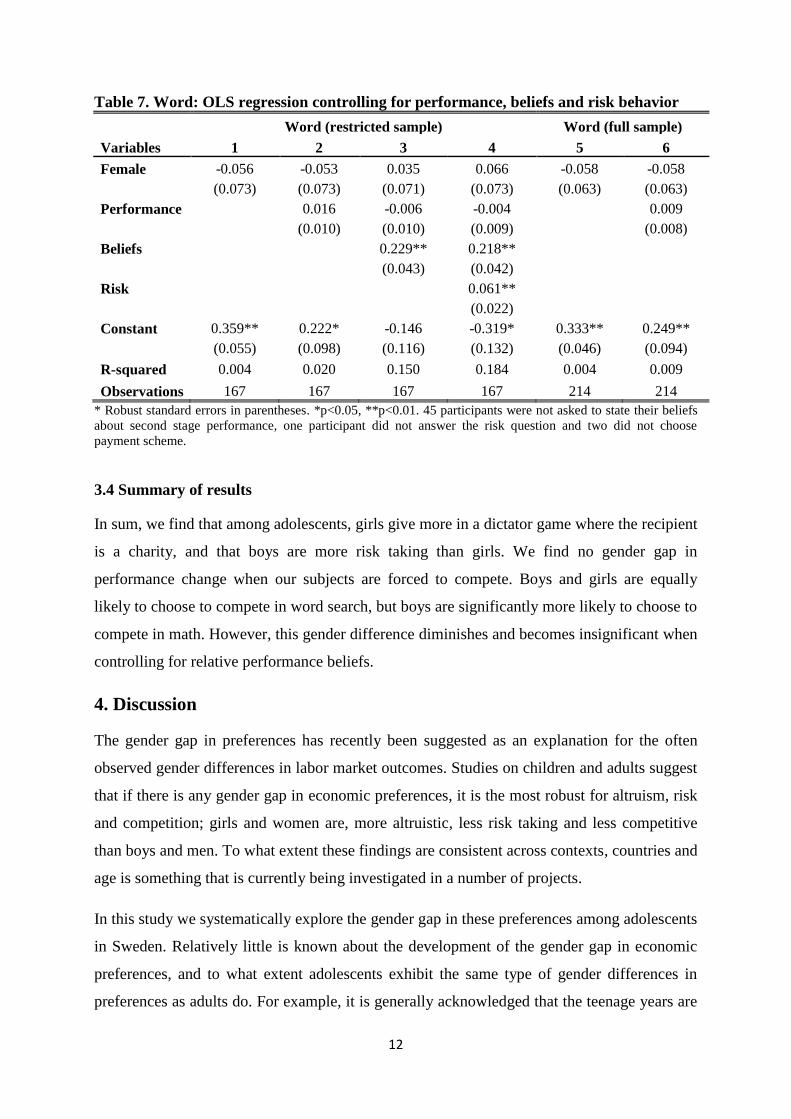
The gender gap in tournament choice in the word task is not significant, independent of
whether we control for performance or not. Performance beliefs and risk taking are, as in
math, positively related to choosing to compete in the word task.
25
The setups of our study and that of Niederle and Vesterlund (2007) differ in that they had participants submit a
piece-rate performance to the tournament, whereas in our case subjects performed again when choosing to
compete. Moreover, Niederle and Vesterlund find that gender differences in risk preferences only have a
negligible effect on the choice to compete. 26
Performance and beliefs in the regression analysis is based on performance and relative performance beliefs in
the second stage (the tournament). Since 15 participants were inconsistent in their choices in the risk task, the
risk measure included here is the number of risky choices the participants make.
12
Table 7. Word: OLS regression controlling for performance, beliefs and risk behavior
Word (restricted sample) Word (full sample)
Variables 1 2 3 4 5 6
Female -0.056 -0.053 0.035 0.066 -0.058 -0.058
(0.073) (0.073) (0.071) (0.073) (0.063) (0.063)
Performance
0.016 -0.006 -0.004
0.009
(0.010) (0.010) (0.009)
(0.008)
Beliefs
0.229** 0.218**
(0.043) (0.042)
Risk
0.061**
(0.022)
Constant 0.359** 0.222* -0.146 -0.319* 0.333** 0.249**
(0.055) (0.098) (0.116) (0.132) (0.046) (0.094)
R-squared 0.004 0.020 0.150 0.184 0.004 0.009
Observations 167 167 167 167 214 214
* Robust standard errors in parentheses. *p<0.05, **p<0.01. 45 participants were not asked to state their beliefs
about second stage performance, one participant did not answer the risk question and two did not choose
payment scheme.
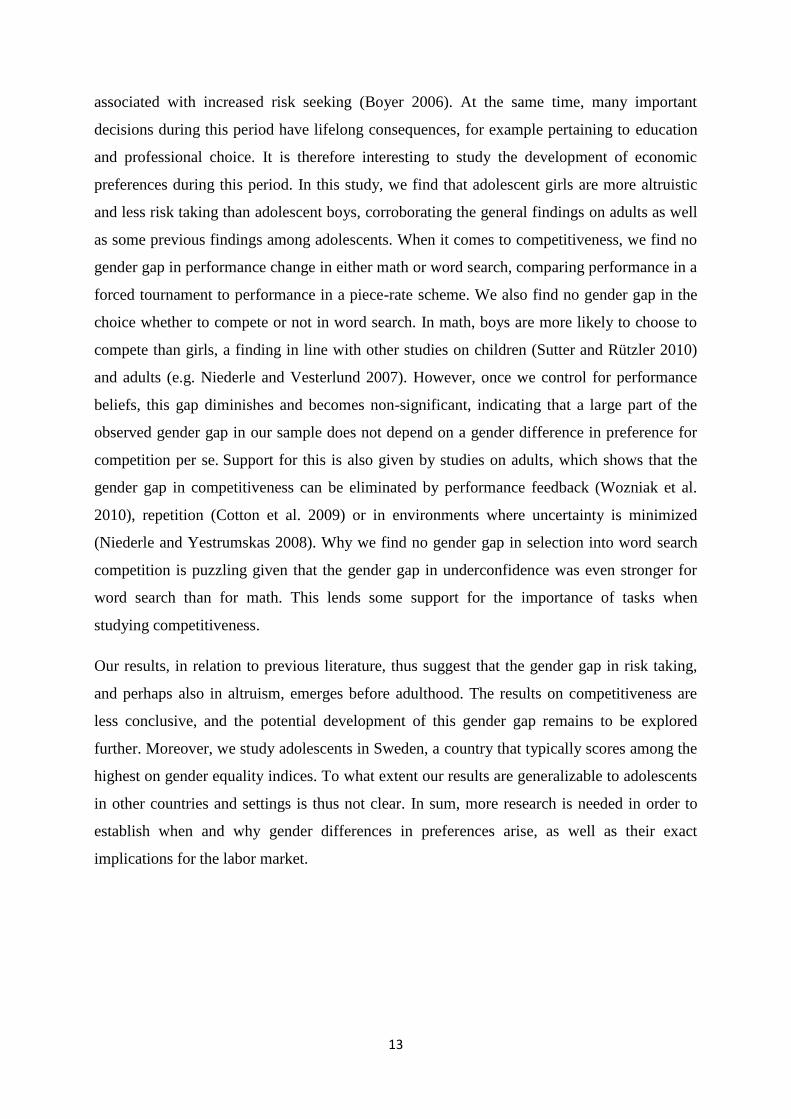
3.4 Summary of results
In sum, we find that among adolescents, girls give more in a dictator game where the recipient
is a charity, and that boys are more risk taking than girls. We find no gender gap in
performance change when our subjects are forced to compete. Boys and girls are equally
likely to choose to compete in word search, but boys are significantly more likely to choose to
compete in math. However, this gender difference diminishes and becomes insignificant when
controlling for relative performance beliefs.
4. Discussion
The gender gap in preferences has recently been suggested as an explanation for the often
observed gender differences in labor market outcomes. Studies on children and adults suggest
that if there is any gender gap in economic preferences, it is the most robust for altruism, risk
and competition; girls and women are, more altruistic, less risk taking and less competitive
than boys and men. To what extent these findings are consistent across contexts, countries and
age is something that is currently being investigated in a number of projects.
In this study we systematically explore the gender gap in these preferences among adolescents
in Sweden. Relatively little is known about the development of the gender gap in economic
preferences, and to what extent adolescents exhibit the same type of gender differences in
preferences as adults do. For example, it is generally acknowledged that the teenage years are
13
associated with increased risk seeking (Boyer 2006). At the same time, many important
decisions during this period have lifelong consequences, for example pertaining to education
and professional choice. It is therefore interesting to study the development of economic
preferences during this period. In this study, we find that adolescent girls are more altruistic
and less risk taking than adolescent boys, corroborating the general findings on adults as well
as some previous findings among adolescents. When it comes to competitiveness, we find no
gender gap in performance change in either math or word search, comparing performance in a
forced tournament to performance in a piece-rate scheme. We also find no gender gap in the
choice whether to compete or not in word search. In math, boys are more likely to choose to
compete than girls, a finding in line with other studies on children (Sutter and Rützler 2010)
and adults (e.g. Niederle and Vesterlund 2007). However, once we control for performance
beliefs, this gap diminishes and becomes non-significant, indicating that a large part of the
observed gender gap in our sample does not depend on a gender difference in preference for
competition per se. Support for this is also given by studies on adults, which shows that the
gender gap in competitiveness can be eliminated by performance feedback (Wozniak et al.
2010), repetition (Cotton et al. 2009) or in environments where uncertainty is minimized
(Niederle and Yestrumskas 2008). Why we find no gender gap in selection into word search
competition is puzzling given that the gender gap in underconfidence was even stronger for
word search than for math. This lends some support for the importance of tasks when
studying competitiveness.
Our results, in relation to previous literature, thus suggest that the gender gap in risk taking,
and perhaps also in altruism, emerges before adulthood. The results on competitiveness are
less conclusive, and the potential development of this gender gap remains to be explored
further. Moreover, we study adolescents in Sweden, a country that typically scores among the
highest on gender equality indices. To what extent our results are generalizable to adolescents
in other countries and settings is thus not clear. In sum, more research is needed in order to
establish when and why gender differences in preferences arise, as well as their exact
implications for the labor market.
14
References
Almås, Ingvild, Alexander W. Cappelen, Erik Ø. Sørensen and Bertil Tungodden. 2010.
“Fairness and the Development of Inequality Acceptance.” Science, 328: 1176-1178.
Andersen, Steffen, Seda Ertac, Uri Gneezy, John List and Sandra Maximiano. 2010. ”Age and
Gender Differences in Competitiveness: Evidence from Matrilineal and Patriarchal Societies.”
Mimeo.
Benenson, Joyce F., Joanna Pascoe and Nicola Radmore. 2007. “Children‟s Altruistic
Behavior in the Dictator Game.” Evolution and Human Behavior, 28(3): 168-175.
Blake. Peter R. and David G. Rand. 2010. “Currency value moderates equity preference
among young children”. Evolution and Human Behavior, 31: 210-218.
Bonin, H., T. Dohmen, A. Falk, D. Huffman, and U. Sunde. 2007. “Cross-Sectional Earnings
Risk and Occupational Sorting: The Role of Risk Attitudes.” Labour Economics, 14(6): 926-
937.
Bolton, Gary and Elena Katok. 1995. “An Experimental Test for Gender Differences in
Beneficent Behavior.” Economics Letters, 48: 287-292.
Booth, Alison L. and Patrick Nolen. 2009a. “Gender Differences in Risk Behaviour: Does
Nurture Matter?” Mimeo.
Booth, Alison L. and Patrick J. Nolen. 2009b. ”Choosing to Compete: How Different Are
Girls and Boys?” IZA Discussion Paper 4027.
Borghans, Lex, Bart H.H. Golsteyn, James J. Heckman and Huub Meijers. 2009. “Gender
Differences in Risk Aversion and Ambiguity Aversion.” NBER Working Paper 14713.
Boyer, Ty. 2006. “The Development of Risk-Taking: A Multi-Perspective View.”
Developmental Review, 26: 291–345.
Cárdenas, Juan-Camilo, Anna Dreber, Emma von Essen and Eva Ranehill. Forthcoming.
“Gender differences in competitiveness and risk taking: comparing children in Colombia and
Sweden.” Journal of Economic Behavior and Organization.
Charness, Gary and Matthew Rabin. 2002. “Understanding Social Preferences with Simple
Tests.” Quarterly Journal of Economics, 117(3): 817-869.
Cotton, Christopher, Frank McIntyre and Joseph Price. 2009. “Gender Differences Disappear
with Exposure to Competition.” Working Paper 2010-11, University of Miami, Department of
Economics.
Croson, Rachel and Uri Gneezy. 2009. “Gender Differences in Preferences.” Journal of
Economic Literature, 47(2): 1-27.
Datta Gupta, Nabanita, Anders Poulsen and Marie-Claire Villeval. 2005. ”Male and Female
Competitive Behavior – Experimental Evidence.” IZA Discussion Paper 1833.
Dohmen, Thomas, Armin Falk, David Huffman, Uwe Sunde, Jürgen, Schupp and Gert G.
Wagner. 2011. “Individual Risk Attitudes: Measurement, Determinants and Behavioral
Consequences.”Journal of the European Economic Association, 9(3):.
Dreber, Anna, Emma von Essen, and Eva Ranehill. 2009. “Outrunning the Gender Gap: Boys
and Girls Compete Equally.” SSE/EFI Working Paper Series in Economics and Finance 709.

15
Eckel, Catherine and Philip Grossman. 2008a. “Men, Women and Risk Aversion:
Experimental Evidence”. Handbook on Experimental Economics Results, Volume 1, Edited
by C. Plott and V. Smith. Chapter 113, 1063-1071. New York, Elsevier.
Eckel, Catherine, and Philip Grossman. 2008b. “Differences in the Economic Decisions of
Men and Women: Experimetnal Evidence”. Handbook on Experimental Economics Results,
Volume 1, Edited by C. Plott and V. Smith. Chapter 57, 509-519. New York, Elsevier.
Engel, Christoph. 2010. “Dictator Games: A Meta Study”. Working Paper 2010/07, Max
Planck Institute for Research of Collective Goods.
Fehr, Ernst, Daniela Rützler and Matthias Sutter. 2011. ”The Development of Egalitarianism,
Altruism, Spite and Parochialism in Childhood and Adolescence.” IZA Discussion Paper
5530.
Flory, Jeffrey, Leibbrandt, Andreas and John List. 2010. “Do Competitive Work Places Deter
Female Workers? A Large-Scale Natural Field Experiment on Gender Differences in Job-
Entry Decisions.” NBER Working Paper Series w16546.
Fortin, Nicole M. 2008. “The Gender Wage Gap among Young Adults in the United States.”
Journal of Human Resources, 884-918.
Gneezy, Uri, Kenneth Leonard and John List. 2009. “Gender Differences in Competition:
Evidence from a Matrilineal and a Patriarchal Society.” Econometrica, 77(5): 1637-1664.
Gneezy, Uri, Muriel Niederle and Aldo Rustichini. 2003. “Performance in Competitive
Environments: Gender Differences.” Quarterly Journal of Economics, 118(3): 1049-1074.
Gneezy, Uri and Aldo Rustichini. 2004a. “Gender and Competition at a Young Age.”
American Economic Review, 94(2): 377-381.
Gneezy, Uri and Aldo Rustichini. 2004b. “Executives verses Teachers: Gender, Competition
and Self Selection.” Mimeo.
Grosse, Niels D. and Gerhard Reiner. 2010. “Explaining Gender Differences in
Competitiveness: Gender-Task Stereotypes.” Jena Economic Research Papers 2010 – 017.
Gummerum, Michaela, Yaniv Hanoch, Monika Keller, Katie Parsons, and Alegra Hummel.
2010. “Preschoolers„ Allocations in the Dictator Game: The Role of Moral Emotions.”
Journal of Economic Psychology, 31(1): 25-34.
Günther, Christina, Neslihan Arslan Ekinici, Christiane Schwieren and Martin Strobel. 2009.
“Women Can‟t Jump? – An Experiment on Competitive Attitudes and Stereotype Threat.”
Journal of Economic Behavior and Organization, 75(3): 395-401.
Harbaugh, William T., Kate Krause and Lise Vesterlund. 2002. “Risk Attitudes of Children
and Adults: Choices over Small and Large Probability Gains and Losses.” Experimental
Economics, 5(1): 53–84.
Harbaugh, William T., Kate Krause, and Steven G. Liday, Jr. 2003. “Bargaining by
Children.” Working Paper, University of Oregon.
Manning, Alan and Saidi Farzad. 2010. “Understanding the Gender Pay Gap: What‟s
Competition Got to Do with It?” Industrial and Labor Relations Review, 63(4): 681-698.
Manning, Alan and Joanna Swaffield. 2008. “The Gender Gap in Early-Career Wage
Growth.” Economic Journal, 118: 983-1024.

16
Martinsson, Peter, Nordblom, Katarina, Rützler, Daniela and Matthias Sutter. 2011. “Social
preferences during childhood and the role of gender and age – An experiment in Austria and
Sweden”. Economics Letters, 110(3), 248-251.
Niederle, Muriel and Lise Vesterlund. 2007. “Do Women Shy away from Competition? Do
Men Compete too Much?” Quarterly Journal of Economics, 122(3): 1067-1101.
Niederle, Muriel and Alexandra H. Yestrumskas. 2008. “Gender Differences in Seeking
Challenges: The Role of Institutions.” Mimeo.
Shurchkov, Olga. Forthcoming. “Under Pressure: Gender Differences in Output Quality and
Quantity under Competition and Time Constraints.” Journal of the European Economic
Association.
Sutter, Matthias and Daniela Rützler. 2010. “Gender Differences in Competition Emerge
Early in Life.” IZA Discussion Paper 5015.
Sutter, Matthias, Martin G. Kocher, Daniela Rützler and Stefan T. Trautmann. 2010.
”Impatience and Uncertainty: Experimental Decisions Predict Adolescents‟ Field Behavior.”
IZA Discussion Paper 5404.
Wozniak, David, William Harbaugh and Ulrich Mayr. 2010. “Choices About Competition:
Differences by Gender and Hormonal Fluctuations, and the Role of Relative Performance
Feedback.” MPRA Paper 21097.
Zhang, Jane. 2010. “Do Girls in China Compete Just as Much as Boys? Evidence from an
Experiment that Predicts Educational Choice.” Mimeo.

17
Appendix
Table A1. Math: Logit regression controlling for performance beliefs and risk
preferences.
Math (restricted sample) Math (full sample)
Variables 1 2 3 4 5 6
Female -0.967** -0.766* -0.510 -0.373 -1.039** -0.840*
(0.356) (0.378) (0.395) (0.403) (0.329) (0.346)
Performance
0.187** 0.110 0.089
0.201**
(0.052) (0.057) (0.056)
(0.049)
Beliefs
0.883** 0.954**
(0.246) (0.265)
Risk
0.417*
(0.166)
Constant -0.491* -2.216** -3.625 -4.903** -0.582** -2.417**
(0.233) (0.559) (0.747) (0.959) (0.203 (0.516)
R-squared 0.038 0.115 0.189 0.231 0.043 0.124
Observations 169 169 169 169 215 215
* Robust standard errors in parentheses. *p<0.05, **p<0.01. 45 participants were never asked to state beliefs
about second stage performance, one participant did not answer the risk question and one did not choose
payment scheme.
Table A2. Word: Logit regression controlling for performance beliefs and risk
preferences.
Word (restricted sample) Word (full sample)
Variables 1 2 3 4 5 6
Female -0.251 -0.248 0.230 0.404 -0.275 -0.276
(0.331) (0.334) (0.388) (0.4310 (0.299) (0.300)
Performance
0.074 -0.028 -0.025
0.043
(0.045) (0.050) (0.048)
(0.038)
Beliefs
1.161** 1.168**
(0.271) (0.280)
Risk
0.345*
(0.134)
Constant -0.580* -1.213** -3.282** -4.393** -0.693** -1.098*
(0.237) (0.461) (0.783) (0.984) (0.208) (0.447)
R-squared 0.003 0.016 0.124 0.157 0.003 0.007
Observations 167 167 167 167 214 214
* Robust standard errors in parentheses. *p<0.05, **p<0.01. 45 participants were never asked to state beliefs
about second stage performance, one participant did not answer the risk question and two did not choose
payment scheme.
Related Documents