University of Texas at El Paso DigitalCommons@UTEP Open Access eses & Dissertations 2011-01-01 Impulse Oscillometric Features And Parsimonious Respiratory Models Track Small Airway Function In Hispanic And Anglo Children Erika Guadalupe Meraz Tena University of Texas at El Paso, [email protected] Follow this and additional works at: hps://digitalcommons.utep.edu/open_etd Part of the Biomedical Commons is is brought to you for free and open access by DigitalCommons@UTEP. It has been accepted for inclusion in Open Access eses & Dissertations by an authorized administrator of DigitalCommons@UTEP. For more information, please contact [email protected]. Recommended Citation Meraz Tena, Erika Guadalupe, "Impulse Oscillometric Features And Parsimonious Respiratory Models Track Small Airway Function In Hispanic And Anglo Children" (2011). Open Access eses & Dissertations. 2540. hps://digitalcommons.utep.edu/open_etd/2540

Welcome message from author
This document is posted to help you gain knowledge. Please leave a comment to let me know what you think about it! Share it to your friends and learn new things together.
Transcript
University of Texas at El PasoDigitalCommons@UTEP
Open Access Theses & Dissertations
2011-01-01
Impulse Oscillometric Features And ParsimoniousRespiratory Models Track Small Airway FunctionIn Hispanic And Anglo ChildrenErika Guadalupe Meraz TenaUniversity of Texas at El Paso, [email protected]
Follow this and additional works at: https://digitalcommons.utep.edu/open_etdPart of the Biomedical Commons
This is brought to you for free and open access by DigitalCommons@UTEP. It has been accepted for inclusion in Open Access Theses & Dissertationsby an authorized administrator of DigitalCommons@UTEP. For more information, please contact [email protected].
Recommended CitationMeraz Tena, Erika Guadalupe, "Impulse Oscillometric Features And Parsimonious Respiratory Models Track Small Airway FunctionIn Hispanic And Anglo Children" (2011). Open Access Theses & Dissertations. 2540.https://digitalcommons.utep.edu/open_etd/2540
IMPULSE OSCILLOMETRIC FEATURES AND PARSIMONIOUS
RESPIRATORY MODELS TRACK SMALL AIRWAY FUNCTION IN
HISPANIC AND ANGLO CHILDREN
ERIKA GUADALUPE MERAZ TENA
Department of Electrical and Computer Engineering
APPROVED:
Homer Nazeran, Ph.D., Chair
Patricia Nava, Ph.D.
Jorge Ibarra, MD.,MPH Edson Estrada, PhD.
Patricia D. Witherspoon, Ph.D. Dean of the Graduate School
Copyright ©
by
Erika Guadalupe Meraz Tena
2011

To my beloved husband and sons Paul and Jose
IMPULSE OSCILLOMETRIC FEATURES AND PARSIMONIOUS
RESPIRATORY MODELS TRACK SMALL AIRWAY FUNCTION IN
HISPANIC AND ANGLO CHILDREN
by
ERIKA GUADALUPE MERAZ TENA, MSc
DISSERTATION
Presented to the Faculty of the Graduate School of
The University of Texas at El Paso
in Partial Fulfillment
of the Requirements
for the Degree of
DOCTOR OF PHILOSOPHY
Department of Electrical and Computer Engineering
THE UNIVERSITY OF TEXAS AT EL PASO
May 2011
v
Acknowledgements
A mi esposo, gracias por tu gran apoyo, paciencia, comprensión y amor que siempre me has
brindado, sobretodo durante estos años de estudio. A mis hijos gracias por silenciosamente apoyarme y
disculparme por el tiempo que les he quitado para dedicarme a terminar esta investigación y
dissertacion, los amo.
A mis padres, mil gracias por su apoyo incondicional que siempre me han brindado, gracias por
siempre apoyar mis sueños, y por su gran ayuda siendo padres sustitutos de mis hijios por periodos de
tiempo.
A mi Tia Mary muchas gracias por ser la nana de mis hijos y cuidarlos con tanto amor mientras
yo trabajaba en esta investigación.
A mis hermanas y cuñados, gracias por su cariño y apoyo durante estos años de estudio.
To Dr. Homer Nazeran thank you for giving me the opportunity to work in this research. Thank
you very much for your patience, kindness, support, guidance and understanding during all this years of
study, research and hard work. I will always be deeply grateful for making this dissertation possible.
Thank you for always trusting me and shared with me your knowledge in the area of Impulse
Oscillometry.
This work is also dedicated to the Memory of Dr. Michael Goldman; he made substantial
contributions to the clinical application of the Forced Oscillation Technique over several decades. He
was our role model. He inspired, guided, and educated us all by selflessly devoting his valuable time,
spending his tremendous energy and sharing his vast expert knowledge in Pulmonary Physiology, FOT,
and IOS testing and related areas. Tragically we lost him in March 2010. We will be eternally thankful
for his teachings, collaboration and friendship. He will always be remembered, missed and present in
our work and our hearts.
vi
Abstract
Asthma is an inflammatory condition of the peripheral (small) airways resulting in airway hyper-
reactivity and, among other symptoms, airflow obstruction. It is the most prevalent chronic respiratory
disease in children. Reliable and patient-friendly instruments and methods are required to help
pulmonologists accurately detect asthma and Small Airway Impairment (SAI) with acceptable clinical
accuracy, specificity and sensitivity. Impulse Oscillometry System (IOS) based on the Forced
Oscillation Technique (FOT) has been successfully used to measure lung function in children with a
high degree of sensitivity and specificity to SAI and Asthma. IOS is a patient-friendly lung function to
measure the mechanical impedance of the respiratory system. Equivalent electrical circuit models of
lung function have been developed that can be used to quantify severity of SAI. It has been shown that
impulse oscillometric parameters as well as parameter estimates of these equivalent electrical circuit
models provide useful indicators of lung function and therefore have the potential to be used as sensitive
features for computer-aided classification of pulmonary function in health and disease. Previous work by
our group has evaluated several known respiratory models and two parsimonious versions known as
extended RIC (eRIC) and augmented RIC (aRIC) models have emerged which offer advantages over
earlier models.
This doctoral research aims to analyze IOS data acquired from Anglo and Hispanic children
during pre- and post-bronchodilation conditions, as well as use the eRIC and aRIC model estimated
parameters to determine which ones are better to differentiate between constricted and non-constricted
lung conditions. It is also the first attempt to establish reference values for North American Anglo and
Hispanic children 5 to 19 years old, and find correlations between IOS and eRIC and aRIC model
parameters. The overall objective is to develop a user-friendly tool to assist clinicians in the analysis and
interpretation of IOS data to better detect, diagnose, and treat asthma conditions. In the near future, this
approach offers the potential to be used for computer-aided classification of pulmonary diseases.
vii
Table of Contents
Acknowledgements……………. ................................................................................................ v
Abstract ...................................................................................................................................... vi
Table of Contents ..................................................................................................................... vii
List of Tables ............................................................................................................................. ix
List of Figures ............................................................................................................................ xi
Chapter 1: Introduction ............................................................................................................... 1
1.1 Background and Significance of the Project ....................................................................... 1
1.2 Hypothesis and Goals of the Project .................................................................................... 4
1.3 Proposed Work .................................................................................................................... 5
Chapter 2: Human Respiratory System Anatomy and Physiology ............................................. 6
2.1 Introduction .......................................................................................................................... 6
2.2 The Airways and Alveoli ..................................................................................................... 6
2.3 The Lungs .......................................................................................................................... 10
2.4 Thoracic Anatomy ............................................................................................................. 14
2.5 Mechanics of Breathing ..................................................................................................... 15
2.6 Lung Volumes and Capacities ........................................................................................... 18
2.7 Human Respiratory System Diseases ................................................................................ 19
Chapter 3: Pulmonary Function Tests and Previous Studies .................................................... 26
3.1 Introduction ........................................................................................................................ 26
3.2 Spirometry ......................................................................................................................... 26
3.3 Forced Oscillation technique and Impulse Oscillometry System (IOS) ............................ 27
3.4 Bronchodilation phenotype ................................................................................................ 36
3.5 IOS Previous Studies ......................................................................................................... 37
3.6 IOS Reference Values - Previous Studies ......................................................................... 46
Chapter 4: Respiratory System Models .................................................................................... 49
4.1 Introduction ........................................................................................................................ 49
4.2 Respiratory System Models ............................................................................................... 49
4.3 Previous studies about eRIC and aRIC models ................................................................. 55
4.4 Parameter Estimation Technique ....................................................................................... 59
viii
Chapter 5: Methods ................................................................................................................... 61
5.1 Introduction ........................................................................................................................ 61
5.2 Research Method Design and Statistical Analysis ............................................................ 61
5.3 Human Subject Interactions ............................................................................................... 62
5.4 IOS Tests Procedure .......................................................................................................... 62
Chapter 6: Results and Discussions .......................................................................................... 67
6.1 Introduction ........................................................................................................................ 67
6.2 Results and Discussions from Hypotheses 1, 2 ................................................................. 68
6.3 Results and Discussions from Hypothesis 3 .................................................................... 100
Chapter 7: Conclusions ........................................................................................................... 117
References ............................................................................................................................... 121
Appendix A ............................................................................................................................. 127
Vita...………………………………………………………………………………………...131
ix
List of Tables
Table 3.1 IOS vs Spirometry Studies ........................................................................................................ 41
Table 3.2 IOS vs other Techniques Studies ............................................................................................... 44
Table 3.3 IOS studies ................................................................................................................................. 45
Table 3.4 IOS Reference Values ............................................................................................................... 48
Table 4.1 Previous studies about the aRIC and eRIC performance. ......................................................... 58
Table 4.2 Respiratory system’sresistance and reactance values for a healthy male child. ........................ 59
Table 4.3 Model parameters calculated for a healthy male child .............................................................. 60
Table 6.1 IOS Measurements and Calculated Values ............................................................................... 69
Table 6.2 Estimated Parameters for Anglo/Asthmatic children ................................................................ 70
Table 6.3 IOS Measurements .................................................................................................................... 71
Table 6.4 Model parameters ...................................................................................................................... 71
Table 6.5 IOS Measurements for the Normal Children ............................................................................. 72
Table 6.6 Estimated Parameters for the Anglo Group Using aRIC Model ............................................... 72
Table 6.7 Estimated Parameters for the Hispanic group using aRIC Model ............................................. 73
Table 6.8 Study Population ........................................................................................................................ 73
Table 6.9 IOS Measurements and Model Parameters for the Normal Children ........................................ 74
Table 6.10 IOS Measurements and Model Parameters for the PSAD Children ........................................ 74
Table 6.11 IOS Measurements and Model Parameters for the SAD Children. ......................................... 74
Table 6.12 IOS Measurements and Model Parameters for the Asthmatic Children ................................. 75
Table 6.13 Prebronchodilation work ......................................................................................................... 77
Table 6.14 IOS measurements and calculated values for pre-B and post-B data ...................................... 79
Table 6.15 Estimated parameters for the aRIC model ............................................................................... 79
Table 6.16 IOS Parameters for the Normal/PSAI group ........................................................................... 81
Table 6.17 IOS Parameters for the Asthma/SAI group ............................................................................. 81
Table 6.18 aRIC Model Parameters for the Normal/PSAI group .............................................................. 81
Table 6.19 aRIC model Parameters for the Asthma/SAI group ................................................................ 82
Table 6.20 eRIC model Parameters for the Normal/PSAI group .............................................................. 82
Table 6.21 eRIC model parameters for the Asthma/SAI group ................................................................ 82
Table 6.22 Statistical significance of differences between normal and SAI subjects ............................... 84
Table 6.23 Significant differences from baseline (2006) to 2008 pre-BD and from pre- to post-BD in 2008 ........................................................................................................................................................... 84
Table 6.24 Summary of Pre- and Post- Bronchodilation Work ................................................................. 85
Table 6.25 Healthy Children IOS and Models Parameters Pre-B (N=11) ................................................ 86
Table 6.26 PSAI Children IOS and Models Parameters Pre-B (N=17) .................................................... 87
Table 6.27 SAI Children IOS and Models Parameters Pre-B (N=54) ....................................................... 87
Table 6.28 Asthmatic Children IOS and Models Parameters Pre-B (N=54) ............................................. 87
Table 6.29 Correlation coefficients (r) between IOS and Model Parameters and Height for 2006 Data 89 Table 6.30 Healthy children IOS and Models Parameters Pre- and Post-B (N=6) ................................... 90
Table 6.31 PSAI children IOS and Models Parameters Pre- and Post-B (N=4) ....................................... 91
Table 6.32 SAI children IOS and Models Parameters Pre- and Post-B (N=11) ........................................ 91
Table 6.33 Asthmatic children IOS and Models Parameters Pre- and Post-B (N=24).............................. 92
Table 6.34 Healthy Group p values ........................................................................................................... 96
Table 6.35 PSAI Group p values ............................................................................................................... 96
Table 6.36 SAI Group p values ................................................................................................................. 97
Table 6.37 Asthma Group p values ........................................................................................................... 97
x
Table 6.38 Correlation Coefficients (r) between Height and IOS and Models’ Parameters for 2008 Data ................................................................................................................................................................... 99
Table 6.39 Demographics for the 26 children tested in 2006 and 2008. ................................................. 101
Table 6.40 Average Values and Statistical Significance (SAI vs H) of IOS parameters. ....................... 102
Table 6.41 Average values and Statistical Significance (SAI vs H) of the eRIC and aRIC Model Parameters. ............................................................................................................................................... 103
Table 6.42 Significance difference between 2006-2008 pre-B, and 2008 pre-B and post-B data for IOS parameters. ............................................................................................................................................... 103
Table 6.43 Significant differences between 2006-2008 pre-B, and 2008 pre-B and post-B data for model parameters. ............................................................................................................................................... 104
Table 6.44 Growth and bronchodilator percentage of change in H and SAI children. ........................... 104
Table 6.45 Impact on calculation of R and X (averaged values) by including or excluding an overweight child in 2006 (OC=Overweight child included and NOC=No overweight child included). ................... 105
Table 6.46 Time change in SAI and H children IOS and model parameters (averaged values) ............. 111
xi
List of Figures
Figure 2.1 Respiratory System Structure (52). ............................................................................................ 6
Figure 2.2 The Tracheobronchial Tree (52). ............................................................................................... 7
Figure 2.3 Branching of the airways (52). ................................................................................................... 8
Figure 2.4 The acinus formed by terminal bronchiole subdivisions (52). ................................................... 9
Figure 2.5 The Lungs (52). ........................................................................................................................ 10
Figure 2.6. Autonomic Nervous System Neurotransmitters and Receptors (52). ..................................... 14
Figure 2.7 The Thoracic Cavity (52). ........................................................................................................ 15
Figure 2.8 Lung Volumes and Capacities (55). ......................................................................................... 19
Figure 3.1 Spirometry parameters (70). .................................................................................................... 27
Figure 3.2 Data for spectra of Respiratory Resistance, Reactance and Coherence from 3 to 35 Hz (74) . 30
Figure 3.3 Power spectra for flow ( ____ ) and pressure (-----) (74). ........................................................ 30
Figure 3.4 Schematic diagram of the IOS with its measuring-head and connectors (74) ......................... 31
Figure 3.5 IOS main screen ...................................................................................................................... 32
Figure 3.6 A child undergoing pulmonary function testing by the IOS. ................................................... 32
Figure 3.7 IOS parameters (76) ................................................................................................................. 34
Figure 3.8: Reactance measurements in a Normal and a SAI child as a function of oscillation frequency ................................................................................................................................................................... 35
Figure 4.1 RC Model (47) ........................................................................................................................ 50
Figure 4.2 RIC Model (47) ....................................................................................................................... 51
Figure 4.3 Dubois Model (47) ................................................................................................................... 52
Figure 4.4 Mead’s Model (47) ................................................................................................................... 53
Figure 4.5 eRIC model (47) ....................................................................................................................... 54
Figure 4.6 aRIC Model (47) ..................................................................................................................... 55
Figure 6.1 Correlation between AX vs eRIC Cp for pre-B data ............................................................... 89
Figure 6.2 R3 mean values for the H, PSAI, SAI and Asthma children under Pre- and Post-B conditions ................................................................................................................................................................... 93
Figure 6.3 R5 mean values for the H, PSAI, SAI and Asthma children under Pre- and Post-B conditions ................................................................................................................................................................... 93
Figure 6.4 R3-R20 mean values for the H, PSAI, SAI and Asthma children under Pre- and Post-B conditions ................................................................................................................................................... 94
Figure 6.5 R5-R20 mean values for the H, PSAI, SAI and Asthma children under Pre- and Post-B conditions ................................................................................................................................................... 94
Figure 6.6 AX mean values for the H, PSAI, SAI and Asthma children under Pre- and Post-B conditions ................................................................................................................................................................... 95
Figure 6.7 eRIC Cp mean values for the H, PSAI, SAI and Asthma children under Pre- and Post-B conditions ................................................................................................................................................... 95
Figure 6.8 aRIC Cp mean values for the H, PSAI, SAI and Asthma children under Pre- and Post-B conditions ................................................................................................................................................... 96
Figure 6.9 Correlation between AX and eRIC Cp for pre- and post-B data ........................................... 100
Figure 6.10 R vs Oscillation Frequency in 2006 for averaged SAI and averaged H subjects. ................ 106 Figure 6.11 X vs Oscillation Frequency in 2006 for averaged SAI and averaged H subjects. ............... 106 Figure 6.12 R vs Oscillation Frequency in 2008 for Averaged SAI and Averaged H Subjects. ............. 107 Figure 6.13 X vs. Oscillation Frequency in 2008 for Averaged SAI and Averaged H Subjects. ........... 107 Figure 6.14 Cp as a function of AX for the eRIC and aRIC models in all subjects and measurements . 108
(2006 pre-B, 2008 pre-B and 2008 post-B). ............................................................................................ 108
xii
Figure 6.15 Rp as a function of R5–R20 for the eRIC and aRIC models in all subjects and .................. 109
measurements (2006 pre-B, 2008 pre-B and 2008 post-B). .................................................................... 109
Figure 6.16 Regression line for both models (aRIC and eRIC) Cp in all subjects and measurements ... 109 (2006 pre-B, 2008 pre-B and 2008 post-B). ............................................................................................ 109
Figure 6.17 AX vs Height in all subjects and measurements (2006 pre-B, 2008 pre-B and 2008 post-B) ................................................................................................................................................................. 110
Figure 6.18 eRIC Cp vs Height in all Subjects and Measurements (2006 pre-B, 2008 pre-B and 2008 111 post-B). .................................................................................................................................................... 111
Figure 6.19 Growth changes in eRIC Cp for all H Children. .................................................................. 113
Figure 6.20 Growth Changes in eRIC Cp for All SAI Children ............................................................ 113
1
Chapter 1: Introduction
1.1 BACKGROUND AND SIGNIFICANCE OF THE PROJECT
Asthma is an inflammatory condition of the airways resulting in airway function becoming
hyper-reactive, and generating increased mucus, mucosal swelling and airway smooth muscle
contraction all of which contribute to (partial) airway obstruction. The symptoms include chest
tightness, coughing and wheezing, and in severe cases shortness of breath and low blood oxygen (1).
According to the American Academy of Allergy and Asthma & Immunology, Asthma and
allergies strike 1 out of 4 Americans and approximately 20 million Americans have asthma. Nine
million U.S. children under 18 have been diagnosed with asthma. Every day in America 40,000 people
miss school or work, 30,000 have an asthma attack, 5,000 visit the emergency room, and 1,000 are
admitted to the hospital and, although asthma is rarely fatal, 11 persons die every day due to asthma.
Direct health care costs for asthma in the U.S. total more than $10 billion annually; and indirect costs
(lost productivity) are $8 billion giving a total of $18 billion (2).
In Mexico, 10% (approximately 10 million people), of the population suffer from asthma. It is
the most common cause of chronic illnesses and emergency hospitalizations in children according to the
Mexican College of Allergy, Asthma and Pediatric Pulmonology (3).
Assessment of respiratory function is important in diagnosis and monitoring of asthma and other
respiratory diseases in children (4). The pulmonary function test most commonly used to detect asthma
is spirometry, which measures the volume of air that can be moved in or out of the lungs as a function of
time with rapid and maximal inspiratory and expiratory efforts. This requires a considerable degree of
cooperation from the subject, which is difficult to achieve for older children and almost impossible to
achieve by younger children. This makes the diagnosis of asthma difficult owing to the lack of objective
measurements for younger children (5). Furthermore, it has been reported that some asthmatic patients
do not improve spirometrically, despite clinical improvement with treatment (6). This is of concern
because if asthma is not appropriately controlled, it can lead to permanent airway damage.
In contrast to forced spirometry, the forced oscillation technique (FOT) superimposes small air
pressure perturbations on the natural breathing of a subject to measure lung mechanical parameters. The
2
Impulse Oscillometry System (IOS) measures respiratory impedance using short pulses (impulses) of air
pressure. It has been developed as a patient-friendly lung function test that minimizes demands on the
patient and requires only passive cooperation wearing a nose clip, keeping lips tightly closed about a
mouthpiece and breathing normally through the mouth. IOS has been used with success to asses lung
function in healthy and asthmatic children and adolescents (4) (5) (6) (7) (8) (9) (10) (11) (12) (13) (14)
(15) (16) (17) (18) (19) (20) (21) (22) (23) (24) (25) (26) (27) (28) (29) (30) (31) (32) . In infants and
children, reversible airway obstruction and bronchial hyperresponsiveness (BHR) are significant
components contributing to the diagnosis of bronchial asthma (27). All this evidence, which will be
described in detail later in this dissertation, confirms that lung function in children and adolescents is
sensitively and accurately assessed by IOS, before and after bronchodilation. However, it seems that
there are different parameters that can offer significant information in assessment of asthma. For this
reason, in this study it is proposed to evaluate IOS data acquired from Anglo and Hispanic children, pre-
and post-bronchodilation, evaluating statistical significance between different IOS parameters.
The European Respiratory Society in 1995 published a workshop report (33) about “Reference
Values for Residual Volume (RV), Functional Residual Capacity (FRC) and Total Lung Capacity” in
which it was mentioned that reference values play an important role in establishing whether the
measured volumes fall within an expected range for healthy individuals of the same sex, similar stature,
age, and other characteristics. They also point out that comparing reference with measured values is
fraught with difficulties, as this may result in disease being undetected and as a consequence untreated.
It is also mentioned that FRC is the only lung volume that can be measured routinely with accuracy and
reliability, and in addition it is stated that attempts have been made to evaluate TLC and RV. In this
report reference values (values for healthy subjects) and prediction equations for lung volumes for
children and adults are obtained using different techniques like helium dilution and body
plethysmography. These values are presented for different heights. However, this report does not include
reference values and prediction equations based on the Forced Oscillation Technique (FOT).
In 1991, the American Thoracic Society published guidelines focusing on spirometry as the most
widely used lung function test, where they presented reference values for spirometric parameters for
3
Caucasian and Black men and women. They also mentioned that it is common practice to interpret the
results of lung function tests in relation to reference values and in terms of whether or not they are
considered to be within the “normal” range (34).
A few studies have been developed to obtain Reference values of healthy children using Forced
Oscillation Technique (FOT) and IOS (35) (36) (37) (38) (39) (40) (41) (42). Those studies are also
described in detail in another section of this research.
It is of vital importance to have IOS reference values for children, as this technique has been
shown to be very useful in the detection of lung abnormalities. Therefore, this study is intended to make
an effort towards establishing normal reference IOS values for North American Anglo and Hispanic
children 5 to 19 years old. Also it aims to present baseline (pre-) and post-bronchodilation IOS
parameters for Anglo and Hispanic children with Probable Small Airway Impairment (PSAI), Small
Airway Impairment (SAI) and Asthma.
IOS yields frequency-dependent curves of respiratory impedance that are visually analyzed to
recognize changes in shape and magnitude of the curves and distinguish healthy respiratory function
from disease. The IOS data can be deployed to develop mechanical and equivalent electrical circuit
models of the respiratory impedance to evaluate and quantify lung mechanics. In these equivalent
models, electrical components analogous to mechanical resistance, compliance, and inertance inherent in
the respiratory system are used. Therefore, estimates for these model parameters based on IOS
measurements could be used as baseline measures for better detection, diagnosis, and treatment of
different respiratory diseases (43).
Previous work has focused on development and analysis of different equivalent electrical circuit
models for human respiratory impedance. This effort to date has demonstrated that the performance of
extended Resistance Inductance Capacitance (eRIC) model and the Augmented RIC (aRIC) model (an
improvement of the eRIC model) ranked in the middle of a series of conventional models developed
over the past several decades in terms of total cumulative error. However, they provide parameter
estimates that are physiologically more realistic and in line with expected values in normal subjects and
4
those suffering from pulmonary diseases (43) (44) (45) (46) (47) (48) (49) (50) (51), than previous
models.
The present study is proposed to determine eRIC and aRIC model parameter estimates of lung
function in Normal (N) or Healthy (H), PSAI, SAI and Asthmatic (A) Anglo and Hispanic children, to
evaluate the performance of these models in quantifying lung function in this population and to analyze
the correlation of these models parameters with IOS measured and calculated parameters.
1.2 HYPOTHESIS AND GOALS OF THE PROJECT
The hypotheses to be tested in this project are:
� Baseline IOS values of Resistance, Reactance, Fres or AX and IOS calculated values as
frequency-dependence of Resistance (fdR) and AX, predict changes after bronchodilation in
normal, PSAI, SAI, and Asthmatic children.
� eRIC and aRIC models of lung function based on IOS measurements yield estimates of lung
resistance and compliance that can quantify respiratory mechanics to discriminate between N
or H, PSAI, SAI and A children.
� The expected growth-related improvement in IOS and eRIC/aRIC parameter estimates will
be greater in N/PSAI children than in SAI/A children.
Goals of the project are:
� Create a database of normal, PSAI, SAI, and Asthma IOS impedance and calculated values
(judged by pulmonologist) and eRIC and aRIC model values for baseline and post-
bronchodilation conditions.
� Determine statistical significance of differences between pre- and post-bronchodilation IOS
data for all IOS parameters as well as eRIC and aRIC model parameters for Normal, PSAI,
SAI and children with Asthma.
� Evaluate the performance of the IOS and eRIC/aRIC model parameters in evaluating lung
changes over time (two years periods).
� Evaluate statistical correlation between different IOS and model parameters.
5
� Compare the performance of models derived parameters calculated with IOS data from 5 to
35 Hz and 3 to 25Hz.
1.3 PROPOSED WORK
For this research, the following work to be performed is proposed:
� A database of Normal, PSAI, SAI, and Asthma IOS impedance and calculated values (judged by
a pulmonologist) and eRIC and aRIC model values for baseline and post-bronchodilation
conditions will be created for 112 children tested in pre-bronchodilation conditions and for 47
children tested with pre- and post-bronchodilation conditions.
� Statistical significance of differences between pre- and post-bronchodilation IOS data for all IOS
parameters: Resistances and Reactances from 3 to 25 Hz, Fres, fdR (R3-R20, R5-R20), AX and
eRIC and aRIC model parameters for Normal, PSAI, SAI and Asthmatic children will be
determined.
� The performance of the IOS and parsimonious model parameters in evaluating lung changes over
time (two years period) will be evaluated in 26 children tested in both years (2006 and 2008).
� Statistical correlation between different IOS and model parameters will be evaluated.
� A Comparison of the performance of model-derived parameters calculated with IOS data from 5
to 35 Hz and 3 to 25Hz will be performed.

6
Chapter 2: Human Respiratory System Anatomy and Physiology
2.1 INTRODUCTION
In order to develop this research, an extensive knowledge of the Anatomy (structure), Physiology
(function) and Pathophysiology (functional changes resulting from diseases or injury) of the Human
Respiratory System is required. In this chapter, a review of these aspects is presented.
2.2 THE AIRWAYS AND ALVEOLI
The airways are the place where the atmospheric air and the gas-exchange membrane of the
lungs are connected. The airways only provide a pathway to the inspired (inhaled) air to reach the gas
exchange surface; they do not participate in gas exchange. Airways are divided into: Upper airways and
lower airways. The inspired air is warmed, humidified and filtered by the upper airways in its transit to
the gas exchange surface (52).
2.2.1 The Upper Airways
The upper airways are composed of nose, oral cavity, pharynx and larynx, see Figure 2.1.
Figure 2.1 Respiratory System Structure (52).
7
The main functions of the nose are humidification, heating and filtering of the inspired air. The
nose has a mucus-secreting epithelium called respiratory mucosa. Nasal secretions are the first defense
against inspired agents; it contains immunoglobulins (antibodies) and inflammatory cells.
The pharynx is behind the nose and extends down to the larynx. The pharynx is subdivided into:
nasopharynx, oropharynx, laryngopharynx (see Figure 2.1). A special type of tissue called lymphatic
tissue in the nasopharynx and oropharynx provide an immunological defense. The oropharynx and
laryngopharynx give way to food and air, and the laryngopharynx separates the digestive and respiratory
tracts.
The larynx acts as a valve at the beginning of the trachea; it contains the vocal cords that control
the size of the opening into the trachea (glottis). The larynx main functions are: speech and prevent the
lower airway from aspirating solids and liquids during swallowing and breathing (52).
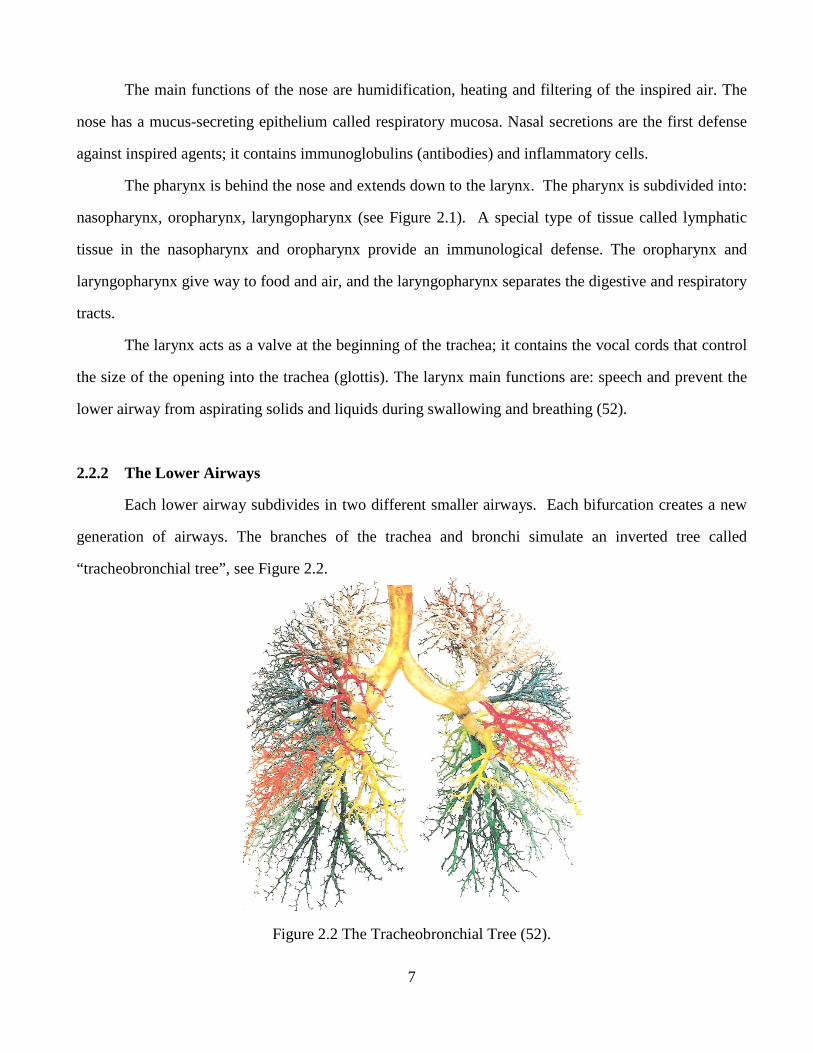
2.2.2 The Lower Airways
Each lower airway subdivides in two different smaller airways. Each bifurcation creates a new
generation of airways. The branches of the trachea and bronchi simulate an inverted tree called
“tracheobronchial tree”, see Figure 2.2.
Figure 2.2 The Tracheobronchial Tree (52).
8
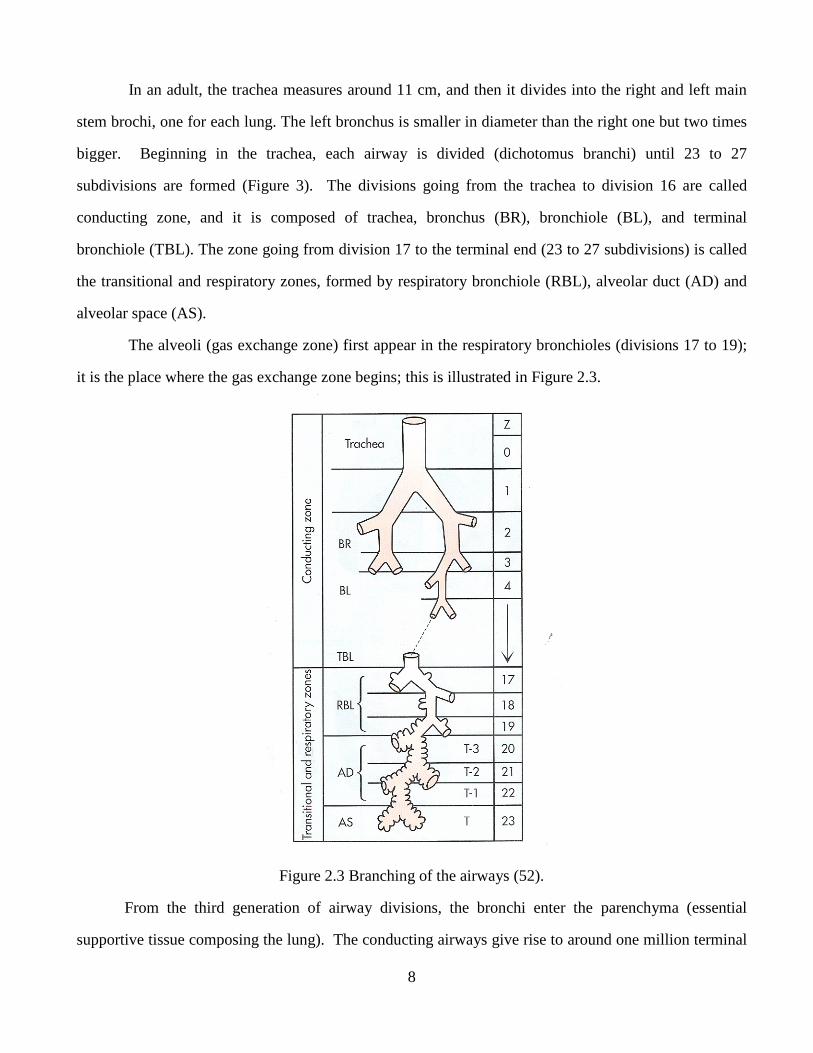
In an adult, the trachea measures around 11 cm, and then it divides into the right and left main
stem brochi, one for each lung. The left bronchus is smaller in diameter than the right one but two times
bigger. Beginning in the trachea, each airway is divided (dichotomus branchi) until 23 to 27
subdivisions are formed (Figure 3). The divisions going from the trachea to division 16 are called
conducting zone, and it is composed of trachea, bronchus (BR), bronchiole (BL), and terminal
bronchiole (TBL). The zone going from division 17 to the terminal end (23 to 27 subdivisions) is called
the transitional and respiratory zones, formed by respiratory bronchiole (RBL), alveolar duct (AD) and
alveolar space (AS).
The alveoli (gas exchange zone) first appear in the respiratory bronchioles (divisions 17 to 19);
it is the place where the gas exchange zone begins; this is illustrated in Figure 2.3.
Figure 2.3 Branching of the airways (52).
From the third generation of airway divisions, the bronchi enter the parenchyma (essential
supportive tissue composing the lung). The conducting airways give rise to around one million terminal
9
tubes at the level where the alveoli first appear. The adult lungs are composed of 300 million alveoli,
representing a gas exchange area between 50 to 100 m².
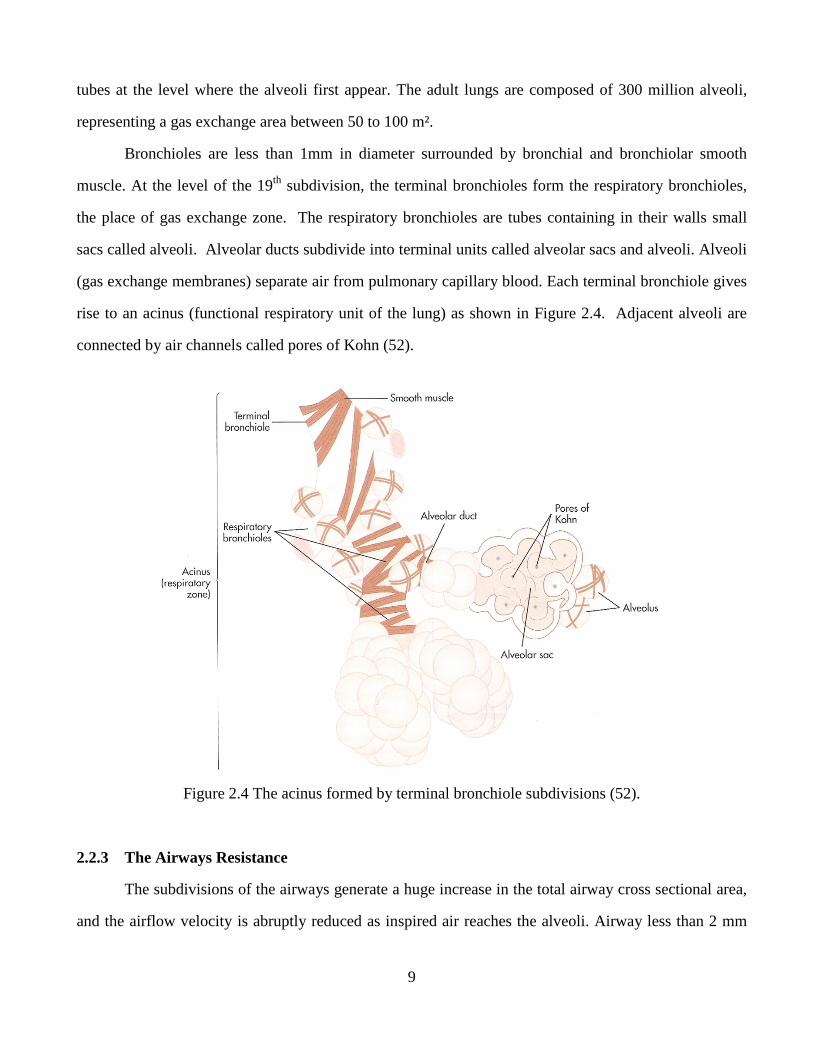
Bronchioles are less than 1mm in diameter surrounded by bronchial and bronchiolar smooth
muscle. At the level of the 19th subdivision, the terminal bronchioles form the respiratory bronchioles,
the place of gas exchange zone. The respiratory bronchioles are tubes containing in their walls small
sacs called alveoli. Alveolar ducts subdivide into terminal units called alveolar sacs and alveoli. Alveoli
(gas exchange membranes) separate air from pulmonary capillary blood. Each terminal bronchiole gives
rise to an acinus (functional respiratory unit of the lung) as shown in Figure 2.4. Adjacent alveoli are
connected by air channels called pores of Kohn (52).
Figure 2.4 The acinus formed by terminal bronchiole subdivisions (52).
2.2.3 The Airways Resistance
The subdivisions of the airways generate a huge increase in the total airway cross sectional area,
and the airflow velocity is abruptly reduced as inspired air reaches the alveoli. Airway less than 2 mm
10
represents only about 10% of the total resistance to airflow because of their huge cross sectional area.
Consequently, upper airway resistance is usually much greater than lower airway resistance (52).
Small (lower or peripheral) airways refer to about 7 to 19th generation airways with an inner
diameter of about 2 to 0.5 mm (53).
2.2.4 The Microscopic Anatomy of Conducting Airways
A mucus secreting epithelium (tissue that line a cavity) called mucosa, lines the conducting
airways. About 100 ml of mucus is secreted per day in healthy people; this volume is considerable
increased in airway inflammation. Inflammation causes the mucosa to swell and smooth airway muscle
to contract; this reaction is called bronchospasm (52).
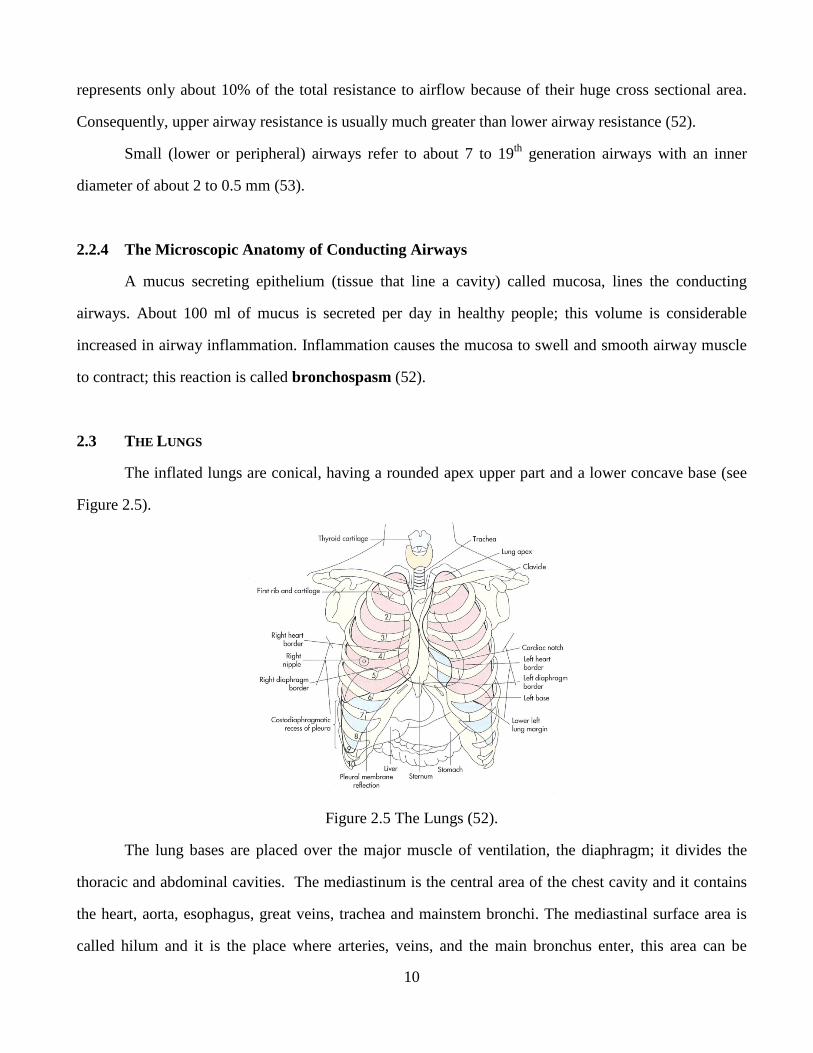
2.3 THE LUNGS
The inflated lungs are conical, having a rounded apex upper part and a lower concave base (see
Figure 2.5).
Figure 2.5 The Lungs (52).
The lung bases are placed over the major muscle of ventilation, the diaphragm; it divides the
thoracic and abdominal cavities. The mediastinum is the central area of the chest cavity and it contains
the heart, aorta, esophagus, great veins, trachea and mainstem bronchi. The mediastinal surface area is
called hilum and it is the place where arteries, veins, and the main bronchus enter, this area can be
11
visualized as the root of the lungs. The pleural membranes, visceral and parietal, are membranes that
form sealed envelopes surrounding each lung. The visceral pleura is attached to the surface of the lungs,
and then it doubles back at the hilar area and forms the parietal pleura, which is attached to the inner
chest wall surface (52).
2.3.1 Blood Supply to the Lungs
The lungs have two main blood supplies: the pulmonary and the systemic circulation. The
pulmonary circulation initiates in the right ventricle of the heart as the pulmonary artery, it carries
deoxygenated blood to the lungs to be oxygenated. Pulmonary arterioles have many subdivisions that
form the capillary beds that surround the alveoli forming a fine net. Beyond the alveoli, capillaries
congregate to form venules and pulmonary veins, which carry oxygenated blood to the left atrium of the
heart. Consequently, the entire cardiac output goes to the pulmonary circulation. The main function of
the pulmonary circulation is to bring blood in contact with alveolar gas and make possible the oxygen
and carbon dioxide exchange (52).
2.3.2 Nervous Control of the Lungs
The skeletal muscles of the diaphragm and chest wall are innervated by the somatic nervous
system (part of the peripheral nervous system associated with the voluntary control of body movements
via skeletal muscles, and with sensory reception of external stimuli); meanwhile the airways are
innervated by the autonomic nervous system (part of the peripheral nervous system that acts as a control
system functioning largely below the level of consciousness, and controls visceral functions).
The lung is innervated completely by autonomic sensory and motor nerves (no voluntary control
over airway smooth muscle exists). The autonomic nervous system is formed by sympathetic and
parasympathetic divisions; these two differ in the place where its neurons are originated and in their
function. The sympathetic division is involved in the stimulation of activities that prepare the body for
action (e.g. increasing heart rate, activation of the release of sugar from the liver into the blood, etc.)
called fight-or-flight response. The parasympathetic nervous system activates relaxation functions (e.g.
12
secretion of saliva or digestive enzymes into the stomach). For both divisions a neuron leaves the
brainstem or spinal cord and forms a junction, called synapse, with cells of the innervated organ
(effector organ). The union (synapse) between two neurons outside the spinal cord is called ganglion.
The synapses between a neuron and an effector organ cell is called neuromuscular junction. The nerve
impulses are transmitted across synapses by chemical substances called neurotransmitters; they are
released in response to electrical impulses. The neurotransmitters travel across the synapse and stimulate
the next neuron or effector organ. The two main neurotransmitters of the autonomic system are
acetylcholine and norepinephrine. The fibers between the spinal cord and ganglia are preganglionic
fibers; and those between the ganglia and the organ cell are postganglionic fibers. Sympathetic
preganglionic fibers originate in the thoracic and lumbar regions of the spinal cord, parasympathetic
fibers originate in the brain stem and sacral spinal cord (52).
2.3.2.1 Efferent (Motor) Responses: Sympathetic and Parasympathetic
Efferent nerves (motor or effector neurons) carry nerve impulses away from the central nervous
system to effectors such as muscles or glands. The opposite direction of flow is called afferent.
Sympathetic postganglionic fibers secrete norepinephrine; these neurons are called adrenergic
fibers. Symphatetic stimulation causes relaxation in the smooth airway muscle, causing an increase in its
diameter (bronchodilation) and decreasing airflow resistance. Drugs that stimulate the sympathetic
system are called adrenergic bronchodilators and are used to reverse bronchoconstriction in asthma.
Parasympathetic postganglionic fibers innervate the smooth airway muscle of the lungs, mucous
glands and the pulmonary blood vessels. They use acetylcholine as a neurotransmitter, and they are
called cholinergic fibers. The major neural bronchoconstrictor mechanism and the major determinant of
airway diameter are the parasympathetic impulses. The cholinergic impulses normally maintain a
continuous smooth muscle contraction (baseline smooth muscle tone). Too much cholinergic stimulation
can cause bronchospasm or airway muscle contraction. Drugs used to treat these conditions are called
anthicolinergic bronchodilators.
13
Parasympathetic stimulation increases the production of mucous and increments the viscosity of
airway secretions. In contrast, sympathetic stimulation produces thin watery secretions only.
The large airways are mainly innervated by cholinergic fibers; these innervations diminish as
airways become smaller. Sympathetic fibers are more uniformly distributed and adrenergic
bronchodilators are equally effective in large and small airways. This is the reason why anticholinergic
bronchodilator drugs are less useful than adrenergic bronchodilator drugs when bronchoconstriction
involves small airways, such as in the case in Asthma (52).
2.3.2.2 Adrenergic and Cholinergic Receptors
A neurotransmitter has to bind very specific receptors on the cell membrane of a postganglionic
fiber or an effector organ cell to stimulate it. Receptors are protein molecules placed on the surface of
the cell and they can penetrate completely through the cell membrane; they can change their shapes
when they bind with neurotransmitters, which cause excitatory or inhibitory reactions in the cell by
changing its membrane permeability to specific ions or by inactivating or activating an intracellular
enzyme.
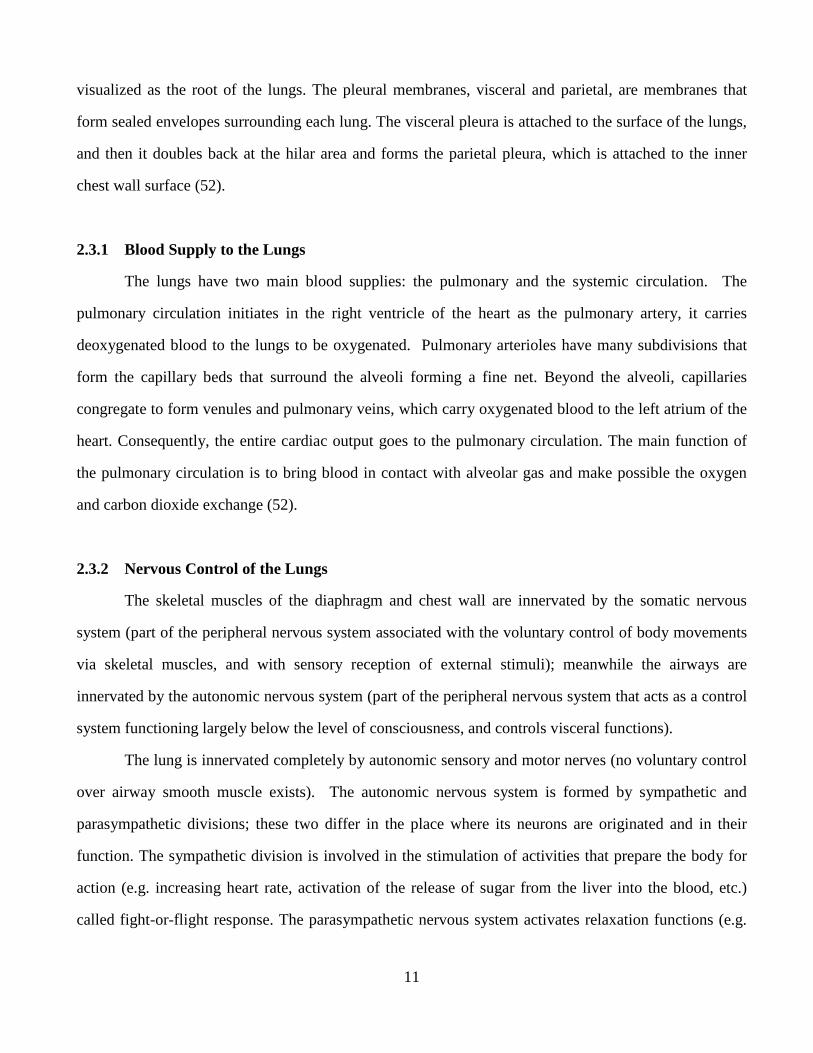
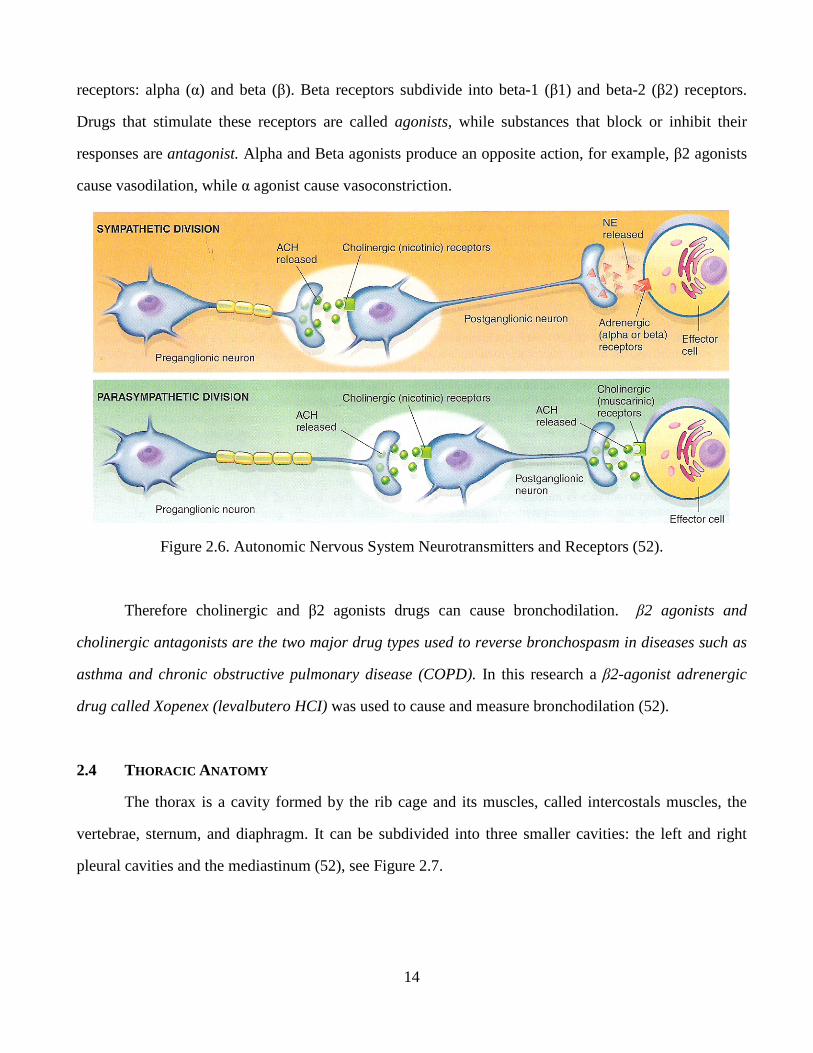
Sympathetic and parasympathetic preganglionic fibers secrete acetylcholine (ACH) at ganglionic
synapses (junctions) where they come in contact with postganglionic fibers (see figure 2.6). In these
synapses the receptors of both divisions are cholinergic, they secrete both acetylcholine, and these
receptors are called nicotinic receptors. When ACH binds with theses nicotinic receptors postganglionic
fibers spread the nerve impulse to the neuromuscular junction or effector organ. Once the impulse
reaches the neuromuscular junction the sympathetic (adrenergic) fibers secrete norepinephrine (NE) and
parasympathetic (cholinergic) fibers secrete acetylcholine again. Cholinergic receptors at the
neuromuscular junction are called muscarinic receptors, they are different from those receptors on the
ganglionic junctions; when ACH binds them they produce bronchoconstriction and increased airway
resistance. On the contrary when NE binds with adrenergic receptors on effector organ cells they
produce bronchodilation and decreased airway resistance. In summary, there are two types of
cholinergic receptors: nicotinic and muscarinic. Similarly there are two major types of adrenergic
14
receptors: alpha (α) and beta (β). Beta receptors subdivide into beta-1 (β1) and beta-2 (β2) receptors.
Drugs that stimulate these receptors are called agonists, while substances that block or inhibit their
responses are antagonist. Alpha and Beta agonists produce an opposite action, for example, β2 agonists
cause vasodilation, while α agonist cause vasoconstriction.
Figure 2.6. Autonomic Nervous System Neurotransmitters and Receptors (52).
Therefore cholinergic and β2 agonists drugs can cause bronchodilation. β2 agonists and
cholinergic antagonists are the two major drug types used to reverse bronchospasm in diseases such as
asthma and chronic obstructive pulmonary disease (COPD). In this research a β2-agonist adrenergic
drug called Xopenex (levalbutero HCI) was used to cause and measure bronchodilation (52).
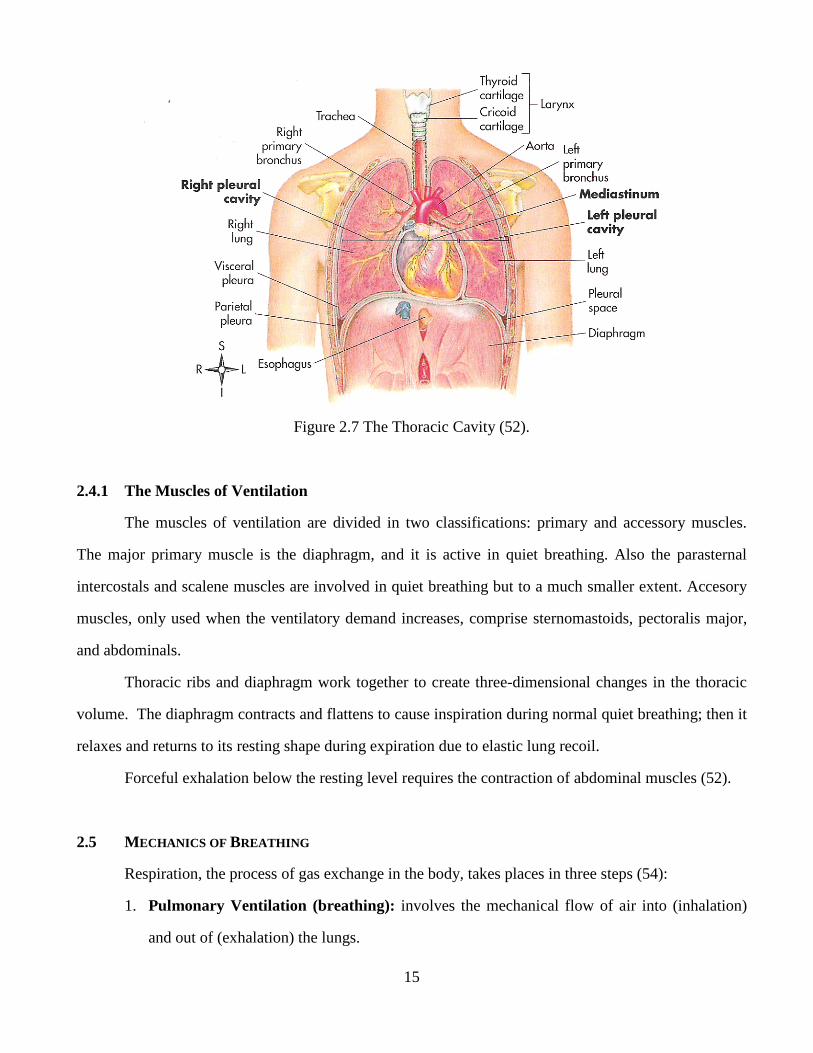
2.4 THORACIC ANATOMY
The thorax is a cavity formed by the rib cage and its muscles, called intercostals muscles, the
vertebrae, sternum, and diaphragm. It can be subdivided into three smaller cavities: the left and right
pleural cavities and the mediastinum (52), see Figure 2.7.
15
Figure 2.7 The Thoracic Cavity (52).
2.4.1 The Muscles of Ventilation
The muscles of ventilation are divided in two classifications: primary and accessory muscles.
The major primary muscle is the diaphragm, and it is active in quiet breathing. Also the parasternal
intercostals and scalene muscles are involved in quiet breathing but to a much smaller extent. Accesory
muscles, only used when the ventilatory demand increases, comprise sternomastoids, pectoralis major,
and abdominals.
Thoracic ribs and diaphragm work together to create three-dimensional changes in the thoracic
volume. The diaphragm contracts and flattens to cause inspiration during normal quiet breathing; then it
relaxes and returns to its resting shape during expiration due to elastic lung recoil.
Forceful exhalation below the resting level requires the contraction of abdominal muscles (52).
2.5 MECHANICS OF BREATHING
Respiration, the process of gas exchange in the body, takes places in three steps (54):
1. Pulmonary Ventilation (breathing): involves the mechanical flow of air into (inhalation)
and out of (exhalation) the lungs.
16
2. External Respiration: exchange of gases between the respiratory zones of the lungs and the
blood in pulmonary capillaries. Pulmonary capillaries blood loses carbon dioxide and obtains
oxygen.
3. Internal Respiration: exchange of gases between the blood and tissue cells. The blood loses
oxygen and obtains carbon dioxide. This process is also called cellular respiration.
2.5.1 Pressure Changes in Pulmonary Ventilation
Air flows from a region of a higher pressure to a region of a lower pressure; these pressure
changes inside the lungs allow the process of breathing.
Pressure changes in pulmonary ventilation occur in two phases (54):
1) Inhalation:
Inhalation (inspiration) is also called breathing in. Just before each inhalation the air pressure
inside the lungs is equal to the pressure of the atmosphere (760 mmHg = 1 atmosphere at sea
level). When the pressure inside the alveoli becomes lower than the atmospheric, air flows
into the lungs. Air continues to flow into the lungs as long as a pressure difference exists
(pressure gradient).
These pressure changes are accomplished by increasing the volume of the lungs. According
to Boyle’s law the volume of gas varies inversely with its pressure, this means that the
pressure of gas in a closed container is inversely proportional to the volume of the container.
2) Exhalation:
The process of breathing out is called exhalation (expiration). It is also possible due to a
pressure gradient, but in opposite direction than inhalation, the pressure of the lungs becomes
greater than the atmospheric pressure. Exhalation is a passive process because no muscular
contraction is involved; exhalation is possible because of elastic recoil of the chest wall and
lungs. Two forces contribute to elastic recoil: (1) the recoil of the elastic muscle fibers that
were stretched during inhalation, and (2) the surface tension due to the of alveolar fluid.
17
2.5.2 Other Factors Affecting Pulmonary Ventilation
Three factors have an effect on the rate of airflow and the ease of pulmonary ventilation (54) :
a) Surface Tension:
A thin layer of alveolar fluid coats the alveoli’s luminal surface and applies a force known as
surface tension. Surface tension occurs in all air-water interfaces because water molecules
are more attracted to each other than they are attracted to air (gas) molecules. Surface
tension causes the alveoli to assume the smallest possible diameter. During respiration
surface tension needs to be overcome enlarging the lungs during each inhalation.
b) Airway Resistance:
Friction encountered in the airways and alveoli is the major source of resistance to gas flow.
Airflow (F, in L/sec) equals the pressure difference (∆P, in cmH20) between the alveoli and
the atmosphere divided by the resistance (R, cmH2O/L/s):
F = ∆P/R [1]
Airway resistance is inversely proportional to lung volume. Larger-diameter airways have
decreased resistance. Airway resistance increases during exhalation as the bronchioles
diameter decreases. The degree of contraction or relaxation of airways smooth muscles
regulates air way diameter as well as resistance. Any condition that narrows or obstructs the
airways increases its resistance.
c) Compliance of the Lungs:
Compliance refers to the amount of effort required to stretch the lungs and chest wall and its
tendency to go back to its resting position once the stretching force is eliminated. High
compliance means easy expansion of lungs and chest walls, and low compliance means that
they offer resistance to expansion. Compliance is also known as elastic recoil of the lungs.
For the purpose of this research the compliance measured with the Impulse Oscillometry
System (IOS) is related to the volume increment caused by the IOS. An increment in volume
is caused by the pressure impulses applied to the to the subjects mouth by the IOS. This
volume is 16 ml/impulse. After accounting for resistive pressure loss, the volume increment
18
divided by the mouth pressure pulse is compliance to be estimated by the IOS data and model
analysis (55).
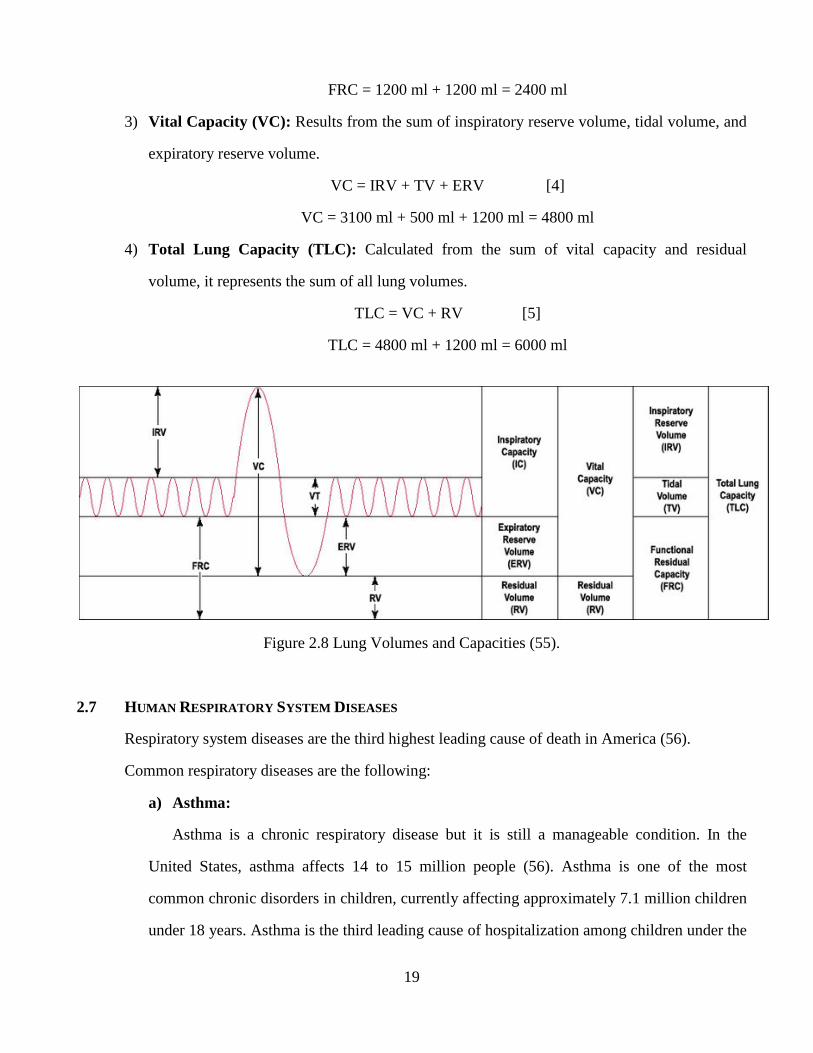
2.6 LUNG VOLUMES AND CAPACITIES
Lung volumes and capacities refer to the volume of air associated with different phases of the
respiratory cycle. Lung volumes are directly measured and lung capacities are calculated from lung
volumes. The average total lung capacity of an adult is about 6 liters (6000 ml) of air, even though only
a small amount of this capacity is used during normal breathing.
The Lung volumes are defined as follows (54):
1) Tidal Volume (TV): It is the volume of one breath and it is approximately 500 ml in an
adult.
2) Inspiratory Reserve Volume (IRV): It represents the additional inhaled air that can be
inspired after tidal volume, it is about 3100 ml.
3) Expiratory Reserve Volume (ERV): It is the additional exhaled air after a tidal volume, it is
about 1200 ml.
4) Residual Volume (RV): It involves the remaining air after the exhalation of the expiratory
reserve volume; this helps to maintain the alveoli always slightly inflated and it amounts to
about 1200 ml.
There are four lung capacities, which are combinations of specific lung volumes [50]:
1) Inspiratory Capacity (IC): It represents the sum of tidal volume and inspiratory reserve
volume.
IC = TV + IRV [2]
IC = 500 ml + 3100 ml = 3600 ml
2) Functional Residual Capacity (FRC): It is the sum of the residual volume and expiratory
reserve volume.
FRC = RV + ERV [3]
19
FRC = 1200 ml + 1200 ml = 2400 ml
3) Vital Capacity (VC): Results from the sum of inspiratory reserve volume, tidal volume, and
expiratory reserve volume.
VC = IRV + TV + ERV [4]
VC = 3100 ml + 500 ml + 1200 ml = 4800 ml
4) Total Lung Capacity (TLC): Calculated from the sum of vital capacity and residual
volume, it represents the sum of all lung volumes.
TLC = VC + RV [5]
TLC = 4800 ml + 1200 ml = 6000 ml
Figure 2.8 Lung Volumes and Capacities (55).
2.7 HUMAN RESPIRATORY SYSTEM DISEASES
Respiratory system diseases are the third highest leading cause of death in America (56).
Common respiratory diseases are the following:
a) Asthma:
Asthma is a chronic respiratory disease but it is still a manageable condition. In the
United States, asthma affects 14 to 15 million people (56). Asthma is one of the most
common chronic disorders in children, currently affecting approximately 7.1 million children
under 18 years. Asthma is the third leading cause of hospitalization among children under the
20
age of 15. Asthma is the third leading cause of school absenteeism; in 2008, asthma caused
an estimated 14.4 million lost school days in children with an asthma attack (57).
Asthma is a disorder characterized by chronic airway inflammation, airway
hypersensitivity to a variety of stimuli, and airway obstruction that is at least partially
reversible. Asthma is more common in children than in adults. Symptoms include difficult
breathing, coughing, wheezing, chest tightness, tachycardia, fatigue, moist skin, and anxiety
(54).
Inflammation of the airways lining is the most common characteristic of asthma. Certain
cells lining the airways, when stimulated release chemical substances that lead to
inflammation; this causes the lining of the airways to swell and narrow. The inflammation
can last a long time, even for weeks. Most people with asthma have always some degree of
inflammation all of the time. With airways inflammation, increased sensitivity of the airways
occurs and the airways become more irritable. Airway obstruction is caused by tightening of
the muscles surrounding them; this condition is called bronchospasm and it causes further
narrowing of the inflamed airways. In some patients with asthma, the airways mucus glands
produce excessive, thick mucus, which also cause airway obstruction (56).
There are different types of medicines used to treat asthma, they include:
1. Long-term control medications: In most cases, these medications need to be
taken every day. They are four different types (58):
• Inhaled corticosteroids are the most commonly prescribed type of long-term
asthma medication. Long-term use of these medications has been related with
slightly slowed growth in children, but the effect is minor.
• Leukotriene modifiers are oral medications that avoid asthma symptoms for up
to 24 hours. In rare cases, these medications have been associated to
psychological reactions, such as agitation, aggression, hallucinations, depression
and suicidal thinking.
21
• Combination inhalers contain an inhaled corticosteroid in addition to a long-
acting beta agonist (LABA). In some situations, long-acting beta agonists have
been linked to severe asthma attacks. For this reason LABA medications should
always be given to a patient with an inhaler that also contains a corticosteroid.
• Theophylline is a daily pill that helps keep the airways open, it relaxes the
airways muscles.
2. Quick-relief medications: Also called rescue medications, they include (58):
• Short acting- beta agonists are inhaled bronchodilator medications that can very
quickly ease the symptoms during an asthma attack. As stated before the
medicine Xopenex (levalbuterol), used in this research, belongs to this
classification of medicines. Its effects last several hours.
• Ipratropium (Atrovent) is sometimes prescribed to treat an asthma attack
because it causes an immediate relief of symptoms.
• Oral and intravenous corticosteroids relieve airway inflammation caused by
severe asthma. They can possibly cause serious side effects when they are used
for long periods of time.
b) Small Airways Diseases (SAD) or Small Airways Impairments (SAI):
The term small airways refer to about 7th to 19th generation of airways with an inner
diameter of about 2 to 0.5 mm. These airways are considered to be an important site of
inflammation in asthma and chronic obstructive pulmonary disease. The atopic manifestation
just prior to asthma could be early SAD and then if inflammation persists, asthma would
appear (53).
Small airways disease includes a spectrum of inflammatory and fibrotic pulmonary
diseases centered on the small conducting airways (59). Small airways inflammation with
structural remodeling may be responsible for recurrent attacks in bronchial asthma. SAD
always presents inflammation of small bronchi and bronchioles with minimal emphysema
22
(destruction of alveolar walls). Exposure to tobacco smoke, air bone pollutants, mineral
dusts, and viral respiratory infections may result in SAD (60).
c) Chronic Obstructive Respiratory Disease (COPD):
COPD is a respiratory disorder characterized by chronic and recurrent airflow
obstruction, which increases airway resistance (54). COPD is a leading cause of death and
illness worldwide. Most COPD is caused by long-term smoking (61). The main types of
COPD are emphysema and chronic bronchitis (54):
1. Emphysema: Is a disorder where the walls of the alveoli are destroyed, producing
abnormally large air spaces that remain filled with air during exhalation. Oxygen
diffusion across the damaged respiratory membrane is reduced due to the narrowed
surface area for gas exchange. Blood oxygen level is to some extent lowered. As the
number of damaged alveolar walls increases, lung elastic recoil decreases due to loss
of elastic fibers, and an increasing amount of air is trapped in the lungs at the end of
expiration. Treatment consists of cessation of smoking and removing other
environmental irritants, breathing exercises, use of bronchodilators, and oxygen
therapy.
2. Chronic Bronchitis: Is an illness characterized by excessive secretion of bronchial
mucus and accompanied by a productive cough that lasts for at least three months of
the year for two successive years. Other symptoms are shortness of breath, wheezing,
cyanosis, and pulmonary hypertension. Treatment is similar to emphysema treatment.
d) Lung Cancer:
Lung cancer is the second most diagnosed cancer in men and women, and it is the
number one cause of death from cancer each year in both men and women (62). Most people
with lung cancer die within a year after diagnosis. Cigarette smoke is the most common
cause of lung cancer. Other causes are ionizing radiation and inhaled irritants (like asbestos
and radon gas). Emphysema normally is a precursor of lung cancer. The most common type
23
of lung cancer is bronchogenic carcinoma which begins in the epithelium of the bronchial
tubes. The tumors begin as epithelial lesions that grow to form bigger masses that obstruct
the bronchial tubes or invade adjacent lung tissue. Symptoms are related to the location of the
tumor. Treatment consists of partial or complete surgical removal of a diseased lung,
radiation therapy, and chemotherapy (54).
e) Pneumonia:
It is an acute infection or inflammation of the alveoli. It is the most common infectious
cause of death in the United States (54). Pneumonia is caused by bacteria, a virus or fungi;
its symptoms can vary from mild to severe (63). The most common cause of pneumonia is
the pneumococcal bacterium Streptococcus pneumonia. Elderly, infants and
immunocompromised individuals, cigarette smokers and individuals with obstructive lung
disease are the most susceptible to pneumonia. Symptoms are fever, chills, productive or dry
cough, malaise (feeling of discomfort or illness), chest pain, and in some cases dyspnea
(difficult breathing) and hemoptysis (spitting blood). Treatment may involve antibiotics,
bronchodilators, oxygen therapy, increased fluid intake, and chest physiotherapy (percussion,
vibration and postural drainage) (54).
f) Tuberculosis:
It is caused by the bacterium Mycobacterium tuberculosis producing an infectious
contagious disease; it mainly affects the lungs and the pleurae but can affect other body parts.
The bacterium can remain dormant for life, but an impaired immune system can enable the
bacterium become active (54). In the recent years there have been advances in its treatment,
but tuberculosis still remains a major cause of illness and death worldwide, especially in
Africa and Asia. Tuberculosis is the cause of death of 2 million people every year (64).
Symptoms that do not develop until disease is advanced are: fatigue, weight loss, lethargy,
anorexia, a low fever, night sweats, cough, dyspnea, chest pain and hemoptysis (54).
Treatments for tuberculosis take longer than treating other types of bacterial infections;
antibiotics for this illness have to be taken for at least six to nine months. The prescribed
24
drugs and length of treatment depend on age, overall health, drug resistance, form of
tuberculosis (active or latent) and its location (64).
g) Coryza and Influenza
Coryza or common cold is an upper respiratory tract viral infection (65). It can be caused
by hundreds of viruses. Symptoms include sneezing, excessive nasal secretion, dry cough,
and congestion. The simple cold does not include fever. Complications comprise sinusitis,
asthma, bronchitis, ear infections and laryngitis. Preschool children are at greatest risk of
recurrent colds, but even healthy adults can expect to have few colds each year. It has been
suggested in recent investigations a relation between level of stress and frequent colds.
Treatments include pain relievers, decongestant nasal sprays and cough syrups (54).
Influenza is also a viral infection; its symptoms consist of chills, high fever, headache and
muscular aches and cold like symptoms (54). Influenza can be deadly, approximately tens of
thousands of people in the United States die each year of complications of influenza.
Complications include pneumonia, bronchitis, sinus infection and ear infections. Frequently
the only treatments are bed rest and plenty of fluids, but sometimes an antiviral medication
needs to be prescribed (66).
h) Pulmonary Edema
Is an abnormal accumulation of fluid in the interstitial spaces and alveoli of the lungs
(54). Heart problems are the main cause of pulmonary edema, but fluid accumulation can
happen for other reasons like pneumonia, exposure to certain toxins and medications and
exercising or living at high elevations (67). The most recurrent symptom is dyspnea. Other
symptoms include: wheezing, tachypnea (rapid breathing rate), restlessness, a feeling of
suffocation, cyanosis, paleness and diaphoresis (excessive perspiration). Treatments are:
oxygen administration, drugs that dilate the bronchioles and lower blood pressure, diuretics
and drugs that correct acid-base imbalance, suctioning of airways and mechanical ventilation
(54).
25
i) Cystic Fibrosis (CF)
Is an inherited disease of secretory epithelia that affects the airways, liver, pancreas,
small intestine and sweat glands. Its cause is a genetic mutation (54). CF affects the cells
that produce mucus, sweat and digestive juices. Usually these secretions are thin and
slippery, but in CF, the secretions are thick and sticky. Instead of acting as lubricant, the
secretions plug up tubes, ducts and passageways, mainly in the pancreas and lungs. CF is
most common in white people of northern European ancestry. One of the first symptoms is
an excessively salty taste to the skin; other symptoms include: persistent cough, wheezing,
repeated lung infections, repeated sinus infections, foul-smelling, greasy stools, poor weight
gain and growth, distended abdomen from constipation and intestine blockage. There is no
cure for CF, but some medications like antibiotics, mucus-thining drugs and bronchodilators,
can improve symptoms and reduce complications. Some mechanical devices to help loosen
lung mucus are used (chest clapper, inflatable vest and breathing devices). Other treatments
include feeding tubes, lung transplant and bowel surgery (68).
26
Chapter 3: Pulmonary Function Tests and Previous Studies
3.1 INTRODUCTION
Pulmonary Function refers to how the lungs perform gas exchange. Pulmonary function testing
is a practical application of Respiratory Physiology and is necessary for understanding abnormalities in
lung function and the effects of treatments. Pulmonary function tests help to determine the severity of
functional impairments or defects and the extent to which treatment restores a normal function (52). In
this chapter we focus on the review of two important pulmonary function tests: Spirometry and Impulse
Oscillometry using the Impulse Oscillation System (IOS); and a literature review of several studies that
have been performed in the previous years to compare several Pulmonary Function Tests (PFTs) to
assess the ability of Forced Oscillation Technique (FOT) and IOS to measure pulmonary function and to
discriminate between impaired and non-impaired lung function.
3.2 SPIROMETRY
Spirometry is the most common pulmonary system test; it is a measurement of maximal airflow
after deep breath to fill up the lungs. It can provide information about the size of the breathing tubes
(mainly large airways) and about the presence of blockages to airflow (69). The measurements usually
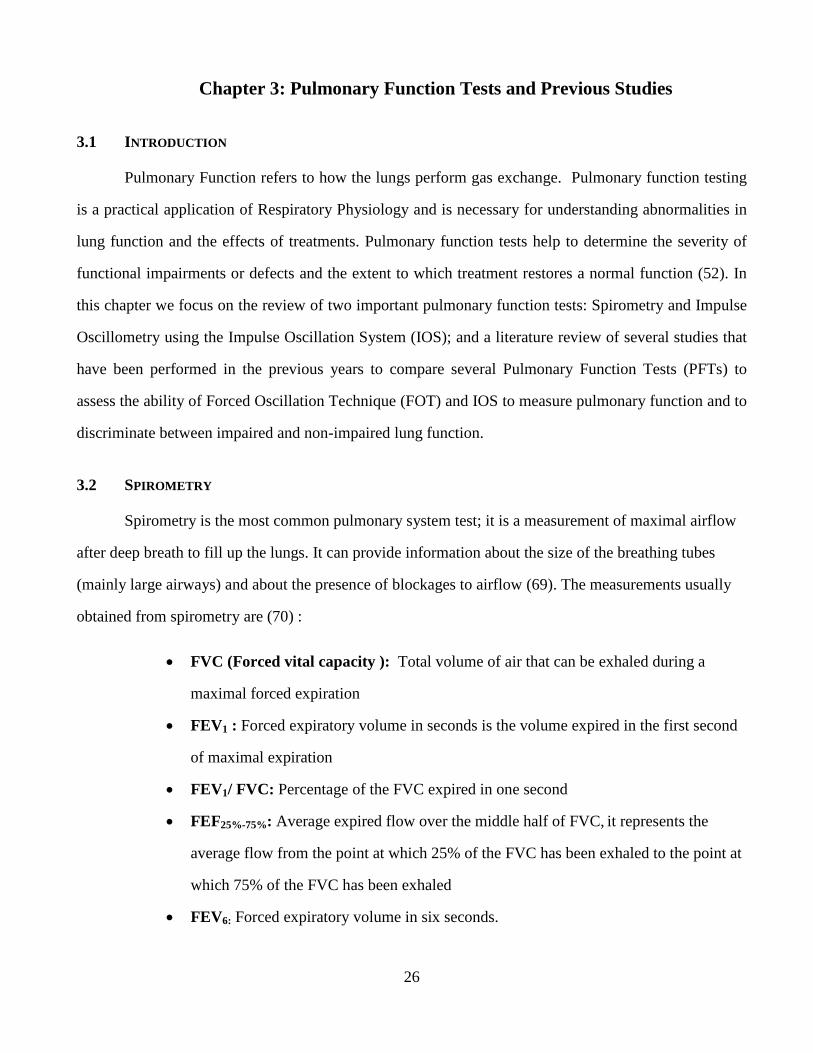
obtained from spirometry are (70) :
• FVC (Forced vital capacity ): Total volume of air that can be exhaled during a
maximal forced expiration
• FEV1 : Forced expiratory volume in seconds is the volume expired in the first second
of maximal expiration
• FEV1/ FVC: Percentage of the FVC expired in one second
• FEF25%-75%: Average expired flow over the middle half of FVC, it represents the
average flow from the point at which 25% of the FVC has been exhaled to the point at
which 75% of the FVC has been exhaled
• FEV6: Forced expiratory volume in six seconds.
• PEF : Peak expiratory flow
Fig
Spirometry parameters are shown
The National Asthma Education and Preven
considered FEV1 as the “gold standard
suggested that most children have normal or near normal FEV
the NAEPP has added FEV1/ FVC
control. The most important pulmonary function abnormalities seen in asthmatic children are decreases
in the FEV1/ FVC and the FEF25%
severity (71).
3.3 FORCED OSCILLATION TECHNIQUE
The fundamental principle of Forced Oscillation Technique (FOT) is that respiratory mechanics
can be measured from superimposition of external pressure oscillations
resting breathing (72). Therefore,
breathing of a subject to determine its breathing mechanics. FOT measures respiratory impedance to this
applied forced pressure oscillations produced by a loud speaker
diagnostic tool to obtain tidal breathing analysis
pulmonary systems tests is that the
therefore it is effort independent;
27
eak expiratory flow represents the maximal expiratory flow rate achieved
Figure 3.1 Spirometry parameters (70).
metry parameters are shown in Figure 3.1.
National Asthma Education and Prevention Program (NAEPP) Guidelines
gold standard” to assess asthma severity and control, but
suggested that most children have normal or near normal FEV1 even when they are symptomatic. N
/ FVC ratio as an impairment criterion to classify asthma severity and
The most important pulmonary function abnormalities seen in asthmatic children are decreases
25%-75%, while FEV1 remain in the normal range in spite of asthma
SCILLATION TECHNIQUE AND IMPULSE OSCILLOMETRY SYSTEM
The fundamental principle of Forced Oscillation Technique (FOT) is that respiratory mechanics
can be measured from superimposition of external pressure oscillations on the respiratory system during
FOT superimposes small external pressure signals on the natural
breathing of a subject to determine its breathing mechanics. FOT measures respiratory impedance to this
applied forced pressure oscillations produced by a loud speaker (73). FOT is indicated as a
tidal breathing analysis. One of the great advantages of FOT over other
the results measured are independent of the subject respiratory pattern,
; it requires only passive cooperation from the subject breathing
maximal expiratory flow rate achieved
tion Program (NAEPP) Guidelines previously
but several studies have
even when they are symptomatic. Now
impairment criterion to classify asthma severity and
The most important pulmonary function abnormalities seen in asthmatic children are decreases
remain in the normal range in spite of asthma
YSTEM (IOS)
The fundamental principle of Forced Oscillation Technique (FOT) is that respiratory mechanics
on the respiratory system during
FOT superimposes small external pressure signals on the natural
breathing of a subject to determine its breathing mechanics. FOT measures respiratory impedance to this
FOT is indicated as a reliable
. One of the great advantages of FOT over other
results measured are independent of the subject respiratory pattern,
it requires only passive cooperation from the subject breathing
28
normally through a mouth piece, keeping lips airtight closed around it, wearing a nose clips occluding
the nares (74).
FOT has been used in humans for more than 50 years; it has been used in children with three
major clinical aims (75):
1. To characterize the lung function abnormalities of chronic respiratory diseases in
children.
2. As a diagnostic tool, especially to recognize asthma and bronchial responsiveness.
3. To study the physiological mechanisms and pathophysiology of diverse situations
involving and/or threatening the respiratory system.
FOT applied at oscillation frequencies between 3 and 35 Hz can provide helpful information to
help distinguish between large and small airways. The use of a multiple oscillation frequencies in FOT
allows a separation of large airways from small airways. Frequencies below 15 Hz, low oscillation
frequencies, have been shown to be transmitted more distally in the lungs, whilst frequencies higher than
20 Hz, high oscillation frequencies, can reach only the intermediate size airways. As a result low
oscillation frequencies reflect small and large airways, while high oscillation frequencies merely reflect
large airways. Therefore changes in large airway resistance cause uniform changes in resistance at all
oscillation frequencies (3-35 Hz), whereas changes in small airway resistance result in noticeable
changes in low frequency (3-15 Hz) resistance with small or no change in high frequency resistance.
Peripheral airways include all airways with a diameter less than 2mm, and large airways are those with
diameters greater than 4 mm (72).
One of the most remarkable features of FOT in relation to spirometry is that it has a relatively
greater sensitivity to peripheral airways disease; due to the fact that spirometry does not provide a clear
indication of peripheral airway obstruction regardless of the information contained in the flow-volume
curve and the values of mid-flow rates (FEF25%-75%) (74).
29
3.3.1 Impulse Oscillation Technique
In 1956 Dubois presented the first study about FOT; in this study FOT was applied using
sinusoidal oscillations with multiple single frequencies between 2 and 18 cycles per second. After this
study several modifications of FOT were developed, until 1993 when the pulse technique was improved
and commercially produced by the German company Jaeger. It was named Impulse Oscillometry
System (IOS), as an easier to use method to measure respiratory resistance (R) and reactance (X). The
advantages of IOS include good time resolution, it measures 5 pulses per second, and continuous
resolution in the frequency domain using a Fourier Integral (71) (72). The IOS, as FOT, superimposes
small air pressure perturbations on the natural breathing of a subject to measure the impedance of the
respiratory system, offering an easy to use method because it does not require any effort from the subject
being tested. An additional advantage is the simplicity of the hardware needed to generate the forced
oscillations, allowing smaller, more efficient electronic and mechanical structures with minimal power
loss (74).
Some disadvantages of the IOS have to be recognized. The fact that IOS measures spontaneous
breathing from a subject allows biological variability, and to counteract this fact multiple tests are
required to be performed in a subject in order to establish reliable mean values of IOS parameters. A
special aspect of applying pulses of pressure is that they are applied within a very short time causing a
higher impact on the respiratory system compared with other lung function tests, and this may be
perceived as an unpleasant sensation during the measurements (74).
3.3.2 IOS Aperiodic Waveforms
The IOS produces aperiodic waveforms through an impulse generator that applies pulses of
limited magnitude with 30-40 ms duration. The feature of an aperiodic waveform is the continuous
spectrum after its time transformation into the frequency domain, using Fourier integral and its efficient
implementation using in the Fast Fourier Transform (FFT). A continuous spectrum is especially
important in impaired respiratory systems with regional nonhomogenieties (see Figure 3.2) where
resistance, reactance and coherence spectra may manifest deviations from its normally smooth and
uniform continuous spectra.
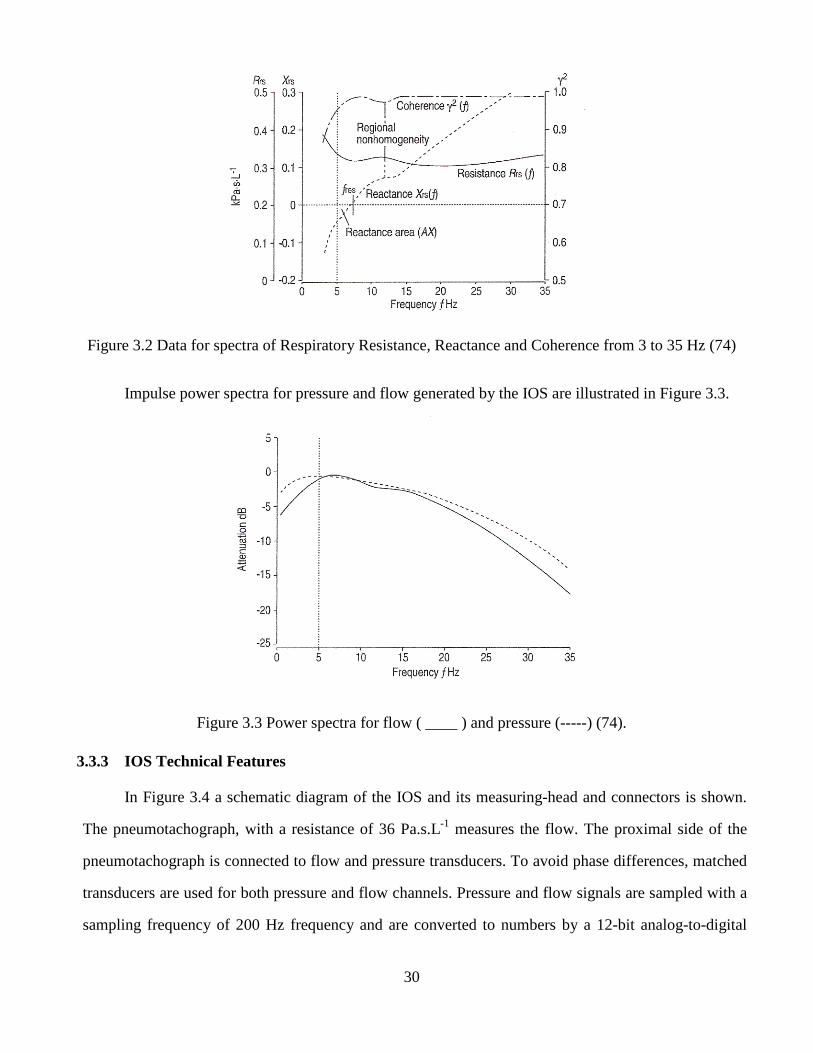
30
Figure 3.2 Data for spectra of Respiratory Resistance, Reactance and Coherence from 3 to 35 Hz (74)
Impulse power spectra for pressure and flow generated by the IOS are illustrated in Figure 3.3.
Figure 3.3 Power spectra for flow ( ____ ) and pressure (-----) (74).
3.3.3 IOS Technical Features
In Figure 3.4 a schematic diagram of the IOS and its measuring-head and connectors is shown.
The pneumotachograph, with a resistance of 36 Pa.s.L-1 measures the flow. The proximal side of the
pneumotachograph is connected to flow and pressure transducers. To avoid phase differences, matched
transducers are used for both pressure and flow channels. Pressure and flow signals are sampled with a
sampling frequency of 200 Hz frequency and are converted to numbers by a 12-bit analog-to-digital
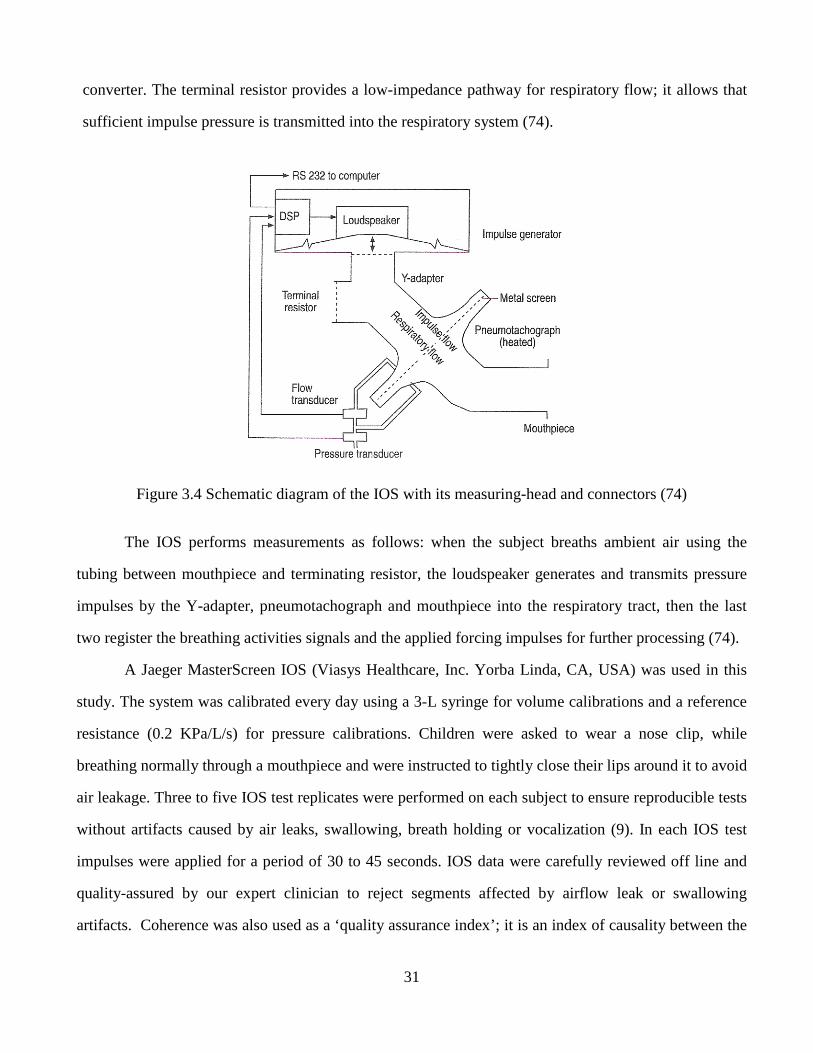
31
converter. The terminal resistor provides a low-impedance pathway for respiratory flow; it allows that
sufficient impulse pressure is transmitted into the respiratory system (74).
Figure 3.4 Schematic diagram of the IOS with its measuring-head and connectors (74)
The IOS performs measurements as follows: when the subject breaths ambient air using the
tubing between mouthpiece and terminating resistor, the loudspeaker generates and transmits pressure
impulses by the Y-adapter, pneumotachograph and mouthpiece into the respiratory tract, then the last
two register the breathing activities signals and the applied forcing impulses for further processing (74).
A Jaeger MasterScreen IOS (Viasys Healthcare, Inc. Yorba Linda, CA, USA) was used in this
study. The system was calibrated every day using a 3-L syringe for volume calibrations and a reference
resistance (0.2 KPa/L/s) for pressure calibrations. Children were asked to wear a nose clip, while
breathing normally through a mouthpiece and were instructed to tightly close their lips around it to avoid
air leakage. Three to five IOS test replicates were performed on each subject to ensure reproducible tests
without artifacts caused by air leaks, swallowing, breath holding or vocalization (9). In each IOS test
impulses were applied for a period of 30 to 45 seconds. IOS data were carefully reviewed off line and
quality-assured by our expert clinician to reject segments affected by airflow leak or swallowing
artifacts. Coherence was also used as a ‘quality assurance index’; it is an index of causality between the
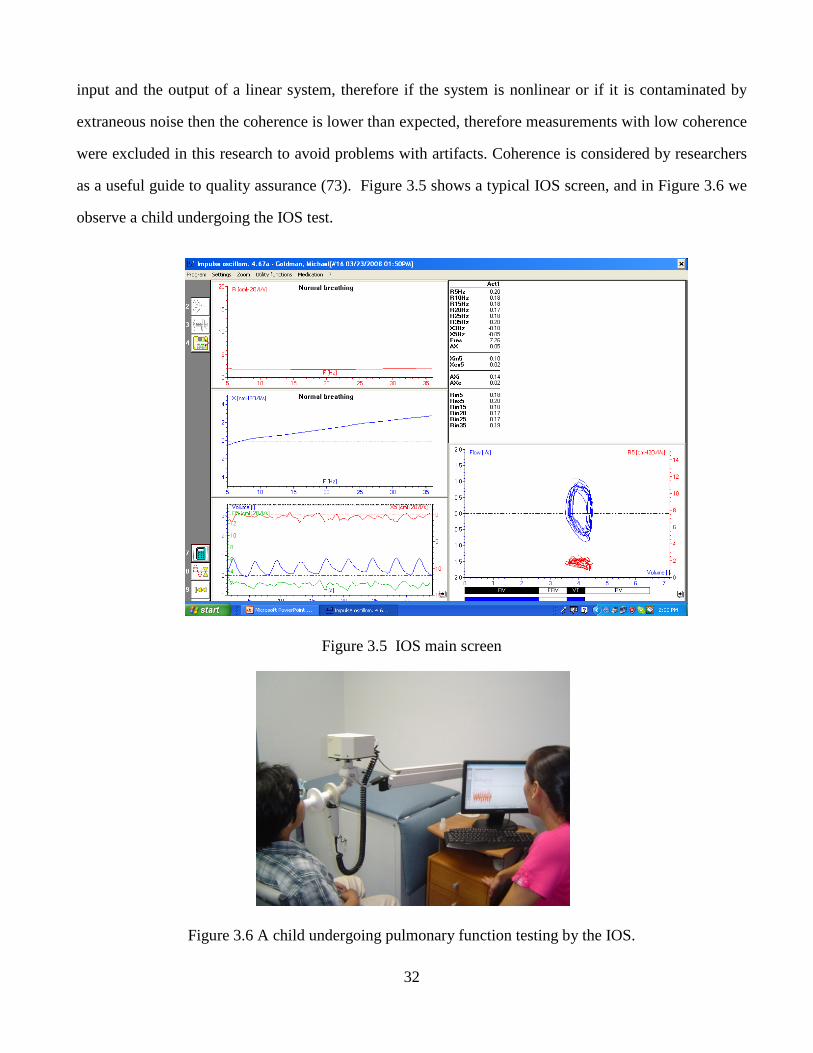
32
input and the output of a linear system, therefore if the system is nonlinear or if it is contaminated by
extraneous noise then the coherence is lower than expected, therefore measurements with low coherence
were excluded in this research to avoid problems with artifacts. Coherence is considered by researchers
as a useful guide to quality assurance (73). Figure 3.5 shows a typical IOS screen, and in Figure 3.6 we
observe a child undergoing the IOS test.
Figure 3.5 IOS main screen
Figure 3.6 A child undergoing pulmonary function testing by the IOS.
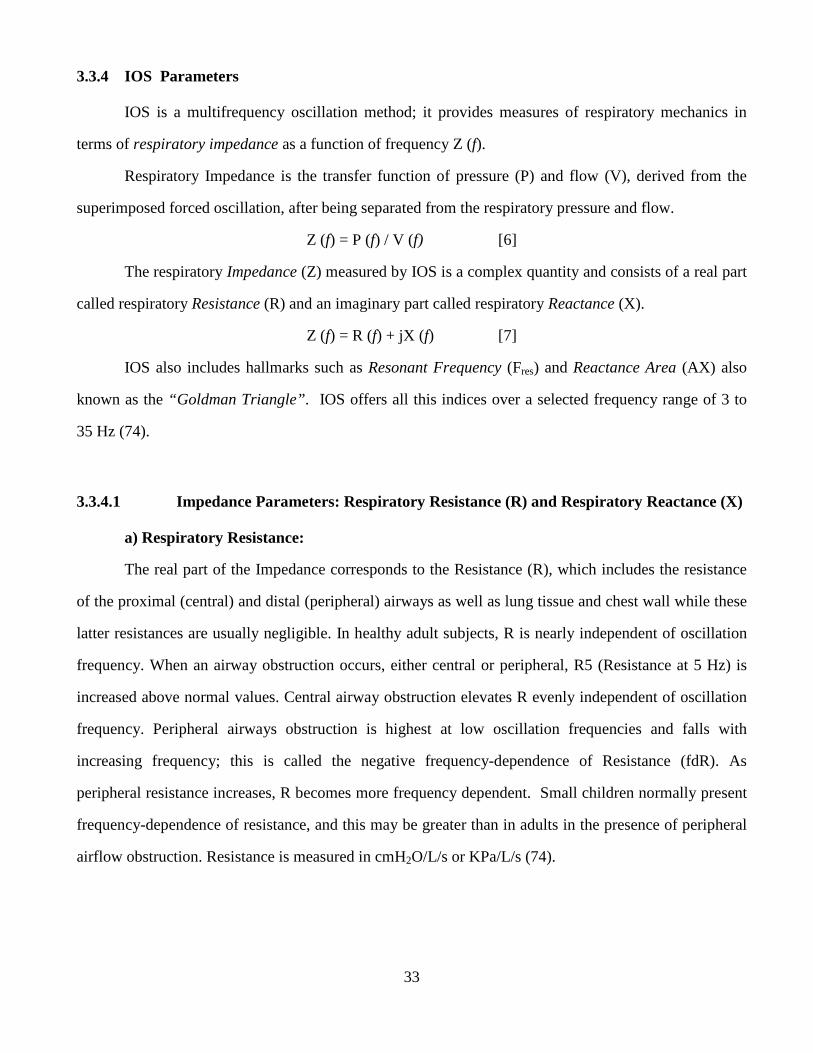
33
3.3.4 IOS Parameters
IOS is a multifrequency oscillation method; it provides measures of respiratory mechanics in
terms of respiratory impedance as a function of frequency Z (f).
Respiratory Impedance is the transfer function of pressure (P) and flow (V), derived from the
superimposed forced oscillation, after being separated from the respiratory pressure and flow.
Z (f) = P (f) / V (f) [6]
The respiratory Impedance (Z) measured by IOS is a complex quantity and consists of a real part
called respiratory Resistance (R) and an imaginary part called respiratory Reactance (X).
Z (f) = R (f) + jX (f) [7]
IOS also includes hallmarks such as Resonant Frequency (Fres) and Reactance Area (AX) also
known as the “Goldman Triangle”. IOS offers all this indices over a selected frequency range of 3 to
35 Hz (74).
3.3.4.1 Impedance Parameters: Respiratory Resistance (R) and Respiratory Reactance (X)
a) Respiratory Resistance:
The real part of the Impedance corresponds to the Resistance (R), which includes the resistance
of the proximal (central) and distal (peripheral) airways as well as lung tissue and chest wall while these
latter resistances are usually negligible. In healthy adult subjects, R is nearly independent of oscillation
frequency. When an airway obstruction occurs, either central or peripheral, R5 (Resistance at 5 Hz) is
increased above normal values. Central airway obstruction elevates R evenly independent of oscillation
frequency. Peripheral airways obstruction is highest at low oscillation frequencies and falls with
increasing frequency; this is called the negative frequency-dependence of Resistance (fdR). As
peripheral resistance increases, R becomes more frequency dependent. Small children normally present
frequency-dependence of resistance, and this may be greater than in adults in the presence of peripheral
airflow obstruction. Resistance is measured in cmH2O/L/s or KPa/L/s (74).
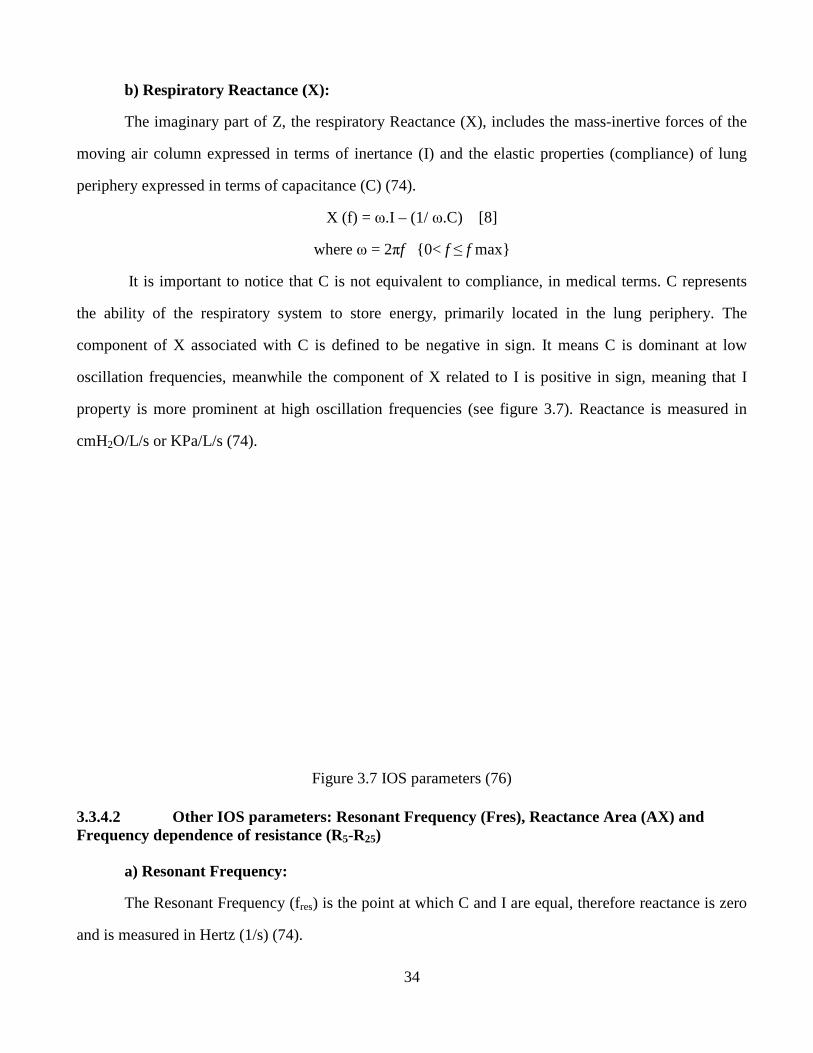
b) Respiratory Reactance (X)
The imaginary part of Z, the
moving air column expressed in terms of inertance (I) and the elastic properties (compliance) of lung
periphery expressed in terms of capacitance (C)
It is important to notice that C
the ability of the respiratory system to store energy, primar
component of X associated with C
oscillation frequencies, meanwhile the component of X related to I is positive in sign,
property is more prominent at high oscillation frequencie
cmH2O/L/s or KPa/L/s (74).
3.3.4.2 Other IOS parameters: Frequency dependence of resistance (R
a) Resonant Frequency:
The Resonant Frequency (fres
and is measured in Hertz (1/s) (74).
34
Reactance (X):
the respiratory Reactance (X), includes the mass-
moving air column expressed in terms of inertance (I) and the elastic properties (compliance) of lung
periphery expressed in terms of capacitance (C) (74).
X (f) = ω.I – (1/ ω.C) [8]
where ω = 2πf {0< f ≤ f max}
t is important to notice that C is not equivalent to compliance, in medical terms
the ability of the respiratory system to store energy, primaril y located in the lung periphery.
omponent of X associated with C is defined to be negative in sign. It means C
oscillation frequencies, meanwhile the component of X related to I is positive in sign,
at high oscillation frequencies (see figure 3.7). Reactance is
Figure 3.7 IOS parameters (76)
parameters: Resonant Frequency (Fres), Reactance Area (AX)Frequency dependence of resistance (R5-R25)
res) is the point at which C and I are equal, therefore
-inertive forces of the
moving air column expressed in terms of inertance (I) and the elastic properties (compliance) of lung
, in medical terms. C represents
y located in the lung periphery. The
t means C is dominant at low
oscillation frequencies, meanwhile the component of X related to I is positive in sign, meaning that I
Reactance is measured in
Area (AX) and
and I are equal, therefore reactance is zero
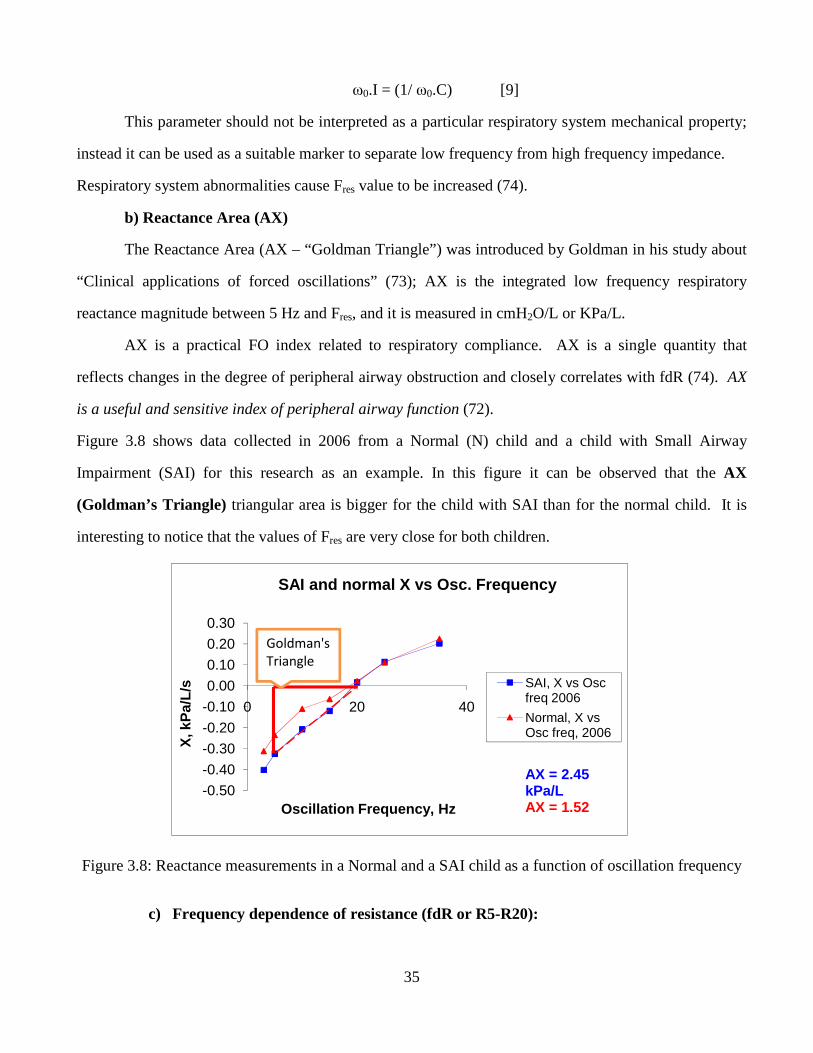
35
ω0.I = (1/ ω0.C) [9]
This parameter should not be interpreted as a particular respiratory system mechanical property;
instead it can be used as a suitable marker to separate low frequency from high frequency impedance.
Respiratory system abnormalities cause Fres value to be increased (74).
b) Reactance Area (AX)
The Reactance Area (AX – “Goldman Triangle”) was introduced by Goldman in his study about
“Clinical applications of forced oscillations” (73); AX is the integrated low frequency respiratory
reactance magnitude between 5 Hz and Fres, and it is measured in cmH2O/L or KPa/L.
AX is a practical FO index related to respiratory compliance. AX is a single quantity that
reflects changes in the degree of peripheral airway obstruction and closely correlates with fdR (74). AX
is a useful and sensitive index of peripheral airway function (72).
Figure 3.8 shows data collected in 2006 from a Normal (N) child and a child with Small Airway
Impairment (SAI) for this research as an example. In this figure it can be observed that the AX
(Goldman’s Triangle) triangular area is bigger for the child with SAI than for the normal child. It is
interesting to notice that the values of Fres are very close for both children.
Figure 3.8: Reactance measurements in a Normal and a SAI child as a function of oscillation frequency
c) Frequency dependence of resistance (fdR or R5-R20):
-0.50
-0.40
-0.30
-0.20
-0.10
0.00
0.10
0.20
0.30
0 20 40
X, k
Pa/
L/s
Oscillation Frequency, Hz
SAI and normal X vs Osc. Frequency
SAI, X vs Osc freq 2006
Normal, X vs Osc freq, 2006
AX = 2.45 kPa/LAX = 1.52
Goldman's
Triangle
36
It is simply the subtraction of the measured resistance at 20 Hz and the resistance at 5 Hz or 3
Hz. Frequency dependence of resistance is a characteristic for peripheral airway dysfunction (72).
R5–R20 = R5 – R20 [10]
Changes in AX with treatment interventions parallel changes in frequency dependence of R. It
has been suggested by Goldman et al. (72) that the magnitudes of frequency dependence of R and AX
appear to reflect a similarly predominant influence of peripheral airway mechanical function.
Frequency dependence of resistance occurs in healthy children, and to a better extent in children
with respiratory system distresses (73). There is now plenty of evidence that peripheral airway
inflammation is present in asthma patients, and frequency dependence of resistance occurs significantly
in asthma (74).
3.4 BRONCHODILATION PHENOTYPE
The bronchodilation response as a physiological response to short-acting beta agonist has been
recommended to demonstrate reversibility of airflow obstruction consistent with the definition of asthma
(71).
Bronchoconstriction is defined as increased tone of airway smooth muscles due to inflammation;
and Bronchodilation is defined as decrease in smooth muscle tone, and as a result a decrease in
inflammation. When an increase of airways smooth muscle tone happens R also increases, due to a
correspondent decrease in airway lumen. R increases due to inflammation or edema. In asthmatics, high
and low frequency R decreases after bronchodilation, showing a larger decrease in low-frequency R and
a resultant decrease in frequency dependence of resistance. In addition FOT has been reported to
demonstrate larger sensitivity to inhaled corticosteroid or to β-agonist inhalation than spirometry (74).
According to a recently developed document on Pulmonary Function Testing in Preschool
Children (2007), FOT has been successfully performed in different settings, and a number of studies
have demonstrated that FOT was capable of identifying airway obstruction and reactions to
bronchodilators and broncho-constrictors (77). Several studies have been developed to assess
bronchodilator responses using FOT. Marotta et al. (7) performed a study in 4-year old children
concluding that IOS bronchodilator responses are remarkably abnormal in this population (children
37
presented a significant bronchodilator response), and that IOS is a useful diagnostic tool in detection of
early asthma development. Oostveen et al. (78) performed a comprehensive review on methodology,
recommendations and future developments of FOT in clinical practice stating that FOT is a reliable
method to assess bronchial hyper-responsiveness in adults and children. Ortiz et al. (8) performed an
IOS study in children 2 to 5 years old in El Paso, Texas, finding that IOS is an acceptable method of
assessing airway responses to bronchoactive drugs in this age group. In a more recent study related to
the use of FOT to detect bronchodilation in children, Bar-Yishay et al. (79) concluded that FOT could
reliably measure response to bronchodilator therapy. Recently Song et al (13) researched the utility of
impulse oscillometry in young children with asthma finding that asthmatic children differed from
control subjects in IOS-assessed bronchodilator response and that there were some significant
correlations between bronchodilator responses of spirometric and IOS parameters. Galant et al. (71)
stated that bronchodilator response (BDR) would appear to give important additional information about
airway inflammation and found that IOS is a promising test to identify asthmatic preschoolers.
All this evidence confirms that lung function in children and adolescents is sensitively and
accurately assessed by IOS, before and after bronchodilation. Nevertheless few longitudinal Forced
Oscillation (FO) data exist in healthy subjects or in those with airflow obstruction. Oostveen et al. (78)
noted the need for a practical FO index to define airway obstruction.
3.5 IOS PREVIOUS STUDIES
3.5.1 IOS vs Spirometry Studies
Several research groups have developed studies to compare IOS vs Spirometry performance to
assess respiratory function in children. Marotta et al. (7) in 2003 evaluated bronchodilator responses
measured by IOS and spirometry in 4-year old asthmatic and nonasthmatic children. The children
performed IOS and spirometry before and after albuterol administration. In this study they assessed IOS
Resistance and Reactance at 5 Hz (R5 and X5) and Resonant Frequency (Fres). Asthmatic vs non-
asthmatic children presented significant differences in IOS parameters. Therefore, they suggested that
IOS bronchodilator responses are remarkably abnormal in this population (children presented a
38
significant bronchodilator response) and IOS is a useful tool for the early detection of asthma
development. Goldman et al. (9) in 2002 performed a study to assess spirometric indices and respiratory
impedance measured with the IOS in stable asthmatic adolescents over three consecutive days. They
found significant differences between R5, frequency dependence of Resistance (R5-R15) and low
frequency reactance area (AX). However, spirometric indices showed no change. They concluded that
these IOS parameters are sensitive measures that can be used to detect changes in bronchomotor tone in
asthmatic adolescents. It has also been reported by Saadeh et al. (11) in 2003 that some asthmatic
patients manifest normal spirometry after initiation of treatment, despite continuing symptoms, and
abnormal IOS test results. They analyzed spirometry and IOS data pre- and post-levalbuterol from
patients with asthma symptoms. These patients had follow up visits and spirometry and IOS tests at 3, 6
and 12 weeks. They concluded that these patients may be more sensitively managed using IOS. Gaylor,
et al. (6) in 2003, conducted a research analyzing IOS data from 21 asthmatic subjects 5-80 years old
comparing IOS data and spirometry pre- and post-levalbuterol. They stated that Force Oscillation (FO)
is more sensitive than spirometry for detecting early small airway disease and in detecting responses to
therapeutic or bronchial challenge in children and adults. They concluded that the use of IOS should be
considered before changing therapy in asthmatic patients whose FEV1 fails to improve, if the treatments
have improved symptoms. Vink et al. (12) in 2003, performed a study in 19 asthmatic children to
evaluate the sensitivity and specificity of IOS parameters, R and X at frequencies of 5-35 Hz, to quantify
changes in airflow obstruction in comparison with forced expiratory volume in the first second (FEV1)
using a pneumotachometer system, and peak expiratory flow (PEF) using a spirometer. They concluded
that IOS parameters can be easily used as an indirect measure of airflow obstruction and that Resistance
values measured at a frequency of 5 Hz showed to be superior to PEF measurements. In a more recent
study by Song et al. (13) in 2008, the correlation between IOS, spirometry and peak expiratory flow rate
(PEFR) was assessed in 77 asthmatic and 55 control Korean children aged 3 to 6 years. The IOS
parameters analyzed were the IOS Resistance at 5, 10, 20 and 35 Hz (R5, R10, R20 and R35). IOS and
spirometry were performed in these groups of children, before and after bronchodilation. Their results
showed that conventional spirometry parameters did not present statistically significant differences, and
39
there were some significant correlations between bronchodilator responses of spirometric parameters
and IOS parameters. They concluded that IOS is a useful diagnostic tool in detection of early asthma
development and might be a helpful objective outcome measure of early interventions. The same group
of researchers (14) conducted another study, also in 2008, in 48 children with asthma and 66 control
children aged 7-15 years of age in order to evaluate the correlation between spirometry values and IOS
in children with asthma. Their findings were that FEV1 and peak expiratory flow rate (PEFR) showed
significant correlation with impedance and resistance at 5, 10, 20 and 35 Hz, both in asthmatic and
control children. Also FVC showed correlation with impedance and resistance at 10, 20 and 35 Hz in
both groups of children. Therefore, they concluded that FEV1, FVC and PEFR were significantly
correlated with IOS parameters, in both asthmatic and control subjects and they affirmed that IOS is an
appropriate measure of lung function when spirometry and PEF cannot be performed. Antonova et al.
(15) in 2006 performed another study in preschool children 6 years old with mild and moderate
bronchial asthma (BA). The sensitivity of impulse oscilometry and spirometry for assessment of the
degree of severity of bronchial asthma were evaluated. The studied parameters were: FEV1, FVC, FEF25-
75 from spirometry and IOS total Impedance (Zrs), Rrs5 (R5), Xrs5 (X5) and Fres; they compared mild
BA vs moderate BA. No significant differences for spirometry parameters were obtained between both
groups, whereas IOS parameters demonstrated significant increase in total Impedance (Z), R5 and Fres
and significant decrease in X5. Therefore, they suggested that Impulse Oscillometry may be a more
sensitive method than spirometry for assessment of the inflammatory process and degree of severity of
bronchial asthma in children. Linares et al. (16) in 2002 tested 98 asthmatic children, 6 to 15 years old,
with the purpose of evaluating the correlation between spirometry and IOS. In this study IOS R5, X5
and Fres were correlated with FEV1, FEF25, FEF50, FEF75, and FEF25-75. Their findings showed that there
were a good correlation between spirometry and IOS in this group of children, having the best
correlations between R5 and FEV1, and between R5 and FEF25. In other studies, like the study
conducted by Lewis-Brown et al. (17) in 2005, children with asthma from 5 to 18 years were assessed to
evaluate the association between FEV1, and FVC with IOS R5. FEV1 and FVC were not associated with
IOS R5. The researchers concluded that spirometry and IOS should be used together along with clinical
40
history in evaluating patients for asthma, and they also stated that IOS should not be used in assessing
asthma until further studies have been performed.
In a different type of study developed to assess a specific oral drug called montelukast, that
improves pulmonary function and can reach lower airways, Nieto et al. (24) in 2006 evaluated 23
children with mild asthma using spirometry and IOS. They stated that this drug showed improvements
in all IOS parameters tested: Z5, R5, R20, X5 and Fres. No changes were found in the control group.
Expiratory flows remained unchanged except for a small but significant worsening of FEF25-75.
Therefore, they concluded that IOS is more sensitive than conventional spirometry.
In two more recent studies performed by Hur et al. (25) in 2008 and Larsen et al. (26) in 2009,
other comparisons between IOS and spirometry were made. Hur et al (25) tested 174 children in a
methacholine challenge evaluating correlation between FEV1, X5 and R5. They concluded that IOS
parameters were more discriminative than FEV1 for detecting decreased lung function and showed a
good correlation with FEV1. Larsen et al. (26) tested children from 6 to 14 years with mild to moderate
persistent asthma using IOS and spirometry in a long term pediatric trial using different therapies. They
specifically evaluated FEV1, FEV1/FVC ratio, FEF25-75, as well as AX and concluded that AX was
unique in reflecting ongoing improvement during the latter part of the trial in contrast to spirometric
values, emphasizing that the pattern of improvement observed in AX suggest that this test might detect
alterations in airway mechanics not reflected by spirometry.
Hellinckx et al. [28] in 1998 studied 281 healthy and asthmatic children, 2.7 to 6.6 years old,
looking at IOS parameters (R and X at 5, 10,15, 20, 25 and 35Hz) before and after bronchodilation using
salbutamol. Their results showed that neither baseline values of impulse oscillation nor its changes after
bronchodilation was significantly different between healthy and stable asthmatic children. They
recommended that a change in R5 of 40% is to be considered as the cut-off for a “positive”
bronchodilator response. In another more recent study performed by Graw-Panzer et al. (29) in 2009
compared IOS vs spirometry performance using a bronchodilator; they tested 46 inner-city (4-20 years
old) children with asthma before and after bronchodilation, using the IOS parameters R5 and R20, and
the spirometry parameters FVC, FEV1, FEV1/FVC, FEF25-75. They found that reversible
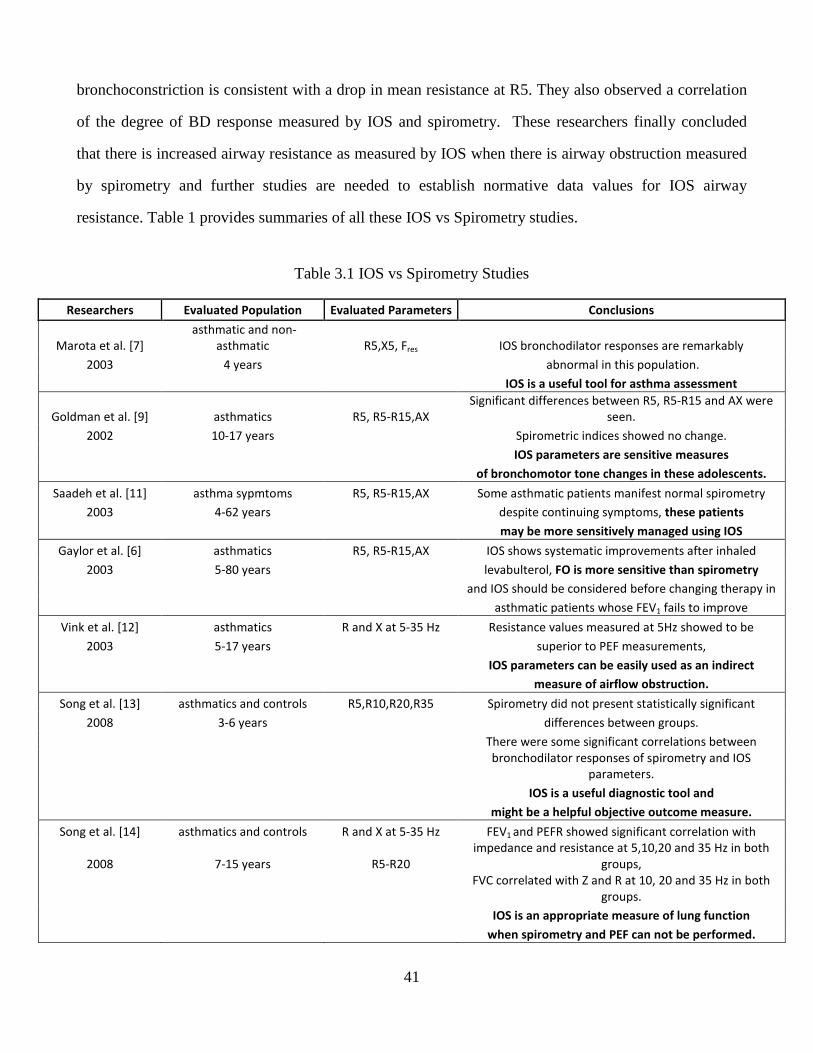
41
bronchoconstriction is consistent with a drop in mean resistance at R5. They also observed a correlation
of the degree of BD response measured by IOS and spirometry. These researchers finally concluded
that there is increased airway resistance as measured by IOS when there is airway obstruction measured
by spirometry and further studies are needed to establish normative data values for IOS airway
resistance. Table 1 provides summaries of all these IOS vs Spirometry studies.
Table 3.1 IOS vs Spirometry Studies
Researchers Evaluated Population Evaluated Parameters Conclusions
Marota et al. [7]
asthmatic and non-
asthmatic R5,X5, Fres IOS bronchodilator responses are remarkably
2003 4 years abnormal in this population.
IOS is a useful tool for asthma assessment
Goldman et al. [9] asthmatics R5, R5-R15,AX
Significant differences between R5, R5-R15 and AX were
seen.
2002 10-17 years Spirometric indices showed no change.
IOS parameters are sensitive measures
of bronchomotor tone changes in these adolescents.
Saadeh et al. [11] asthma sypmtoms R5, R5-R15,AX Some asthmatic patients manifest normal spirometry
2003 4-62 years despite continuing symptoms, these patients
may be more sensitively managed using IOS
Gaylor et al. [6] asthmatics R5, R5-R15,AX IOS shows systematic improvements after inhaled
2003 5-80 years levabulterol, FO is more sensitive than spirometry
and IOS should be considered before changing therapy in
asthmatic patients whose FEV1 fails to improve
Vink et al. [12] asthmatics R and X at 5-35 Hz Resistance values measured at 5Hz showed to be
2003 5-17 years superior to PEF measurements,
IOS parameters can be easily used as an indirect
measure of airflow obstruction.
Song et al. [13] asthmatics and controls R5,R10,R20,R35 Spirometry did not present statistically significant
2008 3-6 years differences between groups.
There were some significant correlations between
bronchodilator responses of spirometry and IOS
parameters.
IOS is a useful diagnostic tool and
might be a helpful objective outcome measure.
Song et al. [14] asthmatics and controls R and X at 5-35 Hz FEV1 and PEFR showed significant correlation with
2008 7-15 years R5-R20
impedance and resistance at 5,10,20 and 35 Hz in both
groups,
FVC correlated with Z and R at 10, 20 and 35 Hz in both
groups.
IOS is an appropriate measure of lung function
when spirometry and PEF can not be performed.
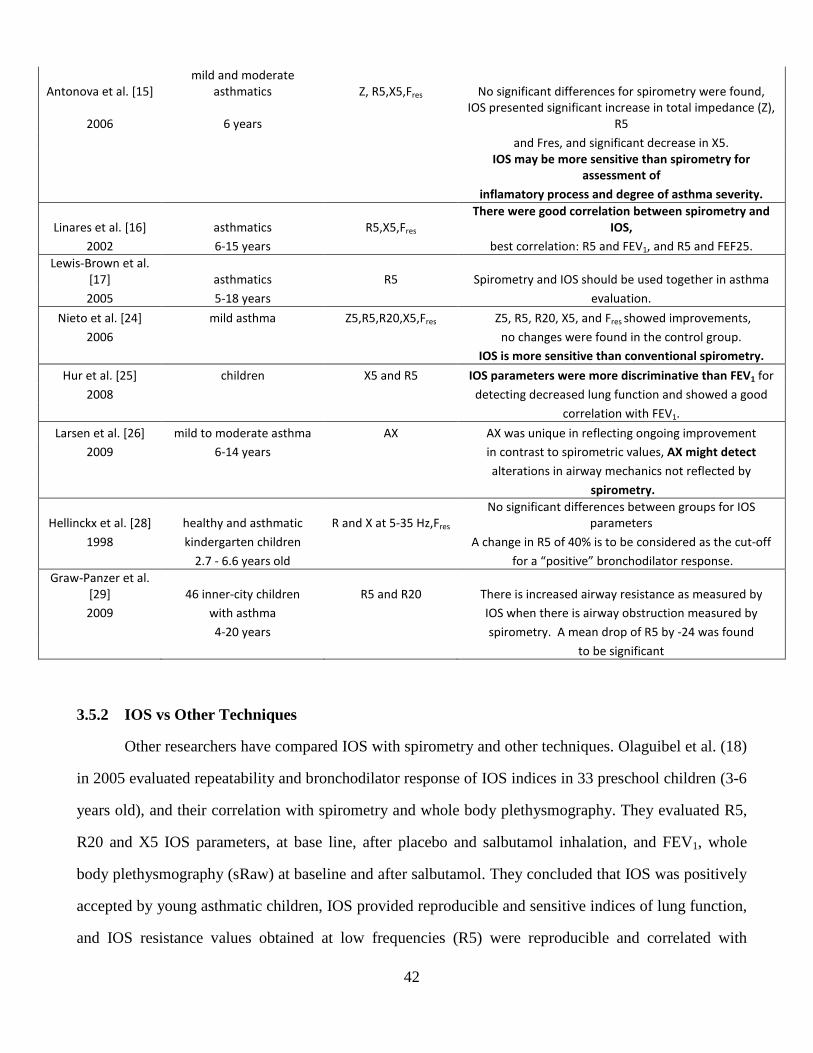
42
Antonova et al. [15]
mild and moderate
asthmatics Z, R5,X5,Fres No significant differences for spirometry were found,
2006 6 years
IOS presented significant increase in total impedance (Z),
R5
and Fres, and significant decrease in X5.
IOS may be more sensitive than spirometry for
assessment of
inflamatory process and degree of asthma severity.
Linares et al. [16] asthmatics R5,X5,Fres
There were good correlation between spirometry and
IOS,
2002 6-15 years best correlation: R5 and FEV1, and R5 and FEF25.
Lewis-Brown et al.
[17] asthmatics R5 Spirometry and IOS should be used together in asthma
2005 5-18 years evaluation.
Nieto et al. [24] mild asthma Z5,R5,R20,X5,Fres Z5, R5, R20, X5, and Fres showed improvements, 2006 no changes were found in the control group.
IOS is more sensitive than conventional spirometry.
Hur et al. [25] children X5 and R5 IOS parameters were more discriminative than FEV1 for
2008 detecting decreased lung function and showed a good
correlation with FEV1.
Larsen et al. [26] mild to moderate asthma AX AX was unique in reflecting ongoing improvement
2009 6-14 years in contrast to spirometric values, AX might detect
alterations in airway mechanics not reflected by
spirometry.
Hellinckx et al. [28] healthy and asthmatic R and X at 5-35 Hz,Fres
No significant differences between groups for IOS
parameters
1998 kindergarten children A change in R5 of 40% is to be considered as the cut-off
2.7 - 6.6 years old for a “positive” bronchodilator response.
Graw-Panzer et al.
[29] 46 inner-city children R5 and R20 There is increased airway resistance as measured by
2009 with asthma IOS when there is airway obstruction measured by
4-20 years spirometry. A mean drop of R5 by -24 was found
to be significant
3.5.2 IOS vs Other Techniques
Other researchers have compared IOS with spirometry and other techniques. Olaguibel et al. (18)
in 2005 evaluated repeatability and bronchodilator response of IOS indices in 33 preschool children (3-6
years old), and their correlation with spirometry and whole body plethysmography. They evaluated R5,
R20 and X5 IOS parameters, at base line, after placebo and salbutamol inhalation, and FEV1, whole
body plethysmography (sRaw) at baseline and after salbutamol. They concluded that IOS was positively
accepted by young asthmatic children, IOS provided reproducible and sensitive indices of lung function,
and IOS resistance values obtained at low frequencies (R5) were reproducible and correlated with
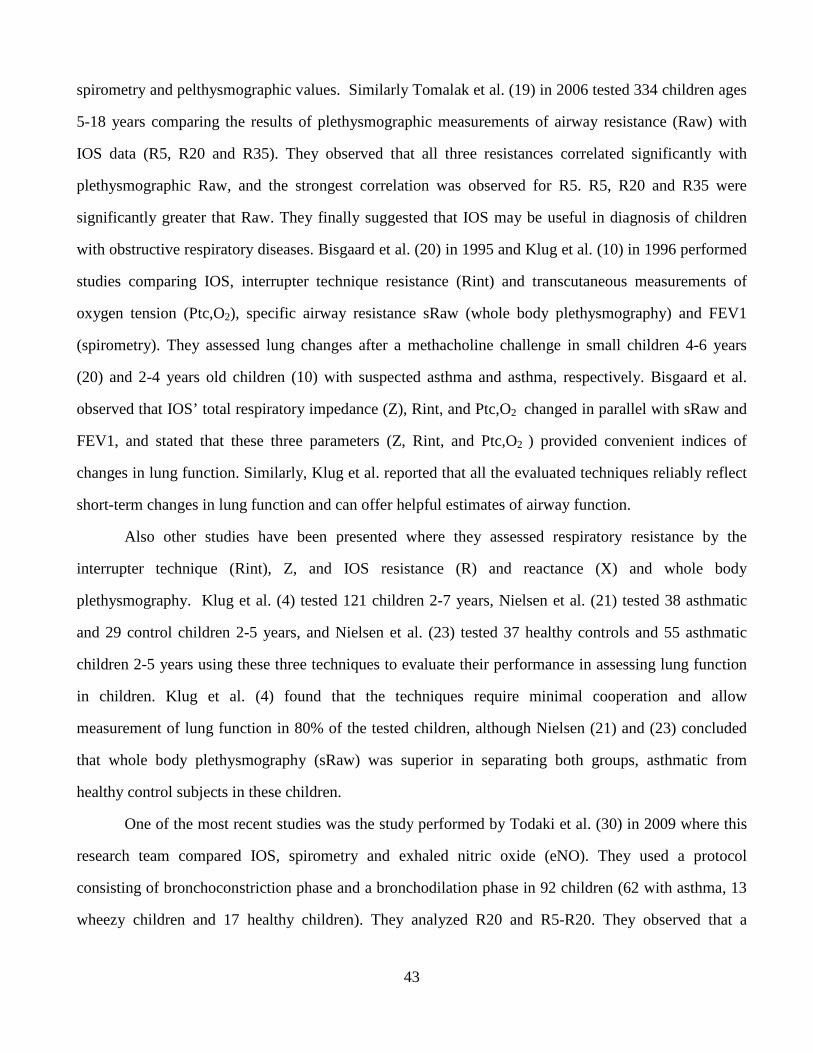
43
spirometry and pelthysmographic values. Similarly Tomalak et al. (19) in 2006 tested 334 children ages
5-18 years comparing the results of plethysmographic measurements of airway resistance (Raw) with
IOS data (R5, R20 and R35). They observed that all three resistances correlated significantly with
plethysmographic Raw, and the strongest correlation was observed for R5. R5, R20 and R35 were
significantly greater that Raw. They finally suggested that IOS may be useful in diagnosis of children
with obstructive respiratory diseases. Bisgaard et al. (20) in 1995 and Klug et al. (10) in 1996 performed
studies comparing IOS, interrupter technique resistance (Rint) and transcutaneous measurements of
oxygen tension (Ptc,O2), specific airway resistance sRaw (whole body plethysmography) and FEV1
(spirometry). They assessed lung changes after a methacholine challenge in small children 4-6 years
(20) and 2-4 years old children (10) with suspected asthma and asthma, respectively. Bisgaard et al.
observed that IOS’ total respiratory impedance (Z), Rint, and Ptc,O2 changed in parallel with sRaw and
FEV1, and stated that these three parameters (Z, Rint, and Ptc,O2 ) provided convenient indices of
changes in lung function. Similarly, Klug et al. reported that all the evaluated techniques reliably reflect
short-term changes in lung function and can offer helpful estimates of airway function.
Also other studies have been presented where they assessed respiratory resistance by the
interrupter technique (Rint), Z, and IOS resistance (R) and reactance (X) and whole body
plethysmography. Klug et al. (4) tested 121 children 2-7 years, Nielsen et al. (21) tested 38 asthmatic
and 29 control children 2-5 years, and Nielsen et al. (23) tested 37 healthy controls and 55 asthmatic
children 2-5 years using these three techniques to evaluate their performance in assessing lung function
in children. Klug et al. (4) found that the techniques require minimal cooperation and allow
measurement of lung function in 80% of the tested children, although Nielsen (21) and (23) concluded
that whole body plethysmography (sRaw) was superior in separating both groups, asthmatic from
healthy control subjects in these children.
One of the most recent studies was the study performed by Todaki et al. (30) in 2009 where this
research team compared IOS, spirometry and exhaled nitric oxide (eNO). They used a protocol
consisting of bronchoconstriction phase and a bronchodilation phase in 92 children (62 with asthma, 13
wheezy children and 17 healthy children). They analyzed R20 and R5-R20. They observed that a
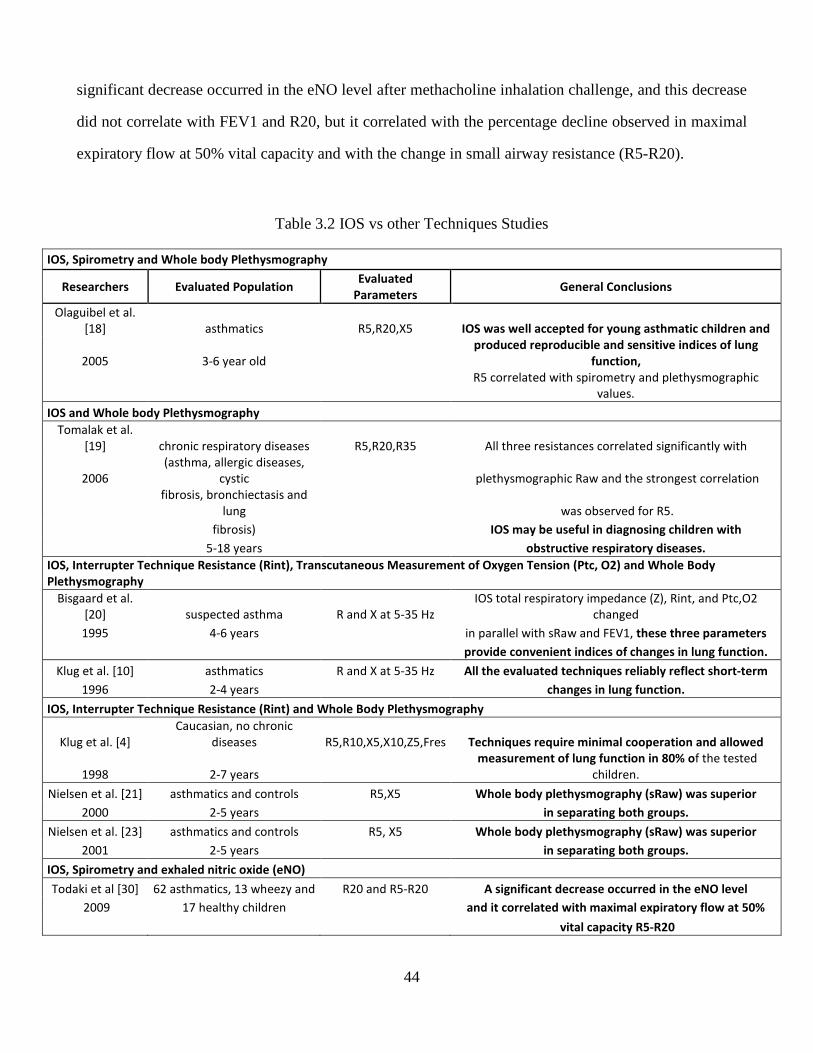
44
significant decrease occurred in the eNO level after methacholine inhalation challenge, and this decrease
did not correlate with FEV1 and R20, but it correlated with the percentage decline observed in maximal
expiratory flow at 50% vital capacity and with the change in small airway resistance (R5-R20).
Table 3.2 IOS vs other Techniques Studies
IOS, Spirometry and Whole body Plethysmography
Researchers Evaluated Population Evaluated
Parameters General Conclusions
Olaguibel et al.
[18] asthmatics R5,R20,X5 IOS was well accepted for young asthmatic children and
2005 3-6 year old
produced reproducible and sensitive indices of lung
function,
R5 correlated with spirometry and plethysmographic
values.
IOS and Whole body Plethysmography
Tomalak et al.
[19] chronic respiratory diseases R5,R20,R35 All three resistances correlated significantly with
2006
(asthma, allergic diseases,
cystic plethysmographic Raw and the strongest correlation
fibrosis, bronchiectasis and
lung was observed for R5.
fibrosis) IOS may be useful in diagnosing children with
5-18 years obstructive respiratory diseases.
IOS, Interrupter Technique Resistance (Rint), Transcutaneous Measurement of Oxygen Tension (Ptc, O2) and Whole Body
Plethysmography
Bisgaard et al.
[20] suspected asthma R and X at 5-35 Hz
IOS total respiratory impedance (Z), Rint, and Ptc,O2
changed
1995 4-6 years in parallel with sRaw and FEV1, these three parameters
provide convenient indices of changes in lung function.
Klug et al. [10] asthmatics R and X at 5-35 Hz All the evaluated techniques reliably reflect short-term
1996 2-4 years changes in lung function.
IOS, Interrupter Technique Resistance (Rint) and Whole Body Plethysmography
Klug et al. [4]
Caucasian, no chronic
diseases R5,R10,X5,X10,Z5,Fres Techniques require minimal cooperation and allowed
1998 2-7 years
measurement of lung function in 80% of the tested
children.
Nielsen et al. [21] asthmatics and controls R5,X5 Whole body plethysmography (sRaw) was superior
2000 2-5 years in separating both groups.
Nielsen et al. [23] asthmatics and controls R5, X5 Whole body plethysmography (sRaw) was superior
2001 2-5 years in separating both groups.
IOS, Spirometry and exhaled nitric oxide (eNO)
Todaki et al [30] 62 asthmatics, 13 wheezy and R20 and R5-R20 A significant decrease occurred in the eNO level
2009 17 healthy children and it correlated with maximal expiratory flow at 50%
vital capacity R5-R20
45
3.5.3 IOS Studies
Ortiz et al. (8) in 2002 assessed the bronchodilator response in 10 children 2-5 years using IOS,
analyzing X5 as primary efficacy variable. They confirmed that IOS is an acceptable method to assess
airway response to bronchoactive drugs in this age group. Similarly, Goldman et al. (22) in 2008
analyzed the same group of children as Ortiz et al. (8), they evaluated R5, R5-R20, and AX. They
concluded that IOS indices are sensitive measures of lung mechanical responses to bronchodilators in
this group of children. Also in 2008 Menendez et al. (31) performed a study about IOS parameters
measuring the effects of short and long acting Beta-agonist in the same children as Ortiz et al. (8). They
analyzed R5, R5-R20, AX and respiratory model parameters for peripheral resistance (Rp) and
compliance (Cp). They concluded that IOS parameters reflecting airway mechanics respond 5 min after
albuterol and salmeterol in young children; Rp decreased and Cp increased after albuterol and salmeterol
at 5 minutes; IOS R5, R5-R20, AX are sensitive measures of lung mechanics responses to SABA and
LABA in pre-school children with asthma. Other study realized by Jee et al. (32) in 2010 also evaluated
IOS parameters R, X, Fres and AX, with the aim of exploring which level of provocative concentration
(PC) is appropriate for bronchial challenge in asthmatic children. They tested 51 children with asthma
and 41 children with chronic cough, used as controls. The IOS parameters were significantly different
between groups in the methacholine challenge. The authors finally suggested that PC(80)_X5 might be a
useful parameter to asses bronchial challenge in preschool children.
Table 3.3 IOS studies
Researchers Evaluated Population Evaluated Parameters General Conclusions
Ortiz et al. [8] asthmatics X5 IOS is an acceptable method to assess airway response
2002 2-5 years to bronchoactive drugs in this age group.
Goldman et al. [22] asthmatics R5, R5-R20, AX IOS indices are sensitive measures of lung mechanical
2008 2-5 years responses to bronchodilators in this group of children.
Menendez et al. [31] asthmatics R5,R5-R20, AX IOS R5, R5-R20, AX are sensitive measures of
2008 2-5 years
lung mechanics responses to SABA and LABA in
pre-school children with asthma
Jee et al. [32] asthmatics and R, X, Fres and AX IOS parameters were significantly different
2010 chronic couugh (controls) between groups in the methacholine challenge
children
46
As mentioned before these previous IOS studies sensitively and accurately evaluated lung
function in children and adolescents, using pre and post bronchodilation conditions and bronchial
challenge. However, it is observed that different parameters at different frequencies have been used
during the years to evaluate the pre and post bronchodilation response and bronchial challenge results. It
is also remarkable that very few studies, only the most recent ones, reported the analysis of the AX
parameter, which could offer criticall information about lung function in these children and adolescents
as stated by Goldman et al. (9) (22), Nieto et al. (24), Larsen et al. (26) and Menendez et al. (31).
Therefore, this study aims to statistically evaluate the performance of all IOS measured and calculated
parameters (Resistances and Reactances, Fres, AX, frequency dependence of resistance R3-R20 and R5-
R20) from 3-35 Hz before and after bronchodilation, to determine which one of these parameters better
differentiates between pre and post bronchodilation conditions. It is also worthwhile to investigate
whether impedance measures at 3 Hz could offer more significant information compared to impedance
values measured at 5Hz.
3.6 IOS REFERENCE VALUES - PREVIOUS STUDIES
Clement et al. (35) in 1987 obtained reference values using FOT for 403 healthy Belgian
children 4 to 20 years of age measuring R and X between 4 and 26 Hz. They found that R and X vs
frequency data depended on age or height, on sex, and slightly on weight. They mentioned that with
growth R and the frequency dependence of R decrease while X increases. They also highlighted that
adult values of R and X can be observed at 15 years of age in girls and at 18 years in boys. Ducharme et
al. (36) in 1998 did a study to determine Reference values in North American children (206 healthy
children aged 3 to 17 years) assessing respiratory resistance measurements using FOT at 8, 12 and 16
Hz. They found that Height is the best predictor for total respiratory resistance at 8, 12 and 16 Hz in
children. In 2005, Frei et al. (37) did a study aimed to obtain reference equations also in North American
children to be used for assessing respiratory function by using IOS. They analyzed values of R and X at
5, 10, 15, 20, 25 and 35 Hz and Fres in 222 white children 3 to 10 years old (100 to 150 cm in height).
They found that standing height was the only significant predictor for all variables, and concluded that
47
Resistance and Fres decreased by height, but also by age, and reactance increased. In 2006, in a study
performed in Sweden, Dencker et al. (38) used IOS to obtain reference values for respiratory system
impedance in children 2 to 10 years old. Their aim was to extend the reference values for IOS variables
and to study their correlation with height, weight and age in healthy children. They tested 360 children
assessing R and X at 5, 10, 15 and 20 Hz, total respiratory impedance (Z) and Fres, and concluded that all
variables were related to body height, and most of them were weakly related to weight. They presented
reference equations for children (height: 90-160 cm). Two more recent studies performed in 2008
presented reference values for IOS in healthy Polish (39) and healthy Iranian children (40) aged 3-18
and 5-19 years old, respectively. Nowowiejska et al. (39) evaluated 626 healthy Polish children in order
to construct equations describing normal values of oscillatory parameters using IOS (R and X at 5, 10,
15,20,25,35 Hz and Fres). They also found that body height was the best predictor and resistances were
best predicted with exponential models while reactances with linear ones. R decreased with height while
X increased. On the other hand, Amra et al. (40) presented IOS data from 509 healthy Iranian children
measuring R and X at 5, 15 and 20 Hz, and their prediction equations. In 2007, Wee et al (41) also
presented a study about IOS Reference values for respiratory system Impedance for 92 children (7 to 12
years old). They obtained reference values for R and X, finding that height was the most significant
predictor of R and X. They concluded that IOS is a feasible method to measure the respiratory resistance
in children, and that they obtained reference IOS values that seemed to be useful to diagnose a variety of
respiratory diseases. Finally in 2010 Jee et al. (42) presented a study about Reference values for healthy
Korean children 3-6 years old, a total of 607 children were tested but only 143 children were successful
in performing IOS. They used the following IOS parameters: R5, R10, X5, X10 and AX. They stated
that their study suggested reference values for healthy Asian children aged 3-6 years, and that healthy
young children had better results in IOS parameters than main reference values reported before.
Others studies have also been performed in adults to obtain reference values and elaborate
predictive equations using the IOS.
Therefore, as stated before, this study is the first attempt to provide IOS reference values for
healthy Anglo and Hispanic children 5 to 19 years old, and also presents baseline and post-
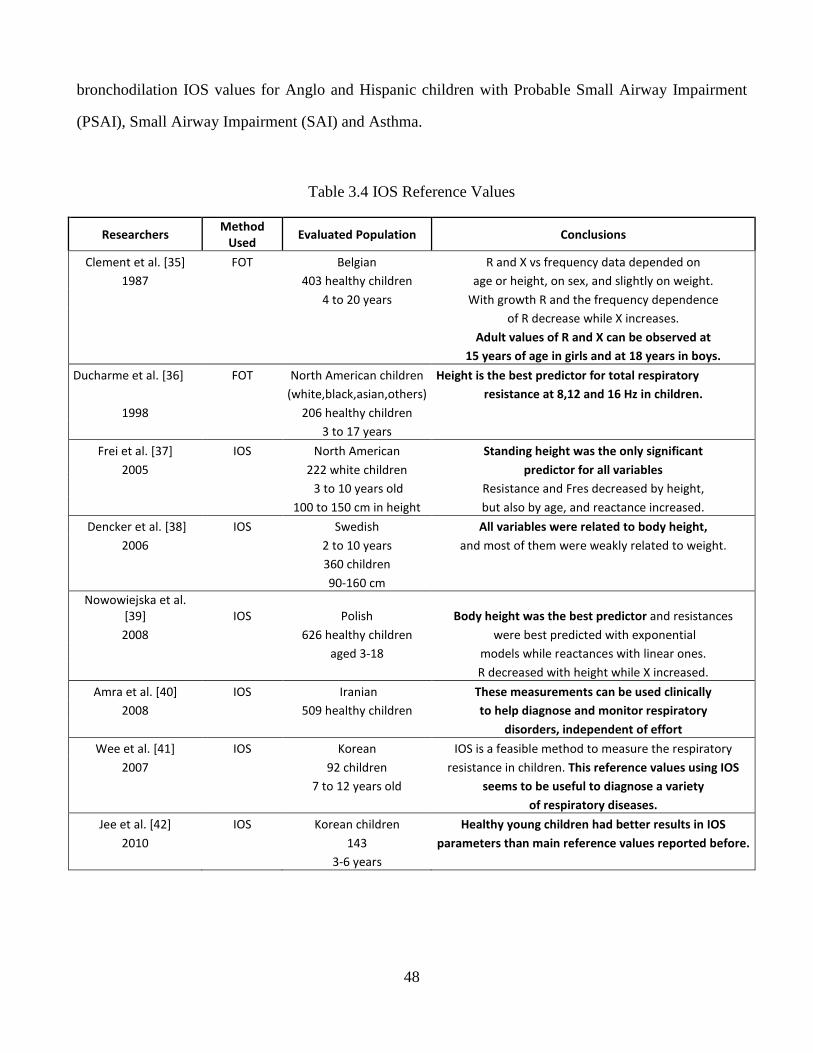
48
bronchodilation IOS values for Anglo and Hispanic children with Probable Small Airway Impairment
(PSAI), Small Airway Impairment (SAI) and Asthma.
Table 3.4 IOS Reference Values
Researchers Method
Used Evaluated Population Conclusions
Clement et al. [35] FOT Belgian R and X vs frequency data depended on
1987 403 healthy children age or height, on sex, and slightly on weight.
4 to 20 years With growth R and the frequency dependence
of R decrease while X increases.
Adult values of R and X can be observed at
15 years of age in girls and at 18 years in boys.
Ducharme et al. [36] FOT North American children Height is the best predictor for total respiratory
(white,black,asian,others) resistance at 8,12 and 16 Hz in children.
1998 206 healthy children
3 to 17 years
Frei et al. [37] IOS North American Standing height was the only significant
2005 222 white children predictor for all variables
3 to 10 years old Resistance and Fres decreased by height,
100 to 150 cm in height but also by age, and reactance increased.
Dencker et al. [38] IOS Swedish All variables were related to body height,
2006 2 to 10 years and most of them were weakly related to weight.
360 children
90-160 cm
Nowowiejska et al.
[39] IOS Polish Body height was the best predictor and resistances
2008 626 healthy children were best predicted with exponential
aged 3-18 models while reactances with linear ones.
R decreased with height while X increased.
Amra et al. [40] IOS Iranian These measurements can be used clinically
2008 509 healthy children to help diagnose and monitor respiratory
disorders, independent of effort
Wee et al. [41] IOS Korean IOS is a feasible method to measure the respiratory
2007 92 children resistance in children. This reference values using IOS
7 to 12 years old seems to be useful to diagnose a variety
of respiratory diseases.
Jee et al. [42] IOS Korean children Healthy young children had better results in IOS
2010 143 parameters than main reference values reported before.
3-6 years
49
Chapter 4: Respiratory System Models
4.1 INTRODUCTION
The IOS and FOT impedance curves can be correlated with respiratory system’s electrical
models with components analogous to the resistances, compliances and inertances inherent of the
respiratory system. With specially designed algorithms, respiratory system component values can be
estimated, and these estimated parameters could be used to assist physicians in the diagnosis and
treatment of different respiratory diseases (43).
In this research we have special interest in the small airways diseases and asthma; an effective
means to evaluate small airways performance could be achieved by integrating realistic models of lung
function based on physiological measurements made by FOT or IOS and other techniques (80).
Different equivalent electrical circuit models with lumped parameter components representing
the resistances, inertances, and compliances of the respiratory system have been developed and analyzed
over the years by different research groups (44).
Previous work by our research group has focused on development and analysis of six different
equivalent electrical circuit models of human respiratory impedance. Our efforts to date, have
demonstrated that the performance of the extended RIC (eRIC) and augmented RIC (aRIC) models rank
in the middle of a series of conventional models developed over the past several decades in terms of
total cumulative error. However, they provide parameter estimates that are physiologically more realistic
and in line with expected values in healthy subjects and those suffering from pulmonary diseases than
previous models (43) (44) (45) (46) (47) (48) (49) (50) (51).
This chapter is intended to give a brief summary of different respiratory system electrical circuit
models, with special focus on the six models evaluated in our research efforts and to also to present
asuccinct review of the results obtained.
4.2 RESPIRATORY SYSTEM MODELS
As stated before, several respiratory systems electrical circuit models have been developed and
analyzed over the years. The simplest of these models are the Resistance-Capacitance (RC) and the
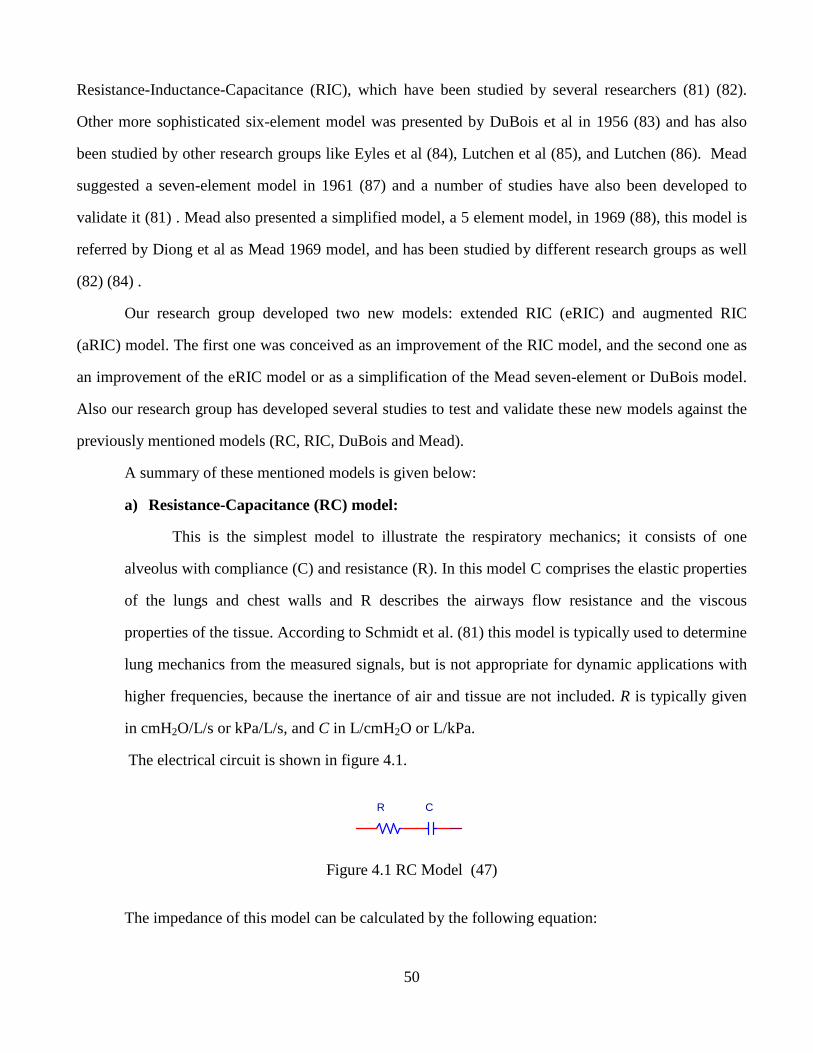
50
Resistance-Inductance-Capacitance (RIC), which have been studied by several researchers (81) (82).
Other more sophisticated six-element model was presented by DuBois et al in 1956 (83) and has also
been studied by other research groups like Eyles et al (84), Lutchen et al (85), and Lutchen (86). Mead
suggested a seven-element model in 1961 (87) and a number of studies have also been developed to
validate it (81) . Mead also presented a simplified model, a 5 element model, in 1969 (88), this model is
referred by Diong et al as Mead 1969 model, and has been studied by different research groups as well
(82) (84) .
Our research group developed two new models: extended RIC (eRIC) and augmented RIC
(aRIC) model. The first one was conceived as an improvement of the RIC model, and the second one as
an improvement of the eRIC model or as a simplification of the Mead seven-element or DuBois model.
Also our research group has developed several studies to test and validate these new models against the
previously mentioned models (RC, RIC, DuBois and Mead).
A summary of these mentioned models is given below:
a) Resistance-Capacitance (RC) model:
This is the simplest model to illustrate the respiratory mechanics; it consists of one
alveolus with compliance (C) and resistance (R). In this model C comprises the elastic properties
of the lungs and chest walls and R describes the airways flow resistance and the viscous
properties of the tissue. According to Schmidt et al. (81) this model is typically used to determine
lung mechanics from the measured signals, but is not appropriate for dynamic applications with
higher frequencies, because the inertance of air and tissue are not included. R is typically given
in cmH2O/L/s or kPa/L/s, and C in L/cmH2O or L/kPa.
The electrical circuit is shown in figure 4.1.
Figure 4.1 RC Model (47)
The impedance of this model can be calculated by the following equation:
CR
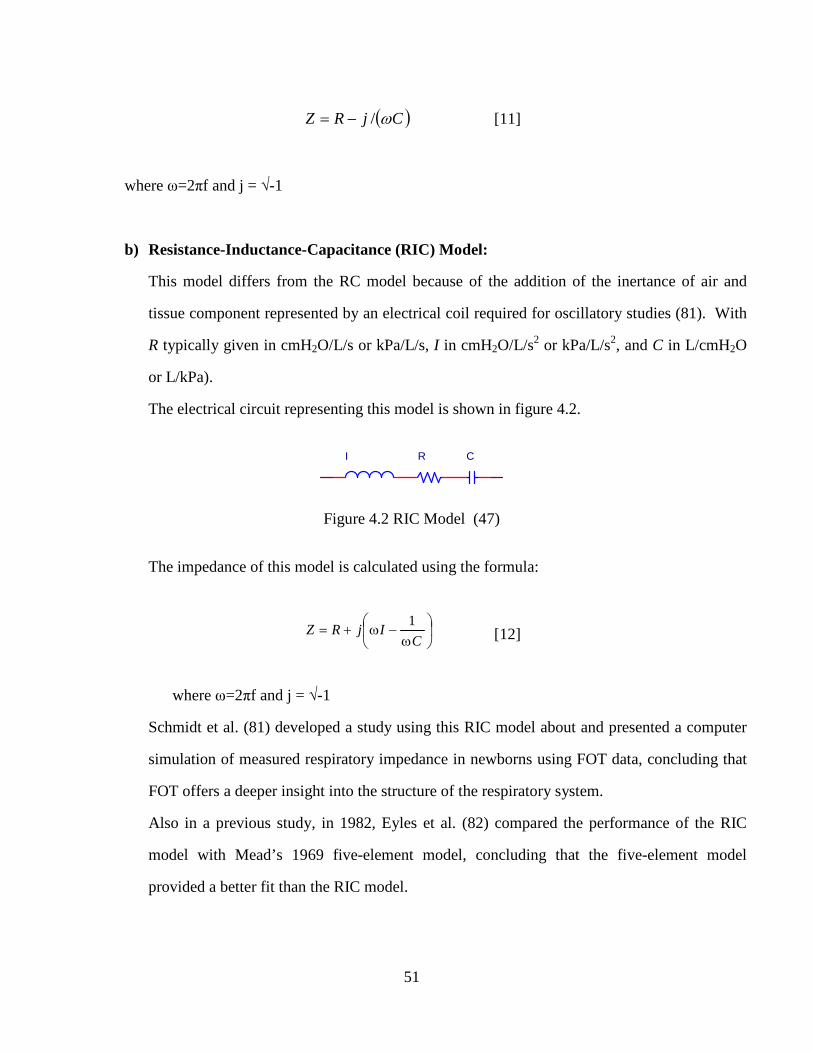
51
( )CjRZ ω/−= [11]
where ω=2πf and j = √-1
b) Resistance-Inductance-Capacitance (RIC) Model:
This model differs from the RC model because of the addition of the inertance of air and
tissue component represented by an electrical coil required for oscillatory studies (81). With
R typically given in cmH2O/L/s or kPa/L/s, I in cmH2O/L/s2 or kPa/L/s2, and C in L/cmH2O
or L/kPa).
The electrical circuit representing this model is shown in figure 4.2.
Figure 4.2 RIC Model (47)
The impedance of this model is calculated using the formula:
ω
−ω+=C
IjRZ1
[12]
where ω=2πf and j = √-1
Schmidt et al. (81) developed a study using this RIC model about and presented a computer
simulation of measured respiratory impedance in newborns using FOT data, concluding that
FOT offers a deeper insight into the structure of the respiratory system.
Also in a previous study, in 1982, Eyles et al. (82) compared the performance of the RIC
model with Mead’s 1969 five-element model, concluding that the five-element model
provided a better fit than the RIC model.
I CR
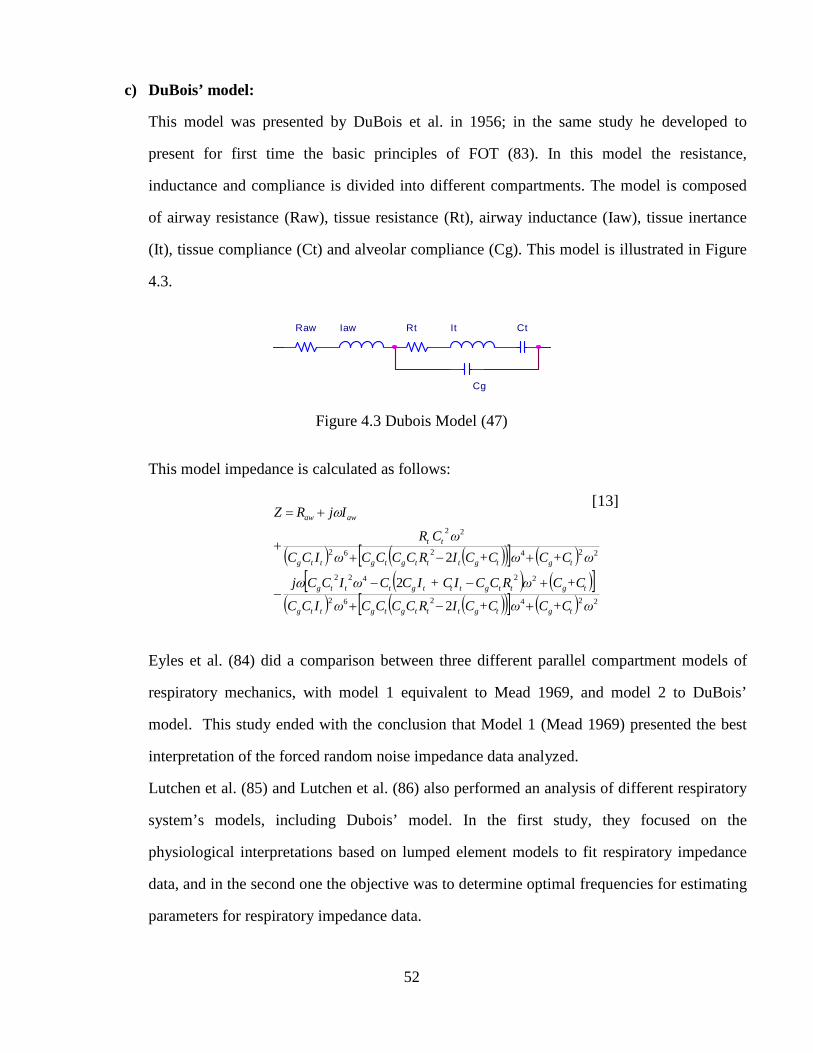
52
( ) ( )( )[ ] ( )( ) ( )[ ]
( ) ( )( )[ ] ( ) 224262
22422
224262
22
2
2
2
ω+CCω+CCIRCCCCωICC
+CCωRCCI + CICCωICCj
ω+CCω+CCIRCCCCωICC
ωCR
IjRZ
tgtgtttgtgttg
tgttgtttgtttg
tgtgtttgtgttg
tt
awaw
+−+
+−−−
+−++
+=
ω
ω
c) DuBois’ model:
This model was presented by DuBois et al. in 1956; in the same study he developed to
present for first time the basic principles of FOT (83). In this model the resistance,
inductance and compliance is divided into different compartments. The model is composed
of airway resistance (Raw), tissue resistance (Rt), airway inductance (Iaw), tissue inertance
(It), tissue compliance (Ct) and alveolar compliance (Cg). This model is illustrated in Figure
4.3.
Figure 4.3 Dubois Model (47)
This model impedance is calculated as follows:
[13]
Eyles et al. (84) did a comparison between three different parallel compartment models of
respiratory mechanics, with model 1 equivalent to Mead 1969, and model 2 to DuBois’
model. This study ended with the conclusion that Model 1 (Mead 1969) presented the best
interpretation of the forced random noise impedance data analyzed.
Lutchen et al. (85) and Lutchen et al. (86) also performed an analysis of different respiratory
system’s models, including Dubois’ model. In the first study, they focused on the
physiological interpretations based on lumped element models to fit respiratory impedance
data, and in the second one the objective was to determine optimal frequencies for estimating
parameters for respiratory impedance data.
ItRtRaw CtIaw
Cg
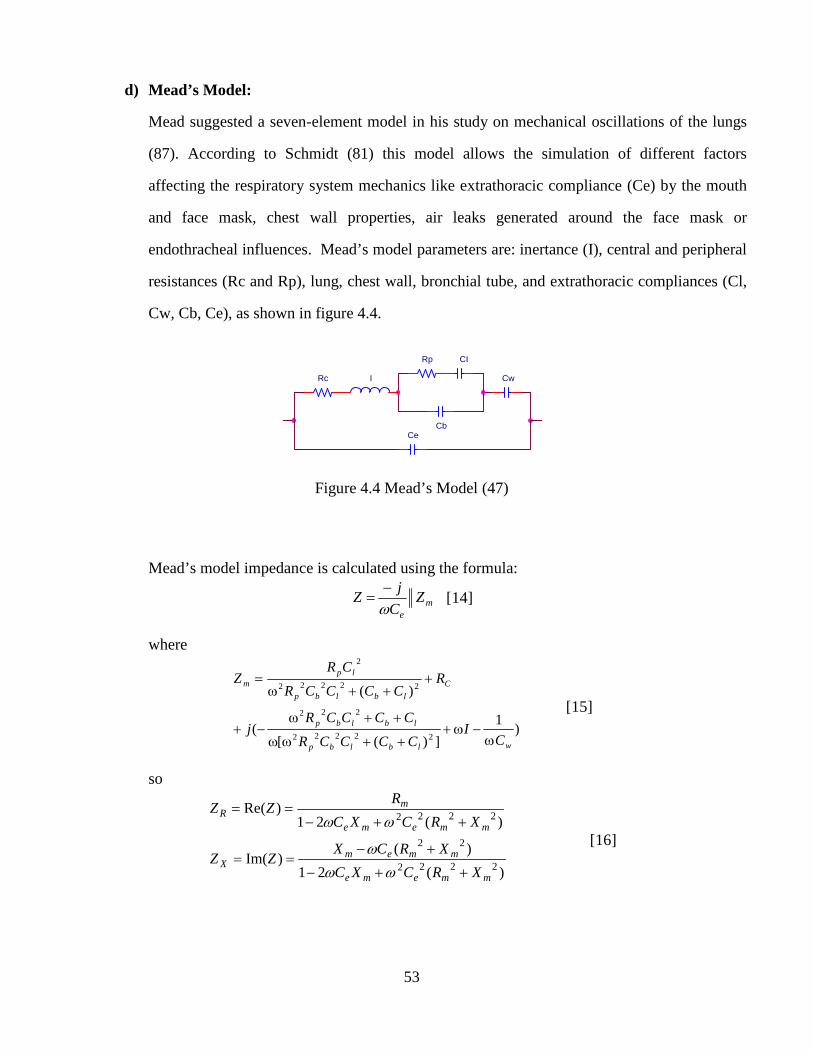
53
d) Mead’s Model:
Mead suggested a seven-element model in his study on mechanical oscillations of the lungs
(87). According to Schmidt (81) this model allows the simulation of different factors
affecting the respiratory system mechanics like extrathoracic compliance (Ce) by the mouth
and face mask, chest wall properties, air leaks generated around the face mask or
endothracheal influences. Mead’s model parameters are: inertance (I), central and peripheral
resistances (Rc and Rp), lung, chest wall, bronchial tube, and extrathoracic compliances (Cl,
Cw, Cb, Ce), as shown in figure 4.4.
Figure 4.4 Mead’s Model (47)
Mead’s model impedance is calculated using the formula:
me
ZC
jZ
ω−
= [14]
where
)1
])([(
)(
22222
222
22222
2
wlblbp
lblbp
C
lblbp
lpm
CI
CCCCR
CCCCRj
RCCCCR
CRZ
ω−ω+
++ωω
++ω−+
+++ω
=
[15]
so
)(21
)()Im(
)(21)Re(
2222
22
2222
mmeme
mmemX
mmeme
mR
XRCXC
XRCXZZ
XRCXC
RZZ
++−
+−==
++−==
ωω
ω
ωω [16]
Rc
Cb
CI
Cw
Ce
Rp
I
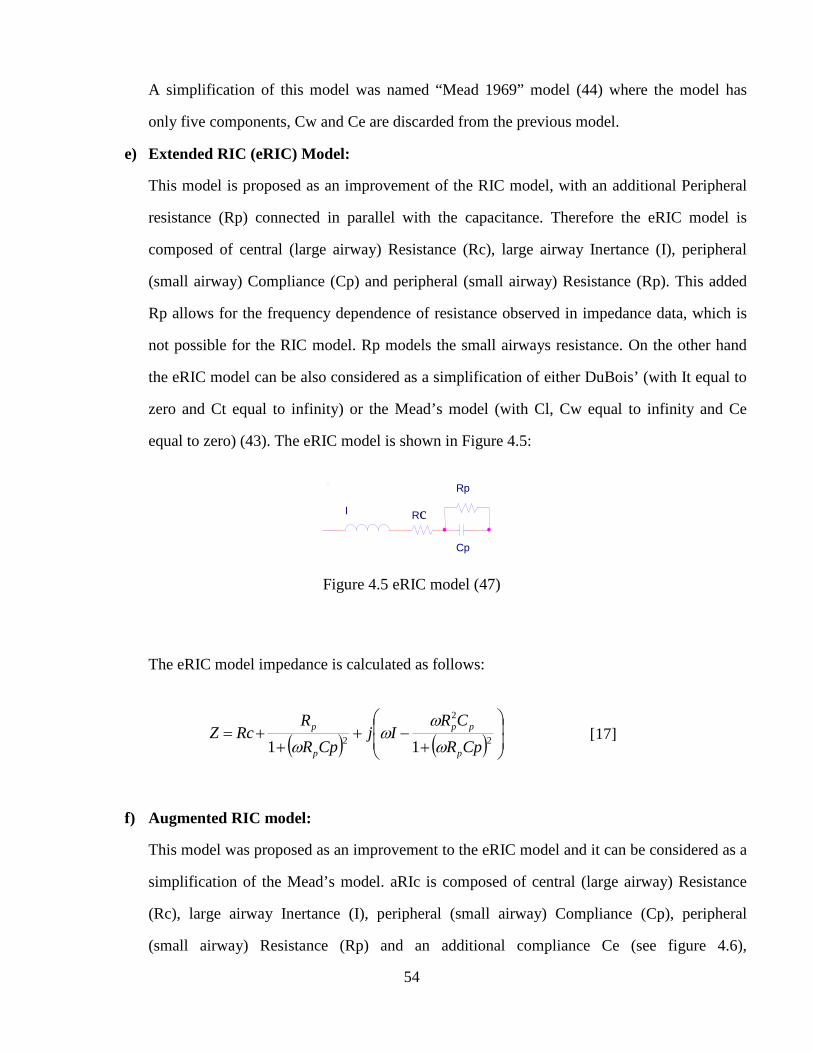
54
A simplification of this model was named “Mead 1969” model (44) where the model has
only five components, Cw and Ce are discarded from the previous model.
e) Extended RIC (eRIC) Model:
This model is proposed as an improvement of the RIC model, with an additional Peripheral
resistance (Rp) connected in parallel with the capacitance. Therefore the eRIC model is
composed of central (large airway) Resistance (Rc), large airway Inertance (I), peripheral
(small airway) Compliance (Cp) and peripheral (small airway) Resistance (Rp). This added
Rp allows for the frequency dependence of resistance observed in impedance data, which is
not possible for the RIC model. Rp models the small airways resistance. On the other hand
the eRIC model can be also considered as a simplification of either DuBois’ (with It equal to
zero and Ct equal to infinity) or the Mead’s model (with Cl, Cw equal to infinity and Ce
equal to zero) (43). The eRIC model is shown in Figure 4.5:
Figure 4.5 eRIC model (47)
The eRIC model impedance is calculated as follows:
( ) ( )
+−+
++=
2
2
2 11 CpR
CRIj
CpR
RRcZ
p
pp
p
p
ω
ωω
ω [17]
f) Augmented RIC model:
This model was proposed as an improvement to the eRIC model and it can be considered as a
simplification of the Mead’s model. aRIc is composed of central (large airway) Resistance
(Rc), large airway Inertance (I), peripheral (small airway) Compliance (Cp), peripheral
(small airway) Resistance (Rp) and an additional compliance Ce (see figure 4.6),
Cp
Rc
Rp
I
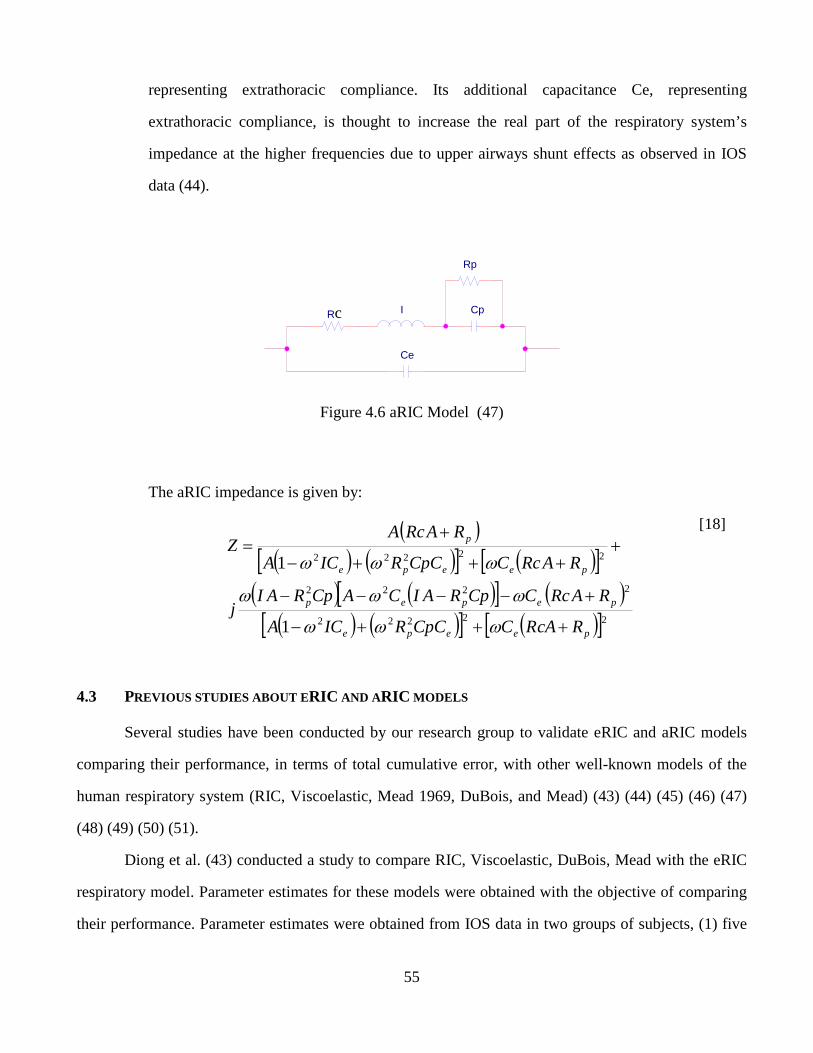
55
representing extrathoracic compliance. Its additional capacitance Ce, representing
extrathoracic compliance, is thought to increase the real part of the respiratory system’s
impedance at the higher frequencies due to upper airways shunt effects as observed in IOS
data (44).
Figure 4.6 aRIC Model (47)
The aRIC impedance is given by:
[18]
4.3 PREVIOUS STUDIES ABOUT ERIC AND ARIC MODELS
Several studies have been conducted by our research group to validate eRIC and aRIC models
comparing their performance, in terms of total cumulative error, with other well-known models of the
human respiratory system (RIC, Viscoelastic, Mead 1969, DuBois, and Mead) (43) (44) (45) (46) (47)
(48) (49) (50) (51).
Diong et al. (43) conducted a study to compare RIC, Viscoelastic, DuBois, Mead with the eRIC
respiratory model. Parameter estimates for these models were obtained with the objective of comparing
their performance. Parameter estimates were obtained from IOS data in two groups of subjects, (1) five
Rc I
Rp
Ce
Cp
( )( ) ( )[ ] ( )[ ]
( ) ( )[ ] ( )( ) ( )[ ] ( )[ ]22222
2222
22222
1
1
peepe
pepep
peepe
p
RcARCCpCRICA
RARcCCpRAICACpRAIj
RARcCCpCRICA
RARcAZ
+++−
+−−−−
++++−
+=
ωωω
ωωω
ωωω
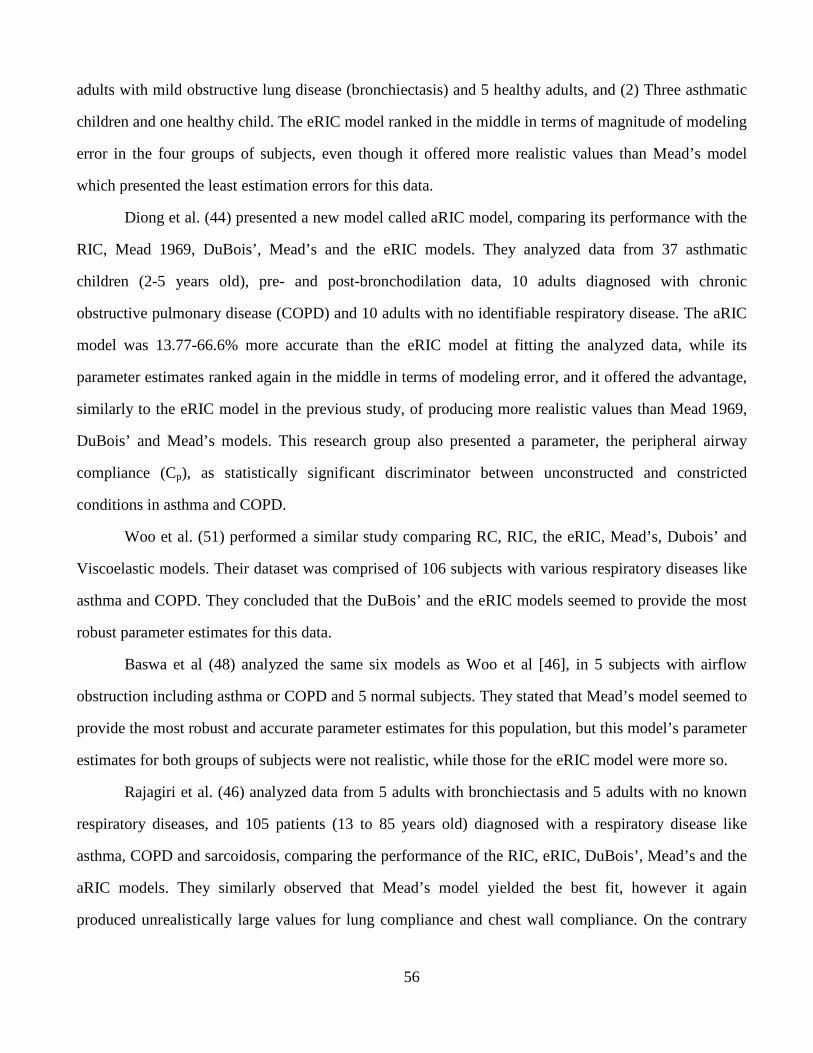
56
adults with mild obstructive lung disease (bronchiectasis) and 5 healthy adults, and (2) Three asthmatic
children and one healthy child. The eRIC model ranked in the middle in terms of magnitude of modeling
error in the four groups of subjects, even though it offered more realistic values than Mead’s model
which presented the least estimation errors for this data.
Diong et al. (44) presented a new model called aRIC model, comparing its performance with the
RIC, Mead 1969, DuBois’, Mead’s and the eRIC models. They analyzed data from 37 asthmatic
children (2-5 years old), pre- and post-bronchodilation data, 10 adults diagnosed with chronic
obstructive pulmonary disease (COPD) and 10 adults with no identifiable respiratory disease. The aRIC
model was 13.77-66.6% more accurate than the eRIC model at fitting the analyzed data, while its
parameter estimates ranked again in the middle in terms of modeling error, and it offered the advantage,
similarly to the eRIC model in the previous study, of producing more realistic values than Mead 1969,
DuBois’ and Mead’s models. This research group also presented a parameter, the peripheral airway
compliance (Cp), as statistically significant discriminator between unconstructed and constricted
conditions in asthma and COPD.
Woo et al. (51) performed a similar study comparing RC, RIC, the eRIC, Mead’s, Dubois’ and
Viscoelastic models. Their dataset was comprised of 106 subjects with various respiratory diseases like
asthma and COPD. They concluded that the DuBois’ and the eRIC models seemed to provide the most
robust parameter estimates for this data.
Baswa et al (48) analyzed the same six models as Woo et al [46], in 5 subjects with airflow
obstruction including asthma or COPD and 5 normal subjects. They stated that Mead’s model seemed to
provide the most robust and accurate parameter estimates for this population, but this model’s parameter
estimates for both groups of subjects were not realistic, while those for the eRIC model were more so.
Rajagiri et al. (46) analyzed data from 5 adults with bronchiectasis and 5 adults with no known
respiratory diseases, and 105 patients (13 to 85 years old) diagnosed with a respiratory disease like
asthma, COPD and sarcoidosis, comparing the performance of the RIC, eRIC, DuBois’, Mead’s and the
aRIC models. They similarly observed that Mead’s model yielded the best fit, however it again
produced unrealistically large values for lung compliance and chest wall compliance. On the contrary
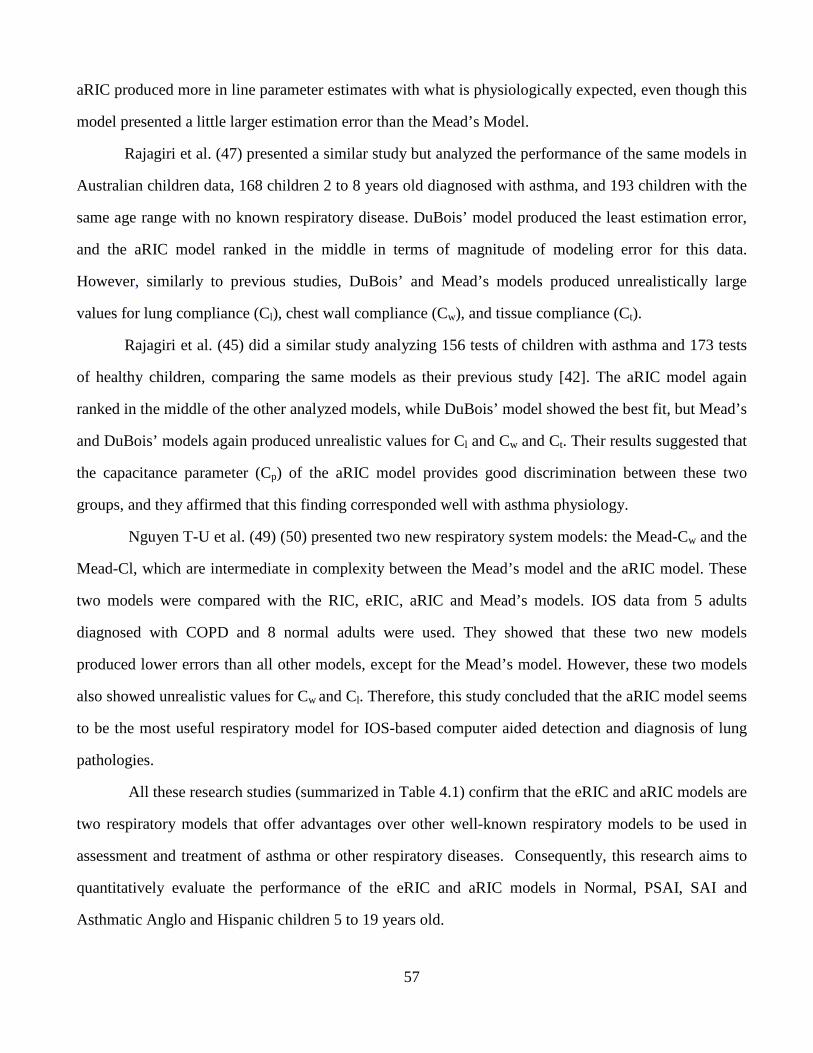
57
aRIC produced more in line parameter estimates with what is physiologically expected, even though this
model presented a little larger estimation error than the Mead’s Model.
Rajagiri et al. (47) presented a similar study but analyzed the performance of the same models in
Australian children data, 168 children 2 to 8 years old diagnosed with asthma, and 193 children with the
same age range with no known respiratory disease. DuBois’ model produced the least estimation error,
and the aRIC model ranked in the middle in terms of magnitude of modeling error for this data.
However, similarly to previous studies, DuBois’ and Mead’s models produced unrealistically large
values for lung compliance (Cl), chest wall compliance (Cw), and tissue compliance (Ct).
Rajagiri et al. (45) did a similar study analyzing 156 tests of children with asthma and 173 tests
of healthy children, comparing the same models as their previous study [42]. The aRIC model again
ranked in the middle of the other analyzed models, while DuBois’ model showed the best fit, but Mead’s
and DuBois’ models again produced unrealistic values for Cl and Cw and Ct. Their results suggested that
the capacitance parameter (Cp) of the aRIC model provides good discrimination between these two
groups, and they affirmed that this finding corresponded well with asthma physiology.
Nguyen T-U et al. (49) (50) presented two new respiratory system models: the Mead-Cw and the
Mead-Cl, which are intermediate in complexity between the Mead’s model and the aRIC model. These
two models were compared with the RIC, eRIC, aRIC and Mead’s models. IOS data from 5 adults
diagnosed with COPD and 8 normal adults were used. They showed that these two new models
produced lower errors than all other models, except for the Mead’s model. However, these two models
also showed unrealistic values for Cw and Cl. Therefore, this study concluded that the aRIC model seems
to be the most useful respiratory model for IOS-based computer aided detection and diagnosis of lung
pathologies.
All these research studies (summarized in Table 4.1) confirm that the eRIC and aRIC models are
two respiratory models that offer advantages over other well-known respiratory models to be used in
assessment and treatment of asthma or other respiratory diseases. Consequently, this research aims to
quantitatively evaluate the performance of the eRIC and aRIC models in Normal, PSAI, SAI and
Asthmatic Anglo and Hispanic children 5 to 19 years old.
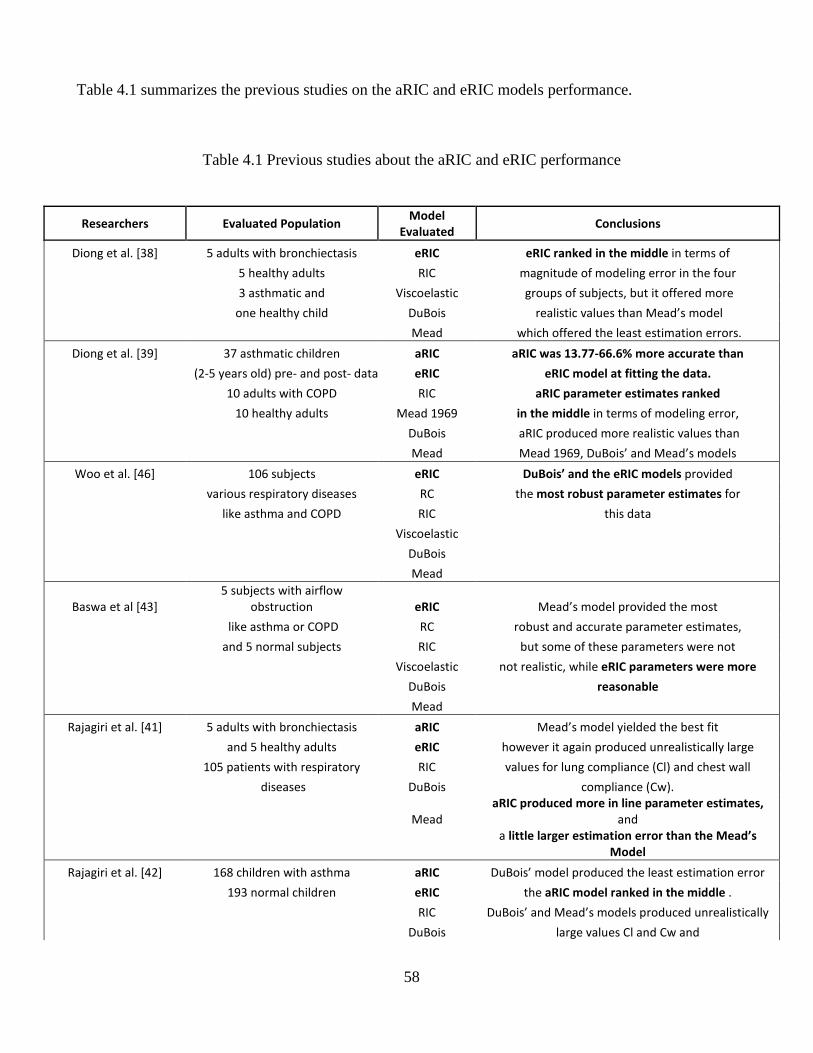
58
Table 4.1 summarizes the previous studies on the aRIC and eRIC models performance.
Table 4.1 Previous studies about the aRIC and eRIC performance
Researchers Evaluated Population
Model
Evaluated Conclusions
Diong et al. [38] 5 adults with bronchiectasis eRIC eRIC ranked in the middle in terms of
5 healthy adults RIC magnitude of modeling error in the four
3 asthmatic and Viscoelastic groups of subjects, but it offered more
one healthy child DuBois realistic values than Mead’s model
Mead which offered the least estimation errors.
Diong et al. [39] 37 asthmatic children aRIC aRIC was 13.77-66.6% more accurate than
(2-5 years old) pre- and post- data eRIC eRIC model at fitting the data.
10 adults with COPD RIC aRIC parameter estimates ranked
10 healthy adults Mead 1969 in the middle in terms of modeling error,
DuBois aRIC produced more realistic values than
Mead Mead 1969, DuBois’ and Mead’s models
Woo et al. [46] 106 subjects eRIC DuBois’ and the eRIC models provided
various respiratory diseases RC the most robust parameter estimates for
like asthma and COPD RIC this data
Viscoelastic
DuBois
Mead
Baswa et al [43]
5 subjects with airflow
obstruction eRIC Mead’s model provided the most
like asthma or COPD RC robust and accurate parameter estimates,
and 5 normal subjects RIC but some of these parameters were not
Viscoelastic not realistic, while eRIC parameters were more
DuBois reasonable
Mead
Rajagiri et al. [41] 5 adults with bronchiectasis aRIC Mead’s model yielded the best fit
and 5 healthy adults eRIC however it again produced unrealistically large
105 patients with respiratory RIC values for lung compliance (Cl) and chest wall
diseases DuBois compliance (Cw).
Mead
aRIC produced more in line parameter estimates,
and
a little larger estimation error than the Mead’s
Model
Rajagiri et al. [42] 168 children with asthma aRIC DuBois’ model produced the least estimation error
193 normal children eRIC the aRIC model ranked in the middle .
RIC DuBois’ and Mead’s models produced unrealistically
DuBois large values Cl and Cw and
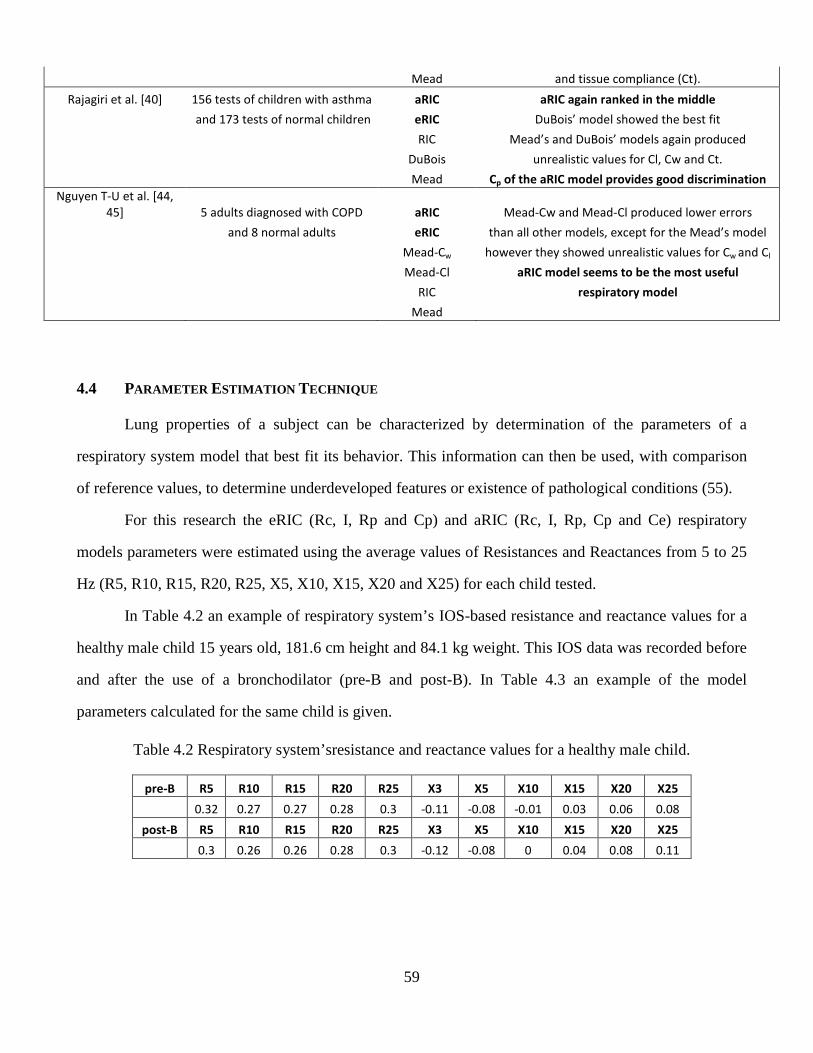
59
Mead and tissue compliance (Ct).
Rajagiri et al. [40] 156 tests of children with asthma aRIC aRIC again ranked in the middle
and 173 tests of normal children eRIC DuBois’ model showed the best fit
RIC Mead’s and DuBois’ models again produced
DuBois unrealistic values for Cl, Cw and Ct.
Mead Cp of the aRIC model provides good discrimination
Nguyen T-U et al. [44,
45] 5 adults diagnosed with COPD aRIC Mead-Cw and Mead-Cl produced lower errors
and 8 normal adults eRIC than all other models, except for the Mead’s model
Mead-Cw however they showed unrealistic values for Cw and Cl
Mead-Cl aRIC model seems to be the most useful
RIC respiratory model
Mead
4.4 PARAMETER ESTIMATION TECHNIQUE
Lung properties of a subject can be characterized by determination of the parameters of a
respiratory system model that best fit its behavior. This information can then be used, with comparison
of reference values, to determine underdeveloped features or existence of pathological conditions (55).
For this research the eRIC (Rc, I, Rp and Cp) and aRIC (Rc, I, Rp, Cp and Ce) respiratory
models parameters were estimated using the average values of Resistances and Reactances from 5 to 25
Hz (R5, R10, R15, R20, R25, X5, X10, X15, X20 and X25) for each child tested.
In Table 4.2 an example of respiratory system’s IOS-based resistance and reactance values for a
healthy male child 15 years old, 181.6 cm height and 84.1 kg weight. This IOS data was recorded before
and after the use of a bronchodilator (pre-B and post-B). In Table 4.3 an example of the model
parameters calculated for the same child is given.
Table 4.2 Respiratory system’sresistance and reactance values for a healthy male child.
pre-B R5 R10 R15 R20 R25 X3 X5 X10 X15 X20 X25
0.32 0.27 0.27 0.28 0.3 -0.11 -0.08 -0.01 0.03 0.06 0.08
post-B R5 R10 R15 R20 R25 X3 X5 X10 X15 X20 X25
0.3 0.26 0.26 0.28 0.3 -0.12 -0.08 0 0.04 0.08 0.11
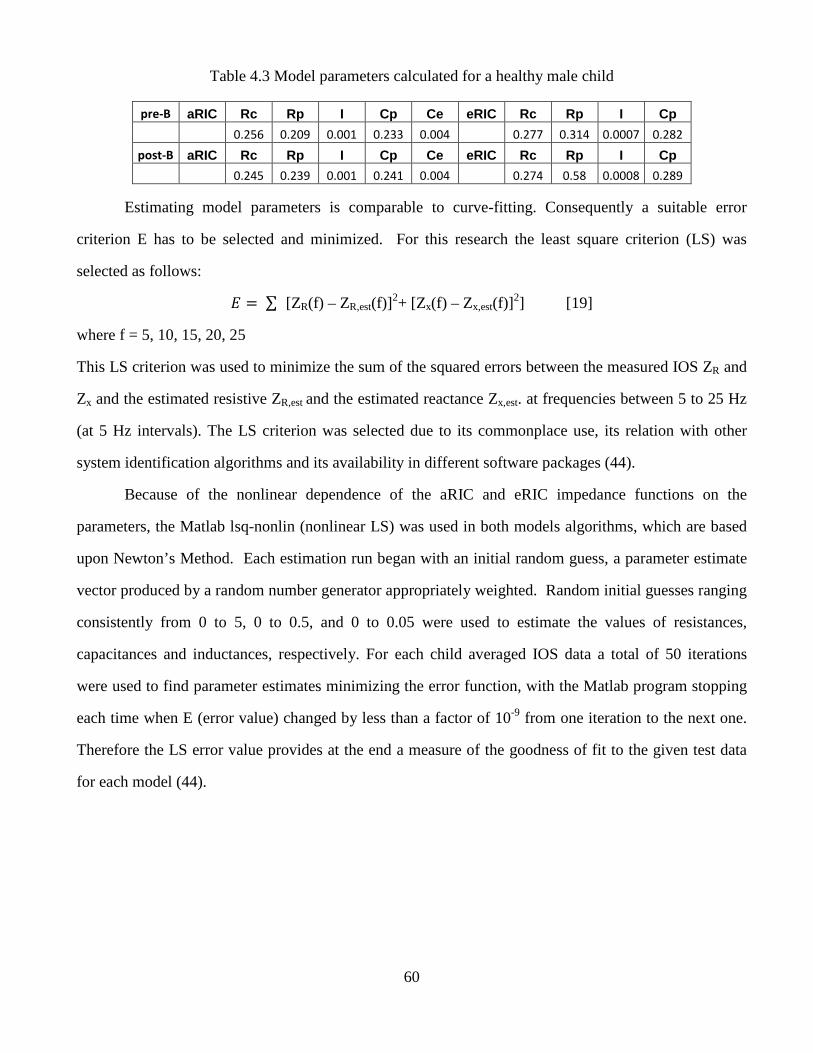
60
Table 4.3 Model parameters calculated for a healthy male child
pre-B aRIC Rc Rp I Cp Ce eRIC Rc Rp I Cp
0.256 0.209 0.001 0.233 0.004 0.277 0.314 0.0007 0.282
post-B aRIC Rc Rp I Cp Ce eRIC Rc Rp I Cp
0.245 0.239 0.001 0.241 0.004 0.274 0.58 0.0008 0.289
Estimating model parameters is comparable to curve-fitting. Consequently a suitable error
criterion E has to be selected and minimized. For this research the least square criterion (LS) was
selected as follows:
� � ∑ [ZR(f) – ZR,est(f)]
2+ [Zx(f) – Zx,est(f)]2] [19]
where f = 5, 10, 15, 20, 25
This LS criterion was used to minimize the sum of the squared errors between the measured IOS ZR and
Zx and the estimated resistive ZR,est and the estimated reactance Zx,est. at frequencies between 5 to 25 Hz
(at 5 Hz intervals). The LS criterion was selected due to its commonplace use, its relation with other
system identification algorithms and its availability in different software packages (44).
Because of the nonlinear dependence of the aRIC and eRIC impedance functions on the
parameters, the Matlab lsq-nonlin (nonlinear LS) was used in both models algorithms, which are based
upon Newton’s Method. Each estimation run began with an initial random guess, a parameter estimate
vector produced by a random number generator appropriately weighted. Random initial guesses ranging
consistently from 0 to 5, 0 to 0.5, and 0 to 0.05 were used to estimate the values of resistances,
capacitances and inductances, respectively. For each child averaged IOS data a total of 50 iterations
were used to find parameter estimates minimizing the error function, with the Matlab program stopping
each time when E (error value) changed by less than a factor of 10-9 from one iteration to the next one.
Therefore the LS error value provides at the end a measure of the goodness of fit to the given test data
for each model (44).
61
Chapter 5: Methods
5.1 INTRODUCTION
This chapter provides an explanation of the methodology of this research project was designed,
the statistical analysis used, the selection of subjects (children) recruited for this research, as well as how
every IOS was used to acquire high quality respiratory impedance data.
5.2 RESEARCH METHOD DESIGN AND STATISTICAL ANALYSIS
This study was developed to perform IOS pulmonary function testing in Anglo and Hispanic
children 5-19 years old living in the El Paso, Texas area. The data were collected at Western Sky
Medical Research clinic and in a Health Fair held in a Socorro District school. The IOS data collected
for this research were analyzed by our expert clinician and classified into four categories: Normal,
Probable Small Airway Impairment (PSAI), Small Airway Impairment (SAI) and Asthma.
The data were collected in 2006 and 2008. The data collected in 2006 were pre-bronchodilation
data, and the data collected in 2008 were pre- and post-bronchodilation data. 112 children were tested in
2006 and 47 children in 2008, 26 of these children were tested in both years. Three to five IOS test
replicates were performed on each subject to ensure reproducible tests without artifacts caused by air
leaks, swallowing, breath holding or vocalization. IOS data were carefully reviewed off line and quality-
assured by our expert clinician to reject segments affected by airflow leak or swallowing artifacts. A
Jaeger MasterScreen IOS (Viasys Healthcare, Inc. Yorba Linda, CA, and USA) was used in this study.
The system was calibrated every day before data collection using a 3-L syringe for volume calibrations
and a reference resistance (0.2 KPa/L/s) for pressure calibrations. Children were asked to wear a nose
clip, while breathing normally through a mouthpiece and were instructed to tightly close their lips
around it to avoid air leakage. Children tested using a bronchodilation medicine, called Levalbuterol
(Xopenex), were tested like previously described for pre bronchodilation, performing 3 to 5 IOS tests.
Then the medicine (Xopenex) was given to the children using a nebulizer for 6 minutes and after it the
children were asked to rest for 10 minutes; and finally after this waiting period the children were again
tested recording 3 to 5 IOS tests (post-bronchodilation tests).
62
This research study was supported in part by NIH grant #1 S11 ES013339-01 A1: UTEP-UNM
HSC ARCH Program on Border Asthma. The ARCH program provided a questionnaire about asthma
or allergy symptoms to be filled out and signed by participating children parents.
Statistical analyses of IOS measured and calculated parameters as well as the eRIC and aRIC
model parameters between pre- and post-bronchodilation data were made using t-distribution
(Differences of Means) test and statistical significance will be established at p<0.05 level.
5.3 HUMAN SUBJECT INTERACTIONS
1. Sources of Participants
Medical staff of the Western Sky Medical Research clinic were in charge of contacting the
children’ participating children’s parents and making appointments for lung function testing IOS
and data collection. Some of the 2006 IOS data were collected from children attending the
Socorro High School Health Fair who wished to participate in our research study.
2. Procedure for Obtaining Informed Consent
An informed consent form was given to every parent and child providing them with a detailed
description of the study. The parents or children over 18 were asked to sign the consent form if
they agreed to participate in this study.
5.4 IOS TESTS PROCEDURE
The following is a detailed explanation about how IOS testing was performed for this research:
a. Turn on the computer and double-click the LAB Jaeger Lab Manager Icon and you will
be placed in the initial (start up) IOS screen. Wait 5 minutes to allow the system to warm
up. You will automatically be placed into the main screen.
b. Look at the bottom of the main screen and you will find several tabs: Main group, Data
Base, Calibrations, Generation, and Utilities.
63
c. The first thing you need to do is the Calibration of the equipment, double click the
Calibration tab and do the required Volume and Pressure Calibrations, these calibrations
have to be done every day before using the IOS equipment. A detailed explanation of
how to perform these calibrations is presented in appendix A.
d. Then go back to the main screen and go to Patient data screen and enter the personal data
of the subject you want to test: first and last name, identification number, date of birth,
sex, height and weight. If you are testing a child already tested, just enter the patient’s
last name and tap the enter key tree times to find his/her information.
e. Click F10 to go back to the main IOS screen. Check that the first and last names of the
patient you are testing are on the top of the main IOS screen.
f. Tell the subject that you are going to test his/her normal breathing through his/her mouth,
and in order to do this you need them to wear a nose clip to close their nostrils.
Emphasize that it is extremely important that all his/her breathing air goes through his/her
mouth and the nose must be completely occluded with the nose clip to avoid air leakage
and mistakes in the measurement.
g. For the purpose of this project the children tested were from 5-19 years old. There are
two different mouthpieces sizes. Use the appropriate according to the age and mouth size
of the child.
h. If you are using the small mouth piece, ask the child to put his/her tongue underneath the
mouthpiece to keep it out of the air flow. After this, ask them to tightly close his/her
mouth around the mouthpiece, double-check that their mouths be sealed around the
mouthpieces (no air leakage). It is a big help if you put a mouthpiece in your mouth and
show the children how to place it.
i. If the child is using the big mouthpiece, ask the child to put the tip of his/her tongue
under the tongue depressor to keep it out of the way. Ask the child to bite the two bite
blocks of the mouthpiece and ask them to place the flange between his/her gums and lips,
the flange should be inside his/her lips but outside teeth. Double-check that their mouths
64
be sealed around the mouthpieces (no air leakage). It is a big help if you put a
mouthpiece in your mouth and show the children how to place it.
j. Ask the child to sit comfortably, but ask them to have a straight back and neck, hands and
arms under his/her tights (uncrossed), straight legs (uncrossed), feet on the floor (if they
can reach the floor) and ask them not to move during the test. Verify the correct position
of the children.
k. Tell the child you are going to do around 4 or 5 tests that last around 20 seconds each.
This way you ensure you will have at least 3 good tests and the child knows what to
expect. For a small child, it helps if you actually count the seconds out loud during the
test, to help them to be calm and wait until you reach the number 20.
l. If you are doing the test in a house ask the mother or father to allow you to place the
equipment in front of the television. The television will occupy the attention of the
children and help them to relax and focus on the television program they choose; this way
they will breathe normally without paying attention to it; which is the way we normally
breathe.
m. If you are doing a test in a clinic or set environment without television, ask the child to
close his/her eyes and think about something they really like during the test (20 or 30
seconds).
n. Place a new filter to the 45 degrees angle tube and connect the mouthpiece chosen for the
child at the end of the filter using a plastic glove and ensure the attachments be airtight.
Put the mouthpiece in front of the child and support arm of the equipment (with the filter
and mouthpiece on it).
o. Ask the child to place the mouthpiece in her/his mouth and check his/her correct position
(back and neck straight). Do the appropriate movements to obtain the position required.
Once you finish placing the child in the optimal position, ask him/her to get the
mouthpiece out of his/her mouth.
65
p. Move the support arm of the equipment away from the child face prior to the first 5
seconds to allow the equipment to realize the zero adjustment.
q. It is convenient to hide the IOS screen from the child to avoid distractions or intentional
changes in children breathing to obtain good tests results.
r. Double click on Impulse Oscillometry Icon to begin the IOS test, and you will see a
dialog box asking you not to approach the mouthpiece to do the zero adjustment.
s. Ask the child to feel the popping through the mouth piece with his/her hand for few
seconds, and let him/her know he/she will feel this popping while he/she breathes during
the test but it will not cause any harm or pain.
t. Ask the child to place the mouthpiece and nose clip in his/her mouth and nose to begin
the test.
u. Through the test duration look at the child’s face and verify tight closure of the lips
around the mouthpiece and correct position of the nose clip. Ask the child to focus on the
TV program or in thinking about something they really like with closed eyes (in case you
do not have a TV in front of the children). This way, they will forget about breathing and
begin to breathe normally.
v. Wait a few seconds until you see repeatable breathing cycles on the IOS screen
(breathing stabilization). After this, click icon 2 to begin test recording.
w. Record the test for 20 seconds for small children and for 30 to 40 seconds for older
children and then terminate the test by clicking icon 7.
x. In the volume tracing you should see breaths of comparable size. If you see an abrupt
increase in Z5 during the test it may indicate a swallow. Ask the children to avoid
swallowing if possible during the test, and before each test ask them to swallow several
times to avoid swallowing during the test.
y. Verify the Coherence graph in the left bottom window for quality assurance, coherence
should be 0.7 to 0.8 at 5 Hz and rise to 0.9 on 10Hz, and then progressively increase to
66
1.0 at higher frequencies. If you forget to ask the child to use the nose clip or if there is
an air leakage from the children mouths, you will see an artificial increase in Coherence.
z. In the top left window you will see a Resistance graph (R vs. frequency), “for healthy
adults or older children R line should remain nearly constant during all oscillation
frequencies”.
aa. In the middle left window, Reactance graph (X), you will observe a diagram of X vs.
frequency. “The X tracing for healthy adults or older children ought to start slightly
below zero at the left of the graph, and increase crossing zero at 7-12 Hz”.
bb. You can visualize the values measured (numbers) for R, X, AX, Fres and Coherence at the
top right window.
cc. Check the test for airflow leak pressing icon 4; this will bring you up a “save
measurement” dialog box. Ensure that new test have a black dot on the left, and save
primary data and check default small boxes (this is extremely important to save the
data). Click on Yes to save the test data. This will show you the test directory which
tells you how many tests you have done on the child you are testing. Highlight the last
test and click ok. This will bring you up the raw data; amplify a small portion
(containing at least one inhalation and one expiration) of the volume blue trace by placing
the mouse in a point, holding the left mouse and moving the cursor to a second point, and
check for corrugations. Airflow leak is manifest when the corrugations appear during
inspiration, near end-inspiration and during early expiration.
dd. Repeat the IOS test 4 or 5 more times, to make sure you get at least tree good tests, and
save each test as a “new test”.
A detailed explanation about archiving IOS data, how to define where the data is being saved in
the computer, how to back up the IOS data recorded to be transfer to another computer, or to simply do a
back up on a USB, can be found in appendix A.
67
Chapter 6: Results and Discussions
6.1 INTRODUCTION
In this chapter the obtained results in this research will be presented and discussed on detail.
Every result will be related to its specific hypothesis. First the results obtained from the analysis of the
Pre-B data recorded in 2006 will be presented in relation to hypothesis 1:“Base line IOS values of
Resistance, Reactance, Fres or AX and IOS calculated values as R3-R20 and R5-R20 predict changes
after bronchodilation in Normal, PSAI, SAI, and Asthmatic children”; and then results of analysis of the
Pre- and Post-B data recorded in 2008 related to hypothesis 2 will be presented: “The eRIC and aRIC
models of lung function based on IOS measurements yield estimates of lung resistance and compliance
that can quantify respiratory mechanics to discriminate between normal, PSAI, SAI and asthmatic
children”.
Finally the results associated with hypothesis 3 will be presented: “The expected growth-related
improvement in IOS and the eRIC/aRIC parameter estimates will be greater in Normal/PSAI children
than in SAI/Asthmatic children”.
Also in this section a detailed explanation will be given on how the goals and proposed work of
this research were addressed.
Goals of the project are:
Create a database of Normal, PSAI, SAI, and Asthma IOS impedance values (judged by
physiologist) and the eRIC and aRIC model values for baseline and post-bronchodilation
conditions.
Determine statistical significance of differences between pre- and post- bronchodilation IOS
data for all IOS parameters as well as the eRIC and aRIC model parameters for Normal,
PSAI, SAI and children with asthma.
Evaluate the performance of the IOS and the eRIC/aRIC model parameters in evaluating lung
function over time (two years periods).
Evaluate statistical correlation between different IOS and model parameters.
68
Compare the performance of the eRIC/aRICmodel-derived parameters calculated from IOS
data over 5 - 35 Hz and 3 – 25Hz.
For this research the following work was proposed (Proposed Work):
A database of Normal, PSAI, SAI, and Asthma IOS impedance values (judged by
physiologist) and the eRIC and aRIC model values for baseline and post-bronchodilation
conditions will be created for the 112 children tested under pre-bronchodilation conditions
and for the 47 children tested under pre and post bronchodilation conditions.
Statistical significance of differences between pre- and post- bronchodilation IOS data for all
IOS parameters Resistances and Reactances from 3 to 25 Hz, Fres, AX and the eRIC and
aRIC model parameters for Normal, PSAI, SAI and Asthmatic children will be determined.
The performance of the IOS and models parameters in evaluating lung function over time
(two years period) will be evaluated in 26 children tested in both years (2006 and 2008).
Statistical correlation between different IOS and model parameters will be evaluated.
A comparison of the performance of model-derived parameters calculated from IOS data
over 5 - 35 Hz and 3 – 25 Hz will be performed.
6.2 RESULTS AND DISCUSSIONS FROM HYPOTHESES 1, 2
Hypothesis 1
“Baseline IOS values of Resistance, Reactance, Fres or AX and IOS calculated
values as R3-R20 and R5-R20 predict changes after bronchodilation in normal, PSAI, SAI,
and Asthmatic children”.
Hypothesis 2
“The eRIC and aRIC models of lung function based on IOS measurements yield
estimates of lung resistance and compliance that can quantify respiratory mechanics to
discriminate between Normal, PSAI, SAI and asthmatic children”.
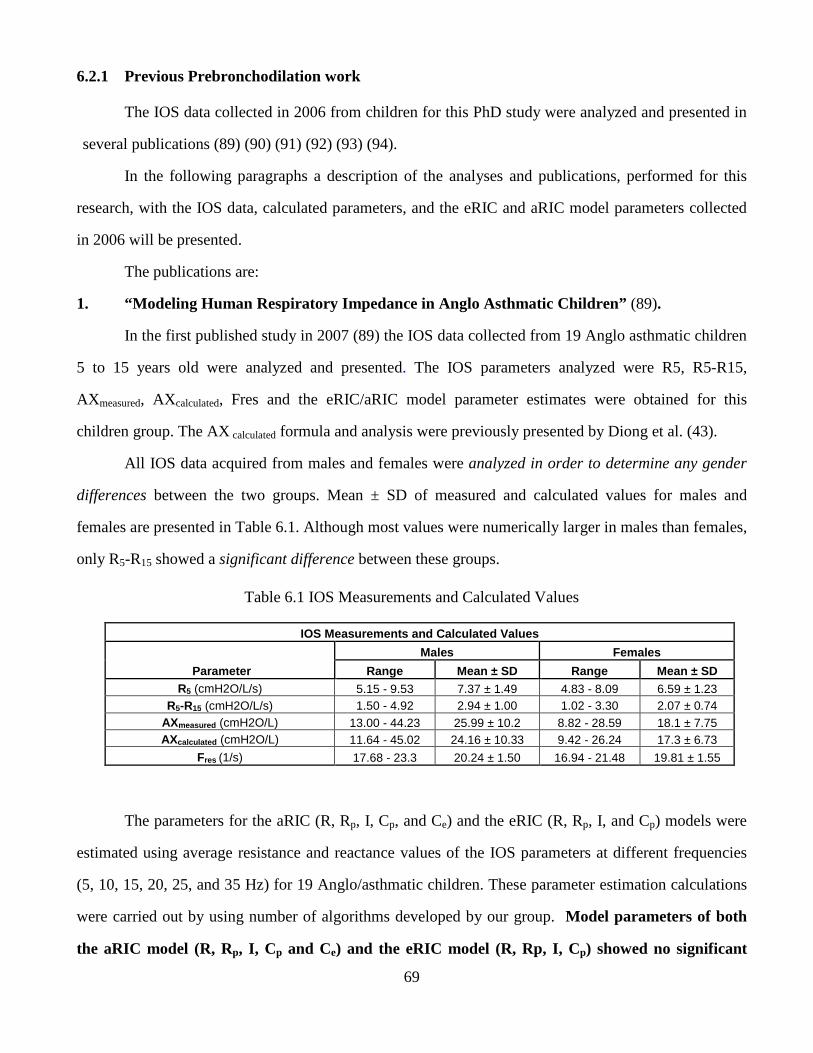
69
6.2.1 Previous Prebronchodilation work
The IOS data collected in 2006 from children for this PhD study were analyzed and presented in
several publications (89) (90) (91) (92) (93) (94).
In the following paragraphs a description of the analyses and publications, performed for this
research, with the IOS data, calculated parameters, and the eRIC and aRIC model parameters collected
in 2006 will be presented.
The publications are:
1. “Modeling Human Respiratory Impedance in Anglo Asthmatic Children” (89).
In the first published study in 2007 (89) the IOS data collected from 19 Anglo asthmatic children
5 to 15 years old were analyzed and presented. The IOS parameters analyzed were R5, R5-R15,
AXmeasured, AXcalculated, Fres and the eRIC/aRIC model parameter estimates were obtained for this
children group. The AX calculated formula and analysis were previously presented by Diong et al. (43).
All IOS data acquired from males and females were analyzed in order to determine any gender
differences between the two groups. Mean ± SD of measured and calculated values for males and
females are presented in Table 6.1. Although most values were numerically larger in males than females,
only R5-R15 showed a significant difference between these groups.
Table 6.1 IOS Measurements and Calculated Values
IOS Measurements and Calculated Values
Parameter
Males Females
Range Mean ± SD Range Mean ± SD R5 (cmH2O/L/s) 5.15 - 9.53 7.37 ± 1.49 4.83 - 8.09 6.59 ± 1.23
R5-R15 (cmH2O/L/s) 1.50 - 4.92 2.94 ± 1.00 1.02 - 3.30 2.07 ± 0.74 AXmeasured (cmH2O/L) 13.00 - 44.23 25.99 ± 10.2 8.82 - 28.59 18.1 ± 7.75 AXcalculated (cmH2O/L) 11.64 - 45.02 24.16 ± 10.33 9.42 - 26.24 17.3 ± 6.73
Fres (1/s) 17.68 - 23.3 20.24 ± 1.50 16.94 - 21.48 19.81 ± 1.55
The parameters for the aRIC (R, Rp, I, Cp, and Ce) and the eRIC (R, Rp, I, and Cp) models were
estimated using average resistance and reactance values of the IOS parameters at different frequencies
(5, 10, 15, 20, 25, and 35 Hz) for 19 Anglo/asthmatic children. These parameter estimation calculations
were carried out by using number of algorithms developed by our group. Model parameters of both
the aRIC model (R, Rp, I, Cp and Ce) and the eRIC model (R, Rp, I, Cp) showed no significant
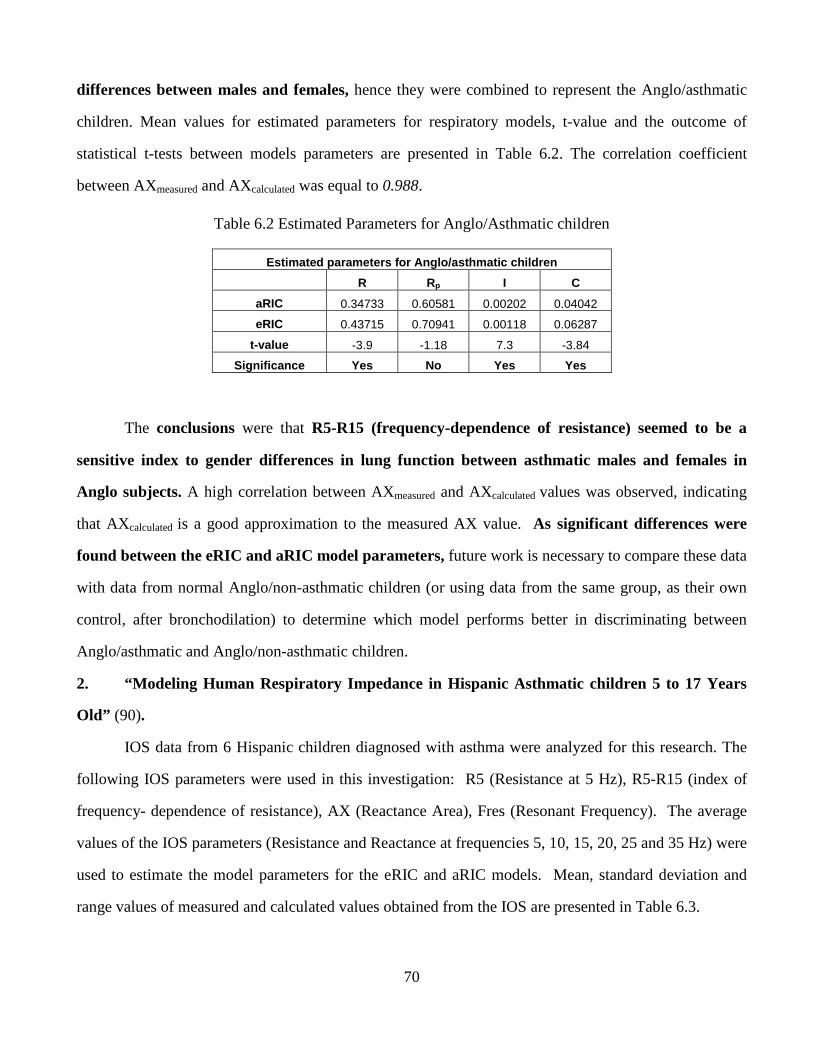
70
differences between males and females, hence they were combined to represent the Anglo/asthmatic
children. Mean values for estimated parameters for respiratory models, t-value and the outcome of
statistical t-tests between models parameters are presented in Table 6.2. The correlation coefficient
between AXmeasured and AXcalculated was equal to 0.988.
Table 6.2 Estimated Parameters for Anglo/Asthmatic children
Estimated parameters for Anglo/asthmatic children
R Rp I C
aRIC 0.34733 0.60581 0.00202 0.04042
eRIC 0.43715 0.70941 0.00118 0.06287
t-value -3.9 -1.18 7.3 -3.84
Significance Yes No Yes Yes
The conclusions were that R5-R15 (frequency-dependence of resistance) seemed to be a
sensitive index to gender differences in lung function between asthmatic males and females in
Anglo subjects. A high correlation between AXmeasured and AXcalculated values was observed, indicating
that AXcalculated is a good approximation to the measured AX value. As significant differences were
found between the eRIC and aRIC model parameters, future work is necessary to compare these data
with data from normal Anglo/non-asthmatic children (or using data from the same group, as their own
control, after bronchodilation) to determine which model performs better in discriminating between
Anglo/asthmatic and Anglo/non-asthmatic children.
2. “Modeling Human Respiratory Impedance in Hispanic Asthmatic children 5 to 17 Years
Old” (90).
IOS data from 6 Hispanic children diagnosed with asthma were analyzed for this research. The
following IOS parameters were used in this investigation: R5 (Resistance at 5 Hz), R5-R15 (index of
frequency- dependence of resistance), AX (Reactance Area), Fres (Resonant Frequency). The average
values of the IOS parameters (Resistance and Reactance at frequencies 5, 10, 15, 20, 25 and 35 Hz) were
used to estimate the model parameters for the eRIC and aRIC models. Mean, standard deviation and
range values of measured and calculated values obtained from the IOS are presented in Table 6.3.
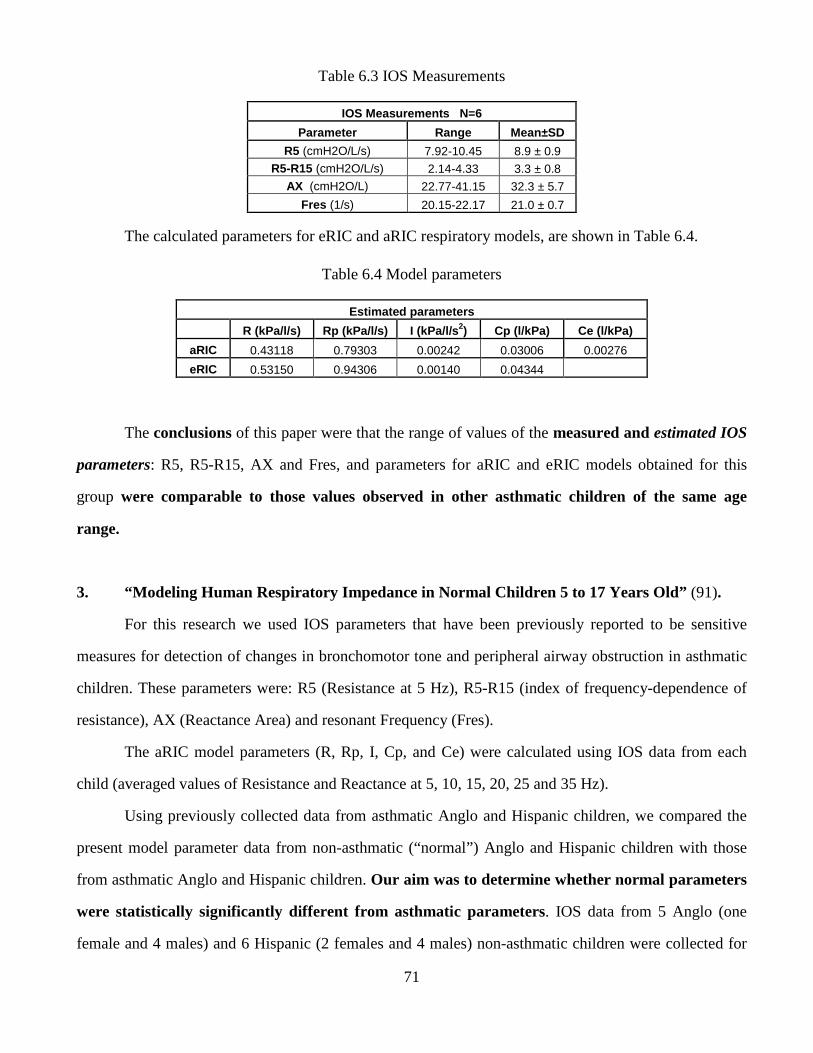
71
Table 6.3 IOS Measurements
IOS Measurements N=6
Parameter Range Mean±SD
R5 (cmH2O/L/s) 7.92-10.45 8.9 ± 0.9 R5-R15 (cmH2O/L/s) 2.14-4.33 3.3 ± 0.8
AX (cmH2O/L) 22.77-41.15 32.3 ± 5.7
Fres (1/s) 20.15-22.17 21.0 ± 0.7
The calculated parameters for eRIC and aRIC respiratory models, are shown in Table 6.4.
Table 6.4 Model parameters
Estimated parameters
R (kPa/l/s) Rp (kPa/l/s) I (kPa/l/s 2) Cp (l/kPa) Ce (l/kPa)
aRIC 0.43118 0.79303 0.00242 0.03006 0.00276
eRIC 0.53150 0.94306 0.00140 0.04344
The conclusions of this paper were that the range of values of the measured and estimated IOS
parameters: R5, R5-R15, AX and Fres, and parameters for aRIC and eRIC models obtained for this
group were comparable to those values observed in other asthmatic children of the same age
range.
3. “Modeling Human Respiratory Impedance in Normal Children 5 to 17 Years Old” (91).
For this research we used IOS parameters that have been previously reported to be sensitive
measures for detection of changes in bronchomotor tone and peripheral airway obstruction in asthmatic
children. These parameters were: R5 (Resistance at 5 Hz), R5-R15 (index of frequency-dependence of
resistance), AX (Reactance Area) and resonant Frequency (Fres).
The aRIC model parameters (R, Rp, I, Cp, and Ce) were calculated using IOS data from each
child (averaged values of Resistance and Reactance at 5, 10, 15, 20, 25 and 35 Hz).
Using previously collected data from asthmatic Anglo and Hispanic children, we compared the
present model parameter data from non-asthmatic (“normal”) Anglo and Hispanic children with those
from asthmatic Anglo and Hispanic children. Our aim was to determine whether normal parameters
were statistically significantly different from asthmatic parameters. IOS data from 5 Anglo (one
female and 4 males) and 6 Hispanic (2 females and 4 males) non-asthmatic children were collected for
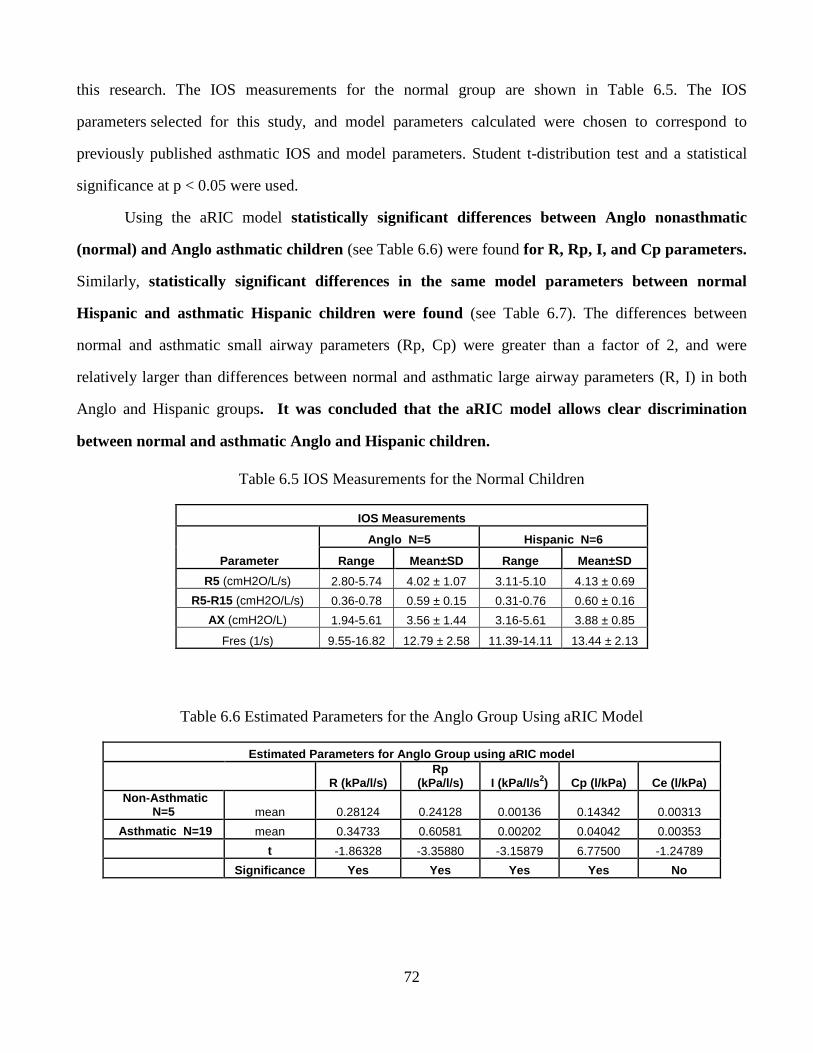
72
this research. The IOS measurements for the normal group are shown in Table 6.5. The IOS
parameters selected for this study, and model parameters calculated were chosen to correspond to
previously published asthmatic IOS and model parameters. Student t-distribution test and a statistical
significance at p < 0.05 were used.
Using the aRIC model statistically significant differences between Anglo nonasthmatic
(normal) and Anglo asthmatic children (see Table 6.6) were found for R, Rp, I, and Cp parameters.
Similarly, statistically significant differences in the same model parameters between normal
Hispanic and asthmatic Hispanic children were found (see Table 6.7). The differences between
normal and asthmatic small airway parameters (Rp, Cp) were greater than a factor of 2, and were
relatively larger than differences between normal and asthmatic large airway parameters (R, I) in both
Anglo and Hispanic groups. It was concluded that the aRIC model allows clear discrimination
between normal and asthmatic Anglo and Hispanic children.
Table 6.5 IOS Measurements for the Normal Children
IOS Measurements
Parameter
Anglo N=5 Hispanic N=6
Range Mean±SD Range Mean±SD
R5 (cmH2O/L/s) 2.80-5.74 4.02 ± 1.07 3.11-5.10 4.13 ± 0.69
R5-R15 (cmH2O/L/s) 0.36-0.78 0.59 ± 0.15 0.31-0.76 0.60 ± 0.16
AX (cmH2O/L) 1.94-5.61 3.56 ± 1.44 3.16-5.61 3.88 ± 0.85
Fres (1/s) 9.55-16.82 12.79 ± 2.58 11.39-14.11 13.44 ± 2.13
Table 6.6 Estimated Parameters for the Anglo Group Using aRIC Model
Estimated Parameters for Anglo Group using aRIC mod el
R (kPa/l/s) Rp
(kPa/l/s) I (kPa/l/s 2) Cp (l/kPa) Ce (l/kPa) Non-Asthmatic
N=5 mean 0.28124 0.24128 0.00136 0.14342 0.00313
Asthmatic N=19 mean 0.34733 0.60581 0.00202 0.04042 0.00353
t -1.86328 -3.35880 -3.15879 6.77500 -1.24789
Significance Yes Yes Yes Yes No
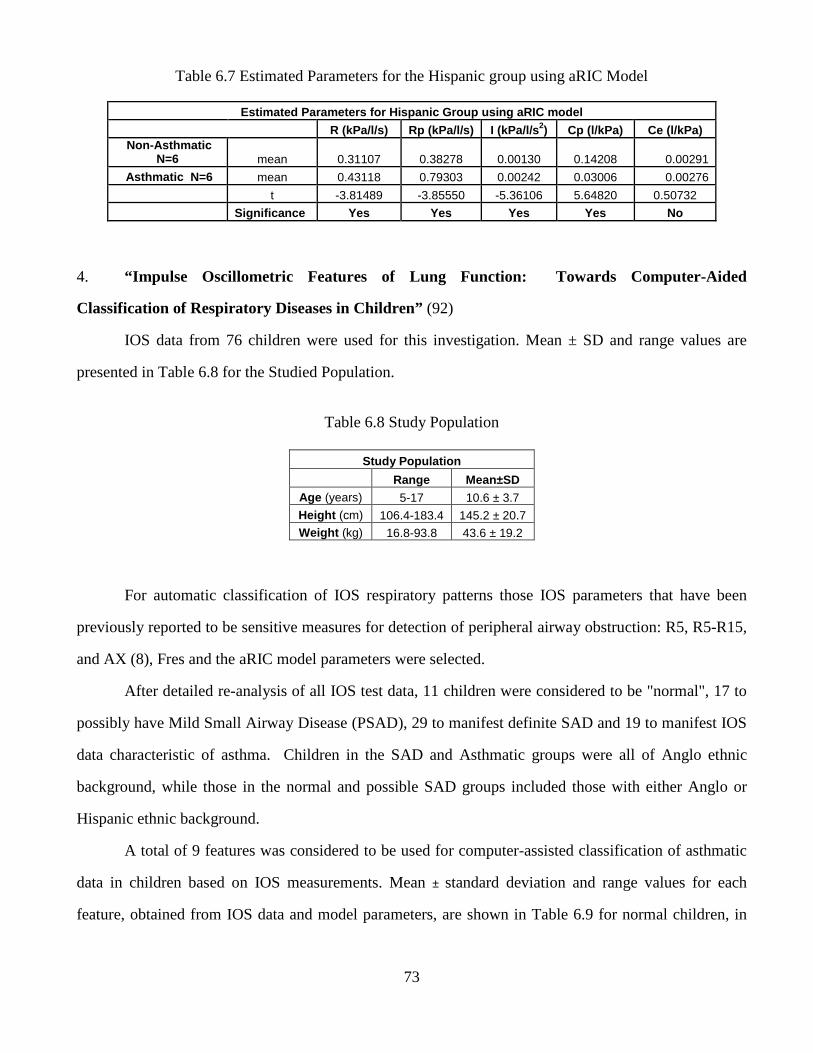
73
Table 6.7 Estimated Parameters for the Hispanic group using aRIC Model
Estimated Parameters for Hispanic Group using aRIC model
R (kPa/l/s) Rp (kPa/l/s) I (kPa/l/s 2) Cp (l/kPa) Ce (l/kPa) Non-Asthmatic
N=6 mean 0.31107 0.38278 0.00130 0.14208 0.00291
Asthmatic N=6 mean 0.43118 0.79303 0.00242 0.03006 0.00276
t -3.81489 -3.85550 -5.36106 5.64820 0.50732
Significance Yes Yes Yes Yes No
4. “Impulse Oscillometric Features of Lung Function: Towards Computer-Aided
Classification of Respiratory Diseases in Children” (92)
IOS data from 76 children were used for this investigation. Mean ± SD and range values are
presented in Table 6.8 for the Studied Population.
Table 6.8 Study Population
Study Population
Range Mean±SD Age (years) 5-17 10.6 ± 3.7
Height (cm) 106.4-183.4 145.2 ± 20.7 Weight (kg) 16.8-93.8 43.6 ± 19.2
For automatic classification of IOS respiratory patterns those IOS parameters that have been
previously reported to be sensitive measures for detection of peripheral airway obstruction: R5, R5-R15,
and AX (8), Fres and the aRIC model parameters were selected.
After detailed re-analysis of all IOS test data, 11 children were considered to be "normal", 17 to
possibly have Mild Small Airway Disease (PSAD), 29 to manifest definite SAD and 19 to manifest IOS
data characteristic of asthma. Children in the SAD and Asthmatic groups were all of Anglo ethnic
background, while those in the normal and possible SAD groups included those with either Anglo or
Hispanic ethnic background.
A total of 9 features was considered to be used for computer-assisted classification of asthmatic
data in children based on IOS measurements. Mean ± standard deviation and range values for each
feature, obtained from IOS data and model parameters, are shown in Table 6.9 for normal children, in
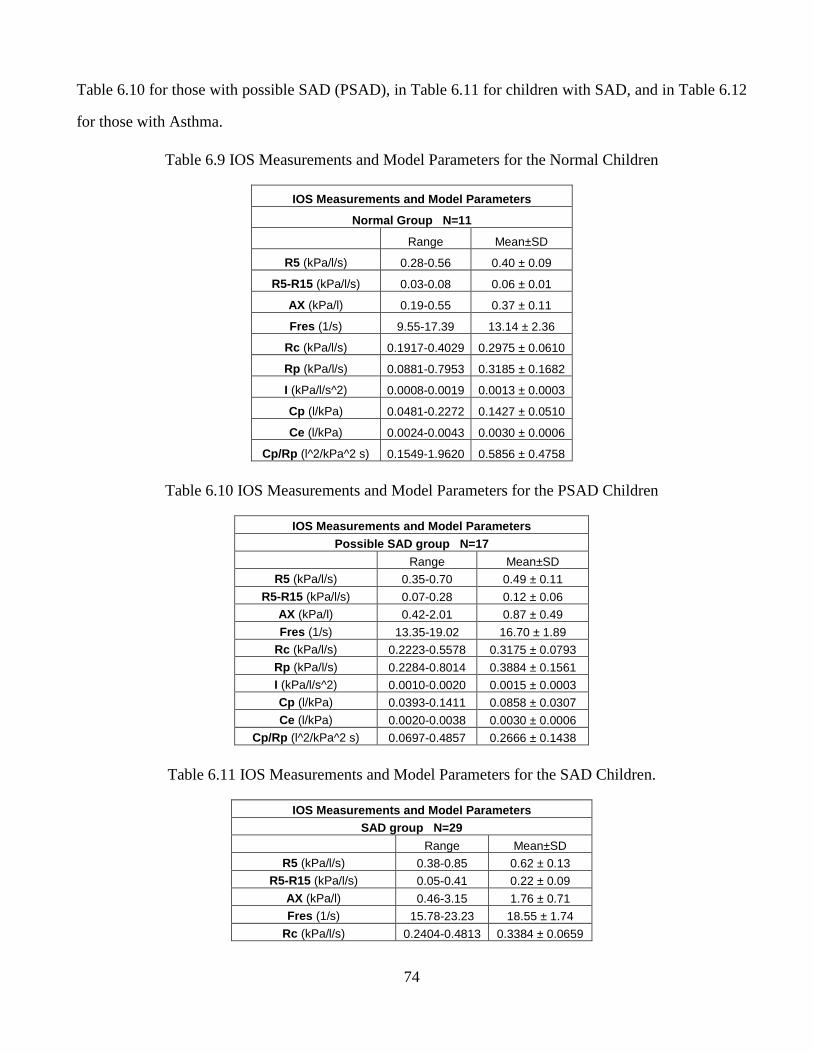
74
Table 6.10 for those with possible SAD (PSAD), in Table 6.11 for children with SAD, and in Table 6.12
for those with Asthma.
Table 6.9 IOS Measurements and Model Parameters for the Normal Children
IOS Measurements and Model Parameters
Normal Group N=11
Range Mean±SD
R5 (kPa/l/s) 0.28-0.56 0.40 ± 0.09
R5-R15 (kPa/l/s) 0.03-0.08 0.06 ± 0.01
AX (kPa/l) 0.19-0.55 0.37 ± 0.11
Fres (1/s) 9.55-17.39 13.14 ± 2.36
Rc (kPa/l/s) 0.1917-0.4029 0.2975 ± 0.0610
Rp (kPa/l/s) 0.0881-0.7953 0.3185 ± 0.1682
I (kPa/l/s^2) 0.0008-0.0019 0.0013 ± 0.0003
Cp (l/kPa) 0.0481-0.2272 0.1427 ± 0.0510
Ce (l/kPa) 0.0024-0.0043 0.0030 ± 0.0006
Cp/Rp (l^2/kPa^2 s) 0.1549-1.9620 0.5856 ± 0.4758
Table 6.10 IOS Measurements and Model Parameters for the PSAD Children
IOS Measurements and Model Parameters Possible SAD group N=17
Range Mean±SD R5 (kPa/l/s) 0.35-0.70 0.49 ± 0.11
R5-R15 (kPa/l/s) 0.07-0.28 0.12 ± 0.06 AX (kPa/l) 0.42-2.01 0.87 ± 0.49
Fres (1/s) 13.35-19.02 16.70 ± 1.89 Rc (kPa/l/s) 0.2223-0.5578 0.3175 ± 0.0793
Rp (kPa/l/s) 0.2284-0.8014 0.3884 ± 0.1561 I (kPa/l/s^2) 0.0010-0.0020 0.0015 ± 0.0003 Cp (l/kPa) 0.0393-0.1411 0.0858 ± 0.0307
Ce (l/kPa) 0.0020-0.0038 0.0030 ± 0.0006 Cp/Rp (l^2/kPa^2 s) 0.0697-0.4857 0.2666 ± 0.1438
Table 6.11 IOS Measurements and Model Parameters for the SAD Children.
IOS Measurements and Model Parameters SAD group N=29
Range Mean±SD R5 (kPa/l/s) 0.38-0.85 0.62 ± 0.13
R5-R15 (kPa/l/s) 0.05-0.41 0.22 ± 0.09
AX (kPa/l) 0.46-3.15 1.76 ± 0.71 Fres (1/s) 15.78-23.23 18.55 ± 1.74
Rc (kPa/l/s) 0.2404-0.4813 0.3384 ± 0.0659
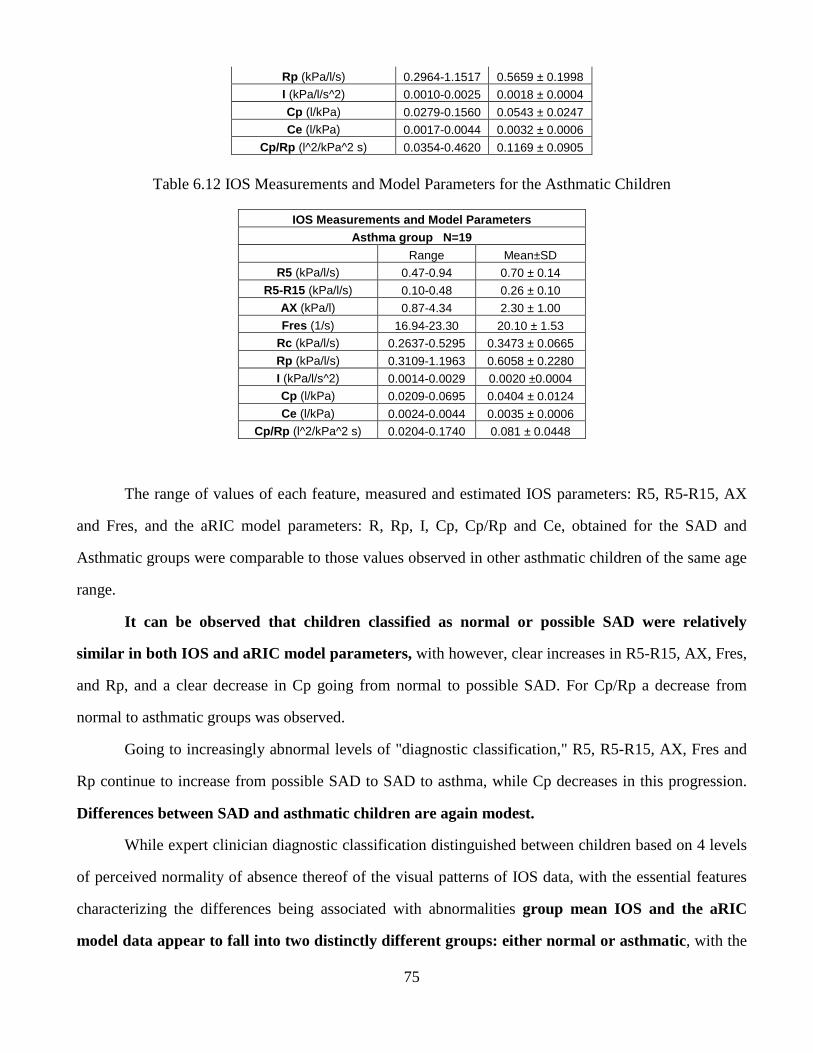
75
Rp (kPa/l/s) 0.2964-1.1517 0.5659 ± 0.1998 I (kPa/l/s^2) 0.0010-0.0025 0.0018 ± 0.0004
Cp (l/kPa) 0.0279-0.1560 0.0543 ± 0.0247 Ce (l/kPa) 0.0017-0.0044 0.0032 ± 0.0006
Cp/Rp (l^2/kPa^2 s) 0.0354-0.4620 0.1169 ± 0.0905
Table 6.12 IOS Measurements and Model Parameters for the Asthmatic Children
IOS Measurements and Model Parameters Asthma group N=19
Range Mean±SD R5 (kPa/l/s) 0.47-0.94 0.70 ± 0.14
R5-R15 (kPa/l/s) 0.10-0.48 0.26 ± 0.10 AX (kPa/l) 0.87-4.34 2.30 ± 1.00
Fres (1/s) 16.94-23.30 20.10 ± 1.53 Rc (kPa/l/s) 0.2637-0.5295 0.3473 ± 0.0665
Rp (kPa/l/s) 0.3109-1.1963 0.6058 ± 0.2280 I (kPa/l/s^2) 0.0014-0.0029 0.0020 ±0.0004 Cp (l/kPa) 0.0209-0.0695 0.0404 ± 0.0124
Ce (l/kPa) 0.0024-0.0044 0.0035 ± 0.0006 Cp/Rp (l^2/kPa^2 s) 0.0204-0.1740 0.081 ± 0.0448
The range of values of each feature, measured and estimated IOS parameters: R5, R5-R15, AX
and Fres, and the aRIC model parameters: R, Rp, I, Cp, Cp/Rp and Ce, obtained for the SAD and
Asthmatic groups were comparable to those values observed in other asthmatic children of the same age
range.
It can be observed that children classified as normal or possible SAD were relatively
similar in both IOS and aRIC model parameters, with however, clear increases in R5-R15, AX, Fres,
and Rp, and a clear decrease in Cp going from normal to possible SAD. For Cp/Rp a decrease from
normal to asthmatic groups was observed.
Going to increasingly abnormal levels of "diagnostic classification," R5, R5-R15, AX, Fres and
Rp continue to increase from possible SAD to SAD to asthma, while Cp decreases in this progression.
Differences between SAD and asthmatic children are again modest.
While expert clinician diagnostic classification distinguished between children based on 4 levels
of perceived normality of absence thereof of the visual patterns of IOS data, with the essential features
characterizing the differences being associated with abnormalities group mean IOS and the aRIC
model data appear to fall into two distinctly different groups: either normal or asthmatic, with the
76
essential features characterizing the differences being associated with abnormalities of peripheral
airways.
The features used in this work seem to be sensitive and reliable indices for automatic respiratory
disease classification using Impulse Oscillometry data. In our other publications we reported on the
performance of a neuro-fuzzy classifier using these indices as powerful features for computer-aided
classification of asthmatic and normal children.
5. “Normal Impulse Oscillometry (IOS) Lung Function Parameters in Adolescents Residing
in El Paso, TX” (93).
Documented prevalence and severity of asthma in Hispanic (H) children are greater than those in
Anglo (A) children. This has been attributed to either socio-economic factors (access to medical care) or
urban living, which increases the risk of developing asthma, with more H than A children living in urban
environments. To address these issues, we recruited, by random selection, both H and A children in the
same urban environment known to have poor air quality in El Paso, Texas, to assess severity and
prevalence of lung dysfunction in children.
Data from 5 Anglo (1 female) and 6 Hispanic (2 females) normal, non-asthmatic adolescents, 11
to 17 years old, were used for this purpose, and R5, R5-R15 and AX were analyzed and were not
significantly different between these groups. It was concluded that despite a slightly greater BMI in
Hispanic adolescents, there were no differences in lung function parameters reflective of peripheral
airway dysfunction in this group of normal adolescents that might suggest genetic differences in
adolescents living in similar urban environments.
6. “Abnormality of Oscillometric Resistances and Reactances is Greater in Hispanic than
Anglo Children in El Paso, TX” (94)
Also in the same year a study was performed where children, ages 5–17 years, underwent
oscillometry (IOS) tests, to assess their respiratory impedance. R and X values were compared with
historical normal data in children of similar age to aid diagnostic assignment by an observer blinded to
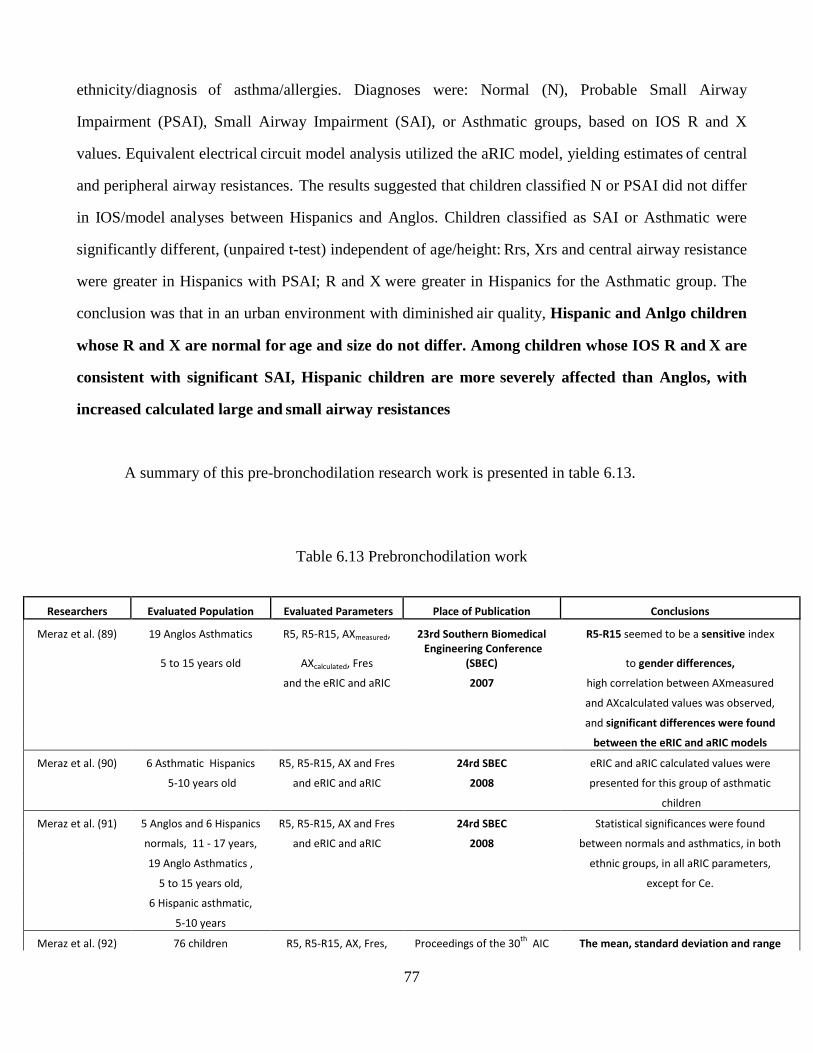
77
ethnicity/diagnosis of asthma/allergies. Diagnoses were: Normal (N), Probable Small Airway
Impairment (PSAI), Small Airway Impairment (SAI), or Asthmatic groups, based on IOS R and X
values. Equivalent electrical circuit model analysis utilized the aRIC model, yielding estimates of central
and peripheral airway resistances. The results suggested that children classified N or PSAI did not differ
in IOS/model analyses between Hispanics and Anglos. Children classified as SAI or Asthmatic were
significantly different, (unpaired t-test) independent of age/height: Rrs, Xrs and central airway resistance
were greater in Hispanics with PSAI; R and X were greater in Hispanics for the Asthmatic group. The
conclusion was that in an urban environment with diminished air quality, Hispanic and Anlgo children
whose R and X are normal for age and size do not differ. Among children whose IOS R and X are
consistent with significant SAI, Hispanic children are more severely affected than Anglos, with
increased calculated large and small airway resistances
A summary of this pre-bronchodilation research work is presented in table 6.13.
Table 6.13 Prebronchodilation work
Researchers Evaluated Population Evaluated Parameters Place of Publication Conclusions
Meraz et al. (89) 19 Anglos Asthmatics R5, R5-R15, AXmeasured, 23rd Southern Biomedical R5-R15 seemed to be a sensitive index
5 to 15 years old AXcalculated, Fres
Engineering Conference
(SBEC) to gender differences,
and the eRIC and aRIC 2007 high correlation between AXmeasured
and AXcalculated values was observed,
and significant differences were found
between the eRIC and aRIC models
Meraz et al. (90) 6 Asthmatic Hispanics R5, R5-R15, AX and Fres 24rd SBEC eRIC and aRIC calculated values were
5-10 years old and eRIC and aRIC 2008 presented for this group of asthmatic
children
Meraz et al. (91) 5 Anglos and 6 Hispanics R5, R5-R15, AX and Fres 24rd SBEC Statistical significances were found
normals, 11 - 17 years, and eRIC and aRIC 2008 between normals and asthmatics, in both
19 Anglo Asthmatics , ethnic groups, in all aRIC parameters,
5 to 15 years old, except for Ce.
6 Hispanic asthmatic,
5-10 years
Meraz et al. (92) 76 children R5, R5-R15, AX, Fres, Proceedings of the 30th
AIC The mean, standard deviation and range
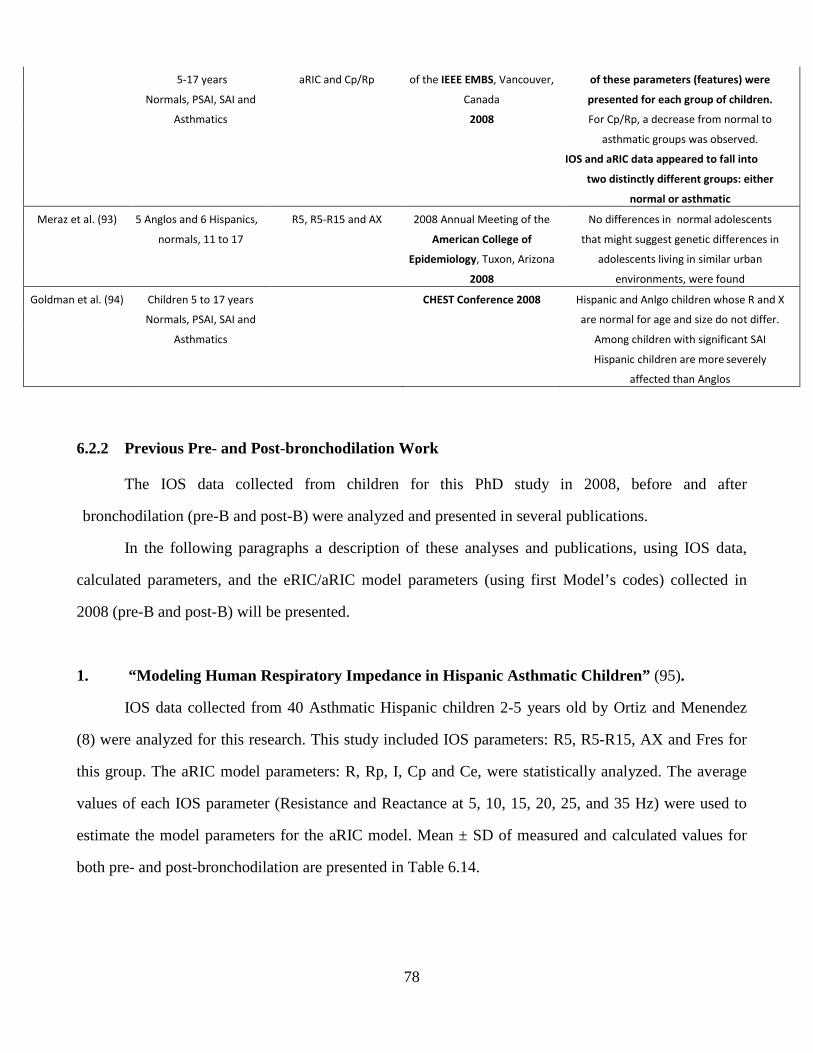
78
6.2.2 Previous Pre- and Post-bronchodilation Work
The IOS data collected from children for this PhD study in 2008, before and after
bronchodilation (pre-B and post-B) were analyzed and presented in several publications.
In the following paragraphs a description of these analyses and publications, using IOS data,
calculated parameters, and the eRIC/aRIC model parameters (using first Model’s codes) collected in
2008 (pre-B and post-B) will be presented.
1. “Modeling Human Respiratory Impedance in Hispanic Asthmatic Children” (95).
IOS data collected from 40 Asthmatic Hispanic children 2-5 years old by Ortiz and Menendez
(8) were analyzed for this research. This study included IOS parameters: R5, R5-R15, AX and Fres for
this group. The aRIC model parameters: R, Rp, I, Cp and Ce, were statistically analyzed. The average
values of each IOS parameter (Resistance and Reactance at 5, 10, 15, 20, 25, and 35 Hz) were used to
estimate the model parameters for the aRIC model. Mean ± SD of measured and calculated values for
both pre- and post-bronchodilation are presented in Table 6.14.
5-17 years aRIC and Cp/Rp of the IEEE EMBS, Vancouver, of these parameters (features) were
Normals, PSAI, SAI and Canada presented for each group of children.
Asthmatics 2008 For Cp/Rp, a decrease from normal to
asthmatic groups was observed.
IOS and aRIC data appeared to fall into
two distinctly different groups: either
normal or asthmatic
Meraz et al. (93) 5 Anglos and 6 Hispanics, R5, R5-R15 and AX 2008 Annual Meeting of the No differences in normal adolescents
normals, 11 to 17 American College of that might suggest genetic differences in
Epidemiology, Tuxon, Arizona adolescents living in similar urban
2008 environments, were found
Goldman et al. (94) Children 5 to 17 years CHEST Conference 2008 Hispanic and Anlgo children whose R and X
Normals, PSAI, SAI and are normal for age and size do not differ.
Asthmatics Among children with significant SAI
Hispanic children are more severely
affected than Anglos
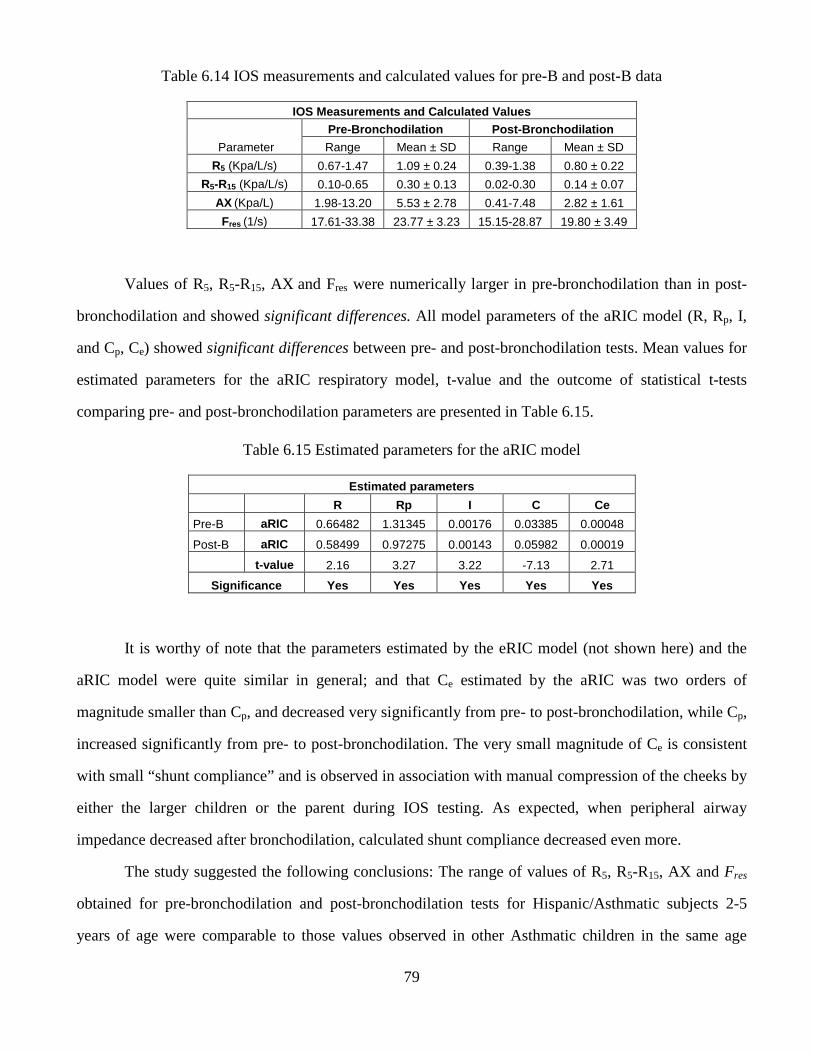
79
Table 6.14 IOS measurements and calculated values for pre-B and post-B data
IOS Measurements and Calculated Values
Parameter
Pre-Bronchodilation Post-Bronchodilation
Range Mean ± SD Range Mean ± SD
R5 (Kpa/L/s) 0.67-1.47 1.09 ± 0.24 0.39-1.38 0.80 ± 0.22
R5-R15 (Kpa/L/s) 0.10-0.65 0.30 ± 0.13 0.02-0.30 0.14 ± 0.07
AX (Kpa/L) 1.98-13.20 5.53 ± 2.78 0.41-7.48 2.82 ± 1.61
Fres (1/s) 17.61-33.38 23.77 ± 3.23 15.15-28.87 19.80 ± 3.49
Values of R5, R5-R15, AX and Fres were numerically larger in pre-bronchodilation than in post-
bronchodilation and showed significant differences. All model parameters of the aRIC model (R, Rp, I,
and Cp, Ce) showed significant differences between pre- and post-bronchodilation tests. Mean values for
estimated parameters for the aRIC respiratory model, t-value and the outcome of statistical t-tests
comparing pre- and post-bronchodilation parameters are presented in Table 6.15.
Table 6.15 Estimated parameters for the aRIC model
Estimated parameters
R Rp I C Ce
Pre-B aRIC 0.66482 1.31345 0.00176 0.03385 0.00048
Post-B aRIC 0.58499 0.97275 0.00143 0.05982 0.00019
t-value 2.16 3.27 3.22 -7.13 2.71
Significance Yes Yes Yes Yes Yes
It is worthy of note that the parameters estimated by the eRIC model (not shown here) and the
aRIC model were quite similar in general; and that Ce estimated by the aRIC was two orders of
magnitude smaller than Cp, and decreased very significantly from pre- to post-bronchodilation, while Cp,
increased significantly from pre- to post-bronchodilation. The very small magnitude of Ce is consistent
with small “shunt compliance” and is observed in association with manual compression of the cheeks by
either the larger children or the parent during IOS testing. As expected, when peripheral airway
impedance decreased after bronchodilation, calculated shunt compliance decreased even more.
The study suggested the following conclusions: The range of values of R5, R5-R15, AX and Fres
obtained for pre-bronchodilation and post-bronchodilation tests for Hispanic/Asthmatic subjects 2-5
years of age were comparable to those values observed in other Asthmatic children in the same age
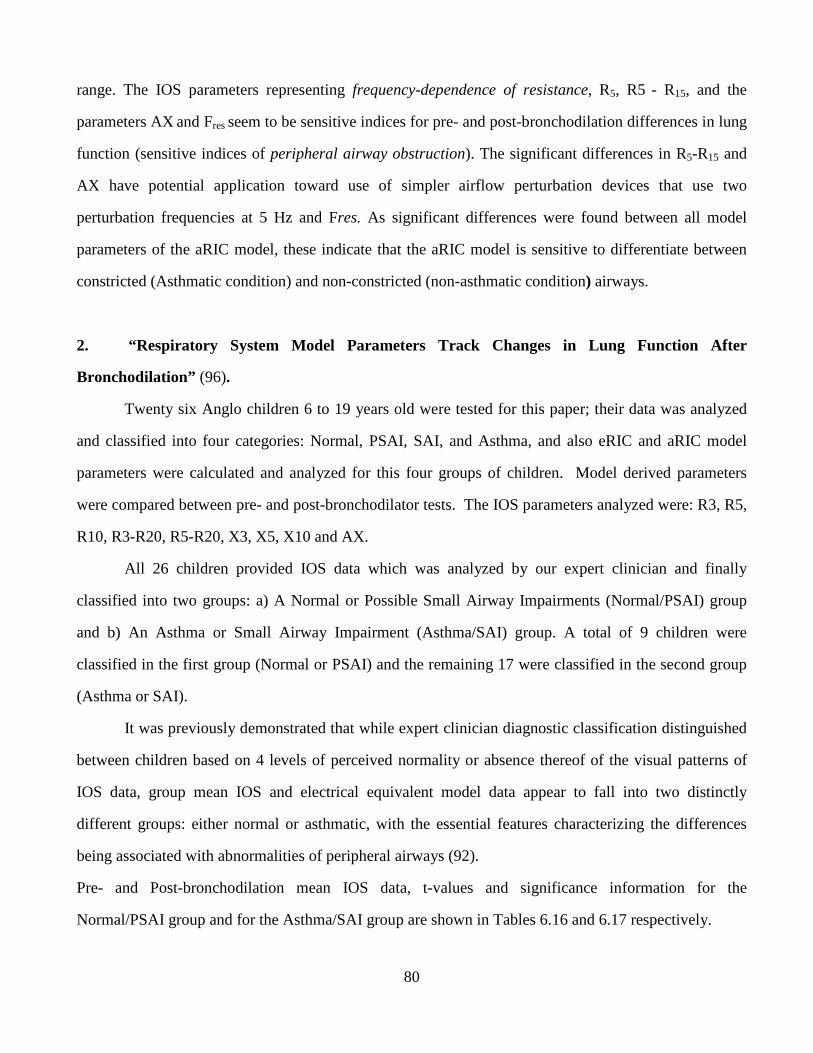
80
range. The IOS parameters representing frequency-dependence of resistance, R5, R5 - R15, and the
parameters AX and Fres seem to be sensitive indices for pre- and post-bronchodilation differences in lung
function (sensitive indices of peripheral airway obstruction). The significant differences in R5-R15 and
AX have potential application toward use of simpler airflow perturbation devices that use two
perturbation frequencies at 5 Hz and Fres. As significant differences were found between all model
parameters of the aRIC model, these indicate that the aRIC model is sensitive to differentiate between
constricted (Asthmatic condition) and non-constricted (non-asthmatic condition) airways.
2. “Respiratory System Model Parameters Track Changes in Lung Function After
Bronchodilation” (96).
Twenty six Anglo children 6 to 19 years old were tested for this paper; their data was analyzed
and classified into four categories: Normal, PSAI, SAI, and Asthma, and also eRIC and aRIC model
parameters were calculated and analyzed for this four groups of children. Model derived parameters
were compared between pre- and post-bronchodilator tests. The IOS parameters analyzed were: R3, R5,
R10, R3-R20, R5-R20, X3, X5, X10 and AX.
All 26 children provided IOS data which was analyzed by our expert clinician and finally
classified into two groups: a) A Normal or Possible Small Airway Impairments (Normal/PSAI) group
and b) An Asthma or Small Airway Impairment (Asthma/SAI) group. A total of 9 children were
classified in the first group (Normal or PSAI) and the remaining 17 were classified in the second group
(Asthma or SAI).
It was previously demonstrated that while expert clinician diagnostic classification distinguished
between children based on 4 levels of perceived normality or absence thereof of the visual patterns of
IOS data, group mean IOS and electrical equivalent model data appear to fall into two distinctly
different groups: either normal or asthmatic, with the essential features characterizing the differences
being associated with abnormalities of peripheral airways (92).
Pre- and Post-bronchodilation mean IOS data, t-values and significance information for the
Normal/PSAI group and for the Asthma/SAI group are shown in Tables 6.16 and 6.17 respectively.
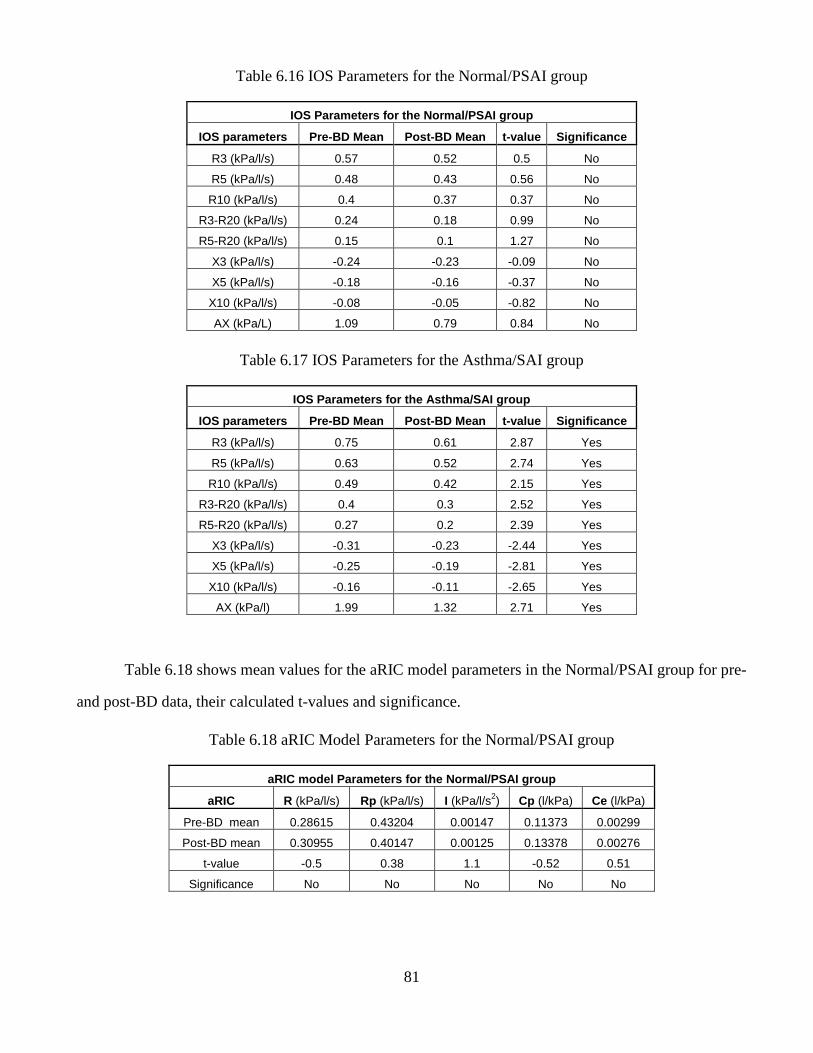
81
Table 6.16 IOS Parameters for the Normal/PSAI group
IOS Parameters for the Normal/PSAI group
IOS parameters Pre-BD Mean Post-BD Mean t-value Significance
R3 (kPa/l/s) 0.57 0.52 0.5 No
R5 (kPa/l/s) 0.48 0.43 0.56 No
R10 (kPa/l/s) 0.4 0.37 0.37 No
R3-R20 (kPa/l/s) 0.24 0.18 0.99 No
R5-R20 (kPa/l/s) 0.15 0.1 1.27 No
X3 (kPa/l/s) -0.24 -0.23 -0.09 No
X5 (kPa/l/s) -0.18 -0.16 -0.37 No
X10 (kPa/l/s) -0.08 -0.05 -0.82 No
AX (kPa/L) 1.09 0.79 0.84 No
Table 6.17 IOS Parameters for the Asthma/SAI group
IOS Parameters for the Asthma/SAI group
IOS parameters Pre-BD Mean Post-BD Mean t-value Significance
R3 (kPa/l/s) 0.75 0.61 2.87 Yes
R5 (kPa/l/s) 0.63 0.52 2.74 Yes
R10 (kPa/l/s) 0.49 0.42 2.15 Yes
R3-R20 (kPa/l/s) 0.4 0.3 2.52 Yes
R5-R20 (kPa/l/s) 0.27 0.2 2.39 Yes
X3 (kPa/l/s) -0.31 -0.23 -2.44 Yes
X5 (kPa/l/s) -0.25 -0.19 -2.81 Yes
X10 (kPa/l/s) -0.16 -0.11 -2.65 Yes
AX (kPa/l) 1.99 1.32 2.71 Yes
Table 6.18 shows mean values for the aRIC model parameters in the Normal/PSAI group for pre-
and post-BD data, their calculated t-values and significance.
Table 6.18 aRIC Model Parameters for the Normal/PSAI group
aRIC model Parameters for the Normal/PSAI group
aRIC R (kPa/l/s) Rp (kPa/l/s) I (kPa/l/s2) Cp (l/kPa) Ce (l/kPa)
Pre-BD mean 0.28615 0.43204 0.00147 0.11373 0.00299
Post-BD mean 0.30955 0.40147 0.00125 0.13378 0.00276
t-value -0.5 0.38 1.1 -0.52 0.51
Significance No No No No No
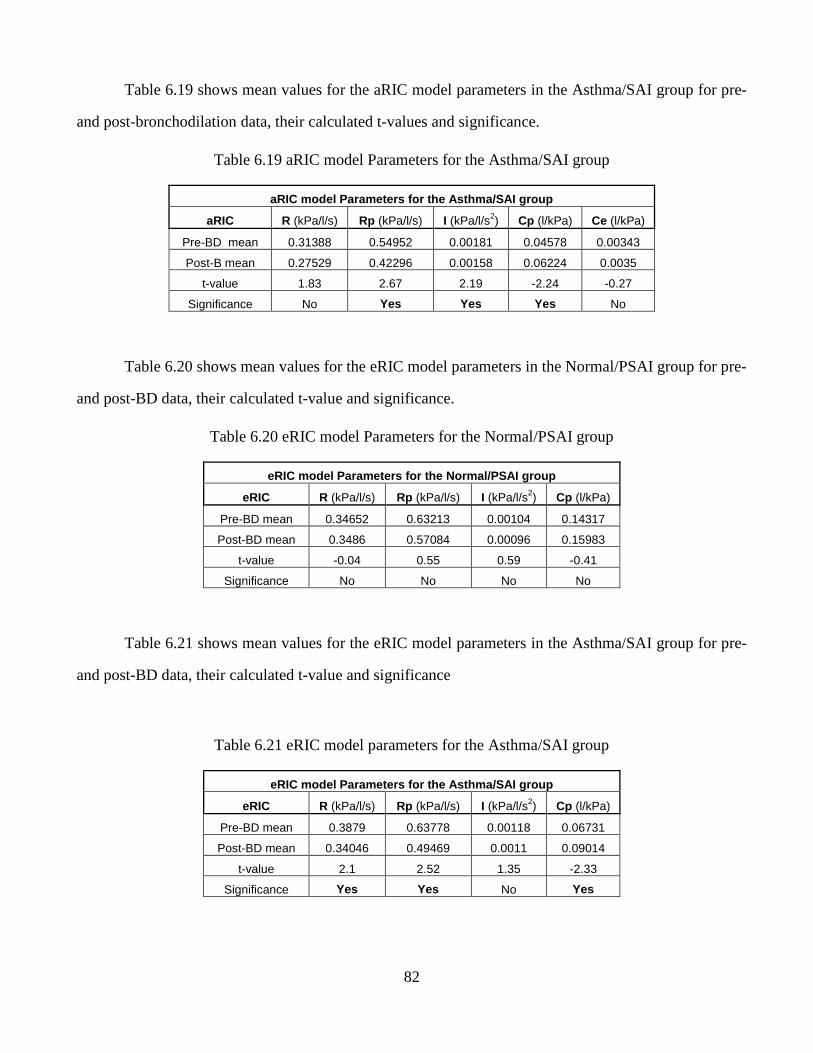
82
Table 6.19 shows mean values for the aRIC model parameters in the Asthma/SAI group for pre-
and post-bronchodilation data, their calculated t-values and significance.
Table 6.19 aRIC model Parameters for the Asthma/SAI group
aRIC model Parameters for the Asthma/SAI group
aRIC R (kPa/l/s) Rp (kPa/l/s) I (kPa/l/s2) Cp (l/kPa) Ce (l/kPa)
Pre-BD mean 0.31388 0.54952 0.00181 0.04578 0.00343
Post-B mean 0.27529 0.42296 0.00158 0.06224 0.0035
t-value 1.83 2.67 2.19 -2.24 -0.27
Significance No Yes Yes Yes No
Table 6.20 shows mean values for the eRIC model parameters in the Normal/PSAI group for pre-
and post-BD data, their calculated t-value and significance.
Table 6.20 eRIC model Parameters for the Normal/PSAI group
eRIC model Parameters for the Normal/PSAI group
eRIC R (kPa/l/s) Rp (kPa/l/s) I (kPa/l/s2) Cp (l/kPa)
Pre-BD mean 0.34652 0.63213 0.00104 0.14317
Post-BD mean 0.3486 0.57084 0.00096 0.15983
t-value -0.04 0.55 0.59 -0.41
Significance No No No No
Table 6.21 shows mean values for the eRIC model parameters in the Asthma/SAI group for pre-
and post-BD data, their calculated t-value and significance
Table 6.21 eRIC model parameters for the Asthma/SAI group
eRIC model Parameters for the Asthma/SAI group
eRIC R (kPa/l/s) Rp (kPa/l/s) I (kPa/l/s2) Cp (l/kPa)
Pre-BD mean 0.3879 0.63778 0.00118 0.06731
Post-BD mean 0.34046 0.49469 0.0011 0.09014
t-value 2.1 2.52 1.35 -2.33
Significance Yes Yes No Yes
83
The present study has shown that electrical equivalent model parameters track changes in lung
function after bronchodilation. Both the eRIC and aRIC models clearly distinguish between children
who are normal (or possibly have mild small airway impairment (SAI), who show no significant
changes with bronchodilator (BD)), and those who are asthmatic with SAI, both at baseline and
regarding the pre- to post-BD changes in lung function. The eRIC model shows an apparently larger
peripheral airway compliance (Cp) than the aRIC model, probably because it may include some of the
“extrathoracic airway compliance” (Ce). eRIC also fails to show significant change in inertance (I) post-
BD in the asthma group, while aRIC does. On the other hand, eRIC is more parsimonious, and the
parameter, Ce, that may be difficult for physicians to understand, appears to show no significant change
post-BD in the asthma group.
Cp values derived from both the eRIC and aRIC models were closely correlated with AX. The
range of values for normal subjects and those with small airway impairment, before and after inhaling
bronchodilator appear to fall along a unique power regression trend line, such that intervention with
bronchodilator moves the data points along this single regression toward the more normal data range.
A definitive choice between eRIC and aRIC models will require further assessments.
3. “Forced Oscillation (IOS) measures in airway-impaired and normal children over 2 years
(97)”
Few longitudinal Forced Oscillation (FO) data exist in normal subjects or in those with airflow
obstruction. Oostveen et al (78) noted need for a practical FO index to define airway obstruction. This
study documents Impulse Oscillation (IOS) data in children and adolescents (7-15 yrs of age) in El Paso
Texas, USA over a two-year time period between 2006-2008. Children were randomly selected to
participate in a lung function study related to contaminated environmental air conditions using IOS in
2006, in El Paso TX. We classified subjects as either “normal” or having small airway impairment
(SAI) on initial baseline IOS studies in 2006 using data of Clément et al (35) as a guide to normality.
We requested subjects studied in 2006 to return in 2008 for more complete IOS testing pre- and post-
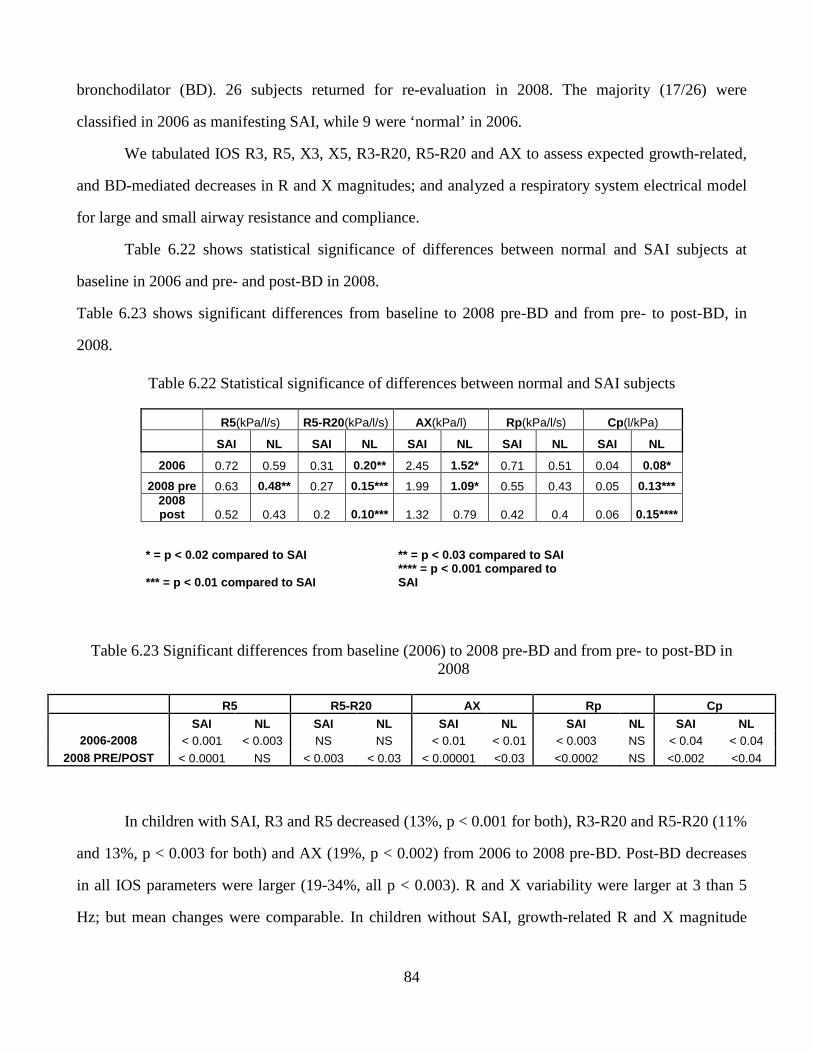
84
bronchodilator (BD). 26 subjects returned for re-evaluation in 2008. The majority (17/26) were
classified in 2006 as manifesting SAI, while 9 were ‘normal’ in 2006.
We tabulated IOS R3, R5, X3, X5, R3-R20, R5-R20 and AX to assess expected growth-related,
and BD-mediated decreases in R and X magnitudes; and analyzed a respiratory system electrical model
for large and small airway resistance and compliance.
Table 6.22 shows statistical significance of differences between normal and SAI subjects at
baseline in 2006 and pre- and post-BD in 2008.
Table 6.23 shows significant differences from baseline to 2008 pre-BD and from pre- to post-BD, in
2008.
Table 6.22 Statistical significance of differences between normal and SAI subjects
R5(kPa/l/s) R5-R20(kPa/l/s) AX(kPa/l) Rp(kPa/l/s) Cp(l/kPa)
SAI NL SAI NL SAI NL SAI NL SAI NL
2006 0.72 0.59 0.31 0.20** 2.45 1.52* 0.71 0.51 0.04 0.08*
2008 pre 0.63 0.48** 0.27 0.15*** 1.99 1.09* 0.55 0.43 0.05 0.13*** 2008 post 0.52 0.43 0.2 0.10*** 1.32 0.79 0.42 0.4 0.06 0.15****
* = p < 0.02 compared to SAI
** = p < 0.03 compared to SAI
*** = p < 0.01 compared to SAI
**** = p < 0.001 compared to SAI
Table 6.23 Significant differences from baseline (2006) to 2008 pre-BD and from pre- to post-BD in 2008
R5 R5-R20 AX Rp Cp
SAI NL SAI NL SAI NL SAI NL SAI NL 2006-2008 < 0.001 < 0.003 NS NS < 0.01 < 0.01 < 0.003 NS < 0.04 < 0.04
2008 PRE/POST < 0.0001 NS < 0.003 < 0.03 < 0.00001 <0.03 <0.0002 NS <0.002 <0.04
In children with SAI, R3 and R5 decreased (13%, p < 0.001 for both), R3-R20 and R5-R20 (11%
and 13%, p < 0.003 for both) and AX (19%, p < 0.002) from 2006 to 2008 pre-BD. Post-BD decreases
in all IOS parameters were larger (19-34%, all p < 0.003). R and X variability were larger at 3 than 5
Hz; but mean changes were comparable. In children without SAI, growth-related R and X magnitude
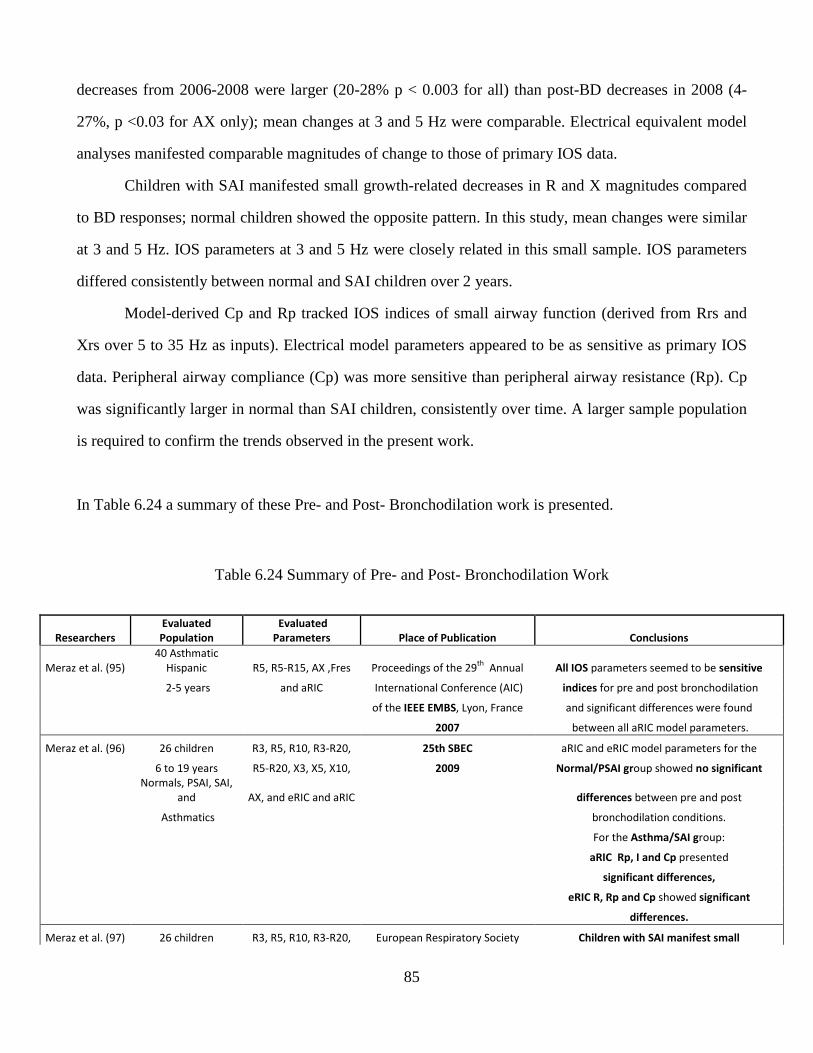
85
decreases from 2006-2008 were larger (20-28% p < 0.003 for all) than post-BD decreases in 2008 (4-
27%, p <0.03 for AX only); mean changes at 3 and 5 Hz were comparable. Electrical equivalent model
analyses manifested comparable magnitudes of change to those of primary IOS data.
Children with SAI manifested small growth-related decreases in R and X magnitudes compared
to BD responses; normal children showed the opposite pattern. In this study, mean changes were similar
at 3 and 5 Hz. IOS parameters at 3 and 5 Hz were closely related in this small sample. IOS parameters
differed consistently between normal and SAI children over 2 years.
Model-derived Cp and Rp tracked IOS indices of small airway function (derived from Rrs and
Xrs over 5 to 35 Hz as inputs). Electrical model parameters appeared to be as sensitive as primary IOS
data. Peripheral airway compliance (Cp) was more sensitive than peripheral airway resistance (Rp). Cp
was significantly larger in normal than SAI children, consistently over time. A larger sample population
is required to confirm the trends observed in the present work.
In Table 6.24 a summary of these Pre- and Post- Bronchodilation work is presented.
Table 6.24 Summary of Pre- and Post- Bronchodilation Work
Researchers
Evaluated
Population
Evaluated
Parameters Place of Publication Conclusions
Meraz et al. (95)
40 Asthmatic
Hispanic R5, R5-R15, AX ,Fres Proceedings of the 29th
Annual All IOS parameters seemed to be sensitive
2-5 years and aRIC International Conference (AIC) indices for pre and post bronchodilation
of the IEEE EMBS, Lyon, France and significant differences were found
2007 between all aRIC model parameters.
Meraz et al. (96) 26 children R3, R5, R10, R3-R20, 25th SBEC aRIC and eRIC model parameters for the
6 to 19 years R5-R20, X3, X5, X10, 2009 Normal/PSAI group showed no significant
Normals, PSAI, SAI,
and AX, and eRIC and aRIC differences between pre and post
Asthmatics bronchodilation conditions.
For the Asthma/SAI group:
aRIC Rp, I and Cp presented
significant differences,
eRIC R, Rp and Cp showed significant
differences.
Meraz et al. (97) 26 children R3, R5, R10, R3-R20, European Respiratory Society Children with SAI manifest small
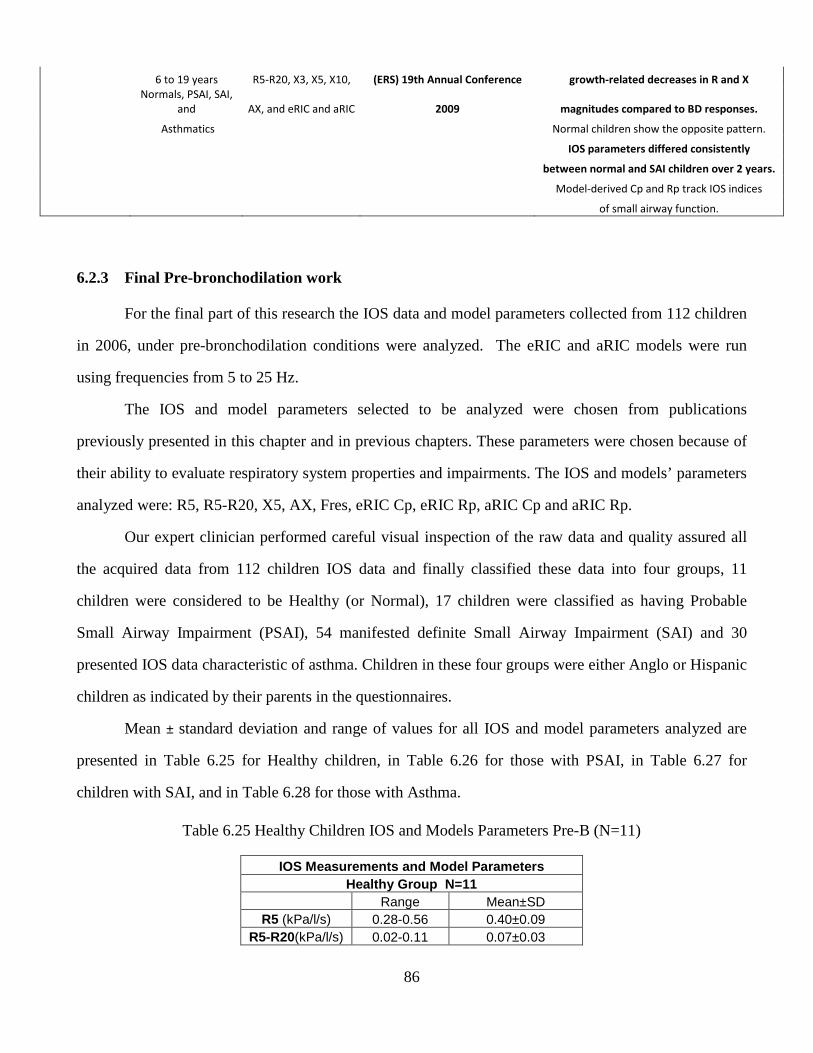
86
6 to 19 years R5-R20, X3, X5, X10, (ERS) 19th Annual Conference growth-related decreases in R and X
Normals, PSAI, SAI,
and AX, and eRIC and aRIC 2009 magnitudes compared to BD responses.
Asthmatics Normal children show the opposite pattern.
IOS parameters differed consistently
between normal and SAI children over 2 years.
Model-derived Cp and Rp track IOS indices
of small airway function.
6.2.3 Final Pre-bronchodilation work
For the final part of this research the IOS data and model parameters collected from 112 children
in 2006, under pre-bronchodilation conditions were analyzed. The eRIC and aRIC models were run
using frequencies from 5 to 25 Hz.
The IOS and model parameters selected to be analyzed were chosen from publications
previously presented in this chapter and in previous chapters. These parameters were chosen because of
their ability to evaluate respiratory system properties and impairments. The IOS and models’ parameters
analyzed were: R5, R5-R20, X5, AX, Fres, eRIC Cp, eRIC Rp, aRIC Cp and aRIC Rp.
Our expert clinician performed careful visual inspection of the raw data and quality assured all
the acquired data from 112 children IOS data and finally classified these data into four groups, 11
children were considered to be Healthy (or Normal), 17 children were classified as having Probable
Small Airway Impairment (PSAI), 54 manifested definite Small Airway Impairment (SAI) and 30
presented IOS data characteristic of asthma. Children in these four groups were either Anglo or Hispanic
children as indicated by their parents in the questionnaires.
Mean ± standard deviation and range of values for all IOS and model parameters analyzed are
presented in Table 6.25 for Healthy children, in Table 6.26 for those with PSAI, in Table 6.27 for
children with SAI, and in Table 6.28 for those with Asthma.
Table 6.25 Healthy Children IOS and Models Parameters Pre-B (N=11)
IOS Measurements and Model Parameters Healthy Group N=11
Range Mean±SD R5 (kPa/l/s) 0.28-0.56 0.40±0.09
R5-R20(kPa/l/s) 0.02-0.11 0.07±0.03
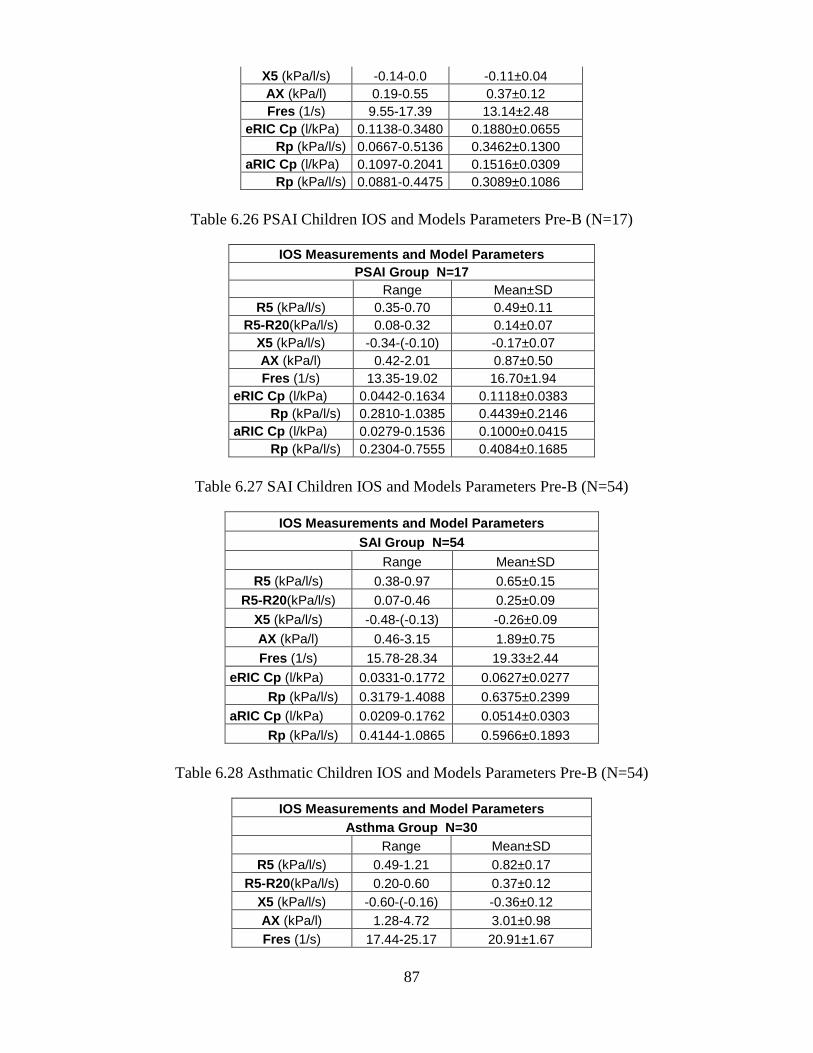
87
X5 (kPa/l/s) -0.14-0.0 -0.11±0.04 AX (kPa/l) 0.19-0.55 0.37±0.12 Fres (1/s) 9.55-17.39 13.14±2.48
eRIC Cp (l/kPa) 0.1138-0.3480 0.1880±0.0655 Rp (kPa/l/s) 0.0667-0.5136 0.3462±0.1300 aRIC Cp (l/kPa) 0.1097-0.2041 0.1516±0.0309 Rp (kPa/l/s) 0.0881-0.4475 0.3089±0.1086
Table 6.26 PSAI Children IOS and Models Parameters Pre-B (N=17)
IOS Measurements and Model Parameters PSAI Group N=17
Range Mean±SD R5 (kPa/l/s) 0.35-0.70 0.49±0.11
R5-R20(kPa/l/s) 0.08-0.32 0.14±0.07 X5 (kPa/l/s) -0.34-(-0.10) -0.17±0.07 AX (kPa/l) 0.42-2.01 0.87±0.50 Fres (1/s) 13.35-19.02 16.70±1.94
eRIC Cp (l/kPa) 0.0442-0.1634 0.1118±0.0383 Rp (kPa/l/s) 0.2810-1.0385 0.4439±0.2146
aRIC Cp (l/kPa) 0.0279-0.1536 0.1000±0.0415 Rp (kPa/l/s) 0.2304-0.7555 0.4084±0.1685
Table 6.27 SAI Children IOS and Models Parameters Pre-B (N=54)
IOS Measurements and Model Parameters SAI Group N=54
Range Mean±SD
R5 (kPa/l/s) 0.38-0.97 0.65±0.15 R5-R20(kPa/l/s) 0.07-0.46 0.25±0.09
X5 (kPa/l/s) -0.48-(-0.13) -0.26±0.09
AX (kPa/l) 0.46-3.15 1.89±0.75
Fres (1/s) 15.78-28.34 19.33±2.44
eRIC Cp (l/kPa) 0.0331-0.1772 0.0627±0.0277
Rp (kPa/l/s) 0.3179-1.4088 0.6375±0.2399 aRIC Cp (l/kPa) 0.0209-0.1762 0.0514±0.0303
Rp (kPa/l/s) 0.4144-1.0865 0.5966±0.1893
Table 6.28 Asthmatic Children IOS and Models Parameters Pre-B (N=54)
IOS Measurements and Model Parameters Asthma Group N=30
Range Mean±SD R5 (kPa/l/s) 0.49-1.21 0.82±0.17
R5-R20(kPa/l/s) 0.20-0.60 0.37±0.12 X5 (kPa/l/s) -0.60-(-0.16) -0.36±0.12 AX (kPa/l) 1.28-4.72 3.01±0.98 Fres (1/s) 17.44-25.17 20.91±1.67
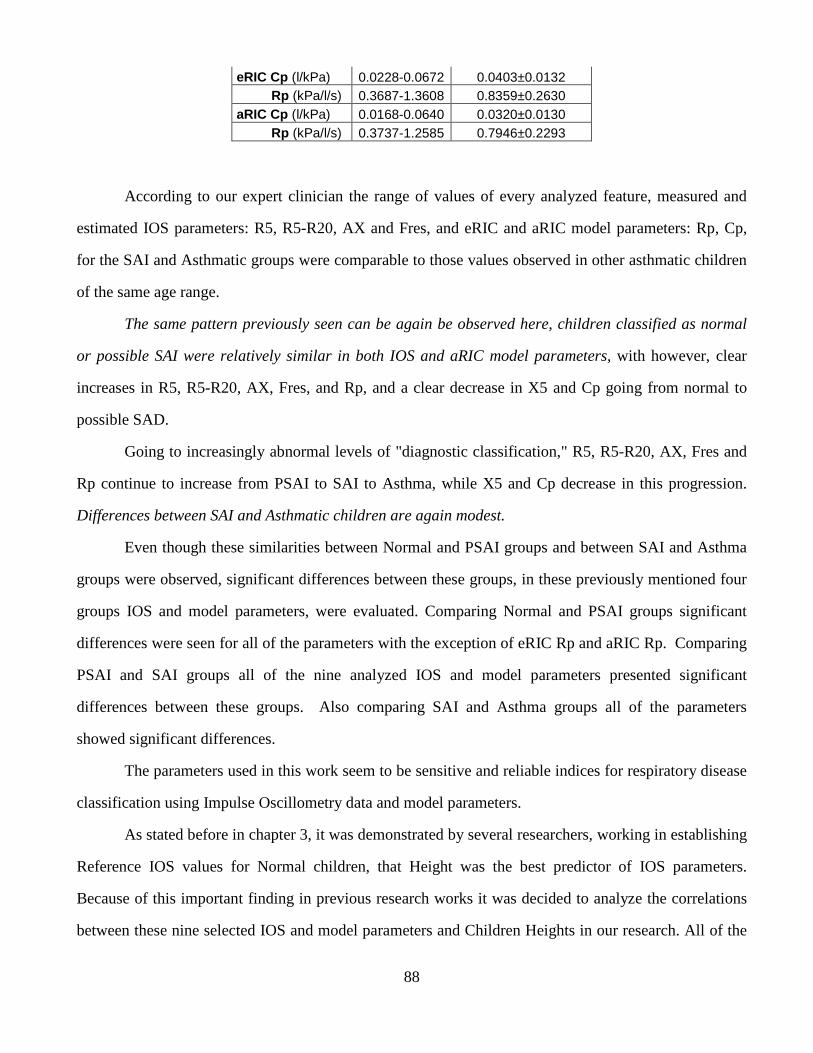
88
eRIC Cp (l/kPa) 0.0228-0.0672 0.0403±0.0132 Rp (kPa/l/s) 0.3687-1.3608 0.8359±0.2630
aRIC Cp (l/kPa) 0.0168-0.0640 0.0320±0.0130 Rp (kPa/l/s) 0.3737-1.2585 0.7946±0.2293
According to our expert clinician the range of values of every analyzed feature, measured and
estimated IOS parameters: R5, R5-R20, AX and Fres, and eRIC and aRIC model parameters: Rp, Cp,
for the SAI and Asthmatic groups were comparable to those values observed in other asthmatic children
of the same age range.
The same pattern previously seen can be again be observed here, children classified as normal
or possible SAI were relatively similar in both IOS and aRIC model parameters, with however, clear
increases in R5, R5-R20, AX, Fres, and Rp, and a clear decrease in X5 and Cp going from normal to
possible SAD.
Going to increasingly abnormal levels of "diagnostic classification," R5, R5-R20, AX, Fres and
Rp continue to increase from PSAI to SAI to Asthma, while X5 and Cp decrease in this progression.
Differences between SAI and Asthmatic children are again modest.
Even though these similarities between Normal and PSAI groups and between SAI and Asthma
groups were observed, significant differences between these groups, in these previously mentioned four
groups IOS and model parameters, were evaluated. Comparing Normal and PSAI groups significant
differences were seen for all of the parameters with the exception of eRIC Rp and aRIC Rp. Comparing
PSAI and SAI groups all of the nine analyzed IOS and model parameters presented significant
differences between these groups. Also comparing SAI and Asthma groups all of the parameters
showed significant differences.
The parameters used in this work seem to be sensitive and reliable indices for respiratory disease
classification using Impulse Oscillometry data and model parameters.
As stated before in chapter 3, it was demonstrated by several researchers, working in establishing
Reference IOS values for Normal children, that Height was the best predictor of IOS parameters.
Because of this important finding in previous research works it was decided to analyze the correlations
between these nine selected IOS and model parameters and Children Heights in our research. All of the
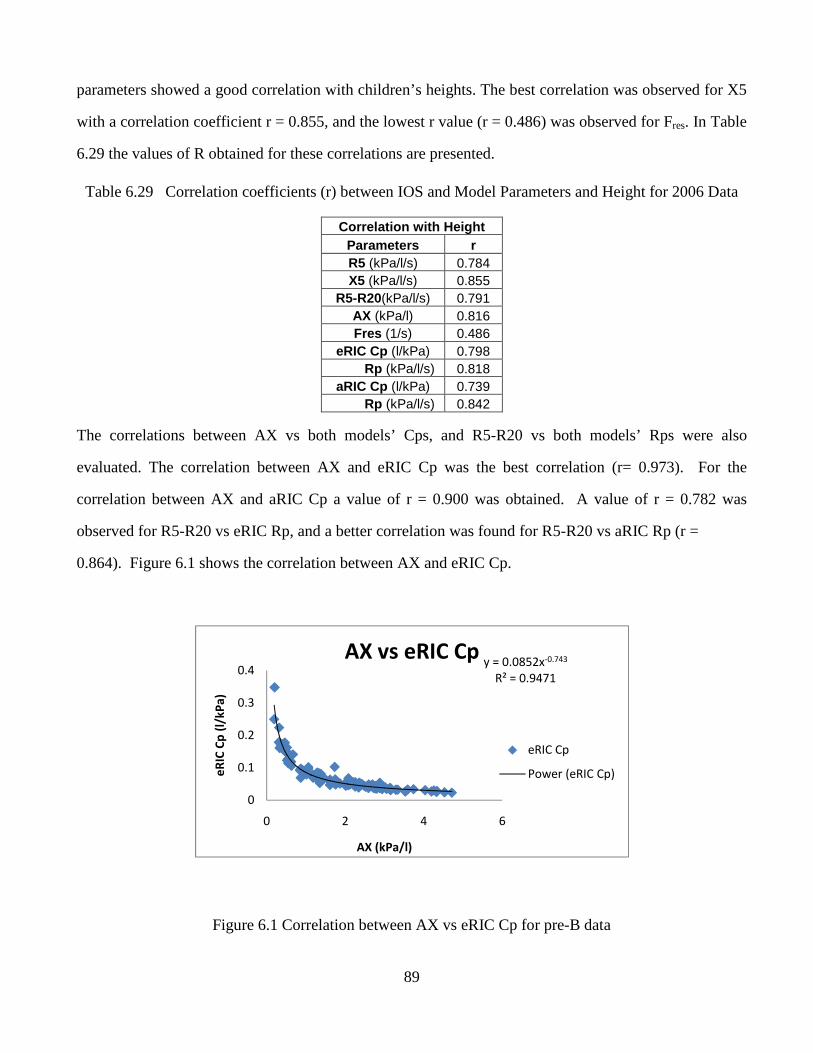
89
parameters showed a good correlation with children’s heights. The best correlation was observed for X5
with a correlation coefficient r = 0.855, and the lowest r value (r = 0.486) was observed for Fres. In Table
6.29 the values of R obtained for these correlations are presented.
Table 6.29 Correlation coefficients (r) between IOS and Model Parameters and Height for 2006 Data
Correlation with Height Parameters r R5 (kPa/l/s) 0.784 X5 (kPa/l/s) 0.855
R5-R20(kPa/l/s) 0.791 AX (kPa/l) 0.816 Fres (1/s) 0.486
eRIC Cp (l/kPa) 0.798 Rp (kPa/l/s) 0.818 aRIC Cp (l/kPa) 0.739
Rp (kPa/l/s) 0.842
The correlations between AX vs both models’ Cps, and R5-R20 vs both models’ Rps were also
evaluated. The correlation between AX and eRIC Cp was the best correlation (r= 0.973). For the
correlation between AX and aRIC Cp a value of r = 0.900 was obtained. A value of r = 0.782 was
observed for R5-R20 vs eRIC Rp, and a better correlation was found for R5-R20 vs aRIC Rp (r =
0.864). Figure 6.1 shows the correlation between AX and eRIC Cp.
Figure 6.1 Correlation between AX vs eRIC Cp for pre-B data
y = 0.0852x-0.743
R² = 0.9471
0
0.1
0.2
0.3
0.4
0 2 4 6
eR
IC C
p (
l/k
Pa
)
AX (kPa/l)
AX vs eRIC Cp
eRIC Cp
Power (eRIC Cp)
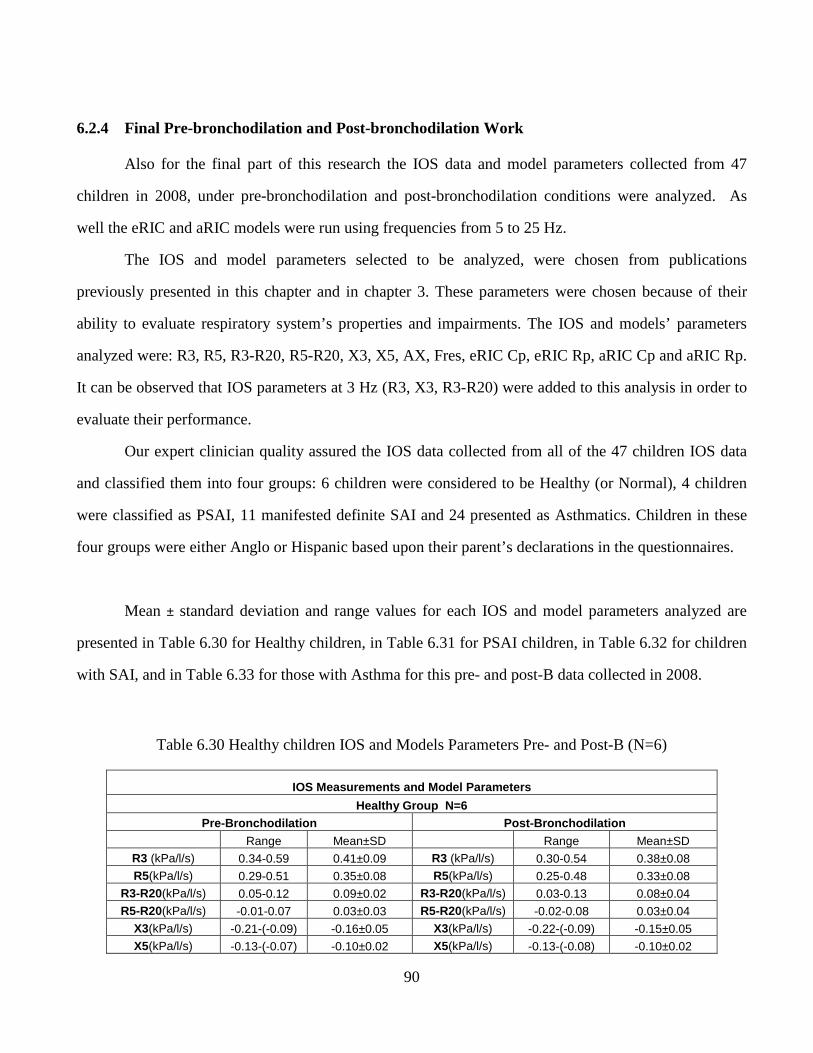
90
6.2.4 Final Pre-bronchodilation and Post-bronchodilation Work
Also for the final part of this research the IOS data and model parameters collected from 47
children in 2008, under pre-bronchodilation and post-bronchodilation conditions were analyzed. As
well the eRIC and aRIC models were run using frequencies from 5 to 25 Hz.
The IOS and model parameters selected to be analyzed, were chosen from publications
previously presented in this chapter and in chapter 3. These parameters were chosen because of their
ability to evaluate respiratory system’s properties and impairments. The IOS and models’ parameters
analyzed were: R3, R5, R3-R20, R5-R20, X3, X5, AX, Fres, eRIC Cp, eRIC Rp, aRIC Cp and aRIC Rp.
It can be observed that IOS parameters at 3 Hz (R3, X3, R3-R20) were added to this analysis in order to
evaluate their performance.
Our expert clinician quality assured the IOS data collected from all of the 47 children IOS data
and classified them into four groups: 6 children were considered to be Healthy (or Normal), 4 children
were classified as PSAI, 11 manifested definite SAI and 24 presented as Asthmatics. Children in these
four groups were either Anglo or Hispanic based upon their parent’s declarations in the questionnaires.
Mean ± standard deviation and range values for each IOS and model parameters analyzed are
presented in Table 6.30 for Healthy children, in Table 6.31 for PSAI children, in Table 6.32 for children
with SAI, and in Table 6.33 for those with Asthma for this pre- and post-B data collected in 2008.
Table 6.30 Healthy children IOS and Models Parameters Pre- and Post-B (N=6)
IOS Measurements and Model Parameters
Healthy Group N=6 Pre-Bronchodilation Post-Bronchodilation
Range Mean±SD Range Mean±SD R3 (kPa/l/s) 0.34-0.59 0.41±0.09 R3 (kPa/l/s) 0.30-0.54 0.38±0.08 R5(kPa/l/s) 0.29-0.51 0.35±0.08 R5(kPa/l/s) 0.25-0.48 0.33±0.08
R3-R20(kPa/l/s) 0.05-0.12 0.09±0.02 R3-R20(kPa/l/s) 0.03-0.13 0.08±0.04 R5-R20(kPa/l/s) -0.01-0.07 0.03±0.03 R5-R20(kPa/l/s) -0.02-0.08 0.03±0.04
X3(kPa/l/s) -0.21-(-0.09) -0.16±0.05 X3(kPa/l/s) -0.22-(-0.09) -0.15±0.05 X5(kPa/l/s) -0.13-(-0.07) -0.10±0.02 X5(kPa/l/s) -0.13-(-0.08) -0.10±0.02
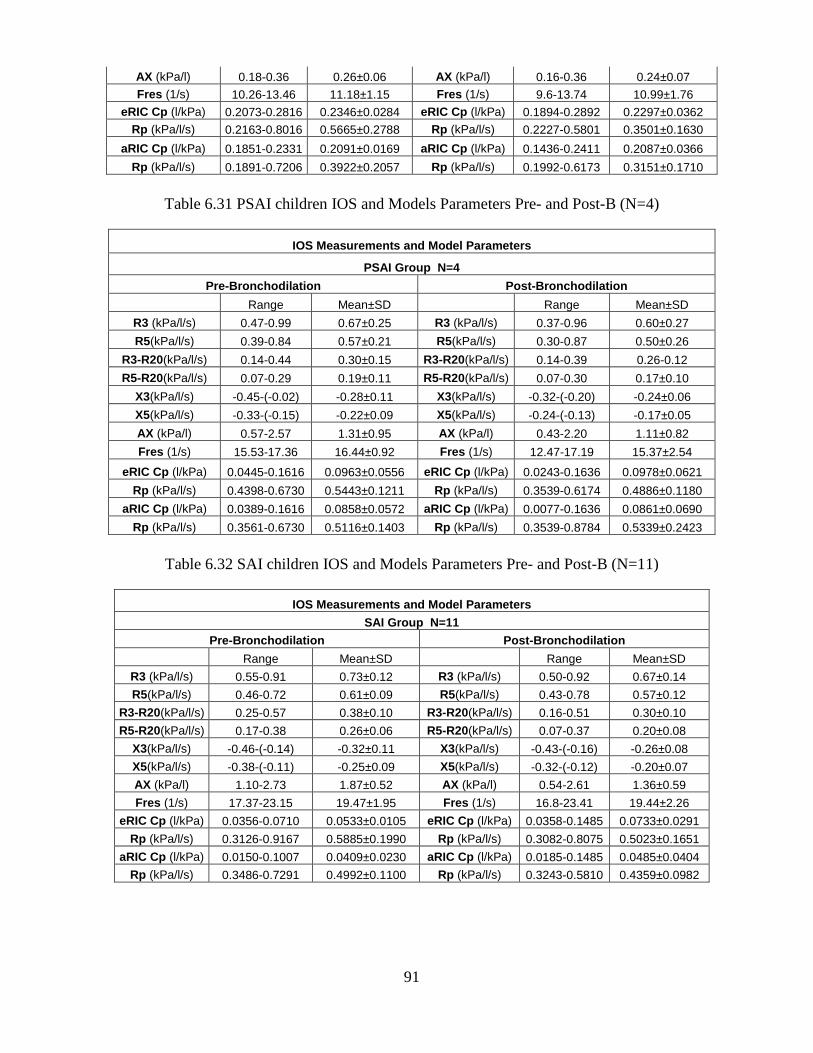
91
AX (kPa/l) 0.18-0.36 0.26±0.06 AX (kPa/l) 0.16-0.36 0.24±0.07 Fres (1/s) 10.26-13.46 11.18±1.15 Fres (1/s) 9.6-13.74 10.99±1.76
eRIC Cp (l/kPa) 0.2073-0.2816 0.2346±0.0284 eRIC Cp (l/kPa) 0.1894-0.2892 0.2297±0.0362 Rp (kPa/l/s) 0.2163-0.8016 0.5665±0.2788 Rp (kPa/l/s) 0.2227-0.5801 0.3501±0.1630
aRIC Cp (l/kPa) 0.1851-0.2331 0.2091±0.0169 aRIC Cp (l/kPa) 0.1436-0.2411 0.2087±0.0366
Rp (kPa/l/s) 0.1891-0.7206 0.3922±0.2057 Rp (kPa/l/s) 0.1992-0.6173 0.3151±0.1710
Table 6.31 PSAI children IOS and Models Parameters Pre- and Post-B (N=4)
IOS Measurements and Model Parameters
PSAI Group N=4
Pre-Bronchodilation Post-Bronchodilation
Range Mean±SD Range Mean±SD
R3 (kPa/l/s) 0.47-0.99 0.67±0.25 R3 (kPa/l/s) 0.37-0.96 0.60±0.27
R5(kPa/l/s) 0.39-0.84 0.57±0.21 R5(kPa/l/s) 0.30-0.87 0.50±0.26
R3-R20(kPa/l/s) 0.14-0.44 0.30±0.15 R3-R20(kPa/l/s) 0.14-0.39 0.26-0.12
R5-R20(kPa/l/s) 0.07-0.29 0.19±0.11 R5-R20(kPa/l/s) 0.07-0.30 0.17±0.10
X3(kPa/l/s) -0.45-(-0.02) -0.28±0.11 X3(kPa/l/s) -0.32-(-0.20) -0.24±0.06
X5(kPa/l/s) -0.33-(-0.15) -0.22±0.09 X5(kPa/l/s) -0.24-(-0.13) -0.17±0.05
AX (kPa/l) 0.57-2.57 1.31±0.95 AX (kPa/l) 0.43-2.20 1.11±0.82
Fres (1/s) 15.53-17.36 16.44±0.92 Fres (1/s) 12.47-17.19 15.37±2.54
eRIC Cp (l/kPa) 0.0445-0.1616 0.0963±0.0556 eRIC Cp (l/kPa) 0.0243-0.1636 0.0978±0.0621
Rp (kPa/l/s) 0.4398-0.6730 0.5443±0.1211 Rp (kPa/l/s) 0.3539-0.6174 0.4886±0.1180
aRIC Cp (l/kPa) 0.0389-0.1616 0.0858±0.0572 aRIC Cp (l/kPa) 0.0077-0.1636 0.0861±0.0690
Rp (kPa/l/s) 0.3561-0.6730 0.5116±0.1403 Rp (kPa/l/s) 0.3539-0.8784 0.5339±0.2423
Table 6.32 SAI children IOS and Models Parameters Pre- and Post-B (N=11)
IOS Measurements and Model Parameters
SAI Group N=11
Pre-Bronchodilation Post-Bronchodilation
Range Mean±SD Range Mean±SD
R3 (kPa/l/s) 0.55-0.91 0.73±0.12 R3 (kPa/l/s) 0.50-0.92 0.67±0.14
R5(kPa/l/s) 0.46-0.72 0.61±0.09 R5(kPa/l/s) 0.43-0.78 0.57±0.12
R3-R20(kPa/l/s) 0.25-0.57 0.38±0.10 R3-R20(kPa/l/s) 0.16-0.51 0.30±0.10
R5-R20(kPa/l/s) 0.17-0.38 0.26±0.06 R5-R20(kPa/l/s) 0.07-0.37 0.20±0.08
X3(kPa/l/s) -0.46-(-0.14) -0.32±0.11 X3(kPa/l/s) -0.43-(-0.16) -0.26±0.08
X5(kPa/l/s) -0.38-(-0.11) -0.25±0.09 X5(kPa/l/s) -0.32-(-0.12) -0.20±0.07
AX (kPa/l) 1.10-2.73 1.87±0.52 AX (kPa/l) 0.54-2.61 1.36±0.59
Fres (1/s) 17.37-23.15 19.47±1.95 Fres (1/s) 16.8-23.41 19.44±2.26
eRIC Cp (l/kPa) 0.0356-0.0710 0.0533±0.0105 eRIC Cp (l/kPa) 0.0358-0.1485 0.0733±0.0291
Rp (kPa/l/s) 0.3126-0.9167 0.5885±0.1990 Rp (kPa/l/s) 0.3082-0.8075 0.5023±0.1651
aRIC Cp (l/kPa) 0.0150-0.1007 0.0409±0.0230 aRIC Cp (l/kPa) 0.0185-0.1485 0.0485±0.0404
Rp (kPa/l/s) 0.3486-0.7291 0.4992±0.1100 Rp (kPa/l/s) 0.3243-0.5810 0.4359±0.0982
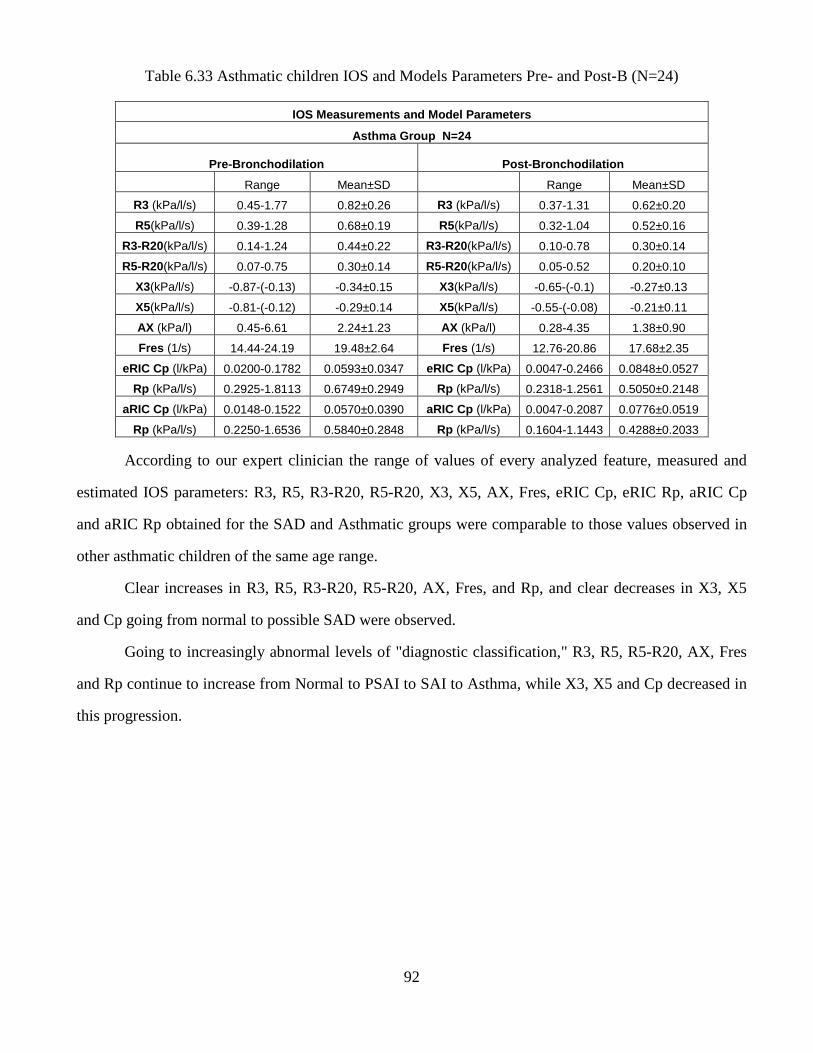
92
Table 6.33 Asthmatic children IOS and Models Parameters Pre- and Post-B (N=24)
IOS Measurements and Model Parameters
Asthma Group N=24
Pre-Bronchodilation Post-Bronchodilation
Range Mean±SD Range Mean±SD
R3 (kPa/l/s) 0.45-1.77 0.82±0.26 R3 (kPa/l/s) 0.37-1.31 0.62±0.20
R5(kPa/l/s) 0.39-1.28 0.68±0.19 R5(kPa/l/s) 0.32-1.04 0.52±0.16
R3-R20(kPa/l/s) 0.14-1.24 0.44±0.22 R3-R20(kPa/l/s) 0.10-0.78 0.30±0.14
R5-R20(kPa/l/s) 0.07-0.75 0.30±0.14 R5-R20(kPa/l/s) 0.05-0.52 0.20±0.10
X3(kPa/l/s) -0.87-(-0.13) -0.34±0.15 X3(kPa/l/s) -0.65-(-0.1) -0.27±0.13
X5(kPa/l/s) -0.81-(-0.12) -0.29±0.14 X5(kPa/l/s) -0.55-(-0.08) -0.21±0.11
AX (kPa/l) 0.45-6.61 2.24±1.23 AX (kPa/l) 0.28-4.35 1.38±0.90
Fres (1/s) 14.44-24.19 19.48±2.64 Fres (1/s) 12.76-20.86 17.68±2.35
eRIC Cp (l/kPa) 0.0200-0.1782 0.0593±0.0347 eRIC Cp (l/kPa) 0.0047-0.2466 0.0848±0.0527
Rp (kPa/l/s) 0.2925-1.8113 0.6749±0.2949 Rp (kPa/l/s) 0.2318-1.2561 0.5050±0.2148
aRIC Cp (l/kPa) 0.0148-0.1522 0.0570±0.0390 aRIC Cp (l/kPa) 0.0047-0.2087 0.0776±0.0519
Rp (kPa/l/s) 0.2250-1.6536 0.5840±0.2848 Rp (kPa/l/s) 0.1604-1.1443 0.4288±0.2033
According to our expert clinician the range of values of every analyzed feature, measured and
estimated IOS parameters: R3, R5, R3-R20, R5-R20, X3, X5, AX, Fres, eRIC Cp, eRIC Rp, aRIC Cp
and aRIC Rp obtained for the SAD and Asthmatic groups were comparable to those values observed in
other asthmatic children of the same age range.
Clear increases in R3, R5, R3-R20, R5-R20, AX, Fres, and Rp, and clear decreases in X3, X5
and Cp going from normal to possible SAD were observed.
Going to increasingly abnormal levels of "diagnostic classification," R3, R5, R5-R20, AX, Fres
and Rp continue to increase from Normal to PSAI to SAI to Asthma, while X3, X5 and Cp decreased in
this progression.
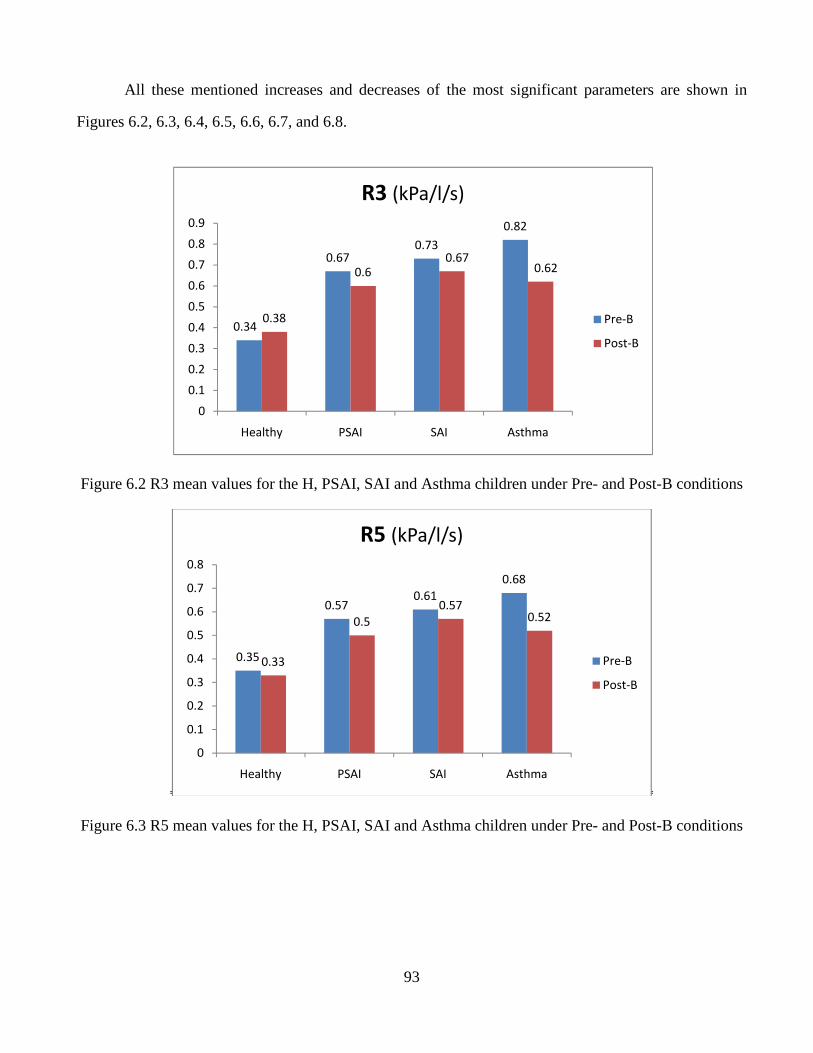
93
All these mentioned increases and decreases of the most significant parameters are shown in
Figures 6.2, 6.3, 6.4, 6.5, 6.6, 6.7, and 6.8.
Figure 6.2 R3 mean values for the H, PSAI, SAI and Asthma children under Pre- and Post-B conditions
Figure 6.3 R5 mean values for the H, PSAI, SAI and Asthma children under Pre- and Post-B conditions
0.35
0.570.61
0.68
0.33
0.5
0.570.52
0
0.1
0.2
0.3
0.4
0.5
0.6
0.7
0.8
Healthy PSAI SAI Asthma
R5 (kPa/l/s)
Pre-B
Post-B
0.34
0.670.73
0.82
0.38
0.60.67
0.62
0
0.1
0.2
0.3
0.4
0.5
0.6
0.7
0.8
0.9
Healthy PSAI SAI Asthma
R3 (kPa/l/s)
Pre-B
Post-B
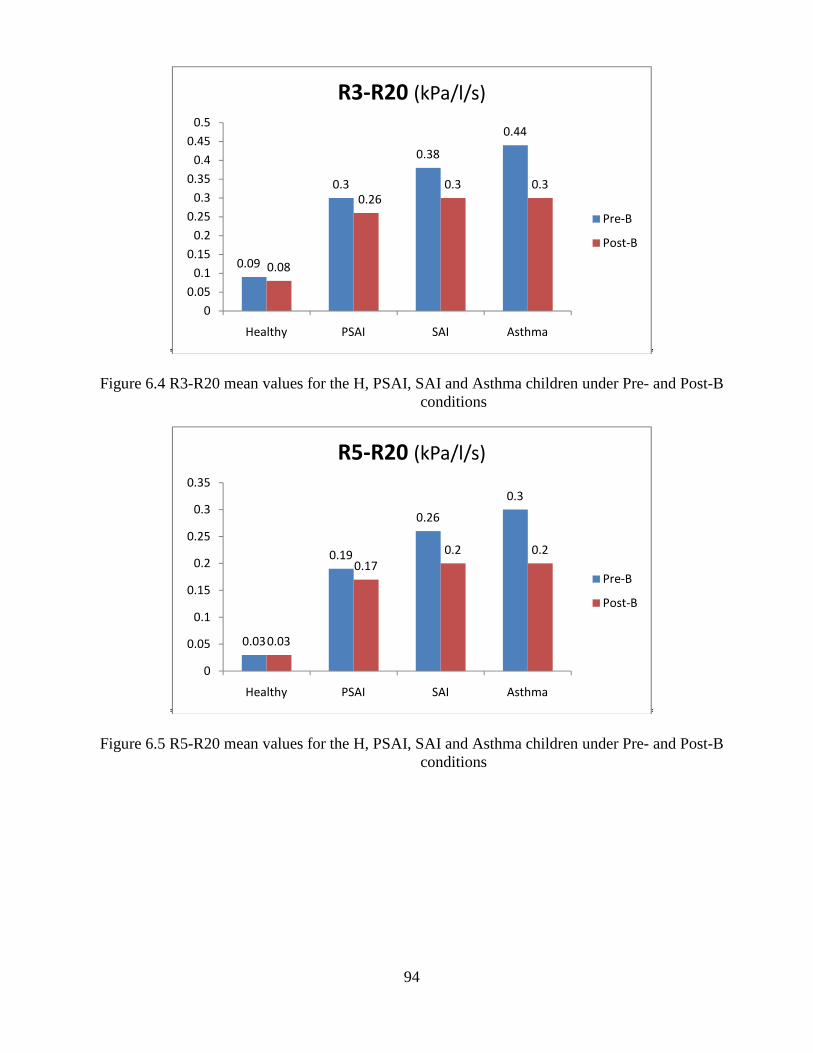
94
Figure 6.4 R3-R20 mean values for the H, PSAI, SAI and Asthma children under Pre- and Post-B conditions
Figure 6.5 R5-R20 mean values for the H, PSAI, SAI and Asthma children under Pre- and Post-B conditions
0.09
0.3
0.38
0.44
0.08
0.260.3 0.3
0
0.05
0.1
0.15
0.2
0.25
0.3
0.35
0.4
0.45
0.5
Healthy PSAI SAI Asthma
R3-R20 (kPa/l/s)
Pre-B
Post-B
0.03
0.19
0.26
0.3
0.03
0.17
0.2 0.2
0
0.05
0.1
0.15
0.2
0.25
0.3
0.35
Healthy PSAI SAI Asthma
R5-R20 (kPa/l/s)
Pre-B
Post-B
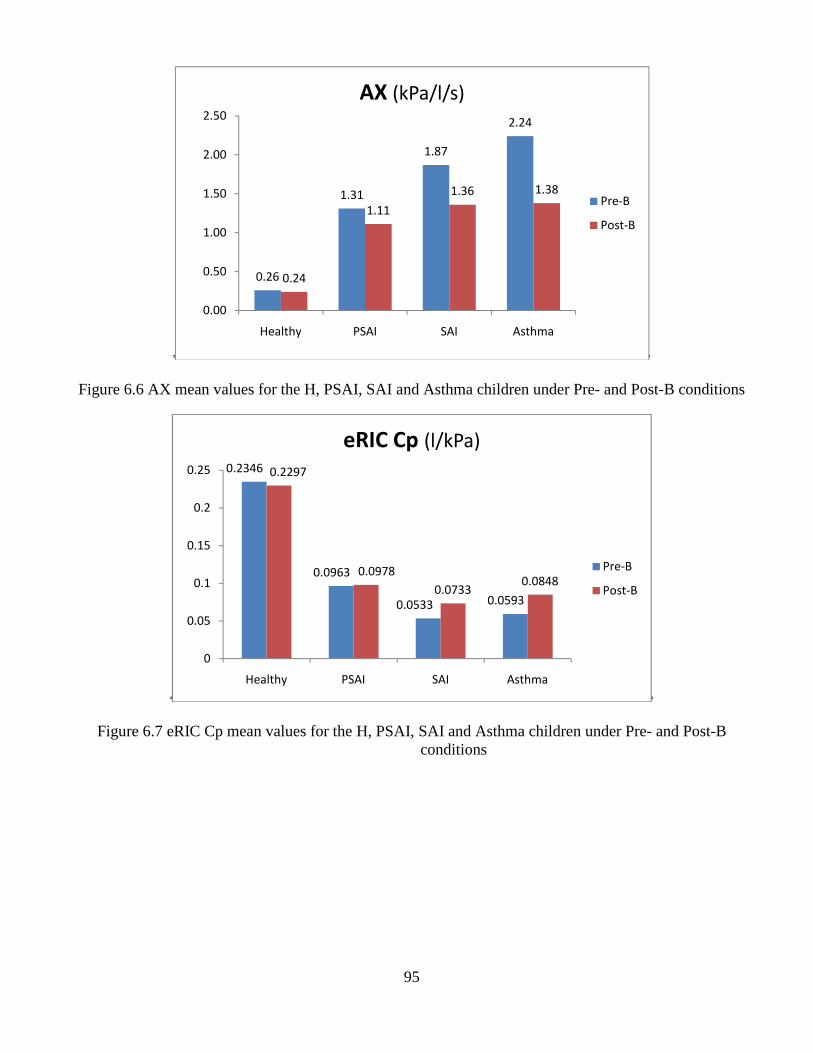
95
Figure 6.6 AX mean values for the H, PSAI, SAI and Asthma children under Pre- and Post-B conditions
Figure 6.7 eRIC Cp mean values for the H, PSAI, SAI and Asthma children under Pre- and Post-B conditions
0.26
1.31
1.87
2.24
0.24
1.11
1.36 1.38
0.00
0.50
1.00
1.50
2.00
2.50
Healthy PSAI SAI Asthma
AX (kPa/l/s)
Pre-B
Post-B
0.2346
0.0963
0.0533 0.0593
0.2297
0.0978
0.07330.0848
0
0.05
0.1
0.15
0.2
0.25
Healthy PSAI SAI Asthma
eRIC Cp (l/kPa)
Pre-B
Post-B
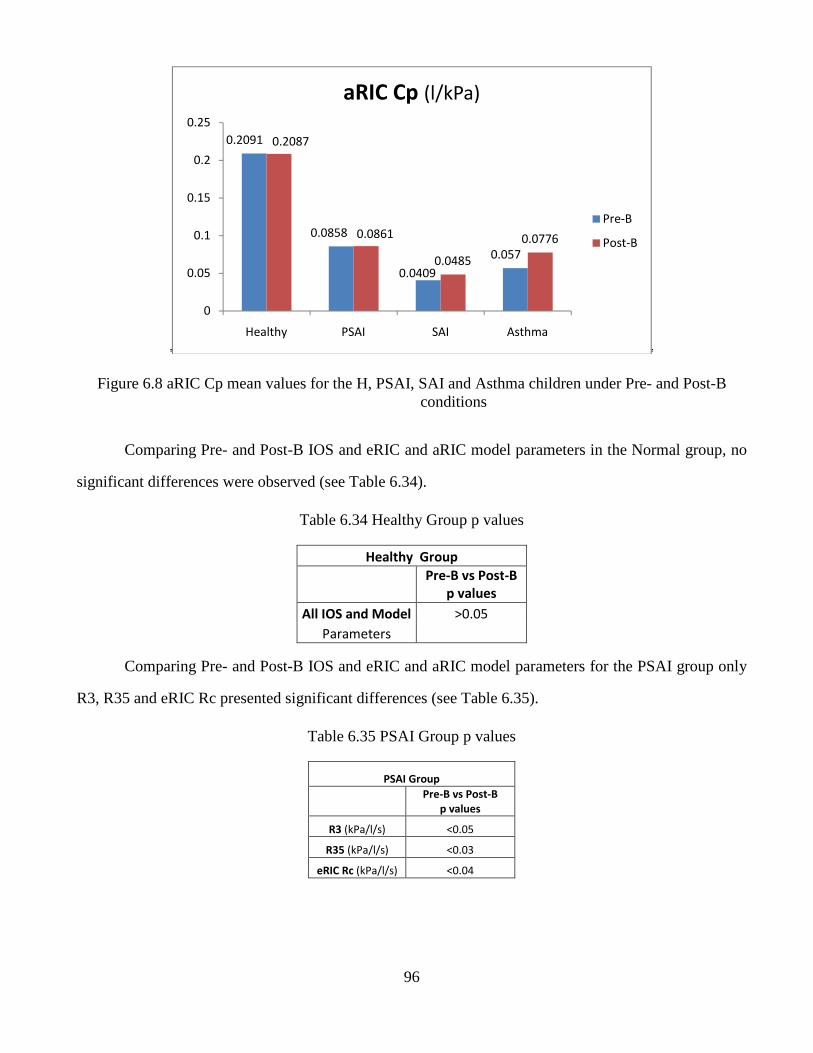
96
Figure 6.8 aRIC Cp mean values for the H, PSAI, SAI and Asthma children under Pre- and Post-B conditions
Comparing Pre- and Post-B IOS and eRIC and aRIC model parameters in the Normal group, no
significant differences were observed (see Table 6.34).
Table 6.34 Healthy Group p values
Healthy Group
Pre-B vs Post-B
p values
All IOS and Model >0.05
Parameters
Comparing Pre- and Post-B IOS and eRIC and aRIC model parameters for the PSAI group only
R3, R35 and eRIC Rc presented significant differences (see Table 6.35).
Table 6.35 PSAI Group p values
PSAI Group
Pre-B vs Post-B
p values
R3 (kPa/l/s) <0.05
R35 (kPa/l/s) <0.03
eRIC Rc (kPa/l/s) <0.04
0.2091
0.0858
0.0409
0.057
0.2087
0.0861
0.0485
0.0776
0
0.05
0.1
0.15
0.2
0.25
Healthy PSAI SAI Asthma
aRIC Cp (l/kPa)
Pre-B
Post-B
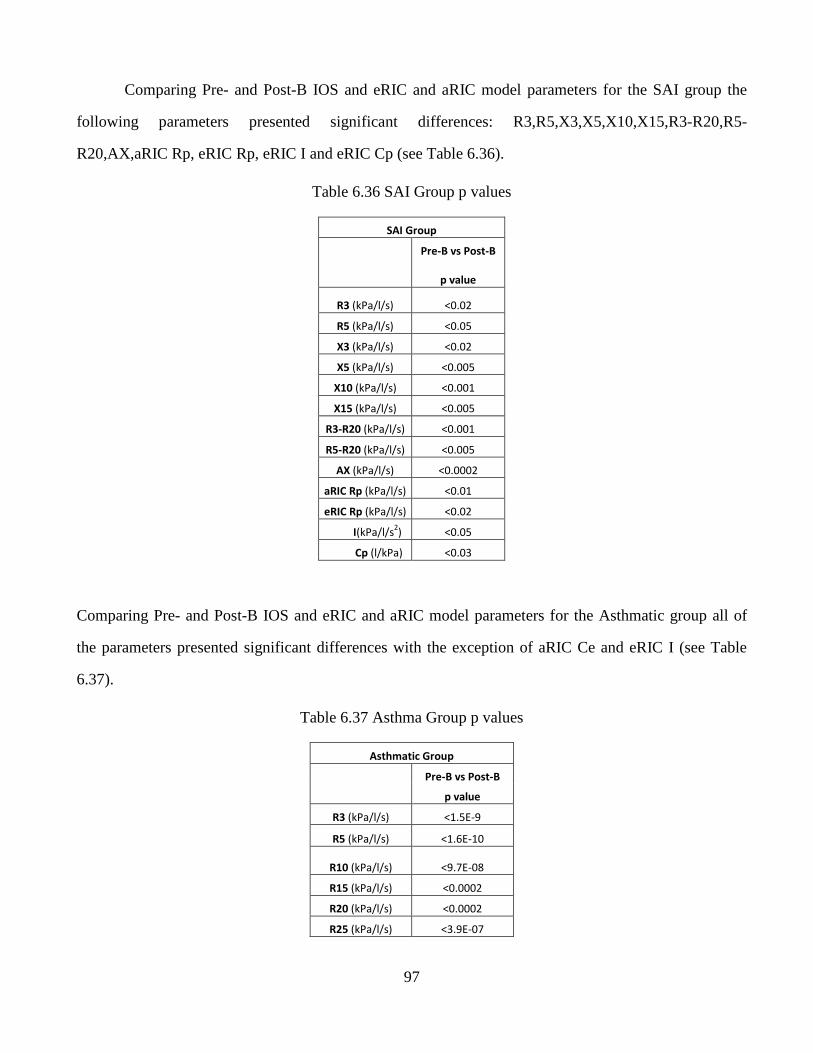
97
Comparing Pre- and Post-B IOS and eRIC and aRIC model parameters for the SAI group the
following parameters presented significant differences: R3,R5,X3,X5,X10,X15,R3-R20,R5-
R20,AX,aRIC Rp, eRIC Rp, eRIC I and eRIC Cp (see Table 6.36).
Table 6.36 SAI Group p values
SAI Group
Pre-B vs Post-B
p value
R3 (kPa/l/s) <0.02
R5 (kPa/l/s) <0.05
X3 (kPa/l/s) <0.02
X5 (kPa/l/s) <0.005
X10 (kPa/l/s) <0.001
X15 (kPa/l/s) <0.005
R3-R20 (kPa/l/s) <0.001
R5-R20 (kPa/l/s) <0.005
AX (kPa/l/s) <0.0002
aRIC Rp (kPa/l/s) <0.01
eRIC Rp (kPa/l/s) <0.02
I(kPa/l/s2) <0.05
Cp (l/kPa) <0.03
Comparing Pre- and Post-B IOS and eRIC and aRIC model parameters for the Asthmatic group all of
the parameters presented significant differences with the exception of aRIC Ce and eRIC I (see Table
6.37).
Table 6.37 Asthma Group p values
Asthmatic Group
Pre-B vs Post-B
p value
R3 (kPa/l/s) <1.5E-9
R5 (kPa/l/s) <1.6E-10
R10 (kPa/l/s) <9.7E-08
R15 (kPa/l/s) <0.0002
R20 (kPa/l/s) <0.0002
R25 (kPa/l/s) <3.9E-07
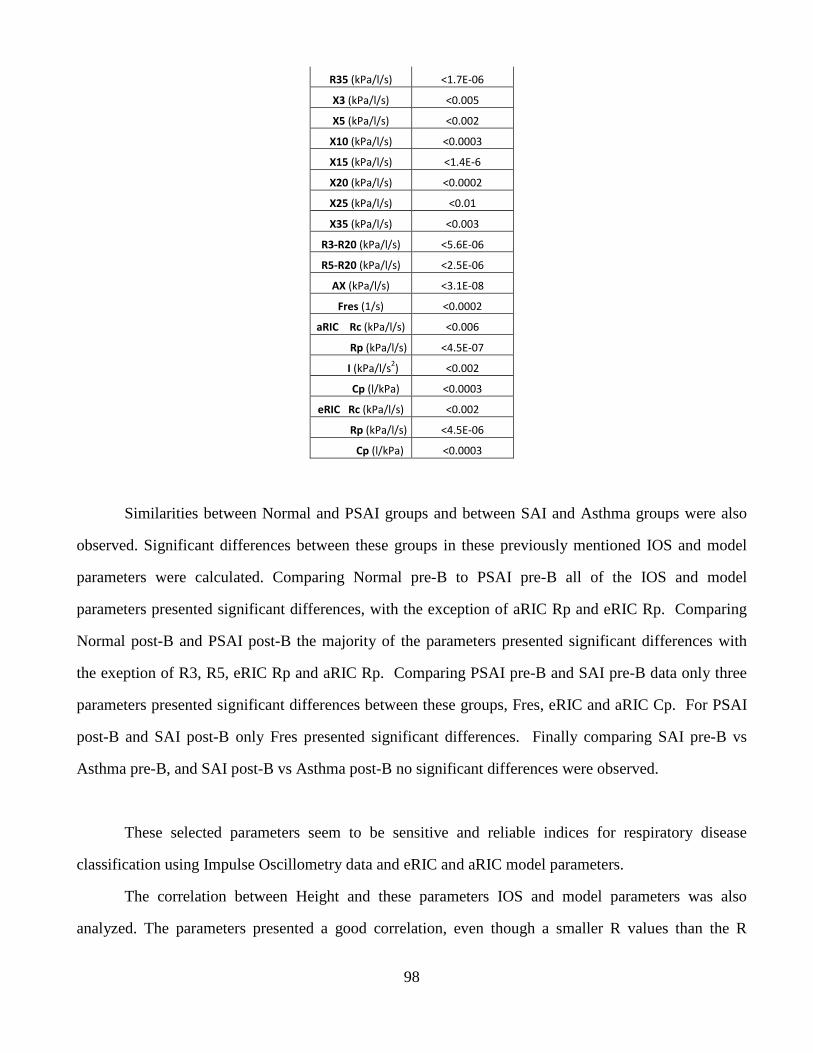
98
R35 (kPa/l/s) <1.7E-06
X3 (kPa/l/s) <0.005
X5 (kPa/l/s) <0.002
X10 (kPa/l/s) <0.0003
X15 (kPa/l/s) <1.4E-6
X20 (kPa/l/s) <0.0002
X25 (kPa/l/s) <0.01
X35 (kPa/l/s) <0.003
R3-R20 (kPa/l/s) <5.6E-06
R5-R20 (kPa/l/s) <2.5E-06
AX (kPa/l/s) <3.1E-08
Fres (1/s) <0.0002
aRIC Rc (kPa/l/s) <0.006
Rp (kPa/l/s) <4.5E-07
I (kPa/l/s2) <0.002
Cp (l/kPa) <0.0003
eRIC Rc (kPa/l/s) <0.002
Rp (kPa/l/s) <4.5E-06
Cp (l/kPa) <0.0003
Similarities between Normal and PSAI groups and between SAI and Asthma groups were also
observed. Significant differences between these groups in these previously mentioned IOS and model
parameters were calculated. Comparing Normal pre-B to PSAI pre-B all of the IOS and model
parameters presented significant differences, with the exception of aRIC Rp and eRIC Rp. Comparing
Normal post-B and PSAI post-B the majority of the parameters presented significant differences with
the exeption of R3, R5, eRIC Rp and aRIC Rp. Comparing PSAI pre-B and SAI pre-B data only three
parameters presented significant differences between these groups, Fres, eRIC and aRIC Cp. For PSAI
post-B and SAI post-B only Fres presented significant differences. Finally comparing SAI pre-B vs
Asthma pre-B, and SAI post-B vs Asthma post-B no significant differences were observed.
These selected parameters seem to be sensitive and reliable indices for respiratory disease
classification using Impulse Oscillometry data and eRIC and aRIC model parameters.
The correlation between Height and these parameters IOS and model parameters was also
analyzed. The parameters presented a good correlation, even though a smaller R values than the R
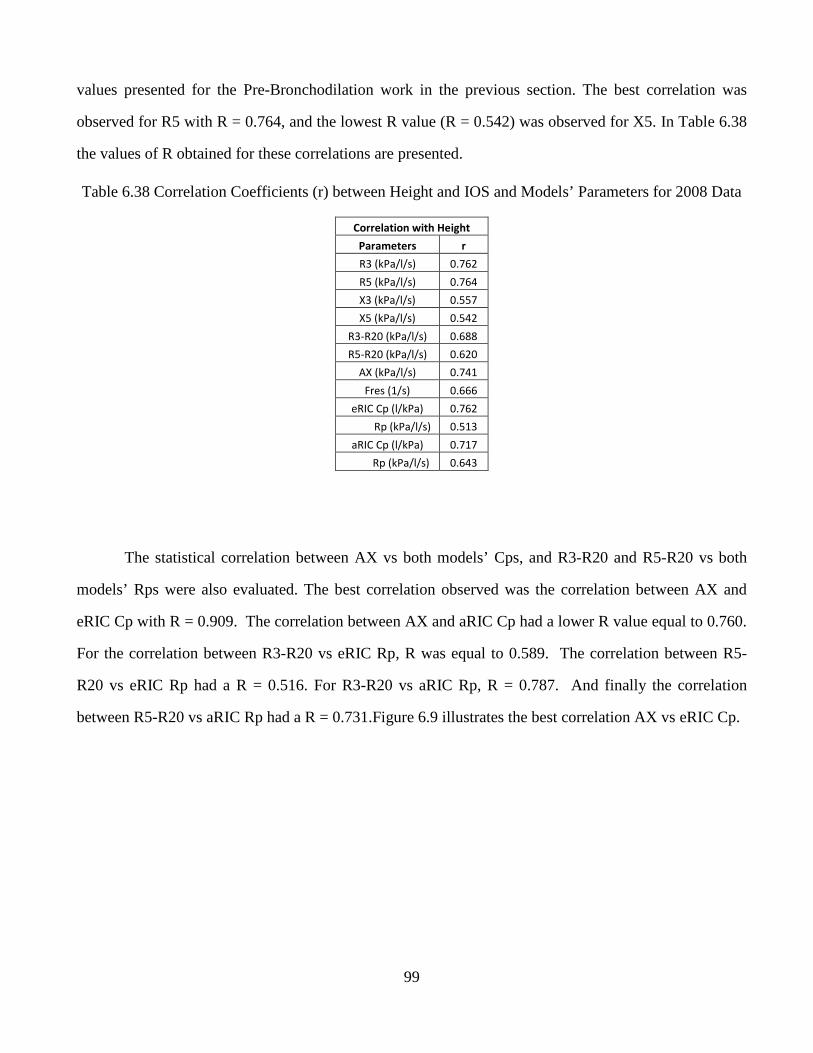
99
values presented for the Pre-Bronchodilation work in the previous section. The best correlation was
observed for R5 with R = 0.764, and the lowest R value (R = 0.542) was observed for X5. In Table 6.38
the values of R obtained for these correlations are presented.
Table 6.38 Correlation Coefficients (r) between Height and IOS and Models’ Parameters for 2008 Data
Correlation with Height
Parameters r
R3 (kPa/l/s) 0.762
R5 (kPa/l/s) 0.764
X3 (kPa/l/s) 0.557
X5 (kPa/l/s) 0.542
R3-R20 (kPa/l/s) 0.688
R5-R20 (kPa/l/s) 0.620
AX (kPa/l/s) 0.741
Fres (1/s) 0.666
eRIC Cp (l/kPa) 0.762
Rp (kPa/l/s) 0.513
aRIC Cp (l/kPa) 0.717
Rp (kPa/l/s) 0.643
The statistical correlation between AX vs both models’ Cps, and R3-R20 and R5-R20 vs both
models’ Rps were also evaluated. The best correlation observed was the correlation between AX and
eRIC Cp with R = 0.909. The correlation between AX and aRIC Cp had a lower R value equal to 0.760.
For the correlation between R3-R20 vs eRIC Rp, R was equal to 0.589. The correlation between R5-
R20 vs eRIC Rp had a R = 0.516. For R3-R20 vs aRIC Rp, R = 0.787. And finally the correlation
between R5-R20 vs aRIC Rp had a R = 0.731.Figure 6.9 illustrates the best correlation AX vs eRIC Cp.
100
Figure 6.9 Correlation between AX and eRIC Cp for pre- and post-B data
6.3 RESULTS AND DISCUSSIONS FROM HYPOTHESIS 3
Hypothesis 3
The expected growth-related improvement in IOS and eRIC/aRIC parameter estimates will be
greater in Normal/PSAI children than in SAI/Asthmatic children.
6.3.1 Pre- and Post-bronchodilation work over a 2 years period
To address hypothesis 3 the work previously presented in the ERS conference in 2009 was
expanded (97) . From this expanded work based on IOS, eRIC and aRIC model changes over a two-
year period, a Journal Paper was developed. It was recently published in the Biomedical Engineering
Online Journal in March 2011 (98).
This Journal Paper focused on determination of the sensitivity of IOS parameters to show
growth-related changes (increases or decreases), over a two-year period, and to analyze eRIC and aRIC
model parameter estimates of lung function in Healthy (H) and Small Airway Impaired (SAI) children,
to evaluate the performance of these models in quantifying airway function in this population and to
show the correlation of these model parameters with IOS measures. In this paper we use the terms
Healthy (H) and Normal (N) interchangeably.
y = 0.0808x-0.763
R² = 0.8271
0
0.1
0.2
0.3
0.4
0 2 4 6 8e
RIC
Cp
(l/
kP
a)
AX (kPa/l)
AX vs eRIC Cp
eRIC Cp
Power (eRIC Cp)
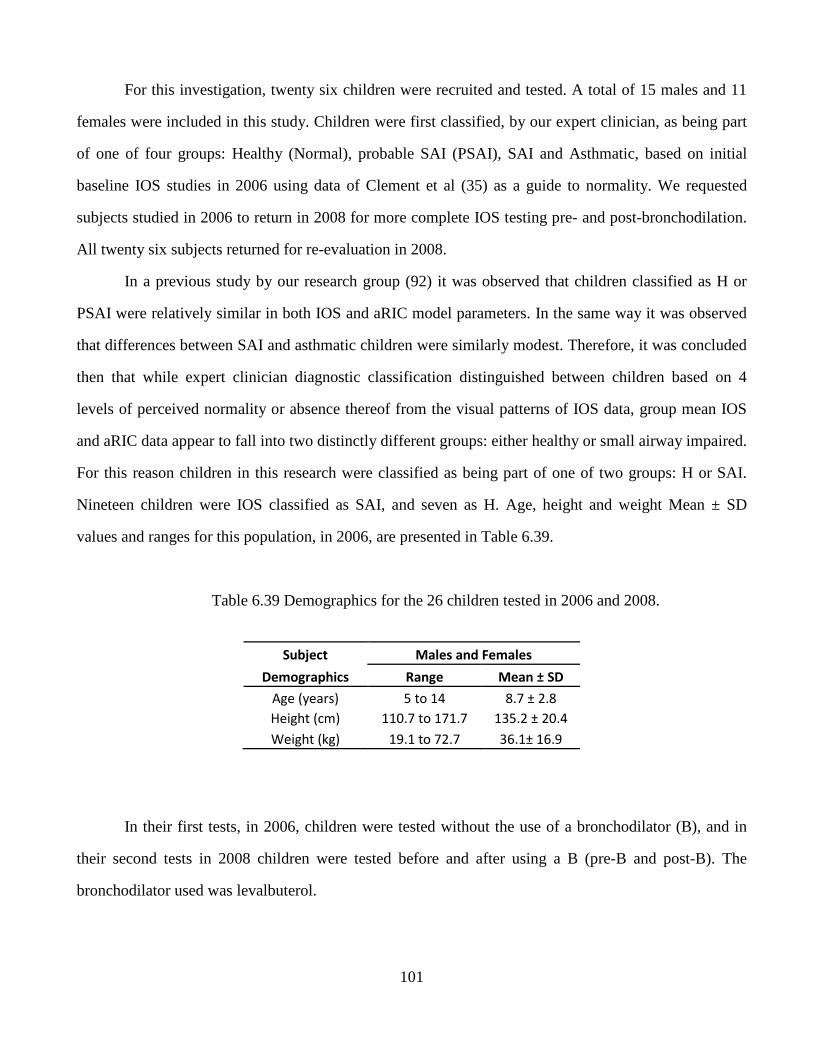
101
For this investigation, twenty six children were recruited and tested. A total of 15 males and 11
females were included in this study. Children were first classified, by our expert clinician, as being part
of one of four groups: Healthy (Normal), probable SAI (PSAI), SAI and Asthmatic, based on initial
baseline IOS studies in 2006 using data of Clement et al (35) as a guide to normality. We requested
subjects studied in 2006 to return in 2008 for more complete IOS testing pre- and post-bronchodilation.
All twenty six subjects returned for re-evaluation in 2008.
In a previous study by our research group (92) it was observed that children classified as H or
PSAI were relatively similar in both IOS and aRIC model parameters. In the same way it was observed
that differences between SAI and asthmatic children were similarly modest. Therefore, it was concluded
then that while expert clinician diagnostic classification distinguished between children based on 4
levels of perceived normality or absence thereof from the visual patterns of IOS data, group mean IOS
and aRIC data appear to fall into two distinctly different groups: either healthy or small airway impaired.
For this reason children in this research were classified as being part of one of two groups: H or SAI.
Nineteen children were IOS classified as SAI, and seven as H. Age, height and weight Mean ± SD
values and ranges for this population, in 2006, are presented in Table 6.39.
Table 6.39 Demographics for the 26 children tested in 2006 and 2008.
Subject Males and Females
Demographics Range Mean ± SD
Age (years) 5 to 14 8.7 ± 2.8
Height (cm) 110.7 to 171.7 135.2 ± 20.4
Weight (kg) 19.1 to 72.7 36.1± 16.9
In their first tests, in 2006, children were tested without the use of a bronchodilator (B), and in
their second tests in 2008 children were tested before and after using a B (pre-B and post-B). The
bronchodilator used was levalbuterol.
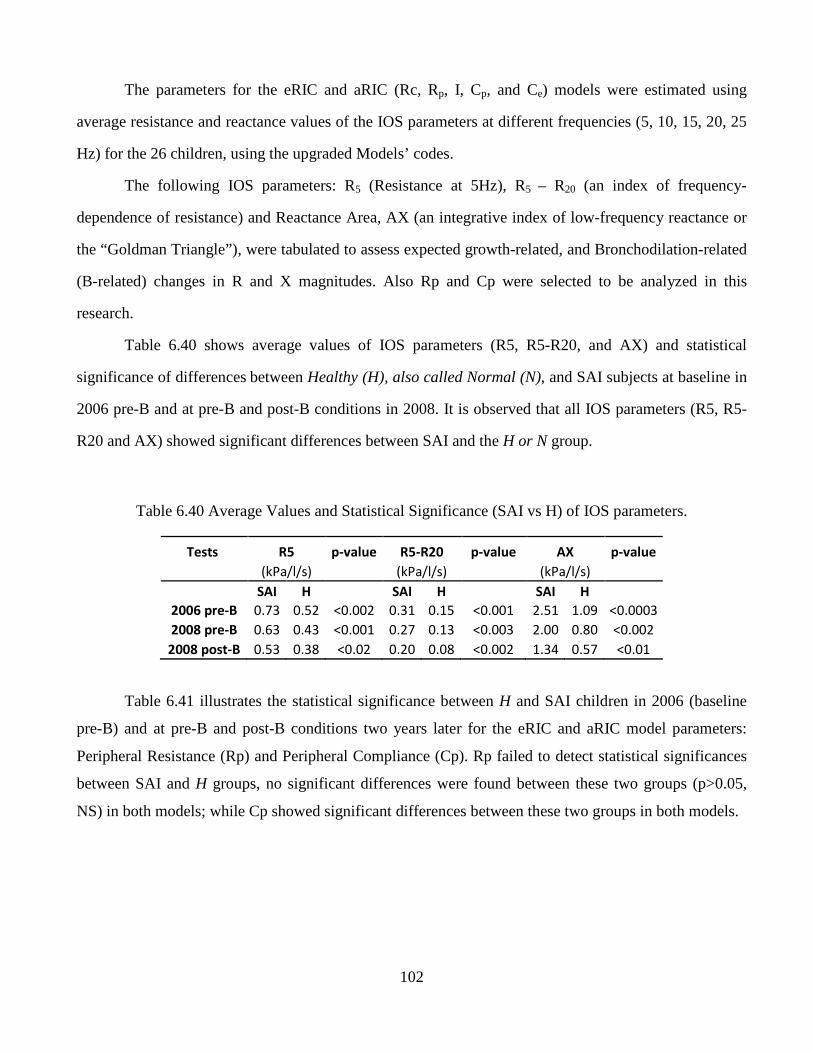
102
The parameters for the eRIC and aRIC (Rc, Rp, I, Cp, and Ce) models were estimated using
average resistance and reactance values of the IOS parameters at different frequencies (5, 10, 15, 20, 25
Hz) for the 26 children, using the upgraded Models’ codes.
The following IOS parameters: R5 (Resistance at 5Hz), R5 – R20 (an index of frequency-
dependence of resistance) and Reactance Area, AX (an integrative index of low-frequency reactance or
the “Goldman Triangle”), were tabulated to assess expected growth-related, and Bronchodilation-related
(B-related) changes in R and X magnitudes. Also Rp and Cp were selected to be analyzed in this
research.
Table 6.40 shows average values of IOS parameters (R5, R5-R20, and AX) and statistical
significance of differences between Healthy (H), also called Normal (N), and SAI subjects at baseline in
2006 pre-B and at pre-B and post-B conditions in 2008. It is observed that all IOS parameters (R5, R5-
R20 and AX) showed significant differences between SAI and the H or N group.
Table 6.40 Average Values and Statistical Significance (SAI vs H) of IOS parameters.
Tests R5 p-value R5-R20 p-value AX p-value
(kPa/l/s) (kPa/l/s) (kPa/l/s)
SAI H SAI H SAI H
2006 pre-B 0.73 0.52 <0.002 0.31 0.15 <0.001 2.51 1.09 <0.0003
2008 pre-B 0.63 0.43 <0.001 0.27 0.13 <0.003 2.00 0.80 <0.002
2008 post-B 0.53 0.38 <0.02 0.20 0.08 <0.002 1.34 0.57 <0.01
Table 6.41 illustrates the statistical significance between H and SAI children in 2006 (baseline
pre-B) and at pre-B and post-B conditions two years later for the eRIC and aRIC model parameters:
Peripheral Resistance (Rp) and Peripheral Compliance (Cp). Rp failed to detect statistical significances
between SAI and H groups, no significant differences were found between these two groups (p>0.05,
NS) in both models; while Cp showed significant differences between these two groups in both models.
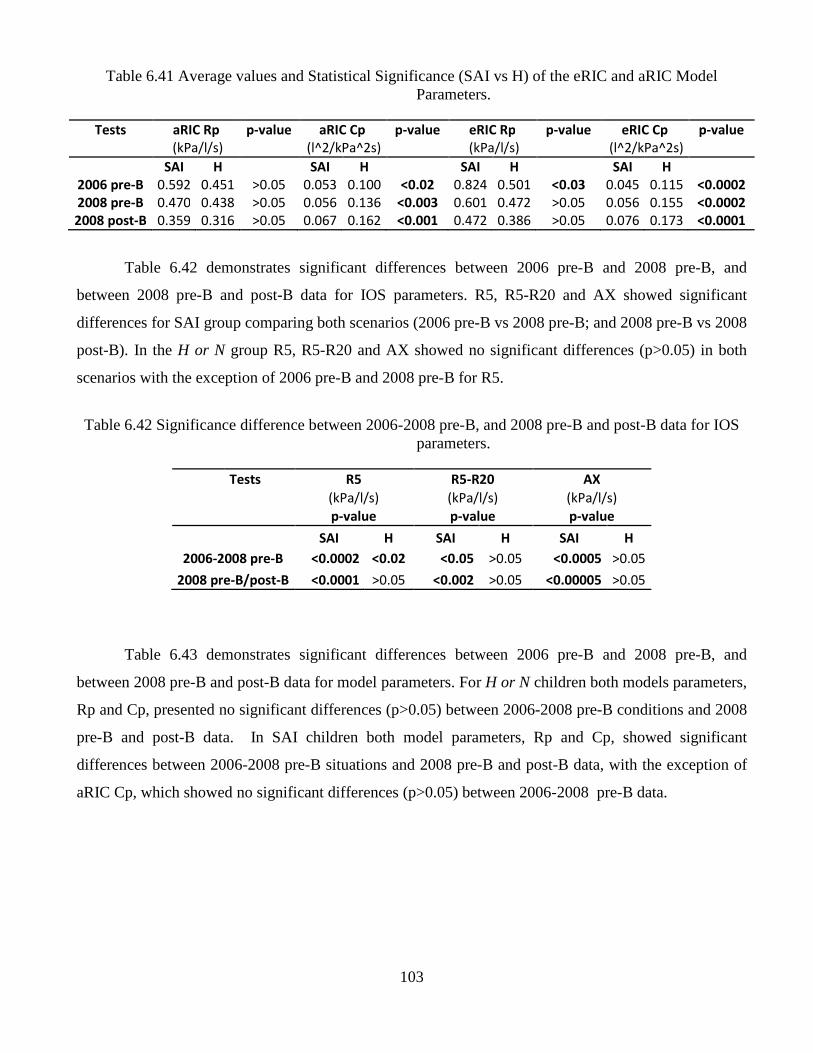
103
Table 6.41 Average values and Statistical Significance (SAI vs H) of the eRIC and aRIC Model Parameters.
Tests aRIC Rp p-value aRIC Cp p-value eRIC Rp p-value eRIC Cp p-value
(kPa/l/s) (l^2/kPa^2s) (kPa/l/s) (l^2/kPa^2s)
SAI H SAI H SAI H SAI H
2006 pre-B 0.592 0.451 >0.05 0.053 0.100 <0.02 0.824 0.501 <0.03 0.045 0.115 <0.0002
2008 pre-B 0.470 0.438 >0.05 0.056 0.136 <0.003 0.601 0.472 >0.05 0.056 0.155 <0.0002
2008 post-B 0.359 0.316 >0.05 0.067 0.162 <0.001 0.472 0.386 >0.05 0.076 0.173 <0.0001
Table 6.42 demonstrates significant differences between 2006 pre-B and 2008 pre-B, and
between 2008 pre-B and post-B data for IOS parameters. R5, R5-R20 and AX showed significant
differences for SAI group comparing both scenarios (2006 pre-B vs 2008 pre-B; and 2008 pre-B vs 2008
post-B). In the H or N group R5, R5-R20 and AX showed no significant differences (p>0.05) in both
scenarios with the exception of 2006 pre-B and 2008 pre-B for R5.
Table 6.42 Significance difference between 2006-2008 pre-B, and 2008 pre-B and post-B data for IOS parameters.
Tests R5 R5-R20 AX
(kPa/l/s) (kPa/l/s) (kPa/l/s)
p-value p-value p-value
SAI H SAI H SAI H
2006-2008 pre-B <0.0002 <0.02 <0.05 >0.05 <0.0005 >0.05
2008 pre-B/post-B <0.0001 >0.05 <0.002 >0.05 <0.00005 >0.05
Table 6.43 demonstrates significant differences between 2006 pre-B and 2008 pre-B, and
between 2008 pre-B and post-B data for model parameters. For H or N children both models parameters,
Rp and Cp, presented no significant differences (p>0.05) between 2006-2008 pre-B conditions and 2008
pre-B and post-B data. In SAI children both model parameters, Rp and Cp, showed significant
differences between 2006-2008 pre-B situations and 2008 pre-B and post-B data, with the exception of
aRIC Cp, which showed no significant differences (p>0.05) between 2006-2008 pre-B data.
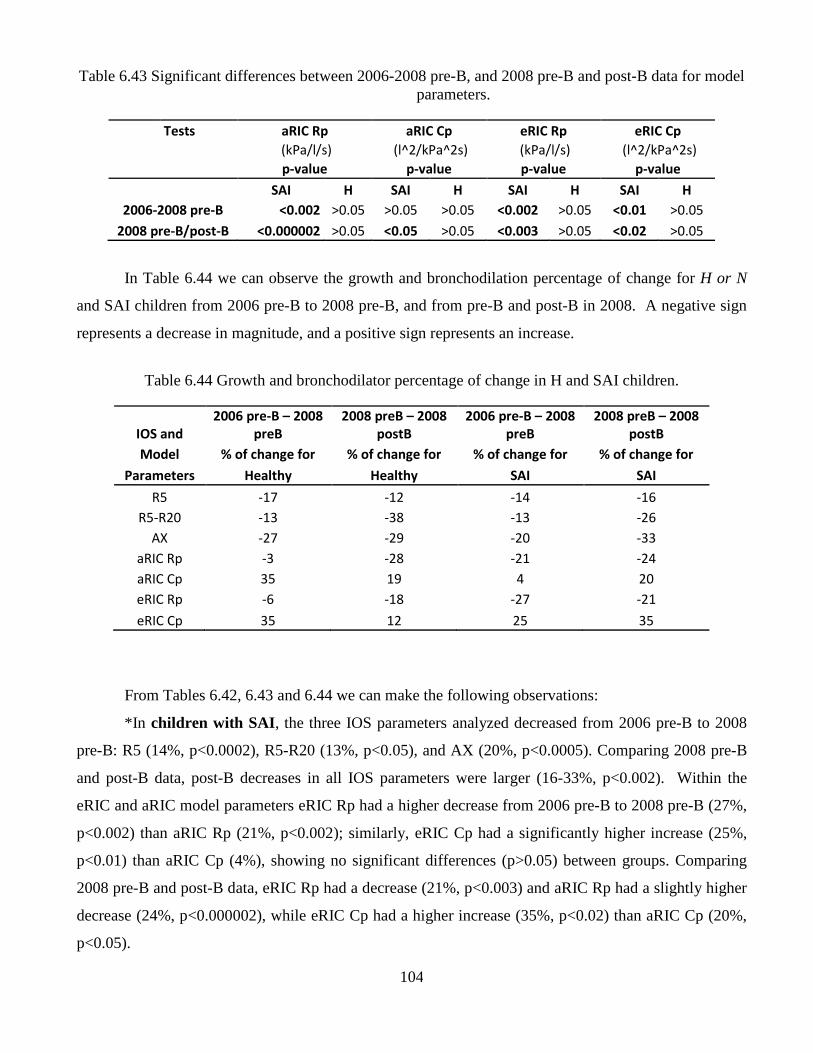
104
Table 6.43 Significant differences between 2006-2008 pre-B, and 2008 pre-B and post-B data for model parameters.
Tests aRIC Rp aRIC Cp eRIC Rp eRIC Cp
(kPa/l/s) (l^2/kPa^2s) (kPa/l/s) (l^2/kPa^2s)
p-value p-value p-value p-value
SAI H SAI H SAI H SAI H
2006-2008 pre-B <0.002 >0.05 >0.05 >0.05 <0.002 >0.05 <0.01 >0.05
2008 pre-B/post-B <0.000002 >0.05 <0.05 >0.05 <0.003 >0.05 <0.02 >0.05
In Table 6.44 we can observe the growth and bronchodilation percentage of change for H or N
and SAI children from 2006 pre-B to 2008 pre-B, and from pre-B and post-B in 2008. A negative sign
represents a decrease in magnitude, and a positive sign represents an increase.
Table 6.44 Growth and bronchodilator percentage of change in H and SAI children.
IOS and
2006 pre-B – 2008
preB
2008 preB – 2008
postB
2006 pre-B – 2008
preB
2008 preB – 2008
postB
Model % of change for % of change for % of change for % of change for
Parameters Healthy Healthy SAI SAI
R5 -17 -12 -14 -16
R5-R20 -13 -38 -13 -26
AX -27 -29 -20 -33
aRIC Rp -3 -28 -21 -24
aRIC Cp 35 19 4 20
eRIC Rp -6 -18 -27 -21
eRIC Cp 35 12 25 35
From Tables 6.42, 6.43 and 6.44 we can make the following observations:
*In children with SAI , the three IOS parameters analyzed decreased from 2006 pre-B to 2008
pre-B: R5 (14%, p<0.0002), R5-R20 (13%, p<0.05), and AX (20%, p<0.0005). Comparing 2008 pre-B
and post-B data, post-B decreases in all IOS parameters were larger (16-33%, p<0.002). Within the
eRIC and aRIC model parameters eRIC Rp had a higher decrease from 2006 pre-B to 2008 pre-B (27%,
p<0.002) than aRIC Rp (21%, p<0.002); similarly, eRIC Cp had a significantly higher increase (25%,
p<0.01) than aRIC Cp (4%), showing no significant differences (p>0.05) between groups. Comparing
2008 pre-B and post-B data, eRIC Rp had a decrease (21%, p<0.003) and aRIC Rp had a slightly higher
decrease (24%, p<0.000002), while eRIC Cp had a higher increase (35%, p<0.02) than aRIC Cp (20%,
p<0.05).
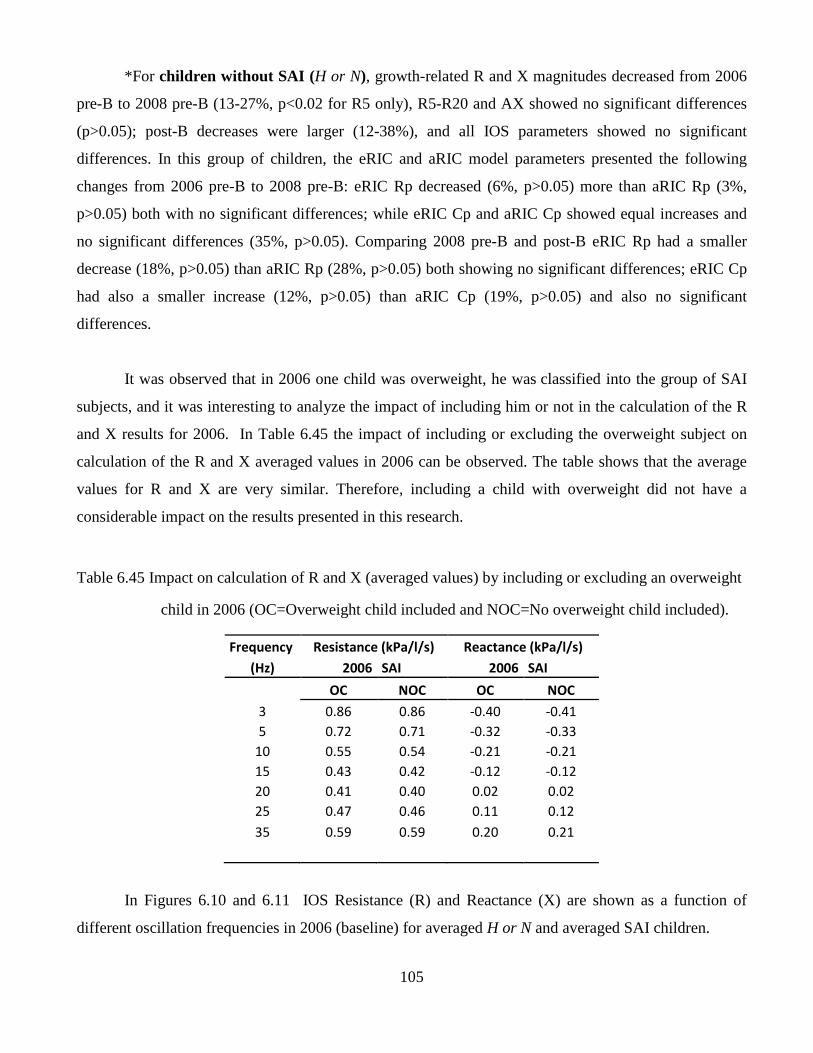
105
*For children without SAI (H or N), growth-related R and X magnitudes decreased from 2006
pre-B to 2008 pre-B (13-27%, p<0.02 for R5 only), R5-R20 and AX showed no significant differences
(p>0.05); post-B decreases were larger (12-38%), and all IOS parameters showed no significant
differences. In this group of children, the eRIC and aRIC model parameters presented the following
changes from 2006 pre-B to 2008 pre-B: eRIC Rp decreased (6%, p>0.05) more than aRIC Rp (3%,
p>0.05) both with no significant differences; while eRIC Cp and aRIC Cp showed equal increases and
no significant differences (35%, p>0.05). Comparing 2008 pre-B and post-B eRIC Rp had a smaller
decrease (18%, p>0.05) than aRIC Rp (28%, p>0.05) both showing no significant differences; eRIC Cp
had also a smaller increase (12%, p>0.05) than aRIC Cp (19%, p>0.05) and also no significant
differences.
It was observed that in 2006 one child was overweight, he was classified into the group of SAI
subjects, and it was interesting to analyze the impact of including him or not in the calculation of the R
and X results for 2006. In Table 6.45 the impact of including or excluding the overweight subject on
calculation of the R and X averaged values in 2006 can be observed. The table shows that the average
values for R and X are very similar. Therefore, including a child with overweight did not have a
considerable impact on the results presented in this research.
Table 6.45 Impact on calculation of R and X (averaged values) by including or excluding an overweight
child in 2006 (OC=Overweight child included and NOC=No overweight child included).
Frequency Resistance (kPa/l/s) Reactance (kPa/l/s)
(Hz) 2006 SAI 2006 SAI
OC NOC OC NOC
3 0.86 0.86 -0.40 -0.41
5 0.72 0.71 -0.32 -0.33
10 0.55 0.54 -0.21 -0.21
15 0.43 0.42 -0.12 -0.12
20 0.41 0.40 0.02 0.02
25 0.47 0.46 0.11 0.12
35 0.59 0.59 0.20 0.21
In Figures 6.10 and 6.11 IOS Resistance (R) and Reactance (X) are shown as a function of
different oscillation frequencies in 2006 (baseline) for averaged H or N and averaged SAI children.
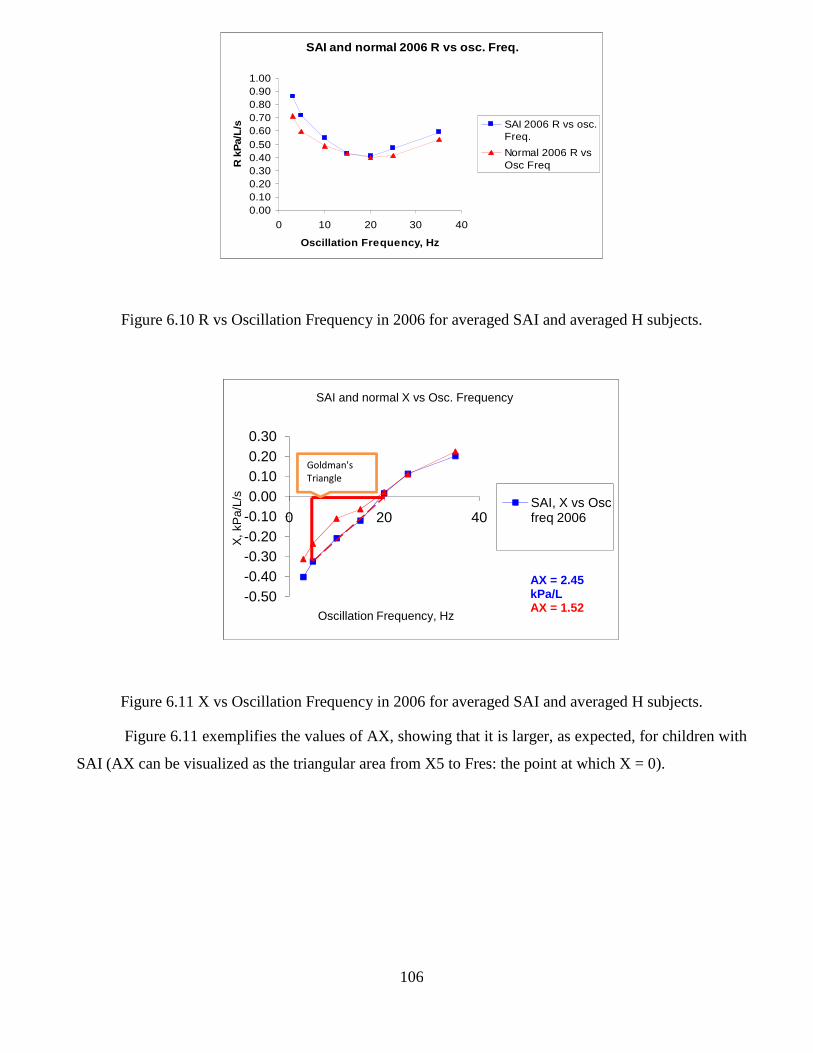
106
Figure 6.10 R vs Oscillation Frequency in 2006 for averaged SAI and averaged H subjects.
Figure 6.11 X vs Oscillation Frequency in 2006 for averaged SAI and averaged H subjects.
Figure 6.11 exemplifies the values of AX, showing that it is larger, as expected, for children with
SAI (AX can be visualized as the triangular area from X5 to Fres: the point at which X = 0).
SAI and normal 2006 R vs osc. Freq.
0.000.100.200.300.400.500.600.700.800.901.00
0 10 20 30 40
Oscillation Frequency, HzR
kP
a/L/
s SAI 2006 R vs osc.Freq.
Normal 2006 R vsOsc Freq
-0.50-0.40-0.30-0.20-0.100.000.100.200.30
0 20 40
X, k
Pa/
L/s
Oscillation Frequency, Hz
SAI and normal X vs Osc. Frequency
SAI, X vs Osc freq 2006
AX = 2.45 kPa/LAX = 1.52
Goldman's
Triangle
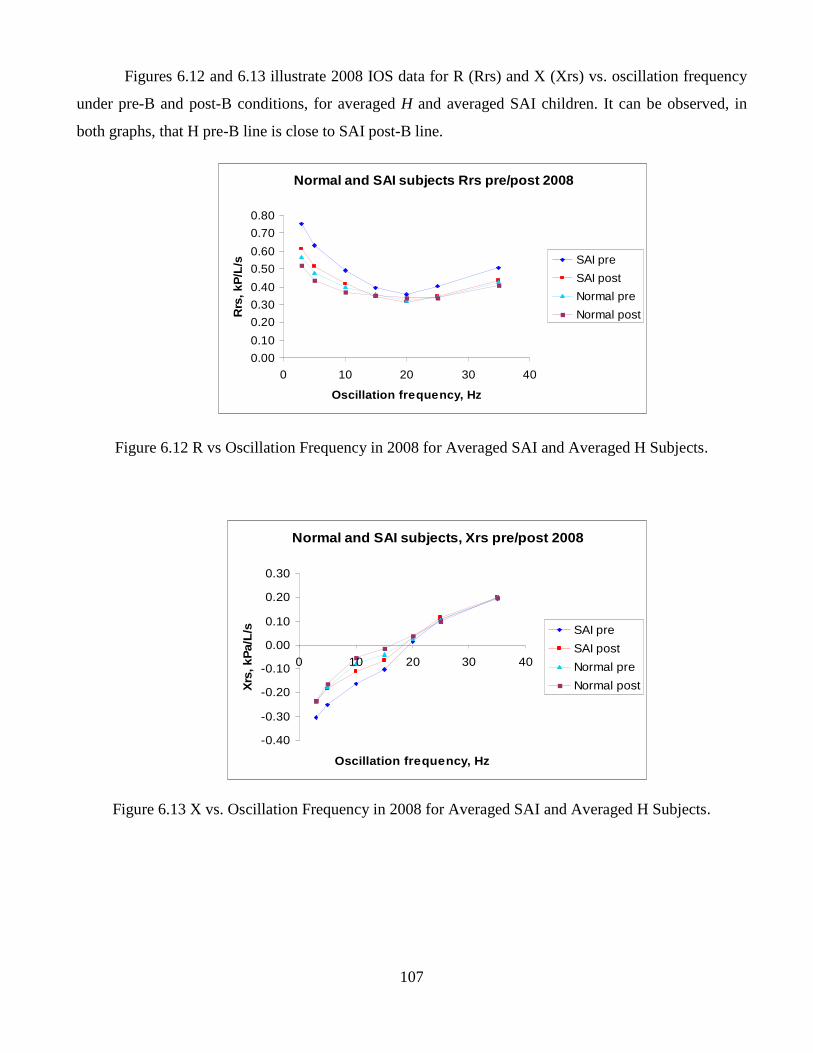
107
Figures 6.12 and 6.13 illustrate 2008 IOS data for R (Rrs) and X (Xrs) vs. oscillation frequency
under pre-B and post-B conditions, for averaged H and averaged SAI children. It can be observed, in
both graphs, that H pre-B line is close to SAI post-B line.
Figure 6.12 R vs Oscillation Frequency in 2008 for Averaged SAI and Averaged H Subjects.
Figure 6.13 X vs. Oscillation Frequency in 2008 for Averaged SAI and Averaged H Subjects.
Normal and SAI subjects, Xrs pre/post 2008
-0.40
-0.30
-0.20
-0.10
0.00
0.10
0.20
0.30
0 10 20 30 40
Oscillation frequency, Hz
Xrs
, kP
a/L/
s SAI pre
SAI post
Normal pre
Normal post
Normal and SAI subjects Rrs pre/post 2008
0.00
0.10
0.20
0.30
0.40
0.50
0.60
0.70
0.80
0 10 20 30 40
Oscillation frequency, Hz
Rrs
, kP
/L/s SAI pre
SAI post
Normal pre
Normal post
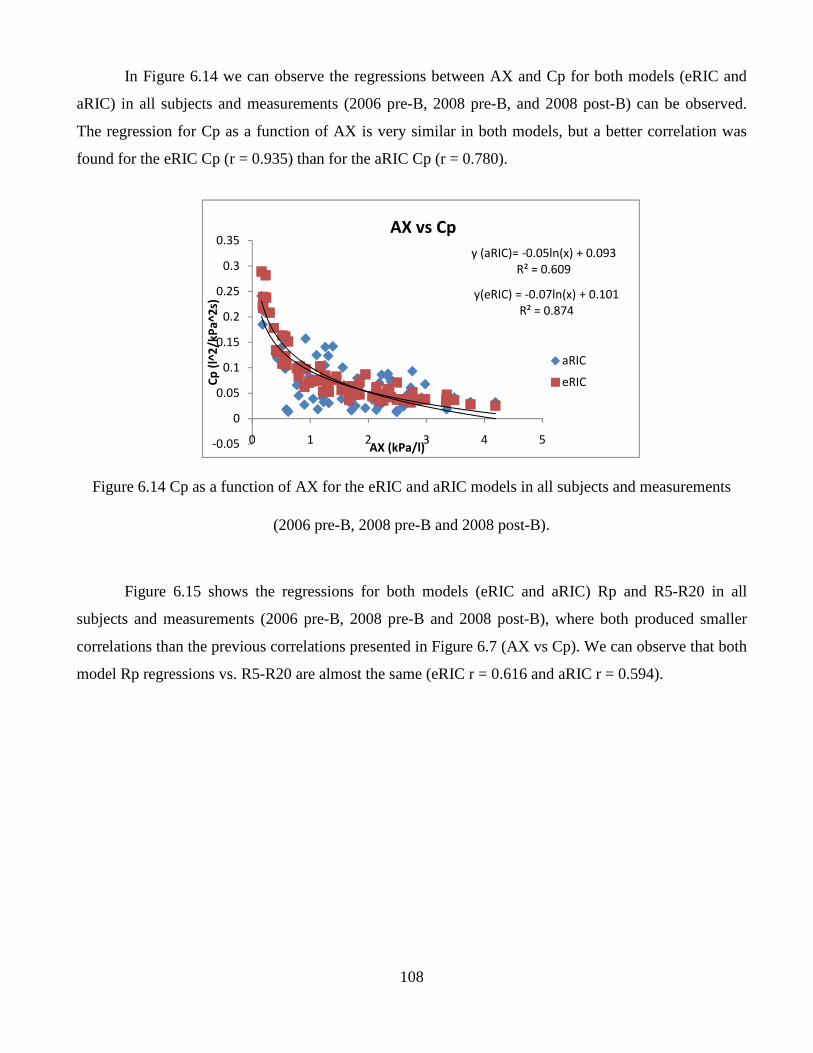
108
In Figure 6.14 we can observe the regressions between AX and Cp for both models (eRIC and
aRIC) in all subjects and measurements (2006 pre-B, 2008 pre-B, and 2008 post-B) can be observed.
The regression for Cp as a function of AX is very similar in both models, but a better correlation was
found for the eRIC Cp (r = 0.935) than for the aRIC Cp (r = 0.780).
Figure 6.14 Cp as a function of AX for the eRIC and aRIC models in all subjects and measurements
(2006 pre-B, 2008 pre-B and 2008 post-B).
Figure 6.15 shows the regressions for both models (eRIC and aRIC) Rp and R5-R20 in all
subjects and measurements (2006 pre-B, 2008 pre-B and 2008 post-B), where both produced smaller
correlations than the previous correlations presented in Figure 6.7 (AX vs Cp). We can observe that both
model Rp regressions vs. R5-R20 are almost the same (eRIC r = 0.616 and aRIC r = 0.594).
y (aRIC)= -0.05ln(x) + 0.093
R² = 0.609
y(eRIC) = -0.07ln(x) + 0.101
R² = 0.874
-0.05
0
0.05
0.1
0.15
0.2
0.25
0.3
0.35
0 1 2 3 4 5
Cp
(l^
2/k
Pa
^2
s)
AX (kPa/l)
AX vs Cp
aRIC
eRIC
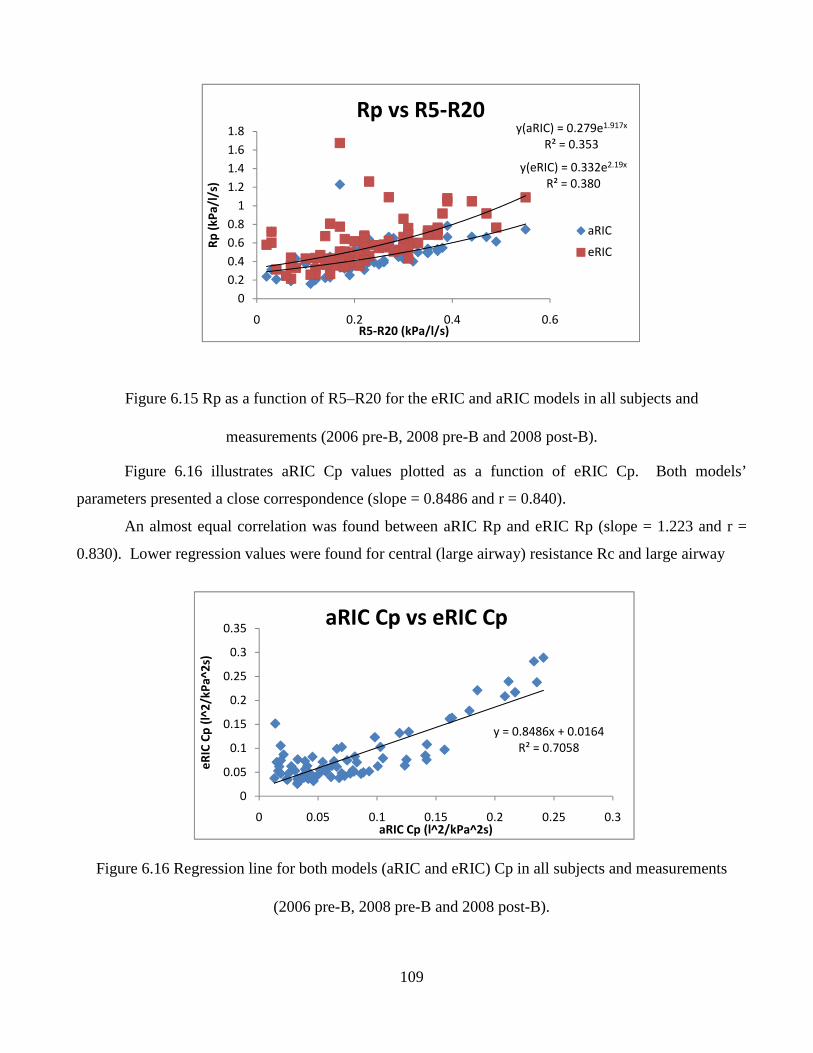
109
Figure 6.15 Rp as a function of R5–R20 for the eRIC and aRIC models in all subjects and
measurements (2006 pre-B, 2008 pre-B and 2008 post-B).
Figure 6.16 illustrates aRIC Cp values plotted as a function of eRIC Cp. Both models’
parameters presented a close correspondence (slope = 0.8486 and r = 0.840).
An almost equal correlation was found between aRIC Rp and eRIC Rp (slope = 1.223 and r =
0.830). Lower regression values were found for central (large airway) resistance Rc and large airway
Figure 6.16 Regression line for both models (aRIC and eRIC) Cp in all subjects and measurements
(2006 pre-B, 2008 pre-B and 2008 post-B).
y(aRIC) = 0.279e1.917x
R² = 0.353
y(eRIC) = 0.332e2.19x
R² = 0.380
0
0.2
0.4
0.6
0.8
1
1.2
1.4
1.6
1.8
0 0.2 0.4 0.6
Rp
(k
Pa
/l/s
)
R5-R20 (kPa/l/s)
Rp vs R5-R20
aRIC
eRIC
y = 0.8486x + 0.0164
R² = 0.7058
0
0.05
0.1
0.15
0.2
0.25
0.3
0.35
0 0.05 0.1 0.15 0.2 0.25 0.3
eR
IC C
p (
l^2
/kP
a^
2s)
aRIC Cp (l^2/kPa^2s)
aRIC Cp vs eRIC Cp
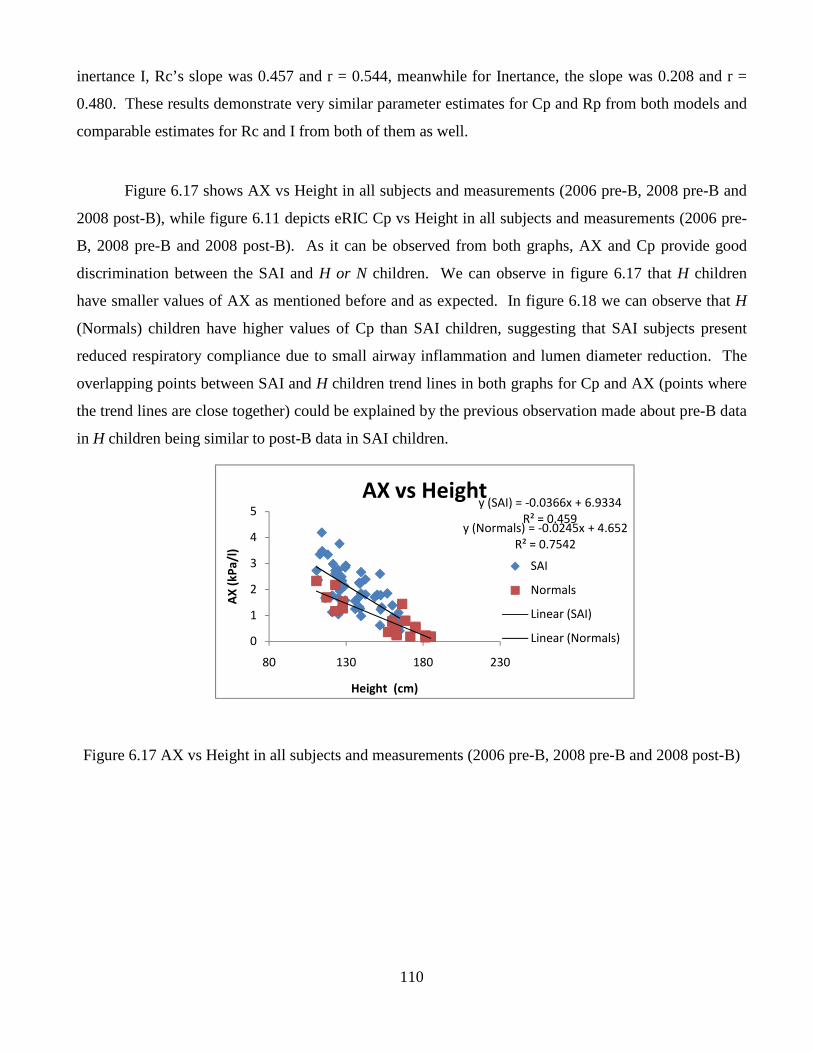
110
inertance I, Rc’s slope was 0.457 and r = 0.544, meanwhile for Inertance, the slope was 0.208 and r =
0.480. These results demonstrate very similar parameter estimates for Cp and Rp from both models and
comparable estimates for Rc and I from both of them as well.
Figure 6.17 shows AX vs Height in all subjects and measurements (2006 pre-B, 2008 pre-B and
2008 post-B), while figure 6.11 depicts eRIC Cp vs Height in all subjects and measurements (2006 pre-
B, 2008 pre-B and 2008 post-B). As it can be observed from both graphs, AX and Cp provide good
discrimination between the SAI and H or N children. We can observe in figure 6.17 that H children
have smaller values of AX as mentioned before and as expected. In figure 6.18 we can observe that H
(Normals) children have higher values of Cp than SAI children, suggesting that SAI subjects present
reduced respiratory compliance due to small airway inflammation and lumen diameter reduction. The
overlapping points between SAI and H children trend lines in both graphs for Cp and AX (points where
the trend lines are close together) could be explained by the previous observation made about pre-B data
in H children being similar to post-B data in SAI children.
Figure 6.17 AX vs Height in all subjects and measurements (2006 pre-B, 2008 pre-B and 2008 post-B)
y (SAI) = -0.0366x + 6.9334
R² = 0.459y (Normals) = -0.0245x + 4.652
R² = 0.7542
0
1
2
3
4
5
80 130 180 230
AX
(k
Pa
/l)
Height (cm)
AX vs Height
SAI
Normals
Linear (SAI)
Linear (Normals)
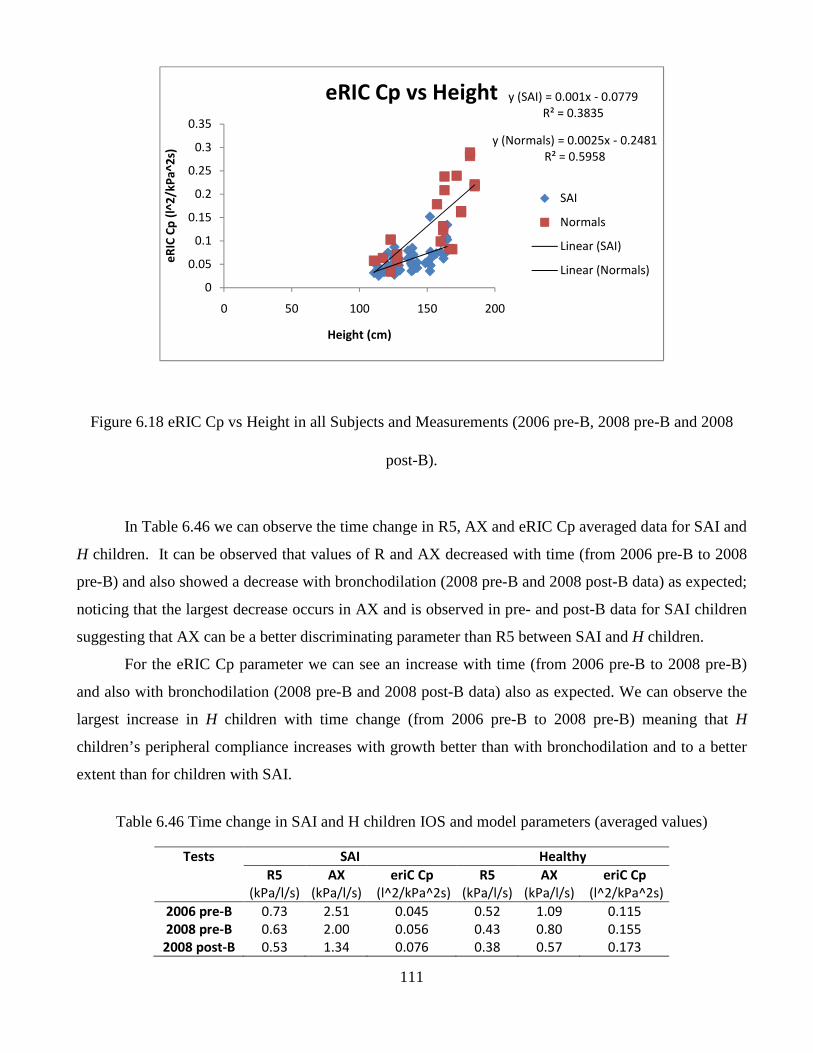
111
Figure 6.18 eRIC Cp vs Height in all Subjects and Measurements (2006 pre-B, 2008 pre-B and 2008
post-B).
In Table 6.46 we can observe the time change in R5, AX and eRIC Cp averaged data for SAI and
H children. It can be observed that values of R and AX decreased with time (from 2006 pre-B to 2008
pre-B) and also showed a decrease with bronchodilation (2008 pre-B and 2008 post-B data) as expected;
noticing that the largest decrease occurs in AX and is observed in pre- and post-B data for SAI children
suggesting that AX can be a better discriminating parameter than R5 between SAI and H children.
For the eRIC Cp parameter we can see an increase with time (from 2006 pre-B to 2008 pre-B)
and also with bronchodilation (2008 pre-B and 2008 post-B data) also as expected. We can observe the
largest increase in H children with time change (from 2006 pre-B to 2008 pre-B) meaning that H
children’s peripheral compliance increases with growth better than with bronchodilation and to a better
extent than for children with SAI.
Table 6.46 Time change in SAI and H children IOS and model parameters (averaged values)
Tests SAI Healthy
R5 AX eriC Cp R5 AX eriC Cp
(kPa/l/s) (kPa/l/s) (l^2/kPa^2s) (kPa/l/s) (kPa/l/s) (l^2/kPa^2s)
2006 pre-B 0.73 2.51 0.045 0.52 1.09 0.115
2008 pre-B 0.63 2.00 0.056 0.43 0.80 0.155
2008 post-B 0.53 1.34 0.076 0.38 0.57 0.173
y (SAI) = 0.001x - 0.0779
R² = 0.3835
y (Normals) = 0.0025x - 0.2481
R² = 0.5958
0
0.05
0.1
0.15
0.2
0.25
0.3
0.35
0 50 100 150 200
eR
IC C
p (
l^2
/kP
a^
2s)
Height (cm)
eRIC Cp vs Height
SAI
Normals
Linear (SAI)
Linear (Normals)
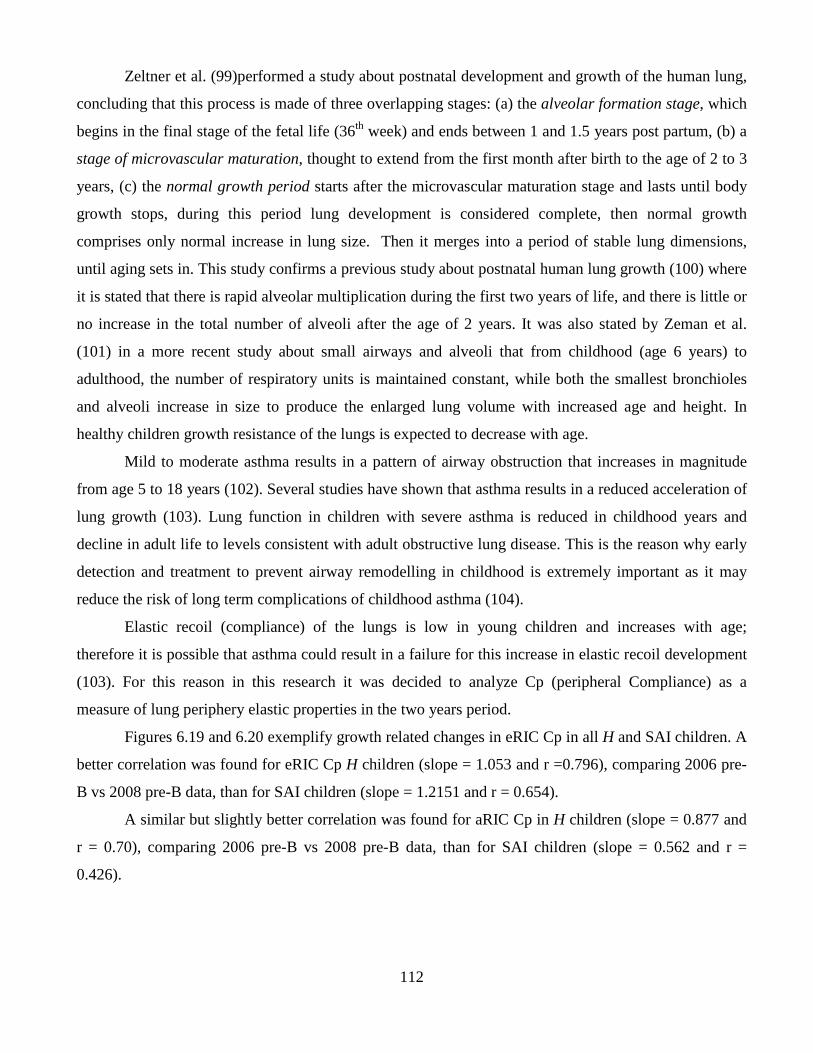
112
Zeltner et al. (99)performed a study about postnatal development and growth of the human lung,
concluding that this process is made of three overlapping stages: (a) the alveolar formation stage, which
begins in the final stage of the fetal life (36th week) and ends between 1 and 1.5 years post partum, (b) a
stage of microvascular maturation, thought to extend from the first month after birth to the age of 2 to 3
years, (c) the normal growth period starts after the microvascular maturation stage and lasts until body
growth stops, during this period lung development is considered complete, then normal growth
comprises only normal increase in lung size. Then it merges into a period of stable lung dimensions,
until aging sets in. This study confirms a previous study about postnatal human lung growth (100) where
it is stated that there is rapid alveolar multiplication during the first two years of life, and there is little or
no increase in the total number of alveoli after the age of 2 years. It was also stated by Zeman et al.
(101) in a more recent study about small airways and alveoli that from childhood (age 6 years) to
adulthood, the number of respiratory units is maintained constant, while both the smallest bronchioles
and alveoli increase in size to produce the enlarged lung volume with increased age and height. In
healthy children growth resistance of the lungs is expected to decrease with age.
Mild to moderate asthma results in a pattern of airway obstruction that increases in magnitude
from age 5 to 18 years (102). Several studies have shown that asthma results in a reduced acceleration of
lung growth (103). Lung function in children with severe asthma is reduced in childhood years and
decline in adult life to levels consistent with adult obstructive lung disease. This is the reason why early
detection and treatment to prevent airway remodelling in childhood is extremely important as it may
reduce the risk of long term complications of childhood asthma (104).
Elastic recoil (compliance) of the lungs is low in young children and increases with age;
therefore it is possible that asthma could result in a failure for this increase in elastic recoil development
(103). For this reason in this research it was decided to analyze Cp (peripheral Compliance) as a
measure of lung periphery elastic properties in the two years period.
Figures 6.19 and 6.20 exemplify growth related changes in eRIC Cp in all H and SAI children. A
better correlation was found for eRIC Cp H children (slope = 1.053 and r =0.796), comparing 2006 pre-
B vs 2008 pre-B data, than for SAI children (slope = 1.2151 and r = 0.654).
A similar but slightly better correlation was found for aRIC Cp in H children (slope = 0.877 and
r = 0.70), comparing 2006 pre-B vs 2008 pre-B data, than for SAI children (slope = 0.562 and r =
0.426).
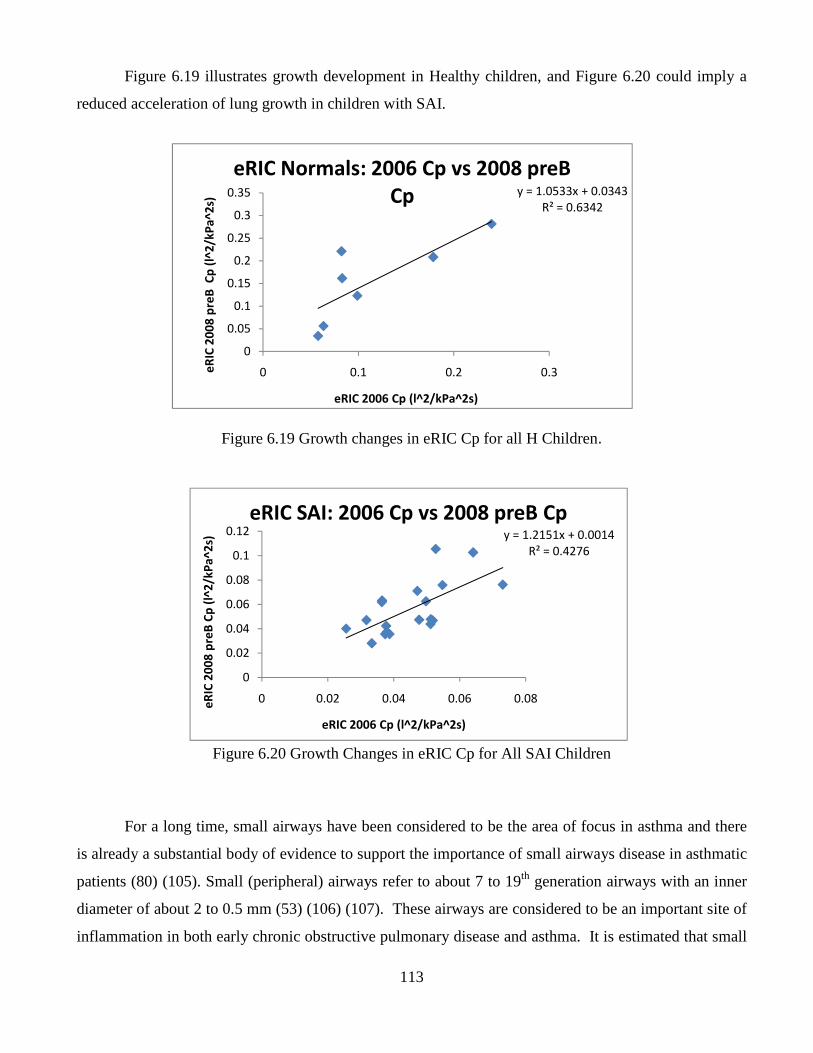
113
Figure 6.19 illustrates growth development in Healthy children, and Figure 6.20 could imply a
reduced acceleration of lung growth in children with SAI.
Figure 6.19 Growth changes in eRIC Cp for all H Children.
Figure 6.20 Growth Changes in eRIC Cp for All SAI Children
For a long time, small airways have been considered to be the area of focus in asthma and there
is already a substantial body of evidence to support the importance of small airways disease in asthmatic
patients (80) (105). Small (peripheral) airways refer to about 7 to 19th generation airways with an inner
diameter of about 2 to 0.5 mm (53) (106) (107). These airways are considered to be an important site of
inflammation in both early chronic obstructive pulmonary disease and asthma. It is estimated that small
y = 1.0533x + 0.0343
R² = 0.6342
0
0.05
0.1
0.15
0.2
0.25
0.3
0.35
0 0.1 0.2 0.3eR
IC 2
00
8 p
reB
Cp
(l^
2/k
Pa
^2
s)
eRIC 2006 Cp (l^2/kPa^2s)
eRIC Normals: 2006 Cp vs 2008 preB
Cp
y = 1.2151x + 0.0014
R² = 0.4276
0
0.02
0.04
0.06
0.08
0.1
0.12
0 0.02 0.04 0.06 0.08eR
IC 2
00
8 p
reB
Cp
(l^
2/k
Pa
^2
s)
eRIC 2006 Cp (l^2/kPa^2s)
eRIC SAI: 2006 Cp vs 2008 preB Cp
114
airways resistance contributes 15 to 24% of airway resistance in healthy (normal) people and much
higher in patients with severe diseases. It has also been stated that for subjects with nonasthmatic
allergic disease (atopy) early manifestation prior to asthma could be early Small Airway Disease (SAD)
also known as Small Airway Impairment and then if inflammation persists, asthma would appear (53).
Even though the importance of the small airways in asthma and other pulmonary diseases is
established, clinical assessment of the peripheral airways continues to be a challenge to date (107) and a
means of studying the small airways have never been readily available to clinicians (105). The silent
zone of the lung (small airways) can became a seat of inflammation and fibrosis from varied sources like
Small Airway Impairment leading to small airways distortion ending in functional abnormalities. These
abnormalities are evident because of the increased resistance to airflow at a lately detected stage when
the condition has become severe. Such circumstances demand early diagnosis to prevent pulmonary
complications (108).
Asthmatic patients present a progressive deterioration of lung function, and this deterioration
seems to be more evident in younger asthmatics whose disease is not well controlled. Therefore, early
evaluation and therapy for small airways might be even more effective when started earlier in the course
of the disease (105).
It is observed that in healthy lung growth, airway resistance decreases with age. Peripheral
resistance increases significantly in asthmatics with airflow obstruction compared with central
resistance, suggesting that the peripheral airways are the predominant site of airflow obstruction in
asthma (107).
An effective means to evaluate small airways performance could be achieved by integrating
realistic models of lung function based on physiological measurements made by FOT and other
techniques (80). In this research we aimed to analyze and offer sensitive measures for healthy and
impaired respiratory conditions such as SAI, by using the well-established IOS parameters R5, R5-R20
and AX, as well as the aRIC and eRIC model parameters such as Cp and Rp.
The significant differences found between SAI and H groups, illustrated in tables 6.36 and 6.37,
confirm the ability of the analyzed IOS parameters: R5, R5-R20 (fdR) and AX, as well as model
parameter Cp (for both aRIC and eRIC models) to differentiate between obstructed and non-obstructed
airways. It is also demonstrated in these tables that values of IOS parameters and both Rps in both
models are higher in children with SAI than in H children. It is also clear that Cps for both models are
higher in H children than in children with SAI, as expected.
115
In Tables 6.42 and 6.43, the significant differences observed in the SAI group in all IOS
parameters (R5, R5-R20 and AX) and model parameters (eRIC and aRIC Rp, and eRIC Cp), comparing
baseline (pre-B) data in 2006 with pre-B 2008 data suggest an abnormal lung growth development due
to the presence of the illness in the two year period. In contrast no significant differences were seen for
H children in the same parameters during the same period of time, with the exception of R5, which may
be attributed to the noise previously reported to occur in low frequency resistance and reactance
measurements (73).
As illustrated in Figure 6.11, the AX parameter is greater in children with SAI than in H
children. An improvement in lung function will imply a decrease in AX value and AX, as stated before,
reflects small airway function (73). In Table 6.44 it can be observed that the AX decrease presented as
percentage of change in baseline (pre-B 2006 and pre-B 2008) IOS data, is greater in H children than in
children with SAI, a -27% for H children and a -20% for children with SAI (a negative sign means a
decrement). These results imply that AX demonstrated a higher decrease in the two years period in H
children, indicating improved lung function that could be attributed to normal lung growth in this group.
Furthermore, AX showed a lower decrease in children with SAI suggesting an impaired lung growth due
to their illness. In addition, as stated before, significant differences were observed in the SAI group
comparing 2006 and 2008 baseline data and no significant (p>0.05) differences were found in the H
group in the same period. These results suggest that AX might be a good IOS index used to differentiate
changes over time (2 years) in lung function (impaired and non-impaired).
These findings agree with a recent study performed by Larsen, et al. (26) comparing IOS AX
parameter with spirometry parameters, where it was concluded that the pattern of improvement seen in
AX (XA), over the course of therapy, suggests that IOS might detect alterations in airway mechanics not
reflected by spirometry. In a study on clinical applications of FOT, Goldman developed an integrated
response index for X, AX (73), now called the “Goldman Triangle”, previously explained in this study.
Goldman also explained the history of the phenomenon called “frequency-dependence of resistance
(fdR)” in this study.
There are several studies which are in agreement with the results presented here about the IOS
parameters fdR (R5-R20) and AX being the indices most closely related to small airway function (26)
(74) (109) (110) (111) (72) (112) (97). Even though these research studies suggest the potential
effectiveness of IOS parameters there are still concerns about the effects of upper airway structures (like
upper airway shunt) (71) (112); and additionally there is a necessity for establishing normal values as
well as reproducibility studies for IOS parameters (71).
116
Infant’s airways structure and proportions are different than those of the adult, and the relative
greater lung compliance may accentuate the functional differences (113). In children with SAI, lung
compliance is lower than that in normal or healthy children. As it is observed in table 6.41 for both
models, the Cp is higher in H than in SAI children. An improvement in lung function will produce an
increment in Cp value. In table 6.44 it can be observed that the eRIC Cp increment presented as
percentage of change in baseline (2006-2008) IOS data, is greater in H children than in children with
SAI, a 35% for H children and a 25% for children with SAI. This higher percentage of improvement in
H children for Cp may indicate (as AX would), an improved lung function in H children (normal lung
growth). Whereas a lower increment in SAI group could represent impaired lung function and growth.
Similarly significant differences were observed for SAI group in eRIC Cp parameter comparing 2006
and 2008 baseline data. These results also suggest that the eRIC Cp may be a good index capable of
differentiating changes over time (2 years) in lung function (impaired and non-impaired).
Goldman et al. (112) developed a similar study closely related to this research, in adolescents
and young adults with Cystic Fibrosis, and in asthmatic adults, obtaining very similar results to our
results previously reported, and stating that the eRIC model parameters are reliable and present a slightly
better correlation with IOS parameters compared to the aRIC model parameters, concluding that the less
complex and more intuitive eRIC model may be more suitable for clinical diagnosis and evaluation after
treatment. Goldman et al. concluded that IOS indices of SAI are modelled similarly well with and
without upper airway shunt capacitance (Ce) for good quality IOS data, and do not seem to be dependent
on upper airway shunt capacitance. This is to be expected since the IOS indices are based on low
frequencies up to 20 Hz, whereas the upper airway shunt capacitance in the aRIC manifests significant,
increasing effects on respiratory impedance only at higher frequencies (above the resonant frequency).
117
Chapter 7: Conclusions
The results from this research work suggest that R5-R15 (frequency-dependence of resistance)
seemed to be a sensitive index for gender differences in lung function between asthmatic males and
females in Anglo subjects. As high correlation between AXmeasured and AXcalculated values was observed, it
is stated that AXcalculated is a good approximation to the measured AX value.
Significant differences were found between the eRIC and aRIC model parameters in several of
the published papers. Statistically significant differences between Anglo nonasthmatic (normal) and
Anglo Asthmatic children were found for almost all of the model parameters with the exeption of Ce (R,
Rp, I, and Cp). Similarly, statistically significant differences in the same model parameters between
normal Hispanic and asthmatic Hispanic children were found. It seems that differences between Normal
and Asthmatic children were larger, by a factor of two, for peripheral airways than for large airways.
After these results were observed, it was concluded that the aRIC model allows clear discrimination
between Normal and Asthmatic Anglo and Hispanic children.
Comparing Anglo and Hispanic adolescents IOS data and model parameters, R5, R5-R15 and
AX did not present significant differences between these groups. Therefore, it is concluded in this
research that despite a slightly greater BMI in Hispanic adolescents, there were no differences in lung
function parameters reflective of peripheral airway dysfunction that might suggest genetic differences in
adolescents living in similar urban environments.
Similarly it was observed that in an urban environment with diminished air quality, Hispanic and
Anlgo children whose R and X were normal for age and size do not differ. Among children whose IOS
R and X are consistent with significant SAI, Hispanic children are more severely affected than Anglos,
with increased large and small airway resistances.
The present study has shown that equivalent electrical circuit model parameters were able to
track changes in respiratory system function after bronchodilation. Both the eRIC and aRIC models
clearly distinguished between children who were normal (or possibly had mild small airway impairment
(SAI), who showed no significant changes with bronchodilator (BD)), and those who were asthmatic
with SAI, both at baseline and regarding the pre- to post-BD changes in lung function. The eRIC model
118
showed an apparently larger peripheral airway compliance (Cp) than the aRIC model, probably because
it might include some of the “extrathoracic airway compliance” (Ce). eRIC model also failed to show
significant change in inertance (I) post-BD in the Asthmatic group, while the aRIC did. On the other
hand, the eRIC model is more parsimonious, and the parameter, Ce, that may be difficult for physicians
to understand, appears to show no significant change post-BD in the Asthmatic group.
It can be observed that children classified as Normal or possible SAI were relatively similar in
both IOS and the aRIC model parameters, with however, clear increases in R3, R5, R3-R20, R5-R20,
AX, Fres, and Rp, and a clear decrease in X3, X5 and Cp going from normal to possible SAD.
Going to increasingly abnormal levels of "diagnostic classification," R5, R5-R20, AX, Fres and
Rp continue to increase from PSAI to SAI to Asthma, while X5 and Cp decrease in this progression.
Differences between SAI and Asthmatic children were modest.
While expert clinician diagnostic classification distinguished between children based on 4 levels
of perceived normality of absence thereof of the visual patterns of IOS data, with the essential features
characterizing the differences being associated with abnormalities group mean IOS and the aRIC model
data appear to fall into two distinctly different groups: either normal or asthmatic, with the essential
features characterizing the differences being associated with abnormalities of peripheral airways.
The features used in this work seem to be sensitive and reliable indices for automatic respiratory
disease classification using Impulse Oscillometry data.
The correlation between AX and the eRIC Cp was the best correlation in both pre-B work and
pre- and post-B work.
According to our expert clinician the range of values of every analyzed feature, measured and
estimated IOS parameters: R3, R5, R3-R20, R5-R20, X3, X5, AX, Fres, eRIC Cp, eRIC Rp, aRIC Cp
and aRIC Rp obtained for the SAD and Asthmatic groups were comparable to those values observed in
other Asthmatic children of the same age range.
For the pre- and post-B work comparing Pre- and Post-B IOS and eRIC and aRIC model
parameters in the Normal group, no significant differences were observed. Also comparing Pre- and
Post-B for the PSAI group only R3, R35 and the eRIC Rc presented significant differences. Similarly
119
evaluating Pre- and Post-B for the SAI group the following parameters presented significant differences:
R3,R5,X3,X5,X10,X15,R3-R20,R5-R20,AX, the aRIC Rp, eRIC Rp, eRIC I and eRIC Cp. Finally
evaluating Pre- and Post-B for the Asthmatic group all of the parameters presented significant
differences with the exception of the aRIC Ce and eRIC I.
The selected IOS and model derived parameters (R3, R5, R3-R20, R5-R20, X3, X5, AX, Fres,
the eRIC Cp, eRIC Rp, aRIC Cp and aRIC Rp) presented a good correlation with children Height.
In the pre- and post-B work over a two-year period the following conclusions were reached:
IOS parameters differed consistently between Healthy and SAI children over a two-year period.
SAI children showed smaller trend of “growth” in IOS parameters R5, R5-R20 and AX comparing 2006
pre-B and 2008 pre-B data; and larger trend of bronchodilator responses than H children in R5, AX, the
eRIC Rp and Cp, as well as the aRIC Cp parameters. The AX and eRIC Cp parameters showed larger
differences between pre-B and post-B data.
The eRIC and aRIC model parameters Cp and Rp track IOS indices of small airway function.
Peripheral airway compliance (Cp) is a more sensitive index than peripheral airway resistance (Rp). The
eRIC and aRIC Cp are significantly larger in H or Normal than SAI children, showing larger p values
for the eRIC Cp; while for both models, Rp did not show significant differences between H and SAI
children.
Model calculated parameters Rp and Cp are narrowly comparable between both analyzed models
(aRIC and eRIC). In the same manner Rc and I similarly present a good correlation in both models. Both
the eRIC and aRIC Cp parameters showed significantly good correlations with AX; with the eRIC
model resulting in a higher r value than the aRIC model.
In this research study in children with and without SAI (Healthy), the eRIC model parameters
showed to be consistent and to some extent more closely correlated with IOS measures compared to the
aRIC model parameters. As eRIC is more intuitive, less complex and a more parsimonious model, it
may be considered a more suitable diagnostic tool for clinical applications than the aRIC model. IOS lung function data are similarly well-modelled by the eRIC (without upper airway shunt
compliance) and aRIC models (with upper airway shunt compliance), which are reduced versions of the
120
popular Mead’s model developed at Harvard several decades ago, based on the close correlations of
their corresponding parameters excluding Ce. The eRIC model is a more parsimonious and equally
powerful model in capturing the differences between SAI and H children, therefore it is presented as a
clinically-preferred model of lung function based on IOS data.
In summary, we conclude that the IOS parameters AX and the eRIC model derived parameter Cp
are the most reliable parameters to track small airway function in children before and after
bronchodilator and over a time period (2 years). AX (the “Goldman Triangle”), representing the
integrated low frequency respiratory reactance magnitude between 5 Hz and Fres , and the eRIC Cp
corresponding to the peripheral (small airway) Compliance demonstrated superior diagnostic
discrimination compared to all other parameters analyzed and emerged as useful and reliable indices of
small airway function in children.
Further work in a larger number of H and SAI children is required to establish normal values of
these sensitive indices and enable researchers in this field to perform more effective and timely
evaluation, detection, diagnosis, and treatment of different respiratory diseases.
Also future work should be performed in order to collect data from a larger sample of children to
evaluate changes over time (two-year period) and a statistical analysis should be carried out in order to
evaluate IOS parameters and both models (eRIC and aRIC) performances to evaluate these changes in
lung function.
A definitive choice between the eRIC and aRIC models will require further assessments in a
larger sample of children.
121
References
1. ALA. American Lung Association. [Online] 2011. http://www.lungusa.org/lung-disease/asthma/about-asthma/symptoms-diagnosis.html. 2. AAAAI. American Academy of Allergy Asthma and Inmunology. [Online] 2011. http://www.aaaai.org/media/resources/media_kit/asthma_statistics.stm. 3. COMPEDIA. Colegio Mexicano de Pediatras Especialistas en Inmunologia Clínica y Alergias . [Online] 2011. http://www.compedia.org.mx/archivos/docs/6_asma_bron.pdf. 4. Klug, B and Bisgaard, H. "Specific Airway Resistance, Interrupter Resistance, and Respiratory Impedance in Healthy Children, and Respiratory Impedance in Healthy Children Aged 2-7 Years". Pediatric Pulmonology. 1998, Vol. Vol.25, pp. 322-331. 5. Nielsen, KG and Bisgaard, H. “The Effect of Inhaled Budesonide on Symptoms, Lung Function, and Cold Air and Methacholine Responsiveness in 2- to 5-year-old Asthmatic Children”. Am J Respir Crit Care Med. 2000, Vol. 162, pp. 1500-1506. 6. Gaylor, P B, et al. “Forced Oscillation using Impulse Oscillometry (IOS) Provides Objective Responses to Inhaled Corticosteroids (ICS) in Asthmatic Patients when FEV1 Fails to Improve”. J Allergy and Clin Immun. 2003, Vol. 111, p. S135. 7. Marotta, A, et al. “Impulse Oscillometry provides an effective measure of lung dysfunction in 4-year-old children at risk for persistent asthma”. J Allergy Clin Immunol. 2003, Vol. 112, pp. 317-321. 8. Ortiz, G and Mendez, R. “The Effects of Inhaled Albuterol and Salmeterol in 2- to 5-Year-Old Asthmatic Children as Measured by Impulse Oscillometry”. Journal of Asthma. 2002, Vol. 39, 6, pp. 531-536. 9. Goldman, M D, et al. “Within- and Between-Day Variability of Respiratory Impedance, Using Impulse Oscillometry in Adolescent Asthmatics”. Pediatric Pulmonology. 2002, Vol. 34, pp. 312-319. 10. Klug, B and Bisgaard, H. “ Measurement of Lung Function in awake 2-4 Year-Old Asthmatic Children During Methacholine Challenge and Acute Asthma: A Comparison of the Impulse O Technique, the Interrupter Technique, and Transcutaneous Measurments of Oxygen vs W-B Plethysmography. Pediatric Pulmonology. 1996, Vol. 21, pp. 290-300. 11. Saadeh, C K, et al. “Forced Oscillation Using Impulse Oscillometry (IOS) Detects False Negative Spirometery in Symptomatic Patients with Reactive Airways”. Journal of Allergy and Clinical Immunology. 2003, Vol. III, p. S136. 12. Vink, G R, et al. “Impulse Oscillometry: A measure for Airway Obstruction”. Pediatric Pulmonology. 2003, Vol. 35, pp. 214-219. 13. Song, T W, et al. “Utlility of impulse oscillometry in young children with asthma”. Pediatr Allergy Immunol. 2008, Vol. 19, pp. 763-768. 14. Song, T W, et al. “Correlation between spirometry and impulse oscillometry in children with asthma”. Acta Paediatrica, vol. , pp.,. 2008, Vol. 97, pp. 51-54. 15. Antonova, E A, et al. “Sensitivity impulse oscillometry and spirometry for assessment degree of severity of bronchial asthma in preschool children”. ERS Annual Congress Abstracts. 2006, p. 477s. 16. Linares, M, Concha, I and Meter, R. “Correlation between spirometry and respiratory resistance and reactance measured by impulse oscillometry in asthmatic children”. Revista Chilena de enfermedades respiratorias. 2002, Vol. 18, 2, pp. 90-98. 17. Lewis-Brown, K, Hildreth, G and Maupin, K d. “The association of spirometry with impulse oscillometry in pediatric patients with asthma”. Chest 2005-Slide presentations. p. 188s. 18. Olaguibel, J M, et al. “Comparative analysis of the bronchodilator response measured by impulse oscillometry (IOS), spirometry and body plethysmography in asthmatic children”. J Invest Allergol Clin Immunol. 2005, Vol. 15, 2, pp. 102-106.
122
19. Tomalak, W, et al. “Impulse Oscillometry vs. Body Plethysmography in Assessing Respiratory Resistance in Children”. Pediatric Pulmonology. 2006, Vol. 41, pp. 50-54. 20. Bisgaard, H and Klug, B. “Lung function measurement in awake young children”. Eur Resp J. 1995, Vol. 8, pp. 2067-2075. 21. Nielsen, K G and Bisgaard, H. “Lung Function Response to Cold Air Challenge in Asthmatic and Healthy Children of 2-5 years of age”. Am J Respir Crit Care Med. 2000, Vol. 161, pp. 1805-1809. 22. Goldman, M D, et al. “Impulse oscillometry sensitively measures long and short acting bronchodilator in asthmatic children”,. Biomedical Engineering Recent Developments, Proceedings of the Twenty Fourth SBEC. 2008, pp. 73-76. 23. Nielsen, K G and Bisgaard, H. “Discriminative Capacity of Bronchodilator Response Measured with Three Different Lung Function Techniques in Asthmatic and Healthy Children Aged 2 to 5 Years”. Am J Respir Crit Care Med. 2001, Vol. 164, pp. 554-559. 24. Nieto, A, et al. “Montelukast improves pulmonary function measured by impulse oscillometry in children with asthma (Mio study)”. Respiratory Medicine. 2006, Vol. 100, 7, pp. 1180-1185. 25. Hur, H Y, et al. “A comparison between impulse oscillometry system and spirometry for detecting airway obstruction in children”. Korean Journal of Pediatrics. 2008, Vol. 51 , 8, pp. 842-847. 26. Larsen, G L, et al. “Impulse oscillometry versus spirometry in a long-term study of controller therapy for pediatric asthma. J Allergy Clin Immunol. 2009, Vol. 123, 4, pp. 861-867. 27. Frey, U. “Forced oscillation technique in infants and young children”. Paedriatric Respiratory Reviews. 2005, Vol. 6, pp. 246-254. 28. Hellinckx, J, et al. “Bronchodilator response in 3-6 years old healthy and stable asthmatic children”. Eur Respir J. 1998, Vol. 12, pp. 438-443. 29. Graw-Panzer, K D, et al. Comparing Bronchodilator Response Measured by Impulse Oscillometry to Spirometry in Children with Asthma. Am J Respir Crit Care Med. 2009, Vol. 179, p. A4858. 30. Todaki, H, et al. Effect of bronchoconstriction on exhaled nitric oxide levels in healthy and asthmatic children. Ann Allergy Asthma Immunol . 2009, Vol. 102, 6, pp. 469-74. 31. Menendez, R, et al. Impulse Oscillometry (IOS) measures effects of short and long acting Beta-Agonists (SABA, LABA) on Lung Mechanics in 2-5 year old children with asthma. J Allergy Clin Immunol. 2008, Vol. 121, 2, p. S211. 32. Jee, H M, et al. "Usefulness of bronchial hyperresponsiveness measured with impulse oscillation technique in preschool children". J Asthma. 2010, Vol. 47, 3, pp. 227-232. 33. Stocks, J and Quanjer, H. “Reference values for residual volume, functional residual capacity and total lung capacity”. Eur Respir J. 1995, Vol. 8, pp. 492-506. 34. Becklake, M and Crapo, R O. “Lung Function Testing: Selection of Reference values and interpretative strategies”. Am Rev Respir Dis. 1991, Vol. 144, pp. 1202-1218. 35. Clement, J, et al. “Reference values of total respiratory resistance and reactance between 4 and 26 Hz in children and adolescents aged 4-20 years”. Bull Eur Physiopathol Respir, vol., pp. 1987, Vol. 23, pp. 441-448. 36. Ducharme, F M, Davis, G M and Ducharme, G R. “Pediatric Reference Values for Respiratory Resistance Measured by Forced Oscillation”. CHEST. 1998, Vol. 113, pp. 1322-1328. 37. Frei, J, et al. “Reference values in children 100 to 150 cm in height and 3 to 10 years of age”. CHEST. 2005, Vol. 128, pp. 1266-1273. 38. Dencker, M, et al. “Reference values for respiratory system impedance by using impulse oscillometry in children aged 2-11 years”. Clin Physiol Funct Imaging. 2006, Vol. 26, pp. 247-250. 39. Nowowiejska, B, et al. “Transient Reference values for Impulse Oscillometry for children aged 3-18 years”. Pediatric Pulmonology. 2008, Vol. 43, pp. 1193-1197. 40. Amra, B, Soltaninejad, F and Golshan, M. “Respiratory Resistance by Impulse Oscillometry in Healthy Iranian Children aged 5-19 years”. Iran J Allergy Asthma Immunol. 2008, Vol. 7, 1, pp. 25-29.
123
41. Wee, Y S, et al. "Reference Values of respiratory system impedance using impulse oscillometry in school-aged children in Korea". Korean J Pediatr. 2007, Vol. 50, 9, pp. 862-867. 42. Jee, H M, et al. Reference Values for lung function testing using spirometry and impulse oscillometry in healthy preschool-aged children in Korea. [Online] 2010. [Cited: March 15, 2011.] http://www.ers-education.org/pages/default.aspx?id=2320&idBrowse=85383&det=1. 43. Diong, B, et al. “Modeling Human Respiratory Impedance: Comparing the Best Method with the Least Estimation Errors”. IEEE Engineering in Medicine and Biology Magazine. 2007, pp. 48-55. 44. Diong, B, et al. “The augmented RIC model of the human respiratory system”. Med Biol Eng Comput. 2009, Vol. 47, 4, pp. 395-404. 45. Rajagiri, A, et al. “Can Asthma in Children be Detected by the Estimated Parameter Values of the Augmented RIC Model?”. Proceedings of the IEEE-Engineering in Medicine and Biology Society (EMBS), 28th Annual International Conference. August 30 - September 3, 2006, pp. 5595-5598. 46. Rajagiri, A, et al. “Evaluation of Augmented RIC Model of Adult Respiratory Impedance Based on Impulse Oscillometry Data”. Procedings of the 12th Intl. Conf. Biomedical Engineering. December 2005. 47. Rajagiri, A and Diong, B. “Evaluation of Augmented RIC Model of Child Respiratory Impedance Based on Impulse Oscillometry Data”. Proc. IEEE Region 5 Technical Conf. April 7-9, 2006, pp. 291-295. 48. Baswa, S, et al. “Evaluation of Respiratory System Models Based on Parameter Estimates from Impulse Oscillometry Data”. Proc. IEEE Engineering in Medicine and Biology 27th Annual Conference. September 1-4, 2005, Vol. 3, pp. 2958-2961. 49. Nguyen, T-U, et al. “A study of IOS Data Using Two Mead-related Models of Respiratory Impedance”. Proceedings of the 29th Annual International Conference of the IEEE EMBS. August 23-26, 2007, pp. 1078-1081. 50. Nguyen, T-U and Diong, B. “Evaluation of Two Mead-related Models of Adult Respiratory Impedance Based on IOS Data”. IEEE Region 5 Technical Conference. April 20-21, 2007, pp. 303-308. 51. Woo, T, et al. “A Comparison of Various Respiratory Models Based on Parameter Estimates From Impulse Oscillometry Data”. Proceedings of the 26th Annual International Conference of the IEEE EMBS. September 1-5, 2004, Vol. 5, pp. 3828-3831. 52. Beachey, W. “Respiratory Care Anatomy and Physiology: Foundations for Clinical Practice”. Second edition. St Louis, Missouri, USA : Mosby, Elsevier, 2007. 53. Pesola, G R and Ahmed, U. “Editorial: Small Airway Disease and Asthma". The Internet Journal of Asthma, Allergy and Immunology. 2005, Vol. 4, 1. 54. Tortora, G J and Grabowski, S R. “Principles of Anatomy and Physiology”. Tenth Edition. New York, NY, USA : John Wiley & Sons, 2003. 55. Hafezi, N. “An integrated software package for model-based neuro-fuzzy classification of small airway disfunction”. El Paso, TX, USA : University of Texas at El Paso (M.S.Thesis), 2009. 56. NJH. National Jewish Health. [Online] 2011. http://www.nationaljewish.org/healthinfo/conditions/asthma/index.aspx. 57. ALA. American Lung Association Asthma and Children Fact Sheet. [Online] 2011. http://www.lungusa.org/lung-disease/asthma/resources/facts-and-figures/asthma-children-fact-sheet.html. 58. Mayo Clinic . Mayo Clinic Childhood Asthma Teatments and drugs. [Online] http://www.mayoclinic.com/health/childhood-asthma/DS00849/DSECTION=treatments-and-drugs. 59. Abbot, G E, et al. “Imaging of Small Airways Disease”. Jouranal of Thoracic Imaging. 2009, Vol. 24, 4, pp. 285-298. 60. Bhatia, R S. “Diseases of small Airways of lung”. Journal Indian Academy of Clinical Medicine. 2001, Vol. 2, 3, pp. 222-224.
124
61. Mayo Clinic. Mayo Clinic COPD Definition. [Online] 2011. http://www.mayoclinic.com/health/copd/DS00916. 62. Lung Cancer Organization. Lung Cancer 101. [Online] 2011. http://www.lungcancer.org/reading/about.php. 63. American Lung Association. American Lung Association Pneumonia . [Online] http://www.lungusa.org/lung-disease/pneumonia/?gclid=CNa6rKP8y6YCFQpvbAod6xuTFw. 64. Mayo Clinic. Mayo Clinic Tuberculosis Definition. [Online] 2011. http://www.mayoclinic.com/health/tuberculosis/DS00372. 65. —. Mayo Clinic Common Cold. [Online] 2011. http://www.mayoclinic.com/health/common-cold/DS00056. 66. —. Mayo Clinic Influenza (flu). [Online] 2011. http://www.mayoclinic.com/health/influenza/DS00081. 67. —. Mayo Clinic Pulmonary Edema . [Online] 2011. http://www.mayoclinic.com/health/pulmonary-edema/DS00412. 68. —. Mayo Clinic Cistic Fibrosis (CF). [Online] 2011. http://www.mayoclinic.com/health/cystic-fibrosis/DS00287. 69. Children’s Hospital of Pitsburg . Routing Testing Spirometry. [Online] 2010. http://www.chp.edu/CHP/Routine+Testing. 70. Barreiro, T J and Perrillo, I. "An approach to interpreting spirometry". 2004, Vol. 69, 5, pp. 1107-1115. 71. Galant, S. "Lung Function Measurement in the Assessment of Childhood Asthma: Recent Important Developments". Curr Opin Allergy Clin Immunol. 2010, Vol. 10, 2, pp. 149-154. 72. Goldman, M D, Saadeh, C and Ross, D. "Clinical applications of forced oscillation to assess peripheral airway function". Respiratory Physiology & Neurobiology. 2005, Vol. 148, pp. 179-194. 73. Goldman, M D. "Clinical Application of Forced Oscillation". Pulmonary Pharmacology & Therapeutics. 2001, Vol. 14, pp. 341-350. 74. Smith, H J, Reinhold, P and Goldman, M D. “Forced Oscillation technique and impulse oscillometry”. Eur Respir Mon. 2005, Vol. 31, pp. 72-105. 75. Marchal, F and Hall, G L. Forced Oscillation Technique. Eur Respir Mon. 2010, Vol. 47, pp. 121-136. 76. Carefusion. [Online] http://www.carefusion.com/images/IOS_Special_Edition.pdf. 77. Beydon, N et al. on Behalf of the American Thoracic Society/ European Respiratory Society Working Group on Infant and Young Children Pulmonary Function Testing. "An Official American Thoracic Society/European Respiratory Society Statement: Pulmonary Function Testing in Preschool Children". Am J Respir Crit Care Med. 2007, Vol. 175, pp. 1304-1345. 78. Oostveen, E, et al. "The forced oscillation technique in clinical practice: methodology, recommendations and future developments". Eur Respir J. 2003, Vol. 22, pp. 1026-1041. 79. Bar-Yishay, E, et al. "Use of the Forced Oscillation Technique to Detect Bronchodilation in children: Experience from the Schneider Children’s Medical Center of Israel". Isr Med Assoc J. 2009, Vol. 11, 4, pp. 198-200. 80. Lahzami, S and King, G G. "Targeting small airways in asthma: the new challenge of inhaled corticosteroid treatment". Eur Respir J. 2008, Vol. 31, pp. 1145-1147. 81. Schmidt, M, et al. "Computer Simulation of the measured respiratory impedance in newborn infants and the effect of the measurement equipment". Medical Engineering & Physics. 1998, Vol. 20, pp. 220-228. 82. Eyles, J G, et al. Parameter Estimates in a Five-Element Respiratory Mechanical Model. IEEE Transactions on Biomedical Engineering. 1982, Vol. 29, 6, pp. 461-463.
125
83. Dubois, A B, et al. "Oscillatin Mechanics of Lungs and Chest in Man". Journal of Applied Physiology. 1956, Vol. 8, 6, pp. 587-594. 84. Eyles, J G and Pimmel, R L. "Estimating Respiratory Mechanical Parameters in Parallel Compartments Models". IEEE Transactions on Biomedical Engineering. 28, 1981, Vol. 4, pp. 313-317. 85. Lutchen, K R and Costa, K D. "Physiological Interpretation based on lumped element models fit to respiratory impedance data: use of forward-inverse modeling". IEEE Transacctions on Biomedical Engineering. 1990, Vol. 17, 11, pp. 1076-1086. 86. Lutchen, K R. "Optimal selection of frequencies for estimating parameters from respiratory impedance data". IEEE Transacctions on Biomedical Engineering. 1988, Vol. 35, 8, pp. 607-617. 87. Mead, J. Mecanical Properties of Lungs. Physiological Reviews. 1961, Vol. 41, pp. 281-320. 88. —. "Contribution of compliance of airways to frequency-dependence behaviour of lungs". Journal of Applied Physiology. 1969, Vol. 26, 5, pp. 670-673. 89. Meraz, E, et al. “Modeling Human Respiratory Impedance in Anglo Asthmatic Children. Biomedical Engineering Recent Developments, Proceedings of the Twenty Third Southern Biomedical Engineering Conference. April 13-15 2007, pp. 108-113. 90. Meraz, E, et al. “Modeling Human Respiratory Impedance in Hispanic asthmatic children 5 to 17 years old”. Biomedical Engineering Recent Developments, Proceedings of the Twenty Fourth Southern Biomedical Engineering Conference. April 18-20 2008, pp. 87-90. 91. Meraz, E, et al. “Modeling Human Respiratory Impedance in Normal children 5 to 17 years old”. Biomedical Engineering Recent Developments, Proceedings of the Twenty Fourth Southern Biomedical Engineering Conference. April 18-20 2008, pp. 85-86. 92. Meraz, E, et al. “Impulse Oscillometric Features of Lung Function: Towards Computer-Aided Classification of Respiratory Diseases in Children”. Proceedings of the 30th Annual International Conference of the IEEE EMBS, Vancouver, Canada. August 20-24, 2008, pp. 2443-2446. 93. Meraz, E, et al. “Normal Impulse Oscillometry (IOS) Lung Function Parameters in Adolescents Residing in el Paso, TX”. 2008 Annual Meeting of the American College of Epidemiology, Annals of Epidemiology. Vol. vol. 18, 9, p. 72. 94. Goldman, M, et al. “Abnormality of Oscillometric Resistances and Reactances is Greater in Hispanic than Anglo Children in El Paso, TX”. CHEST 2008, Pediatric Pulmonary, Sleep, and Critical Care. October 2008, Vol. 134 , 4. 95. Meraz, E, et al. “Modeling Human Respiratory Impdance in Hispanic Asthmatic Children”. Proceedings of the 29th Annual International Conference of the IEEE EMBS. Lyon, France, August 23-26, 2007, pp. 4251-4254. 96. Meraz, E, et al. “Respiratory System Model Parameters Track Changes in Lung Function After Bronchodilation”. Biomedical Engineering Recent Developments, Proceedings of the 25th Southern Biomedical Engineering Conference. May 15-17, 2009, pp. 319-322 . 97. Meraz, E, et al. “Forced Oscillation (IOS) measures in airway-impaired and normal children over 2 years”. European Respiratory Journal, Abstracts 19th European Respiratory Society Annual Congress, Austria. Sept. 12-16, 2009, Vol. 34, 53, p. 681s. 98. Meraz, E G, et al. Analysis of impulse oscillometric measures of lung function and respiratorymodel parameters in small airway-impaired and healthy children over a 2-year period. BioMedical Engineering OnLine. 2011, Vol. 10, 21. 99. Zeltner, T B and Burri, P H. "The Postnatal development and growth of the human lung". II Morphology. Respiration Physiology. 1987, Vol. 67, pp. 269-282. 100. Thurlbeck, W M. "Postnatal human lung growth". Thorax. 1982, Vol. 37, pp. 564-571. 101. Zeman, K L and Bennett, W. "Growth of the small airways and alveoli from childhood to the adult lung measured by aerosol-derived airway morphometry". J Appl Physiol. 2006, Vol. 100, pp. 965-971.
126
102. Strunk, R C, et al. "Mild to moderate asthma affects lung growth in children and adolescents". J Allergy Clin Immunol. 2006, Vol. 118, pp. 1040-1047. 103. Irvin, C G. "Interactions between the growing lung and asthma: Role of early intervention". J Allergy Clin Immunol. 2000, Vol. 105(Suppl 2), pp. S540-S546. 104. Tai, ASN, et al. "Pediatric Origins of Adult Chronic Obstructive Pulmonary Disease (COPD): Childhood Asthma". Am J Respir Crit Care Med. 2010, Vol. 181, p. A2275. 105. Gross, G N. "Evaluating and Treating Small Airway Disease in Asthma". US Respiratory Care, , Reference Section. 2005, pp. 1-4. 106. Hashimoto, M, Tanaka, H and Abe, S. "Quantitative Analysis of Bronchial Wall Vascularity in the Medium and Small Airways of Patients with Asthma and COPD". CHEST. 2005, Vol. 127(Suppl 3), pp. 965-972. 107. Corren, J. "Small Airways Disease in Asthma". Current Allergy and Asthma Reports. 2008, Vol. 8, pp. 533-539. 108. Bhatia, R S. "Diseases of Small Airways of lung". Journal Indian Academy of Clinical Medicine. 2001, Vol. 2(Suppl 3), pp. 222-224. 109. Yamaguchi, M et al. "Effects of inhaled corticosteroids on small airways in asthma: investigation using impulse oscillometry". Pulm Pharmacol Ther . 2009, Vol. 22(Suppl 4), pp. 326-32. 110. Hoshino, M. "Comparison of effectiveness in Ciclesonide and Fluticasone Propionate on Small Airway Function in Mild Asthma". Allergol Int. 2010, Vol. 59, pp. 59-66. 111. Skloot, G, et al. "Respiratory Symptoms and Physiologic Assessment of Ironworkers at the World Trade Center disaster site". CHEST. 2004, Vol. 125, pp. 1248-1255. 112. Goldman, M D, et al. "Electrical Circuit Models of the Human Respiratory System Reflect Small Airway Impairment Measured by Impulse Oscillation (IOS)". Proceedings of the IEEE EMBS 32nd Annual International Conference. 2010, pp. 2467-2472. 113. Jeffery, P K. "The Development of Large and Small Airways". Am J Respir Crit Care Med. 1998, Vol. 157, pp. S174-S180.

127
Appendix A
IOS Calibration
1. Assemble the IOS equipment, if it is required, and be sure that all the equipment components are airtight. This is extremely important for the proper operation of the equipment.
2. Turn on the computer. Double-click the LAB Jaeger Lab Manager Icon and you will be placed in the initial (star-up) IOS screen. Wait 5 minutes to allow the system to warm up. You can see a clock showing the time countdown at the top center of the screen. You will automatically be placed into the main IOS screen.
3. Look at the bottom of the main screen and you will find several tabs: Main group, Data Base, Calibrations, Generation, and Utilities.
4. The first thing you need to do is the Calibration of the equipment. Double click the Calibration tab and you will see two icons: Ambient Conditions and Volume Calibrations.
5. If the equipment has been moved to a different location, as is the case in the home visits made in this project, it is important to check if the Ambient Conditions have changed. If you move the equipment to another location into the same city, it is probable that the only parameter that may change is the Temperature. Measure the temperature inside the room where you placed the IOS equipment with a regular thermometer, then double click the Ambient Conditions icon and update the temperature, if it is required, erasing the old temperature number and entering the new value. Be sure you enter the temperature in the correct units set in the equipment (e.g. °C or °F). Click OK and this will bring you back to Calibration screen. If the equipment has not been moved to a different location, as is the case for the test performed in the clinic set in this project, you do not need to check the ambient conditions once they are set.
6. The calibrations that need to be set every day, before you start doing any IOS test, are the Volume and Pressure Calibrations.
a. Volume Calibration: i. Open the terminal resistor door at the back of Y-connector (white plastic
connector with a moveable Terminal Resistor door) ii. Double click on Volume Calibrations. On the left you will see a screen flow vs
volume diagram, and on the right the calibration factors. The Flow vs Volume diagram has a dashed white marker at 3L.
iii. Click on the number one icon shown in the upper left of the screen to begin the volume calibration. You will see a dialog box indicating you should press ok to begin the zero measurement and click OK.
iv. Use the fixed resistance straight beige plastic tube attached the 3L syringe to the open end of the plastic angle connector. Fit it tightly to avoid any air leakage and be sure this attachment is airtight for the proper operation of the equipment.
v. Pull the syringe back and forward at a speed similar to your normal inspiration and expiration. You will see, in the Flow and Volume diagram, a flow-volume loop traced. Make sure the end of the syringe stroke corresponds closely to the vertical dashed white marker (3L), if it does not correspond it could be because you forgot to open the terminal resistor door.
vi. Pull on the syringe back and forth. The first strokes are erased and the last 6 strokes will be saved. After this the new calibrations factors will appear at the right portion of the screen.
vii. In the calibration factors screen you will see a table with the Corrections factors CorrIN (Correction factor for Inspiration) and CorrEX (Correction factor for
128
Expiration) in the first two rows, and tree columns: Old (old calibration values), New (new calibration values), and %Old (difference between new and old calibration). The important issue that we have to carefully check is that the New CorrIN and New CorrEX should not be different by more than 3% fron the Old values. If everything goes ok you will se a message at the bottom of the screen saying “Calibration successful”.
viii. To verify the stability of the calibration repeat the calibration immediately, after finishing the previous calibration. Click icon 10, and you will see a window asking “Save Calibration?” Click on yes to save the calibration and go back to the calibration screen. Repeat the previous steps to perform the calibration again.
ix. After finishing the calibration process, click on main group tab in the bottom of the screen to go back to IOS main screen.
b. Pressure Calibration: i. The Pressure Calibration ought to be done after you perform the Volume
Calibration. ii. Double click on the Patient Data icon. This will take you to the Patient Data
Screen. iii. Enter CAL in last and first name. Enter any 3-6 digit number for Identification
and enter a birth day month/day/year (use four digits for the year), and press enter iv. You will see a tab highlighted with the sex in it saying “Female”. Press enter if
you want to leave it like this, or press the space bar if you want to choose male. v. Next, enter a height and weight (it can be your own height and weight).
vi. Click on icon 10 (or press F10) to go back to the main IOS screen to perform the Pressure Calibration.
vii. You will see in the top of the screen the last and first name you just entered to do the Pressure Calibration, CAL, CAL. Check this every time you do the pressure calibration, this will make you sure that you are saving the pressure calibration data in the correct place.
viii. The Calibration Pressure is done by performing an IOS test using the Fixed Reference Resistance as patient.
ix. Close the terminal resistor door. x. Position the 0.2 kPA/L/s reference (fixed) resistance over the end of the angle
connector using the same fixed resistance straight beige plastic tube you just used to attached the syringe; make sure the connection be airtight.
xi. Double Click on Impulse Oscillometry Icon to enter to the IOS test screen. You will see a dialog box asking you to not approach the mouthpiece to do the zero adjustment. Be sure you always allow the system to do the zero adjustment before the patient places his/her mouth on the mouthpiece.
xii. After this you will hear a continuous popping from the loudspeaker. Wait a couple of seconds and press icon 2 to begin data saving. Do this test for 10 seconds and click on icon 7.
xiii. After this you will see 5 windows in the screen. Check that the calculated numerical values be 0.2kPa/L/s for R displayed in the upper right window. In doing IOS tests in homes you will find that this value changes up to 0.21kPa/L/s. This is because of the increased temperatures inside the houses, but if the value goes up more than this amount go to Reference Manual Troubleshooting.
xiv. Click on icon 10 to exit this screen. This will show you a dialog box saying “Save measurement?” Check that the adjacent circle to New Test has a black dot, and be

129
sure the saving primary data and default box inside this dialog box be checked, this is extremely important otherwise your data will not be properly saved, after this click yes.
Archiving IOS Data
1. First check where the data are being saved following the next steps:
a. Press Control, Alt, Shift and S. This will show you Service tools b. You will see the Icon DatGen highlighted in upper left. Double click on it and you will
see a window labeled Database-Generation -V4.xx This window has two columns: to the left is Local and to the right is Network.
c. Look at the Local site to see where the data are being. You will enter this as “source database.” In this research, we found that the data was stored in C:\LAB\DB for the computers we used, the Utep laptop and WSMR Clinic PC.
2. To back up your IOS data do the following: a. Double click Windows Explorer. b. Select My Computer. c. Select Local Disk (C:) d. Click on FILE (upper left). e. Select New, and then click Folder. f. Place the cursor in new folder and type DATAforMDG and hit enter. For this research
several folders were created inside this folder and approximately the IOS data for 5 children was saved in each one. The name chosen for each folder had the next information:
i. Folder number ii. The place where the original data was stored (PC2 WSMR or Laptop) iii. Race iv. Children number saved in each folder (e.g. 1-5)
g. Exit Windows Explorer. h. Go into LabManager and to the main IOS screen. i. Click on Actions (upper left top bar). j. Select Generate Lab Manager. k. Enter password (abcd) and press enter; you will now see a screen of main group icons
with rectangles all over screen. l. Double click on any empty rectangle to get a new dialog box. m. In this new dialog box entitled Add New Program, click on down arrow next to blue bar. n. Select Database Utility Merge from resulting menu and press OK. o. This new created icon will appear in previously empty rectangle on main screen. p. Click Generation (upper left top bar). q. Select End Generation Mode at bottom of drop down menu. r. You will now have main group screen (without rectangles) with the new added icon.
Once you create this icon you will just double click it every time you want to do a data base back up.
s. Double click this Database Utility Merge icon and in resulting dialog box entitled settings, click Select button under Source Data Base.
t. In resulting dialog box entitled Open, double click C in middle window, scroll down to Lab and select it with a double click.
130
u. Double click DB and then click OK v. C:\LAB\DB will now appear under Source Database w. Click select button under Destination data base x. Double click C in middle window and scroll down to DATAforMDG data and double
click it, scroll down again to select the appropriate folder were you are going to store the data and double click it and then click OK.
y. C:\ DATAforMDG\(folder name) will now appear under Destination Database z. Now click Create Database button under Destination Database aa. NOTE!! NEVER click create database when c:\LAB4\DB (your main database on
your hard drive) is listed as destination database, or you will ERASE ALL YOUR DATA if you execute this command!!
bb. Now look two thirds of the way down the dialog box and find “Consider date.” Enter appropriate dates in the box next to FROM and in the box next to UNTIL and click OK (upper right). This will transfer data from the beginning date to the until date to your new archive on C.
cc. If you or somebody else has tested patients on a given date that are NOT to be included in the data you wish to transfer, then look just below the Consider Data box and use the Single Patient box. Enter the exact patient ID in the small window labeled Identification and NOT enter anything in the Test number small window if you want that all tests on this patient on all dates are transferred. Then click OK.
dd. Exit out from this by clicking on X in upper right ee. This newly copied data can be checked by examining it under Windows
Explorer. It will have 18 files, with the largest one named MLDATA.DAT
This whole folder can then be zipped and then copied to the USB stick.
131
Vita
Erika Guadalupe Meraz Tena earned her Bachelor of Engineering degree in Electronics
Engineering from the Technological Institute of Chihuahua, Mexico in 1999. She received her Master of
Sciences degree in biomedical engineering in 2003 from the University of Surrey, United Kingdom. In
2006, she joined the doctoral program in electrical and computer engineering at the University of Texas
at El Paso.
While pursuing her degree, Dr Meraz Tena worked as a research assistant on a National Institute
of Health funded project on border asthma. She is currently a researcher professor at the Autonomous
University of Ciudad Juarez where she has been teaching since 2004. Most recently, Dr Meraz Tena,
was a receipent of a Dodson Dissertation Fellowship. Dr Meraz Tena has presented her research at
international conferences and workshop meeting in biomedical engineering and pulmonary medicine.
She has authored and co-authored several conference papers and was recently publishe in BioMedical
Engineering Online Journal.
Permanent address: 4141 Westcity ct. apt. 144
El Paso, Texas 79902
This thesis/dissertation was typed by Erika Guadalupe Meraz Tena.
Related Documents