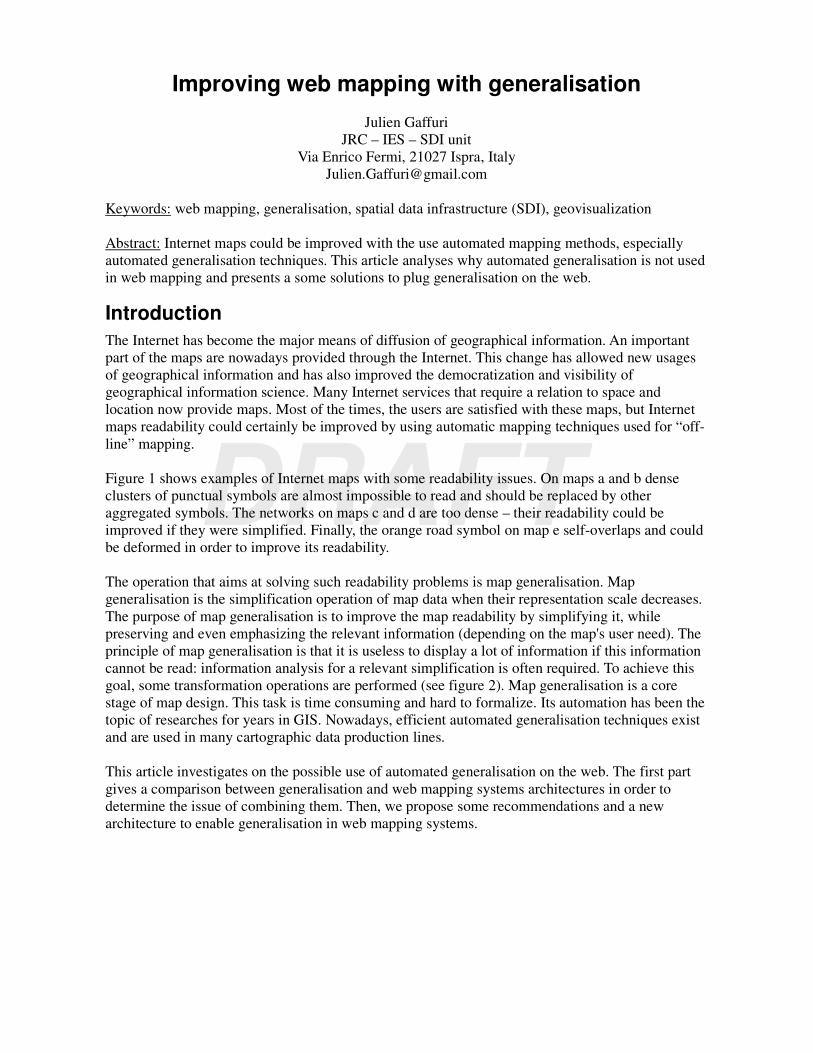
DRAFT Improving web mapping with generalisation Julien Gaffuri JRC – IES – SDI unit Via Enrico Fermi, 21027 Ispra, Italy [email protected] Keywords: web mapping, generalisation, spatial data infrastructure (SDI), geovisualization Abstract: Internet maps could be improved with the use automated mapping methods, especially automated generalisation techniques. This article analyses why automated generalisation is not used in web mapping and presents a some solutions to plug generalisation on the web. Introduction The Internet has become the major means of diffusion of geographical information. An important part of the maps are nowadays provided through the Internet. This change has allowed new usages of geographical information and has also improved the democratization and visibility of geographical information science. Many Internet services that require a relation to space and location now provide maps. Most of the times, the users are satisfied with these maps, but Internet maps readability could certainly be improved by using automatic mapping techniques used for “off- line” mapping. Figure 1 shows examples of Internet maps with some readability issues. On maps a and b dense clusters of punctual symbols are almost impossible to read and should be replaced by other aggregated symbols. The networks on maps c and d are too dense – their readability could be improved if they were simplified. Finally, the orange road symbol on map e self-overlaps and could be deformed in order to improve its readability. The operation that aims at solving such readability problems is map generalisation. Map generalisation is the simplification operation of map data when their representation scale decreases. The purpose of map generalisation is to improve the map readability by simplifying it, while preserving and even emphasizing the relevant information (depending on the map's user need). The principle of map generalisation is that it is useless to display a lot of information if this information cannot be read: information analysis for a relevant simplification is often required. To achieve this goal, some transformation operations are performed (see figure 2). Map generalisation is a core stage of map design. This task is time consuming and hard to formalize. Its automation has been the topic of researches for years in GIS. Nowadays, efficient automated generalisation techniques exist and are used in many cartographic data production lines. This article investigates on the possible use of automated generalisation on the web. The first part gives a comparison between generalisation and web mapping systems architectures in order to determine the issue of combining them. Then, we propose some recommendations and a new architecture to enable generalisation in web mapping systems.

Welcome message from author
This document is posted to help you gain knowledge. Please leave a comment to let me know what you think about it! Share it to your friends and learn new things together.
Transcript
DRAFT
Improving web mapping with generalisation
Julien Gaffuri
JRC – IES – SDI unit
Via Enrico Fermi, 21027 Ispra, Italy
Keywords: web mapping, generalisation, spatial data infrastructure (SDI), geovisualization
Abstract: Internet maps could be improved with the use automated mapping methods, especially
automated generalisation techniques. This article analyses why automated generalisation is not used
in web mapping and presents a some solutions to plug generalisation on the web.
Introduction
The Internet has become the major means of diffusion of geographical information. An important
part of the maps are nowadays provided through the Internet. This change has allowed new usages
of geographical information and has also improved the democratization and visibility of
geographical information science. Many Internet services that require a relation to space and
location now provide maps. Most of the times, the users are satisfied with these maps, but Internet
maps readability could certainly be improved by using automatic mapping techniques used for “off-
line” mapping.
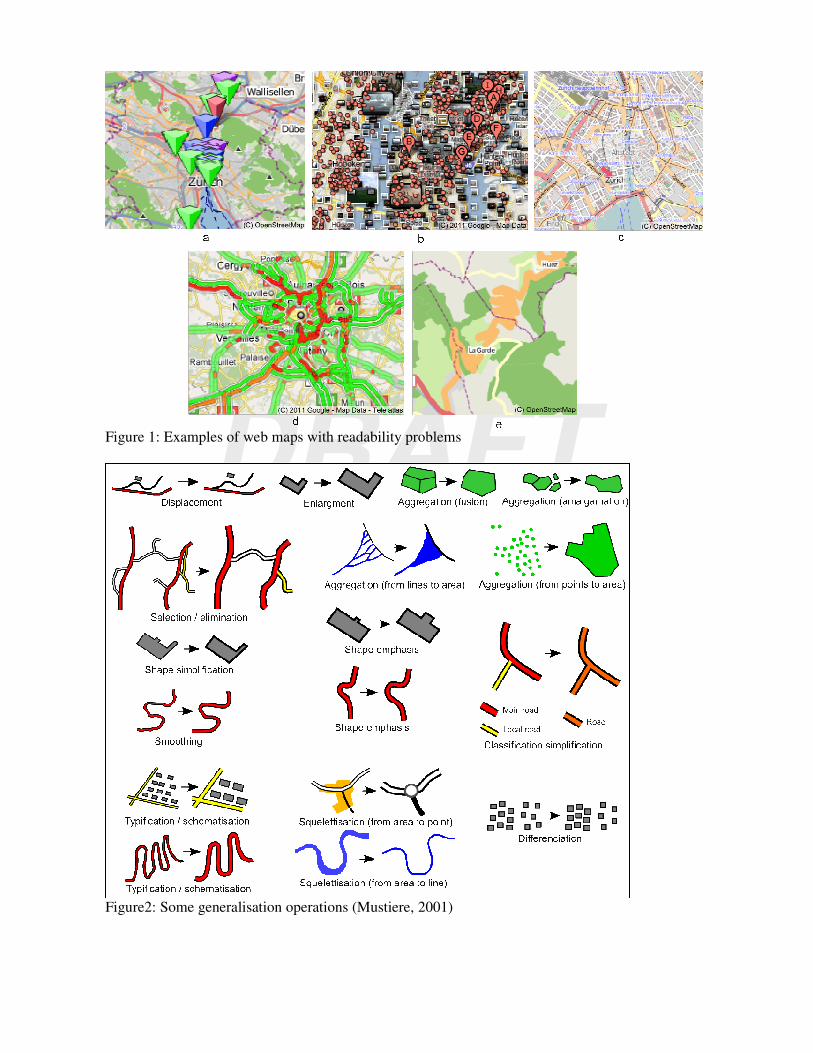
Figure 1 shows examples of Internet maps with some readability issues. On maps a and b dense
clusters of punctual symbols are almost impossible to read and should be replaced by other
aggregated symbols. The networks on maps c and d are too dense – their readability could be
improved if they were simplified. Finally, the orange road symbol on map e self-overlaps and could
be deformed in order to improve its readability.
The operation that aims at solving such readability problems is map generalisation. Map
generalisation is the simplification operation of map data when their representation scale decreases.
The purpose of map generalisation is to improve the map readability by simplifying it, while
preserving and even emphasizing the relevant information (depending on the map's user need). The
principle of map generalisation is that it is useless to display a lot of information if this information
cannot be read: information analysis for a relevant simplification is often required. To achieve this
goal, some transformation operations are performed (see figure 2). Map generalisation is a core
stage of map design. This task is time consuming and hard to formalize. Its automation has been the
topic of researches for years in GIS. Nowadays, efficient automated generalisation techniques exist
and are used in many cartographic data production lines.
This article investigates on the possible use of automated generalisation on the web. The first part
gives a comparison between generalisation and web mapping systems architectures in order to
determine the issue of combining them. Then, we propose some recommendations and a new
architecture to enable generalisation in web mapping systems.
DRAFT
Figure 1: Examples of web maps with readability problems
Figure2: Some generalisation operations (Mustiere, 2001)
DRAFT
Generalisation and web mapping: state of play
This part presents how generalisation and web mapping systems are designed in order to determine
the issues of their common use.
Generalisation systems architecture
Existing generalisation techniques are composed of model and graphic generalisation techniques.
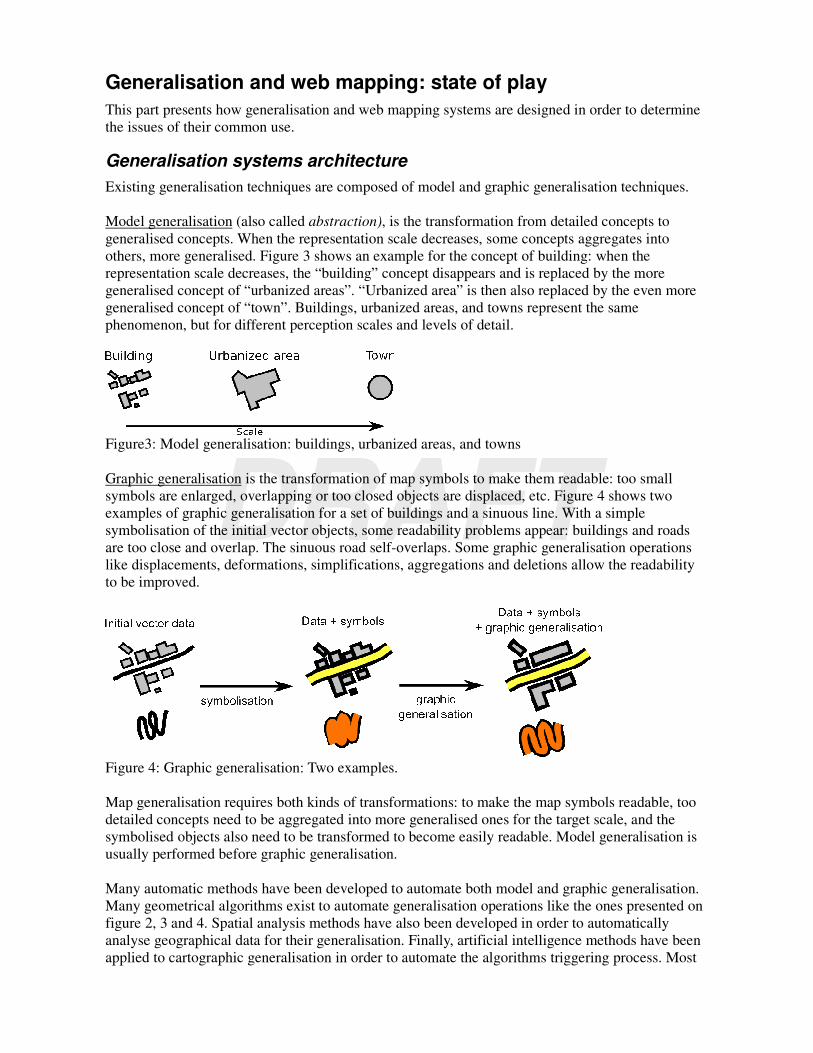
Model generalisation (also called abstraction), is the transformation from detailed concepts to
generalised concepts. When the representation scale decreases, some concepts aggregates into
others, more generalised. Figure 3 shows an example for the concept of building: when the
representation scale decreases, the “building” concept disappears and is replaced by the more
generalised concept of “urbanized areas”. “Urbanized area” is then also replaced by the even more
generalised concept of “town”. Buildings, urbanized areas, and towns represent the same
phenomenon, but for different perception scales and levels of detail.
Figure3: Model generalisation: buildings, urbanized areas, and towns
Graphic generalisation is the transformation of map symbols to make them readable: too small
symbols are enlarged, overlapping or too closed objects are displaced, etc. Figure 4 shows two
examples of graphic generalisation for a set of buildings and a sinuous line. With a simple
symbolisation of the initial vector objects, some readability problems appear: buildings and roads
are too close and overlap. The sinuous road self-overlaps. Some graphic generalisation operations
like displacements, deformations, simplifications, aggregations and deletions allow the readability
to be improved.
Figure 4: Graphic generalisation: Two examples.
Map generalisation requires both kinds of transformations: to make the map symbols readable, too
detailed concepts need to be aggregated into more generalised ones for the target scale, and the
symbolised objects also need to be transformed to become easily readable. Model generalisation is
usually performed before graphic generalisation.
Many automatic methods have been developed to automate both model and graphic generalisation.
Many geometrical algorithms exist to automate generalisation operations like the ones presented on
figure 2, 3 and 4. Spatial analysis methods have also been developed in order to automatically
analyse geographical data for their generalisation. Finally, artificial intelligence methods have been
applied to cartographic generalisation in order to automate the algorithms triggering process. Most
DRAFT
of the actual generalisation techniques are presented in (Mackaness et al., 2007) and on the website
of the ICA commission on “generalisation and multiple representation” (http://aci.ign.fr)
Nowadays, most of these techniques are used by more and more geographical data producers,
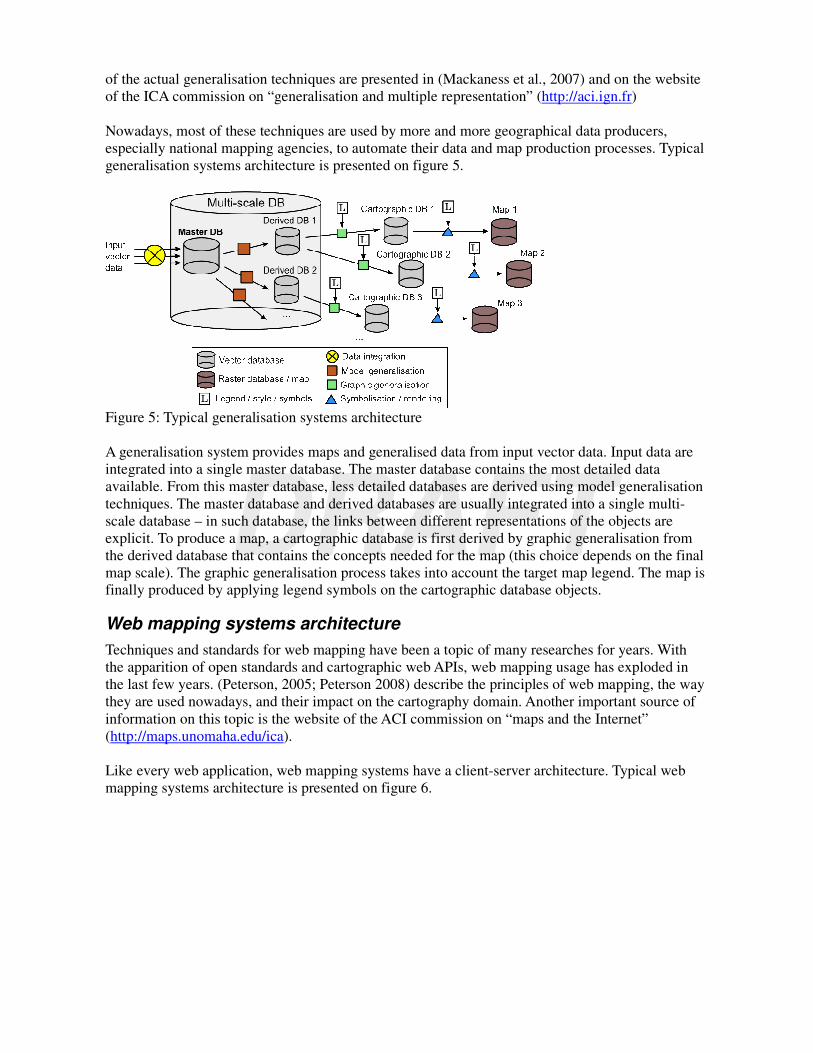
especially national mapping agencies, to automate their data and map production processes. Typical
generalisation systems architecture is presented on figure 5.
Figure 5: Typical generalisation systems architecture
A generalisation system provides maps and generalised data from input vector data. Input data are
integrated into a single master database. The master database contains the most detailed data
available. From this master database, less detailed databases are derived using model generalisation
techniques. The master database and derived databases are usually integrated into a single multi-
scale database – in such database, the links between different representations of the objects are
explicit. To produce a map, a cartographic database is first derived by graphic generalisation from
the derived database that contains the concepts needed for the map (this choice depends on the final
map scale). The graphic generalisation process takes into account the target map legend. The map is
finally produced by applying legend symbols on the cartographic database objects.
Web mapping systems architecture
Techniques and standards for web mapping have been a topic of many researches for years. With
the apparition of open standards and cartographic web APIs, web mapping usage has exploded in
the last few years. (Peterson, 2005; Peterson 2008) describe the principles of web mapping, the way
they are used nowadays, and their impact on the cartography domain. Another important source of
information on this topic is the website of the ACI commission on “maps and the Internet”
(http://maps.unomaha.edu/ica).
Like every web application, web mapping systems have a client-server architecture. Typical web
mapping systems architecture is presented on figure 6.
DRAFT
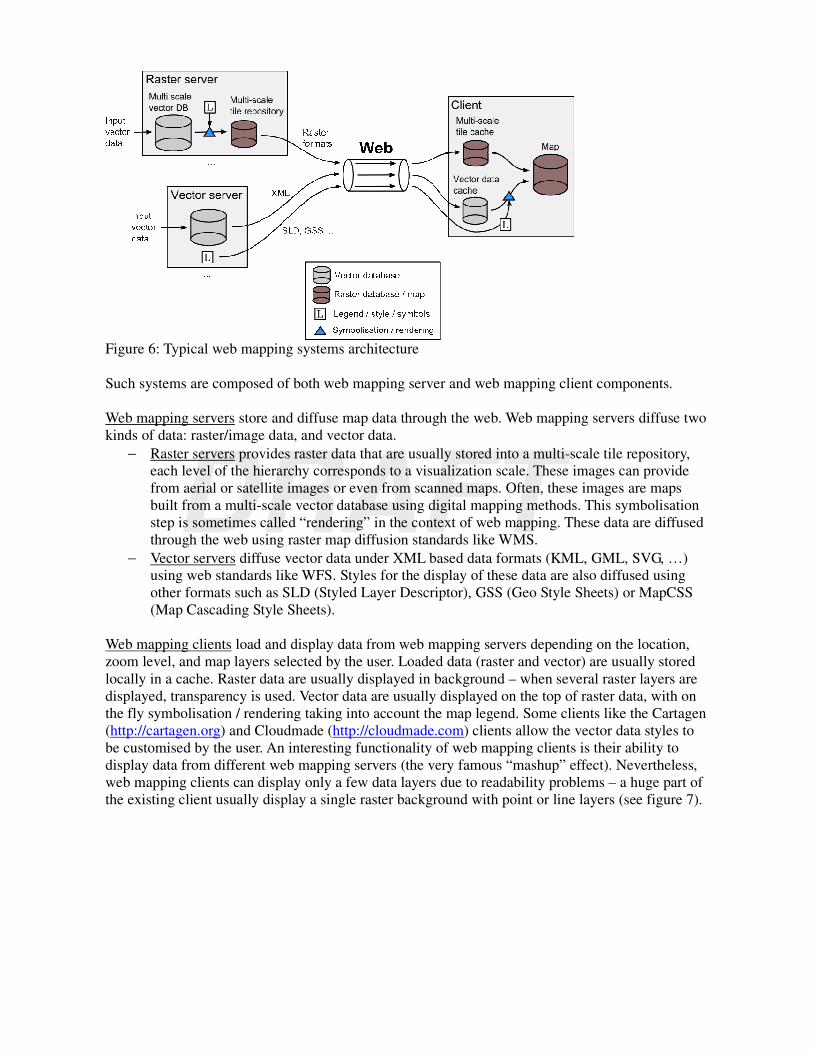
Figure 6: Typical web mapping systems architecture
Such systems are composed of both web mapping server and web mapping client components.
Web mapping servers store and diffuse map data through the web. Web mapping servers diffuse two
kinds of data: raster/image data, and vector data.
− Raster servers provides raster data that are usually stored into a multi-scale tile repository,
each level of the hierarchy corresponds to a visualization scale. These images can provide
from aerial or satellite images or even from scanned maps. Often, these images are maps
built from a multi-scale vector database using digital mapping methods. This symbolisation
step is sometimes called “rendering” in the context of web mapping. These data are diffused
through the web using raster map diffusion standards like WMS.
− Vector servers diffuse vector data under XML based data formats (KML, GML, SVG, …)
using web standards like WFS. Styles for the display of these data are also diffused using
other formats such as SLD (Styled Layer Descriptor), GSS (Geo Style Sheets) or MapCSS
(Map Cascading Style Sheets).
Web mapping clients load and display data from web mapping servers depending on the location,
zoom level, and map layers selected by the user. Loaded data (raster and vector) are usually stored
locally in a cache. Raster data are usually displayed in background – when several raster layers are
displayed, transparency is used. Vector data are usually displayed on the top of raster data, with on
the fly symbolisation / rendering taking into account the map legend. Some clients like the Cartagen
(http://cartagen.org) and Cloudmade (http://cloudmade.com) clients allow the vector data styles to
be customised by the user. An interesting functionality of web mapping clients is their ability to
display data from different web mapping servers (the very famous “mashup” effect). Nevertheless,
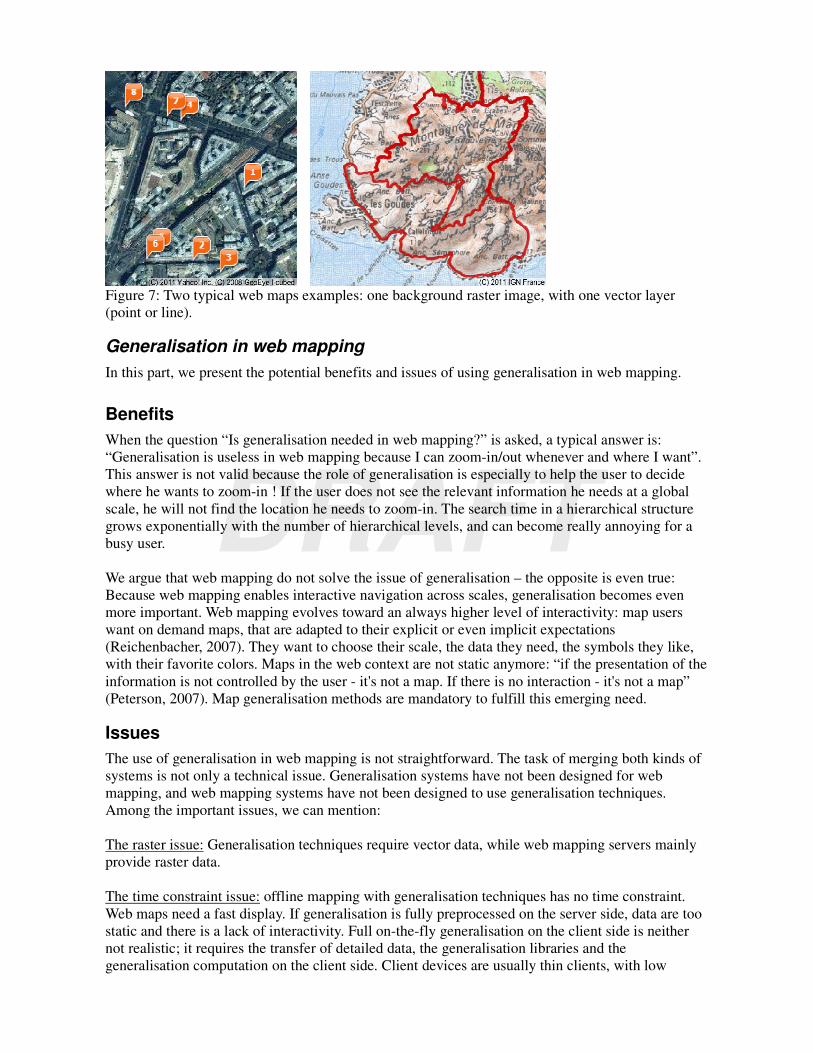
web mapping clients can display only a few data layers due to readability problems – a huge part of
the existing client usually display a single raster background with point or line layers (see figure 7).
DRAFT
Figure 7: Two typical web maps examples: one background raster image, with one vector layer
(point or line).
Generalisation in web mapping
In this part, we present the potential benefits and issues of using generalisation in web mapping.
Benefits
When the question “Is generalisation needed in web mapping?” is asked, a typical answer is:
“Generalisation is useless in web mapping because I can zoom-in/out whenever and where I want”.
This answer is not valid because the role of generalisation is especially to help the user to decide
where he wants to zoom-in ! If the user does not see the relevant information he needs at a global
scale, he will not find the location he needs to zoom-in. The search time in a hierarchical structure
grows exponentially with the number of hierarchical levels, and can become really annoying for a
busy user.
We argue that web mapping do not solve the issue of generalisation – the opposite is even true:
Because web mapping enables interactive navigation across scales, generalisation becomes even
more important. Web mapping evolves toward an always higher level of interactivity: map users
want on demand maps, that are adapted to their explicit or even implicit expectations
(Reichenbacher, 2007). They want to choose their scale, the data they need, the symbols they like,
with their favorite colors. Maps in the web context are not static anymore: “if the presentation of the
information is not controlled by the user - it's not a map. If there is no interaction - it's not a map”
(Peterson, 2007). Map generalisation methods are mandatory to fulfill this emerging need.
Issues
The use of generalisation in web mapping is not straightforward. The task of merging both kinds of
systems is not only a technical issue. Generalisation systems have not been designed for web
mapping, and web mapping systems have not been designed to use generalisation techniques.
Among the important issues, we can mention:
The raster issue: Generalisation techniques require vector data, while web mapping servers mainly
provide raster data.
The time constraint issue: offline mapping with generalisation techniques has no time constraint.
Web maps need a fast display. If generalisation is fully preprocessed on the server side, data are too
static and there is a lack of interactivity. Full on-the-fly generalisation on the client side is neither
not realistic; it requires the transfer of detailed data, the generalisation libraries and the
generalisation computation on the client side. Client devices are usually thin clients, with low
DRAFT
memory, weak processing capabilities, sometimes low data transfer capabilities, and therefore
cannot support generalisation in a satisfying time. The generalisation process has to be shared
between preprocessed generalisation on the server and on-the-fly generalisation on the client. A
good balance has to be found.
The integration issue: in generalisation, the data are integrated to be generalised altogether. In web
mapping, there is no integration – data are simply displayed late in the process (on the client side).
Web mapping does not take into account the relations between objects providing from different
servers. Some generalisation steps that require the data to be integrated have to be performed on the
client.
The genericity issue: Generalisation techniques for the web need to be generic enough to face the
emerging diversity of web data. The diversity of spatial data that are provided on the web is high.
New usages of geolocalisation devices and social networks contribute to the apparition of
cartographic applications with new kinds of data. Also, the increasing number of spatial data servers
parts of wider Spatial Data Infrastructures (SDI) makes the use of generic generalisation techniques
even more important.
The generalisation complexity issue: generalisation methods can be complex and hard to use by
web mapping developers.
The web generalisation libraries availability issue: many web mapping software components are
available and widely used in the very active web mapping community. It is not the case for
automatic generalisation libraries. Such a library based on GI and web standards should be
provided. Interoperability of these libraries is also a strong requirement.
The next section presents some recommendations to solve these issues and propose an architecture
for a web mapping system with generalisation.
Toward web mapping with generalisation
Recommendations
The previous section listed some problems for the use of generalisation in web mapping. We present
in this section some possible solutions and recommendations to solve these issues.
Preference for vector web mapping servers: Generalisation is possible only on vector data. If raster
data needs to be displayed with vector data, there is no way to generalise these data altogether on
the client. Furthermore, interactivity is higher with vector data: styles can be customised; objects
can be selected, etc. An issue of using vector data on the client's side is that vector data transfer,
storage, and symbolisation can sometimes be too cumbersome to be performed by the client. This
issue can be solved if a sufficient part of the generalisation process is done on the server:
Generalized data take less memory and are therefore faster to transfer, load and process than
detailed data. If the client cannot display the vector data provided by the server, it means that these
data have not been generalised enough on the server's side. Of course, raster web mapping servers
can still be used if there is no need of combination with other vector data. In that case, cartographic
generalisation techniques should be used to generate the server's tile repository.
Model generalisation on the server – graphic generalisation on the client: The generalisation process
must be shared between the server and the client. As proposed by (Harrie et al., 2002; Sester &
Brenner, 2005), it is a good balance to compute the model generalisation on the server, as a
preprocess, and to store the result in a multi scale database. The client should be able to query such
DRAFT
multi scale servers to retrieve the relevant objects for its visualisation scale, and to compute on-the-
fly graphic generalisation. This sharing between the server and the client allows the data transfer to
be minimum. The client remains responsible for the integration and the display of vector data
providing from different servers.
Progressive loading and generalisation of the data: Many web clients that display vector data use a
progressive display: the objects are displayed once they are loaded on the client – the client does not
wait all the data to be loaded from the server to display it. The same progressive display can be
applied for generalisation: when objects are loaded, they are displayed, and start to be generalise
step by step. Their progressive generalisation is displayed. This requires generalisation algorithms
to be “any time” algorithms. We argue that generalisation techniques using multi agents systems are
adapted for this purpose.
Progressive loading of generalisation libraries: Generalisation requires several software components
(like algorithms) that are not used for all generalisation cases. In order to make the graphic
generalisation library lighter on the client, then loading of some generalisation components could be
dynamic, depending on the need. A generalisation component would be loaded only if it is needed
to transform the data that are needed to be displayed.
Use of generic generalisation treatments: In order to make generalisation more adaptable to the
huge diversity of web data, existing generalisation techniques, that have been mainly developed for
specific data (mainly topographic data), need to be ‘generalised’ to other data themes.
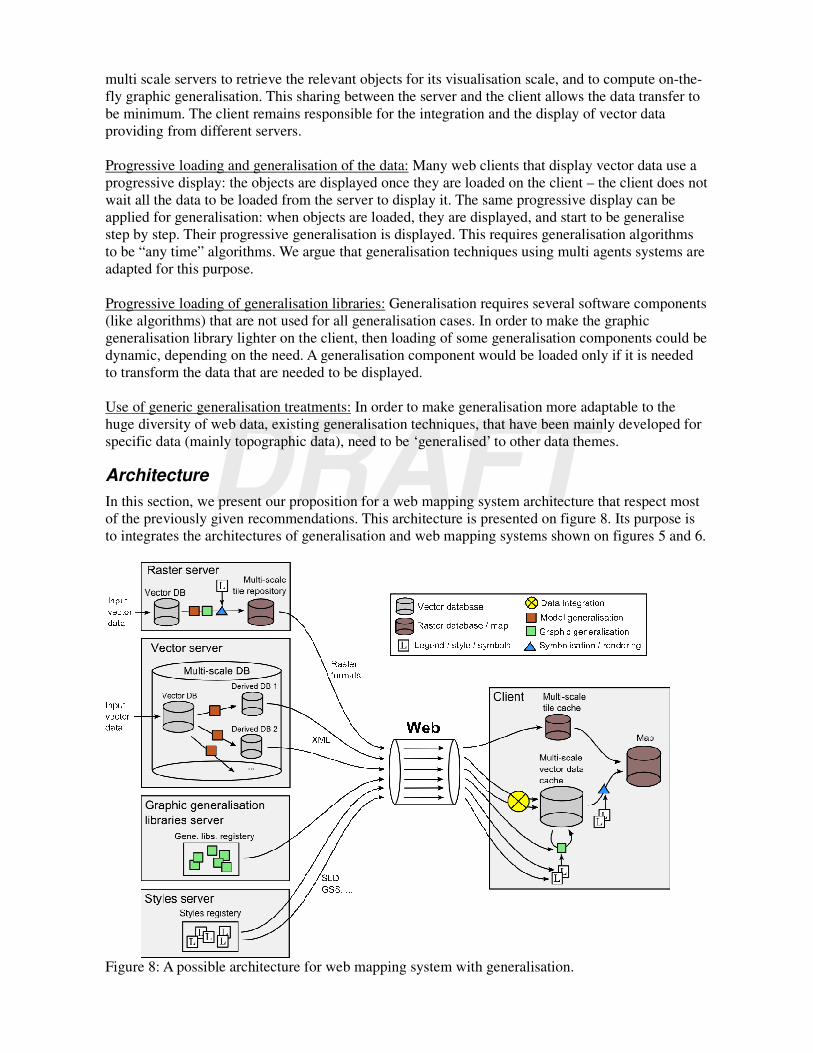
Architecture
In this section, we present our proposition for a web mapping system architecture that respect most
of the previously given recommendations. This architecture is presented on figure 8. Its purpose is
to integrates the architectures of generalisation and web mapping systems shown on figures 5 and 6.
Figure 8: A possible architecture for web mapping system with generalisation.
DRAFT
Such web mapping system is composed of four types of web mapping servers:
Raster web mapping servers are the same as the one presented on figure 6, except it uses model and
graphic generalisation techniques to generate improved raster maps.
Vector web mapping servers diffuse vector data from a multi-scale databases. The different
representations of the vector data at different scales are preprocessed using model generalisation
techniques. Such vector server is able to provide data to a client depending on its visualisation scale.
For example, a client will obtain “building” objects for high visualisation scale, and another one
“urbanised area” objects for a lower visualisation scale of the same region. A consequence of this
data diffusion according to the scale is that the data size to transfer through the web will quasi-
constant whatever the client visualisation scale.
Graphic generalisation libraries servers diffuse graphic generalisation libraries to be loaded
dynamically by the clients depending on their generalisation needs. It allows to keep the client
graphic generalisation system thin. Ideally, a web vector data provider should provide graphic
generalisation libraries adapted for its data visualisation. Even further, generalisation libraries could
be embedded with their objects, as methods.
Legend web mapping servers provide cartographic styles for vector data. In order to make
cartographic styles reusable for analog datasets diffused by different clients, an harmonisation of
these data schemas is required. For instance, the INSPIRE (http://inspire.jrc.ec.europa.eu) data
schema could be used for this purpose.
The last component of this architecture is the cartographic client. This client is able to load raster
data, like traditional existing clients, in a multi-scale tile cache. It also has the capacity to load and
integrate vector data from different servers. These data are requested to the server multi-scale
databases according to the visualisation scale. Returned data are stored in a local multi-scale cache.
The client computes on-the-fly graphic generalisation of these data, taking into account a style
returned by a style server (or specified by the user). The display of raster and generalised vector
data is done progressively: the objects appears when they are loaded from the server, and their
progressive generalisation is visible. The more the user keep a given location and scale, the more
the readability of the displayed map is improved. Because the generalised versions of the objects are
stored locally, this generalisation is not repeated when the user zoom-in and out. When the user
changes the map styles locally, the map objects also dynamically and progressively adapt to the new
cartographic constraints imposed by the new style.
From existing web mapping systems to the proposed one
Moving existing generalisation system toward the proposed on can be performed progressively.
Possible actions could be:
− Improvement of raster maps with addition of map generalisation techniques into existing
rendering softwares used to build map tiles from vector data.
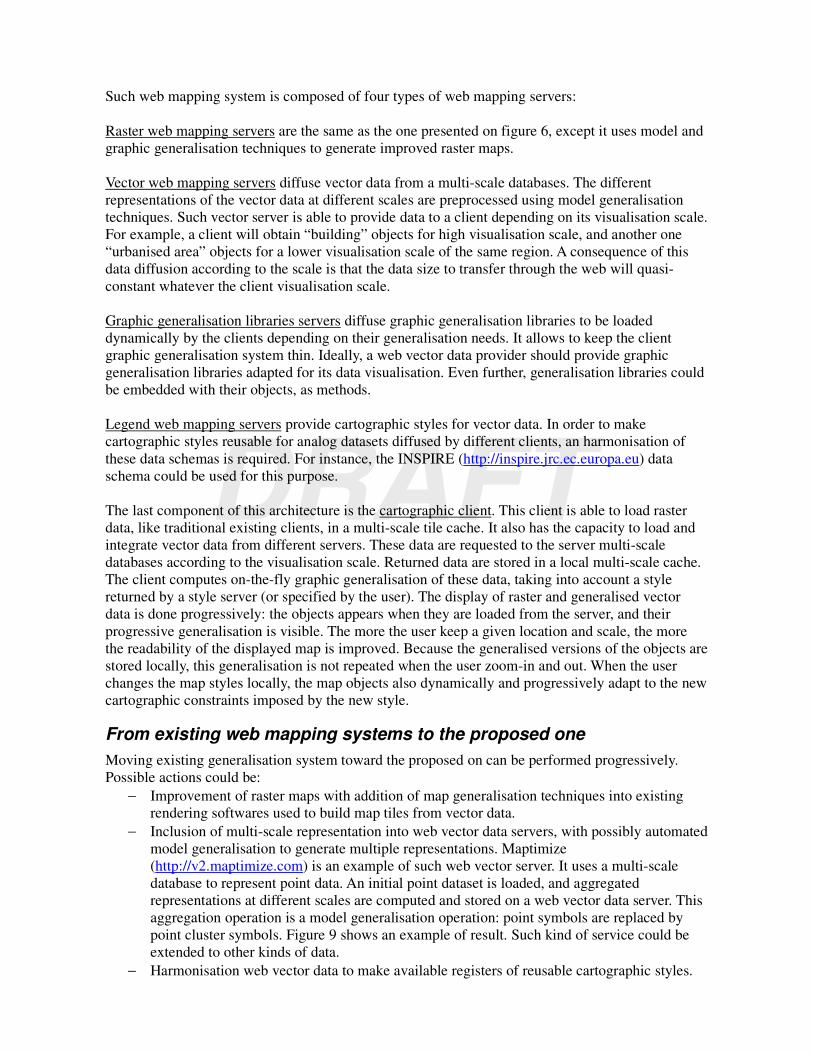
− Inclusion of multi-scale representation into web vector data servers, with possibly automated
model generalisation to generate multiple representations. Maptimize
(http://v2.maptimize.com) is an example of such web vector server. It uses a multi-scale
database to represent point data. An initial point dataset is loaded, and aggregated
representations at different scales are computed and stored on a web vector data server. This
aggregation operation is a model generalisation operation: point symbols are replaced by
point cluster symbols. Figure 9 shows an example of result. Such kind of service could be
extended to other kinds of data.
− Harmonisation web vector data to make available registers of reusable cartographic styles.
DRAFT
The INSPIRE project is an example of such initiative.
− Improvement of the style standards, like SLD and GSS. There is no complete standard to
represent cartographic styles. Style formats used in generalisation are much more flexible,
and allow a more advanced representation of styles.
− Improvement of client vector rendering with graphic generalisation techniques.
− Improvement of web query languages to include the scale dimension.
− …
Figure 9: Result from Maptimize service to generalise point data: before and after generalisation.
A key element of this new architecture is the client described in the previous part. Extending
existing web mapping client programs is certainly a hard task. They are usually designed mainly for
raster data. The OpenCarto project (https://sourceforge.net/projects/opencarto/) aims at providing
generalisation libraries and a web mapping client as the one described on figure 8. A prototype is
visible on the project's website.
Conclusion
In this article, we have analysed the issue and the possible benefits of generalisation in web
mapping. We have proposed a new architecture to support generalisation on the web.
Cartographic clients are not clients like the others: the rules to display maps are not the same as the
ones to display other images or HTML pages. Web servers and client should more take into account
the specificity of cartography, while cartographers should also work better on the transfer of their
know-how into the web. Improving web maps is possible, let's do it !
References
Harrie, L., Sarjakoski, T., Lehto, L., july 2002. A variable-scale map for small-display cartography.
In: Joint International Symposium on GeoSpatial Theory, Processing and Applications
(ISPRS/Commission IV, SDH2002). Ottawa, Canada.
Mackaness, W. A., Ruas, A., Sarjakoski, T. (Eds.), 2007. Generalisation of Geographic Information:
Cartographic Modelling and Applications. Elsevier.
Mustière, S., 2001. Apprentissage supervisé pour la généralisation cartographique. thèse de doctorat
en informatique, université Pierre et Marie Curie Paris VI, laboratoire COGIT.
Peterson, M. P. (Ed.), 2005. Maps and the Internet. Elsevier Science.
Peterson, M. P., 2007. Elements of multimedia cartography. In: Cartwright, W., Peterson, M. .,
Gartner, G. (Eds.), Multimedia Cartography. Springer Berlin Heidelberg, Berlin, Heidelberg, Ch. 5,
pp. 63-73.

DRAFT
Peterson, M. P. (Ed.), 2008. International Perspectives on Maps and the Internet. Lecture Notes in
Geoinformation and Cartography. Springer.
Reichenbacher, T., 2007. Adaptation in mobile and ubiquitous cartography. In: Cartwright, W.,
Peterson, M. P., Gartner, G. (Eds.), Multimedia Cartography. Springer Berlin Heidelberg, Berlin,
Heidelberg, Ch. 27, pp. 383-397.
Sester, M., Brenner, C., 2005. Continuous generalization for visualization on small mobile devices.
In: Fisher, P. (Ed.), Developments in Spatial Data Handling. pp. 355-368.
Related Documents