Department of Industrial Management and Logistics Faculty of Engineering, LTH Lund University Master thesis students: Veronica Danielsson and Granit Smajli Supervisor: PhD Joakim Kembro, Division of Engineering Logistics at LTH Examiner: Prof. Jan Olhager, Division of Engineering Logistics at LTH IMPROVING WAREHOUSING OPERATIONS WITH VIDEO TECHNOLOGY

Welcome message from author
This document is posted to help you gain knowledge. Please leave a comment to let me know what you think about it! Share it to your friends and learn new things together.
Transcript
Department of Industrial Management and Logistics
Faculty of Engineering, LTH
Lund University
Master thesis students: Veronica Danielsson and Granit Smajli
Supervisor: PhD Joakim Kembro, Division of Engineering Logistics at LTH
Examiner: Prof. Jan Olhager, Division of Engineering Logistics at LTH
IMPROVING WAREHOUSING
OPERATIONS WITH VIDEO
TECHNOLOGY

i

ii
Abstract
In the last decades, the role of warehouses has increased due to wider product range, emphasis on shorter
lead times and constant changes in customer demand. The increased demands forces companies to
improve their warehousing operations for better service level and decreased costs. Different technology
solutions like WMS and RFID are currently available for supporting this improvement. However, there is
still improvement potential. The purpose with this research is to investigate if video technology can make
warehousing more efficient. The research should contribute with an insight of how different types of
warehouses can benefit from video technology and how barriers prevent implementation. The authors
have chosen to collaborate with a world-leading company in the field of video technology. A multiple case
study has been performed, including nine companies in three different warehousing categories. The
categories are contracted warehouses, distribution warehouses and production warehouses. The multiple
case study was performed in two sessions where the first included a visit to the warehouses to better
understand their most demanding operations. Ideas were generated during the interviews of how video
can facilitate warehousing operations. These ideas were evaluated in the second sessions together with
an identification of barriers that prevent video implementation.
The research has shown that video technology is interesting to all warehouse types, with the objective to
enhance warehousing efficiency. Contracted warehouses were mostly interested in applications that
facilitate operations from picking and forward. Distributing warehouses were interested in applications
enhancing all warehousing operations. Production companies were foremost interested in video
applications that can enhance the receiving and shipping operations. Video technology can be useful for
analyzing events and should be considered as a new way of improving warehousing. The authors believe
video is a complement to WMS and RFID rather than a substitute. Two appreciated video applications
were the possibility to read barcodes with cameras and identify goods’ volume. Barriers to video
implementation that were considered as obstacles for investing were primarily connected to the
uncertainty of economical and operational benefits. Companies also experienced union restrictions and
interface problems as great barriers. A key success factor for managing barriers is providing warehouses
with benchmarking examples for clearer explanation of video’s benefits. Future research has also an
important role to document advantages with video technology. The authors believe that easier
integration would increase the probability of successful implementation. Integration could be facilitated
by providing video with other systems like WMS or automation as a package solution. If these aspects are
considered, video has a great potential in enhancing warehousing efficiency.
Keywords: warehousing, warehousing efficiency, barriers, operations, video technology, WMS and RFID.

iii
Preface
The research was conducted during the spring in 2015 as a part of our engineering studies within the field
of Supply Chain Management and Production at Lund University, Faculty of Engineering. Conducting the
research has improved our skills in analyzing real case problems. Managing difficulties during the research
process have also giving us an insight of how to approach unexpected obstacles. The research has further
enlighten the importance of understanding the connection between theory and practice.
The project was initiated by our collaborating partner, Axis Communications AB. The result would not
have been as extensive without their help and support. Working with Axis has been very exciting due to
their competence within the field of video technology and their strive for developing innovative solutions.
We would like to thank Patrik Anderson, our supervisor at Axis, for his commitment and trust. We are also
grateful for all feedback provided by our supervisor at Lund University, Joakim Kembro. Lastly, we would
like to express our gratitude to everyone that have taken an interest in this study, including case
companies, employees at Axis and Lund University.
Lund, May 2015
Veronica Danielsson Granit Smajli

iv
Table of Contents
1 Introduction .......................................................................................................................................... 1
Background: The growing importance of supply chain and warehousing .................................... 1
Purpose ......................................................................................................................................... 1
Research questions ....................................................................................................................... 2
Description of collaborating partner............................................................................................. 2
Delimitations ................................................................................................................................. 3
Structure of the thesis .................................................................................................................. 3
2 Frame of reference ............................................................................................................................... 4
Warehousing ................................................................................................................................. 4
Current Technologies in Warehouses ........................................................................................... 9
Video Technology Development ................................................................................................. 12
Barriers for implementation in warehousing.............................................................................. 17
3 Development of Process Framework .................................................................................................. 19
Purpose with a process framework ............................................................................................ 19
Explanation of the framework .................................................................................................... 21
4 Methodology ....................................................................................................................................... 22
Research Strategy ....................................................................................................................... 22
Research Design .......................................................................................................................... 24
Research process ........................................................................................................................ 36
Trustworthiness of the research ................................................................................................. 40
5 Findings from the multiple Case Study ............................................................................................... 42
Overall interest for video applications ........................................................................................ 42
Contracted warehouses’ interest for video technology ............................................................. 44
Distribution warehouses’ interest for video technology ............................................................ 45
Production warehouses’ interest for video technology ............................................................. 46
Appreciated applications ............................................................................................................ 47
Barriers for implementing video technology .............................................................................. 51
6 Analysis ............................................................................................................................................... 54
Analysis of warehouse groups’ interest for video applications .................................................. 54

v
Video’s contribution to warehousing efficiency ......................................................................... 59
Barriers to video technology ....................................................................................................... 60
7 Conclusion ........................................................................................................................................... 63
Warehouses’ need for video technology .................................................................................... 63
How to proceed with video technology in warehouses ............................................................. 64
Theoretical contribution and managerial implications ............................................................... 65
Suggestions for future research .................................................................................................. 65
8 Appendices .......................................................................................................................................... 67
Appendix A – Warehouse type according to Bartholdi and Hackman (2010) ............................ 67
Appendix B - Warehouse type according to Frazelle (2002)....................................................... 68
Appendix C – Research Protocol ................................................................................................. 69
Appendix D – Activity profiles for case companies ..................................................................... 70
Appendix E – Semi structured interview guide for the first multiple case study sessions ......... 79
Appendix F – Structured interview guide for the follow up multiple case interview ................. 83
9 List of reference .................................................................................................................................. 86

vi
List of figures
Figure 1. Visualization of RQ (Danielsson and Smajli, 2015) ......................................................................... 2
Figure 2. Visualization of ingoing components in research questions (Danielsson and Smajli, 2015) ......... 4
Figure 3. Shipments without intermediate warehouses (Bartholdi and Hackman, 2010) ........................... 5
Figure 4. Reduced shipments by using a warehouse (Bartholdi and Hackman, 2010) ................................. 5
Figure 5. Warehouse Operations (Danielsson and Smajli, 2015) ................................................................. 7
Figure 6. Frequently occurred problem in warehousing (Poon et al., 2009) .............................................. 11
Figure 7. The elements in video application and video technology (Danielsson and Smajli, 2015). .......... 13
Figure 8. Monitoring system. (Axis, 2014c) ................................................................................................ 14
Figure 9. Readable barcodes by Cognex's solution (Cognex, 2013) ........................................................... 15
Figure 10. Tripwire after entrance. (Axis, 2012) ......................................................................................... 16
Figure 11. Pallet overhangs. (SICK, 2014) ................................................................................................... 16
Figure 12. First part of the Process framework (Danielsson and Smajli, 2015) .......................................... 20
Figure 13. Warehouse relevance (Danielsson and Smajli, 2015) ................................................................ 25
Figure 14. The research process (Danielsson and Smajli, 2015) ................................................................. 36
Figure 15. Procedure for developing a process framework (Danielsson and Smajli, 2015) ....................... 38
Figure 16. Illustration of the quality inspection of pallets application (Axis, 2015f) .................................. 48
Figure 17. Example of a heat map (Connected Security, 2015) .................................................................. 49
Figure 18. Illustration of the measure volume application (Axis, 2015f).................................................... 49
Figure 19. Example of a barcode recognition application (Danielsson and Smajli, 2015) .......................... 50
Figure 20. Illustration of the human detection for forklift application (Axis, 2015f) ................................. 50
Figure 21. Illustration of a visual goods tracking solution (Axis, 2014a) ..................................................... 51
Figure 22. Most demanding operations for contracted warehouses ......................................................... 55
Figure 23. Most demanding operations for distribution warehouses ........................................................ 56
Figure 24. Most demanding operations for production warehouses ......................................................... 57
Figure 25. Illustration of barriers and solutions .......................................................................................... 61
List of tables
Table 1. Warehouse classification according to Berg and Zijm (1999) ......................................................... 5
Table 2. Research on warehouse operations ................................................................................................ 6
Table 3. Performance metrics per warehouse operation according to Frazelle (2002) ............................... 8
Table 4. Performance metrics based on reversed or forward flow. Mondragon et al. (2011). .................... 9
Table 5. How a WMS supports warehousing operations ............................................................................ 10
Table 6. How RFID improve warehouse operations ................................................................................... 12
Table 7. Available video technologies ......................................................................................................... 14
Table 8. Kinds of supply chain barriers, extraction from Harland et al., (2007) ......................................... 17
Table 9. Examples of barriers for implementation of technology in warehousing .................................... 18
Table 10. Second part of the Process framework (Danielsson and Smajli, 2015) ...................................... 21
Table 11. Matching research purpose with methodology, Voss et al. (2002) ............................................ 23

vii
Table 12. Categorization of enterprises according to the European Commission (2003) .......................... 26
Table 13. Activity profile for Pilot Company ............................................................................................... 27
Table 14. Information about the nine case companies .............................................................................. 29
Table 15. Pilot and multiple case study protocol ........................................................................................ 35
Table 16. Criteria for trustworthy research. Boesch et al. (2013). ............................................................. 40
Table 17. Description of video applications. ............................................................................................... 42
Table 18. Quantified interest for video applications for all case companies. ............................................ 43
Table 19. Barriers stated by the case companies ....................................................................................... 52
Table 20. Warehouse types' average interest for video technology depending on operation .................. 55
Table 21. Video applications’ value compared to WMS and RFID (Danielsson and Smajli, 2015) ............. 60
Table 22. Type of barriers for video technology ......................................................................................... 61

1
1 Introduction
Background: The growing importance of supply chain and warehousing
Warehousing is a critical part of every supply chain, ensuring that customers receive the right product, at
the right time and price (Christopher and Towill, 2001). In the last decades, the role of warehouses has
increased due to wider product range, emphasis on shorter lead times and constant changes in customer
demand (Geraldes et al., 2008; Baker and Canessa, 2009; Accorci et al., 2014). Despite its importance,
warehouse operations are however often regarded as a burden due to the involved capital and operating
expenses (Bartholdi and Hackman, 2010). According to Baker and Canessa (2009) and De Koster et al.
(2007), warehousing represents approximately a quarter of the total logistics cost. Considering that
warehouses cannot be eliminated from a supply chain (Frazelle, 2002), companies are therefore looking
at cutting costs and improving warehousing efficiency (de Koster et al., 2007).
Even though companies are looking at reducing warehousing costs, there is a lack in literature of how to
achieve this. The majority of research is concentrated on isolated sub-problems without considering all
warehousing operations jointly (Geraldes et al., 2008; Gu et al., 2007). Even though there is technology
solutions currently used that consider all warehousing operations with the objective to improve efficiency.
One example is the Warehouse Management System (WMS) that offers a way to store information and
handle operations (Nee, 2009). Another example is radio frequency identification (RFID). The technology
enables products to be automatically identified, resulting in cost savings through shorter handling times
(Karagiannaki et al., 2011). Despite the benefits with WMS and RFID, there are still problems within
warehousing. Companies are facing the challenge to adapt new technology in order to enhance
warehousing operations further (Karagiannaki et al., 2011). A modern technology that has the potential
to improve warehousing efficiency is network video. Video is used in other market segments and can
perform analysis on video sequences. It is currently applied within transportation and retailing to read,
count and document activities (Axis, n.d.). Video technology is not established within warehousing but
companies are starting to market their video solutions to this segment (Divis, n.d.; VLS, 2015). Video
technology might improve warehousing efficiency but it is unknown in what way and how barriers affect
implementation.
Purpose
The purpose with this research is to investigate how video technology can improve warehousing operations
for different types of warehouses and how barriers prevent implementation.
This research will contribute with suggestions for video applications in warehousing. A video application
is when video is applied on warehousing to enhance efficiency or support operations. The applications are
developed in collaboration with warehouses to ensure that the pull effect is identified. The research will
further contribute with an identification of the greatest barriers for implementing video technology in
warehousing. The barriers’ impact on implementation is explored together with an analysis on how the
barriers can be managed. A process framework is developed in order to identify the need for video
technology in warehousing. The framework will include characteristics for each warehouse type and

2
operation. Currently used technologies are outlined for visualizing how they facilitate warehousing
operations. The process framework is used throughout the report and the result from the research will be
added to the framework. The research will highlight the pull for video from warehouses by identifying
their needs. A presentation of the push for video from technology companies is given by elaborating what
solutions are currently available. A match between the push and pull for video technology in warehousing
is then performed.
Research questions
The objective with the research is to investigate how video technology can improve warehousing
efficiency depending on type of warehouse. Literature lists many kinds of warehouses (Frazelle, 2002;
Berg and Zijm, 1998; Bartholdi and Hackman, 2010). Warehouse type might affect the need for video
technology since difficulties with performing operations can vary in magnitude. Some video applications
could be directed to certain operations and therefore be more appropriate for some warehouses. An
interesting area to investigate is therefore the connection between warehouse type and operations and
how this affect the need for video technology. Another area of interest is how barriers prevent
implementation of video technology. The major barriers will be identified and influence the discussion
about video technology’s potential in warehousing. The research purpose is expressed in two research
questions and illustrated in Figure 1.
RQ1. How can different types of warehouses benefit from video technology?
RQ2. How do barriers prevent implementation of video technology in warehousing?
Description of collaborating partner
To answer the research questions, an understanding of the existing video technologies must be obtained.
For this reason, the authors have chosen to collaborate with Axis Communications AB (from here on
known as Axis). Axis, founded in 1984, is a world leading company in the field of high technological
cameras. The company operates in a global market and have 1900 employees in over 40 countries around
the world. The headquarters is located in Lund, Sweden. Axis is growing steadily for each year and the
2014th annual report showed a turnover of 5.45 billion SEK with a profit margin of 13.1 %. In 1996, Axis
wrote history when launching the first network camera in the world. It was a starting point for the shift
from analogue to digital technology. The shift illustrates the company’s goal very well, aiming at being on
Warehouse
type
Operations
Video
technology
Figure 1. Visualization of RQ (Danielsson and Smajli, 2015)
B
a
r
r
i
e
r
s

3
the leading edge by innovative development. Axis has maintained its position as market leader through
developing innovative network surveillance cameras. Their network video products are mainly used in
public areas covering places such as retail stores, airports, trains, highways, universities, prisons, casinos
and banks (Axis, 2015a). Axis provides and develops both the hardware and software for their camera
solutions. The company collaborates with partners within different industries in order to stay competitive
(Axis 2015b). The main reason for choosing to collaborate with Axis is that they are a world leading
company when it comes to video technology. Axis has video solutions that among others can count and
detect object and is already pushing this onto segments like retailing and transportation. Axis’ knowledge
and experience of video solutions are valuable and strongly connected to the aim of this research. The
expertise will be helpful when investigating possible application areas within warehousing. The company’s
interest for the warehousing area has increased and they are already investigating how their technology
can be used for making warehousing more efficient.
Delimitations The research is restricted to how video technology can be used within warehousing. Other parts in the
supply chain will not be examined. The empirical investigation will be limited to companies that mainly
have warehouses in Scandinavia. The constraint that the empirical study only investigates warehouses
located in Scandinavia is not seen as a problem. There might be differences between the state of
warehouses depending on the infrastructure and development phase in different parts of the world. De
Koster & Balk (2008) investigated the differences between globally dispersed warehouses and found that
European warehouses were more efficient than North American and Asian ones. It is hence reasonable to
investigate Scandinavian warehouses, since new innovative applications will probably be more interesting
for evolved warehouses. Furthermore, the research considers only large warehouses with a high turnover.
The delimitation is based on the criteria for the case companies, which can be read in 4.2. The investment
cost for video technology will not be considered due to the lack of information. No comparisons between
video technology and other technologies will therefore be made in terms of investment costs. The
research has a strict time scope that is predetermined to 20 weeks of works for two persons.
Structure of the thesis
The next chapter includes a literature review that presents warehouse types and operations. Current and
future technologies that can be used in warehousing is also presented. A presentation of the process
framework and an explanation for how it was used is given. The methodology chapter presents the
approach for conducting this research. It includes research strategy and research design. The research
process is described and the trustworthiness of the research discussed, including research validity and
reliability. The chapter after that presents the findings from the multiple case study, covering both
interview sessions performed. The analysis chapter investigates relations within and between warehouse
groups regarding their interest for video technology. The final chapter summarizes the results from the
research and answers the research questions. Suggestions for future research is also presented.
References and appendix can be seen at the end of this report.

4
2 Frame of reference A literature review considering all elements related to the research questions is given in this chapter as
illustrated in Figure 2. The chapter starts by introducing warehousing, considering different kinds of
classifications. It gives an explanation to operations performed and how they can be evaluated.
Understanding warehousing design is important for investigating the need for video technology. Current
and potential technologies used in warehousing is presented later in this chapter. The section includes
warehouse management system, RFID and video technology. Video technology might contribute with
efficiency gains through time savings and cost reductions in warehousing that neither WMS nor RFID
currently can attain. To better understand what barriers video might face, barriers for implementing
information systems like WMS and RFID are elaborated.
Warehousing
Warehousing has an important intermediate role within the supply chain, affecting both costs and service
(Faber et al., 2013). The requirements for warehousing operations have increased significantly. It is related
to the increased customer needs and new demand trends (e.g. e-commerce) affecting factors such as
order accuracy, response time and order size (Accorci et al., 2014). Warehousing has several purposes to
fulfill in today’s business. One reason for having warehouses is the rapid changes in demand that can be
hard to quickly adapt to (Bartholdi and Hackman, 2010). Many companies use centralized warehouses as
an approach to manage distribution processes more efficiently (Faber et al., 2013). Activities such as
labelling and pricing of products can be more economical to perform in central warehouses rather than
delegating it to each retail store (Bartholdi and Hackman, 2010). Warehousing can also be used for
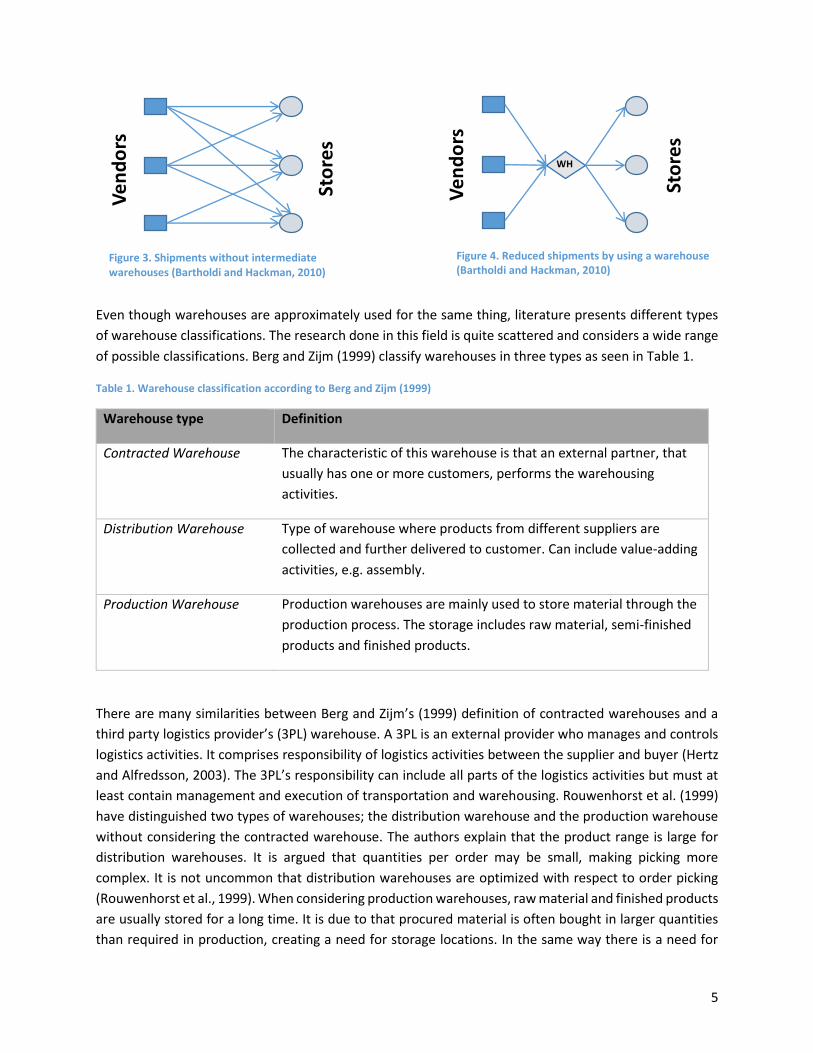
reducing transportation cost by consolidating shipments as illustrated in Figure 3 and Figure 4.
Warehousing
BarriersTechnology
Figure 2. Visualization of ingoing components in research questions (Danielsson and Smajli, 2015)
5
Even though warehouses are approximately used for the same thing, literature presents different types
of warehouse classifications. The research done in this field is quite scattered and considers a wide range
of possible classifications. Berg and Zijm (1999) classify warehouses in three types as seen in Table 1.
Table 1. Warehouse classification according to Berg and Zijm (1999)
Warehouse type Definition
Contracted Warehouse The characteristic of this warehouse is that an external partner, that
usually has one or more customers, performs the warehousing
activities.
Distribution Warehouse Type of warehouse where products from different suppliers are
collected and further delivered to customer. Can include value-adding
activities, e.g. assembly.
Production Warehouse Production warehouses are mainly used to store material through the
production process. The storage includes raw material, semi-finished
products and finished products.
There are many similarities between Berg and Zijm’s (1999) definition of contracted warehouses and a
third party logistics provider’s (3PL) warehouse. A 3PL is an external provider who manages and controls
logistics activities. It comprises responsibility of logistics activities between the supplier and buyer (Hertz
and Alfredsson, 2003). The 3PL’s responsibility can include all parts of the logistics activities but must at
least contain management and execution of transportation and warehousing. Rouwenhorst et al. (1999)
have distinguished two types of warehouses; the distribution warehouse and the production warehouse
without considering the contracted warehouse. The authors explain that the product range is large for
distribution warehouses. It is argued that quantities per order may be small, making picking more
complex. It is not uncommon that distribution warehouses are optimized with respect to order picking
(Rouwenhorst et al., 1999). When considering production warehouses, raw material and finished products
are usually stored for a long time. It is due to that procured material is often bought in larger quantities
than required in production, creating a need for storage locations. In the same way there is a need for
Ve
nd
ors
Sto
res
WH
Ve
nd
ors
Sto
res
Figure 4. Reduced shipments by using a warehouse (Bartholdi and Hackman, 2010)
Figure 3. Shipments without intermediate warehouses (Bartholdi and Hackman, 2010)

6
storing finished products when the produced batch is higher than customer demand. The main criteria
when designing production warehouses is therefore storage capacity (Rouwenhorst et al., 1999).
Bartholdi and Hackman (2010) have distinguished five different types of warehouses; retail, service part,
catalogue fulfillment or e-commerce, 3PL and perishable warehouses (see appendix 8.1). Frazelle (2002)
have categorized seven types of warehouses that are named; raw material and component, work-in
process, finished goods, distribution warehouse and distribution center, fulfilment warehouse and
fulfilment center, local warehouse and lastly value-added service warehouse (see appendix 8.2). Either
these categorizations are based on product characteristics or where in the supply chain the warehouse is
located. The categorization presented by Berg and Zijm (1999) is chosen for this research. It provides a
simple way to define warehouses and leaves no room for ambiguity. Berg and Zijm’s classification that
includes contracted warehouses considers the question of liability. The classification is appropriate to use
since some video applications manage complaints, which is affected by liability. Literature clarifies that
warehousing consists of various operations with different objectives as presented in Table 2.
Table 2. Research on warehouse operations
Operation Definition Reference
Receiving Includes activities such as unloading of goods, quality and quantity inspections and prepacking for easier handling.
Frazelle (2002) Gu et al. (2006) Shiau and Lee (2010)
Put-Away Involves the decision to determine where to store the item and can include transporting the product to its storage location.
Bartholdi and Hackman (2010) Chiang et al. (2011)
Storing Storing encompasses the transportation of the products and the determination of its storage locations.
Berg and Zijm (1999) Gu et al. (2007) Petersen and Aase (2004)
Picking Removing items from storage and sort batch picks into individual orders.
Frazelle (2002) Gu et al. (2007) Petersen and Aase (2004)
Checking and Packing Inspections of fully completed customer orders. Ends with packing the goods.
Bartholdi and Hackman (2010)
Shipping Prepare shipping documents and load the products. Can include checking and packing.
Frazelle (2002) Gu et al. (2007) Shiau and Lee (2010)
Returns Handling and inspecting returned products. Communicating with internal departments, vendors and customers.
Jayaramana et al. (2008) Zhang and Sun (2004)
The warehousing operations mentioned require a closer description. Following the flow of goods, the first
warehousing operation is receiving the product. The receiving operation entails unloading of goods,
quality and quantity inspections, prepacking for easier handling and put-away for storage (Frazelle, 2002).
Put-away can be classified as a single activity (Bartholdi and Hackman, 2010). It involves determining
where to store the item and ends with transporting the product to its storage location. Storage is the

7
operation when the product is transported to the storage location and then stored (Berg and Zijm, 1999).
Next step in the warehouse is order picking, which is when items are removed form storage, packed and
sorted (Frazelle, 2002). Bartholdi and Hackman (2010) separate checking and packing as the next step
where the warehouse staff assure that customer orders are complete and finally pack it. In comparison,
Frazelle (2002) states that the checking for order completeness and packing belong to the shipping
operation, which also includes preparing shipping documents and loading the products.
The operations do not cover all activities that modern warehousing deals with today. There has been a
massive increase in flow of goods going backwards in the supply chain in recent years (Jayaramana et al.,
2008). This is known as reversed logistics and is something warehousing must adapt to. Some scholars
state that companies are too inefficient when it comes to handling returned goods (Lee et al., 2012). The
increase in returns is due to information asymmetry between companies and customers, the complexity
in business environment and diversity of customer’s demands (He and Liu, 2006). These factors make
customer complaint unavoidable. Overall returns represent 6% of sales and can be as high as 15% for mass
merchandise and 35% for catalogue and e-commerce retailers (Jayaraman and Luo, 2007). The magnitude
of product returns suggest that companies should improve their complaint service management (He and
Liu, 2006). The selected operations to consider in this research is visualized in Figure 5.
Figure 5. Warehouse Operations (Danielsson and Smajli, 2015)
Theory suggests that connections can be made between warehouse type and warehouse operation.
Receiving and shipping are more complex if the products are to be stored (Gu et al., 2007). The reason is
that these operations must be coupled with put-away and picking operations. Contract logistics, also
known as 3PL (Xianglian and Hua, 2013), does not have storing when performing cross docking. These
warehouses might therefore not experience the storing operation as challenging. Additionally, a growing
number of 3PLs are exploring the possibility of handling product returns in a more cost-efficient manner
(Min and Ko, 2008). A main issue for production warehouses is storage capacity since products are usually
stored for longer times (Rouwenhorst et al., 2000). Distribution warehouses typically deal with a large set
of orderlines over a wide scope of products making the picking operation complex and expensive
(Rouwenhorst et al., 2000).
Assessing the warehousing operations’ performance enables identification of improvement areas and
gives information of the state of a warehouse (Johnsson and McGinns, 2010; Beamon, 1999). Effectiveness
and efficiency are two different dimensions of measures (Neely et al., 1995). Effectiveness reflects the
extent to which customer requirements are met, while efficiency is a measure of how well the economic
resources within the company are utilized given a service level. The assessment of warehousing
performance has not been extensive in literature (Johnsson and McGinns, 2010). The most common used
metric within warehousing is productivity, which is the ratio between the output of what is being achieved
and the input of resources needed (Frazelle, 2002). Receiving can be evaluated by the amount of pallets
8
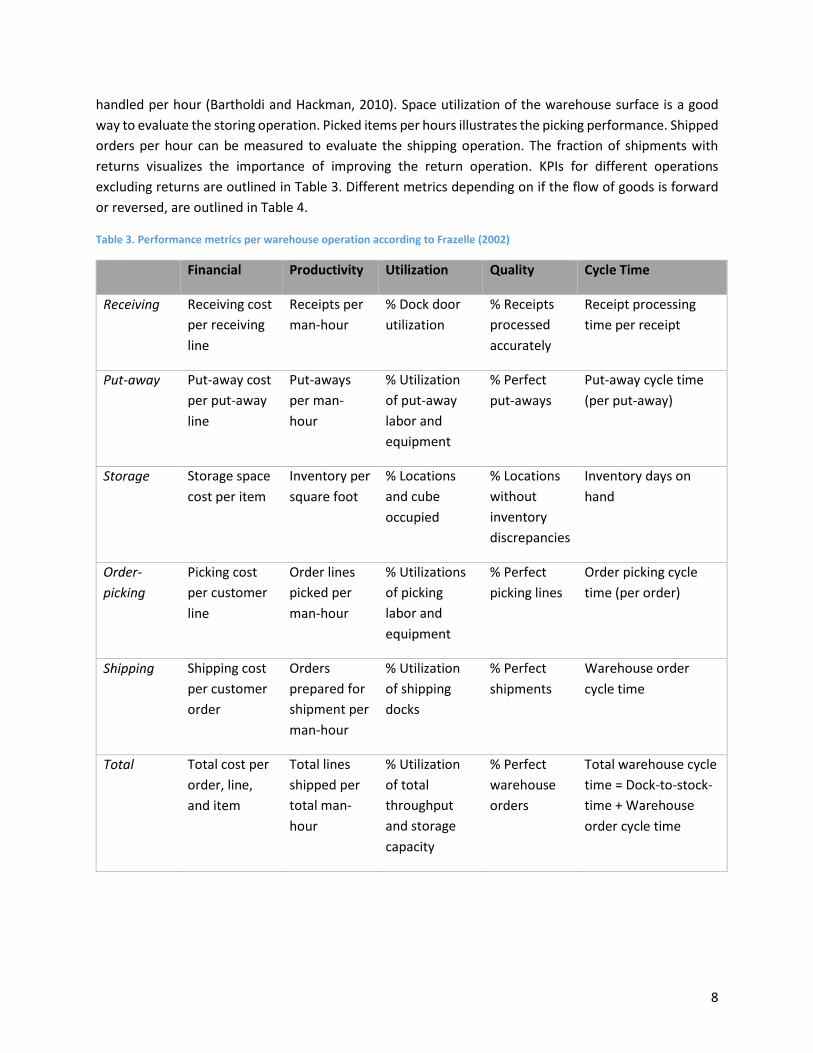
handled per hour (Bartholdi and Hackman, 2010). Space utilization of the warehouse surface is a good
way to evaluate the storing operation. Picked items per hours illustrates the picking performance. Shipped
orders per hour can be measured to evaluate the shipping operation. The fraction of shipments with
returns visualizes the importance of improving the return operation. KPIs for different operations
excluding returns are outlined in Table 3. Different metrics depending on if the flow of goods is forward
or reversed, are outlined in Table 4.
Table 3. Performance metrics per warehouse operation according to Frazelle (2002)
Financial Productivity Utilization Quality Cycle Time
Receiving Receiving cost
per receiving
line
Receipts per
man-hour
% Dock door
utilization
% Receipts
processed
accurately
Receipt processing
time per receipt
Put-away Put-away cost
per put-away
line
Put-aways
per man-
hour
% Utilization
of put-away
labor and
equipment
% Perfect
put-aways
Put-away cycle time
(per put-away)
Storage Storage space
cost per item
Inventory per
square foot
% Locations
and cube
occupied
% Locations
without
inventory
discrepancies
Inventory days on
hand
Order-
picking
Picking cost
per customer
line
Order lines
picked per
man-hour
% Utilizations
of picking
labor and
equipment
% Perfect
picking lines
Order picking cycle
time (per order)
Shipping Shipping cost
per customer
order
Orders
prepared for
shipment per
man-hour
% Utilization
of shipping
docks
% Perfect
shipments
Warehouse order
cycle time
Total Total cost per
order, line,
and item
Total lines
shipped per
total man-
hour
% Utilization
of total
throughput
and storage
capacity
% Perfect
warehouse
orders
Total warehouse cycle
time = Dock-to-stock-
time + Warehouse
order cycle time

9
Table 4. Performance metrics based on reversed or forward flow. Mondragon et al. (2011).
Type of flow Performance metrics
Performance measures forward flow -Total units received in period
-Total units shipped in period
-Average units received per day
-Average units shipped per day
-Freight and preparation
-Days analyzed
-Total spent in preparation of devices
-Backorders
Performance measures reversed flow -Total returns
-Total faults
-Percentage of returns from shipments
-Percentage of faults from shipments
-Reversed logistics costs per device returned and processed
-Reversed logistics costs per device dispatched
-Average units returned
Current Technologies in Warehouses Two currently used technologies within warehousing are WMS and RFID. These technology solutions are
used to enhance warehousing efficiency through facilitating planning, coordination and control activities
and inventories. The WMS has highly improved the documentation of materials handling and the RFID
technology enables real-time data in warehouses.
Warehouse Management System
A WMS can be used for obtaining efficiency in warehousing by recording and handling operations (Nee,
2009, Bartholdi and Hackman, 2010). The main purpose with the system is to keep track and register
incoming and outgoing shipments (Bartholdi and Hackman, 2010). It is possible by providing, storing and
reporting information that is required to manage the warehousing operations. The WMS is part of a larger
system that communicates with other management systems such as order acceptance, procurement,
production control, finance and transportation (Faber et al., 2002). These systems can be integrated in a
common enterprise resource planning (ERP) system. However, there is a difference between an ERP
system and WMS. The main distinction is the scope of planning horizon where the WMS is more short-
term oriented focusing on warehousing activities, and the ERP system focuses on a long time horizon that
includes all functions in the enterprise (Faber et al., 2002).
There are many improvement possibilities using a WMS. Its contribution for improving warehousing
efficiency is outlined in Table 5. A WMS is important for achieving cost reductions in operations, obtain

10
effective management and stay competitive on a strategic level (Nee, 2009). The WMS provides
advantages such as increased productivity, reduced inventories and better space utilizations (Faber et al.,
2002). It can also be used for optimizing warehousing resources, which is especially important for a 3PL
(contracted) warehouse (Tan, 2009). Warehouses without an implemented WMS might have a
disadvantage in comparison with competitors that do have this software (Faber et al., 2002). A single-case
study performed by Nee (2009) investigates what benefits that follow after implementing a WMS. The
case study indicates that a WMS eliminates manual errors, reduces labour costs, increases productivity
and that less time is spent on searching for deviations. The WMS implementation gave a better overview
of completed and upcoming tasks resulting in an enhanced planning. The case company managed to
reduce safety stocks simultaneously as increasing the service level.
Table 5. How a WMS supports warehousing operations
Warehouse Operation Improvement with WMS Reference
Receiving With the WMS, the personnel will know
when goods will arrive to the warehouse
and can easily check if it is the right goods
of the right quantity.
Bartholdi and Hackman (2010)
Storing The WMS can facilitate goods
management, which can lead to reduced
inventory levels and safety stock levels.
The WMS can also tell where to store
goods and utilize space better.
Faber et al. (2002); Nee (2009)
Picking The WMS can see orders that have to be
picked, create a pick list and optimize the
picking route with respect to the shortest
path.
Bartholdi and Hackman (2010);
Faber et al. (2002)
Shipping The WMS will tell when and how the
goods will be shipped and provide
packaging instructions.
Bartholdi and Hackman (2010);
Returns Information about when and why goods
will be returned can be obtained with a
high end WMS.
Bartholdi and Hackman (2010);

11
RFID
Warehousing activities must be enhanced with new information technology to stay competitive
(Karagiannaki et al., 2011). Synchronizing material and information flow and reduce inventory
discrepancies is one of the most significant questions warehousing managers are facing (Wang et al.,
2010). WMS was adopted with the purpose to gather warehousing operations data to be able to solve
problems with material handling (Poon et al., 2009). Though, the current WMS face difficulties regarding
retrieving timely and accurate information about the warehousing operations. The problem is derived
from WMS’s incapability of providing real-time data. Information inaccuracy is unavoidable since human
errors are inescapable when using a WMS (Poon et al., 2009). Incorrect information regarding inventory
levels, warehouse capacity and storage locations will lead to inaccurate reports generated by the WMS as
illustrated in Figure 6. Imprecise reports cause the warehouse staff to make untrustworthy material
handling decisions. It is therefore important to integrate an intelligent system with real-time and
automatic data retrieval features in the warehouse. RFID is the most common technology to solve this
problem and has been widely adopted (Poon et al., 2009).
Figure 6. Frequently occurred problem in warehousing (Poon et al., 2009)
RFID is a technology that uses radio frequency signals and space coupling by which it can achieve
automatic identification of moving or static targets through non-contact transmission of data (Zhang and
Lian, 2008). An RFID system consists of three parts: a tag, antenna and reader (Hou, 2011). The tag consists
of radio frequency coupling components and chips where each tag has got a unique code. The reader can
read or write tag information by decoding the radio frequency signals. The antenna has the mission to
radiate radio frequency waves and receive the signals sent by the tag and enables communication
between the reader and the tag. When the tag is within the working area it can receive radio frequency
signals sent by the reader. The coupling component in the tag can activate the chip by using energy from
induced current. The code in the chip will be sent back to the reader. The reader decodes the information
and prepares the retrieval of data processing of the upper controlling computer. Communication between
the reader and the tag allows the location of the item to be recorded and the information transferred to
a server (Ngai et al., 2008).
In warehouses, a tag can be attached to each unit of goods. When the goods enter the warehouse region,
the RFID reader will automatically read the tag information and transfer it to the WMS. RFID can provide
support for decision making regarding placement of goods. It will shorten distribution time and improve
the utilization degree of warehousing space (Hou, 2011). Benefits with RFID are more effective packing
and loading of goods, possibility to check product source, have an effective quality surveillance system
and possibility to track material flow (Zhang and Lian, 2008). It can further enable faster receiving and

12
shipping operations and an improved order fulfillment rate (Ross et al., 2009). RFID can facilitate all
warehousing operation by providing easier communication (Ross et al., 2009). For a clarification of how
the warehousing operations are affected by RFID, see Table 6.
Table 6. How RFID improve warehouse operations
Video Technology Development
There has been efficiency improvements realized in warehousing from implementing WMS and RFID.
These technologies can store information about goods and transactions, which facilitate warehousing.
Although, WMS fails to deliver timely and accurate information since it is lacking the real-time feature
(Poon et al., 2009). RFID provides a way to deal with this problem. Video technology can further contribute
when analyzing what has happened in a warehouse and provide a way to capture events on video.
Technology companies are pushing video solutions onto warehouses. Video technology enables recording
of events, known as video monitoring and analysis of video sequences, called video analytics. To clarify
the relationship between the technical terms a schematic illustration in Figure 7 is presented.
Warehouse Operation Improvement with RFID Reference
Receiving Verify that the right product has entered
the warehouse in the right quantity. The
verification and documentation in the
WMS is done faster with RFID.
Zhang and Lian (2008); Ross et
al. (2009)
Storing The optimization of locating goods is
easier and the degree of space utilization
is improved with RFID since no
uncertainty exist of inventory level
discrepancies.
Hou (2011)
Picking RFID enables easier and faster tracking of
goods. No time is spent on searching for
the goods in the warehouse.
Ross et al. (2009)
Shipping It is easier to organize loading position for
more effective and faster packing and
loading.
Hou (2011); Zhang and Lian
(2008); Ross et al. (2009)
Returns If a product should return to the
warehouse after it has been shipped, it is
easy to ensure product authentication.
Ross et al. (2009)
13
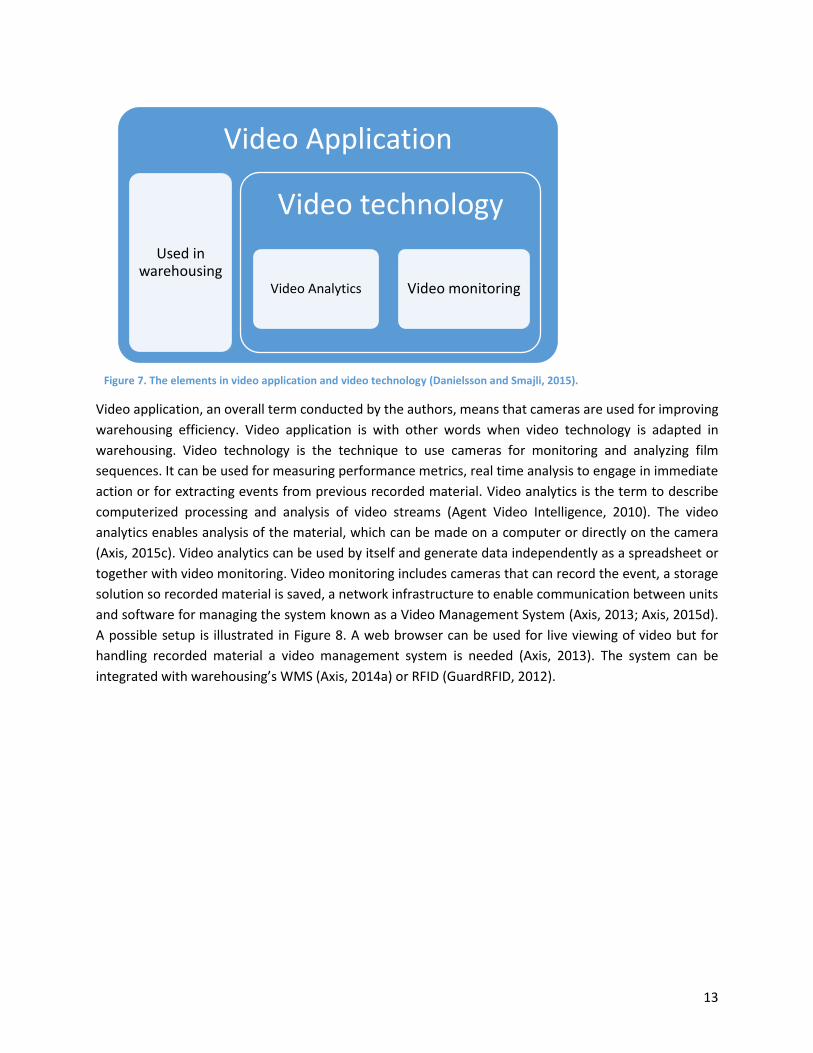
Video application, an overall term conducted by the authors, means that cameras are used for improving
warehousing efficiency. Video application is with other words when video technology is adapted in
warehousing. Video technology is the technique to use cameras for monitoring and analyzing film
sequences. It can be used for measuring performance metrics, real time analysis to engage in immediate
action or for extracting events from previous recorded material. Video analytics is the term to describe
computerized processing and analysis of video streams (Agent Video Intelligence, 2010). The video
analytics enables analysis of the material, which can be made on a computer or directly on the camera
(Axis, 2015c). Video analytics can be used by itself and generate data independently as a spreadsheet or
together with video monitoring. Video monitoring includes cameras that can record the event, a storage
solution so recorded material is saved, a network infrastructure to enable communication between units
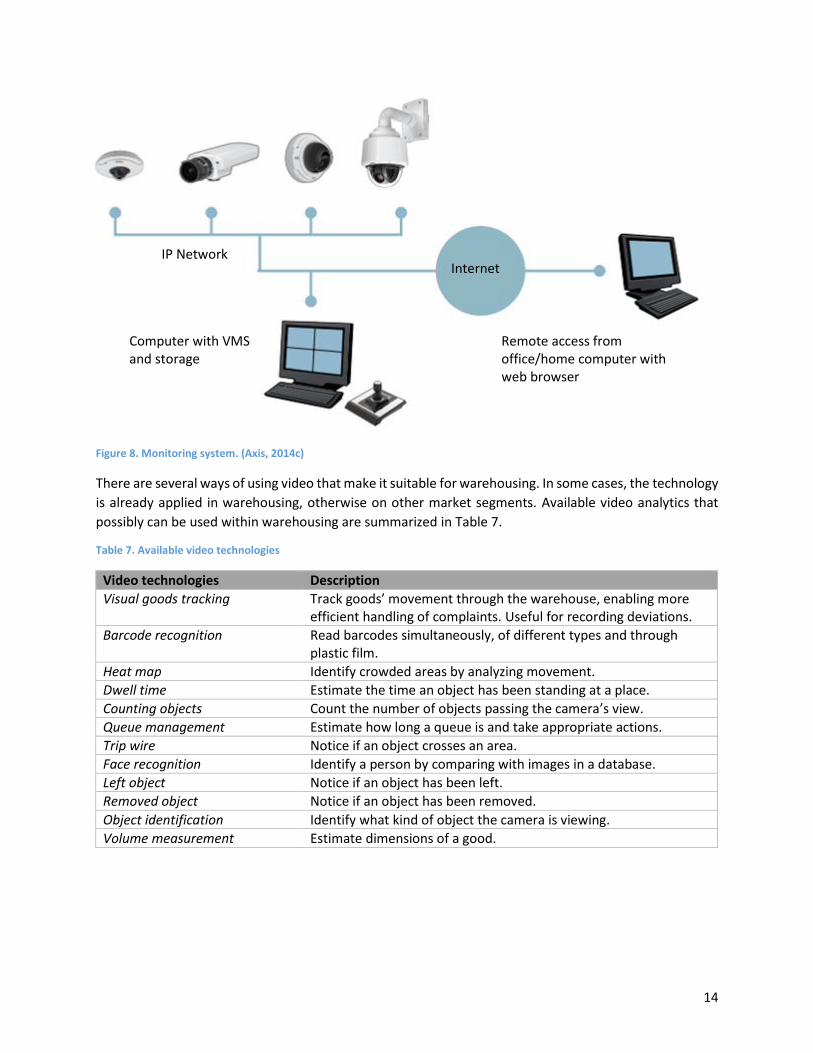
and software for managing the system known as a Video Management System (Axis, 2013; Axis, 2015d).
A possible setup is illustrated in Figure 8. A web browser can be used for live viewing of video but for
handling recorded material a video management system is needed (Axis, 2013). The system can be
integrated with warehousing’s WMS (Axis, 2014a) or RFID (GuardRFID, 2012).
Video Application
Used in warehousing
Video technology
Video Analytics Video monitoring
Figure 7. The elements in video application and video technology (Danielsson and Smajli, 2015).
14
There are several ways of using video that make it suitable for warehousing. In some cases, the technology
is already applied in warehousing, otherwise on other market segments. Available video analytics that
possibly can be used within warehousing are summarized in Table 7.
Table 7. Available video technologies
Video technologies Description
Visual goods tracking Track goods’ movement through the warehouse, enabling more efficient handling of complaints. Useful for recording deviations.
Barcode recognition Read barcodes simultaneously, of different types and through plastic film.
Heat map Identify crowded areas by analyzing movement.
Dwell time Estimate the time an object has been standing at a place.
Counting objects Count the number of objects passing the camera’s view.
Queue management Estimate how long a queue is and take appropriate actions.
Trip wire Notice if an object crosses an area.
Face recognition Identify a person by comparing with images in a database.
Left object Notice if an object has been left.
Removed object Notice if an object has been removed.
Object identification Identify what kind of object the camera is viewing.
Volume measurement Estimate dimensions of a good.
Figure 8. Monitoring system. (Axis, 2014c)
IP Network Internet
Computer with VMS and storage
Remote access from office/home computer with web browser
15
Visual goods tracking is a video application based on video monitoring that has been implemented in
warehousing. If a product’s identification number is entered into the VMS all related images will be
accessed, which makes it possible to view the product’s physical flow in retrospective (VLS, 2015). It
increases warehousing transparency and reliability. Visual goods tracking can be used for damage analysis
and transfer of liability (Divis, n.d.). Visual goods tracking can be used to handle complaints, both towards
supplier and customer. Being able to prove that the product was already damaged when it entered the
warehouse or that it was perfectly handled by the warehouse staff can be valuable. It might save the
warehouse both time and money by avoiding penalties, extra transportation or searching through video
material (VLS, n.d.a). Axis also markets their solution as a way to improve operations by identifying
education needs and improvement areas (Axis, 2015e).
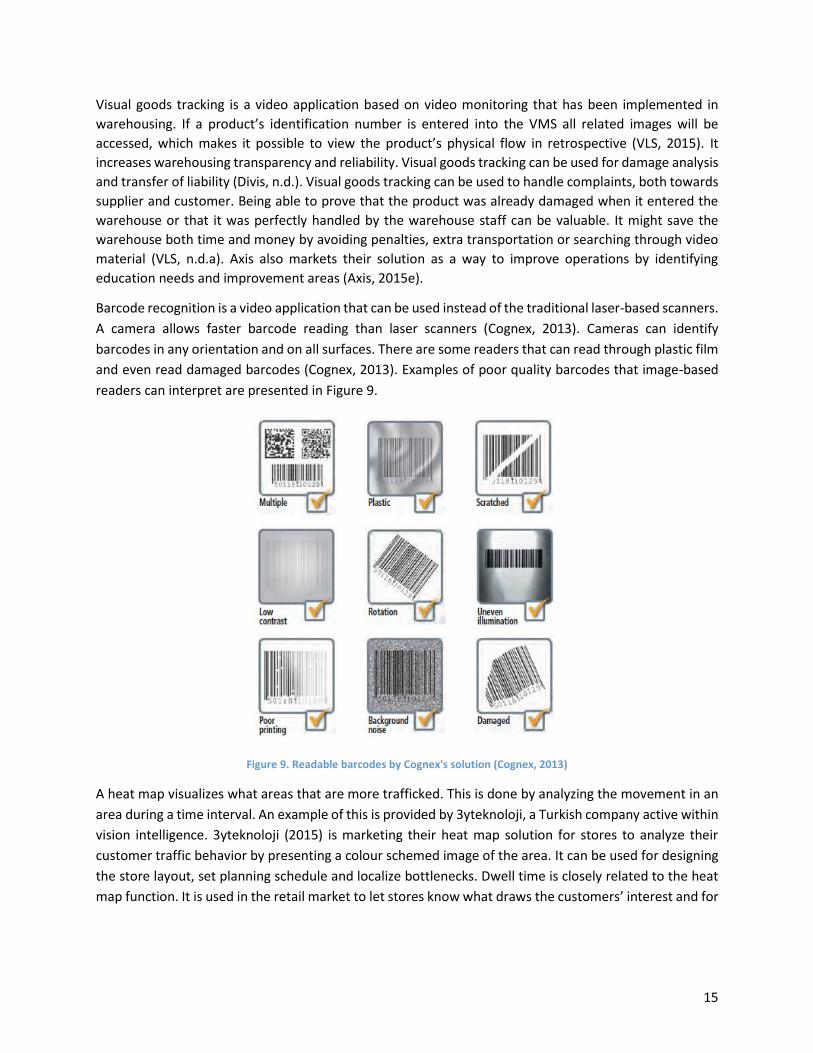
Barcode recognition is a video application that can be used instead of the traditional laser-based scanners.
A camera allows faster barcode reading than laser scanners (Cognex, 2013). Cameras can identify
barcodes in any orientation and on all surfaces. There are some readers that can read through plastic film
and even read damaged barcodes (Cognex, 2013). Examples of poor quality barcodes that image-based
readers can interpret are presented in Figure 9.
Figure 9. Readable barcodes by Cognex's solution (Cognex, 2013)
A heat map visualizes what areas that are more trafficked. This is done by analyzing the movement in an
area during a time interval. An example of this is provided by 3yteknoloji, a Turkish company active within
vision intelligence. 3yteknoloji (2015) is marketing their heat map solution for stores to analyze their
customer traffic behavior by presenting a colour schemed image of the area. It can be used for designing
the store layout, set planning schedule and localize bottlenecks. Dwell time is closely related to the heat
map function. It is used in the retail market to let stores know what draws the customers’ interest and for

16
how long they are standing at an area (Cisco, n.d.). It is currently
used as a way for stores to identify how attractive their displays are.
Counting is another video analytic that can count how many
customers there are in certain parts of a store (Axis, 2014b).
Statistics can be obtained and used to evaluate sales. It can further
be developed into queue management that has the functionality to
count the length of queues. It enables the system to send alerts
when queues are getting to long in the store (Axis, 2014b). The
tripwire analytic is used for alarming when a person is crossing a
virtual line drawn in the camera’s field of view. The analytic is
illustrated in Figure 10 where a person is about to cross such a line.
Face recognition is a video analytic used for identifying faces. The cameras can with this video analytic
identify blacklisted persons or grant passage for authorized persons (Herta, 2015). Another video analytic
is left object that alarms if an item is left during a longer time without its owner being present (Clearview,
2015). A closely linked video analytic is the removed object function that detects if an item is absent from
the image (Technoaware, n.d.). If an item has been present in the camera’s view and is later removed, the
system will identify that gap and send an alarm. Object identification can with the help of a camera identify
an object of a predefined shape. It can also be used for quality inspection to ensure that the product is of
the right quality (SICK, 2013). Measuring volume is currently possible with lasers. In this case, an object’s
dimensions are estimated by a beam of laser. Another way of estimating goods’ volume is by using video
technology. Ferreira et al. (2014) highlight the benefits with volume measurement using Microsoft Kinect,
a vision based technology, is highlighted. The authors explain that video technology has application areas
in the field of warehousing. Microsoft Kinect features an RGB and depth camera that facilitates a fast and
relatively high resolution solution for depth sensing.
There are other technologies than video that can be applied on
warehousing. SICK is one of the world leading companies on
sensor solutions for industrial applications (SICK, 2015). They
have developed a sensor-based system that detects overhanging
objects. The system can help protect people operating on the
floor, avoiding injuries related to falling objects (SICK, 2014). This
is illustrated in Figure 11. SICK has also implemented solutions
for identifying pick error and verifying pick quantity (SICK, 2014).
The right item selection can be verified by using light grids. If the
operator selects an item from the wrong storage area, a signal
will let the operator know. Photoelectric sensors identifies if the
operator has picked too many items from the pick bin (SICK,
2014).
Figure 10. Tripwire after entrance. (Axis, 2012)
Figure 11. Pallet overhangs. (SICK, 2014)

17
Barriers for implementation in warehousing
This research will identify and analyze barriers for implementing video technology in warehousing. A
barrier is an obstacle that negatively affects adaption of new technology in warehousing. There are many
types of barriers depending on research field. Research related to supply chain information integration
has resulted in a classification of barriers divided into three groups: behavioural and cultural barriers,
technical barriers and business and supply chain related barriers (Harland et al., 2007). The categorization
is exemplified in Table 8.
Table 8. Kinds of supply chain barriers, extraction from Harland et al., (2007)
Type of barrier Example
Behavioural and cultural Fear of losing personal touch, reluctant to use new system
Technical Security concerns, incompability
Business and supply chain related Long term relationships with some suppliers, low volume business
Previous empirical research has focused little on warehousing issues (Marchet et al., 2015). General
barriers to technology implementation in warehousing are therefore difficult to find. Although, barriers
for implementing information communication technologies (ICT) in logistics are common to all types of
companies (Krmac, 2012). They do however differ slightly in relation to business company size. Various
studies indicate that a lack of awareness of potential benefits with ICT is the greatest barrier to
implementation (Krmac, 2012; Harland et al., 2007). Research concerning integration of automation in
warehousing has found many barriers to implementation. The most common obstacles are estimated to
be high investment cost and risk of interrupting warehousing operations during implementation (Marchet
et al., 2015). Barriers connected to implementation of RFID are foremost tag price, lack of standardized
technology and the price/performance ratio (Ross et al., 2009). Barriers to implementation of ICT,
automation or RFID systems are listed in Table 9.

18
Table 9. Examples of barriers for implementation of technology in warehousing
Barrier ICT Automation RFID Reference
Resistence to change x Krmac, 2012
Integration problems x Krmac, 2012
Investment cost x x x Marchet et al., 2015; Baker and Halim, 2007; Ross et al., 2009; Krmac, 2012
Price/performance ratio uncertainty
x x x Marchet et al., 2015; Ross et al., 2009; Harland et al., 2007; Krmac, 2012
System reliability x x Marchet et al., 2015; Baker and Halim, 2007; Krmac, 2012
Interrupting warehousing operations
x Marchet et al., 2015
Loss of flexibility x Marchet et al., 2015; Baker and Halim, 2007
Change in culture x Baker and Halim, 2007
Lack of standardization x Ross et al., 2009
Even though the barriers are extensive, companies have found ways around them to overcome their
reluctance to implement technology (Marchet et al., 2015). Although, examples of how to avoid barriers
in warehousing are scarce in literature. Two ways could be to share information and plan the technology
start-up phase (Marchet et al., 2015).

19
3 Development of Process Framework Previous chapters have presented warehousing and its operations together with how different
technologies can support them. The literature also covered barriers that prevent implementation of
technology in warehousing. All components are put into a process framework visualizing the relationship
between them. An explanation to the framework will be given as well as the connections between the
ingoing building blocks. The framework will be used when performing the empirical part.
Purpose with a process framework
The purpose with the framework is to provide a way to analyze the current state of a warehouse. The
analysis is made with regard to warehousing type, operations, barriers and technology used for improving
warehousing efficiency. The first part of the framework illustrates how the elements relate to each other.
The second part of the framework illustrates in what way WMS and RFID enhance warehousing
operations. The research will investigate the need for video in warehousing. Once the analysis of the
empirical study has been made, video is added to the framework, explaining how video can enhance
warehousing efficiency. The process framework will also contribute with a method for conducting the
empirical study. In Figure 12 and Table 10, the process framework’s both parts are outlined.
20
RFID
Figu
re 1
2. F
irst
par
t o
f th
e P
roce
ss f
ram
ew
ork
(D
anie
lsso
n a
nd
Sm
ajli,
20
15
)
21
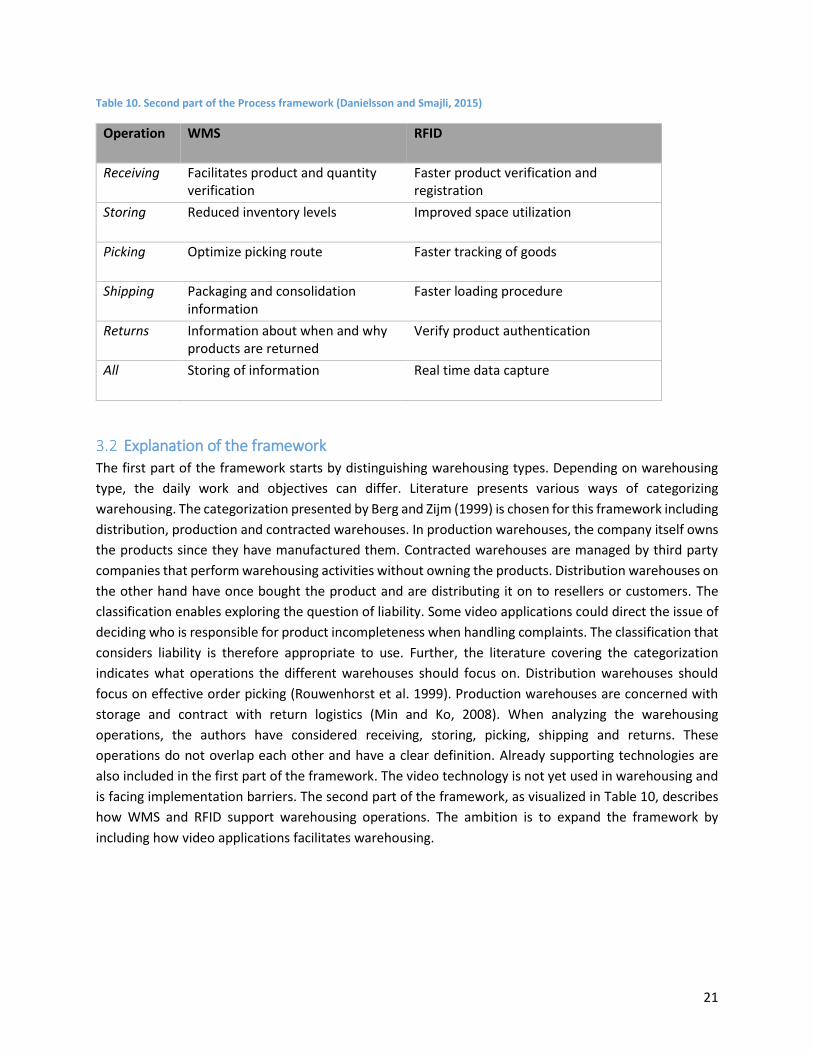
Table 10. Second part of the Process framework (Danielsson and Smajli, 2015)
Operation WMS RFID
Receiving Facilitates product and quantity verification
Faster product verification and registration
Storing Reduced inventory levels Improved space utilization
Picking Optimize picking route Faster tracking of goods
Shipping Packaging and consolidation information
Faster loading procedure
Returns Information about when and why products are returned
Verify product authentication
All Storing of information Real time data capture
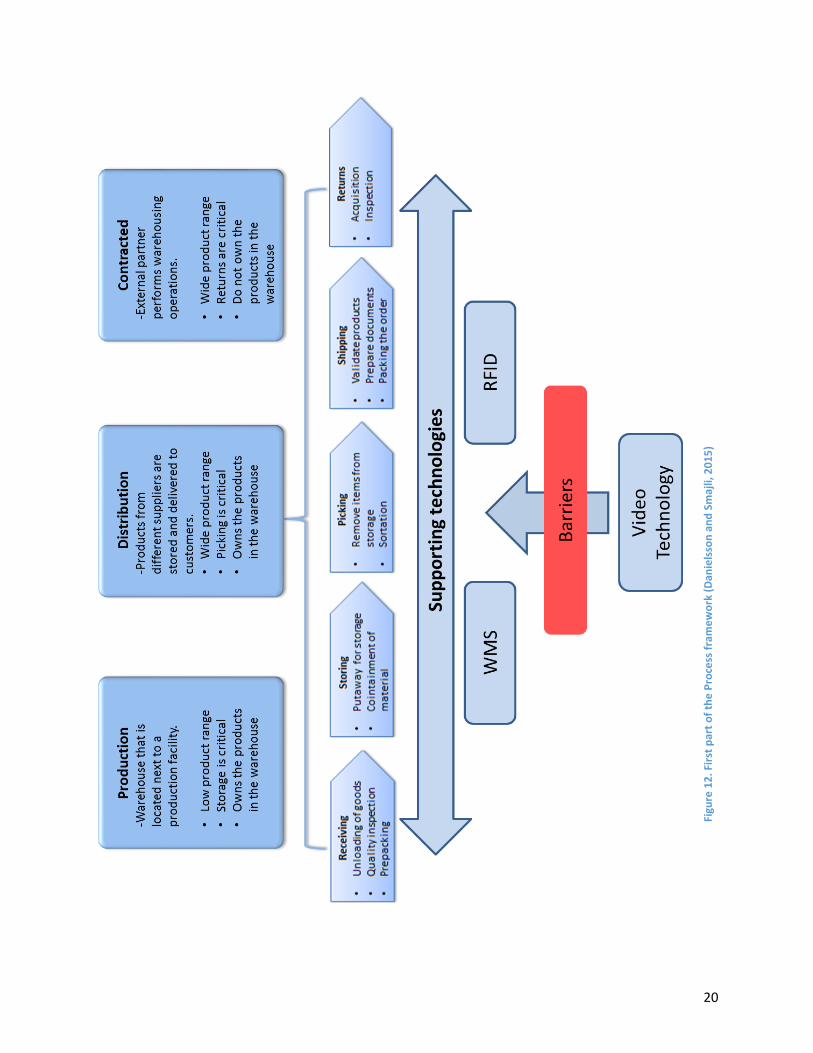
Explanation of the framework The first part of the framework starts by distinguishing warehousing types. Depending on warehousing
type, the daily work and objectives can differ. Literature presents various ways of categorizing
warehousing. The categorization presented by Berg and Zijm (1999) is chosen for this framework including
distribution, production and contracted warehouses. In production warehouses, the company itself owns
the products since they have manufactured them. Contracted warehouses are managed by third party
companies that perform warehousing activities without owning the products. Distribution warehouses on
the other hand have once bought the product and are distributing it on to resellers or customers. The
classification enables exploring the question of liability. Some video applications could direct the issue of
deciding who is responsible for product incompleteness when handling complaints. The classification that
considers liability is therefore appropriate to use. Further, the literature covering the categorization
indicates what operations the different warehouses should focus on. Distribution warehouses should
focus on effective order picking (Rouwenhorst et al. 1999). Production warehouses are concerned with
storage and contract with return logistics (Min and Ko, 2008). When analyzing the warehousing
operations, the authors have considered receiving, storing, picking, shipping and returns. These
operations do not overlap each other and have a clear definition. Already supporting technologies are
also included in the first part of the framework. The video technology is not yet used in warehousing and
is facing implementation barriers. The second part of the framework, as visualized in Table 10, describes
how WMS and RFID support warehousing operations. The ambition is to expand the framework by
including how video applications facilitates warehousing.

22
4 Methodology The chapter aims at describing the methodological choices made in the research. Having a well defined
research methodology provides a systematic way of solving the research problem. It is important for the
researchers to understand the underlying assumptions for different research methods in order to make
an adequate decision (Kothari, 2011). Choices made regarding research strategy and design are therefore
presented. In connection to the research design a presentation of the case companies is given. A
motivation of qualifying criteria, process framework and research trustworthiness is presented followed
by an explanation of how the study is performed.
Research Strategy
The study’s research questions ask how different types of warehouses can benefit from video technology
and how barriers prevent implementation of video technology in warehousing. The research questions
can indicate what research strategy to use. If the questions express a need to identify “how” and “why” a
phenomenon occurs, the examiners should lean towards using case studies (Yin, 2014). If the study
requires an extensive and in-depth investigation of the phenomenon, a case study is suitable (Yin, 2014).
Since the report’s research questions are of the “how” character, it is appropriate to perform a case study.
The research is about investigating a new technology where very little research has been conducted.
Meredith (1998) concludes that if the aim is to develop or extend theory one must ask the question “why”
and understand the problem. Therefore, many researchers tend to believe that rationalist methods like
optimization or statistical modeling are more meaningful for testing and verifying existing theory. Case
studies on the other hand are more appropriate when it comes to generating or extending theory
(Meredith 1998). Since the ambition is to generate theory, case studies is the chosen research strategy.
Case studies is one the most powerful research methods in operation management, particularly when
developing new theory (Voss et al., 2002). Situations when case study is recommended as research
strategy are outlined in Table 11. The table provides strong support for the chosen research strategy since
the study explores a new technology and build theory in this area.

23
Table 11. Matching research purpose with methodology, Voss et al. (2002)
According to Table 11, it is suitable to perform in-depth or multi-site case studies when exploring or
building theory. Case studies were performed with several companies, known as multiple case study. The
objective was to better understand the phenomenon and to extend generalizability (Meredith, 1998).
Purpose Research question Research structure
Exploration
Uncover areas for research and
theory development
Is there something interesting
enough to justify research?
In-depth case studies
Unfocused, longitudinal field
study
Theory building
Identify/describe key variables
Identify linkages between
variables
Identify “why” these
relationships exist
What are the key variables?
What are the patterns or
linkages between variables?
Why should these relationships
exist?
Few focused case studies
In-depth field studies
Multi-site case studies
Best-in-class case studies
Theory testing
Test the theories developed in
the previous stages
Predict future outcomes
Are the theories we have
generated able to survive the
test of empirical?
Did we get the behavior that
was predicted by the theory or
did we observe another
unanticipated behavior?
Experiment
Quasi-experiment
Multiple case studies
Large-scale sample of
population
Theory extension/refinement
To better structure the theories
in light of the observed results
How generalizable is the
theory?
Where does the theory apply?
Experiment
Quasi-experiment
Case studies
Large-scale sample of
population

24
Research Design
Theoretical sampling
Sampling from a chosen population is unusual when building theory. Cases can instead be chosen for
theoretical reasons, known as theoretical sampling (Eisenhardt, 1989). Cases should not be chosen
randomly but rather in such a way so they can extend existing theory or chosen to fill theoretical
categories. For this research, the theoretical sampling has been made with the intent to fill theoretical
categories. The sampling filled different warehouse types, more precisely distribution, contract and
production warehouses. When sampling the case companies, one must decide how many varying aspect
to consider. It depends on how many independent variables to include (Meredith, 1998). An independent
variable is a factor that can be altered and will affect the dependent variables. Examples of independent
variables are order quantity or frequency and an example of a dependent variable is cost. For increasing
generalizability it is a good idea to include as many independent variables as possible (Meredith, 1998).
Other situations that concern these factors will also be covered in the theory. Implementing Meredith’s
(1998) theory on this research implies that different warehousing characteristics should be studied within
every type of warehouse. For this reason a variety of companies were included in the study. Companies
with diverse turnover, automation degree and size of warehouse contributed to a research with many
independent variables. Including several independent variables ensured a wide research scope. To deduce
relationships between warehouse type and video technology, it was important to perform as many case
studies as possible. However, case studies are very time consuming and it is difficult to get access to the
companies (Meredith, 1998), therefore restrictions were made. Nine case studies, three within each
warehouse type were involved since that was suitable for the scope and the time frame for this thesis. It
was important to fill the categories with cases until being sure that the category was saturated (Glaser
and Strauss, 2009). No new ideas were generated in the last third of the visits, indicating that the research
was saturated. Including more companies would not generate new information.
Qualifying criteria
Performing nine case studies required a high quality of the interviews. The quality was ensured by setting
criteria the companies must attain to enroll in the study. The first one, a technical criteria, was to ensure
that the warehouse performed many transactions, indicating the need for supporting systems. The
authors wanted to involve warehouses that were using a WMS or a module in the ERP system to manage
warehousing operations. If a WMS is not used, it might be because the number of transactions is small.
Companies lacking a WMS have harder to compete with other companies (Faber et al., 2002). Setting the
use of a WMS as a qualifying criterion guarantees a certain degree of warehousing complexity. The
importance of having a WMS was highlighted even more during a visit at a smaller warehouse. The visit
was performed in the beginning of the research as a pilot study. Some warehousing operations were not
running smoothly and there were areas that needed improvement. However, no recommendations of
video technology applications could be made since the basic information systems were not in place. The
warehouse’s problems could perhaps have been solved with a WMS. Warehouses that do not have a WMS
are probably not early adaptors of new technology and are not the target warehouses for this study. The
second criterion is an economic one, concerning the market value of outgoing goods from the visited

25
warehouse during a year. The criterion is to confirm that a certain extent of warehousing is performed at
the local site. The authors claim that there are two variables that have an impact on the value of outgoing
goods during a year; product value and accumulated volume shipped during a year. A matrix with these
two variables has been constructed in Figure 13 to illustrate what warehouses are suitable for this
research. Companies with either a high accumulated volume shipped per year, high product value or both
are of interest.
Figure 13. Warehouse relevance (Danielsson and Smajli, 2015)
The chosen research criteria for the case companies are:
1. Use of WMS or a special module in a ERP system
2. The market value of goods shipped from the local site should exceed 1 billion SEK yearly
Managers for larger warehouses will hopefully be knowledgeable about warehousing and be innovative
about how video can improve their warehouse. These managers might also be keener on investing than
small-scale warehouse managers. The authors have determined that the value of outgoing goods from
the warehouse during a year have to exceed 1 billion SEK. The criterion was set with respect to the pilot
study, where the visited warehouse only shipped products worth 300 million SEK. The low value of
outgoing goods in combination with the low extent of performed activities made it more difficult to find
applications areas for the video technology. The European Commission has divided companies into
different categories depending on enterprise extent. The categorization is done with regard to the number
of employees and annual turnover. An outline for the classification can be seen in Table 12. Companies
not included in this classification have more than 250 employees and a turnover exceeding 50 million
euros. These are considered to be large companies (European Small Business Alliance, 2011). Only large
companies have enrolled in the study.

26
Table 12. Categorization of enterprises according to the European Commission (2003)
Pilot Study
An activity profile with specific warehouse information and an interview guide were developed early in
the research process. Before conducting the multiple case study the concept was tested on a pilot
company. A visit to the collaborating partner’s own local warehouse was arranged. The warehouse
performed activities like assembling, quality testing and labeling. The warehouse was one of many
distribution warehouses belonging to the collaborating partner. The qualifying criteria considering the use
of a WMS and value of shipped goods were put to test. The visited warehouse did not use a WMS and
shipped goods worth 300 million SEK yearly. If the authors would come to the conclusion that this
warehouse would benefit from video technology the hypotheses should be rejected. A closer presentation
of the company can be seen in Table 13. Another reason for conducting the pilot study was to validate the
interview guide.
Enterprise category Headcount: Annual
work unit
Annual Workload Annual balance sheet total
Medium sized < 250 <€50 million <€43 million
Small < 50 <€10 million <€10 million
Micro < 10 <€2 million <€2 million
OR

27
Conclusions were made that the authors’ hypotheses were well motivated. The warehouse only shipped
goods worth 300 million SEK annually, which was too little to attain the benefits from many video
applications. The flow of goods was not extensive, generating in a lower improvement potential. The lack
of WMS caused difficulties in material handling that could be solved with the introduction of a WMS. For
these reasons, the criteria were maintained. An insight to what contact person to interview at the
warehouses was also achieved. It was concluded that the contact person should be a warehouse manager
or likewise. The pilot study also generated some video application ideas, which were added to the
interview guide. The guide was altered with respect to the performed meeting for facilitating
communication and clarification. The modifications done were not extensive since the concept worked
Table 13. Activity profile for Pilot Company
Metric Pilot Company
Company information
Industry Electronics
Global turn over 5.45 billion SEK
Number of employees global 1 900
Globalization Offices in 40 countries
Warehouse information
Kind of WH Distribution
Area of warehouse 6 500 m2
Seasonalities None
Value adding activities performed in warehouse Labelling, quality testing
Number of employees in warehouse 80
Operators per shift 30
Number of shifts per day 1
Vehicle equipment, type and amount 6 forklifts
Automated operations None
Information system (WMS) Paper + a module in IFS
Number of scanning points 7
Using RFID in warehouse No
Ingoing goods
SKU Definition at receiving Pallets
Storing
Type of storing system Single deep racks
Number of storage locations 3 500
Dedicated or shared storage Shared
Number of SKUs 3 800
Introduction of new SKUs 320 new SKUs in 2014
Outgoing goods
Value of units shipped per year 300 million SEK
Number of order-lines per day 120 - 150
SKU Definition at shipping Pallets

28
well during the pilot study. The setup could be used for the multiple case study. No further research or
pilot studies needed to be performed.
Case companies
Key information about the nine case companies is presented in Table 14. A presentation of company and
warehousing operations is given for each of them. Contracted warehouses are named C1, C2, C3;
distribution warehouses are named D1, D2, D3 and production warehouses are named P1, P2 and P3. For
more information about the case companies, see their respective activity profiles in appendix 8.4.

29
Tab
le 1
4. I
nfo
rmat
ion
ab
ou
t th
e n
ine
cas
e c
om
pan
ies
Me
tric
C1
C2
C3
D1
D2
D3
P1
P2
P3
Glo
bal
tu
rn o
ver
(bil
lio
ns
SEK
)18
239
6299
102
1.9
530
492
Are
a o
f
war
eh
ou
se
(sq
uar
e m
ete
rs)
22 5
0010
7 00
011
0 80
062
500
10 0
0012
000
14 0
006
860
15 0
00
Nu
mb
er
of
em
plo
yee
s in
war
eh
ou
se
7019
010
080
010
074
1321
160
Au
tom
ate
d
op
era
tio
ns
Lim
ite
dSo
rtin
g
con
veyo
r b
elt
sLi
mit
ed
Re
ceiv
ing
to p
icki
ng
Sto
rin
g +
som
e
pic
kin
g
Co
nve
yor
be
lt
fro
m p
acki
ng
to s
hip
pin
g
Re
ceiv
ing
to s
hip
pin
gR
ece
ivin
g to
pic
kin
gR
etu
rns
Nu
mb
er
of
sto
rage
loca
tio
ns
(pal
let
po
siti
on
s)
25 0
0011
0 00
091
000
250
000
pal
let
po
siti
on
s
350
000
bo
x
po
siti
on
s
3 00
0 p
alle
t +
8 00
0 b
ox
po
siti
on
s
24 0
0022
140
25 0
00
Nu
mb
er
of
SKU
s35
000
300
000
10 0
005
000
-
7 00
080
000
31 0
0040
030
0 -
350
16 0
00
Nu
mb
er
of
ord
er-
lin
es
pe
r
day
6 00
0 -
7 00
022
000
18 0
0025
0 00
07
000
-
8 00
06
000
40 -
800
416
4 50
0
Be
vera
geFa
st m
ovi
ng
con
sum
er
goo
ds,
sn
acki
ng
Au
tom
oti
veEl
ect
ron
ics,
e-
com
me
rce
Ind
ust
ry
Ele
ctro
nic
sFo
otw
ear
, fo
od
,
bo
dy
loti
on
etc
.
Tran
spo
rtat
ion
+
sto
rin
g B
2B g
oo
ds
Foo
dM
ech
anic
al
spar
e p
arts

30
Company C1
C1 distributes electronics on behalf of their customers. C1 receives goods in pallets and cartons. If a good
is damaged at arrival, a picture is taken to document the fault. The photo is added to a database for
handling complaints. All types of complaints, covering damaged incoming goods and returns, are handled
by an external part to avoid the risk of disagreements. The non-damaged SKUs are stored depending on
type of customer with respect to an ABC-classification. The ABC-classification ensures that popular SKUs
are placed at more convenient places to facilitate picking. Picking is performed using forklifts or man
labour, depending on SKU. All picked items are checked at a fix pick and pack station prior shipping. The
most challenging operation at C1 is picking, connected to their problems with pick errors. They tried to
solve this issue by scanning all objects before closing an order. Picking is also time consuming since there
is a wide range of small orders, leading to a high magnitude of picks. Altogether, picking demanded many
more operators than other operations. Company C1 has two ways of measuring their performance. The
first is delivery reliability, e.g. sending the right product at the right time. C1 has a second metric that is
productivity, which they measure differently depending on how they are paid by their customers.
Examples of productivity measures are orderliness per day and picks per day. C1 experiences difficulties
with measuring productivity. Measuring picking time would have been preferred since this is a cost driver.
Company C2
Company C2 provides logistics solutions to their customers and handlles a wide range of products. C2 has
two hubs located on the same site, where the e-commerce hub was visited. The warehouse has a
dedicated flow for each of C2’s customers. Goods enter the warehouse through different gates depending
on customer. After the goods have been scanned and registered in the WMS, the pallets and containers
are split in smaller handling units. The products are then transported by forklifts to be stored at their rack
position. Forklifts drivers scan the products in every transaction, e.g. receiving, put away, picking, quality
inspection etc., to avoid errors. The handling of e-commerce products results in a high return flow. It was
highlighted that the amount of returns could be as high as one third of all products for some customers.
Incoming returns are therefore handled at a separate part of the warehouse where the products are
inspected and stored again. The most challenging operation is considered to be handling of returned
goods, due to the large volume of returns. The most time consuming operation is picking since products
are handled in smaller quantities compared to incoming goods. C2 measures the return operation in two
ways. One metric considers the amount of returns that are coming in daily and the second metric
measures returns handled per day. The company aims for reducing the handling time per return.
Considering the picking operation, C2 measures amount of pick lines performed per hour and the number
of pick errors made.
Company C3
Company C3 offers logistics services where the visited warehouse has a cross-docking and a warehousing
service hub. The service hub is known as Solutions. In the cross-docking hub, products are received and
shipped the same day. For the Solutions hub, products are stored and includes more operations. At the
cross-docking hub, the only performed operations are receiving and shipping goods. Products are received
31
at one end of the warehouse and shipped at the other end, using a flow oriented layout. Products are not
stored at the hub for more than a couple of hours before they are loaded again. At the Solutions hub, the
warehousing operations are more extensive. Products are received in all kinds of shapes and handling
units and transported for storage in single deep racks. Products are stored with respect to customer and
picking is performed manually before shipping the products. The Solutions hub also handled the return
flow. The most time consuming operation performed at C3 is picking. C3 measures pick errors per order-
line and number of picks per hour to evaluate this operation. The most challenging operations are shipping
products and handling returns. Shipping the goods is demanding when trucks differ from the time
schedule. Since C3 operates in an environment with small time margins it is important that ingoing and
outgoing of goods keep a smooth pace. Goods are put in front of a bay in the order it should be sent. If
that order is altered, it means extra work for the operators. To evaluate the shipping operation, C3
measured the number of deliveries sent per day. Returns are challenging since it is an operation that
deviates from the usual flow of goods. Returns need to be handled separately, which makes it more
complex. C3 measured the number of returns handled per day.
Company D1
Company D1 operates within the food industry and is one of the leading retail companies in the Nordic
region. The warehouse design is divided into four parts considering the product characteristics; freezer,
cold/fresh, fruit & vegetables and dry. Products arrive as pallets and are weighted and controlled at the
receiving station. Pallets are broken into different handling units like cartons and packages when they are
put away for automated storage. The automated parts of the warehouse enable storing on high levels and
narrow surfaces but are resulting in difficulties to control stock balance. Depending on type of product,
forklifts, conveyor belts or AS/RS transport the products to their storing position. Picking is performed in
the same manner before shipping the products. The company handles returns but this is not an extensive
operation due to the characteristics’ of fresh products. Picking is the most time consuming operation since
there is a wide range of SKUs. D1 find the picking operation time consuming but not as challenging as
receiving where they experience quality issues with incoming pallets. Quality issues with pallets causes
problems for the automated part of the flow. As an example, the whole pallet can be wrapped in plastics,
resulting in stop for automation. D1 mainly measures picks per hour to get an overview of the employee’s
productivity. D1 has the possibility to measure their operations at many ways due to the high degree of
automation.
Company D2
The warehouse stores mechanical spare parts that are bought from distributors around the world.
Handling spare parts requires a fast and precise respond to customers. The goods arrive in different
handling units and are checked before scanning them into the system. Once scanned, the products are
placed in miniload carriers or pallets together with other SKUs and are transported on conveyor belts to
storage. The warehouse has got a high degree of automation with both conveyor belts and AS/RS.
Conveyor belts also transport products to fixed pick stations where operators pick items and pack them.
D2 handles returns that have occurred because of pick errors. Due to the small amount of pick errors, the
return operation is not extensive. The increased number of SKUs the warehouse must handle makes
32
storing the most pressuring operation. D2 experiences a lack of storage capacity, resulting in failures from
the put away algorithm. Another challenging operation is receiving. D2 wants to increase the flow of
incoming goods by handling the products faster and register them earlier in the system. The most time
consuming operation is picking due to the large amount of picks. D2 measures the number of errors a
customer experiences. The metric is divided into quantity errors, wrong part, missing part in warehouse
etc. Many of D2’s operations are about minimizing errors. As an example, D2 uses double checks for
special urgent parts or sample checks to make sure no picking errors have occurred. D2 uses many metrics
to evaluate their operations but does not know how their conveyor belts are performing. There is a need
of a metric that describes the state of the conveyor belts to understand their availability and to identify
bottlenecks.
Company D3
D3 is one of Europe’s largest distributor of electronics within different sub-categories. D3 is already using
cameras to improve their operations. More than 100 cameras have been set up to monitor different areas
of the warehouse. The received products are directly labeled and scanned before handled further.
Depending on size of the good and picking frequency the products are stored at different places in the
warehouse. When the products are picked, operators use carriages to pick batches of orders and bring
them to fixed pack stations. D3 also manages returned products that are handled at a separate area. The
returns occur due to quality or quantity errors or that the customers have changed their mind. In case of
customer complaints, D3 goes through all recorded material about the good to identify if the error actually
have occurred. The most challenging and time consuming operation at D3 is handling returns. It is the
most complex operation since goods must be handled in other ways compared to the receiving operation.
Further, D3 has to adapt the handle of returns depending on vendor. Some vendors want the product
shipped to a repair center, other want it disposed of. It results in a non-standardized way of handling
returns. Another time consuming operation is picking due to the handling of small packages that are
managed manually. D3 evaluate their return operation by measuring the number of returns per day and
number of customer complaints filed per day. In relation to picking, they use metrics like picks per hour,
picking lines per day and number of picking errors to name a few.
Company P1
The producing company P1 is a global provider of alcoholic beverages where all products flow through
one production warehouse. Production and warehouse are synchronized in such a way that if one of them
experiences issues, the other one will directly be affected. Company P1 has automated almost every
operation in production as well as warehousing. Conveyor belts transport products into the warehouse
and products are weighted before transported to storage. The products are also transported on a
conveyor belt when they are picked for shipping. The only manual work is loading the pallets onto the
trucks. Company P1 has scanners installed on the forklifts so they automatically can read goods’ barcodes.
They have also barcodes in the roof in front of the truck entrance and scanners mounted on the forklifts’
roofs. It enables the system to alarm if a good is loaded on to the wrong truck. P1 does also manage
returned products, though this rarely occurs. The most challenging and time consuming operation is
shipping. It is because that the operation is the only one performed manually and that the containers

33
must be cleaned before the goods are loaded. The most used KPI for P1 is associated with shipping, which
is delivery reliability. P1 measures to what extent their customers receive the product on time. P1 is
lacking a way to measure how effective the different operations in the warehouse are, especially the
conveyor belts.
Company P2
Company P2 manufactures snacks of different kinds where the warehouse is synchronized with the nearby
production unit. When a problem occurs with the production or warehouse, this has a direct effect on the
other side. Pallets are received from the production facility by conveyor belts that connect production
with the warehouse. The warehouse can also receive finished goods from external trucks. These pallets
are manually inspected before placing them on the conveyer belt. Sensors are used to determine pallet
dimensions in order to reject those pallets that cannot be handled by the automated equipment. As an
example, the palletized good can be standing unstably, causing a collapse when storing the pallets in the
high bay storage. Storage is divided in two zones with various temperatures where items with different
temperature demands are stored. When pallets are demanded from storage the cranes pick and set them
on the conveyor belt that transport them to the shipping area. A small amount of manual picking is
performed for less than full pallet orders. These pallets are stored on racks located close to the shipping
area to reduce transportation. P2 did not handle returns since there were seldom disputes over customer
complaints that P2 could not easily resolve. The most challenging operation is handling outgoing goods
due to the limited space and few bays at the shipping deck. The most time consuming operation is
receiving since the quality of external pallets are poor and handled manually. Picking is also time
consuming even though the total amount of picks is not extensive. P2 measures pick errors and the
amount of picks achieved per day and hour. Considering outgoing goods, P2 measures the amount of
orders that are managed per day. There is an interest to measure the time a truck has been standing at
the bay, known as truck turnover time.
Company P3
Company P3 is a producer of trucks and buses where the visited warehouse provides parts to the
manufacturing unit nearby. P3 has implemented RFID in production but not in their warehouse. They
consider it too costly since a warehouse requires more tags that cannot be reused in the same way as in
production. P3 are developing their scanning procedure since they want to register transactions in the
warehouse more extensively than today. Pallets are manually checked at receiving by operators so they
correspond to what is expected. Many labels with different barcodes are placed on the pallets and boxes.
P3 finds it too time consuming to scan every barcode. They have for this reason chosen to check the units
manually. After the goods have been received, the pallets are labelled and put away for storage. P3 places
the articles with respect to an ABC-analysis. If the goods are frequently handled they are placed at more
convenient locations. Picking could be performed using forklifts for larger units or manual picking for
smaller items. Goods are shipped from the same deck as where they were received. P3’s warehouse also
handles returns from production. Usually the return occurs due to the wrong item has been requested
from production. The most challenging operation is receiving the goods since operators manually have to
search through every unit to match this with their lists. Storing can occasionally cause problems when P3
34
experience high demands from production. The most time consuming operation is the picking operation
when single items are picked rather than full pallets. P3 measures how long time it takes from a good is
received until it is in storage. Considering storage, P3 evaluates their utilization degree. To evaluate their
performance on picking, P3 measures how many pick error that occurs per day. If an error occurs, they
want to know this directly so they can take immediate actions. P3 is lacking a way to measure if they
received the right goods at incoming.
Contact person at case companies
It was important to meet with a knowledgeable person that has an overview of the warehousing
operations to identify the need of improvement. Therefore, the case studies were performed in
collaboration with a warehouse manager or likewise. A protocol for when the interviews were conducted
and whom the authors met with is presented in Table 15. The contact persons’ titles varied but it was not
considered a problem since the objective was to meet with knowledgeable people in the warehouses.
Different titles could imply the same role for the companies. Talking with many people at the case
companies before the visit ensured that the authors met with the right person.

35
Time horizons
Before performing the multiple case study, the time horizon was set. A cross-sectional time horizon was
chosen since it captures a snapshot of the situation (Johnson, 2010). The opposite is longitudinal research
where data collection occurs in many pre-determined points in time. Cross-sectional studies are quicker
Warehouse type
Company Contact Person
Experience at case company
Experience in logistics
First interview session (3 hours)
Follow up interview (45 minutes)
Pilot Study Pilot Company
Assistant warehouse manager
12 years 12 years 3/2 2015
25/3 2015
Contract C1 Business developer contract logistics
4 years 4 years 12/2 2015
30/3 2015
C2 Supply chain Developer Head of logistics development
1/2 year 2 years
1/2 year 6 years
6/3 2015 1/4 2015
C3 Head of Projects and Change management
14 years 30 years 16/3 2015 16/4 2015
Distribution D1 Operations manager
7 years 7 years 24/2 2015
26/3 2015
D2 Store operations manager
7 years 24 years 3/3 2015 31/3 2015
D3 Director of Group Logistics
15 years 15 years 19/3 2015 1/4 2015
Production P1 Warehouse manager
10 years 28 years 25/2 2015 10/4 2015
P2 Warehouse and transport manager
8 years 8 years 13/3 2015 27/3 2015
P3 Logistics developer Project engineer
10 years 16 years
10 years 16 years
24/3 2015 2/4 2015
Table 15. Pilot and multiple case study protocol

36
to perform (Johnson, 2010) which is suitable for this thesis’ time frame. It is enough to analyze a snapshot
of the situation since the purpose is to investigate what the need for video technologies is now.
Research process
In the following sections, an outline of how the research was conducted is presented. The research
process is divided into a frame of reference and an empirical part. The process follows the steps illustrated
in Figure 14. For more information about when activities were performed, see appendix 8.3.
Figure 14. The research process (Danielsson and Smajli, 2015)
Step 1: Project scope
The first step was to determine the project scope of the research. The extent of the research and a project
plan were conducted together with the collaborating partner. The collaborating partner, Axis, provided
information about video technology and distributed contacts with technology experience. A basic
browsing in the warehousing and technology literature, using keywords like warehousing, performance,
processes and technology, a fundamental understanding of the area could be achieved. The
understanding helped when deciding research purpose and questions. The processes were planned not
to exceed the time constraint, which was set to 20 weeks.
Step 2: Research strategy and research design
To answer the research question a research strategy and design were formulated. This is outlined in
section 4.1 and 4.2.
Empirical part
Step 2: Research strategy and
design
Step 5: Pilot Study
Step 6: Multiple case studies
Step 7: Analysis of result
Step 8: Conclusion
Research references
Step 1: Project scope Step 3: Frame of referenceStep 4: Developing a process
framework

37
Step 3: Frame of reference
As a third step, a literature review was conducted. Reputable books as well as academic journals were
searched in order to find the most relevant information. Finding peer reviewed articles was made by
searching through known academic databases like Web of Science, Elseiver, JSTOR, EBSCOHost and IEEE
Xplore. Keywords used were: warehouse, warehousing, classification, performance indicators, barriers,
processes, operations and technology. Facts were checked against other sources and disregarded if not
found trustworthy. The literature review started with a wide scope before narrowing it done. First, broad
research questions like warehousing type were considered. After that, the investigation was narrowed
down to warehousing operations. Next, information about the research’s specific area of interest was
handled by examining current available technologies and barriers. Following this approach ensured that
the scholars fully understood the overall structure of one layer before investigating an underlying
phenomenon. Searching through reputable databases was the approach taken regarding the literature
review on warehouses, operations, KPIs, current technology and barriers. However, since network video
technology is a new area there is a gap in literature. Considering the time it takes to publish an article in
an academic journal, information needed to come from other places. To establish an understanding of
what video technology can do, corporate companies’ websites, brochures and advertisement videos were
sought. Knowledgably people at Axis were interviewed to better understand the technology.
Step 4: Creating a process framework
In the process framework, the literature review was summarized and the key topics that were most likely
to affect the need for video technology were identified. The objective was to identify the most important
factors in warehousing and compile them into a framework for how the rest of the study should be
performed. Using the framework should facilitate the sample selection and provide support for how to
conduct the interviews for the multiple case study. The interview guides followed the framework since it
was considered to be the best way to identify warehousing need for video technology. An illustration of
how the process framework was conducted can be seen in Figure 15.

38
Figure 15. Procedure for developing a process framework (Danielsson and Smajli, 2015)
Step 5: Pilot study
Information about the pilot study can be found in section 4.2.
Step 6: Multiple case studies
A multiple case study was performed to answer the research questions. The phenomenon can be studied
in its natural settings and conclusions can be deducted from data collection and observations (Meredith,
1998). The conclusions made could be biased from the researchers’ cultural and social taint since this
affects the understanding of the problem. An appropriate approach to handle this is to observe the
phenomenon directly to get to the first source of information rather than the second or third (Meredith,
1998). For this reason the first session of case studies were performed at the companies’ premises to
minimize the risk of misunderstanding. The follow up interviews were performed over telephone or in
person.
First case study session + verification
During the first interview sessions a tour was given at the case companies’ warehouses. The tour was
given by the warehouse manager or a person with corresponding knowledge. An activity profile was
conducted in relation to this tour. Following the tour, the manager was interviewed according to the
interview guide as seen in 8.5. The manager gave overall information about the warehouse’s operations
and performance indicators to get a better understanding of what aspects were valued. The information
gathered was transcribed, summarized and sent to the interviewed persons so they could verify that no
misinterpretations had occurred. The output from these sessions were activity profiles for every case
company, documentation of interest for old and new video applications and a deeper understanding for
the demand from warehouses.
Process framework
Technology
Barriers
Warehousing types and operations

39
Follow up interview with case companies
After the case studies had been performed, a list of all interesting video applications for the warehouses
was comprised. People with video knowledge at the collaborating company were questioned about the
applications feasibility. All applications were believed to be currently available or possible in the future. A
structured interview guide was set up and sent to the case companies, which can be seen in section 8.6.
The follow up interview was performed over telephone or in person. The companies were to grade their
interest for every video application and elaborate on how their interest can be increased. Barriers to video
implementation were also discussed where the companies chose a maximum of three barriers they find
most challenging. How the barriers can be resolved were further discussed. A 5-step Likert-scale where
every step was described was used by the companies for grading their interest in video applications. It is
common to use uneven-number scales since ambivalent respondents tend to react negatively when they
must chose a side for even-number scales (Weijters et al., 2010). Literature states that 5-point Likert scales
result in better data quality than 7-point scales. The scale should be fully labeled when interviewing a
general population who are not used to questionnaires where the objective is to measure opinions
(Weijters et al., 2010). A study performed by Matell and Jacoby (1971) concluded that either ease of rating
or reliability of measurement should be used as criteria when deciding how many steps to use. Having a
fully labeled 5-steps Likert scale ensures both criteria are met. If only five steps are possible it leaves little
room for interpreting grades in different ways, ensuring a more reliable result. It is also easier for the
participants to grade the applications if fewer alternatives are available. An extra respond alternative was
given for those who were unsure of their interest. A “Don’t know”-option was therefore available. Further,
the company could chose the ‘n’-alternative meaning that the solution was not applicable at their
warehouse. A pilot study was performed for this part of the research as well. The same pilot company was
interviewed and the structured interview guide was evaluated. The pilot showed that no major changes
were needed.
Step 7: Analysis of result
When both the interviews with the case companies had been performed the analysis could begin. All
gathered data were reviewed and analyzed. Identification of popular video applications was of great
importance as were the relationship between warehouse type and video technology interest. Popular
video technologies and the main barriers were identified and elaborated upon.
Step 8: Conclusion
As a final step of the study, the research questions were answered and concluding remarks were given.
The most promising video applications were presented as were ways of resolving barriers. How video can
contribute to making warehousing more efficient was described. At last, some suggestions for further
research connected to video technology in warehousing were given.
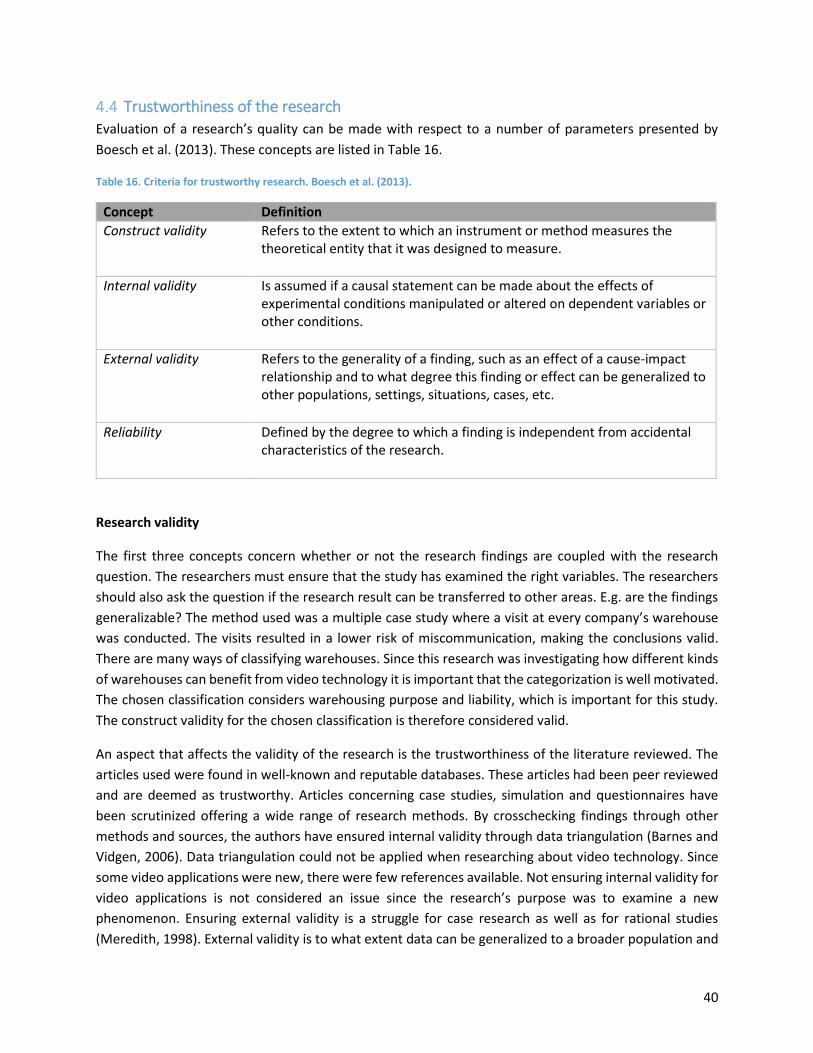
40
Trustworthiness of the research
Evaluation of a research’s quality can be made with respect to a number of parameters presented by
Boesch et al. (2013). These concepts are listed in Table 16.
Table 16. Criteria for trustworthy research. Boesch et al. (2013).
Concept Definition
Construct validity Refers to the extent to which an instrument or method measures the theoretical entity that it was designed to measure.
Internal validity Is assumed if a causal statement can be made about the effects of experimental conditions manipulated or altered on dependent variables or other conditions.
External validity Refers to the generality of a finding, such as an effect of a cause-impact relationship and to what degree this finding or effect can be generalized to other populations, settings, situations, cases, etc.
Reliability Defined by the degree to which a finding is independent from accidental characteristics of the research.
Research validity
The first three concepts concern whether or not the research findings are coupled with the research
question. The researchers must ensure that the study has examined the right variables. The researchers
should also ask the question if the research result can be transferred to other areas. E.g. are the findings
generalizable? The method used was a multiple case study where a visit at every company’s warehouse
was conducted. The visits resulted in a lower risk of miscommunication, making the conclusions valid.
There are many ways of classifying warehouses. Since this research was investigating how different kinds
of warehouses can benefit from video technology it is important that the categorization is well motivated.
The chosen classification considers warehousing purpose and liability, which is important for this study.
The construct validity for the chosen classification is therefore considered valid.
An aspect that affects the validity of the research is the trustworthiness of the literature reviewed. The
articles used were found in well-known and reputable databases. These articles had been peer reviewed
and are deemed as trustworthy. Articles concerning case studies, simulation and questionnaires have
been scrutinized offering a wide range of research methods. By crosschecking findings through other
methods and sources, the authors have ensured internal validity through data triangulation (Barnes and
Vidgen, 2006). Data triangulation could not be applied when researching about video technology. Since
some video applications were new, there were few references available. Not ensuring internal validity for
video applications is not considered an issue since the research’s purpose was to examine a new
phenomenon. Ensuring external validity is a struggle for case research as well as for rational studies
(Meredith, 1998). External validity is to what extent data can be generalized to a broader population and
41
different settings. It is important for rational studies that the chosen sample is representable for the entire
population. In case studies, on the other hand, there is no need for a representable sample since the cases
are not meant to represent a population (Meredith, 1998). Many independent variables are included in
this study since companies with varying degrees of automation, technology equipment and storing
systems are considered. The diversity implies that polar types within each category has been found, which
is beneficial when generalizing findings (Meredith, 1998). The performed research ought to be
generalizable due to the varying kinds of warehouses considered.
Research reliability
Research reliability concerns the question if the research result can be replicated. Every person has a true
value on every measure that would be obtained if no errors occurred. Due to imperfect measurement
instruments, the score we observe may differ from the true value (Fullerton, 1993). The less measurement
error the more we can depend on the research and that it can be replicated. The literature review was
conducted in a thorough and structured way. Presumably, others would come to the same insights of the
relationship between warehouse, technology and barriers. The second part of the research consists of a
multiple case study. A risk during the study is that the contact persons might have exaggerated the need
for video technology. When visiting the companies the authors were representing Lund University as well
as Axis. The connection with Axis might have made the warehouse managers keener to see the benefits
with video technology. They might have presented applications they were not really interested in just to
please the questioners. There is also a risk that the authors were eager to find video application areas and
therefore interpreted the subjects answer in a beneficial way. To avoid interpretations of answers and
ensure a reliable methodology the warehouse manager’s interview answers were transcribed and
summarized. This summary was then sent back to the managers who then had the possibility to correct
any misunderstandings. The follow up interview further ensured reliability since the case companies were
to quantify their interest.
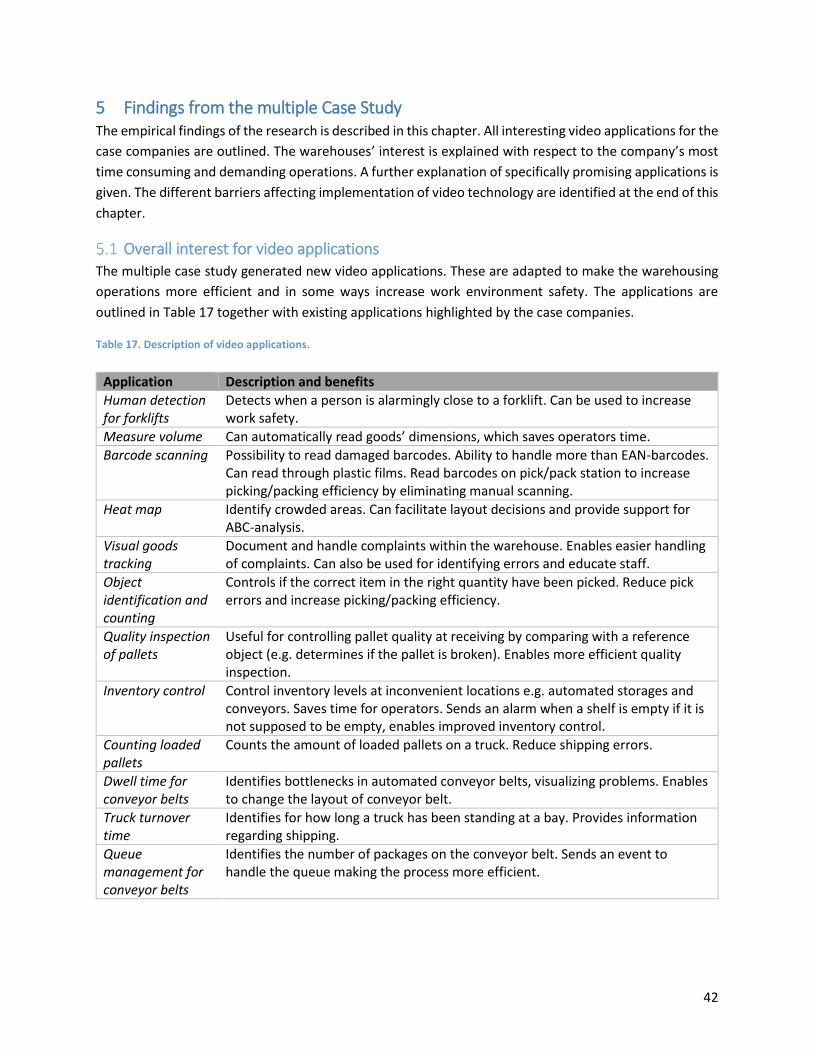
42
5 Findings from the multiple Case Study The empirical findings of the research is described in this chapter. All interesting video applications for the
case companies are outlined. The warehouses’ interest is explained with respect to the company’s most
time consuming and demanding operations. A further explanation of specifically promising applications is
given. The different barriers affecting implementation of video technology are identified at the end of this
chapter.
Overall interest for video applications
The multiple case study generated new video applications. These are adapted to make the warehousing
operations more efficient and in some ways increase work environment safety. The applications are
outlined in Table 17 together with existing applications highlighted by the case companies.
Table 17. Description of video applications.
Application Description and benefits
Human detection for forklifts
Detects when a person is alarmingly close to a forklift. Can be used to increase work safety.
Measure volume Can automatically read goods’ dimensions, which saves operators time.
Barcode scanning Possibility to read damaged barcodes. Ability to handle more than EAN-barcodes. Can read through plastic films. Read barcodes on pick/pack station to increase picking/packing efficiency by eliminating manual scanning.
Heat map Identify crowded areas. Can facilitate layout decisions and provide support for ABC-analysis.
Visual goods tracking
Document and handle complaints within the warehouse. Enables easier handling of complaints. Can also be used for identifying errors and educate staff.
Object identification and counting
Controls if the correct item in the right quantity have been picked. Reduce pick errors and increase picking/packing efficiency.
Quality inspection of pallets
Useful for controlling pallet quality at receiving by comparing with a reference object (e.g. determines if the pallet is broken). Enables more efficient quality inspection.
Inventory control Control inventory levels at inconvenient locations e.g. automated storages and conveyors. Saves time for operators. Sends an alarm when a shelf is empty if it is not supposed to be empty, enables improved inventory control.
Counting loaded pallets
Counts the amount of loaded pallets on a truck. Reduce shipping errors.
Dwell time for conveyor belts
Identifies bottlenecks in automated conveyor belts, visualizing problems. Enables to change the layout of conveyor belt.
Truck turnover time
Identifies for how long a truck has been standing at a bay. Provides information regarding shipping.
Queue management for conveyor belts
Identifies the number of packages on the conveyor belt. Sends an event to handle the queue making the process more efficient.

43
All case companies’ interest for the different applications were graded and are listed in Table 18 in descending order. The applications are presented with regard to what operations they facilitate in the warehouse flow. Some applications are applicable for more than one operation. The scale for grading the applications is: 1 = Not interested (we would not invest in this application)
2 = Low interest
3 = Moderate interest
4 = High interest
5 = Very interested (we would most likely invest in this application)
0 = Do not know; n= Not applicable
Table 18. Quantified interest for video applications for all case companies.
Application
Re
ceivin
g
Storin
g
Pickin
g
Ship
pin
g
Re
turn
s
C1
C2
C3
D1
D2
D3
P1
P2
P3
Average
Human detection for forklifts
X X X X X 5 3 3 3 5 3 5 4 3 3.8
Measure volume
X X 5 4 4 3 2 5 2 4 4 3.7
Barcode scanning
X X X X X 3 3 4 5 5 1 3 1 5 3.3
Heat map X X X 4 4 3 4 4 3 1 3 3 3.2
Visual goods tracking
X 3 3 3 3 3 5 4 3 2 3.2
Object identification and counting
X 3 3 2 3 4 3 n 3 4 3.1
Quality inspection of pallets
X 3 1 2 4 4 1 4 4 2 2.8
Inventory control
X 3 2 1 4 5 1 1 2 3 2.4
Counting loaded pallets
X 4 3 2 2 2 1 2 3 2 2.3
Dwell time for conveyor belts
X n 1 n 3 4 1 4 1 n 2.3
Truck turnover time
X X 2 1 2 2 1 1 1 4 4 2
Queue management for conveyor belts
X n 1 n 2 4 1 1 1 n 1.7
Contracted Distribution Production

44
Contracted warehouses’ interest for video technology
None of the contracted warehouses considers receiving nor storing as challenging. Consequently, they are
not interested in applications that can facilitate these operations. Picking is one of the most time
consuming and demanding operations for these warehouses. All contracted warehouses are interested in
the heat map analytic that can be used to facilitate this operation. They think it can be useful when
identifying the most trafficked picking aisles. At C1 and C2, an ABC-analysis is used for placing popular
SKUs at convenient locations. However, this is time consuming since it is frequently updated. The heat
map could tell if there is a need for updating the analysis. By studying the heat map, a decision regarding
if the allocation is correct can be made, resulting in time savings. Inconveniently placed SKUs that the heat
map show as popular could be moved to an A-location without having to perform a new ABC-analysis. The
heat map could also be used for larger improvements programs when changing design for a more efficient
flow as stated by C2. The object identification and counting application is another idea of improving
picking. C1 and C2 state that it can be used for reducing picking errors. If a camera were to be installed
above a pick-and-pack station, the operator would not have to count the objects to get the order
approved. Instead, the camera could count the objects itself and approve the order. C3 is not as interested
in this application since they do not have a fix pick station and do not pick small enough items.
All contracted warehouses experience shipping as one of the most challenging operations. C3 is for this
reason interested in using the heat map on the shipping area to improve the layout. A time consuming
activity connected with shipping is to measure goods’ volume, which is done manually at these
warehouses. In C1’s case, this is done when a new SKU is introduced, for C2 it is done on a daily basis and
C3 measures volume when they expect deviations. By using a camera, the measurement process could be
automated, resulting in time savings and data that are more precise. Another shipping application of
interest for C1 is the possibility to count loaded pallets on a truck. It happens that truck drivers take too
many or few pallets which causes a time consuming activity when searching for errors. A camera could be
installed above the bay and show the number of loaded pallets to avoid error in shipping. Both C2 and C3
think that handling returns is one of their most challenging operations. C1 did not find it as challenging
but still time consuming. Although, they are all interested in improving this operation and showed an
interest for the visual goods tracking solution. Every time a package is scanned, a time stamp is created in
the WMS. Entering the package’s ID will generate all video sequences related to that package. C1 shows
an interest for documenting arrival of damaged goods in this way, instead of manually photographing
them, which was currently the case. C2 and C3 are interested in documenting the good’s flow through the
warehouse to educate staff in managing operations in a better way. C3 is currently applying this idea since
they use their cameras to track goods’ flow. Although, there is no connection with their cameras and
WMS, something they are interested in improving. All warehouses think that the visual goods tracking
solution can be used for handling complaints in a more efficient way. The video sequence could be used
as evidence to their customer where the film provides great proof. However, at C1, the content of every
pallet/carton could not be identified, which makes the application more complex to apply.
An application not connected to a specific operation that was of interest for all contracted warehouses is
barcode recognition. C1 used many handheld scanners even at their fixed packaging stations. If a camera
could be stationary, it would enhance operators’ productivity by having the possibility to work with both

45
hands. C2 finds it interesting in having cameras that can read damaged barcodes. C2 would then not have
to replace damaged barcodes. Barcodes do not have to be impact when they leave C2, which makes this
aspect of the application useful. C3 finds it valuable to be able to read multiple barcodes simultaneously
on an item, resulting in time saving. Another general application of interest for all contracted warehouses
is the idea about human detection for forklifts. A camera mounted on a forklift could identify if a person
is alarmingly close. C1 has expressed the greatest interest for this application. They argue that the
application could be even more interesting if the camera could prevent the forklifts to hit poles and other
forklifts. The warehouses do not have many accidents per year but are all concerned with improving
safety.
Distribution warehouses’ interest for video technology
D1 and D2 experience receiving of goods as a complex operation. This is due to the extent of deliveries
and the high degree of automation. Both these warehouses use conveyor belts, which make the quality
inspection of incoming pallets important. Quality issues with incoming pallets have a high impact on the
flow of goods. If the pallet’s quality is low, the automated equipment cannot handle the pallet and there
is a risk of collapse in storage. D1 and D2 are for this reason very interested in the video application that
can inspect the quality of pallets. A camera could compare the pallet with a reference object and clarify if
the pallet is approved or should be rejected and manually handled. This application could contribute with
time savings at receiving. D1 has installed lasers to do the quality inspection. Cameras could presumably
do the check more precise, stated D1. They had thought of using cameras to do the inspection but had
not found a solution that worked properly. D2 is also interested to use the heat map application on the
receiving area to identify crowded areas. Using a heat map could help D2 change the physical layout of
the warehouse to avoid congestions and save time at receiving. D3 does not have difficulties with the
receiving operation since they performed this operation manually. They are therefore not interested in
applications facilitating this operation.
The most complex operation for D2 is storing since they suffer from lack of storage capacity. D2 is
interested in applications that can facilitate this operation. D1 do not consider storing a major problem
even though the automated storing system and conveyor belts can cause issues. The inventory control
application could be useful for controlling inventories in the automated storage. A camera could be
mounted on the cranes and count number of objects stored at a specific location. Currently, if there are
suspects to errors an operator has to climb up and validate the inventory level. It occurs daily and causes
machine downtime. A similar solution is of interest for D1 since they want a camera to validate if a box is
empty when it goes back to the receiving area. Due to errors in picking, the carriers are not empty in some
cases resulting in problems at the receiving station. The problem could be avoided if a camera can see if
any items remain in a carrier and sends that box to reject. Both D1 and D2 are interested in the dwell time
for the conveyor belt application. Cameras could be installed above conveyor belts to identify bottlenecks.
When the conveyer stops, the camera starts counting the downtime and can generate statistics of what
parts are most crowded and need correction. D2 is further interested in using a queue management
application for facilitating storing. D2 sometimes experience that there are too many carriers on the
conveyor belt resulting in congestions. If the camera were to identify when the queue is too long, a loop
could open to increase the capacity. Reducing congestions would save time for put away making storing

46
more efficient. D3 is not interested in applications connected to storing since they do not consider it
challenging.
All three warehouses experience picking as the most time consuming operation. D1 and D3 are interested
in applying the heat map application on the picking area. It could help to optimize placement of SKUs with
respect to picking intensity and convenient storage locations. D3 already has statistics of where goods are
picked and how frequently. The heat map could contribute by visualizing the path that the operators take
to pick the items. D2 on the other hand shows an interest for the object identification and counting
application to reduce pick errors. Even though shipping is not the most challenging operation for any of
the warehouses, D1 and D3 show an interest for applications within this area. D1 is interested in applying
a heat map on the shipping area to identify forklift and human motion patterns. D3 wants to be able to
measure goods’ volume automatically applying the measure goods application. Some of the SKUs stored
in their WMS have information about weight and measures but far from all. D3 experience a problem with
charging the right price for transportation since they do not know the exact dimensions of a package. The
packages D3 is interested in measuring small packages with dimensions around 50x30x50 cm. D3 request
a way to measure this with a precision around 1 ̶ 2cm. There are solutions for this currently using lasers
but D3 consider them too expensive and slow.
Handling returns is the most challenging operation to D3. They are therefore very interested in the visual
goods tracking solution. They have already applied a manual visual goods tracking application where
goods are video monitored for handling complaints. D3 is going to implement a solution where the video
sequences are directly attained by entering a package’s ID. The visual goods tracking application is one of
their most valuable tools. D3 has reduced the number of complaints and the time it takes to handle
complaints. Also D2 is interested in the visual goods tracking application even though they do not
experience a vast number of complaints. Their interest is based on the fact that video can identify errors
in handling and use this information to educate staff. An interesting application for D1 and D2 concerned
with facilitating all operations is the ability to read barcodes using cameras. Their interest is related to the
possibility to read damaged barcodes, which would save them time if not having to replace them. D1 is
also interested in the possibility to read several kinds of barcode types and not just EAN-barcodes. D2 is
constantly aiming at improving their work environment and is for this reason interested in the human
detection for forklifts application. The other warehouses are also interested in this application as a way
to improve safety.
Production warehouses’ interest for video technology
Receiving is the most challenging or time consuming operation for P2 and P3. P3 is interested in making
receiving more time efficient. One way is by letting a camera measure the time a truck is standing at a
bay, known as truck turnover time. That knowledge is valuable for evaluating their performance and
reduce the time it takes to load and unload goods. However, this application would only be used during a
shorter period for conducting analysis. Receiving is time consuming for P2 since they experience quality
issues with the incoming external pallets. P2 is therefore interested in applying the quality inspection of
pallet application to do quality control automatically. It is currently done by using photocells to inspect if
palletized good is standing correctly. However, it does not inspect the quality of the wooden pallets and

47
a camera could contribute with this check. P1 does not have difficulties with receiving but is still interested
in controlling the pallet quality automatically. Currently, P1 uses a tag system so every tenth time a pallet
is received it goes through quality check. The inspection is done manually. If a camera could do it instead
it would save time and the pallets could be controlled more often.
Storing can be an occasional problem for P3 during high demand periods but there was no interest for any
of the applications connected to storing. P2 does not experience storing as challenging and does not have
an interest in applications facilitating storing. P1 experiences neither storing challenging but is still
interested in evaluating conveyor belts’ performance with the dwell time application. Picking is the most
time consuming operation for P2 and P3. Both these companies think that the heat map application could
be used to identify picking routes and use this information to improve placement of SKUs. P3 is also
interested in the objects identification and counting application to reduce pick errors. P3 does not have a
fix pick/pack station and would have to place the box with the order under a camera for control. Even
though the most challenging operation to P1 is shipping, no application that facilitates this operation is of
interest for P1. P2 does also experience shipping as challenging and think that a heat map could be applied
on the area to change layout for improving the flow of goods. Another potential tool to make shipping
more efficient for P2 is to measure the truck turnover time, which is of interest. Counting loaded pallets
is also of interest to reduce shipping errors. An application that both P2 and P3 are interested in is
measuring the volume of goods. P2 currently estimates the number of pallet positions needed on a truck.
The measure volume application could facilitate the planning of transportation. At some hubs at company
P3, laser beams are used to measure goods’ dimensions. At these sites, the cameras could add value since
lasers are considered imprecise. P1 does not suffer from a vast number of complaints. Even though, they
realize the gains of having an image or a video sequence of the shipping operation. P2 and P3 are not
interested in this application and do not experience extensive returns.
All production warehouses are interested in applications used to enhance all warehousing operations. P1
experiences issues with their barcode readers since they cannot read through plastic film. They think RFID
can solve this issue but have not implemented it. Although, a camera could be used instead and read
barcodes through plastic film. P3 is currently testing to read barcodes with cameras. Their interest is
coupled with the possibility to read multiple barcodes simultaneously. It would save P3 time since they
have a large number of barcodes on every pallet. They request the possibility of having cameras installed
on forklifts allowing the operator to read barcodes without having to dismount. All warehouses show an
interest for the human detection for forklift application. These companies do not have many accidents
per year but still want to improve safety.
Appreciated applications
Some applications were more appreciated than others were by the case companies. These applications
are identified by examining the applications’ grade and validating the case companies’ answers with their
most challenging operations. A description of these applications follows.

48
Quality inspection of pallets
The purpose with this application is to identify pallets of poor quality. By taking images of the pallet and
comparing them to a reference image, differences can be identified. Depending on if the pallet is approved
or disapproved, the camera sends an event of how to deal with the pallet. The application could enhance
receiving efficiency. Receiving was challenging for distribution and production companies, resulting in a
high interest for this application. Companies that handled their pallets manually saw no benefit in using
this application since they already could identify poor quality pallets. Some automated warehouses had
lasers to do this inspection. However, it was stated that the lasers could be unpredictable and judge the
pallets too hard or miss faults. Some warehouses thought that cameras could be a smarter way to do this
control. One extension could be to let cameras notify if palletized good is leaning. A possible setup for
how cameras can be used for controlling quality and if good on pallet is leaning is illustrated in Figure 16.
This would also decrease the risk of collapse in storage.
Heat map
A heat map is a colored area indicating where the most activity has occurred during a specific time.
Depending on how much movement has occurred in a certain area, that part is illustrated with a specific
color, as illustrated in Figure 17. The camera can be programmed to register a specific speed, either that
of humans or vehicles. Different heat maps can in this way be created depending on what object’s
movement one wishes to analyze. It provides a way to analyze crowded receiving, picking or shipping
areas. The heat map can provide information of goods’ flow and how the layout can be changed. Another
way of using this application has been expressed as a complement to ABC-analysis. The analysis is often
done by extracting information from a WMS and analyze it in another program like Excel, which can be
time consuming. If a heat map is used, the analysis might not have to be as frequently updated. The heat
map could instead offer real time data of how to place SKUs in picking aisles.
Figure 16. Illustration of the quality inspection of pallets application (Axis, 2015f)

49
Measure volume
Cameras could be installed where they cover a part of the goods’ flow. Cameras can measure the good’s
dimensions from several angles. The dimensions could be displayed on a screen or directly added to that
SKU’s information in the WMS. An illustration of the application can be seen in Figure 18. The application
could also be used by installing cameras on forklifts. Goods’ dimensions could be measured when picking
it up with a forklift. The interest for measure volume has been high for all kinds of SKUs. Companies that
are shipping pallets stated that this application could be useful for measuring dimensions to book the right
volume on trucks. Other warehouses that are shipping cartons stated that it can be good to measure
volume to better charge their customers for transportation. Many warehouses are already measuring
goods’ dimensions. However, this is done manually with a yardstick or eye measurement. The camera
solution would make this faster and with a better precision compared to manual methods. The application
can help warehouses improve their shipping procedure. All kinds of warehouses were interested in
improving this operation, explaining the high interest in the application.
Figure 18. Illustration of the measure volume application (Axis, 2015f)
Figure 17. Example of a heat map (Connected Security, 2015)

50
Barcode recognition
It is possible to scan products more efficiently by using intelligent cameras as illustrated in Figure 19. Many
of the warehouses have an interest in improving their scanning activities. Managers stated that an
advantage with a camera is its ability to read different barcodes and not just EAN barcodes. There was
also a big interest of reading several barcodes simultaneously.
Additionally, having a camera that can read damaged
barcodes would generate time savings since operators would
then not have to replace them. In cases where others use
barcodes outside the warehouse, the label must be replaced.
By having a camera placed above a fixed station, operators
would not have to scan the product manually by holding a
scanner with their hands. It could be done automatically by
the camera, resulting in time savings. One company showed
an interest in reading through plastic film. Since their laser
scanners had difficulties reading those labels, it was an
appreciated feature. Moreover, some of the warehouses
expressed an interest for having cameras installed on forklifts.
This would enable barcode recognition without having to
dismount from the forklift, which would save time for the
operators.
Human recognition for forklifts
A safe work environment was very important for all visited warehouses and was constantly in focus. Even
if the visited warehouses did not have many accidents it was clear that it was important to proceed the
work with increasing the safety level. One of the risks the operators were exposed to were accidents with
forklifts. A way to reduce the risk for collisions is by applying cameras that can identify humans nearby a
forklift. Some warehouses showed an interest for having the camera decelerate the forklift in dangerous
cases. The technology is already applied for modern cars where the integrated camera stops the vehicle
when the speed is too high close to a person. Alternatively, the camera could send an alarm to the forklift
driver to raise their attention. A possible setup is outlined in Figure 20.
Figure 20. Illustration of the human detection for forklift application (Axis, 2015f)
Figure 19. Example of a barcode recognition application (Danielsson and Smajli, 2015)
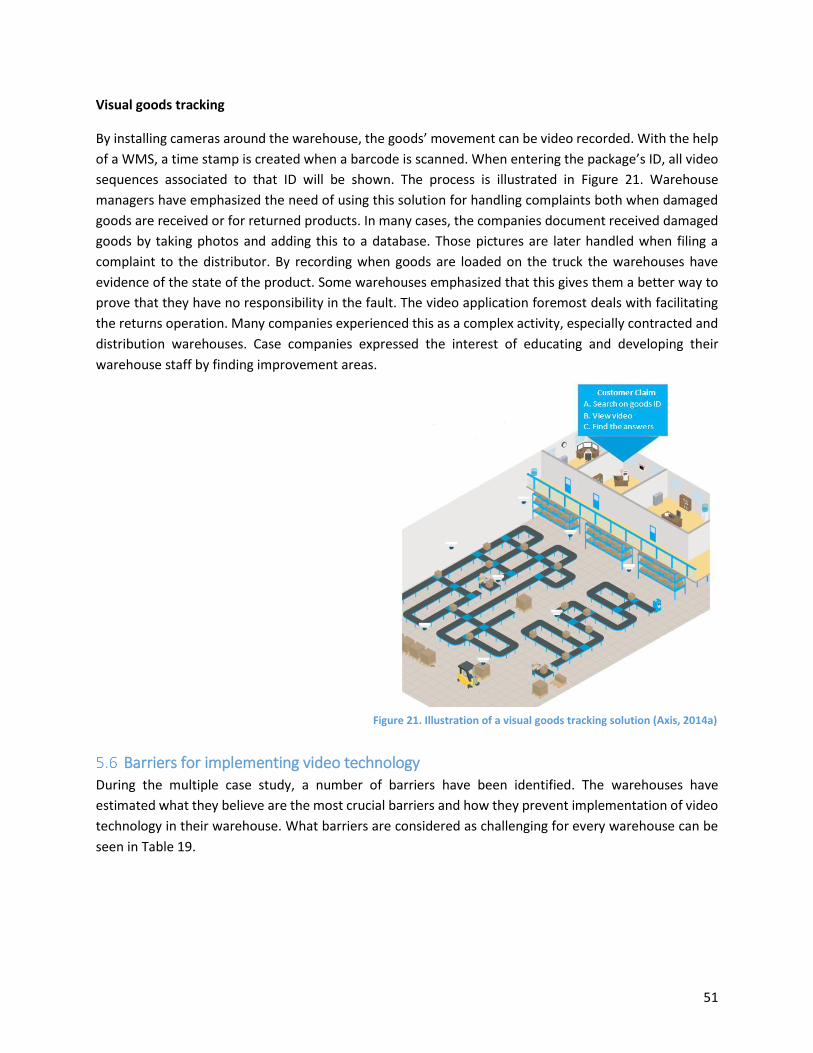
51
Visual goods tracking
By installing cameras around the warehouse, the goods’ movement can be video recorded. With the help
of a WMS, a time stamp is created when a barcode is scanned. When entering the package’s ID, all video
sequences associated to that ID will be shown. The process is illustrated in Figure 21. Warehouse
managers have emphasized the need of using this solution for handling complaints both when damaged
goods are received or for returned products. In many cases, the companies document received damaged
goods by taking photos and adding this to a database. Those pictures are later handled when filing a
complaint to the distributor. By recording when goods are loaded on the truck the warehouses have
evidence of the state of the product. Some warehouses emphasized that this gives them a better way to
prove that they have no responsibility in the fault. The video application foremost deals with facilitating
the returns operation. Many companies experienced this as a complex activity, especially contracted and
distribution warehouses. Case companies expressed the interest of educating and developing their
warehouse staff by finding improvement areas.
Barriers for implementing video technology
During the multiple case study, a number of barriers have been identified. The warehouses have
estimated what they believe are the most crucial barriers and how they prevent implementation of video
technology in their warehouse. What barriers are considered as challenging for every warehouse can be
seen in Table 19.
Figure 21. Illustration of a visual goods tracking solution (Axis, 2014a)

52
Table 19. Barriers stated by the case companies
Barrier C1 C2 C3 D1 D2 D3 P1 P2 P3
Economic aspects X X X X
Other priorities within the organization
X X X X
Unsure benefits X X X
Interface problems
X X X X X X
Union restrictions X X X X X X
The warehouses were to state maximum three barriers that they considered the greatest obstacles for
video implementation in their warehouse. An explanation to these barriers is given below. The first three
barriers consider financial aspects and are therefore closely related to each other.
Economic aspects
What can prevent video technology’s implementation in warehousing is the question of return on
investment. The case companies have stated that it is not enough that video technology might improve
warehousing operation’s efficiency; it must be proved that it does. The companies want to know how
much the technology is going to cost and how much money that will be saved. The purchasing cost is not
the most important aspect for many case companies. Because of their purchasing power, they can invest
even if many cameras are needed. They were more concerned with the return on investment. A
warehouse manager applying for funding is required to declare the implementation cost and effect on
future expenses. The magnitude of this barrier varies with application type. As an example, it is not
possible to calculate return on investment for safety applications.
Other priorities within the organization
Another barrier emphasized by the case companies was how their organization prioritizes projects. It can
be difficult to find funding since there could be several other improvement programs that were being
prioritized. The case companies had the financial muscles to invest in all projects. However, due to the
complexity only one major solution was implemented at a time. Implementation of a new solution usually
required many man hours in order to communicate and solve problems. It is therefore preferred that one
work is finished before another starts. Further, managers wanted to be able to evaluate what the outcome
from one solution was before beginning a new project.
Unsure benefits
One barrier mentioned by the case companies is that they are unsure of video technology’s operational
benefits in terms of time savings and easier handling. Since video in warehousing is a new technology,
there are no well-documented benefits. The case companies stated that they do not like to invest in
unproven solutions. They avoid being early adopters and rather invest in robust solutions. Many of the

53
mentioned applications are not available today. Companies prefer to have a clear business case when
pitching an idea. Another uncertainty is how the applications can be used and how to interpret data. One
company stated that they could be interested in the heat map application but were uncertain of how to
interpret the result. Most companies were of the opinion that they needed more information to fully
grasp the benefits with video technology.
Interface problems
Many of the case companies had experiences with complex and time consuming processes when
implementing new features with existing WMS and other systems. The case companies referred to IT
departments that were unwilling to integrate systems since it was considered a risk for system
breakdown. Implementation time could be extensive and debugging time consuming. The companies
sometimes experienced that implementation could be more costly than the single application alone.
Companies with a high degree of automation experienced this barrier as greater compared to other
companies. It was because more systems needed to be integrated when operations were automated.
Finding an interface that is applicable on all systems is difficult. Since the WMS market is very fragmented
and the warehouses applied different WMS the barrier is complex. The diversity exemplifies the
difficulties to integrate systems with each other. The case companies saw this barrier as a major challenge
but not as impossible to overcome.
Union restrictions
One aspect that many companies considered being a barrier is how to convince the employees’ union
about the benefits of using cameras. Employee integrity is a sensitive topic and many managers were not
aware of the current legislation. Most of the case companies agree that video monitoring is seen as
something negative among personnel. Some case companies had installed cameras in the past and
managers can witness of the anxiety employees experience. Many warehouse employees questioned the
camera’s features and purpose. According to the case companies, this barrier varied in extent depending
on video application. Applications that record employees’ movement are more concerning for the
warehouse managers. Other applications that were following goods’ movements or gathering statistics
are more acceptable and the union restriction barrier not as great.

54
6 Analysis Similarities and differences between the warehousing types’ interest for video technology is elaborated.
The analysis is done with respect to literature and what operations the case companies experience as the
most demanding. How video can contribute to warehousing efficiency compared to WMS and RFID is
explained. The explanation is given together with an analysis of what makes an application popular.
Barriers for implementing video are compared to barriers for other technologies used in warehousing.
The identified barriers are further analyzed with the aim to understand how to manage them.
Analysis of warehouse groups’ interest for video applications
The interest in video technology varies depending on warehousing type. Contracted warehouses are more
interested in applications facilitating outbound operations from picking and forward. Distribution
warehouses find applications that are suitable for all kinds of operations valuable. Production warehouses
are interested in applications connected foremost to receiving and shipping. The warehouse groups’
average interest is illustrated in Table 20. The red areas in the table visualize what warehouse type has
the greatest average grade for a certain application. These interests correspond with what the
warehouses stated were their most demanding operations in terms of time and complexity. The
applications can also help improve the performance metrics the operations are evaluated on. Contracted
and distribution warehouses are expected to benefit the most from video technology. Their warehouses
are the most developed ones and they were more eager to improve their operations. Production
warehouses are generally more concerned with improving production rather than warehousing.

55
Table 20. Warehouse types' average interest for video technology depending on operation
Contracted warehouses
Figure 22. Most demanding operations for contracted warehouses
What operations the contracted warehouses experienced as most demanding are illustrated in Figure 22
in the color red, and corresponds to the applications they were interested in. Applications facilitating the
picking operation is of interest for contracted warehouses. The interest corresponds to the literature,
Receiving Storing Picking Shipping Returns
Application
Receivin
g
Storin
g
Pickin
g
Ship
pin
g
Re
turn
s
Contracted
Distribution
Production
Average
Human detection for forklifts
X X X X X 3.7 3.7 4 3.8
Measure volume
X X 4.3 3.3 3.3 3.7
Barcode scanning
X X X X X 3,3 3.7 3 3.3
Heat map X X X 3.7 3.7 2.3 3.2
Visual goods tracking
X 3 3.7 3 3.2
Object identification and counting
X 2.7 3.3 3.5 3.1
Quality inspection of pallets
X 2 3 3.3 2.8
Inventory control
X 2 3.3 2 2.4
Counting loaded pallets
X 3 1.7 2.3 2.3
Dwell time for conveyor belts
X 1 2.7 2.5 2.3
Truck turnover time
X X 1.7 1.3 3 2
Queue management for conveyor belts
X 1 2.3 1 1.7
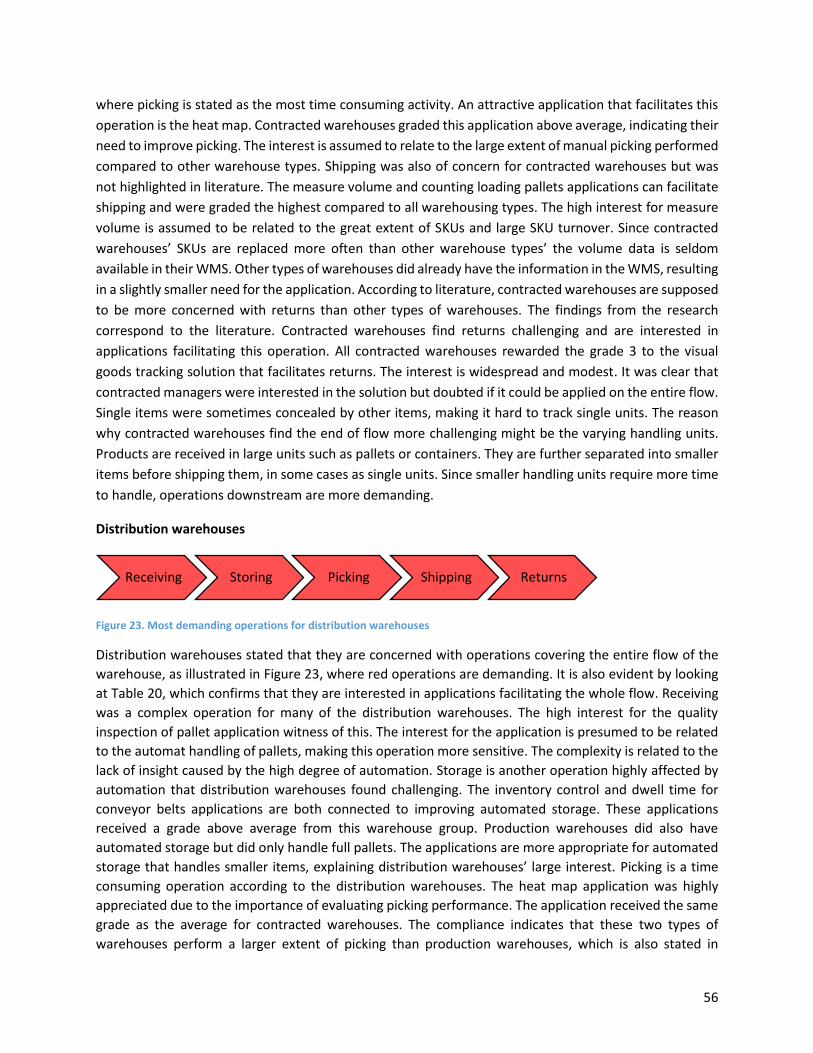
56
where picking is stated as the most time consuming activity. An attractive application that facilitates this
operation is the heat map. Contracted warehouses graded this application above average, indicating their
need to improve picking. The interest is assumed to relate to the large extent of manual picking performed
compared to other warehouse types. Shipping was also of concern for contracted warehouses but was
not highlighted in literature. The measure volume and counting loading pallets applications can facilitate
shipping and were graded the highest compared to all warehousing types. The high interest for measure
volume is assumed to be related to the great extent of SKUs and large SKU turnover. Since contracted
warehouses’ SKUs are replaced more often than other warehouse types’ the volume data is seldom
available in their WMS. Other types of warehouses did already have the information in the WMS, resulting
in a slightly smaller need for the application. According to literature, contracted warehouses are supposed
to be more concerned with returns than other types of warehouses. The findings from the research
correspond to the literature. Contracted warehouses find returns challenging and are interested in
applications facilitating this operation. All contracted warehouses rewarded the grade 3 to the visual
goods tracking solution that facilitates returns. The interest is widespread and modest. It was clear that
contracted managers were interested in the solution but doubted if it could be applied on the entire flow.
Single items were sometimes concealed by other items, making it hard to track single units. The reason
why contracted warehouses find the end of flow more challenging might be the varying handling units.
Products are received in large units such as pallets or containers. They are further separated into smaller
items before shipping them, in some cases as single units. Since smaller handling units require more time
to handle, operations downstream are more demanding.
Distribution warehouses
Figure 23. Most demanding operations for distribution warehouses
Distribution warehouses stated that they are concerned with operations covering the entire flow of the
warehouse, as illustrated in Figure 23, where red operations are demanding. It is also evident by looking
at Table 20, which confirms that they are interested in applications facilitating the whole flow. Receiving
was a complex operation for many of the distribution warehouses. The high interest for the quality
inspection of pallet application witness of this. The interest for the application is presumed to be related
to the automat handling of pallets, making this operation more sensitive. The complexity is related to the
lack of insight caused by the high degree of automation. Storage is another operation highly affected by
automation that distribution warehouses found challenging. The inventory control and dwell time for
conveyor belts applications are both connected to improving automated storage. These applications
received a grade above average from this warehouse group. Production warehouses did also have
automated storage but did only handle full pallets. The applications are more appropriate for automated
storage that handles smaller items, explaining distribution warehouses’ large interest. Picking is a time
consuming operation according to the distribution warehouses. The heat map application was highly
appreciated due to the importance of evaluating picking performance. The application received the same
grade as the average for contracted warehouses. The compliance indicates that these two types of
warehouses perform a larger extent of picking than production warehouses, which is also stated in
Receiving Storing Picking Shipping Returns

57
literature. Improving the shipping operation was also of importance for distribution warehouses, as
indicated by the high interest in the measure volume application. The grade varied within this group with
highest value for the warehouse that consolidated products. Measurements were in this case not available
resulting in a need for the measure volume application. Handling returns was a challenging operation for
distribution warehouses. The visual goods tracking solution was rewarded the highest average grade. The
reason for the high grade is the warehouse handling e-commerce that was already today applying a visual
goods tracking solution. The solution is therefore believed to be of great value where the extent of
complaints are high. Literature states that distribution warehouses should have picking in focus due to
the large amount of picks. Although picking is time consuming, it is not the single most demanding
operation for these companies. The reason why the entire flow is demanding for this warehouse group is
believed to be correlated once again with the handling unit. Products are not split into smaller units to
the same extent as for contracted warehouses. The time it takes to handle a unit is therefore more
balanced throughout the flow. Another factor that makes all applications interesting to this group is the
high degree of automation. Automation was applied at receiving and storing, making these operations
more complex and the need for supporting technologies greater.
Production warehouses
Figure 24. Most demanding operations for production warehouses
Production warehouses are interested in applications that can facilitate receiving and shipping, shown in
Figure 24 with the color red. The importance of receiving is validated by the high interest in the quality
inspection of pallets and truck turnover time application, which received the highest average grades. The
popularity in quality inspection of pallets is once again assumed to be related to the high degree of
automation at receiving, as it was for the distribution warehouses. Production warehouses was the only
group interested in the truck turnover time application despite that they did not receive nor ship as many
units as the other warehouses. Production warehouses were in some cases unable to attain the data from
their basic WMS. The lack of information indicates that production warehouses are not as well developed
as contracted or distribution warehouses. Production warehouses did not perform nearly as many picks
as contracted nor distribution warehouses. Even though, there was an interest for the object identification
and counting application. Although, the interest is suspected to be overestimated since the warehouses’
operations would have to be altered to implement the application. The low picking volume makes it
disadvantageous to implement. Shipping was a complex operation for production warehouses, which is
visualized on the grades for measure volume and counting loaded pallets. The warehouses also showed
an interest for the visual goods tracking solution. Although, the degree of returns were low compared to
the other groups. The application would therefore most likely not be used for handling complaints but
rather as a way to identify errors and educate staff. Literature states storing as the single most demanding
operation for production warehouses since products are stored for longer times. The reason literature is
not valid in this case is that the companies only experience difficulties with storing during seasonality. The
demanding operations in this study are instead receiving and shipping. Receiving is important because of
the high degree of automation, setting high quality requirements on received pallets. Shipping is
Receiving Storing Picking Shipping Returns
58
demanding since it is in many cases the only operation performed manually, which requires more man
hours. Hence, automation is a contributing factor to why receiving and shipping are demanding for
production warehouses.
General interest
An equal interest for barcode scanning and human detection for forklifts was found between the
warehouses. It is concluded that the applications can be beneficial for all kinds of warehouses since they
all use barcodes and forklifts. The reason why the applications received good marks is thought to be that
they are easy to relate to and understand. The most prominent applications are the ones facilitating the
most challenging and time consuming operations. Their benefits are easy to identify and standardized to
fit many kinds of warehouses. Too specific applications are not of interest since the warehouses see
barriers of implementation rather than the gains. Companies are not interested in changing the way they
perform operations. Therefore, generic applications with no demand on how operations are performed
attract more attention. The degree of automation has a significant impact on warehouses’ interest for
video applications since some are more applicable for automated warehouses.
59
Video’s contribution to warehousing efficiency
WMS is widely adopted within warehousing; all case companies were using it to manage their daily
operations. WMS can help warehouses by looking back at performed transactions, guide in the presence
of where products are and provide information about future operations. How a WMS can support in
warehousing operations are listed in Table 21. The WMS can make warehousing more efficient by time
savings through optimized picking routes, lower capital cost through reduced inventory and facilitation of
handling through information sharing. Since the WMS supports operations in many ways, the area of use
is large. Different types of warehouses can all benefit from WMS features, which is thought to be the
reason for the high extent of use for the case companies. Even though WMS is widely adopted it lacks the
feature to retrieve real-time data. RFID can fulfill this need in warehousing and is in literature stated to be
beneficial for increasing warehousing efficiency. The real time data of transactions can be used for faster
handling of products enabled by information about a product’s exact location as stated in Table 21. Since
RFID’s time savings are based on knowledge of products’ location the technology can be redundant if
warehouses have correct information already. None of the case companies did experience large inventory
discrepancies, which can be the reason why they did not use RFID.
Another technology that can contribute to increasing warehousing efficiency is video. In this research,
video has proven to be useful for analyzing video sequences. The image itself can have a value for
warehousing, something neither WMS nor RFID can provide. An image can provide a more transparent
and reliable warehouse by delivering information about past events and can analyze current activities. In
comparison, the WMS can guide in future operations which video is incapable of. However, video can
provide visual information about operations in retrospective, which WMS and RFID cannot do. Video’s
contribution to increasing operations’ efficiency is presented in Table 21. Video technology can provide
an easier way of handling products more exact, faster and improve safety. The enhancement is achieved
by applications like barcode scanning, measure volume, quality control and human detection for forklifts.
Video is similar to WMS since they both support operations in a specific way by evaluating different kinds
of inputs. For example, WMS can evaluate shipping times as well as number of operators needed and
video can analyze velocities, times and measurements. RFID on the other hand, is only based on
information of products’ locations. Video can therefore be applied on more situations than RFID,
something that should affect video’s popularity in warehousing.
Video technology has the potential to improve warehousing efficiency by supporting operations in a way
that neither WMS nor RFID do. The popular video applications are new ways of enhancing warehousing
and do not compete with WMS nor RFID. The technologies provide different methods of enhancing
operations and should therefore not be considered as substitutes. Many of the proposed video
applications are dependent on a WMS. It is therefore the authors’ opinion that video technology is most
appropriate for warehouses that have a well-functioning WMS. Since no case companies have RFID and
there was an interest for video, it is assumed that RFID is not needed when investing in video technology.

60
Table 21. Video applications’ value compared to WMS and RFID (Danielsson and Smajli, 2015)
Operation WMS RFID Video Applications
Receiving Facilitates product and quantity verification
Faster product verification and registration
Quality inspection of pallets, truck turnover time
Storing Reduced inventory levels Improved space utilization
Inventory control, queue management and dwell time for conveyor belts
Picking Optimize picking route Faster tracking of goods
Object identification and counting, heat map
Shipping Packaging and consolidating information
Faster loading procedure
Heat map, measure volume, truck turnover time, counting loaded pallets
Returns Information about when and why products are returned
Verify product authentication
Visual goods tracking
All Storing of information Real time data capture
Barcode reading and human detection for forklifts
Barriers to video technology Five barrier to video implementation in warehousing have been identified. These barriers are grouped
with respect to literature depending on type of barrier, as seen in Table 22. The emphasis lies on business
related barriers where the financial aspects have a great impact. The barrier is in line with literature that
highlights the increased demands on warehousing and the ambition to cut costs. Financial aspects are
especially highlighted by contracted warehouses. They see this as a great barrier due to the short
contracts they have with their customers. It is therefore important that the payback time is within the
contract time frame. Production warehouses see union restrictions as the greatest barrier to video
implementation. Producing companies are expected to have a long history of union membership. Union
related questions are therefore taken most seriously. When comparing video’s barriers with those for
other technologies in warehousing, there is a high correlation. The price/performance ratio and
investment cost are important for all technologies, video included. Information systems like WMS
experience integration problems as a barrier, as it is for video implementation. Barriers that other
technologies have not experienced, but video does, are union restrictions and other priorities within the
organization. The union barrier for video is rational since it can capture individual information in a way
that is not possible for other technologies.

61
Table 22. Type of barriers for video technology
Type of barrier Barrier
Behavioural and cultural Union restrictions
Technical Interface problems
Business and supply chain related Economical aspects, Other priorities within the organization, Unsure benefits
The identified barriers for video might be avoided with the same approach, working with benchmarking
and facilitating integration. The barriers and solutions are illustrated in Figure 25.
Figure 25. Illustration of barriers and solutions
Benchmarking can positively affect the barriers economic aspects, unsure of benefits, priorities within
organization and union restrictions. Benchmarking is the approach to get information by comparing
operations with another company. Benchmarking could provide warehouses with information about
return on investment and solve the issue of economic benefits. Table 3 lists appropriate financial metrics
to consider and can be useable when conducting benchmarking cases. Using these metrics would assure
that the most critical financial aspects are covered and that the benchmarking cases are suitable. Enabling
companies to benchmark their business with other companies would give them insights of the video
technology’s gains, managing the uncertainty of benefits. Knowing the operational benefits will provide a
clear business case for the companies, making video more prioritized. Even though video technology may
be cheap, it will not be implemented if the benefits are not well documented. The case companies also
promoted the possibility to visit benchmarking companies to fully understand how video technology can
be useful at their warehouses. The union restriction obstacle can also be managed by providing
benchmarking cases. If warehouse managers had more documented benefits it would be easier to
convince the union about using cameras. Clarifying video’s purpose would reduce uncertainty for
employees, making video more acceptable. Integrating video with other warehousing system would
facilitate implementation. Having a WMS provider offer video technology would ensure the ease of
- Benchmarking
- Integration
Union restrictions
Unsure benefits
Interface problems
Economic aspects
Priorities within
organization

62
integration and offer credibility. Other providers like forklift leasers or sellers of automated equipment
could also offer video solutions directly, integrated as a package solution. Buying video solutions
independently is considered both costly and complex, resulting in higher demands of customer
knowledge. Facilitating integration will decrease the interface issue. Additionally, if cameras are
integrated to a WMS it would not be seen as a separate solution but rather a WMS feature. Video
technology could be more prioritized since WMS is already used today.

63
7 Conclusion The chapter starts with evaluating the process framework used for identifying how different kinds of
warehouses can benefit from video technology. Video’s contribution to warehousing efficiency is
highlighted and the two most prominent video applications are presented. The chapter continues by
explaining how barriers prevent implementation of video technology in warehousing and how these
barriers can be managed. How the findings contribute to theory and what it has for managerial
implications is outlined. Following that is suggestions for future research, which concludes the chapter.
Warehouses’ need for video technology
During the study, the process framework has successfully been used to identify the need for video
technology in warehousing. The approach helped the researchers understand and identify the need for
improvements depending on type of warehouse. The research considered the need for video technology
depending on type of warehouse. Following the process framework enabled identifying the pull aspects
from warehousing before offering video solutions. Type of warehouse was thought to affect the need for
video technology. It was highlighted in the process framework and emphasized in research question one.
“How can different types of warehouses benefit from video technology?”
The three warehouse types were interested in applications that can facilitate their most challenging
operations. Since contracted warehouses were more interested in improving their picking, shipping and
returns operations they were most interested in these kinds of video applications. Their focus on
improving the end of flow is most likely due to the handling of smaller units downstream. Since contracted
warehouses are highly developed and cost focused, they can probably benefit from implementing video.
Distribution warehouses were concerned with all warehousing operations, which also reflected on their
interest for video technology. The reason why they focus on all operations is probably since they have the
same handling unit throughout the flow and the high degree of automation. The distribution warehouses
were well developed and aimed to enhance warehousing further. The improvement could be attained by
implementing video technology. Production warehouses had difficulties performing their receiving and
shipping operations. Consequently, they were interested in applications that can facilitate those
operations. The high degree of automation results in a focus on receiving and shipping since these are the
only manually handled operations. Although, production warehouses were not as well developed
compared to contracted and distribution. Production companies were more concerned with facilitating
the production units and put less emphasis on enhancing warehousing operations. Operations performed
were not as extensive as for the other warehouse categories. Video is therefore not as applicable for
production warehouses as for contracted and distribution warehouses. Video can contribute to
warehousing by providing ways of making operations faster, better and easier, resulting in cost savings.
Since video can increase warehousing efficiency through varying methods, it is a diverse technology that
many types of warehouses can benefit from. Every visited warehouse was unique but still had a high
interest for video applications, indicating that video can be suitable for all warehouses. Video’s
contribution compared to WMS and RFID is the ability to analyze video sequences. It is recommended to
have a WMS in the warehouse before implementing video; this is however not the case with RFID. Video
can be seen as a complement to existing technologies rather than a substitute.

64
There are two applications that the authors believe have the most potential to increase warehousing
efficiency. These are the measure volume and the barcode scanning applications. The applications
received the highest marks in the multiple case study and are both easy to implement compared to other
applications. The measure volume application can help improve the shipping operation, something all
warehouse types were interested in. The barcode scanning solution could help in all warehousing
operations. Video technology companies can most likely target the broadest group by offering these
solutions. During this study, it was clear that every warehouse is unique. Some requested tailor-made
solutions that were too specific, making them not applicable at other warehouses. The measure volume
and barcode scanning solutions are applicable for almost all warehouses.
How to proceed with video technology in warehouses
The identified interest for video technology is extensive, although there are barriers preventing
implementation in warehousing. The greatest barriers for implementing video have been covered in this
report and ways of exceeding those barriers were analyzed. Interviewing warehouse managers have
resulted in information for answering the second research question:
“How do barriers prevent implementation of video technology in warehouses?”
Barriers prevent implementation of video in a similar way as it has done for WMS and RFID. Warehouse
managers are uncertain about business, technical and behavioural implications. The uncertainty hinders
managers from making investment decisions and thus prevent implementation. Barriers like economical
aspects, priorities and uncertainty of benefits are related to payback and efficiency gains. Warehousing is
expected to be done at the lowest possible cost and many warehouses do not invest if they are not sure
of the gains beforehand. By benchmarking their operations with other warehouses they could understand
the technology and compare economical and efficiency gains. Video providers have a great responsibility
in convincing warehouses to be benchmarking examples for communicating the advantages to other
companies. Marketing video in warehouses will be a slow and challenging process if no benchmarking
examples are in place. Union restrictions is another area of concern that is considered a major barrier.
The technology companies have a responsibility in communicating legislations and providing information
about how video can be used. It is important not to consider it as a tool for monitoring employees, but as
a tool to increase efficiency. Benchmarking could be used as a way to provide information in this aspect
as well. Interface problems prevent implementation of video technology. Many of the case companies
consider implementation costly and time consuming. Warehouses wanted other providers of supporting
systems (WMS, automation or forklifts) to also offer video as a fully integrated solution. Warehouses
would then not have to consider potential interface problems.
The case companies considered barriers differently, indicating that they affect the warehouses in varying
extents. Contracted warehouses had a higher cost focus than other warehouses and a shorter time
horizon for their investments, which was reflected in their choice of barriers. They thought financial
barriers like investment cost and payback time as the most challenging barriers. Production warehouses
focused more on the production processes where the union had great power. The established unions can
be the reason for why production warehouses had a skeptical view of how video technology affect
employees’ integrity. There is no barrier that is too great to entire prevent implementation of video
65
technology in warehousing. Key points for implementing video is to provide warehouses with
benchmarking examples and to facilitate integration of video with existing supporting systems. Either by
developing compatible interfaces or by offering video together with existing supporting systems.
Theoretical contribution and managerial implications
A new area of use have been identified for video, which contributes to literature in the field of technology
in warehousing. Video can enhance warehousing efficiency further, compared to what RFID and WMS
previously have achieved. Video should therefore be considered the next step in improving warehousing
efficiency. The research has contributed with knowledge of how the need for video varies between
warehouse groups, which has not been identified before. Challenging operations for different warehouse
types have been identified, adding to warehousing research. The literature in warehousing operations
was scarce and not always corresponding to the findings in this study. The research’s result can therefore
be considered as a complement to existing literature. Barriers to video implementation in warehousing
have been identified. The findings provide an important insight since the barriers have not been presented
in literature before. Barriers for implementing video correspond to a high degree with the challenges WMS
and RFID experience. Barriers not included in literature were also identified, resulting in new insights for
what obstacles new technology might face in warehousing. The research also contributed with
suggestions for how to resolve the barriers to video implementation. Since video is a new technology in
warehousing, the suggestions provide a contribution to literature.
Managers should be aware of video technology’s potential in improving warehousing efficiency. Video
can contribute with cost reductions through time savings, more accurate handling and increased safety.
Video can be used as a tool for meeting the increased demands on warehousing, complementing currently
used technologies. Managers for contracted warehouses should especially acknowledge the technology
considering their focus on cost reductions. Contracted warehouses compete with offering logistics
services to a low cost. Reducing the cost would directly lead to advantages over other warehouses in this
market. Since the logistics contracts for these warehouses are very short, customers would swiftly adapt
to the lowered cost and demand the same price. Other warehouse managers should also be aware of
video’s potential but do not have to adapt as quickly as contracted warehouses.
Suggestions for future research
The performed study had a cross-sectional time horizon where the need for video has been evaluated in
a single point in time. Future research could perform a longitudinal study and follow a warehouse during
a longer period. Warehousing efficiency could be evaluated before and after video technology has been
implemented. Documenting video benefits is essential since warehouses stated it is crucial to know the
financial and operational outcome before investing. The chosen categorization of warehouses is based on
warehousing purpose and liability, covering all kinds of warehouses. Even though the categorization has
been useful, relationships among different kinds of warehouses have been identified. These connections
indicate that different types of warehouses have something in common. As an example were warehouses
with a high degree of automation more interested in certain applications. The interest was more
correlated to automation degree than type of warehouse. A suggestion is therefore to consider two
categories: a manual warehouse and an automated warehouse. The low extent of manual handling when

66
applying automation might result in a lack of operational insight. Automated warehouses might therefore
have a greater need for video technology than manual warehouses. Some video applications might be
more useable for a certain type of unit handled in the warehouse. It can therefore also be appropriate to
classify warehouses with respect to handling unit based on for example pallet, carton or piece flow.
The study has been successful in identifying the need for video technology and its barriers in warehousing.
However, there is further research needed regarding how barriers can be managed. Since many of video’s
barriers correlated with WMS and RFID, future research could identify how these barriers were resolved.
The study showed that RFID is not used to the same extent as the authors thought prior the research.
None of the case companies had implemented RFID since they considered the barriers too great. A closer
examination of their skepticism to RFID would increase the knowledge of barriers. It would facilitate the
proceeding work for implementing video. Video is already an established technology within the retailing
and transportation market. Barriers for implementing video in these segments might correspond to those
for warehousing. Investigating barriers for other market segments can provide guidance of how to breech
warehousing barriers.
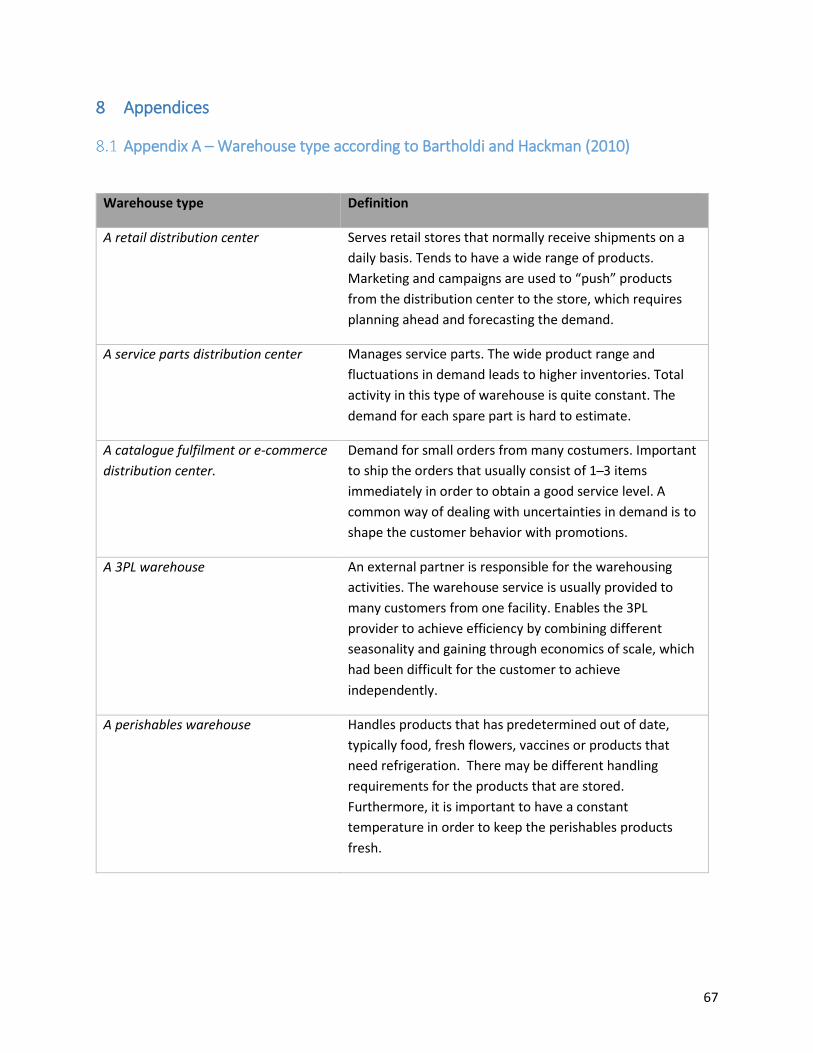
67
8 Appendices
Appendix A – Warehouse type according to Bartholdi and Hackman (2010)
Warehouse type Definition
A retail distribution center Serves retail stores that normally receive shipments on a
daily basis. Tends to have a wide range of products.
Marketing and campaigns are used to “push” products
from the distribution center to the store, which requires
planning ahead and forecasting the demand.
A service parts distribution center Manages service parts. The wide product range and
fluctuations in demand leads to higher inventories. Total
activity in this type of warehouse is quite constant. The
demand for each spare part is hard to estimate.
A catalogue fulfilment or e-commerce
distribution center.
Demand for small orders from many costumers. Important
to ship the orders that usually consist of 1 ̶3 items
immediately in order to obtain a good service level. A
common way of dealing with uncertainties in demand is to
shape the customer behavior with promotions.
A 3PL warehouse An external partner is responsible for the warehousing
activities. The warehouse service is usually provided to
many customers from one facility. Enables the 3PL
provider to achieve efficiency by combining different
seasonality and gaining through economics of scale, which
had been difficult for the customer to achieve
independently.
A perishables warehouse Handles products that has predetermined out of date,
typically food, fresh flowers, vaccines or products that
need refrigeration. There may be different handling
requirements for the products that are stored.
Furthermore, it is important to have a constant
temperature in order to keep the perishables products
fresh.

68
Appendix B - Warehouse type according to Frazelle (2002)
Warehouse type Definition
Raw material and component warehouse Storing of raw material in connection to processing
operations such as production or assembly.
Work-in-process warehouse Storing of material or products that are already partially
processed and will go through more operations.
Finished goods warehouse Inventories are used to handle differences between
produced units and demand. The warehouse is usually
located close to the production unit and the flow is
common to be in full pallets.
Distribution warehouse and distribution
center
The purpose is to consolidate shipments from several
manufacturing units to a common customer. The
warehouse is normally located centrally to the
manufacturing units or to the customer.
Fulfilment warehouse and fulfilment
center
Warehouses that receive, pick, and ship small orders for
individual consumers.
Local warehouse The warehouse is located close to the costumer, which
makes it possible to respond quickly to costumer
demand.
Value-added service warehouse The purpose with this type of warehouses is to
customize the products through activates such as,
packaging, labelling, marketing, pricing and returns
processing.
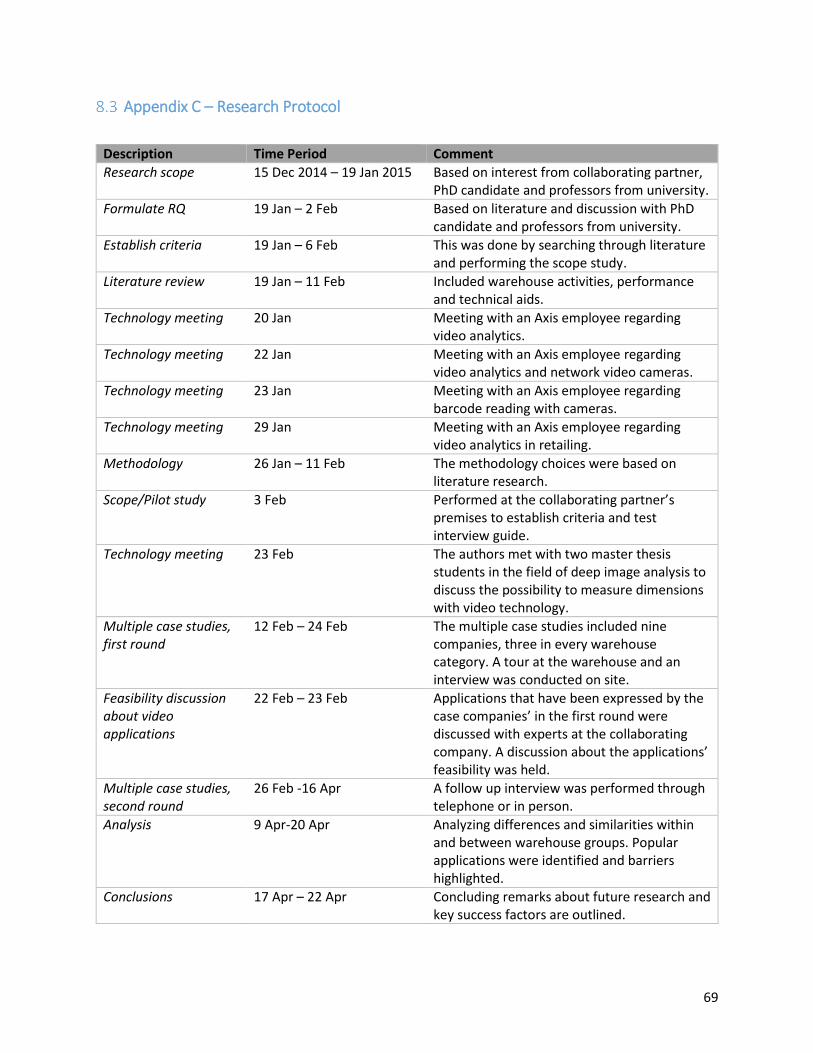
69
Appendix C – Research Protocol
Description Time Period Comment
Research scope 15 Dec 2014 – 19 Jan 2015 Based on interest from collaborating partner, PhD candidate and professors from university.
Formulate RQ 19 Jan – 2 Feb Based on literature and discussion with PhD candidate and professors from university.
Establish criteria 19 Jan – 6 Feb This was done by searching through literature and performing the scope study.
Literature review 19 Jan – 11 Feb Included warehouse activities, performance and technical aids.
Technology meeting 20 Jan Meeting with an Axis employee regarding video analytics.
Technology meeting 22 Jan Meeting with an Axis employee regarding video analytics and network video cameras.
Technology meeting 23 Jan Meeting with an Axis employee regarding barcode reading with cameras.
Technology meeting 29 Jan Meeting with an Axis employee regarding video analytics in retailing.
Methodology 26 Jan – 11 Feb The methodology choices were based on literature research.
Scope/Pilot study 3 Feb Performed at the collaborating partner’s premises to establish criteria and test interview guide.
Technology meeting 23 Feb The authors met with two master thesis students in the field of deep image analysis to discuss the possibility to measure dimensions with video technology.
Multiple case studies, first round
12 Feb – 24 Feb The multiple case studies included nine companies, three in every warehouse category. A tour at the warehouse and an interview was conducted on site.
Feasibility discussion about video applications
22 Feb – 23 Feb Applications that have been expressed by the case companies’ in the first round were discussed with experts at the collaborating company. A discussion about the applications’ feasibility was held.
Multiple case studies, second round
26 Feb -16 Apr A follow up interview was performed through telephone or in person.
Analysis 9 Apr-20 Apr Analyzing differences and similarities within and between warehouse groups. Popular applications were identified and barriers highlighted.
Conclusions 17 Apr – 22 Apr Concluding remarks about future research and key success factors are outlined.
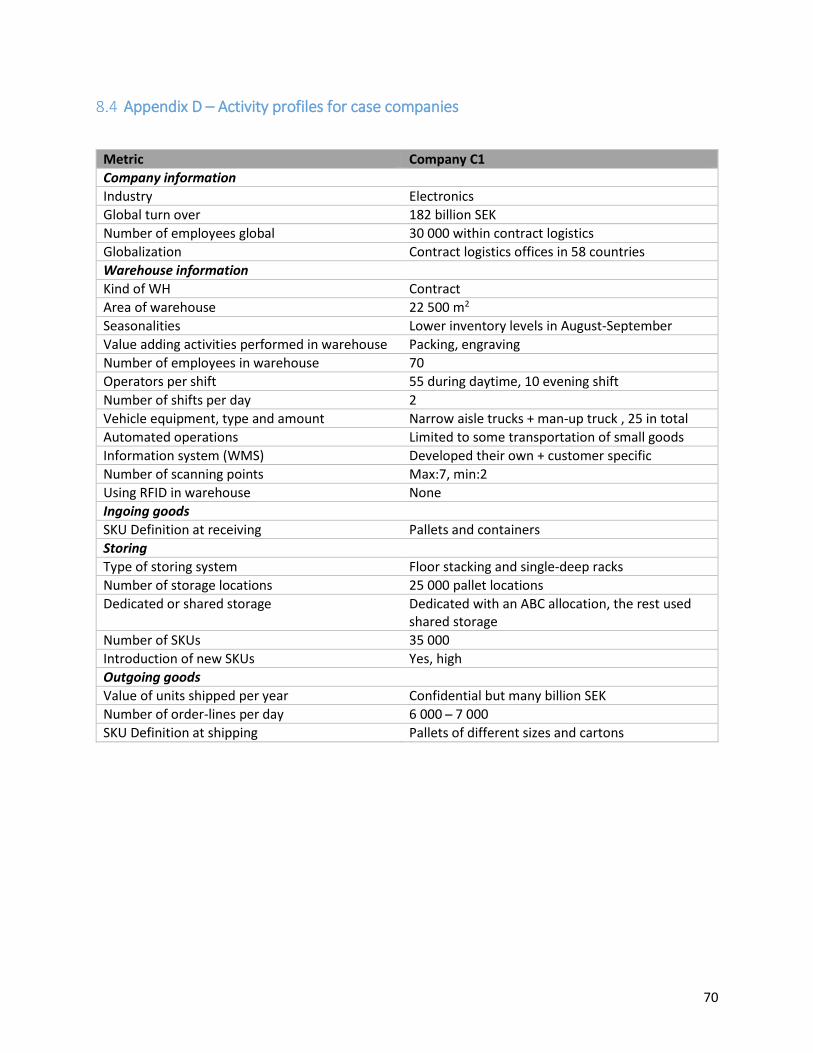
70
Appendix D – Activity profiles for case companies
Metric Company C1
Company information
Industry Electronics
Global turn over 182 billion SEK
Number of employees global 30 000 within contract logistics
Globalization Contract logistics offices in 58 countries
Warehouse information
Kind of WH Contract
Area of warehouse 22 500 m2
Seasonalities Lower inventory levels in August-September
Value adding activities performed in warehouse Packing, engraving
Number of employees in warehouse 70
Operators per shift 55 during daytime, 10 evening shift
Number of shifts per day 2
Vehicle equipment, type and amount Narrow aisle trucks + man-up truck , 25 in total
Automated operations Limited to some transportation of small goods
Information system (WMS) Developed their own + customer specific
Number of scanning points Max:7, min:2
Using RFID in warehouse None
Ingoing goods
SKU Definition at receiving Pallets and containers
Storing
Type of storing system Floor stacking and single-deep racks
Number of storage locations 25 000 pallet locations
Dedicated or shared storage Dedicated with an ABC allocation, the rest used shared storage
Number of SKUs 35 000
Introduction of new SKUs Yes, high
Outgoing goods
Value of units shipped per year Confidential but many billion SEK
Number of order-lines per day 6 000 ̶ 7 000
SKU Definition at shipping Pallets of different sizes and cartons

71
Metric Company C2
Company information
Industry Footwear, food, body lotion, automotive parts etc.
Global turn over 39 billion SEK
Number of employees global 40 000
Globalization Nordic countries and Germany
Warehouse information
Kind of WH Contracted
Area of warehouse 107 000 m2
Seasonalities Yes, high pressure during holidays
Value adding activities performed in warehouse Labelling, repackaging, building displays
Number of employees in warehouse Approximately 190
Operators per shift Huge variations depending on customer, season and time
Number of shifts per day Varying but between 1 ̶2 shifts
Vehicle equipment, type and amount 80 forklifts of the type narrow aisle, man-up and stand behind
Automated operations Sorting conveyor belts
Information system (WMS) Diracom
Number of scanning points 4
Using RFID in warehouse No
Ingoing goods
SKU Definition at receiving Pallet, container, cages
Storing
Type of storing system Single deep racks
Number of storage locations 110 000 pallet locations
Dedicated or shared storage Dedicated for picking and shared for buffer locations
Number of SKUs Approximately 300 000
Introduction of new SKUs Varying from 10% for some customers to 100% for others
Outgoing goods
Value of units shipped per year Exceeding 1 billion SEK
Number of order-lines per day 22 000
SKU Definition at shipping Pallet, cages, envelopes

72
Metric Company C3
Company information
Industry Transportation and warehousing of B2B goods
Global turn over 62 billion SEK
Number of employees global 23 000
Globalization Established in more than 70 countries
Warehouse information
Kind of WH Contracted
Area of warehouse 110 800 m2
Seasonalities Small peaks during holidays
Value adding activities performed in warehouse Rework and assembly
Number of employees in warehouse 400 white collars + 100 warehouse operators
Operators per shift 35 for solutions, 15 for cross-docking
Number of shifts per day 1 for solutions, 3 for cross-docking
Vehicle equipment, type and amount 70 counter balance truck, picking truck, man-up truck
Automated operations Some sorting conveyor belts for packages
Information system (WMS) LWS from Logistex
Number of scanning points Depending on customer at solutions, 2 at cross-docking
Using RFID in warehouse No
Ingoing goods
SKU Definition at receiving Varying, cartons, pallets, single items
Storing
Type of storing system Floor storage at cross docking and racks at solutions
Number of storage locations 91 000
Dedicated or shared storage Shared for cross-docking and dedicated for solutions
Number of SKUs 10 000
Introduction of new SKUs Large, variation in solutions, 100% per day for cross-docking
Outgoing goods
Value of units shipped per year Exceeding 1 billion SEK
Number of order-lines per day 18 000
SKU Definition at shipping Varying, cartons, pallets, single items
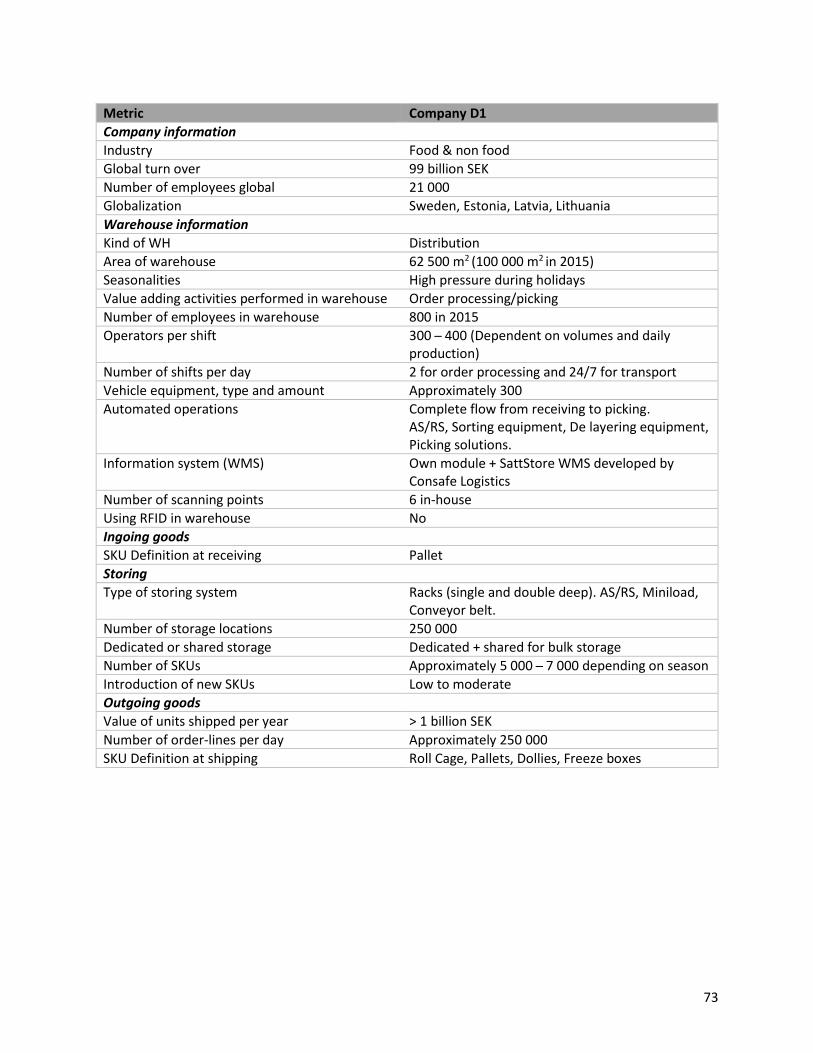
73
Metric Company D1
Company information
Industry Food & non food
Global turn over 99 billion SEK
Number of employees global 21 000
Globalization Sweden, Estonia, Latvia, Lithuania
Warehouse information
Kind of WH Distribution
Area of warehouse 62 500 m2 (100 000 m2 in 2015)
Seasonalities High pressure during holidays
Value adding activities performed in warehouse Order processing/picking
Number of employees in warehouse 800 in 2015
Operators per shift 300 ̶ 400 (Dependent on volumes and daily production)
Number of shifts per day 2 for order processing and 24/7 for transport
Vehicle equipment, type and amount Approximately 300
Automated operations Complete flow from receiving to picking. AS/RS, Sorting equipment, De layering equipment, Picking solutions.
Information system (WMS) Own module + SattStore WMS developed by Consafe Logistics
Number of scanning points 6 in-house
Using RFID in warehouse No
Ingoing goods
SKU Definition at receiving Pallet
Storing
Type of storing system Racks (single and double deep). AS/RS, Miniload, Conveyor belt.
Number of storage locations 250 000
Dedicated or shared storage Dedicated + shared for bulk storage
Number of SKUs Approximately 5 000 ̶ 7 000 depending on season
Introduction of new SKUs Low to moderate
Outgoing goods
Value of units shipped per year > 1 billion SEK
Number of order-lines per day Approximately 250 000
SKU Definition at shipping Roll Cage, Pallets, Dollies, Freeze boxes
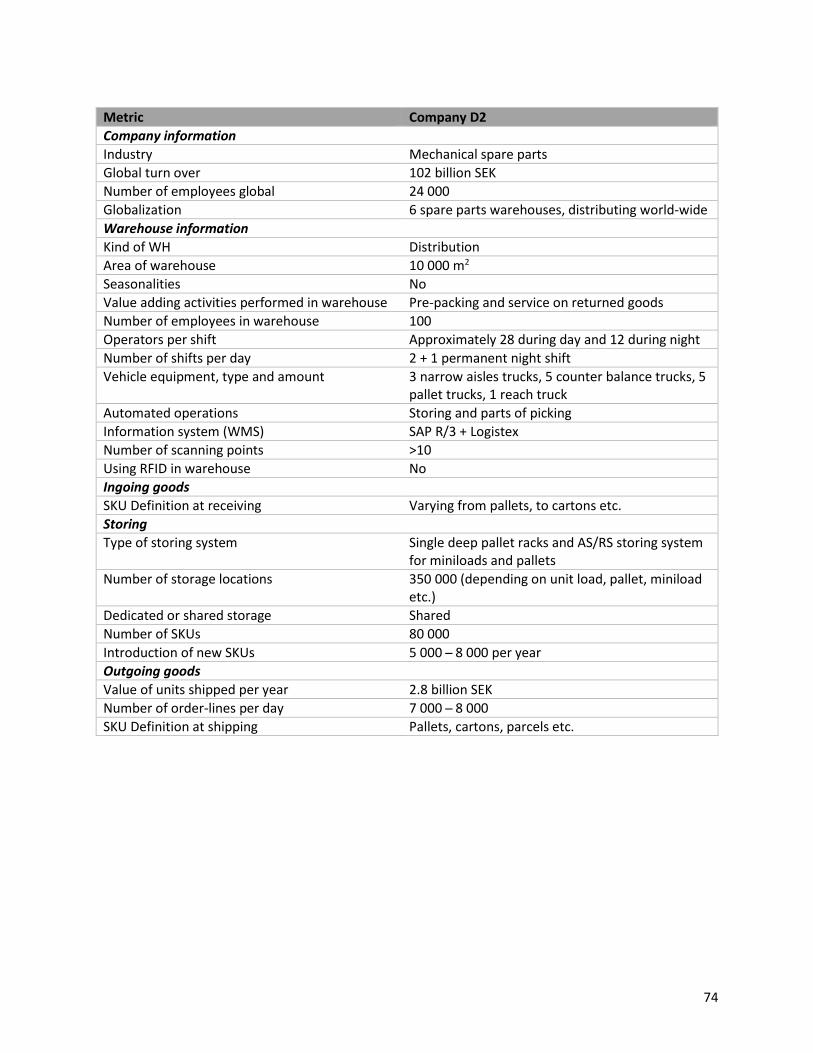
74
Metric Company D2
Company information
Industry Mechanical spare parts
Global turn over 102 billion SEK
Number of employees global 24 000
Globalization 6 spare parts warehouses, distributing world-wide
Warehouse information
Kind of WH Distribution
Area of warehouse 10 000 m2
Seasonalities No
Value adding activities performed in warehouse Pre-packing and service on returned goods
Number of employees in warehouse 100
Operators per shift Approximately 28 during day and 12 during night
Number of shifts per day 2 + 1 permanent night shift
Vehicle equipment, type and amount 3 narrow aisles trucks, 5 counter balance trucks, 5 pallet trucks, 1 reach truck
Automated operations Storing and parts of picking
Information system (WMS) SAP R/3 + Logistex
Number of scanning points >10
Using RFID in warehouse No
Ingoing goods
SKU Definition at receiving Varying from pallets, to cartons etc.
Storing
Type of storing system Single deep pallet racks and AS/RS storing system for miniloads and pallets
Number of storage locations 350 000 (depending on unit load, pallet, miniload etc.)
Dedicated or shared storage Shared
Number of SKUs 80 000
Introduction of new SKUs 5 000 ̶ 8 000 per year
Outgoing goods
Value of units shipped per year 2.8 billion SEK
Number of order-lines per day 7 000 ̶ 8 000
SKU Definition at shipping Pallets, cartons, parcels etc.
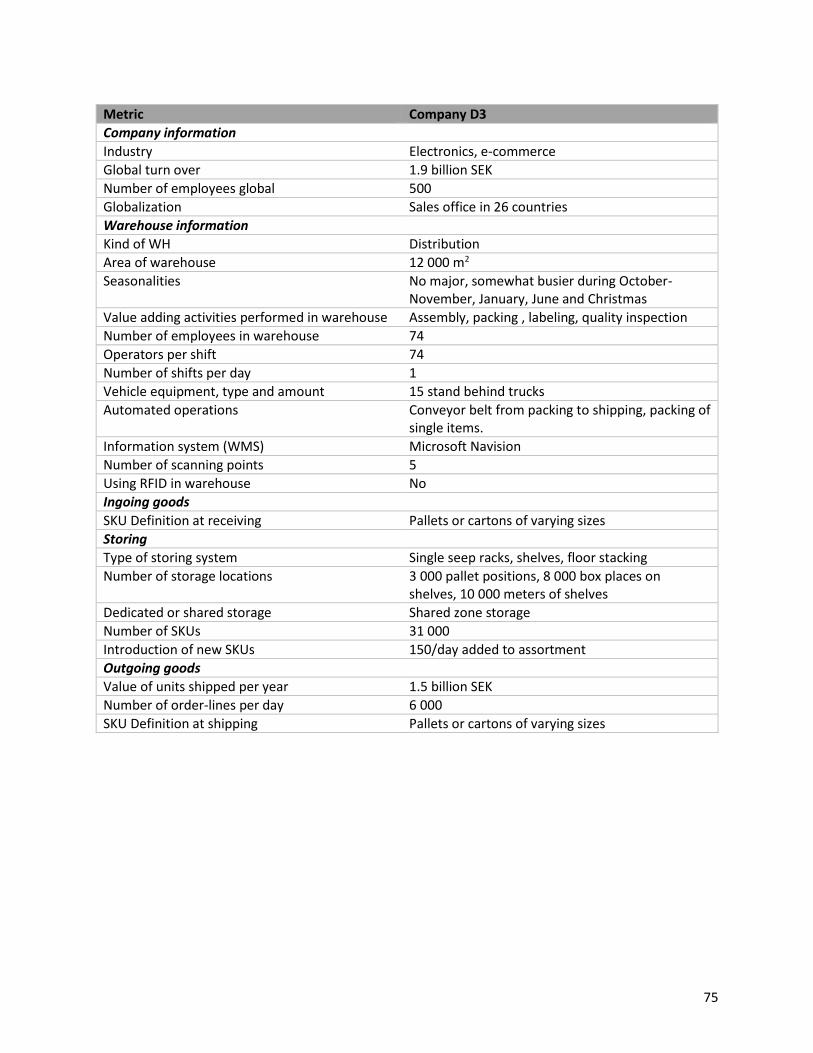
75
Metric Company D3
Company information
Industry Electronics, e-commerce
Global turn over 1.9 billion SEK
Number of employees global 500
Globalization Sales office in 26 countries
Warehouse information
Kind of WH Distribution
Area of warehouse 12 000 m2
Seasonalities No major, somewhat busier during October-November, January, June and Christmas
Value adding activities performed in warehouse Assembly, packing , labeling, quality inspection
Number of employees in warehouse 74
Operators per shift 74
Number of shifts per day 1
Vehicle equipment, type and amount 15 stand behind trucks
Automated operations Conveyor belt from packing to shipping, packing of single items.
Information system (WMS) Microsoft Navision
Number of scanning points 5
Using RFID in warehouse No
Ingoing goods
SKU Definition at receiving Pallets or cartons of varying sizes
Storing
Type of storing system Single seep racks, shelves, floor stacking
Number of storage locations 3 000 pallet positions, 8 000 box places on shelves, 10 000 meters of shelves
Dedicated or shared storage Shared zone storage
Number of SKUs 31 000
Introduction of new SKUs 150/day added to assortment
Outgoing goods
Value of units shipped per year 1.5 billion SEK
Number of order-lines per day 6 000
SKU Definition at shipping Pallets or cartons of varying sizes

76
Metric Company P1
Company information
Industry Beverage
Global turn over 5 billion SEK
Number of employees global 500 ̶ 600
Globalization Production at one site in Sweden
Warehouse information
Kind of WH Production
Area of warehouse 14 000 m2
Seasonalities High pressure from April to December
Value adding activities performed in warehouse Weight control
Number of employees in warehouse 13
Operators per shift 5 per shift + 2 daytime
Number of shifts per day 2
Vehicle equipment, type and amount 6 forklifts and 1 high reach truck
Automated operations AS/RS in storage and conveyor belts form receiving to shipping
Information system (WMS) SattStore WMS developed by Consafe Logistics
Number of scanning points 6 in-house
Using RFID in warehouse No, maybe in future
Ingoing goods
SKU Definition at receiving Pallet
Storing
Type of storing system Single deep racks + some floor storage
Number of storage locations 24 000
Dedicated or shared storage Shared storage
Number of SKUs 400
Introduction of new SKUs Low, approximately 1 per year
Outgoing goods
Value of units shipped per year 5 billion SEK
Number of order-lines per day 40 containers, varying from 40 orderlines to 800 per day
SKU Definition at shipping Slip-sheet, pallet

77
Metric Company P2
Company information
Industry Fast moving consumer goods, snacking
Global turn over 304 billion SEK
Number of employees global 100 000
Globalization Sales in 165 countries
Warehouse information
Kind of WH Production
Area of warehouse 6 860 m2
Seasonalities Peaks during Christmas and other holidays
Value adding activities performed in warehouse None
Number of employees in warehouse 21 blue collars + 5 admins
Operators per shift 5 ppl on each shift, 1 in the night, 10 ppl daytime
Number of shifts per day 2 shifts + day and night personnel
Vehicle equipment, type and amount 5 counter balance trucks, 5 stand behind forklifts and 5 picking trucks
Automated operations Receiving, transportation, storing, picking
Information system (WMS) SAP WM and SAP / R3
Number of scanning points 2
Using RFID in warehouse no
Ingoing goods
SKU Definition at receiving Pallet
Storing
Type of storing system Single deep racks
Number of storage locations 22 140 pallet positions
Dedicated or shared storage Shared but restricted to areas
Number of SKUs 300 ̶ 350
Introduction of new SKUs 20 ̶ 30 per year
Outgoing goods
Value of units shipped per year Exceeding 1 billion SEK
Number of order-lines per day 416
SKU Definition at shipping Pallet

78
Metric Company P3
Company information
Industry Automotive
Global turn over 92 billion SEK
Number of employees global 42 000
Globalization Production in 15 countries
Warehouse information
Kind of WH Production
Area of warehouse 15 000 m2
Seasonalities None
Value adding activities performed in warehouse Repacking, kitting
Number of employees in warehouse 160
Operators per shift 70
Number of shifts per day 2
Vehicle equipment, type and amount 72, counterbalance truck, man up truck, reach truck
Automated operations Some for handling returned pallets
Information system (WMS) Own
Number of scanning points One under a pilot project, thinking of implementing up to five scanning points
Using RFID in warehouse No
Ingoing goods
SKU Definition at receiving Pallets and boxes
Storing
Type of storing system Floor storage, single deep racks
Number of storage locations 25 000 pallet and box locations
Dedicated or shared storage Dedicated for fast moving SKUs and shared for slow moving SKUs
Number of SKUs 16 000
Introduction of new SKUs A couple of hundred per year
Outgoing goods
Value of units shipped per year Exceeding 1 billion SEK
Number of order-lines per day 4 500
SKU Definition at shipping Pallets and boxes

79
Appendix E – Semi structured interview guide for the first multiple case study sessions
Activity Profiling
Metric Company X
Company information
Industry
Global turn over
Number of employees global
Globalization
Warehouse information
Kind of WH
Area of warehouse
Seasonalities
Value adding activities performed in warehouse
Number of employees in warehouse
Operators per shift
Number of shifts per day
Vehicle equipment, type and amount
Automated operations
Information system (WMS)
Number of scanning points
Using RFID in warehouse
Ingoing goods
SKU Definition at receiving
Storing
Type of storing system
Number of storage locations
Dedicated or shared storage
Number of SKUs
Introduction of new SKUs
Outgoing goods
Value of units shipped per year
Number of order-lines per day
SKU Definition at shipping
80
Information about critical operations
Present the operations: Receiving, storing, picking, shipping, returns
Question 1: What are your most challenging operations?________________________________________
Question 2: Why are those operations so difficult?_____________________________________________
Question 3: What are your most time consuming operations?____________________________________
_____________________________________________________________________________________
Question 4: Why are those operations so time consuming?______________________________________
Information about critical measures
Question 5: What performance metrics do you have for your most challenging operations?____________
_____________________________________________________________________________________
Question 6: Is your metric for your challenging operations sufficiently good, why / why not?____________
_____________________________________________________________________________________
Question 7: What performance metrics do you have for your most time consuming operations?_________
_____________________________________________________________________________________
Question 8: Is your metric for your time consuming operations sufficiently good, why / why not?________
_____________________________________________________________________________________
Information about video analytics
Heat map
http://www.3yteknoloji.com.tr/en/products/pheat-heatmap-analytic.html
Dwell time
https://www.youtube.com/watch?v=Ryy-N59v2ls
Trip wire
http://www.axis.com/products/crossline/system.htm
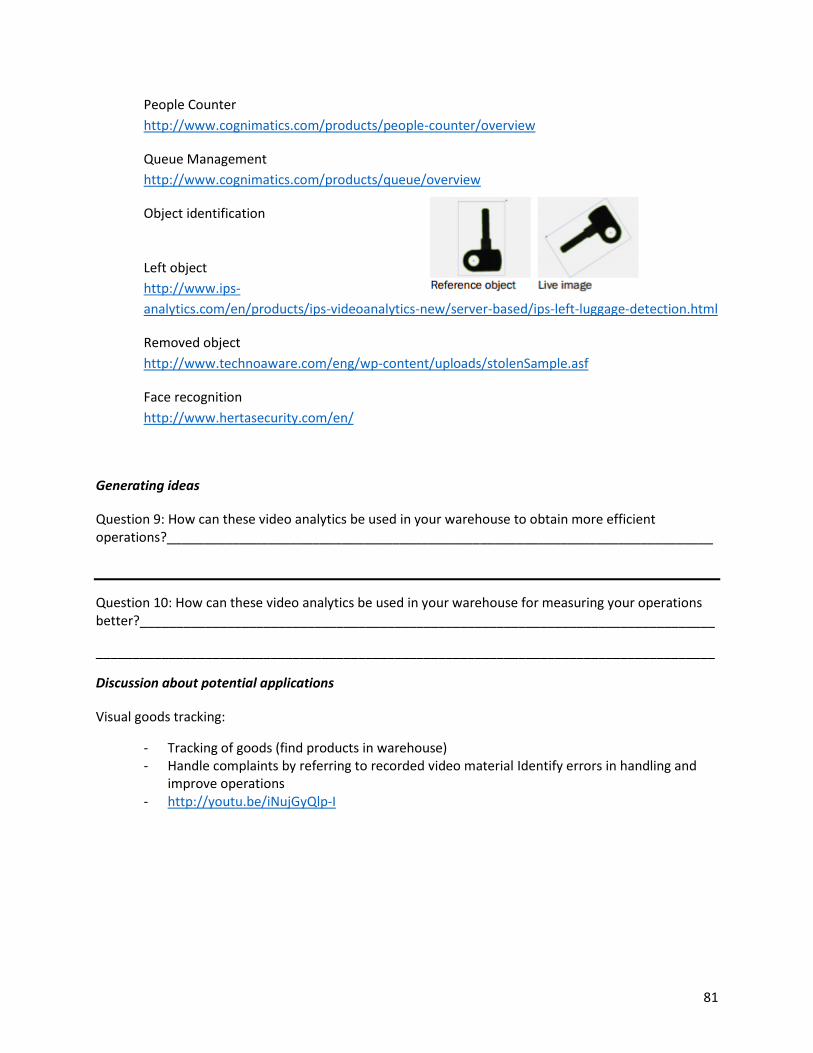
81
People Counter
http://www.cognimatics.com/products/people-counter/overview
Queue Management
http://www.cognimatics.com/products/queue/overview
Object identification
Left object
http://www.ips-
analytics.com/en/products/ips-videoanalytics-new/server-based/ips-left-luggage-detection.html
Removed object
http://www.technoaware.com/eng/wp-content/uploads/stolenSample.asf
Face recognition
http://www.hertasecurity.com/en/
Generating ideas
Question 9: How can these video analytics be used in your warehouse to obtain more efficient operations?___________________________________________________________________________
Question 10: How can these video analytics be used in your warehouse for measuring your operations better?_______________________________________________________________________________
_____________________________________________________________________________________
Discussion about potential applications
Visual goods tracking:
- Tracking of goods (find products in warehouse) - Handle complaints by referring to recorded video material Identify errors in handling and
improve operations - http://youtu.be/iNujGyQlp-I

82
- Heat Map - People - Vehicles
Barcode recognition:
- Fill in information when gaps exist in barcodes
- Read through plastic film
- Eliminate scanning through installation on
forklifts
Quality inspection at receiving/shipping, using object identification. Can be used to stop the operation and handle the discrepancy.
Identify picking time, using dwell time. See for how long an operator stand at one pick station.
Reduce picking errors, using touch analytics or object identification. See if the operator takes the wrong
item or in the wrong quantity. Or check if an order contains what it actually should contain.
Empty shelves notification, using removed object. Let the system know if a shelf is empty.
Discrepancies in stacking, using left item. Can identify a potential danger if there are pallet overhangs.
Measure volume – can be used for measuring dimension of goods.
Feedback and idea generation
Question 11: Which applications could potentially be used in your warehouse? ____________________
Question 12: Can you think of any other application areas?_____________________

83
Appendix F – Structured interview guide for the follow up multiple case interview
1. Estimate your interest for the video applications presented in the table.
The interest should be based on the scale between 1 ̶ 5 where;
1 = Not interested (we would not invest in this application)
2 = Low interest
3 = Moderate interest
4 = High interest
5 = Very interested (we would most likely invest in this application)
0 = Do not know
n = Not applicable (E.g. do not have conveyor belt)
More explicit, what is the underlying reason to the extent of your interest for these applications?
------------------------------------------------------------------------------------------------------------------------------------------
------------------------------------------------------------------------------------------------------------------------------------------
------------------------------------------------------------------------------------------------------------------------------------------
------------------------------------------------------------------------------------------------------------------------------------------
--------------------------------------------------------
What is needed to increase your interest for applying these applications in your warehouse?
------------------------------------------------------------------------------------------------------------------------------------------
------------------------------------------------------------------------------------------------------------------------------------------
------------------------------------------------------------------------------------------------------------------------------------------
------------------------------------------------------------------------------------------------------------------------------------------
----------------------------------------------------------

84
Characteristic Application Description and benefits
Visualize Dwell time for conveyor belts Identify bottlenecks in automated conveyor belts, visualizing problems. Enables to change the layout of conveyor belt.
Heat map Identify crowded areas. Can facilitate layout decisions and provide support for ABC-analysis.
Truck turnover time Identify for how long a truck has been standing at a bay. Provides information regarding shipping.
Reduce errors Counting loaded pallets Counts the amount of loaded pallets on a truck. Reduce shipping errors.
Object identification and counting
Controls if the correct item in the right quantity have been picked. Reduce pick errors and increase picking/packing efficiency.
Facilitate handling of goods
Barcode scanning Possibility to read damaged barcodes. Ability to handle more than EAN-barcodes. Can read through plastic films. Read barcodes on pick/pack station to increase picking/packing efficiency by eliminating manual scanning.
Inventory control Control inventory levels at inconvenient locations e.g. automated storages and conveyors. Saves time for operators. Sends an alarm when a shelf is empty if it is not supposed to be empty, enables improved inventory control.
Measure volume Can automatically read goods’ dimensions, which saves operators time.
Queue management for conveyor belts
Identify the number of packages on the conveyor belt. Sends an event to handle the queue making the process more efficient.
Quality inspection of pallets Useful for controlling pallet quality at receiving by comparing with a reference object (e.g. determines if the pallet is broken). Enables more efficient quality inspection.
Visual goods tracking Document and handle complaints within the warehouse. Enables easier handling of complaints. Can also be used for identifying errors and educate staff.
Safety Human detection for forklifts Detects when a person is alarmingly close to a forklift. Can be used to ensure a safe environment.

85
2. Is there any other application that you would be interested in?
------------------------------------------------------------------------------------------------------------------------------------------
------------------------------------------------------------------------------------------------------------------------------------------
3. Which are the three major barriers you see for implementing video technology in your warehouse?
1. Economic aspects: Return on investment aspects or a tight warehousing budget.
2. Interface problems with current systems: Interaction with existing systems. Might be difficult to
use the systems together.
3. Lack of technology knowledge: The overall technology knowledge within the company is
considered low. Makes it difficult take technology decisions.
4. Union restrictions to video monitoring employees: Not allowed by the union to record
warehousing staff.
5. Unsure benefits: The video technology is a new technology with no documented benefits for
warehouses.
6. Other priorities within the organization: Other improvement projects might be prioritized.
7. Other, what?
For these three, describe the underlying reason for considering them as obstacles.
1.
------------------------------------------------------------------------------------------------------------------------------------------
------------------------------------------------------------------------------------------------------------------------------------------
2.
------------------------------------------------------------------------------------------------------------------------------------------
------------------------------------------------------------------------------------------------------------------------------------------
3.
------------------------------------------------------------------------------------------------------------------------------------------
------------------------------------------------------------------------------------------------------------------------------------------
How can the magnitude of the barriers be reduced?
1.
------------------------------------------------------------------------------------------------------------------------------------------
------------------------------------------------------------------------------------------------------------------------------------------
2.
------------------------------------------------------------------------------------------------------------------------------------------
------------------------------------------------------------------------------------------------------------------------------------------
3.
------------------------------------------------------------------------------------------------------------------------------------------
------------------------------------------------------------------------------------------------------------------------------------------

86
9 List of reference
3yteknoloji, 2015. PHeat - Heatmap Analytic. [Online] Available at
http://www.3yteknoloji.com.tr/en/products/pheat-heatmap-analytic.html [Accessed 2 February 2015].
Accorsi, R., Manzini, R., & Maranesi, F., 2014. A decision-support system for the design and management
of warehousing systems. Computers in Industry, 65(1), p.175-186.
Agent Video Intelligence, 2010. What is Video Analytics? [Online] Available at
http://www.agentvi.com/20-Technology-56-What_is_Video_Analytics [Accessed 30 January 2015]
Axis Communications AB, 2015a. Network video solutions for all industries. [online] Available at
http://www.axis.com/solutions/video/index.htm [Accessed 30 January 2015]
Axis Communications AB, 2015b. Axis Homepage. [online] Available at www.axis.com [Accessed 27 January 2015] Axis Communications AB, 2015c. ACAP applications ready to meet your needs. [online] Available at
http://www.axis.com/products/video/compatible_applications/index.php [Accessed 30 January 2015]
Axis Communications AB, 2015d. Axis intelligent video. [Online] Available at
http://www.axis.com/products/video/about_networkvideo/iv/system_design.htm [Accessed 3
February 2015]
Axis Communications AB, 2015e. Smart logistics with visual goods tracking. [Video Online] Available at
https://www.youtube.com/watch?v=iNujGyQlp-I [Accessed 4 February 2015].
Axis Communications AB, 2015f. Examples of video application images. [pdf]. Lund.
Axis Communications AB, 2014a. Discover transparent and secure logistics. [pdf] Available at
http://www.axis.com/files/brochure/bc_cargo_210x280_61383_en_1412_lo.pdf [Accessed 1 February
2015]
Axis Communications AB, 2014b. Improve your retail business with network-based people counting. [pdf]
Available at http://www.axis.com/files/user_scenarios/ap_ret_peoplecounting_55186_en_1401_lo.pdf
[Accessed 2 February 2015]
Axis Communications AB, 2014c. Technical guide to network video. [pdf] Available at
http://www.axis.com/files/brochure/bc_techguide_60870_en_1411_lo.pdf [Accessed 3 February 2015]
Axis Communications AB, 2013. Choosing the right video management software solution. [pdf] Available
at http://www.axis.com/files/whitepaper/wp_choosing_right_vms_50485_en_1302_lo.pdf [Accessed
30 January 2015]

87
Axis Communications AB, 2012. AXIS Cross Line Detection. [pdf] Available at
http://www.axis.com/files/datasheet/ds_cross_line_detection_45537_en_1202_lo.pdf [Accessed 2
February 2015]
Axis Communications AB, n.d. The road to smarter traffic monitoring: with Axis network video solutions.
p. 5. Available at: http://www.axis.com/files/brochure/bc_traffic_210x280_56060_en_1402_lo.pdf
[Accessed 27 January 2015].
Baker, P., & Canessa, M., 2009. Warehouse design: A structured approach. European Journal of
Operational Research, 193(2), p.425-436.
Baker, P., & Halim, Z. 2007. An exploration of warehouse automation implementations: cost, service and
flexibility issues. Supply Chain Management: An International Journal, 12(2), p. 129-138.
Bartholdi, J.J. & Hackman, S.T., 2010. Warehouse & Distribution Science, 0.93 ed, Atlanta (GA): Georgia Institute of Technology
Barnes, S. J., & Vidgen, R. T., 2006. Data triangulation and web quality metrics: A case study in e-
government. Information & Management, 43(6), p.767-777.
Berg, J. P., & Zijm, W. H. M.,1999. Models for warehouse management: Classification and
examples. International Journal of Production Economics, 59(1), p.519-528.
Beamon, B. M. (1999). Measuring supply chain performance. International Journal of Operations &
Production Management, 19(3), p.275-292.
Boesch, I., Schwaninger, M., Weber, M., & Scholz, R. W., 2013. Enhancing validity and reliability through
feedback-driven exploration: A study in the context of conjoint analysis. Systemic Practice and Action
Research, 26(3), p.217-238.
Chiang, D. M. H., Lin, C. P., & Chen, M. C., 2011. The adaptive approach for storage assignment by
mining data of warehouse management system for distribution centres. Enterprise Information Systems,
5(2), p. 219-234.
Christopher, M., & Towill, D., 2001. An integrated model for the design of agile supply chains.
International Journal of Physical Distribution & Logistics Management, 31(4), p.235-246.
Cisco, n.d. Cisco Video Analytics. [Online] Available at
http://www.cisco.com/c/en/us/products/collateral/physical-security/video-analytics/datasheet_c78-
622537.html [Accessed 2 February 2015].
Clearview, 2015. CCTV Facial Recognition & Video Analytics Software Systems - Essex & UK [Online]
Available at http://www.clearview-communications.com/cctv/facial-recognition-video-analytics
[Accessed 2 February 2015].

88
Cognex, 2013. Automatic identification of pallets.[pdf] Available at
http://www.cognex.com/ExploreLearn/FindOutMore/WhitePapersArticles/WhitePaperAndArticleMain.
aspx?id=14223&rdr=true&LangType=2057 [Accessed 2 February 2015].
Connected security, 2015. Heat map analysis (view high / low traffic zones). [Online] Available at: <
http://www.connectedsecurity.uk/products-and-services/intelligent-cctv-analytics> [Accessed 23 April
2015].
De Koster, M. D., & Balk, B. M., 2008. Benchmarking and monitoring international warehouse operations
in Europe. Production and Operations Management, 17(2), p.175-183.
De Koster, R., Le-Duc, T., & Roodbergen, K. J., 2007. Design and control of warehouse order picking: A
literature review. European Journal of Operational Research, 182(2), p.481-501.
Divis, n.d. Intelligent Solutions for Logistics. [pdf] Available at
http://www.divis.eu/tl_files/pdf/DIVIS_Magazin.pdf [Accessed 30 January 2015]
Eisenhardt, K. M., 1989. Building theories from case study research. Academy of management review,
14(4), p.532-550.
European Commission, 2003. The new SME definition: User guide and model declaration. Enterprise and
Industry Publications.
European Small Business Alliance, 2011. Micro and Small Business in the EU: What‘s in it for you! European
Small Business Alliance.
Faber, N., de Koster, M. B. M., & Smidts, A., 2013. Organizing warehouse management. International
Journal of Operations & Production Management, 33(9), p.1230-1256.
Faber, N., de Koster, R.M.B., & van de Velde, S.L., 2002. Linking warehouse complexity to warehouse
planning and control structure: an exploratory study of the use of warehouse management information
systems. International Journal of Physical Distribution & Logistics Management, 32(5), p.175-183.
Ferreira, B. Q., Griné, M., Gameiro, D., Costeira, J. P., & Santos, B. S., 2014. VOLUMNECT: measuring
volumes with Kinect. In: Conference on Three-Dimensional Image Processing, Measurement (3DIPM),
and Applications. San Francisco, USA, 5 February 2014.
Frazelle, E., 2002. World-class warehousing and material handling. 1 ed. New York: McGraw-Hill.
Fullerton, J. T., 1993. Evaluation of research studies. Journal of nurse-midwifery, 38(2), p.121-125.
Geraldes, C. A., Carvalho, M. S. F., & Pereira, G. A., 2008. A warehouse design decision model—Case
study. In Engineering Management Conference, Estoril , Portugal, 28-30 June, 2008. IEMC Europe 2008.
IEEE International, p. 1-5. IEEE.
Glaser, B. G., & Strauss, A. L., 2009. The discovery of grounded theory: Strategies for qualitative research.
7th edition. USA: Transaction Publishers.

89
Gu, J., Goetschalckx, M., & McGinnis, L. F., 2007. Research on warehouse operation: A comprehensive
review. European journal of operational research, 177(1), p.1-21.
GuardRFID, 2012. Active RFID Platform Integrates Closed Circuit TV (CCTV). [Online] Available at
http://guardrfid.com/active-rfid-platform-integrates-closed-circuit-tv-cctv/ [Accessed 1 February 2015].
Harland, C. M., Caldwell, N. D., Powell, P., & Zheng, J. (2007). Barriers to supply chain information
integration: SMEs adrift of eLands. Journal of Operations Management, 25(6), p. 1234-1254.
Herta, 2015. Facial Recognition Technology. [Online] Available at http://ecl-ips.com/blog/facial-
recognition-technology/ [Accessed 2 February 2015].
Hertz, S., & Alfredsson, M., 2003. Strategic development of third party logistics providers. Industrial
marketing management, 32(2), p.139-149
Hou, B., 2011. The optimizing model of the logistics warehousing distribution based on RFID technology.
In: Computer Science and Network Technology (ICCSNT), Harbin, China, 24-26 December 2011. Vol. 4, p.
2709-2711). IEEE.
Johnson, S. L., 2010. A question of time: Cross-sectional versus longitudinal study designs. Pediatrics in
Review, 31(6), p.250.
Karagiannaki, A., Papakiriakopoulos, D., & Bardaki, C., 2011. Warehouse contextual factors affecting the
impact of RFID. Industrial Management & Data Systems, 111(5), p.714-734
Krmac, V.E. 2012. Interdependence between Logistics Activities and Information Communication
Technologies (ICT). PROMET-Traffic&Transportation, 19(2), p. 115-119.
Marchet, G., Melacini, M., & Perotti, S. 2015. Investigating order picking system adoption: a case-study-
based approach. International Journal of Logistics Research and Applications, 18(1), p.82-98.
Matell, M. S., & Jacoby, J., 1971. Is There an Optimal Number of Alternatives for Likert Scale Items? Study
1: reliability and validity. Educational and psychological measurement, 31, p. 657-674.
Meredith, J., 1998. Building operations management theory through case and field research. Journal of
operations management, 16(4), p.441-454.
Mondragon, A. E. C., Lalwani, C., & Mondragon, C. E. C., 2011. Measures for auditing performance and
integration in closed-loop supply chains. Supply Chain Management: An International Journal, 16(1),
p.43-56.
Nee, A. Y. H., 2009. Warehouse Management System and Business Performance: Case Study of a
Regional Distribution Centre. 2nd International Conference on Computing and Informatics. Kuala
Lumpur, Malaysia, 24-25 June 2009, p.350-354
Neely, A., Gregory, M., & Platts, K. (1995). Performance measurement system design: a literature review
and research agenda. International journal of operations & production management, p.15(4), 80-116.

90
Ngai, E. W. T., Moon, K. K., Riggins, F. J., & Candace, Y. Y., 2008. RFID research: An academic literature
review (1995–2005) and future research directions. International Journal of Production Economics,
112(2), p.510-520.
Petersen, C. G., & Aase, G., 2004. A comparison of picking, storage, and routing policies in manual order
picking. International Journal of Production Economics, 92(1), p. 11-19.
Poon, T. C., Choy, K. L., Chow, H. K., Lau, H. C., Chan, F. T., & Ho, K. C., 2009. A RFID case-based logistics
resource management system for managing order-picking operations in warehouses. Expert Systems
with Applications, 36(4), p.8277-8301.
Ramanathan, R., Ramanathan, U., & Ko, L. W. L., 2014. Adoption of RFID technologies in UK logistics:
Moderating roles of size, barcode experience and government support. Expert Systems with
Applications, 41(1), p.230-236.
Ross, A. D., Twede, D., Clarke, R. H., & Ryan, M., 2009. A framework for developing implementation
strategies for a radio frequency identification (RFID) system in a distribution center environment. Journal
of Business Logistics, 30(1), p. 157-183.
Shiau, J. Y., & Lee, M. C., 2010. A warehouse management system with sequential picking for multi-
container deliveries. Computers & Industrial Engineering, 58(3), p. 382-392.
SICK, 2015. This is SICK. [Online] Available at
http://www.sick.com/GROUP/EN/HOME/Pages/Homepage1.aspx [Accessed 2 February 2015].
SICK, 2014. Warehouse and distribution. [Online] Available at
http://www.sick.com/group/EN/home/solutions/industries/retail_and_warehousing/Pages/warehouse
_and_distribution.aspx [Accessed 2 February 2015].
SICK, 2013. Vision. [pdf] Available at https://www.mysick.com/saqqara/pdf.aspx?id=im0050302
[Accessed 2 February 2015].
Tan, H., 2009. Design and Realization of WMS Based on 3PL Enterprises. In: IEEC'09: International
Symposium on Information Engineering and Electronic Commerce. 16-17 May, 2009. p. 169-173. IEEE.
Technoaware, n.d. VTrack-AbandonedStolenObjects. [pdf] Available at
http://www.technoaware.com/eng/wp-content/uploads/VTrackAbandonedStolenObjectsEN.pdf
[Accessed 2 february 2015]
VLS, 2015. Recognize what is important. [pdf] Available at http://www.v-l-
s.com/sites/default/files/vls_en.pdf [Accessed 30 January 2015]
VLS, n.d.a VLS Logtrack. [Online] Available at http://www.v-l-s.com/en/produkte/vlslogtrack [Accessed 1
February 2015].

91
Voss, C., Tsikriktsis, N., & Frohlich, M., 2002. Case research in operations management. International
journal of operations & production management, 22(2), p. 195-219.
Wang, H., Chen, S., & Xie, Y., 2010. An RFID-based digital warehouse management system in the tobacco
industry: a case study. International Journal of Production Research, 48(9), p.2513-2548.
Weijters, B., Cabooter, E., & Schillewaert, N., 2010. The effect of rating scale format on response styles:
The number of response categories and response category labels. International Journal of Research in
Marketing, 27(3), p. 236-247.
Yin, R. K., 2014. Case study research: Design and methods. 5th ed. Thousand Oaks (California): Sage
publications, Inc.
Zhang, X., & Lian, X., 2008. Design of warehouse information acquisition system based on RFID. In: IEEE
International Conference on Automation and Logistics, Qingdao, China, 1-3 September, 2008. p. 2550-
2555. IEEE.
Zhang, Y., & Sun, J., 2004. Cooperation in Reverse Logistics. In: ICEB, 4th International Conference on
Electronic Business. Beijing, China, 5-9 December 2004.
Related Documents