Improving Vulnerability Remediation Through Better Exploit Prediction Jay Jacobs Sasha Romanosky Idris Adjerid Wade Baker [email protected] [email protected] [email protected] [email protected] Cyentia RAND Corporation Virginia Tech Virginia Tech Despite significant innovations in IT security products and research over the past 20 years, the information security field is still immature and struggling. Practitioners lack the ability to properly assess cyber risk, and decision-makers continue to be paralyzed by vulnerability scanners that overload their staff with mountains of scan results. In order to cope, firms prioritize vulnerability remediation using crude heuristics and limited data, though they are still too often breached by known vulnerabilities for which patches have existed for months or years. And so, the key challenge firms face is trying to identify a remediation strategy that best balances two competing forces. On one hand, it could attempt to patch all vulnerabilities on its network. While this would provide the greatest coverage of vulnerabilities patched, it would inefficiently consume resources by fixing low-risk vulnerabilities. On the other hand, patching a few high-risk vulnerabilities would be highly efficient, but may leave the firm exposed to many other high-risk vulnerabilities. Using a large collection of multiple datasets together with machine learning techniques, we construct a series of vulnerability remediation strategies and compare how each perform in regard to trading off coverage and efficiency. We expand and improve upon the small body of literature that uses predictions of published exploits, by instead using exploits in the wild as our outcome variable. We implement the machine learning models by classifying vulnerabilities according to high- and low-risk, where we consider high risk vulnerabilities to be those that have been exploited in actual firm networks. Keywords: vulnerability management, exploited vulnerability, CVSS, security risk management, machine learning, precision, recall Acknowledgements: The authors would like to sincerely thank Kenna Security and Fortinet for sharing their data.

Welcome message from author
This document is posted to help you gain knowledge. Please leave a comment to let me know what you think about it! Share it to your friends and learn new things together.
Transcript

Improving Vulnerability Remediation
Through Better Exploit Prediction
Jay Jacobs Sasha Romanosky Idris Adjerid Wade Baker
jaycyentiacom sromanosrandorg iadjeridvtedu wbakervtedu
Cyentia RAND Corporation Virginia Tech Virginia Tech
Despite significant innovations in IT security products and research over the past 20 years the information security field is still immature and struggling Practitioners lack the ability to properly assess cyber risk and decision-makers continue to be paralyzed by vulnerability scanners that overload their staff with mountains of scan results In order to cope firms prioritize vulnerability remediation using crude heuristics and limited data though they are still too often breached by known vulnerabilities for which patches have existed for months or years And so the key challenge firms face is trying to identify a remediation strategy that best balances two competing forces On one hand it could attempt to patch all vulnerabilities on its network While this would provide the greatest coverage of vulnerabilities patched it would inefficiently consume resources by fixing low-risk vulnerabilities On the other hand patching a few high-risk vulnerabilities would be highly efficient but may leave the firm exposed to many other high-risk vulnerabilities Using a large collection of multiple datasets together with machine learning techniques we construct a series of vulnerability remediation strategies and compare how each perform in regard to trading off coverage and efficiency We expand and improve upon the small body of literature that uses predictions of published exploits by instead using exploits in the wild as our outcome variable We implement the machine learning models by classifying vulnerabilities according to high- and low-risk where we consider high risk vulnerabilities to be those that have been exploited in actual firm networks
Keywords vulnerability management exploited vulnerability CVSS security risk management machine learning precision recall
Acknowledgements The authors would like to sincerely thank Kenna Security and Fortinet for sharing their data
Introduction
A critical challenge for many modern organization is understanding how to minimize the cost of
managing and protecting its information assets and business systems A core component of this challenge
is adopting a vulnerability management process that can detect and remediate known vulnerabilities1
Unfortunately despite decades of research and technical innovations there have been few advances in
remediation practices Given that firms will always have more exposed vulnerabilities than resources to
fix them firms struggle trying to develop and apply a remediation strategy that will optimally patch those
vulnerabilities that pose the greatest risk while also deprioritizing those vulnerabilities that pose the
lowest risk
In theory a firm seeks to balance two competing forces On one hand it could attempt to patch all
vulnerabilities identified on its network which would provide the greatest coverage of vulnerabilities
patched but would inefficiently consume resources to fixing vulnerabilities that pose a lower risk On the
other hand the firm could patch a small set of high-risk vulnerabilities While this strategy might be
highly efficient many other potentially high-risk vulnerabilities may remain exposed In practice most
firms are not sophisticated about managing this tradeoff and use heuristic strategies to prioritize their
remediation efforts for example a common approach is to remediate all vulnerabilities above a certain
severity score However many of the common heuristics used by firms have been found to be
sub-optimal (Dey Lahiri and Zhang 2015 Beattie et al 2002) and in some cases no better than
randomly choosing vulnerabilities to remediate (Allodi and Massacci 2014)
One of the key reasons the current approaches are ineffective is that firms cannot effectively assess
whether a given vulnerability poses a meaningful threat For instance prior work suggests that of all the
publicly known vulnerabilities only 10-15 actually ever have a known exploit written for them and
even fewer still are ever weaponized as part of hacking toolkits (Bozorgi et al 2010) An even smaller
proportion of vulnerabilities are ever targeted against an organization in the wild Sabottke Suciu and
Dumitras (2015) find that as few as 14 of published vulnerabilities have exploits which have been
observed in the wild Given that so few vulnerabilities are actually a focus for attackers in the real world
a promising approach towards remediation is to identify vulnerabilities which are likely to be actually
exploited and therefore prioritize firm efforts towards remediating those vulnerabilities first
1 We are not concerned with zero-day vulnerabilities in this paper
Because an exploit observed in the wild is the most relevant proxy for the probability that an exposed
vulnerability can be used to compromise a firmrsquos network our focus in this manuscript is on building
predictive models that can identify an exploited vulnerability
We start by generating ground truth data of whether a vulnerability has an exploit observed in the wild
We aggregate data from a variety of sources including a private dataset generated by a partner security
firm that monitors more than 100000 corporate networks (almost 200 billion observations of network
traffic) To our knowledge ours is the most comprehensive ground truth data used in this kind of
prediction effort and the only one to rely on data from a diverse set of real-world intrusion detection
systems Notably we observe exploits in the wild for 55 of vulnerabilities in our dataset compared to
14 in prior works We also collect a novel set of features for prediction for example we text mine
detailed descriptions of each vulnerability to extract 191 tags (eg ldquobuffer overflowrdquo ldquodenial of servicerdquo)
that are included as features in our prediction model Combining this unique dataset with gradient boosted
trees we build a predictive model with exploits in the wild as the target variable
The combination of a more comprehensive measure of exploits in the wild and novel features for
prediction results in a model that can effectively identify vulnerabilities with a high risk of exploitation in
the wild Our model achieves an accuracy of 945 (with the ROC AUC of 091) and produces a significant
lift in prediction coverage and efficiency compared to prior work (as shown in Figures 1a and 1b)2
2 False Positive Rate (FPR) and True Positive Rate (TPR)
Figure 1 a) ROC curve of our model output and b) comparison of exploit prediction models (Sabottke
Suciu and Dumitras 2015)
More importantly the lift in prediction accuracy that our model provides significantly improve the
efficiency of remediation strategies Informed by our prediction model a firm seeking broad coverage of
vulnerabilities that are exploited in the wild (eg 70) can achieve this by remediating only ~7900
vulnerabilities On the other hand this same level of coverage would require the remediation of more than
3 times the vulnerabilities using both comparable heuristic approaches (~34000) and ML models built on
the features utilized by prior works (~30000) This reduction in the number of vulnerabilities that a firm
needs to remediate is due to a dramatic decrease in the number of false positives remediated under an
approach informed by our model
Our work contributes to the literature on the economics of information systems and computer science
literature on vulnerability remediation In addition we believe this work has significant implications for
decision makers when assessing cyber security risk to include firms federal agencies and national
security policy makers
In further work we will examine more deeply the mechanics behind our model identify which features
are most important to predicting exploits in the wild and generate predictive models for important subsets
of vulnerabilities (eg based on the most popular vendors)
The next section discusses related literature followed by a description of the datasets used in this
research We then present the results from 3 separate vulnerability remediation strategies using simple
rule-based approaches followed by a full machine learning prediction model We conclude with a
discussion on limitations and conclusion
Related Literature
This paper draws on a body of work focused on the economics of information security Our work is
particularly relevant to a stream of research evaluating the efficiency of vulnerability remediation a key
function related to how organizations proactively guard against security incidents This stream of research
includes evaluations of the appropriateness of strategies for identifying new vulnerabilities and
disseminating that information to relevant stakeholders (Kannan and Telang 2005 Ransbotham Mitra
and Ramsey 2012 Cavusoglu Cavusoglu and Raghunathan 2007 Arora Telang and Xu 2008) the
design of incentives and liability with respect to vulnerability remediation (August Dao and Kim 2019
August and Tunca 2011 Cavusoglu Cavusoglu and Zhang 2008) and the efficacy of strategies that firm
take when attempting to prioritize the vulnerabilities they address (Dey Lahiri and Zhang 2015 Beattie
et al 2002 Allodi and Massacci 2014) A consistent finding in this stream of research is that the status
quo for how organizations address vulnerability remediation is often suboptimal and has significant room
for improvement For example Allodi and Massacci (2014) evaluate the effect on exploit risk of
prioritizing vulnerabilities with high severity scores (a common practice in organizations) is equivalent to
randomly selecting vulnerabilities to address
Our work also relates to an emerging body of research coupling machine learning methods with diverse
feature sets drawn from information security contexts and explores the value of prediction for information
security management (Muumlnz Li and Carle 2007 Lakhina Crovella and Diot 2004 Garcia-Teodoro et
al 2009 Lakhina Crovella and Diot 2004) This literature holds significant potential value for a few
reasons First information security contexts are marked by considerable technical and managerial
uncertainty The management of this uncertainty is exacerbated by the limited resources that most
organizations dedicate to security Second there are long-standing challenges with properly leveraging
massive collections of data (network traffic data user logs etc) that hold within them relevant insights
for efficiently managing current and future security risks For instance current tools are often inadequate
at prioritizing and identifying key risks and often inundate security professionals with too many alerts and
false alarms As a result critical warnings are either never generated or lost in a sea of other often less
important warnings Third vulnerabilities may be unknown to organizations (eg zero days) and thus
difficult to identify with standard approaches In these cases machine learning methods (eg those
focused on anomalous pattern detection) can identify new attacks by recognizing changes in network or
user behavior (Garcia et al 2009 Muumlnz Li and Carle 2007)
A nascent stream in this body of work most directly relates to our work and combines machine learning
approaches with a variety of datasets in order to reduce the uncertainty surrounding exploit risk of
disclosed vulnerabilities (Bozorgi et al 2010 Sabottke Suciu and Dumitras 2015 Edkrantz and Said
2015 Bullough et al 2017) While these works start to bridge the gap between vulnerabilities and the
real-world risk they present to systems the majority of these works (with the exception of Sabottke
Suciu and Dumitras 2015) focus on vulnerabilities with a published exploits as opposed to an exploit
observed in the wild This is because predicting actual exploits in the wild remains a difficult prediction
problem In particular and as we noted previously exploits in the wild are rare Of all the vulnerabilities
that are disclosed only a small subset have written exploits Even fewer still have exploits which are
weaponized and become available as part of hacking toolsets Smaller still is the proportion of exploits
that are observed in use in the real world (eg on corporate networks) For example prior works find that
less than 14 of disclosed vulnerabilities are observed in the wild
This raises two notable problems for these prediction efforts First classification methods have trouble
disentangling rare events and require rich feature sets to differentiate vulnerabilities with high risk of
exploit from more benign vulnerabilities Second there is limited ground truth data on which exploits are
actually being levied against organizations For example Sabottke Suciu and Dumitras (2015) utilize
available signature databases from Symantec to identify vulnerabilities likely to be in the field but these
data have notable limitations as they are not based on actual network traffic from corporate networks and
only capture vulnerabilities in Microsoft products As we discuss in the following section a key
contribution of our work is to address these data limitations to build a more accurate and usable prediction
model for vulnerability remediation We do so by leveraging a unique set of features for prediction and
amalgamating data sources to more comprehensively capture exploits that exist in the wild
Data
This paper leverages multiple datasets collected in partnership with Kenna Security a large US-based
vulnerability and threat management company3 As a foundation we use a dataset of vulnerabilities
published by MITRErsquos Common Vulnerability Enumeration (CVE) effort between 2009 and 2018 The
CVE list is widely known and is the authoritative source of publicly known vulnerabilities MITRErsquos
enumeration includes a unique identifier (CVE number) a short free-text description and a list of
references to additional details of the vulnerability (in the form of URLs) After cleaning and including
only valid and fully documented vulnerabilities this dataset contains over 75k observations While CVE
data exists for years prior to 2009 and past 2018 we limit the sample for the availability of data across all
categories of features
We also collect additional information for each CVE We use NISTrsquos National Vulnerability Database
(NVD) to gather the vulnerability score and vulnerability characteristics as defined by the Common
Vulnerability Scoring System (CVSS) We also collect the Common Platform Enumeration (CPE)
information which provides a standard machine-readable format for encoding names of IT products
platforms and vendors
Next we retrieved the descriptive text from the list of references present in each CVE We then extracted
common multiword expressions from the raw text using Rapid Automatic Keyword Extraction (Rose et
3 See httpwwwkennasecuritycom
al 2010) and manually culled and normalized a list of 191 tags encoded as binary features for each
vulnerability
For each vulnerability we also gather real-world information about its prevalence and exploitability First
we gather information about whether exploit code was written and published for it and then whether the
vulnerability was exploited in real-world attacks These are related but not identical data points The
former relates only to vulnerabilities for which exploit code has been written (but not used) and the latter
relates to actual exploits observed in (at least attempted) malicious attacks Since there is no authoritative
or complete source of exploit information exploit data were assembled across many sources Data
relating to exploits found in the wild were collected from the collective intelligence of FortiGuard Labs4
which draws from Fortinetrsquos vast array of devicessensors collecting billions of threat events and incidents
observed in live production environments around the world Evidence of exploitation was also collected
from SANS Internet Storm Center Secureworks CTU Alienvaultrsquos OSSIM metadata and Reversing
Labs metadata Information about written exploit code comes from Exploit DB multiple exploitation
frameworks (Metasploit D2 Securityrsquos Elliot Kit and Canvas Exploitation Framework) Contagio
Reversing Labs and Secureworks CTU In total we acquired 4183 observations of unique exploits used
in the wild and 9726 observations of written exploit code
Finally through Kenna Security we obtained a count of the prevalence of each vulnerability derived from
scans of hundreds of corporate (customer) networks derived from vulnerability scanner information This
rich feature-set of real-world data is used to enhance the performance of the models
Note that we removed those features that were sparsely populated with zero or near-zero variance For
binary variables near zero-variance was set at a threshold 05 and so features with less than 05
unique values were removed Summary information for these data are shown in Table 1
Table 1 Data Summary
Data Type Source(s) Observations(n) Features(p)5
CVE Number6 Mitre CVE database 2009-2018 75976 -
CVSS score7 NISTrsquos NVD 75423 20
4 See httpsfortiguardcom 5 This refers to the number of variables collected per data source 6 The CVE number is just an identifier to tie disparate data sets and was not used in any model 7 The version 2 base score temporal score and the 6 base metrics each with 3 values per metric
Products affected8 NISTrsquos CPE 75582 43
Vendor affected9 NISTrsquos CPE 75582 26
Reference Lists MITRErsquos CVE list 75976 31
Vulnerability Tags Text Scraped from referenced URLs 68491 83 10 listed in MITRErsquos CVE list
Exploitation observed in the wild
FortiGuard Labs SANS Internet Storm Center Securewords CTU Alienvaults OSSIM metadata and Reversing Labs metadata
9726 1
Exploit code published
Exploit DB exploitation frameworks (Metasploit D2 Securityrsquos Elliot Kit and Canvas Exploitation Framework) Contagio Reversing Labs and Secureworks CTU
4183 4
Vulnerability prevalence data
Kenna Security 35405 1
Next we highlight three of the key data sources used in our prediction models CVSS scores published
exploits and reference tagging
CVSS
The Common Vulnerability Scoring System (CVSS v2) was first developed in 2003 and has become an
international11 and de facto standard for measuring the severity of a vulnerability CVSS produces a
numeric score between 0 (lowest severity) and 10 (highest severity) and is fundamentally an ordinal scale
based on 6 immutable characteristics of a vulnerability and is independent of any user environmental
configurations security controls or known exploits Figure 2 shows descriptive information regarding the
distribution of vulnerabilities by CVSS (v2) score In addition for each integer range we show the
8 Initially we constructed a dataset of 28647 product names but reduced this to 43 features that exceeded threshold for determining near zero-variance 9 Initially we constructed a dataset of 11554 attributes but this was again reduced to the 26 most common without near-zero variance 10 Initially we constructed a dataset of 191 commonly use expressions but this was again reduced to the 83 most common without near-zero variance 11 ITU-T X1521
proportion of vulnerabilities that have been exploited For example of all vulnerabilities 4686 were
given a score of 10 of which almost 17 of which were observed to be exploited
Figure 2 Exploited vulnerabilities by CVSS severity
Visual inspection shows that vulnerabilities with a CVSS score of 9 or 10 have a higher proportion of
exploited vulnerabilities relative to the base rate of 55 Also just under half of all exploited
vulnerabilities have a CVSS score of 9 or higher
Published Exploits
As mentioned we consider published exploits to be software code posted publicly and designed to
compromise a weakness in another software application while exploits in the wild are instances of this
code observed to be targeted at actual corporate networks There is an important relationship to note
between published exploits and exploits found in the wild as shown in Figure 3
Figure 3 Published exploits vs exploits in the wild
First notice that overall our dataset contains 97k published exploits and 42k observed exploits in the
wild That is about 128 (97k 76k) of all vulnerabilities between 2009 and 2018 had published exploit
code while only about 5 (42k 76k) of all vulnerabilities were exploited in the wild Further only
about half of all exploited vulnerabilities (21k) have associated published code This is in itself is an
important finding because it suggests the need for an improved approach to vulnerability remediation
Specifically previous research has used published exploits as the outcome target while exploits in the
wild represents what we believe is the preferred outcome measure A table of results for all years is
provided in the Appendix
Reference tagging
Reference tags as used in our data are collected by a multistep process We first begin by using the text
description from MITRErsquos CVE list then scrape the text from the URLs listed in the references We then
extract ldquomulti-word expressionsrdquo from the text and then manually curate a list of multi-word expressions
Note that other research uses a simple ldquobag of wordsrdquo (single word frequencies independent of context)
approach The result is tagging vulnerabilities with expressions like ldquocode executionrdquo ldquodirectory
traversalrdquo ldquosql injectionrdquo and ldquodenial of servicerdquo
Our justification for identifying the multi-word expressions is that there is a significant difference in
exploiting a ldquomemory corruptionrdquo vulnerability and a ldquodouble free memoryrdquo vulnerability Using
multi-word expressions enables us to isolate those two concepts into 2 distinct features
Additionally we found that the brief text descriptions in MITRErsquos CVE list did not adequately capture all
the complexities behind each vulnerability By scraping the referenced websites in each CVE we expect
to achieve a more complete text descriptions of attributes that may be sought out and exploited by
attackers (eg authenticated localremote labels and phrases that describe the vulnerability itself and the
impact) The use of the Rapid Automatic Keyword Extraction (Rose et al 2010) technique along with
manual curation was used to tag concepts within each vulnerability and is expected to outperform
previous Figure 4 shows a random selection of 20 tags from the CVE references along with the overall
frequency (text at the top of each bar) and the proportion of vulnerabilities with that tag that were
observed to be exploited in the wild After removing tags with near-zero variance our final reference tag
feature set has 83 individual tags
Figure 4 Prevalence and exploitation of multiword expressions (20 randomly sampled shown)
Next we describe the model evaluation criteria and machine learning configuration
Model Development
Exploited in the wild as the Outcome Measure
Before we describe the modeling approach we first describe what we mean by risk and therefore how we
classify a high-risk vulnerability Many information security best practices including the US-based
NIST recognize that risk is a combination of threat (capability and intent of the threat actor) vulnerability
(weakness or exposure) of the targeted system and the impact (consequence or disruption) to the
organization conditional on a successful attack (See Figure 3 p12 NIST SP 800-30) In this research we
seek to develop vulnerability remediation strategies that are agnostic to individual firms and so we
restrict our definition of risk by abstracting away firm-specific criteria such as a firmrsquos security controls
and impact to the organization As a result for the purpose of this article our use of risk reflects threat
only -- the exposure posed by an exploitable vulnerability
As mentioned while previous work uses published exploits we believe this is a premature measure and
that the most appropriate measure of threat relates to whether a vulnerability has actually been exploited
in the wild and if it has we then consider the vulnerability to pose a high risk to the organization
Evaluation criteria
Throughout our analysis we will evaluate the performance of the models along four dimensions
coverage efficiency accuracy and level of effort
Coverage (recall) and efficiency (precision) are two common evaluation criteria used in information
theory and machine learning (classification) models In our context coverage measures the completeness
of remediation For example of all vulnerabilities that should be remediated what percentage was
patched if 100 vulnerabilities are being exploited and yet only 15 are remediated the coverage of this
prioritization strategy is 15 Coverage is represented mathematically as the true positives divided by the
sum of the true positives and false negatives or TP (TP + FN) and is maximized as the number of false
negatives tends to zero
On the other hand efficiency measures the optimality of remediation efforts Of all vulnerabilities
remediated what percentage should have been addressed For example if we remediate 100
vulnerabilities but only 15 are ever exploited the efficiency of this strategy would be 15 The other
85 represents resources that would have been better spent elsewhere Efficiency is represented
algebraically as true positives divided by the sum of the true positives and false positives or TP (TP +
FP) and is maximized as the number of false positives tends to zero
The ideal strategy of course achieves 100 coverage and 100 efficiency (ie only patch those that you
need to and no more) but a trade-off exists between the two A strategy that prioritizes only high-risk
vulnerabilities may have a good efficiency but it comes at the price of low coverage because many
vulnerabilities with existing exploits have a low severity score Conversely we could improve coverage
by remediating more vulnerabilities with high severity scores but suffer in efficiency due to fixing
vulnerabilities that were never exploited and therefore pose lower risk
Accuracy measures the overall correctness of predictions Accuracy is the sum of the true positives and
negatives divided by the sum of samples or (TP + TN) (TP + TN + FP + FN) 12
A given set of coverage and efficiency parameters uniquely defines the performance of a remediation
strategy What this does not explicitly communicate however is the number of vulnerabilities that the
organization would need to patch in order to satisfy that strategy Therefore we define level of effort as
one measure of the cost to a firm from that remediation strategy13
Basic and machine learning models
In the next section we explore 3 distinct vulnerability remediation strategies that firms may employ Each
strategy uses a different set of features (ie distinct independent variables) and for each strategy we first
compute the outcome parameters (coverage efficiency accuracy and the level of effort) from a simple
12 This particular metric can create misleading results when the data is imbalanced such as we have in the exploitation data Since only 55 of our vulnerabilities have been observed exploited in the wild a simple model of remediating nothing yields 945 accuracy 13 Certainly this is an imperfect measure of the cost of patching to firm because of the many efficiencies of scale involved in enterprise patch management
rule-based approach and then compare those results to a machine learning model using the same feature
sets (but which computes additional variable interactions)
All machine learning models are gradient boosted trees generated with Extreme Gradient Boosting
(XGBoost) (Chen and Guestrin 2016) We also explored using the Random Forest and linear SVM
algorithms However with the area under the precision-recall curve being 051 for random forest and
0494 for the linear SVM we selected XGBoost as our final model with the AUC of 05514 Because of
the extreme class imbalance we down-sampled (Kubat and Matwin 2000) the majority class during
training However when evaluating the models we use the entire (unbalanced) test sample Because of the
sparseness of some features we performed 5-fold stratified cross-validation repeated 5 times to limit
possible over-fitting in the training Since each model produces a probability that a particular sample will
or will not be exploited-in-the-wild a cutoff must be selected to classify the data This cutoff is tunable in
a way that can balance efficiency vs coverage We select a cutoff value which maximizes the F1 score
(Chinchor 1992) which is the weighted harmonic mean of coverage and efficiency
Feature-Based Remediation Strategies
CVSS Score
A primary aspect of vulnerabilities often considered during remediation decisions is the severity or impact
that a vulnerability would have if it were successfully exploited Assigning remediation efforts based on
CVSS score has become a familiar and popular means of prioritizing patching especially given how
CVSS considers scores from 7-89 to be ldquohigh severityrdquo while scores above 90 are critical For example
The US Department of Homeland Security (DHS) issued a binding operational directive to federal
agencies requiring them to patch critical vulnerabilities within 15 days and high severity ones within 30
days15 In addition the Payment Card Industry Data Security Standard (PCI-DSS) requires that all
merchants remediate vulnerabilities with a CVSS score above 40 (PCI 2018)
The prediction results for a firm adopting a remediation strategy driven by CVSS score including the
machine learning model which accounts for interactions are shown in Table 2 For brevity we only show
tabular results for 4 rules-based strategies while we display full results in Figure 5
Table 2 CVSS prediction results
14 Note the area under the curve metrics here are for the precision-recall curve not the receiver operating characteristic (ROC) curve The AUC of the ROC curve for XGBoost is 091 15 See httpscyberdhsgovbod19-02
Strategy Accuracy
CVSS 10+ 9040
CVSS 9+ 8470
CVSS 8+ 7240
CVSS 7+ 5700
CVSS 6+ 5180
CVSS 5+ 3410
CVSS 4+ 1020
ML Model 853
Efficiency
1680
1780
1210
900
830
690
570
1880
Coverage
1880
4870
6360
7430
7660
8710
9850
5020
Level of Effort
( vulns)
4686
11477
21990
34530
38674
52906
71908
11153
Efficiency Coverage
by Chance by Chance
553 620
553 1520
553 2910
553 4570
553 5120
553 7000
553 9510
553 1480
Note Efficiency by Chance and Coverage by Chance are the overall results from a strategy of randomly selecting vulnerabilities
to remediate
The machine learning (ML) model for this strategy uses 20 features of CVSS for training and is shown in
Figure 5 The CVSS feature set includes each of the base metrics as defined in CVSS (version 2) attack
vector access complexity authentication and 3 impact metrics each for confidentiality integrity and
availability16
16 Attack vector refers to the network proximity required by an attacker in order to exploit a vulnerability (eg differentiating whether an attacker can launch a single packet from across the internet or whether she requires physical access to the vulnerable device) Authentication refers to the level of additional authentication privileges the attacker requires in order to exploit the vulnerability (eg must the attacker authenticate to the vulnerable system before attack or can she execute the attack anonymously) Access complexity considers whether the attacker must rely on actions beyond her control (such as winning a computing race condition) in order to carry out the attack The 3 impact metrics measure the degree of loss by the system Further information can be found at httpsnvdnistgovvuln-metricscvssv2-calculator
Figure 5 CVSS prediction results
Note Level of effort refers to the numbers of vulnerabilities to be patched by the given strategy
These results suggest that a rule-based strategy of remediating all vulnerabilities with CVSS 7 or higher
would achieve coverage of slightly over 74 with an efficiency of 9 and accuracy of only 57 This
appears to be the best balance among CVSS-based strategies even though it would still result in
unnecessarily patching 31k (76k total - 35k patched) unexploited vulnerabilities Further note that the
PCI-DSS mandate requires that vulnerabilities scoring 4+ be patched which is equivalent to an efficiency
of random patching provides only slightly better coverage and at the cost of fixing 72k vulnerabilities
While some research shows that a strategy of patching by CVSS score is no better than random chance
(Allodi and Massacci 2014) our results show that a strategy of patching CVSS score 9+ performs
significantly better than random chance
While the ML model performs better than a strategy of patching by any single score the differences are
not dramatic Indeed for most all CVSS strategies the machine learning model performs only marginally
better
Next we examine a strategy of patching according to whether an exploit involving the vulnerability has
been published publicly
Published Exploits
It is a relatively recent capability that organizations are able to record information about vulnerabilities
that have been exploited in the wild Prior to that and a resource that is still quite valuable practitioners
had relied on datasets either describing how to exploit a vulnerability or providing working or
proof-of-concept code to exploit known vulnerabilities One may well consider that these ldquopublishedrdquo
exploit repositories are reasonable proxies (predictors) for exploits found in the wild and absent ground
truth data (ie complete information about all exploits) firms might employ a remediation strategy based
off of published exploits Indeed as described above a number of research efforts have used published
exploits as their outcome target variable
In Table 3 we provide prediction results for 3 exploit code repositories (Elliot Exploit DB and
Metasploit) and our machine learning model
Table 3 Published Exploits prediction results
Strategy Accuracy Efficiency Coverage
Elliot 9435 3440 230
Exploit DB 8678 1790 3880
Metasploit 9489 6320 1820
ML Model 9536 7050 2790
Level of Effort Efficiency Coverage by
(vulns) by Chance Chance
285 553 040
9055 553 1200
1208 553 160
1657 553 220
We first observe that of the rules-based approaches the Exploit DB strategy has the best coverage but
suffers from considerably poor efficiency while Metasploit performs exceptionally well in efficiency
(highest out of all the rules-based approaches) with considerable reduction in coverage and drastically
smaller level of effort required to satisfy the strategy The Elliot DB strategy while not efficient as the
Metasploit strategy incurs a relatively tiny level of effort of just 285 vulnerabilities that would need to be
patched These same results are also presented graphically in Figure 6
Figure 6 Published Exploits prediction results
Note Level of effort refers to the numbers of vulnerabilities to be patched by the given strategy
Visually it is even more clear how well the Metasploit strategy performs relative to the other rules-based
models suggesting that vulnerabilities (and exploits) that appear in this repository are very likely to be
seen in the wild On the other hand exploits that appear in Exploit DB require a great deal more coverage
for little efficiency gain
There are important distinctions between these exploit repositories which may help explain these
variations Exploit DB is an online repository of scripts and source code for exploits Execution of the
exploits listed in exploit DB often require a minimal level of technical ability such as knowledge of how
to edit and execute a scripting language or knowledge to compile source code to get a working exploit
The D2 Elliot Web Exploitation Framework (Elliot) and the Metasploit framework are both applications
that can be installed and each contains a set of working exploit modules Unlike Exploit DB the technical
ability required to exploit a target system is lower since the exploit code is easily executable through a
user interface Those differences undoubtedly affect their placement on the efficiencycoverage metrics
Given the data at hand itrsquos difficult to parse out if the Metasploit community is talented at identifying
vulnerabilities that will be exploited in the wild or if vulnerabilities are exploited in the wild because the
modules exist in an exploitation framework with a user interface But it is clear that over 60 of the
modules associated with CVEs are observed to be exploited in the wild
In addition an interesting artifact emerges from the machine learning curve of Figure 6 The discontinuity
is likely an artifact of a model built on a small number of binary variables There are very few variations
in the way the binary variables interact and the left side from the discontinuity is likely revealing a
handful of vulnerabilities with unique mixtures of the variables This would explain why the individual
cross-validation folds fan out as precision increases (gray lines in Figure 6) - a small number of unique
combinations may appear unevenly in either the training or testing data set creating the variation
Nevertheless notice how this ML model performs better than any of the individual strategies achieving a
better balance of coverage and efficiency
The final remediation strategy presented below considers patching according to select keywords found in
the vulnerability description
Reference tagging
Finally we consider a remediation strategy consisting of commonly used keywords as provided in the
CVE reference links Keywords can provide a shorthand insight into the characteristics and potential
impact from particular sets of vulnerabilities beyond what is captured by CVSS And so these become
useful heuristics upon which to based a remediation strategy
Rather than show the full curated 83 unique reference tags in Table 4 we selected 4 tags but all 83 tags
are represented in Figure 7
Table 4 Reference tagging prediction results
Strategy Accuracy Efficiency Coverage
memory corruption 8850 1548 2400
code execution 7080 1225 6950
remote 2940 677 9200
buffer overflow 8740 1347 2350
ML Model 8880 235 459
Level of Effort Efficiency Coverage
(vulns) by Chance by Chance
6480 553 860
23729 553 3140
56841 553 7520
7304 553 970
14841 553 1960
Perhaps unsurprisingly all the rule-based approaches are relatively inefficient Tags like ldquocode executionrdquo
and ldquoremoterdquo (ie ldquoremotely exploitablerdquo) achieved relatively similar efficiency but at a much greater cost
of coverage For example a firm would need to remediate 24k vulnerabilities under the code execution
strategy while only 73k vulnerabilities under the buffer overflow strategy -- for the same level of
efficiency The results are shown graphically in Figure 7
Figure 7 Reference tagging prediction results
Note Level of effort refers to the numbers of vulnerabilities to be patched by the given strategy
Overall like the other rules-based strategies focusing on individual features (whether CVSS published
exploit or reference tags) as a decision point yields inefficient remediation strategies This holds true for
all of the individual multi-word expressions And as with all other strategies the machine learning model
using the full set of multi-word expressions out-performs the simple strategies with a better balance
between efficiency and coverage and with less effort
The memory corruption and buffer overflow strategies likely enjoy higher (or approximately equal)
efficiency for lower coverage possibly because it is these vulnerabilities that offer the most attractive
targets for malicious actors Interestingly if it were true that buffer overflow vulnerabilities were also the
most severe (in terms of impact and exploitability) then one might expect there to be a strong correlation
between these two strategies and the CVSS 9 or 10 strategies Indeed as shown in Figure 7 there is some
regional proximity of these strategies suggesting that a rules-based approach based on any one of these
approaches is approximately equivalent Although a CVSS 10 strategy will perform better than a CVSS 9
or either memory corruption and buffer overflow strategies
We provide more explanation and discussion of these strategies and our full model next
Full Machine Learning Strategy
Wersquove seen in the rule-based models that simple heuristics donrsquot perform well and while machine
learning models based on individual classes of features outperform the rule-based approach they can be
improved with a machine learning approach using all data available Therefore we construct a machine
learning model using the full data set outlined in Table 1 using 75585 unique CVEs and 209 features
from each vulnerability
Unsurprisingly the coverageefficiency curve for the full model outperforms the reduced-feature models
and all of the simple heuristic models as shown in Figure 8
Figure 8 Prediction performance of all models
Observe how each of the three feature-based models bear approximately the same slope and position
above about 50 coverage with the CVSS model performing slightly less efficiently Below 50
coverage on the other hand while the Reference Tags and CVSS models continue along similar treds the
Published Exploits model becomes extremely efficient even approaching the Full Model
Comparing the coverage and efficiency output from each strategy has been useful but does not provide a
complete picture The decision to remediate a vulnerability will be associated with a very specific level of
effort by the firm (eg the effort in patching) Unfortunately there is no single metric by which to evaluate
a solution and firms are not homogenous among capabilities resources and risk tolerance And so one
approach is to optimize along both coverage and efficiency (which is done by maximizing the F1
measure) But what if the firm has few resources and needs to be more efficient What if the firm wants to
improve coverage at the expense of efficiency
We consider these what-if prospects by creating a ldquohighly efficientrdquo scenario (which doubles the weight
placed on efficiency in the F-measure) and a ldquobroad coveragerdquo scenario (which doubles the weight of
coverage in the F-measure) Any emphasis on one comes at a cost of the other and the level of effort
follows Table 5 shows the metrics for each scenario
Table 5 Full Model with 3 scenarios
Scenario Accuracy Efficiency Coverage Level of Effort (vulns)
Highly Efficient 945 714 373 2186
Balanced 945 546 530 4058
Broad Coverage 945 368 691 7851
We now compare all heuristic strategies outlined in this document with the model output as shown in
Figure 9
Figure 9 All models 2
Note that almost all of the simple strategies appear in the lower fifth of the diagram (performing below
20 efficiency) suggesting that any vulnerability risk management program relying on simple (single)
characteristics (like vulnerability severity or key phrases) will have acute efficiency problems from
unnecessarily patching many vulnerabilities The consistently low efficiency implies a slow and steady
increase in the level of effort in order to reach broad coverage regardless of the simple decision point
The Full Model on the other hand strictly dominates all other strategies by a considerable amount
Discussion
In this paper we sought to test and evaluate 3 practical vulnerability remediation strategies using CVSS
scores published exploits and attributes of the vulnerability (discovered through multi-word expression
tagging) For each strategy we presented the coverage and efficiency results from a simple rules-based
approach as well as a machine learning model Finally we integrated our rich dataset into a full machine
learning model in order to construct an optimal model
We find that applying machine learning approaches to existing feature sets strictly dominate heuristic
approaches (although sometimes only by a slight margin) This is because most heuristic approaches
make decisions based on one or a limited amount of data points Heuristic approaches cannot possibly
factor in all the information or interaction effects of a more advanced machine learning model
While we constructed our tables with a discrete decision recall that the output of each model is a
probability that a particular vulnerability will (or will not) be exploited in the wild In reality of course
firms face prioritization decisions after each new vulnerability report and enterprise vulnerability scan
Therefore in practice we consider how firm preferences and risk tolerances many vary which we reflect
in our overall strategies of ldquohighly efficientrdquo ldquobalancedrdquo and ldquobroad coveragerdquo We would expect firms
with a lower capacity for remediating vulnerabilities to adopt a ldquohighly efficientrdquo strategy fixing some
proportion of vulnerabilities based on the probability output from the model and maximizing the benefit
from their limited resources As a firm gains experience and capacity they can push towards a balanced
approach While it may require a greater level of effort after each scan this maturity elevates a firm to a
higher rate of coverage Finally the more mature organizations that have the capacity for a higher level of
effort may achieve a higher rate of coverage much more quickly than the other two strategies
Regardless of the capacity and current strategy of an individual firm a machine learning approach will
reduce costs and maintain their existing level of coverage For example if a firm addresses vulnerabilities
that have a proof-of-concept code published in Exploit DB our model will achieve a comparable level of
coverage but at one-quarter the level of effort If the firm is currently addressing vulnerabilities with a
CVSS score of 7 and above the ldquobroad coveragerdquo strategy will achieve comparable coverage but also
with one-quarter of the effort
So far our focus has been on the predictive power of a machine learning approach but we recognize the
importance of interpreting each contribution individually An initial analysis shows the relative
importance of published exploit followed by the prevalence of the vulnerability across the hundreds of
vulnerability scans collected by the security service provider Other important features include the tag
ldquocode executionrdquo (such as a remote code execution flaw) followed by whether a Microsoft reference is
listed in the published CVE the CVSS Base score and finally the number of references listed in the CVE
description
Limitations
We recognize that out results and inferences are limited to the data collected by our data partners and
therefore may not be representative of all firms Specifically the vulnerability scan data are limited to the
commercial and open-source vulnerability scanners used as well as the kinds of software operating in
these networks and therefore may be susceptible to missed observations of exploit data
Throughout this Article we refer to known exploits as ldquoexploits in the wildrdquo but we recognize that this
inference is limited to exploits that have been observed by signature-based intrusion detectionprevention
(IDSIPS) sensors and are limited in their scope First we do not know how many of the non-detected
vulnerabilities did not have signatures generated therefore we could never observe the exploit in the wild
Secondly the IDSIPS may not have had the most up to date signatures and therefore missed some known
exploits The visibility of these sensors is limited to the enterprise networks within which they were
placed and may therefore have missed exploits targeting other networks
Also we do not consider zero day vulnerabilities in this research or exploits against zero day
vulnerabilities given that these vulnerabilities are by definition not observable by signature-based
vulnerability scanners
We acknowledge that our data is a ldquopoint in timerdquo and our knowledge is limited to that point It is
feasible we are training our model to ignore vulnerabilities ldquonot yetrdquo exploited in the wild But given the
massive class imbalance and the massive collection of exploited vulnerabilities (55 of all
vulnerabilities) the influence of mislabeled target data should be minimal
We attempted to make clear that our measure of risk relates to threat only (ie the likelihood that a
vulnerability will be exploited) and does not consider all other factors that determine risk such as the
strength security controls employed by target organizations or the value of the asset or data on that assets
or the actual impact that a successful exploit may cause In effect we provide an estimate of the biggest
exposures to a neighborhood not to the individual houses in that neighborhood Further while there are
many factors that determine the probability of exploit (such as the motivation and capability of the
attacker economic diplomatic or political considerations) we are not able to separately identify these
factors and therefore our outcome measure is simply whether an exploit was observed (or not)
In addition to efficiency and coverage we considered a third measure of evaluation called ldquolevel of
effortrdquo which represented the number of vulnerabilities that the organization would have to patch in order
to satisfy that strategy We realize that this level of effort is notional and does reflect the actual number of
vulnerabilities to be patched for every firm but instead reflects the number of vulnerabilities that a
hypothetical firm would have to patch if it contained as a baseline the total number of vulnerabilities
included in our dataset (76k) While this is a useful number to track in order to gauge the relative effort
between strategies it is not reflective of the total effort for a firm for a number of reasons First the cost
of applying patches is likely not constant across firms and vulnerabilities Certainly firms will have
varying capabilities of acquiring testing and deploying patches across their internal and external
enterprise networks And firms vary in their level of effort required to apply a given patch in terms of
testing and applying throughout their network Some firms may have 10 instances of a given
vulnerability while another firm may have 10000 instances Moreover vendors seldom release a patch
for a single vulnerability but often bundle many fixes up into a single ldquopatchrdquo And so our results may
underestimate the economies of scale that are achieved when firms apply bundled patches
In regard to modeling techniques given the sparseness of some variables and relatively small base rate of
exploits (upon which model identification is achieved) proper prediction and estimation of all features
may be limited We therefore tried to address this by dropping those features which were excessively
sparse and remarking on this where appropriate
Conclusion
The ability to effectively assess the risk of a vulnerability to understand how prevalent it is and to make
inferences about the risk it poses to either a single firm or to sectors of critical infrastructure is an
extraordinarily important matter Indeed it is one of the foundations of information security risk
management domestic protection of critical infrastructure and even national security And it is still
unsolved
Evidence-based vulnerability risk assessment such as the research conducted in this Article has the
power to drive better patching decisions by software vendors who are making their own economic and
political decisions about where to prioritize resources for developing and issuing patches The better
information vendors have about the actual risk to their customers the sooner they can protect us
Our results also provide an opportunity to improve the existing CVSS standard and specifically the
temporal metric group in order to produce a better risk score While the CVSS base score reflects severity
only the CVSS standard also specifies temporal metrics which reflect properties that change over time
such as the threat and exploitability of a vulnerability As such the exploit prediction results in this
research could be used to augment the overall CVSS framework
Our results also are relevant to federal policy makers such as the DHS which is charged with protecting
US federal networks and support protection of US critical infrastructure Our results provide an
opportunity for DHS to integrate evidence-based learning into their threat reports (from CISAUS-CERT)
in order to provide improved measures of risk (and impact) to their constituents Better information about
vulnerability exploits can also be leveraged by them to disseminate throughout their Automated
Information Sharing (AIS) network in order to better protect subscribers
In addition we believe this research can inform the White House National Security Council (NSC) as
well as other countryrsquos governing bodies during deliberations on the use or restriction of zero day
vulnerabilities as part of a Vulnerability Equities Process (VEP) (Romanosky 2019) Central to the
discussions of ldquodefensive equitiesrdquo are questions about the prevalence of vulnerabilities in and therefore
risks to the countryrsquos citizens and businesses
Finally we believe this research will help crystalize the value of information sharing between
organizations Too often information sharing practices and agencies have struggled to demonstrate real
value and prove actual effectiveness to their users Individual organizations themselves are stymied by
legal bureaucratic and technical obstacles Our results therefore provide justification for sharing very
tangible and practical kinds of data (namely evidence of exploits used in the wild) understanding how
they can be analyzed and most importantly understanding what the results mean and what to do about
them The results further help characterize the value of the hundreds of indicators of compromise (IoCs)
that follow from incident reports relative to outcome variables like exploit in the wild
In sum despite the small but growing body of literature on exploit prediction firms and government
agencies have been unable to practically integrate evidence-based wisdom into their decision making
processes We sincerely hope that this and other similar research can better help provide practical
insights into this critical problem of assessing risk
References
Allodi L amp Massacci F (2014) Comparing vulnerability severity and exploits using case-control
studies ACM Transactions on Information and System Security (TISSEC) 17(1) 1
Bozorgi Mehran Lawrence K Saul Stefan Savage and Geoffrey M Voelker (2010) Beyond Heuristics
Learning to Classify Vulnerabilities and Predict Exploits Available at
httpcsewebucsdedu~saulpaperskdd10_exploitpdf Last accessed January 20 2019
Arora A Telang R amp Xu H (2008) Optimal policy for software vulnerability disclosure
Management Science 54(4) 642-656
August T amp Tunca T I (2008) Let the pirates patch an economic analysis of software security patch
restrictions Information Systems Research 19(1) 48-70
August T amp Tunca T I (2011) Who should be responsible for software security A comparative
analysis of liability policies in network environments Management Science 57(5) 934-959
August T Dao D amp Kim K (2019) Market segmentation and software security Pricing patching
rights Management Science In Press
Beattie S Arnold S Cowan C Wagle P Wright C amp Shostack A (2002 November) Timing the
Application of Security Patches for Optimal Uptime In LISA (Vol 2 pp 233-242)
Cavusoglu H Cavusoglu H amp Raghunathan S (2007) Efficiency of vulnerability disclosure
mechanisms to disseminate vulnerability knowledge IEEE Transactions on Software Engineering 33(3)
171-185
Cavusoglu H H Cavusoglu and J Zhang (2008) Security patch management Share the burden or
share the damage Management Science 54(4) 657ndash670
Chen T Guestrin C (2016) XGBoost A Scalable Tree Boosting System KDD rsquo16 San Francisco
CA Available at httpsarxivorgabs160302754 Last accessed February 16 2019
Chinchor Nancy (1992) MUC-4 evaluation metrics Proceedings of the Fourth Message Understanding
Conference 22-29 10311510720641072067
Dey D Lahiri A amp Zhang G (2015) Optimal policies for security patch management INFORMS
Journal on Computing 27(3) 462-477
Garcia-Teodoro P Diaz-Verdejo J Maciaacute-Fernaacutendez G amp Vaacutezquez E (2009) Anomaly-based
network intrusion detection Techniques systems and challenges computers amp security 28(1-2) 18-28
Kannan K amp Telang R (2005) Market for software vulnerabilities Think again Management science
51(5) 726-740
Kubat M amp Matwin Stan (2000) Addressing the Curse of Imbalanced Training Sets One-Sided
Selection Fourteenth International Conference on Machine Learning
Lakhina A Crovella M amp Diot C (2004 August) Diagnosing network-wide traffic anomalies In
ACM SIGCOMM Computer Communication Review (Vol 34 No 4 pp 219-230) ACM
Lakhina A Crovella M amp Diot C (2004 October) Characterization of network-wide anomalies in
traffic flows In Proceedings of the 4th ACM SIGCOMM conference on Internet measurement (pp
201-206) ACM
Muumlnz G Li S amp Carle G (2007 September) Traffic anomaly detection using k-means clustering In
GIITG Workshop MMBnet (pp 13-14)
NIST (2012) Guide for Conducting Risk Assessments SP 800-30 NIST
PCI (2018) Approved Scanning Vendors Program Guide v31 PCI Security Standards Council
Available at httpswwwpcisecuritystandardsorgdocumentsASV_Program_Guide_v31pdf
Ransbotham S amp Mitra S (2009) Choice and chance A conceptual model of paths to information
security compromise Information Systems Research 20(1) 121-139
Ransbotham S Mitra S amp Ramsey J (2012) Are markets for vulnerabilities effective Mis Quarterly
43-64
Romanosky S (2019) Developing an Objective Repeatable Scoring System for a Vulnerability Equities
Process Lawfare Blog available at
httpswwwlawfareblogcomdeveloping-objective-repeatable-scoring-system-vulnerability-equities-proc
ess Last accessed February 19 2019
Rose Stuart amp Engel Dave amp Cramer Nick amp Cowley Wendy (2010) Automatic Keyword Extraction
from Individual Documents Text Mining Applications and Theory 1 - 20 1010029780470689646ch1
Sabottke C Suciu O amp Dumitras T (2015 August) Vulnerability Disclosure in the Age of Social
Media Exploiting Twitter for Predicting Real-World Exploits In USENIX Security Symposium (pp
1041-1056)
Bullough B L Yanchenko A K Smith C L amp Zipkin J R (2017 March) Predicting exploitation
of disclosed software vulnerabilities using open-source data In Proceedings of the 3rd ACM on
International Workshop on Security And Privacy Analytics (pp 45-53) ACM
Edkrantz M I C H E L amp Said A (2015) Predicting exploit likelihood for cyber vulnerabilities with
machine learning Unpublished Masterrsquos Thesis Chalmers Unıversıty of Technology Department of
Computer Science and Engineering Gothenburg Sweden 1-6
Appendix
Exploit in the Wild vs Published Exploit
Table 6 Published exploits vs exploits in the wild (2009-2018)
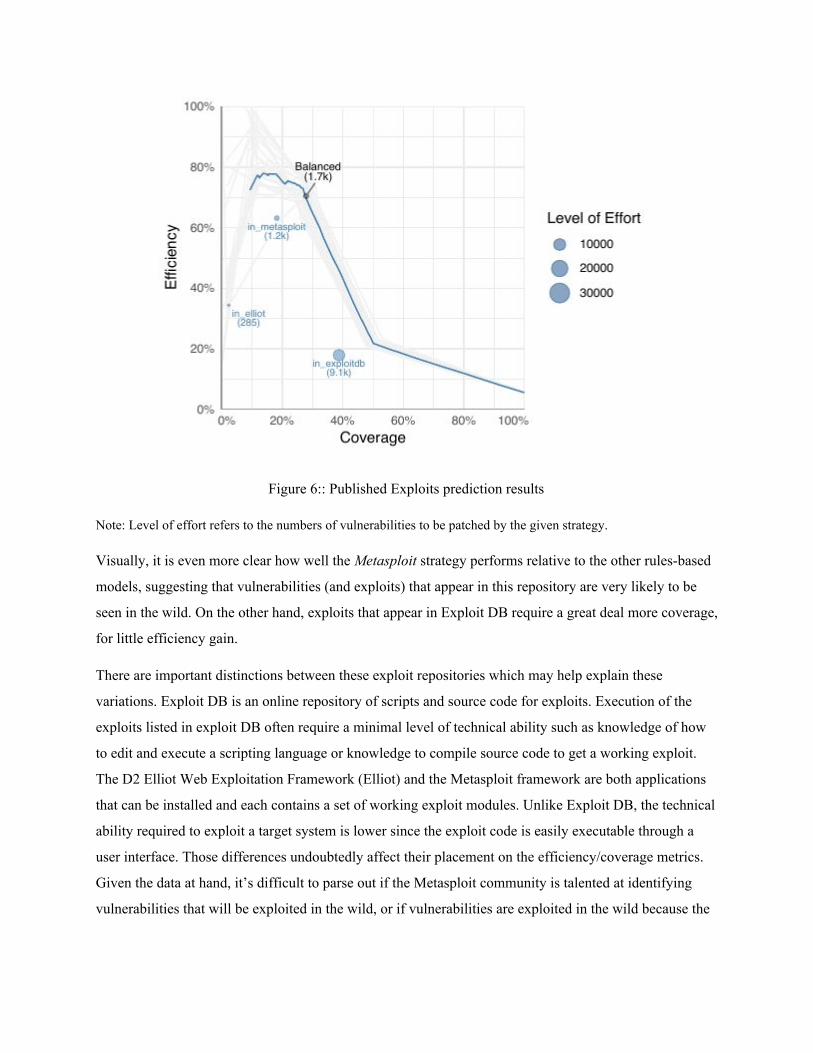
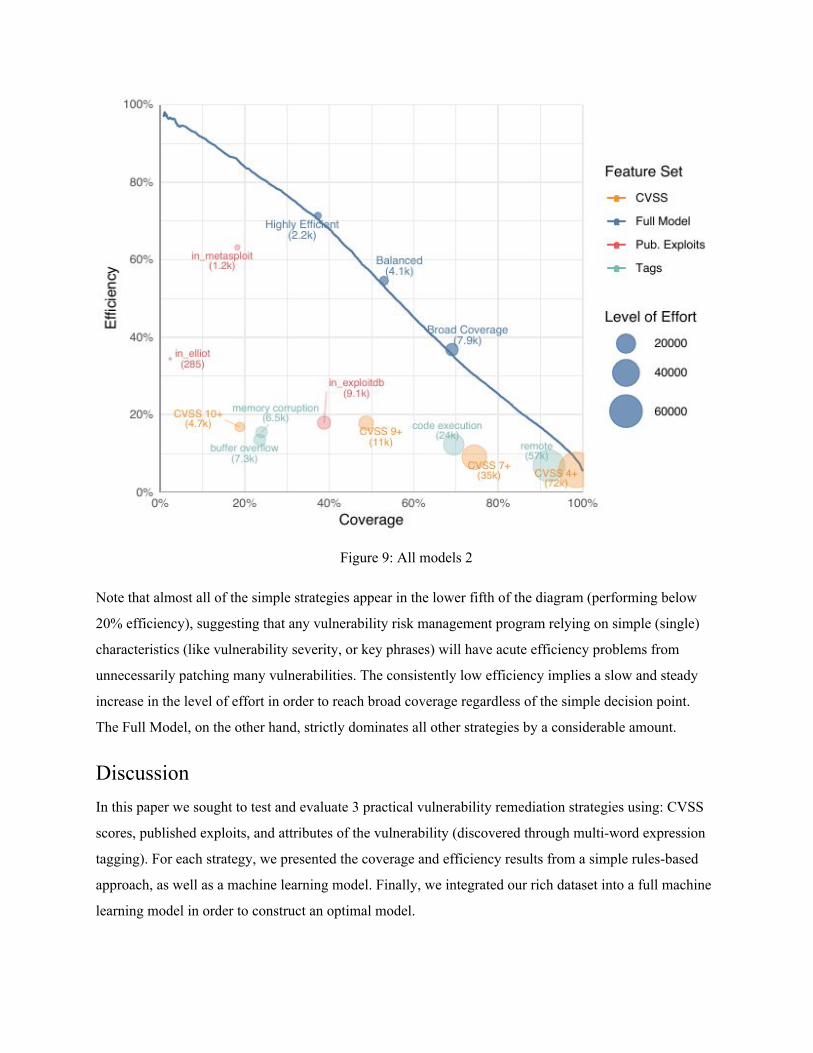
Related Documents