RESEARCH ARTICLE Open Access Improving treatment intensification to reduce cardiovascular disease risk: a cluster randomized trial Joe V Selby 1 , Julie A Schmittdiel 2,9* , Bruce Fireman 2 , Marc Jaffe 3 , Laura J Ransom 4 , Wendy Dyer 2 , Connie S Uratsu 2 , Mary E Reed 2 , Eve A Kerr 5,6 and John Hsu 7,8 Abstract Background: Blood pressure, lipid, and glycemic control are essential for reducing cardiovascular disease (CVD) risk. Many health care systems have successfully shifted aspects of chronic disease management, including population- based outreach programs designed to address CVD risk factor control, to non-physicians. The purpose of this study is to evaluate provision of new information to non-physician outreach teams on need for treatment intensification in patients with increased CVD risk. Methods: Cluster randomized trial (July 1-December 31, 2008) in Kaiser Permanente Northern California registry of members with diabetes mellitus, prior CVD diagnoses and/or chronic kidney disease who were high-priority for treatment intensification: blood pressure ≥ 140 mmHg systolic, LDL-cholesterol ≥ 130 mg/dl, or hemoglobin A1c ≥ 9%; adherent to current medications; no recent treatment intensification). Randomization units were medical center-based outreach teams (4 intervention; 4 control). For intervention teams, priority flags for intensification were added monthly to the registry database with recommended next pharmacotherapeutic steps for each eligible patient. Control teams used the same database without this information. Outcomes included 3-month rates of treatment intensification and risk factor levels during follow-up. Results: Baseline risk factor control rates were high (82-90%). In eligible patients, the intervention was associated with significantly greater 3-month intensification rates for blood pressure (34.1 vs. 30.6%) and LDL-cholesterol (28.0 vs 22.7%), but not A1c. No effects on risk factors were observed at 3 months or 12 months follow-up. Intervention teams initiated outreach for only 45-47% of high-priority patients, but also for 27-30% of lower-priority patients. Teams reported difficulties adapting prior outreach strategies to incorporate the new information. Conclusions: Information enhancement did not improve risk factor control compared to existing outreach strategies at control centers. Familiarity with prior, relatively successful strategies likely reduced uptake of the innovation and its potential for success at intervention centers. Trial registration: ClinicalTrials.gov Identifier NCT00517686 Keywords: Diabetes mellitus, Hypertension, Hyperlipidemia, Cardiovascular diseases, Clinical inertia * Correspondence: [email protected] 2 Division of Research, The Permanente Medical Group, Oakland, CA, USA 9 Kaiser Permanente Division of Research, 2000 Broadway, Oakland, CA 94612, USA Full list of author information is available at the end of the article © 2012 Selby et al.; licensee BioMed Central Ltd. This is an Open Access article distributed under the terms of the Creative Commons Attribution License (http://creativecommons.org/licenses/by/2.0), which permits unrestricted use, distribution, and reproduction in any medium, provided the original work is properly cited. Selby et al. BMC Health Services Research 2012, 12:183 http://www.biomedcentral.com/1472-6963/12/183

Welcome message from author
This document is posted to help you gain knowledge. Please leave a comment to let me know what you think about it! Share it to your friends and learn new things together.
Transcript
Selby et al. BMC Health Services Research 2012, 12:183http://www.biomedcentral.com/1472-6963/12/183
RESEARCH ARTICLE Open Access
Improving treatment intensification to reducecardiovascular disease risk: a clusterrandomized trialJoe V Selby1, Julie A Schmittdiel2,9*, Bruce Fireman2, Marc Jaffe3, Laura J Ransom4, Wendy Dyer2, Connie S Uratsu2,Mary E Reed2, Eve A Kerr5,6 and John Hsu7,8
Abstract
Background: Blood pressure, lipid, and glycemic control are essential for reducing cardiovascular disease (CVD) risk.Many health care systems have successfully shifted aspects of chronic disease management, including population-based outreach programs designed to address CVD risk factor control, to non-physicians. The purpose of this studyis to evaluate provision of new information to non-physician outreach teams on need for treatment intensificationin patients with increased CVD risk.
Methods: Cluster randomized trial (July 1-December 31, 2008) in Kaiser Permanente Northern California registry ofmembers with diabetes mellitus, prior CVD diagnoses and/or chronic kidney disease who were high-priority fortreatment intensification: blood pressure≥ 140 mmHg systolic, LDL-cholesterol≥ 130 mg/dl, or hemoglobinA1c≥ 9%; adherent to current medications; no recent treatment intensification). Randomization units were medicalcenter-based outreach teams (4 intervention; 4 control). For intervention teams, priority flags for intensification wereadded monthly to the registry database with recommended next pharmacotherapeutic steps for each eligiblepatient. Control teams used the same database without this information. Outcomes included 3-month rates oftreatment intensification and risk factor levels during follow-up.
Results: Baseline risk factor control rates were high (82-90%). In eligible patients, the intervention was associatedwith significantly greater 3-month intensification rates for blood pressure (34.1 vs. 30.6%) and LDL-cholesterol (28.0vs 22.7%), but not A1c. No effects on risk factors were observed at 3 months or 12 months follow-up. Interventionteams initiated outreach for only 45-47% of high-priority patients, but also for 27-30% of lower-priority patients.Teams reported difficulties adapting prior outreach strategies to incorporate the new information.
Conclusions: Information enhancement did not improve risk factor control compared to existing outreachstrategies at control centers. Familiarity with prior, relatively successful strategies likely reduced uptake of theinnovation and its potential for success at intervention centers.
Trial registration: ClinicalTrials.gov Identifier NCT00517686
Keywords: Diabetes mellitus, Hypertension, Hyperlipidemia, Cardiovascular diseases, Clinical inertia
* Correspondence: [email protected] of Research, The Permanente Medical Group, Oakland, CA, USA9Kaiser Permanente Division of Research, 2000 Broadway, Oakland, CA 94612,USAFull list of author information is available at the end of the article
© 2012 Selby et al.; licensee BioMed Central Ltd. This is an Open Access article distributed under the terms of the CreativeCommons Attribution License (http://creativecommons.org/licenses/by/2.0), which permits unrestricted use, distribution, andreproduction in any medium, provided the original work is properly cited.
Selby et al. BMC Health Services Research 2012, 12:183 Page 2 of 10http://www.biomedcentral.com/1472-6963/12/183
BackgroundBlood pressure, lipid, and glycemic control are essentialfor reducing cardiovascular disease (CVD) risk. [1-7] Al-though control of these conditions is improving nationally,[8-12] large proportions of patients remain suboptimallycontrolled. Non-adherence to prescribed medications isone reason for poor control. [13-15] “Clinical inertia,” orfailure to advance pharmacotherapy in persons adheringto current medications, is another. [13,16-24]Many health care systems have shifted aspects of
chronic disease management to non-physicians with posi-tive results for risk factor control. [25-28] Using treatmentalgorithms and electronic health information, pharmacists,nurses, or medical assistants can support patient self-management and advance evidence-based pharmacother-apy in collaboration with physicians.In this translational study, we evaluated an enhance-
ment of medical information used by non-physician out-reach staff to further improve treatment intensificationin patients at risk for CVD, who were adherent tocurrent medications but with elevated blood pressure,LDL-cholesterol, and/or hemoglobin A1c values.
MethodsThis six-month intervention (July 1 - December 31, 2008)used a cluster randomized controlled design among enrol-lees of Kaiser Permanente Northern California (KPNC).The unit of randomization was KPNC medical center-based, non-physician, population management outreachteams (n= 8). KPNC is an integrated health care systemproviding comprehensive care to over 3.2 million enrolleesthrough 21 medical centers. KPNC’s Institutional ReviewBoard approved this study, waiving the requirement forindividual informed consent because the interventionrepresented an enhancement to usual population-basedoutreach care.
Study populationThe KPNC PHASE (Preventing Heart Attacks and StrokesEveryday) population registry was identified in 2005 for amanagement program aimed at preventing CVD. [29] Theregistry is refreshed monthly and includes approximately300,000 KPNC members, ages 18–85, at increased CVDrisk because of: diabetes mellitus (DM); prior diagnoses ofcoronary artery disease, cerebrovascular disease, periph-eral artery disease or abdominal aortic aneurysm; and/oradvanced chronic kidney disease (age≥ 50 and GFR< 30or GFR <60 with proteinuria).Medical center-based PHASE outreach teams are com-
posed of a varying mix of clinical pharmacists, registerednurses, and medical assistants across centers. Teamsconduct mail and telephone outreach to improve use ofrecommended medications and risk factor control. PHASEguidelines provide general evidence-based therapeutic
algithms for achieving targets for blood pressure <130/80 mmHg for patients with DM or CKD <75 years, <140/90 mmHg for all others; LDL-cholesterol (LDL-c)<100 mg/dL; and hemoglobin A1c (A1c) <7.0%. Forpatients with prior CVD, aspirin (≥81 mg daily), a statin(≥40 mg simvastatin or equivalent daily), and an ACE-inhibitor (≥lisinopril 10 mg daily or equivalent) are recom-mended. For those with only DM, a statin from age 40, anACE-inhibitor from age 55, and aspirin from age 50 in menand age 60 in women are recommended.All teams use the Population Management Tool (PMT),
a web-enabled database, to identify and track PHASEpatients. The PMT presents risk factor and medication in-formation that is refreshed weekly and accessible throughstandard queries. Some centers focus exclusively on reach-ing quality targets; others outreach to all patients periodic-ally. Teams communicate with primary care physicians viathe electronic health record, secure e-mail and telephone.Center-level performance for risk factor control and
use of recommended medications is monitored quar-terly. Performance targets are one component of modestcenter-directed incentive payments[30].
Identifying eligibility for treatment intensificationWithin the PHASE population, risk factor levels and recentprescription fills were monitored monthly during the inter-vention to identify persons newly eligible for treatment in-tensification. The first search used a 3-month look-backwindow. Eligibility required: 1) most recent risk factorlevels (systolic blood pressure (SBP), A1c, or LDL-c) abovetarget (2 consecutive elevated values were required forSBP; 2)≥ 7 months prior continuous KPNC enrollment tomeasure adherence and prior treatment intensification;3) adherence to previously prescribed medications for thecondition; and 4) no treatment intensification for the con-dition in the prior month. Blood pressures from inpatient,emergency, or procedure-related visits were not used toidentify eligibility or assess effectiveness.Adherence was measured separately for each condition
by averaging adherence estimates across all condition-related medications in the period from 6 months beforethe elevated risk factor was noted to the date of the subse-quent monthly data pull. For each medication, total daysbetween the first prescription in this period and the datapull were summed and proportions of those days withavailable medications calculated. An average medicationpossession ratio was calculated across all condition-related medications. To account for stockpiling, remainingdays supply from prior prescriptions for the same medica-tion were added to numerators. Hospital days were sub-tracted from both numerators and denominators. Personswith average medication ratios of≥ 80% were consideredadherent and therefore eligible for treatment intensifica-tion. Patients on insulin but no oral diabetes medications
Selby et al. BMC Health Services Research 2012, 12:183 Page 3 of 10http://www.biomedcentral.com/1472-6963/12/183
at baseline were not considered for the A1c outcome be-cause insulin adherence and treatment intensification aredifficult to measure.
Randomization, training and intervention processThe study concept was presented to PHASE team lea-ders in late 2007, along with data on the relationship oftreatment intensification to improved risk factor control.[12] Leaders from nine out of a total of 17 center serviceareas expressed interest in participating. During the first6 months of 2008, researchers met regularly with re-gional and center-based PHASE leadership to refine thestudy information to be placed in the PMT. In June,medical centers were randomized after blocking on cen-ter population size and current rates of treatment in-tensification. The small number of centers precludedadditional blocking. Five centers were randomized to theintervention, four to the control arm. Before the inter-vention began, one intervention team underwent majorre-organization and withdrew from the study. This left atotal of 8 centers available for randomization.Because of concern that staff might be unable to out-
reach to all eligible patients in a timely way, the studyinvestigators and PHASE operations team leaders par-ticipating in the study created a prioritization schemebased on risk factor levels: Priority 1: SBP ≥ 140 mmHg;Priority 2: LDL-c ≥ 130 mg/dL; Priority 3: A1c ≥ 9%; Pri-ority 4: SBP 130–139 mmHg in persons with diabetes orCKD; Priority 5: LDL-c 100–129 mg/dL; Priority 6: A1c7–8.9%. For Priority 1, members≤ 85 years were flagged.For other priorities, the upper age limit was 75. Staff atintervention centers agreed to process those in priorities1–3 first. During the intervention, priority flags (up to 3per patient), along with PHASE-recommended nextsteps in pharmacotherapy for each individual patient foruse at the point-of-care, were prominently placed intothe PMT and refreshed monthly. PHASE teams partici-pating in the study were trained in the use of the newflags, and PHASE center leaders were provided withperiodic feedback on how many eligible patients werebeing processed.
Qualitatitive interviewsQualitative pre- and post-intervention interviews withintervention team leaders at each center assessed goals,structure, and tactics of each center’s program, andrecorded experiences and barriers encountered in usingthe new information. These interviews were conductedin the 2 months prior to the scheduled start of the inter-vention, and again after the intervention had ended. Thebaseline interview included domains to assess existingpopulation care-based approaches to adherence andtreatment intensification; staffing levels; and use of thePMT in existing PHASE program structure. The follow-
up interviews included domains to assess changes in thepopulation care programs as a result of the intervention;experience with the intervention; and barriers and facili-tators to the intervention’s implementation at each site.In addition, researchers met monthly with intervention
team leaders during the study to support use of the newinformation. The PMT was modified to allow interven-tion staff to record dates and types of processing efforts(e.g. review, outreach).
AnalysesAnalyses were conducted separately by priority. Primaryanalyses considered Priorities 1–3. We excluded PHASEpatients who did not have a KPNC pharmacy benefit andthose in long-term care. Outcomes were receipt of treat-ment intensification within 3 months after placing an eli-gibility flag in the PMT (baseline), and changes in riskfactor levels during 12 months post-baseline. Treatmentintensification was defined as filling a prescription for amedication class not used in the prior 7 months or an in-crease in prescribed dosage of a current medication. Sec-ondary analyses examined rates of intensification within6 months and compared rates between intervention centerpatients processed by the outreach team and those notprocessed.We used first recorded risk factor values at least 3 months
post-baseline to assess mean risk factor change; weincluded all values for the entire 12-month post-baselineperiod in a repeated measures analyses. Although earlypost-baseline values in these analyses could precede treat-ment intensification, we included them because early valuesshowing a return to control would be a reason not to orderanother test for some time. Small percentages of patientswith no follow-up values of SBP, LDL-c, or A1c (3%; 14%,10% respectively) were not included in analyses. Althoughwe did not expect that treatment intensification or risk fac-tor control would improve for priorities 4–6, we analysedthese priorities in secondary analyses. We also comparedproportions of patients “in control” during follow-up usingpriority-specific cutpoints in repeated measures analyses.Persons with missing values post-baseline were alternatelytreated as “not in control” or excluded. Finally, we com-pared control for the entire PHASE populations using lastrecorded values at 12 months after the intervention began.Hierarchical logistic regression models (SAS PROC
MIXED with GLIMMIX Macro) were used to comparetreatment intensification rates, adjusting for patient age,sex, race/ethnicity, risk factor level and number of medi-cations at baseline. Hierarchical linear regression models(SAS PROC MIXED) with an autoregressive covariancestructure were used for repeated measures analyses ofrisk factor endpoints. A covariate for time from baselineto each measurement, and random effects for center,were included in all models.
Selby et al. BMC Health Services Research 2012, 12:183 Page 4 of 10http://www.biomedcentral.com/1472-6963/12/183
In pre-study simulations (2500 iterations), we estimatedstudy power to detect follow-up risk factor differences as-suming 8 centers, 4 in each arm; 2300 eligible patients percenter for blood pressure and LDL-c; 1700 for A1c con-trol; average of 6 post-intervention blood pressure mea-sures, one LDL-c and one A1c measure during 12-monthsfollow-up. Intra-class correlations for centers were 0.01for SBP, 0.006 for LDL-c, and 0.008 for A1c [31] . Simula-tions indicated 80% power to detect intervention-controldifferences of 3.4 mmHg for SBP; 6.7 mg/dL for LDL-c;0.42% for A1c. The subsequent decision to focus only onpatients in the top 3 priorities reduced eventual samplesizes by more than 50% for each risk factor, but focusedon patients with most room for improvement.
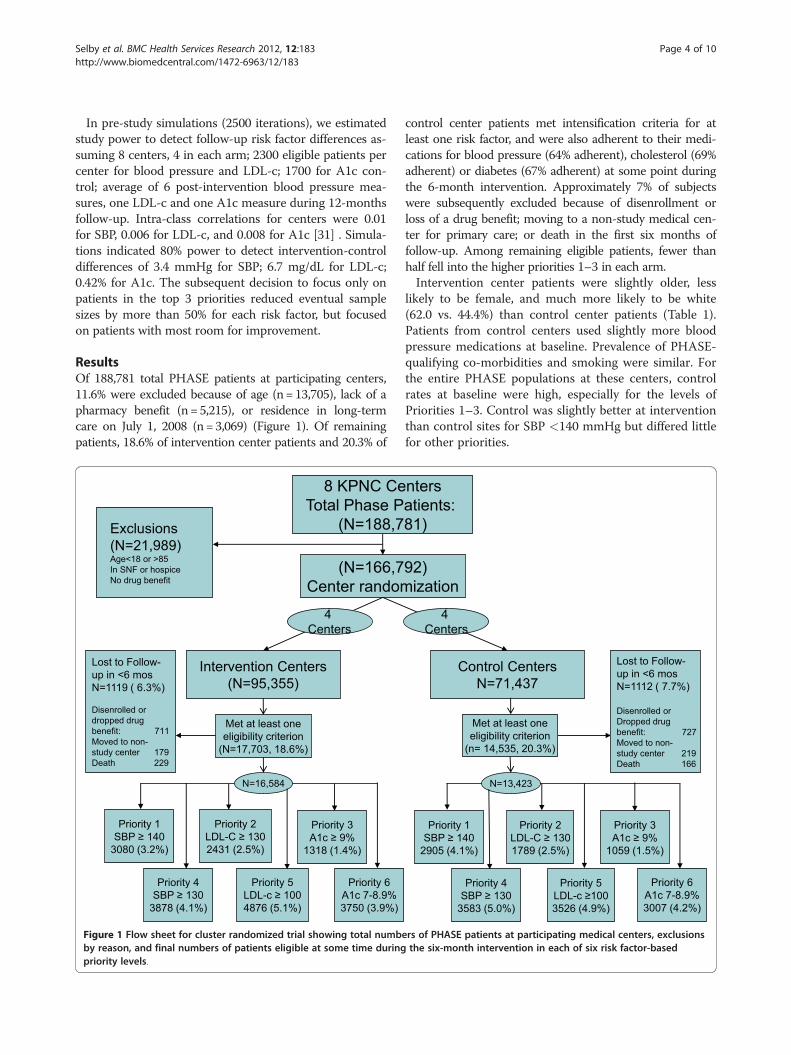
ResultsOf 188,781 total PHASE patients at participating centers,11.6% were excluded because of age (n=13,705), lack of apharmacy benefit (n= 5,215), or residence in long-termcare on July 1, 2008 (n=3,069) (Figure 1). Of remainingpatients, 18.6% of intervention center patients and 20.3% of
(N=166,7Center random
Intervention Centers(N=95,355)
4 Centers
Priority 1SBP ≥ 140
3080 (3.2%)
Priority 2LDL-C ≥ 1302431 (2.5%)
Priority 4SBP ≥ 130
3878 (4.1%)
Priority 3A1c ≥ 9%
1318 (1.4%)
Priority 5LDL-c ≥ 1004876 (5.1%)
Priority 6A1c 7-8.9%3750 (3.9%)
Exclusions(N=21,989)Age<18 or >85In SNF or hospiceNo drug benefit
8 KPNC CeTotal Phase P
(N=188,7
Lost to Follow-up in <6 mosN=1119 ( 6.3%)
Disenrolled or dropped drug benefit: 711 Moved to non-study center 179Death 229
Met at least oneeligibility criterion
(N=17,703, 18.6%)
N=16,584
Figure 1 Flow sheet for cluster randomized trial showing total numbby reason, and final numbers of patients eligible at some time duringpriority levels.
control center patients met intensification criteria for atleast one risk factor, and were also adherent to their medi-cations for blood pressure (64% adherent), cholesterol (69%adherent) or diabetes (67% adherent) at some point duringthe 6-month intervention. Approximately 7% of subjectswere subsequently excluded because of disenrollment orloss of a drug benefit; moving to a non-study medical cen-ter for primary care; or death in the first six months offollow-up. Among remaining eligible patients, fewer thanhalf fell into the higher priorities 1–3 in each arm.Intervention center patients were slightly older, less
likely to be female, and much more likely to be white(62.0 vs. 44.4%) than control center patients (Table 1).Patients from control centers used slightly more bloodpressure medications at baseline. Prevalence of PHASE-qualifying co-morbidities and smoking were similar. Forthe entire PHASE populations at these centers, controlrates at baseline were high, especially for the levels ofPriorities 1–3. Control was slightly better at interventionthan control sites for SBP <140 mmHg but differed littlefor other priorities.
92)ization
Control CentersN=71,437
4 Centers
Priority 1SBP ≥ 140
2905 (4.1%)
Priority 2LDL-C ≥ 1301789 (2.5%)
Priority 3A1c ≥ 9%
1059 (1.5%)
Priority 6A1c 7-8.9%3007 (4.2%)
Priority 5LDL-c ≥1003526 (4.9%)
Priority 4SBP ≥ 130
3583 (5.0%)
ntersatients: 81)
Met at least oneeligibility criterion
(n= 14,535, 20.3%)
Lost to Follow-up in <6 mosN=1112 ( 7.7%)
Disenrolled or Dropped drugbenefit: 727 Moved to non-study center 219Death 166
N=13,423
ers of PHASE patients at participating medical centers, exclusionsthe six-month intervention in each of six risk factor-based
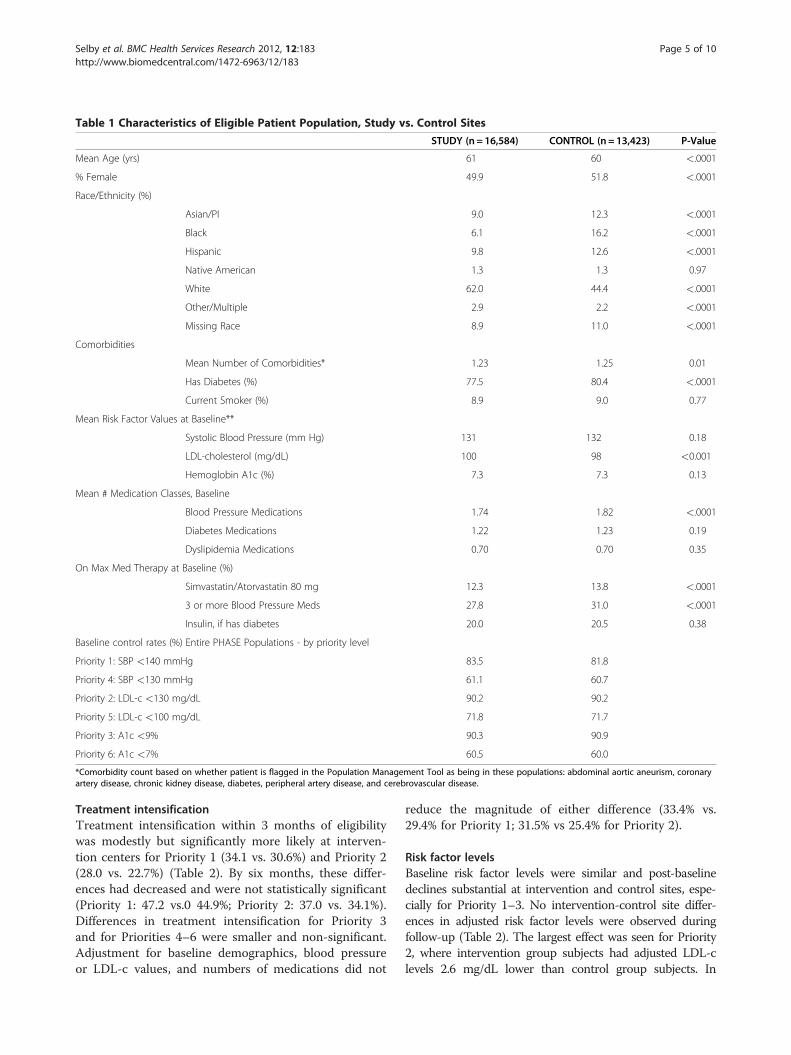
Table 1 Characteristics of Eligible Patient Population, Study vs. Control Sites
STUDY (n = 16,584) CONTROL (n = 13,423) P-Value
Mean Age (yrs) 61 60 <.0001
% Female 49.9 51.8 <.0001
Race/Ethnicity (%)
Asian/PI 9.0 12.3 <.0001
Black 6.1 16.2 <.0001
Hispanic 9.8 12.6 <.0001
Native American 1.3 1.3 0.97
White 62.0 44.4 <.0001
Other/Multiple 2.9 2.2 <.0001
Missing Race 8.9 11.0 <.0001
Comorbidities
Mean Number of Comorbidities* 1.23 1.25 0.01
Has Diabetes (%) 77.5 80.4 <.0001
Current Smoker (%) 8.9 9.0 0.77
Mean Risk Factor Values at Baseline**
Systolic Blood Pressure (mm Hg) 131 132 0.18
LDL-cholesterol (mg/dL) 100 98 <0.001
Hemoglobin A1c (%) 7.3 7.3 0.13
Mean # Medication Classes, Baseline
Blood Pressure Medications 1.74 1.82 <.0001
Diabetes Medications 1.22 1.23 0.19
Dyslipidemia Medications 0.70 0.70 0.35
On Max Med Therapy at Baseline (%)
Simvastatin/Atorvastatin 80 mg 12.3 13.8 <.0001
3 or more Blood Pressure Meds 27.8 31.0 <.0001
Insulin, if has diabetes 20.0 20.5 0.38
Baseline control rates (%) Entire PHASE Populations - by priority level
Priority 1: SBP <140 mmHg 83.5 81.8
Priority 4: SBP <130 mmHg 61.1 60.7
Priority 2: LDL-c <130 mg/dL 90.2 90.2
Priority 5: LDL-c <100 mg/dL 71.8 71.7
Priority 3: A1c <9% 90.3 90.9
Priority 6: A1c <7% 60.5 60.0
*Comorbidity count based on whether patient is flagged in the Population Management Tool as being in these populations: abdominal aortic aneurism, coronaryartery disease, chronic kidney disease, diabetes, peripheral artery disease, and cerebrovascular disease.
Selby et al. BMC Health Services Research 2012, 12:183 Page 5 of 10http://www.biomedcentral.com/1472-6963/12/183
Treatment intensificationTreatment intensification within 3 months of eligibilitywas modestly but significantly more likely at interven-tion centers for Priority 1 (34.1 vs. 30.6%) and Priority 2(28.0 vs. 22.7%) (Table 2). By six months, these differ-ences had decreased and were not statistically significant(Priority 1: 47.2 vs.0 44.9%; Priority 2: 37.0 vs. 34.1%).Differences in treatment intensification for Priority 3and for Priorities 4–6 were smaller and non-significant.Adjustment for baseline demographics, blood pressureor LDL-c values, and numbers of medications did not
reduce the magnitude of either difference (33.4% vs.29.4% for Priority 1; 31.5% vs 25.4% for Priority 2).
Risk factor levelsBaseline risk factor levels were similar and post-baselinedeclines substantial at intervention and control sites, espe-cially for Priority 1–3. No intervention-control site differ-ences in adjusted risk factor levels were observed duringfollow-up (Table 2). The largest effect was seen for Priority2, where intervention group subjects had adjusted LDL-clevels 2.6 mg/dL lower than control group subjects. In
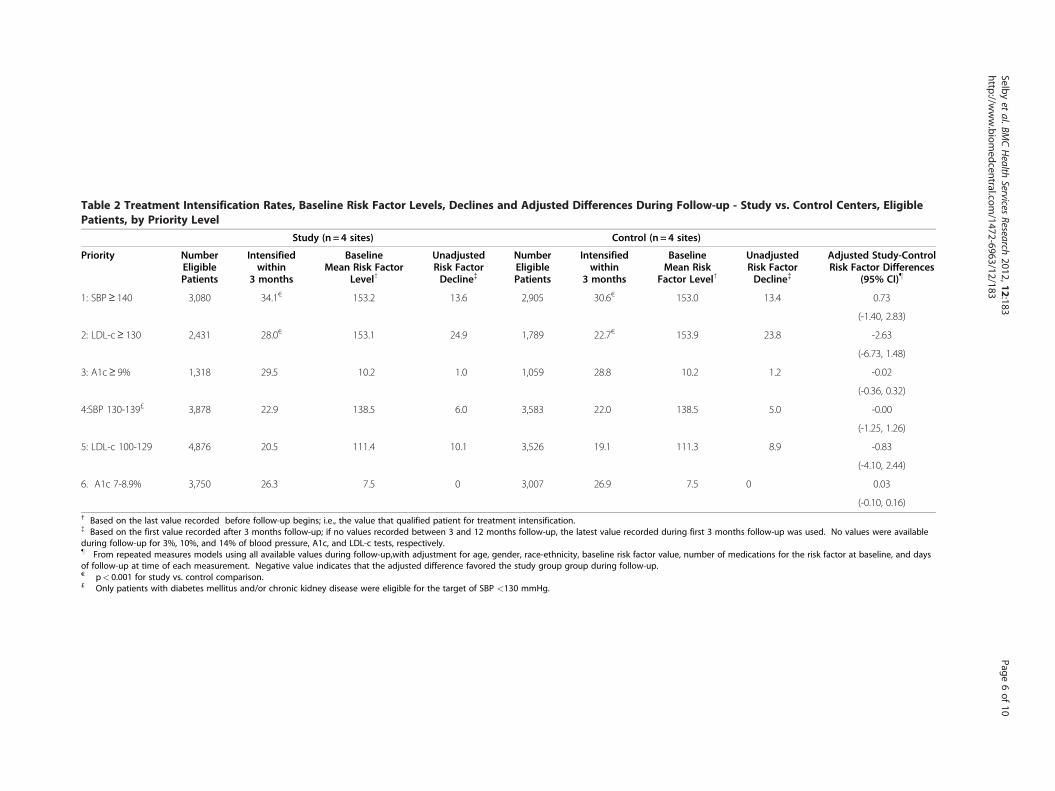
Table 2 Treatment Intensification Rates, Baseline Risk Factor Levels, Declines and Adjusted Differences During Follow-up - Study vs. Control Centers, EligiblePatients, by Priority Level
Study (n = 4 sites) Control (n = 4 sites)
Priority NumberEligiblePatients
Intensifiedwithin
3 months
BaselineMean Risk Factor
Level†
UnadjustedRisk FactorDecline{
NumberEligiblePatients
Intensifiedwithin
3 months
BaselineMean Risk
Factor Level†
UnadjustedRisk FactorDecline{
Adjusted Study-ControlRisk Factor Differences
(95% CI)}
1: SBP≥ 140 3,080 34.1€ 153.2 13.6 2,905 30.6€ 153.0 13.4 0.73
(-1.40, 2.83)
2: LDL-c≥ 130 2,431 28.0€ 153.1 24.9 1,789 22.7€ 153.9 23.8 -2.63
(-6.73, 1.48)
3: A1c≥ 9% 1,318 29.5 10.2 1.0 1,059 28.8 10.2 1.2 -0.02
(-0.36, 0.32)
4:SBP 130-139£ 3,878 22.9 138.5 6.0 3,583 22.0 138.5 5.0 -0.00
(-1.25, 1.26)
5: LDL-c 100-129 4,876 20.5 111.4 10.1 3,526 19.1 111.3 8.9 -0.83
(-4.10, 2.44)
6. A1c 7-8.9% 3,750 26.3 7.5 0 3,007 26.9 7.5 0 0.03
(-0.10, 0.16)† Based on the last value recorded before follow-up begins; i.e., the value that qualified patient for treatment intensification.{ Based on the first value recorded after 3 months follow-up; if no values recorded between 3 and 12 months follow-up, the latest value recorded during first 3 months follow-up was used. No values were availableduring follow-up for 3%, 10%, and 14% of blood pressure, A1c, and LDL-c tests, respectively.} From repeated measures models using all available values during follow-up,with adjustment for age, gender, race-ethnicity, baseline risk factor value, number of medications for the risk factor at baseline, and daysof follow-up at time of each measurement. Negative value indicates that the adjusted difference favored the study group group during follow-up.€ p< 0.001 for study vs. control comparison.£ Only patients with diabetes mellitus and/or chronic kidney disease were eligible for the target of SBP <130 mmHg.
Selbyet
al.BMCHealth
ServicesResearch
2012,12:183Page
6of
10http://w
ww.biom
edcentral.com/1472-6963/12/183
Selby et al. BMC Health Services Research 2012, 12:183 Page 7 of 10http://www.biomedcentral.com/1472-6963/12/183
adjustment models for Priorities 2 and 3, addition of an in-dicator for treatment intensification within 3 monthsyielded large, statistically significant associations of treat-ment intensification with lower follow-up LDL-c and A1clevels. In contrast, receiving treatment intensification forSBP (Priority 1) was associated with significantly higher SBPvalues at follow-up, suggesting that, for blood pressure, in-tensification may have been reserved for those whose highSBP persisted through the early weeks of follow-up (ratherthan regressing to an earlier mean). After adjustment forbaseline rates of treatment intensification, there was no evi-dence that the intervention led to greater heterogeneity inintensification rates than that seen among control centers.Secondary analyses of proportions reaching control
showed similarly small, non-significant differences forPriorities 1 and 2, whether patients with no follow-upvalues were treated as “not in control” or excluded. Over50% or patients in each arm reached control. For priority3, patients at control sites were more likely to be in con-trol at follow-up (52.2% vs. 46.6%). This differences wassomewhat smaller and no longer significant in therepeated measures analysis (4.9 mmHg, p = 0.22).
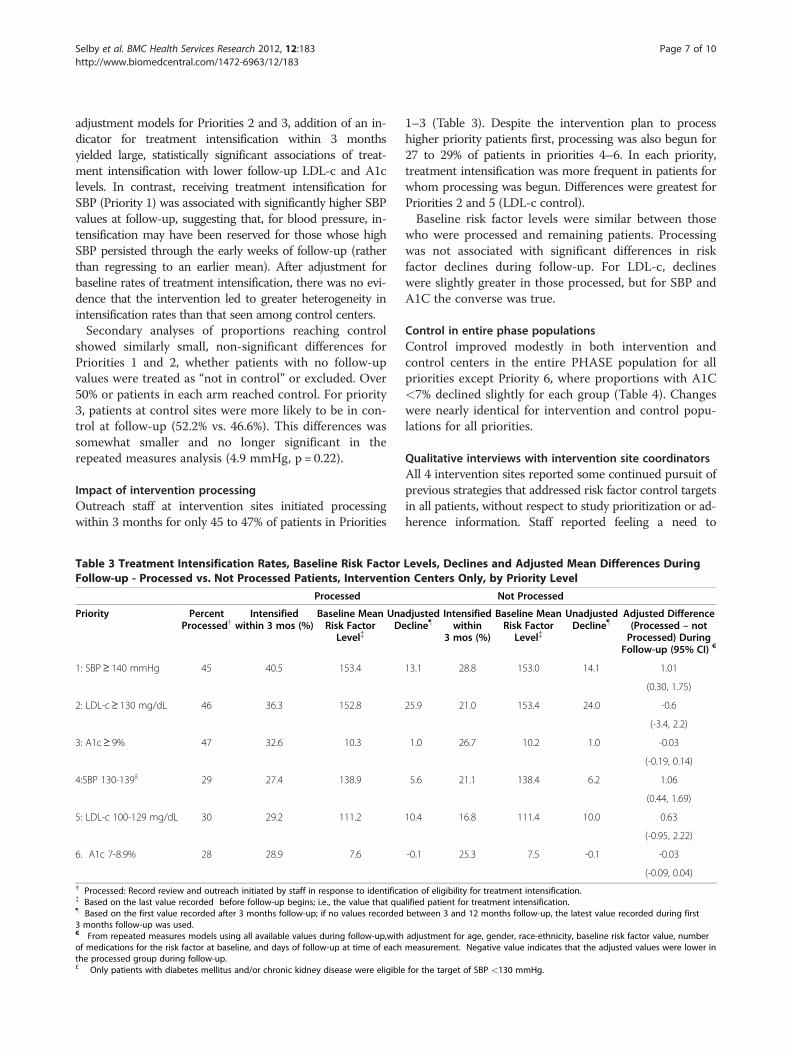
Impact of intervention processingOutreach staff at intervention sites initiated processingwithin 3 months for only 45 to 47% of patients in Priorities
Table 3 Treatment Intensification Rates, Baseline Risk FactorFollow-up - Processed vs. Not Processed Patients, Interventio
Processed
Priority PercentProcessed†
Intensifiedwithin 3 mos (%)
Baseline MeanRisk Factor
Level{
UnaDe
1: SBP≥ 140 mmHg 45 40.5 153.4
2: LDL-c≥ 130 mg/dL 46 36.3 152.8
3: A1c≥ 9% 47 32.6 10.3
4:SBP 130-139£ 29 27.4 138.9
5: LDL-c 100-129 mg/dL 30 29.2 111.2
6. A1c 7-8.9% 28 28.9 7.6
† Processed: Record review and outreach initiated by staff in response to identifica{ Based on the last value recorded before follow-up begins; i.e., the value that qua} Based on the first value recorded after 3 months follow-up; if no values recorded3 months follow-up was used.€ From repeated measures models using all available values during follow-up,withof medications for the risk factor at baseline, and days of follow-up at time of eachthe processed group during follow-up.£ Only patients with diabetes mellitus and/or chronic kidney disease were eligible
1–3 (Table 3). Despite the intervention plan to processhigher priority patients first, processing was also begun for27 to 29% of patients in priorities 4–6. In each priority,treatment intensification was more frequent in patients forwhom processing was begun. Differences were greatest forPriorities 2 and 5 (LDL-c control).Baseline risk factor levels were similar between those
who were processed and remaining patients. Processingwas not associated with significant differences in riskfactor declines during follow-up. For LDL-c, declineswere slightly greater in those processed, but for SBP andA1C the converse was true.
Control in entire phase populationsControl improved modestly in both intervention andcontrol centers in the entire PHASE population for allpriorities except Priority 6, where proportions with A1C<7% declined slightly for each group (Table 4). Changeswere nearly identical for intervention and control popu-lations for all priorities.
Qualitative interviews with intervention site coordinatorsAll 4 intervention sites reported some continued pursuit ofprevious strategies that addressed risk factor control targetsin all patients, without respect to study prioritization or ad-herence information. Staff reported feeling a need to
Levels, Declines and Adjusted Mean Differences Duringn Centers Only, by Priority Level
Not Processed
djustedcline}
Intensifiedwithin
3 mos (%)
Baseline MeanRisk Factor
Level{
UnadjustedDecline}
Adjusted Difference(Processed – notProcessed) During
Follow-up (95% CI) €
13.1 28.8 153.0 14.1 1.01
(0.30, 1.75)
25.9 21.0 153.4 24.0 -0.6
(-3.4, 2.2)
1.0 26.7 10.2 1.0 -0.03
(-0.19, 0.14)
5.6 21.1 138.4 6.2 1.06
(0.44, 1.69)
10.4 16.8 111.4 10.0 0.63
(-0.95, 2.22)
-0.1 25.3 7.5 -0.1 -0.03
(-0.09, 0.04)
tion of eligibility for treatment intensification.lified patient for treatment intensification.between 3 and 12 months follow-up, the latest value recorded during first
adjustment for age, gender, race-ethnicity, baseline risk factor value, numbermeasurement. Negative value indicates that the adjusted values were lower in
for the target of SBP <130 mmHg.
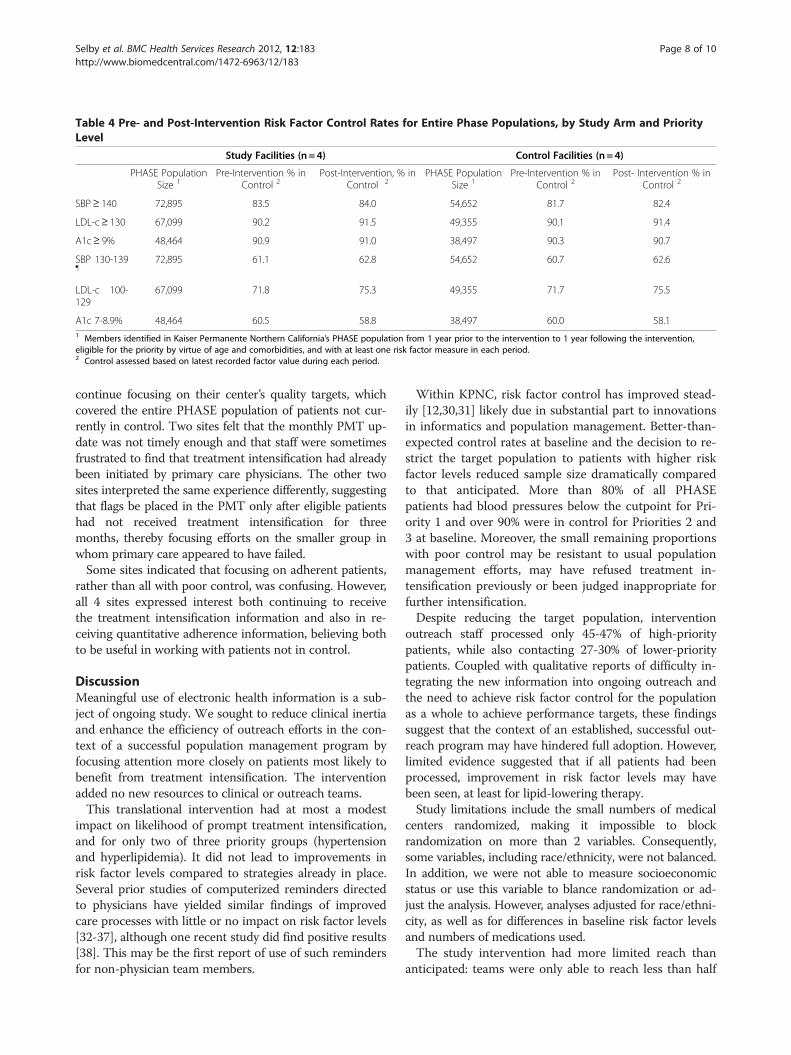
Table 4 Pre- and Post-Intervention Risk Factor Control Rates for Entire Phase Populations, by Study Arm and PriorityLevel
Study Facilities (n = 4) Control Facilities (n = 4)
PHASE PopulationSize 1
Pre-Intervention % inControl 2
Post-Intervention, % inControl 2
PHASE PopulationSize 1
Pre-Intervention % inControl 2
Post- Intervention % inControl 2
SBP≥ 140 72,895 83.5 84.0 54,652 81.7 82.4
LDL-c≥ 130 67,099 90.2 91.5 49,355 90.1 91.4
A1c≥ 9% 48,464 90.9 91.0 38,497 90.3 90.7
SBP 130-139}
72,895 61.1 62.8 54,652 60.7 62.6
LDL-c 100-129
67,099 71.8 75.3 49,355 71.7 75.5
A1c 7-8.9% 48,464 60.5 58.8 38,497 60.0 58.11 Members identified in Kaiser Permanente Northern California’s PHASE population from 1 year prior to the intervention to 1 year following the intervention,eligible for the priority by virtue of age and comorbidities, and with at least one risk factor measure in each period.2 Control assessed based on latest recorded factor value during each period.
Selby et al. BMC Health Services Research 2012, 12:183 Page 8 of 10http://www.biomedcentral.com/1472-6963/12/183
continue focusing on their center’s quality targets, whichcovered the entire PHASE population of patients not cur-rently in control. Two sites felt that the monthly PMT up-date was not timely enough and that staff were sometimesfrustrated to find that treatment intensification had alreadybeen initiated by primary care physicians. The other twosites interpreted the same experience differently, suggestingthat flags be placed in the PMT only after eligible patientshad not received treatment intensification for threemonths, thereby focusing efforts on the smaller group inwhom primary care appeared to have failed.Some sites indicated that focusing on adherent patients,
rather than all with poor control, was confusing. However,all 4 sites expressed interest both continuing to receivethe treatment intensification information and also in re-ceiving quantitative adherence information, believing bothto be useful in working with patients not in control.
DiscussionMeaningful use of electronic health information is a sub-ject of ongoing study. We sought to reduce clinical inertiaand enhance the efficiency of outreach efforts in the con-text of a successful population management program byfocusing attention more closely on patients most likely tobenefit from treatment intensification. The interventionadded no new resources to clinical or outreach teams.This translational intervention had at most a modest
impact on likelihood of prompt treatment intensification,and for only two of three priority groups (hypertensionand hyperlipidemia). It did not lead to improvements inrisk factor levels compared to strategies already in place.Several prior studies of computerized reminders directedto physicians have yielded similar findings of improvedcare processes with little or no impact on risk factor levels[32-37], although one recent study did find positive results[38]. This may be the first report of use of such remindersfor non-physician team members.
Within KPNC, risk factor control has improved stead-ily [12,30,31] likely due in substantial part to innovationsin informatics and population management. Better-than-expected control rates at baseline and the decision to re-strict the target population to patients with higher riskfactor levels reduced sample size dramatically comparedto that anticipated. More than 80% of all PHASEpatients had blood pressures below the cutpoint for Pri-ority 1 and over 90% were in control for Priorities 2 and3 at baseline. Moreover, the small remaining proportionswith poor control may be resistant to usual populationmanagement efforts, may have refused treatment in-tensification previously or been judged inappropriate forfurther intensification.Despite reducing the target population, intervention
outreach staff processed only 45-47% of high-prioritypatients, while also contacting 27-30% of lower-prioritypatients. Coupled with qualitative reports of difficulty in-tegrating the new information into ongoing outreach andthe need to achieve risk factor control for the populationas a whole to achieve performance targets, these findingssuggest that the context of an established, successful out-reach program may have hindered full adoption. However,limited evidence suggested that if all patients had beenprocessed, improvement in risk factor levels may havebeen seen, at least for lipid-lowering therapy.Study limitations include the small numbers of medical
centers randomized, making it impossible to blockrandomization on more than 2 variables. Consequently,some variables, including race/ethnicity, were not balanced.In addition, we were not able to measure socioeconomicstatus or use this variable to blance randomization or ad-just the analysis. However, analyses adjusted for race/ethni-city, as well as for differences in baseline risk factor levelsand numbers of medications used.The study intervention had more limited reach than
anticipated: teams were only able to reach less than half
Selby et al. BMC Health Services Research 2012, 12:183 Page 9 of 10http://www.biomedcentral.com/1472-6963/12/183
of the high-priority patients, and we were unable to col-lect detailed information on the processes teams used tocontact patients (e.g. number of calls per patient). Inaddition, results from the qualitative interviews sug-gested that the information provided in the interventionmay have been more useful if delivered more oftenthan monthly. If the intervention had been more suc-cessful in reaching all targeted patients, and/or providedmore timely updates, it is possible that we would haveobserved more favorable results.Electronic health record and automated pharmacy data
were used to determine adherence and intensification inthis study, and due to the large volume of patientsincluded in the intervention we were not able to validatethis information via chart review, or to therefore includeinsulin adherence for diabetes patients. This potentiallymay have led to biases; however, many studies in thissetting have relied on adherence and intensification in-formation based on chart review and validated their rela-tionship with CVD intermediate outcomes [12,13].This study occurred in an integrated delivery system
with high baseline control rates for CVD risk factors andwell-developed non-physician population managementoutreach strategies. Findings may not generalize to othersettings with lower baseline control rates or those employ-ing different types of quality improvement strategies,where a similar intervention may have been more (or less)successful.
ConclusionIn summary, enhanced information on need for treatmentintensification did not improve risk factor levels in thispopulation. High baseline control rates and a decision tonarrow the target population limited the number ofpatients who could benefit from the intervention. Inad-equate implementation further limited detectability of anypotential benefits. Nonetheless, it is important to note thatat study conclusion, outreach staff asked to continue re-ceiving the new information, augmented by quantitativeestimates of recent medication adherence for all patients.Future research should continue to focus on furtheringour understanding of how to best integrated health ITtools into population management strategies to enhancethe quality of care for patients with chronic conditions.
Competing interestsThe authors have no competing interests to declare.
AcknowledgementsThis study was supported by AHRQ Grant No. R18 HS17031-01. Dr.Schmittdiel receives additional support from the Health Delivery SystemsCenter for Diabetes Translational Research (CDTR) [NIDDK grant 1P30-DK092924]. The authors acknowledge and thank the following leaders ofmedical center-based PHASE outreach teams: Lisa Bell, Linda Carnes, LauraChan, Svasti Patel, and Kathleen Wolf.
Author details1Patient-Centered Outcomes Research Institute, Washington, DC, USA.2Division of Research, The Permanente Medical Group, Oakland, CA, USA.3Department of Medicine and Endocrinology, The Permanente MedicalGroup, South San Francisco, CA, USA. 4Quality and Operations Support(formerly), The Permanente Medical Group, Oakland, CA, USA. 5Center forClinical Management Research, VA Ann Arbor Healthcare System, Ann Arbor,MI, USA. 6Division of General Medicine, University of Michigan MedicalSchool, Ann Arbor, MI, USA. 7Mongan Institute for Health Policy,Massachusetts General Hospital, Boston, MA, USA. 8Department of HealthCare Policy, Harvard Medical School, Boston, MA, USA. 9Kaiser PermanenteDivision of Research, 2000 Broadway, Oakland, CA 94612, USA.
Author contributionsJVS, JAS, BF, and MJ conceived and designed the study. JVS, JAS, MJ, LJR, JH,MER, and EAK implemented the study at participating sites and contributedto the analysis of data. MER conducted the qualitative interviews. WD andCSU performed the statistical analysis. All authors have read and approvedthe final manuscript.
Received: 12 March 2012 Accepted: 2 July 2012Published: 2 July 2012
References1. Heart Protection Study Collaborative Group: MRC/BHF Heart Protection
Study of cholesterol lowering with simvastatin in 20,536 high-riskindividuals: a randomised placebo-controlled trial. Lancet 2002, 360(9326):7–22.
2. ALLHAT Officers and Coordinators for the ALLHAT Collaborative ResearchGroup: Major outcomes in high-risk hypertensive patients randomized toangiotensin-converting enzyme inhibitor or calcium channel blocker vsdiuretic: The Antihypertensive and Lipid-Lowering Treatment to PreventHeart Attack Trial (ALLHAT). JAMA 2002, 288(23):2981–2997.
3. Scandinavian Simvastatin Survival Study Group: Randomised trial ofcholesterol lowering in 4444 patients with coronary heart disease: theScandinavian Simvastatin Survival Study (4S). Lancet 1994, 344(8934):1383–1389.
4. Holman RR, Paul SK, Bethel MA, Matthews DR, Neil HA: 10-year follow-upof intensive glucose control in type 2 diabetes. N Engl J Med 2008, 359(15):1577–1589.
5. Tight blood pressure control and risk of macrovascular and microvascularcomplications in type 2 diabetes: UKPDS 38. UK Prospective DiabetesStudy Group. BMJ 1998, 317(7160):703–713.
6. Nissen SE, Tuzcu EM, Libby P, Thompson PD, Ghali M, Garza D, Berman L,Shi H, Buebendorf E, Topol EJ: Effect of antihypertensive agents oncardiovascular events in patients with coronary disease and normalblood pressure: the CAMELOT study: a randomized controlled trial. JAMA2004, 292(18):2217–2225.
7. Gaede P, Vedel P, Larsen N, Jensen GV, Parving HH, Pedersen O:Multifactorial intervention and cardiovascular disease in patients withtype 2 diabetes. N Engl J Med 2003, 348(5):383–393.
8. Saaddine JB, Cadwell B, Gregg EW, Engelgau MM, Vinicor F, Imperatore G,Narayan KM: Improvements in diabetes processes of care andintermediate outcomes: United States, 1988–2002. Ann Intern Med 2006,144(7):465–474.
9. Hoerger TJ, Segel JE, Gregg EW, Saaddine JB: Is glycemic controlimproving in U.S. adults? Diabetes Care 2008, 31(1):81–86.
10. McWilliams JM, Meara E, Zaslavsky AM, Ayanian JZ: Differences in controlof cardiovascular disease and diabetes by race, ethnicity, and education:U.S. trends from 1999 to 2006 and effects of medicare coverage. AnnIntern Med 2009, 150(8):505–515.
11. McEwen LN, Hsiao VC, Nota-Kirby EM, Kulpa GJ, Schmidt KG, Herman WH:Effect of a managed care disease management program on diabetescare. Am J Manag Care 2009, 15(9):575–580.
12. Selby JV, Uratsu CS, Fireman B, Schmittdiel JA, Peng T, Rodondi N, Karter AJ,Kerr EA: Treatment intensification and risk factor control: toward moreclinically relevant quality measures. Med Care 2009, 47(4):395–402.
13. Schmittdiel JA, Uratsu CS, Karter AJ, Heisler M, Subramanian U, MangioneCM, Selby JV: Why don't diabetes patients achieve recommended riskfactor targets? Poor adherence versus lack of treatment intensification.J Gen Intern Med 2008, 23(5):588–594.
Selby et al. BMC Health Services Research 2012, 12:183 Page 10 of 10http://www.biomedcentral.com/1472-6963/12/183
14. Osterberg L, Blaschke T: Adherence to medication. N Engl J Med 2005, 353(5):487–497.
15. Benner JS, Glynn RJ, Mogun H, Neumann PJ, Weinstein MC, Avorn J: Long-term persistence in use of statin therapy in elderly patients. JAMA 2002,288(4):455–461.
16. Berlowitz DR, Ash AS, Hickey EC, Friedman RH, Glickman M, Kader B,Moskowitz MA: Inadequate management of blood pressure in ahypertensive population. N Engl J Med 1998, 339(27):1957–1963.
17. Andrade SE, Gurwitz JH, Field TS, Kelleher M, Majumdar SR, Reed G, Black R:Hypertension management: the care gap between clinical guidelinesand clinical practice. Am J Manag Care 2004, 10(7 Pt 2):481–486.
18. Ziemer DC, Miller CD, Rhee MK, Doyle JP, Watkins C Jr, Cook CB, Gallina DL, El-Kebbi IM, Barnes CS, Dunbar VG, et al: Clinical inertia contributes to poordiabetes control in a primary care setting. Diabetes Educ 2005, 31:564–571.
19. Grant RW, Buse JB, Meigs JB: Quality of diabetes care in U.S. academicmedical centers: low rates of medical regimen change. Diabetes Care2005, 28(2):337–442.
20. Brown JB, Nichols GA: Slow response to loss of glycemic control in type 2diabetes mellitus. Am J Manag Care 2003, 9(3):213–217.
21. Hirsch AT, Gotto AM Jr: Undertreatment of dyslipidemia in peripheralarterial disease and other high-risk populations: an opportunity forcardiovascular disease reduction. Vasc Med 2002, 7(4):323–331.
22. Sueta CA, Massing MW, Chowdhury M, Biggs DP, Simpson RJ Jr:Undertreatment of hyperlipidemia in patients with coronary arterydisease and heart failure. J Card Fail 2003, 9(1):36–41.
23. Rodondi N, Peng T, Karter AJ, Bauer DC, Vittinghoff E, Tang S, Pettitt D, KerrEA, Selby JV: Therapy modifications in response to poorly controlledhypertension, dyslipidemia, and diabetes mellitus. Ann Intern Med 2006,144(7):475–484.
24. Heisler M, Hogan MM, Hofer TP, Schmittdiel JA, Pladevall M, Kerr EA: Whenmore is not better: treatment intensification among hypertensive patientswith poor medication adherence. Circulation 2008, 117(22):2884–2892.
25. Walsh JM, McDonald KM, Shojania KG, Sundaram V, Nayak S, Lewis R, OwensDK, Goldstein MK: Quality improvement strategies for hypertensionmanagement: a systematic review. Med Care 2006, 44(7):646–657.
26. Shojania KG, Ranji SR, McDonald KM, Grimshaw JM, Sundaram V, Rushakoff RJ,Owens DK: Effects of quality improvement strategies for type 2 diabetes onglycemic control: a meta-regression analysis. JAMA 2006, 296(4):427–440.
27. Carter BL, Rogers M, Daly J, Zheng S, James PA: The potency of team-based care interventions for hypertension: a meta-analysis. Arch InternMed 2009, 169(19):1748–1755.
28. Chisholm-Burns MA, Kim Lee J, Spivey CA, Slack M, Herrier RN, Hall-Lipsy E,Graff Zivin J, Abraham I, Palmer J, Martin JR, et al: US pharmacists' effect asteam members on patient care: systematic review and meta-analyses.Med Care 2010, 48(10):923–933.
29. Dudl RJ, Wang MC, Wong M, Bellows J: Preventing myocardial infarctionand stroke with a simplified bundle of cardioprotective medications. AmJ Manag Care 2009, 15(10):e88–94.
30. Lester H, Schmittdiel J, Selby J, Fireman B, Campbell S, Lee J, Whippy A,Madvig P: The impact of removing financial incentives from clinicalquality indicators: longitudinal analysis of four Kaiser Permanenteindicators. BMJ 2010, 340:c1898.
31. Selby JV, Schmittdiel JA, Lee J, Fung V, Thomas S, Smider N, Crosson FJ, HsuJ, Fireman B: Meaningful variation in performance: what does variation inquality tell us about improving quality? Med Care 2010, 48(2):133–139.
32. Goldstein MK, Lavori P, Coleman R, Advani A, Hoffman BB: Improvingadherence to guidelines for hypertension drug prescribing: cluster-randomized controlled trial of general versus patient-specificrecommendations. Am J Manag Care 2005, 11(11):677–685.
33. Hicks LS, Sequist TD, Ayanian JZ, Shaykevich S, Fairchild DG, Orav EJ, BatesDW: Impact of computerized decision support on blood pressuremanagement and control: a randomized controlled trial. J Gen Intern Med2008, 23(4):429–441.
34. Roumie CL, Elasy TA, Greevy R, Griffin MR, Liu X, Stone WJ, Wallston KA,Dittus RS, Alvarez V, Cobb J, et al: Improving blood pressure controlthrough provider education, provider alerts, and patient education: acluster randomized trial. Ann Intern Med 2006, 145(3):165–175.
35. Ziemer DC, Doyle JP, Barnes CS, Branch WT Jr, Cook CB, El-Kebbi IM, GallinaDL, Kolm P, Rhee MK, Phillips LS: An intervention to overcome clinicalinertia and improve diabetes mellitus control in a primary care setting:
Improving Primary Care of African Americans with Diabetes (IPCAAD) 8.Arch Intern Med 2006, 166(5):507–513.
36. Maclean CD, Gagnon M, Callas P, Littenberg B: The Vermont diabetesinformation system: a cluster randomized trial of a population baseddecision support system. J Gen Intern Med 2009, 24(12):1303–1310.
37. Boren SA, Puchbauer AM, Williams F: Computerized prompting andfeedback of diabetes care: a review of the literature. J Diabetes SciTechnol 2009, 3(4):944–950.
38. O'Connor PJ, Sperl-Hillen JM, Rush WA, Johnson PE, Amundson GH, AscheSE, Ekstrom HL, Gilmer TP: Impact of electronic health record clinicaldecision support on diabetes care: a randomized trial. Ann Fam Med2011, 9(1):12–21.
doi:10.1186/1472-6963-12-183Cite this article as: Selby et al.: Improving treatment intensification toreduce cardiovascular disease risk: a clusterrandomized trial. BMC Health Services Research 2012 12:183.
Submit your next manuscript to BioMed Centraland take full advantage of:
• Convenient online submission
• Thorough peer review
• No space constraints or color figure charges
• Immediate publication on acceptance
• Inclusion in PubMed, CAS, Scopus and Google Scholar
• Research which is freely available for redistribution
Submit your manuscript at www.biomedcentral.com/submit
Related Documents


