University of Massachusetts Amherst University of Massachusetts Amherst ScholarWorks@UMass Amherst ScholarWorks@UMass Amherst Doctoral Dissertations 1896 - February 2014 1-1-1989 Improving the principal's effectiveness through organizational Improving the principal's effectiveness through organizational behavior management (OBM) procedures : goal setting and behavior management (OBM) procedures : goal setting and performance feedback. performance feedback. Alex Gillat University of Massachusetts Amherst Follow this and additional works at: https://scholarworks.umass.edu/dissertations_1 Recommended Citation Recommended Citation Gillat, Alex, "Improving the principal's effectiveness through organizational behavior management (OBM) procedures : goal setting and performance feedback." (1989). Doctoral Dissertations 1896 - February 2014. 4432. https://scholarworks.umass.edu/dissertations_1/4432 This Open Access Dissertation is brought to you for free and open access by ScholarWorks@UMass Amherst. It has been accepted for inclusion in Doctoral Dissertations 1896 - February 2014 by an authorized administrator of ScholarWorks@UMass Amherst. For more information, please contact [email protected].

Welcome message from author
This document is posted to help you gain knowledge. Please leave a comment to let me know what you think about it! Share it to your friends and learn new things together.
Transcript
University of Massachusetts Amherst University of Massachusetts Amherst
ScholarWorks@UMass Amherst ScholarWorks@UMass Amherst
Doctoral Dissertations 1896 - February 2014
1-1-1989
Improving the principal's effectiveness through organizational Improving the principal's effectiveness through organizational
behavior management (OBM) procedures : goal setting and behavior management (OBM) procedures : goal setting and
performance feedback. performance feedback.
Alex Gillat University of Massachusetts Amherst
Follow this and additional works at: https://scholarworks.umass.edu/dissertations_1
Recommended Citation Recommended Citation Gillat, Alex, "Improving the principal's effectiveness through organizational behavior management (OBM) procedures : goal setting and performance feedback." (1989). Doctoral Dissertations 1896 - February 2014. 4432. https://scholarworks.umass.edu/dissertations_1/4432
This Open Access Dissertation is brought to you for free and open access by ScholarWorks@UMass Amherst. It has been accepted for inclusion in Doctoral Dissertations 1896 - February 2014 by an authorized administrator of ScholarWorks@UMass Amherst. For more information, please contact [email protected].

IMPROVING THE PRINCIPAL'S EFFECTIVENESS THROUGH ORGANIZATIONAL BEHAVIOR MANAGEMENT (OBM) PROCEDURES
GOAL SETTING AND PERFORMANCE FEEDBACK
A Dissertation Presented
by
ALEX GILLAT
Submitted to the Graduate School of the University of Massachusetts in partial fulfillment
of the requirements for the degree of
DOCTOR OF EDUCATION
May 1989
School of Education
Alex Gillat 1989
All Rights Reserved
IMPROVING THE PRINCIPAL'S EFFECTIVENESS THROUGH ORGANIZATIONAL BEHAVIOR MANAGEMENT (OBM) PROCEDURES
GOAL SETTING AND PERFORMANCE FEEDBACK
A Dissertation Presented
by
ALEX GILLAT
Approved as to style and content by:
$ 1 vey B. Sqribner, Chairperson of Committee
Clement A^-^eldin, Member
Beth Sulzer*~Azarof Membe^F

ACKNOWLEDGEMENTS
The completion of this dissertation is a significant
point in my professional development. It required both
intellectual and psychological support and I could not have
reached it on my own. To identify and credit those
individuals who intentionally or unintentionally contributed
to its completion is a monumental task. Nonetheless, an
attempt to do so must be undertaken and I am pleased and
grateful to acknowledge, at least, the most significant
contributors:
Many thanks to all my committee members for their
unfailing advice, assistance, encouragement, and enthusiasm;
they were always there when I needed help, with patience and
insightful suggestions, and they provided the intellectual
stimulation that enabled me to move ahead.
The teaching and guidance of Harvey Scribner, my present
chairperson, with his humanistic interest in pupils, have
been a continuous intellectual challenge and an example of
what a professional should be; his sensitivity to my need
for reinforcement at the critical period is greatly
appreciated.
I was deeply inspired by the encouragement and
enthusiasm of my previous chairperson, Bill Fanslow, and
greatly benefited from his constant concern, critisism, and
friendship.
iv

To Clement Seldin, an admired and trusted friend, who
activates others with warmth and energy, I extend my
profound gratitude for his patience, valuable criticism,
support - both moral and academic - and expression of faith
in my ability.
Beth Sulzer-Azaroff, my major supervisor and mentor,
merits a special mention. Throughout.my doctoral program, I
found her untiring readiness to listen and help quite
remarkable and very rewarding indeed. The quality and shape
of this dissertation owes much to her encouragement,
enthusiastic confidence and faith in my ability, as well as
to her timely and constructive feedback. Her constant
support, assistance and advice was invaluable to this
endeavour, and the many times she went well beyond "the call
of professorhood” are greatly appreciated. Beth, you are a
true scholar and a true friend - my deepest gratitude and
appreciation for everything.
I am indebted to, and sincerely wish to thank, the
principals, teachers, and students who participated in this
research and remain anonymous - without their cooperation
and input, this research would have been impossible to
complete.
Andrea, Barbara, Jennifer, Karen, Tim, Velga, and Wendy,
my research assistants, thank you for your participation,
far beyond the call of duty; your performance was highly
professional.
v
I could never adequately express my appreciation to my
family, who patiently enabled me to devote my attention to
my studies:
My dear children Ziv, Noga and Shachar, thank you for
missed weekends and vacations. Ziv, my wizard guide through
the mazes of computer operations - your patience is much
appreciated.
My parents, who provided me with the education that was
the basis for my professional life, thank you for your
endless love and continuous support, thank you for believing
in me.
My last and perhaps most important indebtedness goes to
my partner in life, my wife Batsheva. Her encouragement,
support, understanding, love and unwavening faith in my
ability to accomplish this research made the many hours of
frustration pass by less painfully. You played a substantial
role in my education, and for this resource I am forever
indebted to you. Thank you for sharing your life with me.
Finally, I want to express my thanks to all my friends
who have supported me and helped me get to where I am today.
vi

ABSTRACT
IMPROVING THE PRINCIPAL'S EFFECTIVENESS THROUGH ORGANIZATIONAL BEHAVIOR MANAGEMENT (OBM) PROCEDURES:
GOAL SETTING AND PERFORMANCE FEEDBACK
MAY 1989
ALEX GILLAT, B.S.W., UNIVERSITY OF HAIFA, ISRAEL M.A., UNIVERSITY OF HAIFA, ISRAEL
Ed.D. , UNIVERSITY OF MASSACHUSETTS
Directed by: Professor Harvey B. Scribner
This research tested the application of organizational
behavior management (OBM) procedures in order to improve
principals' effectiveness and teachers' and students'
performance. After establishing baseline rates for: 1)
principal and teachers' verbal praise, non-verbal feedback
and goal setting and, 2) academic performance of students,
in three classes in two schools (one, elementary school, the
other, secondary), treatment conditions were introduced in
two different experimental designs: single-subject reversal
design and multiple-baseline across-subjects design. During
the intervention phases, the rates of praise, feedback and
goal setting increased, as well as the academic performance
of the students. The principals' effectiveness with an
important instructional leadership skill was demonstrated.
The results suggest that the behavior of principals and
teachers may change positively after the application of OBM
procedures and may positively impact upon students
performance.
Vll
TABLE OF CONTENTS
page
ACKNOWLEDGEMENTS
ABSTRACT .
LIST OF TABLES
LIST OF FIGURES
vii
. x i
Chapter
I INTRODUCTION .1
Research Questions .10
II REVIEW OF RELEVANT LITERATURE .12
The Principal as an Effective Instructional Leader: Characteristics and Major Issues.12 Characteristics of Leadership .13’ Issues in Effective Leadership .26 Summary .30
Organizational Behavior Management (OBM) .34
III
Definitions, Characteristics and Contributions of OBM .37
OBM Roots: Behavior Analysis and Applied Behavior Analysis .45
Performance Based Feedback and Goal Setting .49 Illustrative Application of OBM .58 Summary .64
METHOD .
Setting ....
Schools Classes
Subjects 69
Principals Teachers . Students .
69 70 71
Apparatus .
Dependent Variables
71
72
viii
Chapter page
IV
V
Principal Variables .. Teacher Variables .. Student Variables .73
Observational System .73
Observers .73
Observer Training .74
Observational Procedures .75
Reliability .79
Experimental Design .82
Experiment I .82 Experiment II .82
Procedure .83
Experiment I .83 Experiment II .85-
RESULTS .89
Reliability .91
Experiment I .94
Principal Behavior .94 Students’ Academic Performance .97 Summary of Major Findings in Exp. I....100
Experiment II .112
Teacher Behavior .112 Students' Reported Reading Rate.114 Summary of Major Findings in Exp.II....118
DISCUSSION .133
Factors and Issues That may Have Affected the Results .13c
Cost-benefit Analysis of OBM Procedures .
Indirect Benefits of Principal Participation in OBM Procedures
Future Applications and Implications
A Personal Statement .
139
140
141
144
ix

Chapter page
APPENDICES ..
A. OBSERVATIONAL FORM FOR PRINCIPAL A.147 OBSERVATIONAL FORM FOR TEACHER 2 .*148 OBSERVATIONAL FORM FOR STUDENTS.’.149
B. WORKSHOP: OBSERVING AND RECORDING BEHAVIOR ..
C. WALL-CHARTS ..
D. SELF-RECORDING FORM FOR STUDENTS IN EXPERIMENT II .152
E. LETTER TO PARENTS’ PARENTS IN EXPERIMENT II .153
REFERENCES .154
x

LIST OF TABLES
T a b 1 e page
1. Inter-observer Reliability for Principal’s Behavior During Experiment I . 92
2. Inter-observer Reliability for Teacher's Behavior During Experiment II . 93
3. Statistical Significance of Principal A’s Change of Behavior . 96
4. Student/subjects Mastery of Multiplication Tables ... 99
5. Statistical Significance of Students’ Change in Their Academic Performance During Experiment I .101
6. Statistical Significance of Teacher 2’s Change of Behavior During Experiment II ... 114
7. Statistical Significance of Students' Change in Their Reported Reading Rates During Experiment II .. 116
xi

LIST OF FIGURES
Figure page
1. Behavioral contingency
2. Diagram of treatment conditions for experiment I .85
3. Diagram of treatment conditions for experiment II .88
4. Percentage of intervals in which principal sets goals .102
5. Percentage of intervals in which principal uses non-verbal feedback .103
6. Percentage of intervals in which principal uses praise .104
7. Student 1: Performance in quizzes on matriculation tables .105'
8. Student 2: Performance in quizzes on matriculation tables .106
9. Student 3: Performance in quizzes on matriculation tables .107
10. Student 4: Performance in quizzes on matriculation tables .108
11. Student 5: Performance in quizzes on matriculation tables .109
12. Student 6: Performance in quizzes on matriculation tables .
13. Student 7: Performance in quizzes on matriculation tables .
14. Percentage of intervals in which teacher sets goals and uses praise and non-verbal feedback, in the 5th Period .
15. Percentage of intervals in which teacher sets goals and uses praise and non-verbal feedback, in the 7th Period .
16. Student 1: Number of pages reported read during 5th period .
xii
page F i g u r e
17. Student 2: Number of pages reported read during 5th period .122
18. Student 3t Number of pages reported read during 5th period .123
19. Student 4: Number of pages reported read during 5th period .124
20. Student 5: Number of pages reported read during 5th period .125
21. Student 6: Number of pages reported read during 5th period .126
22. Student 1: Number of pages reported read during 7th period .127
23. Student 2: Number of pages reported read during 7th period .128
24. Student 3*. Number of pages reported read during 7th period .129
25. Student 4: Number of pages reported read during 7th period .130
26. Student 5: Number of pages reported read during 7th period .131
27. Student 6: Number of pages reported read during 7th period ..132
xiii

CHAPTER I
INTRODUCTION
Over the past years research has been conducted which
describes effective schools (Brookover and Lezote, 1979;
Venezky and Winfield, 1980; Phi Delta Kappan Study, 1980;
Edmonds, 1979). A recurring theme from the research is that
principals of effective schools tend to be strong
instructional leaders who are perceived as playing a crucial
role in influencing their schools' achievement. Further
studies of effective principals corroborate the findings
(Blumberg and Greenfield, 1980; Rosenblum and Jastrab, 1980;
Leithwood and Montgomery, 1982; Little, 1982; Snyder, 1983).
They describe how principals exercise their leadership to
influence the instructional program, and indicate that
principals can make a fundamental difference in the
performance of a school by involving staff members in school
improvement planning, specific teacher and program
development and in careful assessment.
Based upon the studies mentioned above, this writer
concludes that effective schools have effective leaders and
that much of what the school does to promote achievement is
within the principal's power to influence and control.
Specifically, there are leadership behaviors documented that
have been consistently associated with schools that are
well-managed and whose students achieve. Some of the above
1

are: emphasizing achievement; providing an orderly
atmosphere; evaluating student progress; supporting teachers
and coordinating instructional programs.
Writings of many other researchers (Kroaze, 1984;
McIntyre and Morris 1982; Seifert and Beck, 1981; Zaleznik,
1977) underscored the discrepancy between the perceptions of
the principal as an instructional leader as perceived by the
school superintendents and boards of education and that of
teachers who often view the principals, not as instructional
leaders, but rather as school managers. The existing data
tend to support the teachers* view. Still further research
on the principalship document an inordinate amount of time
by principals spent on non-instructional activities. A
national survey on the secondary principalship by Byrne,
Hines, and McLeary (1978), pointed out that even if program
development is ranked first in importance by principals, the
largest portion of their time is actually spent in what
principals themselves have enunciated as the less important
functions of school management: personnel activities,
student activities, and student behavior. Peterson (1977)
found that principals spend less than 5% of their time in
classrooms and that the planning and coordinating of
curriculum and instruction consume less than 6% of their
time.
2

More specifically, research studies (Howell, 1981;
Wolcott, 1983; Peterson, 1977), reveal that principals
engage in activities that are short, highly varied, change
frequently, and they must often change gears since many of
the activities are initiated by others. Indeed, the fact
that many of the activities or interactions are initiated by
others may be at the core of the problem. Principals tend
not to control their time, especially if they do not have
assistants. Rather than being proactive in their use of
time, principals allow themselves to be reactive. For
instance, the principals’ most carefully laid plans often
are interrupted by irate parents, disruptive students, minor
problems in the hall or by teachers. The principal must
react to those situations and, as a result, good plans or
intentions or well-planned activities are postponed. Very
often, unfortunately, these ’’intentions” include activities
devoted to instructional leadership (like supervision,
observation of classroom instruction and/or staff
development). In short, the problem, is that the principals
become followers (of internal or external events and rules)
instead of educational leaders in a pro-active style.
The purpose of this research was to try to improve
principals’ effectiveness in terms of their instructional
leadership roles. To accomplish this task, the researcher
has applied methods based upon Organizational Behavior
Management (OBM). This decision, to utilize OBM techniques
3
for principals’ behavior, has stemmed from the contributions
of OBM to managerial effectiveness: ’’The field of OBM
consists of the development and evaluation of performance
improvement procedures which are based on the principles of
behavior discovered through the science of Behavior
Analysis. The goal of the field of OBM is to establish a
technology of broad scale performance improvement and
organizational change so that employees will be more happy
and productive, and so that organizations and institutions
will be more effective and efficient in achieving their
goals”. (Hall, 1980).
Two interventions employed frequently by practitioners
of OBM involve various combinations of performance based
feedback (behavioral data provided to the subject) and goal
setting ( the establishment of behavioral targets ).
Variations of this package have been investigated widely in
business, industry, and human service settings.
Performance feedback, which has been defined as
information provided to individuals about the quantity or
quality of their past performance (Prue & Fairbank, 1981;
Chandler, 1977), is a widely used procedure in
organizational behavior management research. In a review of
the first five volumes of the Journal Qf Organizational
Rphavior Management Balcazar, Hopkins, and Suarez (1984)
found that some form of performance feedback was used in 60%
4

of the articles. Much evidence suggests that feedback is
effective, programmatic simplicity, low cost and,
flexibility have made performance feedback an attractive
procedure (Fairbank and Prue, 1982). Additionally,
performance feedback has produced improvements in a variety
of organizational areas, such as: tardiness and absenteeism
(Lamal and Benfield, 1978), customer service (Brown,
Mallott, Dillon and Keeps, 1980) and, safety (Sulzer-Azaroff
and deSantamaria, 1980)
Goal setting has been found to be an effective approach
for improving a number of areas of educational performance
(e.g. Latham and Yukl,1975). In general, goal setting
entails specifying a level of performance toward which the
individual or the group plans to work. As the theory of goal
setting states: "An individual’s conscious goals regulate
his/her behavior; hard goals tend to produce a higher level
of output than easy goals and, specific hard goals lead to a
higher level of output than an abstract or generalized goal
of "do your best"." (Locke, 1968)
Goal setting and feedback can be combined to
successfully change managerial behavior. The effects of
performance feedback and goal setting on organizational
behavior have been demonstrated in a variety of human
service settings across a broad spectrum of behaviors and
with subjects differing on a number of important dimensions
5

(Frederiksen and Johnson, 1981; Kim and Hammer, 1976;
Ivancic, Reid, Iwata, Faw and Page, 1981). It is not
surprising that a combination of goal setting and feedback
has been found to be more effective than either goal setting
or feedback in isolation, by the principal alone. The
combination of goal setting (antecedent) and feedback
(antecedent and/or consequence) should result in the
establishment of behavior under stimulus control and
consequently an increase in performance levels. In order to
establish stimulus control, behavior must be differentially
reinforced (e.g. praised, supplied with feedback) in the
presence of a stimulus (e.g. goal). If, indeed, optimal
performance is achieved by using both goal setting and
feedback, then it can be assumed to have come under stimulus
control. Goal setting alone may be ineffective because the
behavior of concern has not been adequately differentially
reinforced in the presence of the goal. Similarly, feedback
alone may be ineffective because its delivery has not been
paired sufficiently with a reinforcing stimulus in the past.
As indicated previously, studies of observed managerial
work suggest that principals spend a great deal of time
reacting to immediate stimuli in the environment. A typical
principal's day appears to be unstructured, filled with
constant disruptions and distractions arising from a
continuous round of personal visits, telephone calls,
meetings and, incoming paperwork (letters, memos, reports,
6

reference data and so on). These constantly recurring
activities appear to fill most of the principal’s time. One
of the possible answers to this issue can be Time
Management.
As mentioned earlier, management is often characterized
by: ”a series of interruptions interrupted by other
interruptions”. Finding sufficient time to complete all the
routine tasks that must be done in addition to "putting out
all the daily fires" can be both difficult and demanding.
Since most of a manager’s day is unstructured, with various
blocks of discretionary time and an equal variety of
discretionary tasks, matching tasks and time can be one of
the most important functions managers can perform for
themselves. Hanel, Martin, and Kook (1982) corroborate the
previous findings by emphasizing that: "Time management
deficiencies of managers are characterized by the following
typical situations: short-term crises manage the day; much
time is wasted in meetings; frequent work interruptions
occur during the day; disorganized work areas and filing
systems are evident; authority and responsibility are
delegated inappropriately and managers appear to be
constantly busy but accomplish little."
According to Hall and Hursch (1982) effective time
management consists of using procedures which are designated
to help the individual to achieve his or her desired goals.
7
In general terms, effective time management means the right
task is performed at the right time, work is organized and
progressed at comfortable pace, and most important -
individuals’ nonverbal behavior matches their verbal
behavior (i.e. actual work matches the plans of the person).
Basic procedures include specification of behavior
(planning), observation (measurement of time use) and
consequation (feedback and reinforcement).
Although, as indicated before, considerable evidence has
demonstrated the successful application of OBM in business
and industry. More recently, OBM principles increasingly
have began to serve a significant role in improving the
effectiveness of educational and other human service
agencies. (Andrasik, 1979; Riley and Frederiksen, 1984). As
emphasized by Sulzer-Azaroff (1983) : "Behavior modification
has been contributing toward making educational systems more
effective and satisfying to students and school personnel."
Many studies have been conducted to improve classroom
management and/or teaching skills but only few have
demonstrated that the principal can use ABA or OBM
approaches in the field of educational administration.
(Brown, Copeland and Hall, 1972; Copeland, Brown, Axelrod
and Hall, 1972; Maher, 1981; Nau, O'Neil and VanHouten,
1981; Souweine, Sulzer-Azaroff and Frederickson, 1977).
8
As suggested earlier, the primary purpose of this
research was to provide a better understanding of the
interaction between OBM procedures, such as: goal setting
and performance feedback and educational administrators.
While no single, commonly agreed upon definition of
effective principals exists, both researchers and
practitioners generally identify effective principals
partially on the basis of organizational performance such as
student performance scores. In other words, as Manasse
(1982) stated in her research: "There is often agreement
among the various data sources that when certain principals
are effective, the students in their schools perform well,
academically..." Assuming the principals’ main task is to
encourage and to enable learning, OBM procedures may be
applied toward structuring principals’ work in order to
promote the effectiveness of the learning-teaching process.
Measures of the learning-teaching process will inform
teachers and principals about how well students are learning
what has been taught in classrooms. Principals need to
supply this feedback to teachers and students at the correct
time while goal setting, can be related to students
achievement and to performance of the professional school
staff. Effective principals also can use goal setting to
guide staff in identifying and analyzing different
educational issues connected with planning and instruction.
By having a clear vision of the school/class/students goals,
9
principals can set priorities so their time is not consumed
only by administrative or maintenance tasks. The importance
of goal setting to the effective principals leads to the
other component of OBM: time management. By training
principals to monitor their day-by-day activities, a better
picture of their plans, priorities, expectations will be
developed. During the process of weigh conflicting needs,
matching resources with expectations and balancing all the
priorities in the course of their daily interactions,
principals can collect information and develop action plans
and strategies to implement them properly.
Taking into consideration that OBM approaches such as
performance feedback, goal setting, and time management are
being used in a wide variety of organizations, it appears
that OBM is moving toward increased acceptance and more
widespread application in the educational settings, too.
Apparently, applying OBM procedures directed toward the
process of educational improvement, by increasing the
effectiveness of school principals, appears to be a
promising direction to follow.
Research Questions
This research sought to assess the functional
relationship between the principal's application of OBM
methods and the performance of teachers and students. For
10

students, the research was limited to their academic
achievement in math and reading.
Therefore, the research constituted an attempt to answer
the following questions:
1. What is the effect, if any, of the principal and
teacher’s rates of goal setting, verbal praise and
non-verbal feedback would there be, following the
treatment conditions (OBM training sessions, and OBM
procedures)?
2. If the principals and the teachers gave verbal
praise, and non-verbal feedback and set goals for the
students, to what extent would that affect the
academic performance of the students in math and
reading skills?
11
CHAPTER II
REVIEW OF RELEVANT LITERATURE
IJlfi-Principal—as—an—Effective—Instructional Leadpr;
CJiarecter ist ics_an <3_Ma.ior Issues
One of the major barriers to effective instructional
leadership is that principals often do not have a clear
concept of their role and responsibilities. The professional
literature emphasizes different aspects of leadership but,
at the same time, groups and individuals who principals
contact regularly may emphasize other aspects of the
principals’ job so, the confusion can be considerable.
Therefore, the purpose of the review is to describe and
discuss the characteristics of the effective school
principal, including: instructional leadership, promotion of
student achievement, organizational climate. Surveying the
literature on the broad range of principal behaviors in the
instructional area, this section will present some
significant findings of effective schools / effective
principals research as they relate to instructional
leadership. In order to conceptualize the effective school
leader, it will be helpful to discuss characteristics of
ineffectiveness.
Specifically, this section will present:
1. An examination of the sources dealing with the
12

characteristics of effective and ineffective school
principals;
2. A presentation of major issues such as: a) problems in
the management process, and b) managerial skills,
competencies and functions, which are characteristic of
effective principals’ involvement in the instructional area.
3. Summary.
Characteristics of Leadership
Effective leadership
Much research define the kind of person who is likely to
be effective as a school administrator; the question of
"what behavioral characteristics differentiate between
effective and ineffective school administrators" began with
the assumption that: there are several behavioral
characteristics which can be described and which
differentiate between effective and ineffective school
administrators.
A reasonably extensive body of evidence gathered by
many researchers through in-depth studies, support the
proposition that the principal makes a difference in
schools. Effective schools have effective leaders and much
of what the school does to promote achievement is within the
principal’s power to influence and control. Specifically,
there are some leadership behaviors that have been
13

consistently associated with schools that are well-managed
and whose students achieve.
In his recent book, Benjamin (1981) summarized several
characteristics of principals of effective schools. These
principals:
1. Take strong initiative in identifying and articulating
goals and priorities for their schools. They run the
schools rather than allowing them to operate by force of
habit.
2. Hold themselves and their staffs personally accountable
for student achievement in basic skills.
3. Understand educational programs very well. They are
instructional leaders rather than administrative leaders.
Their first priority is instruction and they communicate
this to staff.
4. Are highly visible in the classrooms and hallways of the
schools.
5. Care more about their schools’ academic progress than
human relations or informal, collegial relationships with
their staff members.
6. Attempt to "hand pick" their staff members. They put
pressure on incompetent teachers to leave and find ways to
reward excellent teachers.
7. Set a tone of high expectations for their staff and
students.
14
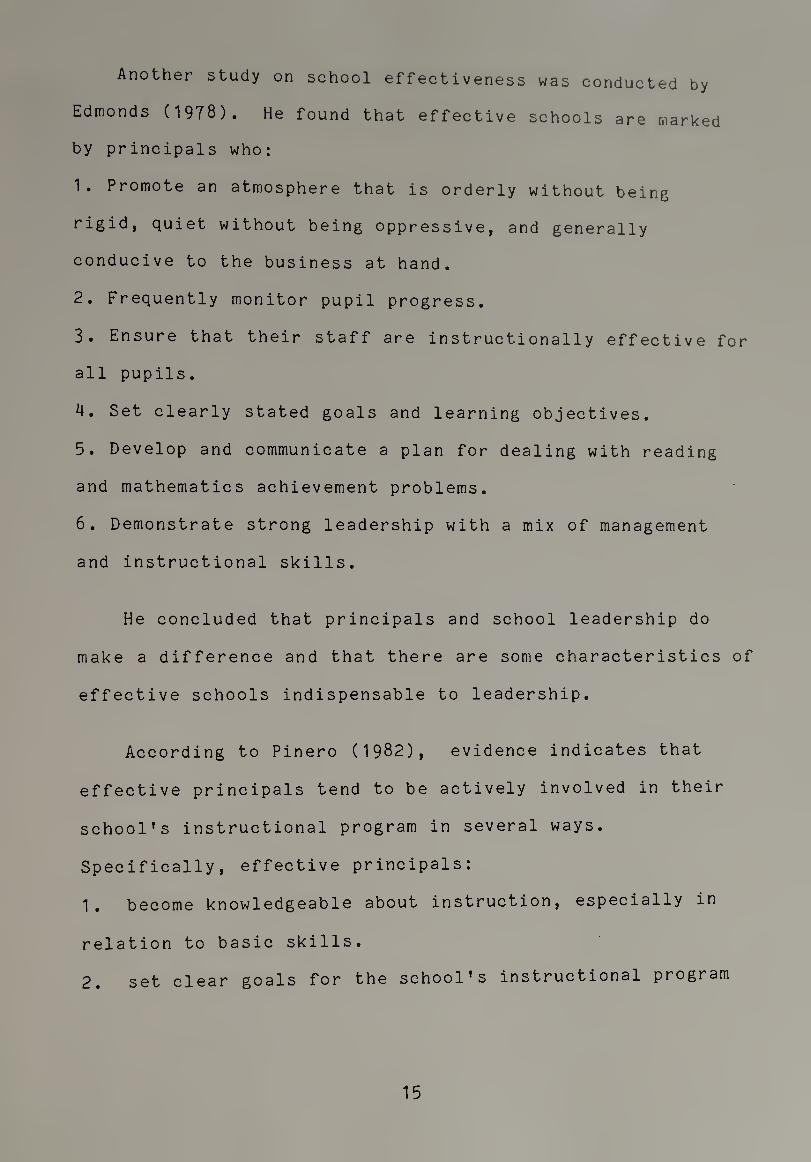
Another study on school effectiveness was conducted by
Edmonds (1978). He found that effective schools are marked
by principals who:
1. Promote an atmosphere that is orderly without being
rigid, quiet without being oppressive, and generally
conducive to the business at hand.
2. Frequently monitor pupil progress.
3. Ensure that their staff are instructionally effective for
all pupils.
4. Set clearly stated goals and learning objectives.
5. Develop and communicate a plan for dealing with reading
and mathematics achievement problems.
6. Demonstrate strong leadership with a mix of management
and instructional skills.
He concluded that principals and school leadership do
make a difference and that there are some characteristics of
effective schools indispensable to leadership.
According to Pinero (1982), evidence indicates that
effective principals tend to be actively involved in their
school’s instructional program in several ways.
Specifically, effective principals:
1. become knowledgeable about instruction, especially in
relation to basic skills.
2. set clear goals for the school’s instructional program
15
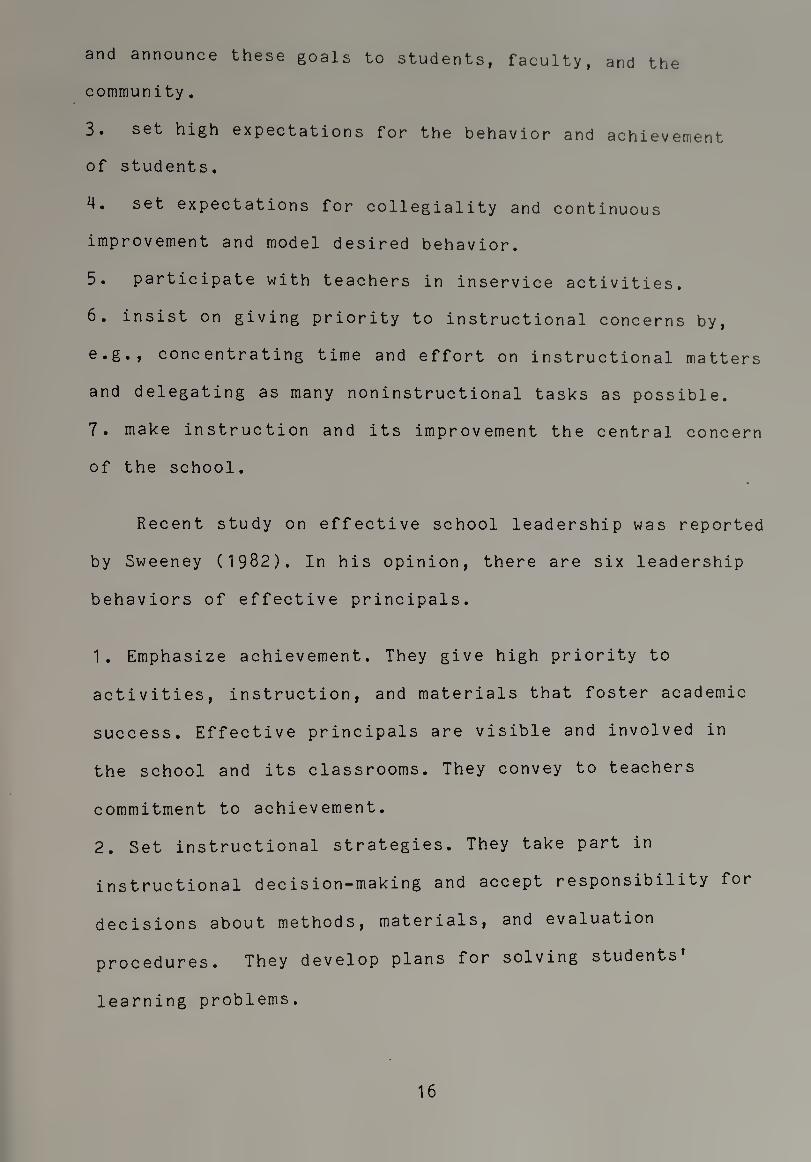
and announce these goals to students, faculty, and the
community.
3 • set high expectations for the behavior and achievement
of students.
4. set expectations for collegiality and continuous
improvement and model desired behavior.
5. participate with teachers in inservice activities.
6. insist on giving priority to instructional concerns by,
e.g., concentrating time and effort on instructional matters
and delegating as many noninstructional tasks as possible.
7. make instruction and its improvement the central concern
of the school.
Recent study on effective school leadership was reported
by Sweeney (1982). In his opinion, there are six leadership
behaviors of effective principals.
1. Emphasize achievement. They give high priority to
activities, instruction, and materials that foster academic
success. Effective principals are visible and involved in
the school and its classrooms. They convey to teachers
commitment to achievement.
2. Set instructional strategies. They take part in
instructional decision-making and accept responsibility for
decisions about methods, materials, and evaluation
procedures. They develop plans for solving students'
learning problems.
16

3. Provide an orderly atmosphere. They do what is necessary
to ensure that the school’s climate is conducive to
learning: it is quiet, pleasant and well-maintained.
4. Frequently evaluate student progress. They monitor
student achievement on a regular basis. Principals set
expectations for the entire school and check to make sure
those expectations are being met. They know how well
their students are performing as compared to students in
other schools.
5. Coordinate instructional programs. They interrelate
course content, sequence of objectives, and materials in all
grades. They see that classroom experiences have bearing on
the overall goals and program of the school.
6. Support Teachers. Effective principals communicate with
teachers about goals and procedures. They support teachers
attendance at professional meetings and workshops, and
provide inservice training that promotes improved teaching.
Summarizing the most common characteristics of
principals based upon the studies mentioned above, effective
principals tend to have high energy levels, to be willing to
work long hours, to be good listeners and observers and to
have wel1—deve1oped expressive and interpersonal skills.
They create images of their schools consistent with their
visions. Then, using their understanding of the community
and the organizational setting, they structure their work,
17

set priorities and adapt their leadership style to make
their vision of their school into reality.
Several roles can be emphasized that link together to
provide a framework for the major principalship tasks and
functions, mentioned above and in many other studies.
The first role is to be a statesperson. As educational
statespersons, principals are primarily concerned with their
school’s overall mission, philosophy, values, and beliefs as
well as with the quality and relevance of the school’s broad
goals and objectives. They give attention to the school’s
overall educational program and broad design for schooling,
ensuring that it reflects accepted values and goals. They
work to communicate the school’s mission to outside
committee and/or superiors, seeking support and obtaining
necessary funds. They also must accept responsibility for
developing the educational policy of the school. (Benjamin,
1981; Jansen, 1967; Vaill, 1981)
The educational leadership role is the second role to be
considered. This role is concerned with the actual
development and articulation of educational programs and
includes such concerns as curricular and teaching
objectives, subject - matter content and organization;
teaching style methods and procedures; classroom learning
climates; student, teachers and programs evaluations.
(Benjamin, 1981; Edmonds, 1979; Jansen, 1967; Sweeney, 1982)
18

Supervisory leadership is the third role. Principals
work with teachers to obtain their commitment to agreed upon
school goals and that facilitates their ability to work more
effectively on behalf of those goals. The supervisory
leadership role encompasses such concerns as staff
development and clinical supervision. (Benjamin, 1981;
Edmonds, 1979; Jansen, 1967; Park, 1982; Pinero, 1982;
Sweeney, 1982)
The organizational leadership role is another important
role because schooling takes place in an organized setting.
Without attention to this important role, school can easily
become comfortable bureaucracies, in which someone is apt to
find that formal structure determines objectives and
patterns of work. Effective principals express strong
organizational leadership to ensure that school purposes,
objectives and work requirements are these which determine
school organizational structure patterns. (Benjamin, 1981;
Edmonds, 1979; Jansen, 1967; Park, 1982; Pinero, 1982;
Sweeney, 1982; Vaill, 1981)
The fifth role is administrative leadership. This role
maybe the least "glamorous" among the others but
nevertheless is very important; it seeks to provide the
necessary support systems and arrangements intended not only
to facilitate, but also to free teachers to devote increased
time and energy to teaching and learning Poor organization
19

of work, mismanaged scheduling routines, unreliable
technical services, supplies and equipment shortages,
inadequate information are only few examples of obstacles to
effectiveness and efficiency in schools. (Park, 1982;
Pinero, 1982; Sweeney, 1982)
The sixth role for principals is the team leadership. As
team leaders, the principals help develop a mutual support
and trust among teachers, and between teachers and
principals as they work together to build an effective
school. (Park, 1982; Pinero, 1982; Sweeney, 1982)
In_g-££ective leadership
The problem of selecting school principals has bothered
school superintendents and boards of education for many
years. They find themselves in a state of indecision when
forced to decide among some applicants for an administrative
position. Sometimes they make mistakes - especially when no
proven criteria exist regarding the characteristics
necessary for effective school administration. Fortunately,
more and more research is being aimed at defining the kind
of person who is likely to be effective as a school
principal.
Another important question is what behavioral
characteristics differentiate between effective and
ineffective principals. Three studies will be used to
illustrate this point.
20
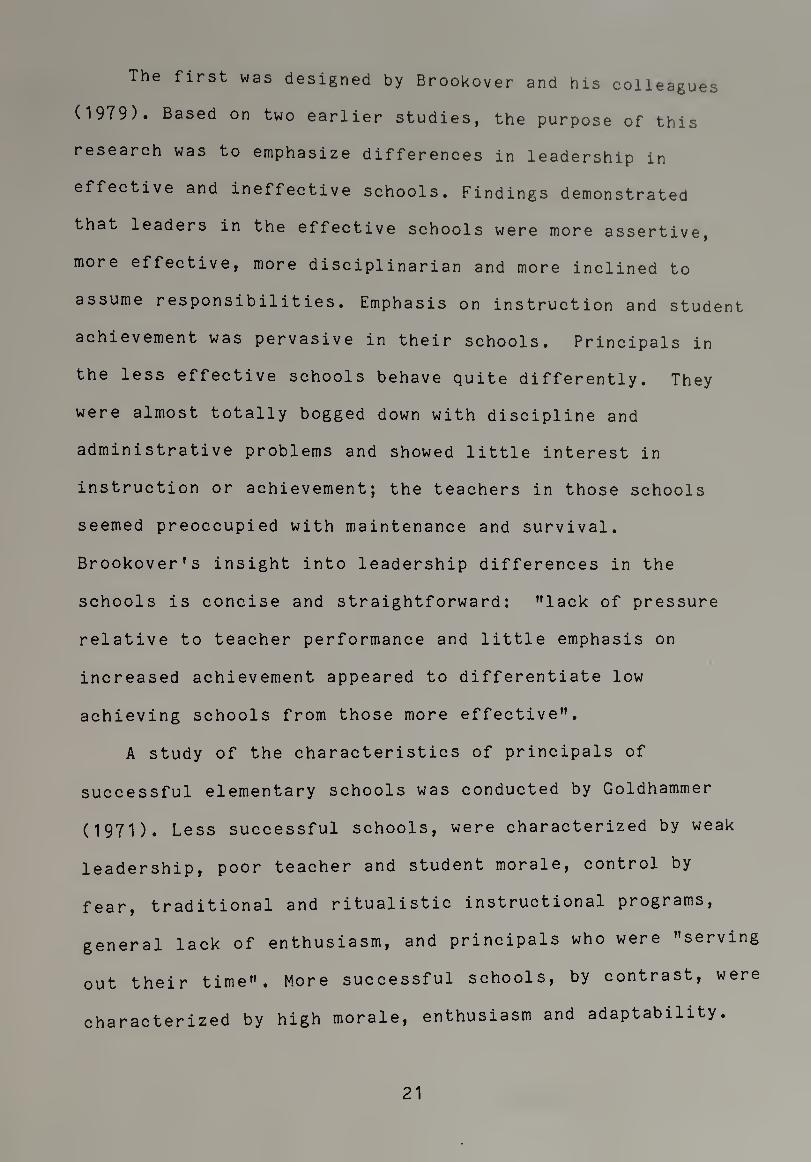
The first was designed by Brookover and his colleagues
(1979). Based on two earlier studies, the purpose of this
research was to emphasize differences in leadership in
effective and ineffective schools. Findings demonstrated
that leaders in the effective schools were more assertive,
more effective, more disciplinarian and more inclined to
assume responsibilities. Emphasis on instruction and student
achievement was pervasive in their schools. Principals in
the less effective schools behave quite differently. They
were almost totally bogged down with discipline and
administrative problems and showed little interest in
instruction or achievement; the teachers in those schools
seemed preoccupied with maintenance and survival.
Brookover’s insight into leadership differences in the
schools is concise and straightforward: "lack of pressure
relative to teacher performance and little emphasis on
increased achievement appeared to differentiate low
achieving schools from those more effective".
A study of the characteristics of principals of
successful elementary schools was conducted by Goldhammer
(1971). Less successful schools, were characterized by weak
leadership, poor teacher and student morale, control by
fear, traditional and ritualistic instructional programs,
general lack of enthusiasm, and principals who were "serving
out their time". More successful schools, by contrast, were
characterized by high morale, enthusiasm and adaptability.
21
They were uplifting places to visit and inhabit. The
principals of those schools were able not only to recognize
problems but also to face them with inspiring leadership and
hard work. They displayed leadership supported by a belief
system, which included an overriding commitment to children,
teaching, and teachers. They seemed to be following Peter
Drucker’s (1967) advice to concentrate "efforts and energies
in a few major areas where superior performance produces
outstanding results". They established priorities and stayed
with priority decisions. They seemed to feel that they had
no alternatives but to do first things first.
The third study was reported by Rutherford (1985). He
discussed distinctions between more effective and less
effective principals emerging from a five year investigation
conducted by researchers from the University of Texas. Five
essential qualities of effective and less effective
principals were identified.
a. Vision: The principals were asked "what is your
vision for this school, your long-range goals and
expectations?" The effective principals began immediately to
list their goals for their school and they responded with
enthusiasm; they had clear informed visions of what they
want their school to become, they focused on their students
and their needs. The less effective principals responded
after a long pause with non-specific statements and usually
22

in reference to specific goals that had been written to
satisfy the supervision; they spoke without enthusiasm,
without any vision for the school, focusing in the "here and
now”.
b. Translating the vision: When the principals had
visions for their schools’ future, usually their teachers
described those schools as good places for students and for
teachers and they were identified as the most influential in
determining what happened in the schools. They translated
the visions into goals for their school and expectations for
their teachers or students. The teachers in the less
effective schools spoke only about their work and their
problems and the schools’ problems. It appeared they lacked
a common understanding of school-wide goals.
c. A supportive environment: The effective principals
allocated funding and materials in ways that maximize
teaching effectiveness and thus student achievement. They
established a school climate that supported progress toward
these goals and expectations. The less effective principals
honored requests of support only when it was easy, without
creating problems and without any real considerations of
goals or expectations for school improvement or school
effectiveness.
23
d. Monitoring: The more effective principals reserved
time to know what was going on in the classrooms, so they
could provide not only specific details about their
teachers’ performance but also insights into why the
teachers’ performed as they did. The less effective
principals described the teachers' performance in a general
way, without any insight about the daily behavior of
teachers. Monitoring was an activity they carried out only
superficially and they spent most of their working hours
handling management or administrative tasks.
e. Interviewing: The effective principals looked for
positive features and then raised and reinforced the
teachers responsible for them. They also identified problems
and engaged in necessary corrective actions. Because the
less effective principals monitored in a superficial way,
they lacked specific information about their school, they
were unable to provide praise or support and identify and
deal with problems unless those problems were obvious and/or
pressing.
Summarizing these three important studies, all three
corroborated the following behavioral characteristics of
ineffective principals:
1. They formulate policies by themselves, regardless of
results, such as low morale, ambiguity, etc.
24
2. They run the whole school by themselves, without any
delegation of responsibilities.
3. They attempt to maintain outward calmness but they easily
explode about trivial details.
4. Frequently, they repeat the same mistakes but, seldom
admit it.
The clear conclusion drawn from these studies is that
effective principals behave differently from ineffective
ones. The results achieved in the effective schools are very
well recognized by students, teachers and parents.
Another important conclusion is that even among
themselves, effective principals are different because they
are demonstrating different qualities of leadership during
their work. For example, to establish a supportive school
environment, one effective principal might work through a
leadership team, while another might instead form functional
faculty committees; a third effective principal might
develop peer support teams among teachers, and a forth one
might use a variety of techniques to develop a faculty-wide
community. Other effective principals might support their
good teachers through teaching assignments, class
scheduling, and the allocation of such rewards as released
time, purchase of special materials and supplies or public
recognition and positive reinforcement for work well done.
On the whole, all these effective principals are committed
25

to developing a supportive school environment, but their
behavior by which each of them seeks to accomplish their
goal might differ widely.
The fact that effective principals behave in different
ways can be considered advantageous because it means that
they do not have to change their personalities to fit some
predeterminated patterns. Furthermore, it means that, as
situations can change, principals can modify their behaviors
accordingly and still retain their commitment to the
effective leadership.
Issues in Effective Leadership
Problems .in.jnanagement
One of the major barriers to more effective performance
is that educational leaders often do not have a clear
concept of what they are supposed to do. For example: as
Bogue and Saundres ( 1975) vividly described: ’’Some managers
become absorbed in the doing of management; they begin to
think of themselves as some magnificent combination of
coach, quarterback, guard, halfback. They design the plays
and also call the signals; they clear the way, tackle
problems and run through the staff and the students.” This
concept of role mentioned above by these authors ignores the
important fact that one cannot manage and operate
simultaneously.
26
Another version of the ineffective manager is the one
who expends his energy in managerial "clucking". The vision
is a principal who rushes about in a frenzy checking locks
on doors and forms in stock, and never gets far enough away
from trivia to see if his organization is moving toward a
healthy set of goals.
As a result of these issues, the performance of school
principals is informally evaluated daily by the different
individuals and groups with which they have contact.
Furthermore, the basis on which their effectiveness is
evaluated appears to differ from gruop to group. Students,
parents, teachers, the upper echelons of administration
observe principals in relatively different situations and
because of these differences in the conditions under which
they make their observations, they emphasize different
aspects of the principal’s job when they describe what they
consider to be effective and/or ineffective behavior on
their part. The problem is that everybody is quite willing
to add to the list of the principal’s responsibilities
without inquiring about the current ones. As a result,
often innovative instructional leadership (with all the
supplementary components of time management, organizational
climate, etc.) is shelved and replaced by the realities of
personal survival and crisis management.
27

M.an.agsrlal—skills-(_£.QinDetencies and functions)
As McIntyre and Morris (1982) concluded their article,
it would be unrealistic to assume that principals would ever
be in a position to give instructional improvement their
number one priority . Nevertheless, a growing body of
research shows a positive relationship between the
leadership ability of principals and student growth in basic
skill achievement. This means that if principals can improve
their skills in and if their leadership efforts focus on the
characteristics of effective teaching, one can anticipate
more successful schools.
A major conclusion from the ESAA (Emergency School Aid
Act) study appears to be that strength of administrative
leadership is a major factor in the school's ability to
improve student achievement. There is consistent evidence
that improved achievement is likely to be found in schools
whose principals: a) feel strongly about instruction; b)
effectively communicates their viewpoints about instruction
to teachers, through principal/teacher discussions, reviews
of teaching performance; c) take a dominant role in
decisions about the selection of instructional materials and
in program planning and evaluation; and d) emphasizes
academic standards.
28

Clearly, the business of creating an optimum learning
and teaching environment is complex and demands of the
principal a host of characteristics and competencies. In
addition to the characteristics already reviewed in the
previous stage the competencies outlined below apply to many
principals.
LoPresti (1982) emphasizes some competencies that the
school administrator must have to be an effective leader and
to foster the appropriate learning environment. Among them:
1) A knowledge and ability to put into practice or help
others put into practice effective classroom management
techniques.
2) An ability to observe classrooms and provide
constructive criticism and support to the teaching staff.
3) An ability to evaluate staff according to data gathered
in a responsible and reliable manner.
4) A thorough knowledge of students' growth and development
patterns.
5) A knowledge of learning theories and practices.
6) A knowledge of subject matter to such a degree that one
can assist or find others to assist teachers in organizing
content for the most effective instruction.
7) A knowledge of where to find answers or people to asisst
with all educational tasks.
29

Other items could be added to this list but these are
the competencies which focus on the learner, on educational
theories, and on techniques that will assist the principal
in serving as an educational leader among teachers and
students.
Summary
This section cannot conclude with a set of
prescriptions for effective principals. None of the research
on principals reviewed has indicated that any one principal
style is most effective. Actually, if the research is
consistent on any point, it is that there is no single
prototype of the effective principal. A crucial question can
be drawn: if so many characteristics are so difficult to
achieve effectively (maybe some of them do not really exist
?) what is the point of an hypothetical characterization of
a nonexist leader ? The answer is that there are several
possible uses of such a picture, as Mazzarella (1982) has
clearly emphasized:
One may recognize potential leaders by determining if
they have many (but not necessarily all) of these
characteristics. Another is for evaluation - those who
evaluate administrators can use this picture to help them
formulate evaluation criteria. This can be used also for
self-evaluation : those who are in leadership positions can
compare themselves with more effective leaders to see how
30

they measure up. Also, knowing the characteristics of an
effective leader can be useful in planning administrator
training programs, as a guide to which aspects of the job
ought to be emphasized. Finally, the most important use can
be to help leaders set priorities. When things get rough and
they are tempted to lock themselves in their office, such a
vision can remind them that human relations and
communication skills are important. When they are coasting
along, day-by-day, not going anywhere in particular, it can
remind them that being goal oriented and that knowing where
they are going, do make a difference. In short, the most
important use is the function performed by any ideal is that
it offers something toward which to strive. Having a vision
of where the school must go, can be very helpful in the
process of priorities and goal setting.
The importance of the personal vision of the school is a
recurring theme in studies of effective principals. On the
basis of case studies of eight effective principals with
different administrative styles and in various school
environments, Blumberg and Greenfield (1980) concluded that
the common elements of effectiveness are vision, initiative,
and resourcefulness: "While they seem to hold fairly
idiosyncratic perspectives toward their work world and while
these viewpoints appeared to condition their manner and
style of behavior as principals, all eight also: 1) desired
and were eager to make their schools over in "their" image;
31

2) proactive and quick to assume the initiative; and 3)
resourceful in being able to structure their roles and
demands on their time in a manner that permitted them to
pursue what might be termed their personal objectives as
principals." Among many of the studies, articles, and books
on effective schools and principals, this writer chose
Blumberg and Greenfield’s in-depth study of the eight
outstanding principals as a model of excellence, especially
for this conclusion.
The fact that the principals interviewed by those
authors were more different than they were alike is not
surprising. As mentioned before, this is positive. The
personal vision of these effective principals helped them to
set priorities so that they were not consumed by the
organizational maintenance requirements of the job. They
used their resourcefulness to avoid allowing themselves to
become consumed by second-order priorities. A clear image of
their school helped them, too, in making management
decisions that promoted student learning and achievement.
Appropriate management decisions to assign students to
teachers and classrooms, to schedule and to allocate time to
respond to staff proposals for experiment and innovation, to
direct staff development, to observe and to evaluate
teachers, to develop behavior and discipline policies, to
schedule extracurricular activities - all of these
activities can generate and sustain commitment on the part
32
of the students and the staff to the learning goals of the
school.
By identifying strengths and potentials in their
staffs, effective principals can provide learning
opportunities and developmental experience for staff members
while, at the same time, moving the operation of the school
forward and freeing themselves to concentrate on high
priority activities (i.e. using good time management). By
integrating as many of their activities as possible toward
their goals, the effective principals can influence the
instructional program and the learning objectives.
Effective schools require a sense of purpose and
direction provided by well-developed and clearly articulated
goals. If the teachers are in control of the teaching
activities in their classrooms, the principal is responsible
for setting goals for the school as a whole and achieving
concensus among the staff about these goals and priorities.
To be successful in setting goals, the principal must first
have a vision: second, the principal needs the analysis and
intellectualize skills to guide the staff in the process of
identifying and analyzing problems; and finally, the
principal must have the political and managerial skills
necessary to resolve conflict and make the planning process
work.
33
ArKanizational—tLehavidr_Management (orm)
Apparently, effective management skills are crucial for
principals if they are to be successful in their role. The
field of organizational behavior management (OBM) has
evolved numerous methods for promoting managerial skills,
and these should lend themselves nicely to the functioning
of principals in their roles as instructional leaders. A
substantial body of evidence has demonstrated the successful
application of OBM in business and industry, and in recent
years applied behavior analysis (ABA) principles have been
increasingly utilized in business and industry settings
(Andrasik, 1979). Riley and Frederiksen (1984) assert that
OBM can serve a significant role in improving the
effectiveness of human service agencies too. In their
opinion, it is a tool that can improve the effectiveness of
human services personnel. It is a systematic and
well-documented approach that can reduce cost, improve
productivity and help organizations achieve desired goals.
As an integral part of the human services in education,
behavior modification has been effectively implemented to
improve student conduct, teacher performance, academic
quality and productivity, and various adaptive social and
emotional behaviors. Behavior modification has been
contributing toward making educational systems more
34
effective and satisfying to students and school personnel
(Sulzer-Azaroff, 1987).
Today, hundreds of behavioral studies of strategies for
improving students' achievement and conduct, classroom
management, teaching skills, social skills etc. have been
published. In a new volume : "Applied Behavior Analysis in
Education", the editors found that 451 articles on
educational topics were published during the last 20 years
in the Journal of Applied Behavior Analysis.
Surprising - and maybe disappointing - is the fact that
few studies using the application of OBM or behavior
modification have been conducted in educational
administration. Only five studies, related to the school's
principal as a behavior modifier, were found by this
writer: Brown, Copeland, and Hall (1972); Copeland, Brown,
Axelrod, and Hall (1972); Copeland, Brown, and Hall (1974);
Nau, VanHouten, and O'Neil (1981); Souweine, Sulzer-Azaroff,
and Frederickson (1977). Komaki (1982) supports this view
about the scarcity of studies related to administration by
stating that very few published studies exist in which
managers' behaviors have been directly specified, measured
and reinforced. Discussing the achievements of behavior
analysis (BA) and the needs of education, Sulzer-Azaroff
(1986) emphasized that there are numbers of factors that may
35
be preventing acceptance of behavioral methods - among
them:
1) many educators are unaware of, or misinformed about, the
advantages of behavioral strategies;
2) even when they are aware of the benefits of the
strategies, they may lack sufficient skills to implement
them successfully, and
3) current contingencies may impede or fail to support
implementation of the methods. There is little doubt that
principals need to be informed about the advantages of
behavior modification and that OBM has the tools for
analyzing complex behaviors in a principals1 struggle for
effectiveness.
Considering that OBM approaches such as performance
feedback and goal-setting, are being used in a wide variety
of organizations, it appears that OBM is moving toward
increased acceptance and more widespread application.
Applying those OBM principles in the process of improving
the effectiveness of the school principal as an
instructional leadership - seems to be essential.
Therefore, the purpose of this section of the literature
review is to describe and discuss the characteristics of
OBM. Surveying the literature, the writer will present
findings and potential uses of OBM approaches in education.
36
Specifically, this section will focus on the following
sub-sections:
1. Definitions, characteristics and contributions of OBM
2. OBM roots: behavior analysis and applied behavior
analysis
3. Performance-based feedback and goal setting
4. Illustrative applications of OBM
5. Summary
Definitions, Characteristics and Contributions of OBM
Attempts to formally define the field of OBM are few.
Perhaps one of the best working definitions was proposed by
Hall (1980) and was mentioned above in the introduction.
Kreitner (1982) has provided us with another: Organizational
Behavior Management (OBM) involves the process of making
specific job-related behaviors occur more or less often,
depending on whether they enhance or hinder organizational
goal attainment, through the systematic manipulation of (1)
antecedent conditions that serve as cues, and (2) immediate
pleasing or displeasing consequences.
At the heart of this process is the assumption that
the environment, interacts with the person’s response
repertoire to dictate how we behave. This orientation
represents a marked departure from the conventional wisdom
of managing job performance. The usual practice has been to
37
focus either on the person (e.g., needs, attitudes, motives,
traits or drives) or the situation (e.g., task, goals,
rules, supervision, or rewards) but not on the systematic
interaction between the person and the situation.
B.F. Skinner, who pioneered the operant conditioning
field, had outlined a three-stage model to explain how the
environment comes to influence and ultimately control our
behavior. In his words: " An adequate formulation of the
interaction between an organism and its environment must
always specify three things: (1) the occasion upon which a
response occurs, (2) the response itself, and (3) the
reinforcing consequences." More recently, this model of
person-environment interaction has been translated to an
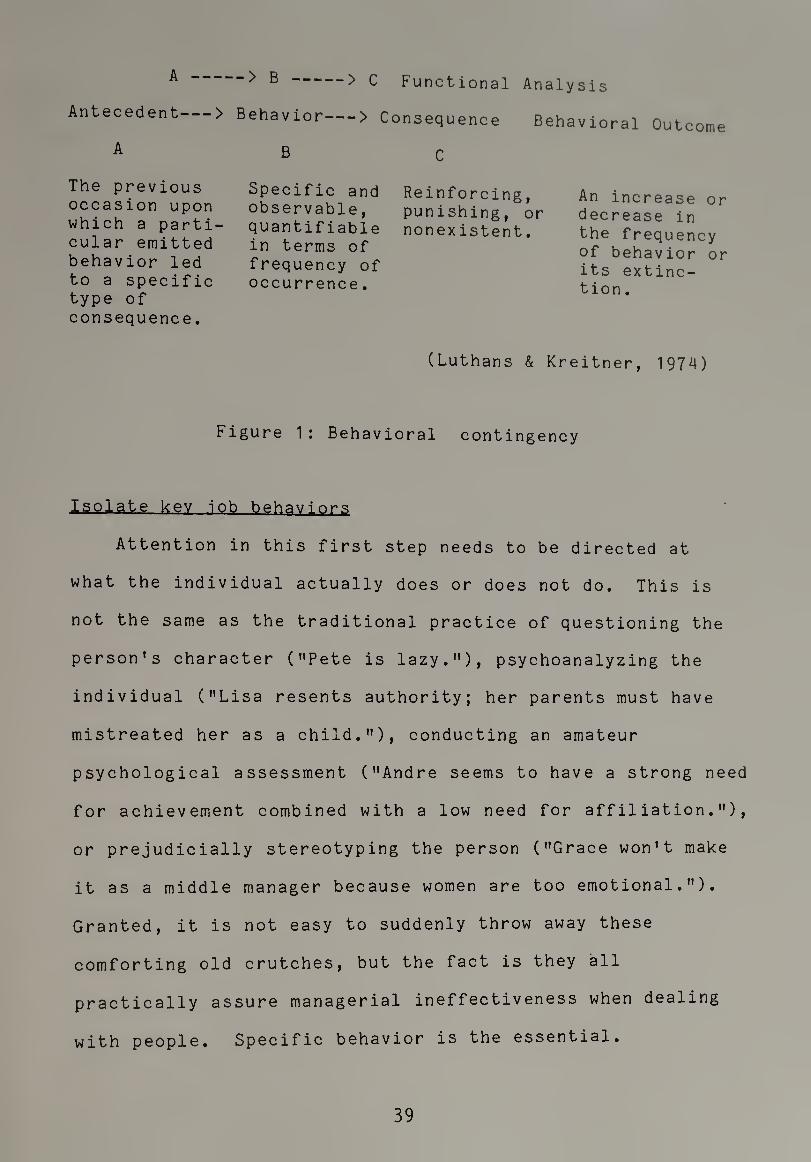
Antecedent-Behavior-Consequence (or A-B-C) model. Both A’s
and C’s are part of the environment situation while the B's
are the person’s specific behaviors. Simply stated, OBM
involves the modification of behavior via environmental
adjustments. The three elements that collectively form a
behavioral contingency and lead to its behavioral outcome
are illustrated on the next page.
Kreitner (1982) has introduced the principles of OBM as
a technology based on the natural science approach to the
study of behavior. He emphasizes three basic principles:
38
> B -> c Functional Analysis
— > Behavior—> Consequence Behavioral Outcome
B C
A -
Antecedent—
A
The previous occasion upon which a parti¬ cular emitted behavior led to a specific type of consequence.
Specific and observable, quantifiable in terms of frequency of occurrence.
Reinforcing, punishing, or nonexistent.
An increase or decrease in the frequency of behavior or its extinc¬ tion .
(Luthans & Kreitner, 1974)
Figure 1: Behavioral contingency
Isolate key job behaviors
Attention in this first step needs to be directed at
what the individual actually does or does not do. This is
not the same as the traditional practice of questioning the
person’s character ("Pete is lazy."), psychoanalyzing the
individual ("Lisa resents authority; her parents must have
mistreated her as a child."), conducting an amateur
psychological assessment ("Andre seems to have a strong need
for achievement combined with a low need for affiliation."),
or prejudicially stereotyping the person ("Grace won't make
it as a middle manager because women are too emotional.").
Granted, it is not easy to suddenly throw away these
comforting old crutches, but the fact is they all
practically assure managerial ineffectiveness when dealing
with people. Specific behavior is the essential.
39
When attempting to isolate key job behaviors, the
managers need to ask themselves the following question:
"What behavior(s) does the individual need to engage in more
often to make a greater contribution to collective
objectives?" This deceptively simple question influences the
managers’ thinking in three important ways. First,
attention is focused on behavior rather than on implied
motives, needs, or drives or on the subjective character
appraisals. Second, attention is focused on important
behavior(s) that are critical to organizational or united
success. Third, attention is focused on what is right
rather than what is wrong with present performance.
Regarding this point, it is more desirable from the
standpoint of creating and maintaining a positive
organizational climate to build up rather than tear down
behavior.
Rearrange antecedents to provide opportunities..and remp.yg
barriers
Recognizing the antecedent conditions are little more
than cues that subtly, yet powerfully, tell us to behave in
a certain manner, many opportunities exist to pave the way
for improved performance. To the extent that opportunities
outweight barriers, the likelihood of more frequent
engagement in desired behaviors is increased.
40
conditional 1Y
Behaviors with favorable consequences will tend to be
repeated while those with negative or no responses will
disappear Managers need to provide a supportive climate for
good performance. In addition to managing antecedents,
managers can do much to improve performance by making sure
that those who give, also get. In other words, by positively
reinforcing those who work well, „e can expect the hard
workers to continue their efforts and good work.
Riley and Frederiksen (1984) have described four major
contributions of OBM, which form the basis for using OBM to
improve staff effectiveness.
The first of these contributions is the theoretical
perspective. As introduced above, OBM is based primarily on
behavioral or operant psychology. As the field has evolved
over recent years, it has broadened somewhat to include the
influences of social learning theory, as well as behavioral
systems of analysis. The adoption of these related
theoretical perspectives has been important for two
important reasons: First, adopting a behavioral perspective
allowed access to a large body of already available
research. The data from operant or social learning
psychology allow one to make predictions and understand
relationships that otherwise might go unnoticed. A second
41

and somewhat related benefit of this theoretical
perspective is that it tells one on what to focus in the
organizational setting. Organizations are complex places.
Those who wish to make changes in an organization must
begin by focusing their attention on some aspect of this
complexity. The theoretical perspective associated with OBM
tells us that we must first look at the employees' behavior.
What is it that they are are actually doing? This is not a
focus on what they think about what they are doing as much
as it is a focus on what their actual behavior is. We must
also focus on the context in which that behavior occurs.
What events or situations immediately precede the behavior
and what consequences follow it? Here again the emphasis is
on the immediately preceding and following events, not the
historical context or long term consequences of a behavior.
This elegantly simple tool provided by the behavioral
perspective has proven to be immensely practical in
simplifying inherently complex situations. In other words,
it tells observers where to focus their attention within
that complexity we call an organization.
The second important contribution is the methodology
of applied behavior analysis. In many ways this may be the
single most important contribution that OBM has to offer.
Applied behavior analysis methodology is unique in several
respects (Baer, Wolf and Risley, 1968; Hersen and Barlow,
1976; Luthans and Davis, 1982). First is its insistence on
42

ongoing measures of actual behavior rather than on single
assessments of how people respond to a test. OBM insists
that the actual behavior of importance be assessed in the
natural environment as it actually occurs rather than in an
artificial testing situation. Further, OBM requires that
these measures be taken continuously rather than at one or
two points. The importance of this requirement can not be
overestimated. It forces one to look at what is actually
happening, on an ongoing basis, in the situation of
relevance. Inferences relating our measurements to the
actual behavior are thus eliminated. Further, any trends in
performance are immediately obvious, as are delayed effects
of our interventions. A related methodological requirement
is the use of single-case rather than between group research
methodology. The important point that single-case
methodology relies on a demonstration of functional control
over behavior rather than statistical control should be
emphasized. In other words, researchers must demonstrate
that that the intervention they are evaluating has a
practical impact on behavior, rather than simply
demonstrating statistical significance. Further, this
methodology eliminates a need for control groups, a feature
that is immensely practical in actual organizational
settings.
A third major contribution of OBM is a body of hard
data. A number of extensive literature reviews (Andrasik,
43

1979; Babb and Kopp, 1978; Frederiksen and Johnson, 1981)
have shown that OBM has accumulated a large volume of
well-controlled experimental studies. These studies are
almost exclusively conducted in organizational settings,
using employees as subjects. They are generally
well-controlled and have demonstrated positive outcomes. Of
importance to our current topic, about half of these studies
have been conducted in human service settings. Thus OBM has
already accumulated an important data base that can be drawn
upon for managing human service settings. Individuals
wishing to improve staff effectiveness in human service
settings do not have to start from scratch. A number of
approaches such as time-management, feedback, goal setting
have already been well-documented in the literature and give
one a head start.
A fourth and final major contribution of OBM is
techniques for behavior change. The field has developed,
tested, and documented the effectiveness of several
techniques that have been consistently shown to change
important staff behavior in organizational settings. The
importance of this is that OBM not only helps us understand
behavior, it also gives us effective tools for managing it.
Among the key methods include the use of goal setting and
performance feedback, positive reinforcement, behavior based
training strategies.

OBM Roots: Behavior Analysis and Applied Behavior Analysis
Organizational Behavior Management (OBM)is an extension
of Behavior Analysis (BA) and Applied Behavior Analysis
(ABA) into the world of work organizations. Behavior
analysis is a basic science concerned with learning the
determinants of behavior via highly controlled laboratory
experiments. Applied Behavior Analysis is an outgrowth of
the experimental analysis of behavior Originally it was to
employ rigorous methods for establishing the applicability
of BA findings to the solution of important social problems
in field settings, hence the term "applied".
Behavior analysis Behavior analysis (BA) and applied
behavior analysis (ABA) are the disciplines most closely
related to Organizational Behavior Management (OBM) BA is a
recent term. What is now BA was once called the experimental
analysis of behavior. Skinner (1966) described the
distinguishing features of the field in terms of the
following: (a) dependent variables, (b) independent
variables, (c) treatment of relations among variables and
(d) attitudes toward research. The dependent variable was
rate of operant response from which its probability was
inferred. Independent variables were stimuli described in
the language of physics. The relationships among
independent and dependent variables were behavior processes
upon which the analyses were focused. The behavior
45
analyst's attitude toward research was to avoid theories
requiring data averaging, hypothesizing and statistical
analyses of data required by theory testing methods.
Behavior analysis has moved beyond the strict data based
approach outlined by Skinner above and now deals with
averaged data and data based theories.
Applied—bghaviQr—analysis As the historical review
indicates, applied behavior analysis has grown out of an
operant perspective on human behavior. The operant approach
has, of course, been characterized by the demonstration of
experimental control over the primary variable of interest:
behavior. As this research strategy has evolved, it has
increasingly been applied to behaviors of social
significance. The application of the principles of
experimental analysis to socially important behavior has
been termed applied behavior analysis (ABA). Luthans and
Martinko (1979) recently characterized ABA as it relates to
organizational management. Their characterization
identified behavior as the primary analytical unit,
emphasized principles of sound experimental research, and
stressed a concern with behaviors of practical significance
to the organization.
A more detailed specification of the characteristics of
applied behavior analysis is to be found in the now classic
article by Baer, Wolf and Risley (1968). In this article,
46

seven characteristics of the ABA approach were identified:
First, it is applied. The behavior chosen for study is
one that is relevant to important concerns of the society
or, in this case, the organization.
Second, it is behavioral. It focuses on what
individuals actually do and not simply on what they say or
how they feel unless these are also of importance to the
problem under study. This is a decidedly pragmatic approach.
In the words of the authors, "Behaviorism and pragmatism
seem often to go hand-in-hand".
Third, it is analytic. A believable demonstration that
the behavior of interest was in fact under the control of
the independent variable is necessary. This is often
translated into the requirement of documenting the
reliability of the dependent measures and providing
demonstrations of experimental control. These demonstrations
have been made possible through the evolution of individual-
subject designs such as reversal or multiple-baseline
designs.
Fourth, applied behavior analysis is technological.
This means that the techniques which make up a particular
intervention are identified and described in such a manner
as to permit replication. The simple identification of vague
techniques (e.g., sensitivity groups, team building) is not
sufficient to meet this requirement.
47

Fifth, applied behavior analysis employs a consistent
system Although it may be possible to identify the
techniques on a strictly operational basis, it is also
necessary to put them within a conceptual framework. This
framework has often involved concepts taken directly from
operant psychology.
Sixth, interventions must be demonstrably effective. The
demonstrated behavior change must be important and of
practical significance. In short, ABA must, by definition,
be effective.
Finally, the behavior change must have some generality.
It is not sufficient to demonstrate significant change in an
extremely limited or artificial environment such as a
laboratory. The effects must be durable and broadly enough
based to effect change in naturally occurring environments.
In practice, the applied behavior analysis approach has
often been translated into procedural steps for managing
problem behavior. While these steps have been articulated
by a number of authors (e.g., Miller, 1978) one of the
clearest presentations was by Luthans and Kreitner (1975).
These authors presented a systematic five-step model they
called behavioral contingency management:
1, Identify the performance-related behavioral event;
2. obtain baseline measurements of the frequency of the
response;
48

3. identify the existing contingencies of reinforcement
through a functional analysis;
4. develop and implement an intervention strategy, and
5. evaluate the effectiveness of the intervention.
To summarize, applied behavioral analysis has grown
out of operant psychology and the associated scientific
approach labeled the experimental analysis of behavior. In
some ways it may be more appropriate to think of applied
behavior analysis as a process for analyzing and modifying
behavior rather than as a theory of behavior. Because of
its emphasis on observable events, careful methodology, and
modification of behavior of applied significance, ABA is an
excellent foundation for OBM. Often, this application has
taken the form of a series of systematic steps designed to
modify targeted behaviors. While helpful, this fixed series
of steps can also be limiting. However, ABA has evolved into
a more comprehensive approach to organizational behavior.
Performance Based Feedback and Goal Setting
An investigation of the application of behavioral
principles to organizational problems and processes suggests
that feedback is one of the most widely used intervention
procedures within the field of OBM (Andrasik, 1979; Prue,
frederiksen and Bacon, 1978). Alone or in combination with
other procedures, it has been succesful in the modification
49
of behaviors as diverse as safe performance of job tasks
(Sulzer-Azaroff, 1978), delivery of training sessions
(Panyan, Boozer and Morris, 1970), staff suggestions
and the completion of production tasks (Quilitch, 1978).
On the simplest level, feedback is the provision of
information regarding past performance. As such, it is
related to the use of instructions. However, feedback
differs from instructions in two primary respects.
Operationally, instructions are typically provided only
prior to the occurrence of behavior. Feedback follows
performance and is typically provided in a way that allows
for comparison between the observed performance and some
standard (Frederiksen and Johnson, 1981). Feedback and
instructions also seem to have differential effects on
behavior. As noted above, feedback has frequently been
shown to have significant effects on a variety of behaviors.
There are at least two possibilities regarding the operation
of feedback: either the effects are general or they are
specific.
The possibility that the effects of feedback are general
suggests that the effects of feedback on a single variable
generalize to other variables that are related in some way.
The provisions of the feedback and associated management
attention to a single behavior could tend to increase
overall performance of other related behaviors.
50

There are data which show the generality of feedback
effects. Chandler (1977) found that providing
individualized, daily feedback and social praise to a shift
supervisor on production not only increased productivity on
the supervisor’s shift, but also decreased the number of
negative comments (complaints) made to the department
manager, a non-targeted behavior.
Similarly, Miller (1978) has described two case
studies in which generalized feedback effects were observed.
In the first case study, feedback on attendance, via public
posting of individual employee data, was combined with
social reinforcement for increased attendance. In addition
to increasing attendance, the feedback intervention produced
an increase in plant operating efficiency and a decrease in
employee turnover.
In a second case study, daily individualized feedback
and social reinforcement was provided to weavers on
production efficiency measures. The intervention was shown
to be effective in increasing production efficiency.
Further, the intervention was associated with increases in
job attendance, decreases in labor turnover and a decrease
in the number of defects per yard of yarn. Supervisors also
noted an increase in the quantity and quality of
interactions among employees.
51

If the effects are specific, than feedback has an impact
only on those specific variables to which it is applied.
Other associated variables will not be impacted by that
feedback. Some evidence concerning the specificity of
feedback effects also exists. Komaki, Waddell and Pearce
(1977) monitored three different behaviors of grocery store
clerks (physical presence in store, customer assistance, and
shelf stocking) and provided them with feedback and
contingent rewards for the attainment of specific goals in a
multiple baseline design across the behaviors. Each
behavior improved as a function of the reward/feedback
intervention. However, improvement was observed only as the
intervention was introduced for a specific behavior.
Similarly, Kreitner, Reif and Morris (1977)
demonstrated the effects of feedback on the performance of
daily routine duties on individual or group therapy
sessions in a psychiatric hospital. Again, each behavior
improved markedly, but only as the feedback was introduced
for that specific behavior.
Another important manipulation used in the OBM process
is goal setting, a highly promising strategy for improving
performance in the organizational setting. Locke's (1968)
theory of goal setting deals with the relationship between
conscious goals or intentions and task performance. The
basic premise of the theory is that an individual's
52

conscious intentions regulate his actions. A goal is
defined simply as what the individual is consciously trying
to do. According to the theory, difficult goals result in a
higher level of performance than do easy goals, and specific
difficult goals result in a higher level of performance than
do no goals or a generalized goal of "do your best." In
addition, the theory states that a person’s goals mediate
how performance is affected by monetary incentives, time
limits, , knowledge of results (i.e., performance feedback),
participation in decision making, and competition. Goals
that are assigned to a person (e.g., by a supervisor) have
an effect on behavior only to the degree that they are
consciously accepted by the person. Thus, Locke states, "It
is not enough to know that an order or request was made; one
has to know whether or not the individual heard it and
understood it, how he appraised it, and what he decided to
do about it before its effects on behavior can be predicted
and explained".
In their comprehensive review, Fellner and Sulzer-
Azaroff (1984) describe goal setting behaviorially : " A
goal is a stimulus that precedes behavior. When the
antecedent goal reliably accompanies a reinforced response
it acquires "discriminative control," increasing the
probability that it will cue the individual to repeat the
behavior. Also, attainment of a goal can function as a
reinforcing stimulus. For example, if meeting the goal is
53
paired frequently with a positive consequence or removal of
a negative consequence, the goal can function as a
conditioned reinforcing stimulus.”
The following example illustrates the relation between
goals and behavior: In the rewinding department of a paper
mill, the number of rolls produced by each employee is
posted daily on a large graph. The supervisor assigns a
goal to each employee. After discussing the goal selected,
she places a heavy dark line next to the employee's name on
the graph, indicating the goal for the next day. (So far,
an antecedent stimulus has been presented.) When the
individual employees' performance meet or exceed the goal,
the supervisor praises them for the accomplishment. (Now,
the consequence of behavior, meeting the goal, is paired
with praise.) After several days of assigning the goal,
meeting the goal and receiving praise for such performance,
the goal has become both a discriminative stimulus, and a
conditioned reinforcer.
In order to produce the best results, Luthans and
Locke (1979) have suggested steps to goal setting. The goal
set should have two main characteristics. First, it should
be specific rather than vague: "Increase sales by 10
percent" rather than "Try to improve sales." Whenever
possible, there should be a time limit for goal
5n

accomplishment: "Cut costs by 3 percent in the next six
months.»
Second, the goal should be challenging yet reachable.
If accepted, difficult goals lead to better performance than
do easy goals. In contrast, if the goals are perceived as
unreachable, employees will not accept them.
A third step to take when introducing goal setting is
to ensure the availability of necessary support elements.
That is, the employee must be given adequate resources -
money, equipment, time, help - as well as the freedom to
utilize them in attaining goals, and company policies must
not work to block goal attainment.
If goal setting is to work, then the manager must
ensure that subordinates will accept and remain committed
to the goals. Simple instruction backed by positive
support and the absence of threats or intimidation were
enough to ensure goal acceptance in most of the studies.
Subordinates must perceive the goals as fair and reasonable
and they must trust management, for if they perceive the
goals as no more than a means of exploitation, they will be
likely to reject the goals. To summarize, goal setting is a
simple, straightforward, and highly effective technique for
motivating employee performance. It is a basic technique, a
method on which most other methods depend for their
motivational effectiveness. Used incorrectly, goal setting
55

may cause problems rather than solve them. If, for example,
the goals set are unfair, arbitrary, or unreachable,
dissatisfaction and poor performance may result. If
difficult goals are set without proper quality controls,
quantity may be achieved at the expense of quality. If
pressure for immediate results is exerted without regard to
how they are attained, short-term improvement may occur at
the expense of long-term gains. Like any other management
tool, goal setting works only when combined with good
managerial judgment.
Another promising approach for changing managerial
behavior and performance is the use of feedback in
combination with goal setting. Several studies reported that
goal setting plus feedback has been found more effective
together than either one separately For example, in four
telephone companies, Kim and Hamner (1976) compared goal
setting and feedback to goal setting alone for improvement
of the following five variables:
1 . cost performance-the ratio of the forecasted cost
divided by the actual cost;
2. absenteeism-the number of eight hour shifts from which
that workers were absent;
3. the number of lost-time injuries;
4. service-foreman1s rating on the quality of service, and
5. worker satisfaction with work, psy, job, fellow
employees and supervisors.
56

Each telephone company received one of the following:
1* weekly goal setting, praise and feedback from the
supervisor (external feedback) on goal attainment;
2. weekly goal setting and the worker rating himself on
attaining the goal (internal feedback);
goal setting, praise, internal feedback and external
feedback;
4. goal setting only, which may have received some internal
feedback. The results showed that goal setting, feedback
and praise was superior to goal setting alone.
A few studies have evaluated the effects of feedback
and goal setting interventions on both staff process
behaviors and intended outcomes but the target of the
intervention has generally been limited to the process
behavior. Illustrative of this approach was an investigation
reported by Ivancic, Reid, Iwata, Faw and Page (1981). The
focus of the intervention was language training for
profoundly retarded institutionalized children.
During and following language training sessions, staff
were provided with feedback by their supervisors for the
rate of appropriate staff antecedent vocalizations,
descriptive praise and sound imitations and prompts.
Feedback related to patient vocalizations was also provided.
The intervention package resulted in increases in both
appropriate staff behavior and patient vocalizations.
57

The results of these and other studies seem to make it
clear that feedback and goal setting interventions can
result in increases in desired process behaviors and
organizationally relevant outcomes. Taken as a whole, these
results show remarkable consistency in terms of being the
best approach for changing behavior and performance. This
package has been effective in managing a range of
organizationally relevant behaviors including safety, task
completion, absenteeism, waste reduction and many others.
The results have been replicated in both industry/business
and human services. This is important especially because of
the applicability issue.
Illustrative Application of OBM
The growing body of research demonstrating the
usefulness of behavioral techniques in controlling many
problems found in organizational settings has been
instrumental in developing an applied behavior analysis.
Ford (1970), gives examples of succesful treatment of OBM
in business as well as in human services organization.
Faced with problem of absenteeism and tardiness, two
organizations: a hardware operation with six outlets and a
large metropolitan school system, applied behavior
modification principles to solve their common problems.
These organizations used the principle of positively
58

rewarding certain behaviors. The hardware store used a plan
whereby monthly drawings for prizes were held for those who
had perfect attendance and punctuality. There was
approximately one prize for every twenty-five employees,
and every six months a drawing was held for a major prize, a
color television. Behavior modification principles used
were positive reinforcement for desired behavior, with
reinforcement being on a variable ratio schedule. As a
result of this program, sick leave payments decreased 62
percent and absenteeism and tardiness were down 75 percent
during the first 16 months.
A metropolitan school system, which was experiencing
high teacher absenteeism and thus high substitution costs,
used a fixed interval plan in which all teachers who had not
been absent for a whole semester were rewarded with 50
dollars. This plan effectively decreased teacher
absenteeism and substitution expense.
The example from the school emphasizes that OBM can
serve a significant role in improving the effectiveness of
the human services. As Riley and Frederiksen (1984) stated
earlier, OBM offers one overriding promise to human service
organizations - an effective and reliable approach to
changing specific staff behaviors. A variety of OBM
techniques, including goal setting and feedback, contingent
reinforcement, training, and time management have been shown
59

to effect improvement in important staff behaviors
(Frederiksen & Johnson, 1981). These have been replicated
across a wide variety of settings by a large number of
investigators.
One of the first studies to investigate the effects of
feedback in a human service setting was conducted in a state
institution for retarded children. (Panyan, Boozer, &
Morris, 1970). Staff on all living units were given formal
training on how to conduct behaviorally oriented training
sessions with the residents. Baseline data showed that
shortly following the completion of training, the staff
conducted a gradually declining percent of the required
training sessions. The authors then introduced publicly
posted feedback on the percentage of training sessions
conducted, using a multiple-baseline design across three of
the institution’s living units. The results indicated a
clear and consistent increase in the number of sessions
conducted following the introduction of feedback.
Quilitch (1975) compared the effects of feedback and
administrative memos on the activity level of patients in a
residential institution for the retarded. First, an
official memo was sent from the administrator of the agency
to all involved staff. The memo stressed the importance of
activities for the residents and recommended specific
procedures for enhancing activity levels. Finally, staff
60
were speeifieally assigned the responsibility for being
activity leaders; the number of residents involved in
activities was prominently posted inside the nursing
station. Results indicated an increase in resident
involvement in activities from the baseline level of 7 to an
average of 32 after implementation of feedback and staff
activity assignments. In other words, by using the OBM
approach of specifying the staff and residents' assignments
and giving feedback for their activities, the performance
increased.
In education, Behavior Analysis has been applied to
improve many problems. During the last twenty years, many
hundreds of behavioral studies have been reported, dealing
with a wide variety of subjects. To mention only a few:
elimination of disruptive, out-of-seat or other behaviors
that interfere with classroom routines, improving academic
skills in terms of reading, writing, mathematics, science,
acquiring social skills, teaching skills and classroom
management, and so on.
Summarizing those behavioral studies, the conclusion
drawn is that behavior analysis has contributed toward a
significant improvement in some educational setting. A key
to this success is the positive approach of this stategy.
One of Skinner’s (1965) points was that schools often are
excessively punitive and punishment results in various
61
undesirable side effects. Behavior modifiers working in
educational settings tend to concentrate on positive rather
than negative contingencies. In other words, desirable
school or classroom related behaviors are positively
reinforced rather than undesirable behaviors punished. Many
maladaptive behaviors are ignored and seriously disruptive
behaviors are treated with respond cost, time-out,
overcorrection and even punishment while desirable
alternative behaviors are targeted too for positive
reinforcement. Specifically, positive contingencies tend to
be emphasized in educational applications of behavior
modification.
Although numerous studies have been conducted to improve
teaching skills and classroom management, only a few have
involved principals. The principal is responsible for much
that occurs within the school and is continually behaving
in ways that affect students, teachers, and parents, yet
relatively few studies have been done to demonstrate how the
principal can use ABA or OBM approaches. In one study, Brown
and his colleagues (1972) reported that by using behavioral
modification techniques, the principal reduced students'
absenteeism, tardiness and disruptions. In another study, by
Nau et al. (1981), the principal helped to mediate a
time-out procedure among disruptive junior high school
students. Souweine, Sulzer-Azaroff, and Frederickson (1977)
studied how a principal's positive comments might influence
62

teachers’ rates of praising students. The teachers first
were trained in a workshop to apply specific praise in their
classrooms. Initially their rates of praise were high
following training, but they began to drop off gradually
during a phase in which the principal visited regularly to
comment on other matters. When the principal began to
comment positively on the teacher’s use of praise, the rates
increased to the high posttraining level.
Very few studies have been published in which OBM has
been applied in educational organizations as a whole,
particularly in educational administration. Maher (1982)
describes one in which teachers in two elementary schools
were responsible for generating the daily instructional
program of one handicapped pupil and for planning and
evaluating that pupil's mainstreaming instructional program
each week. They did this sporadically until a performance
feedback sheet was introduced by the principal and checked
each week if the duties had been performed. The feedback
from the principal markedly increased the percentage — to
nearly 100% — of instructional programs and evaluation
recordings.
Maher (1981) also found that active participation and
feedback were especially effective in a study with
educational personnel. Several public school principals were
trained in a program that included discussion, behavioral
63

rehearsal, social reinforcement, and feedback. The program
involved participants, with a trainer, in didactic
presentations and discussion activities, simulation and role
playing exercises, and receipt of performance feedback and
reinforcement. The participants were instructed in
pinpointing and recording organizational behavior and
performance problems, designing and implementing
organizational intervention programs, evaluating
intervention effectiveness, and involving staff in the
change process. The results suggest that participants were
able to apply OBM techniques to facilitate improved
organizational behavior and performance in their schools.
Summary
In view of the substantial body of evidence that has
suggested the successful application of OBM in business,
industry, human services and in the classrooms, it is hoped
that this trend will move toward increased acceptance in
educational administration. As a recurring theme of this
paper, it seems that behavior modification can be applied to
a variety of areas, including human resources management,
re-socialization of workers, personnel development, job
design, compensation and alternative rewards, facilitating
change by positively reinforcing behavior rather than
64

attitudes, organizational design, and in education - m the
different aspects of classrooms and schools.
The OBM approach is efficient. Although it employs the
same techniques as many other approaches, it does so in a
different fashion. For example, consider the term
"feedback": In many organizations - including schools - the
term feedback means a meeting with the supervisor, on a
quarterly or semiannual basis, in which the individual's
performance is critiqued based on supervisor's impressions,
survey results or average performance. In contrast, OBM
based feedback techniques are different. Feedback occurs on
a daily or weekly basis rather than quarterly. In addition,
it is based on subjects' actual performance rather than on
supervisor's impressions or survey results. Finally, it
specifically addresses a single targeted behavior rather
than a global evaluation that includes a wide variety of
behaviors. In other words, it pinpoints the specifics of
what is being done well and what improvements remain to be
made, rather than providing a generalized impression.
The distinction between "regular" feedback techniques
and OBM based feedback techniques can be compared with the
two different types of program evaluation in schools:
summative and formative evaluation. Summative evaluation is
concerned with the overall program after it is in operation
or after it has been completed. Formative evaluation is
65
concerned with helping the developer of program or the
teachers through the use of empirical research methodology
1,1 the Pr°0eSS °f the ^velopment and implementation of the
program; this evaluation is usually designed to improve
teaching performance on a daily/weekly basis (Barber, 198,).
A similar set of distinctions holds when considering
positive reinforcement. Reinforcement in OBM intervention is
often of a small magnitude, keyed to specific performance,
and is contingent upon the desired behavior. Similar to
behavioral feedback, it tends to be given frequently and
immediately. In contrast to the reward systems in most
organizations (including schools) in which rewards are
dispensed more on the basis of people simply showing up for
work rather than their performance when they are there, the
presentation of reinforcement depends on the behavior of the
individual. Here again the significance of this contribution
is that these are techniques that have demonstrable
effectiveness in changing specific staff behaviors.
Because few attempts have been made to apply OBM in
educational administration, analyzing ’’local” issues such as
development and assessment of a new curriculum, a better
supervision and evaluation system for teachers, achievement
of students, and others are worth trying to encourage
principals to use the successful OBM approaches. A major
strength of this model is the pragmatic behavioral emphasis
which would force principals to observe the effects of their
66
interventions and to relate them directly to their own
performances. By involving jointly principals and staff
and/or the students in identifying, measuring, analyzing,
designing successful interventions, and evaluating, a new
mutually rewarding relationship will occur. The primary
benefit of this new kind of effectiveness will accrue to the
students, teachers, parents, and with no doubt to the
principals themselves.
67

CHAPTER III
METHOD
Setting
This study was conducted in an elementary school
(experiment no. 1) and in a middle school (experiment no.
2), both in college towns in the northeastern United States.
Schools
School A (the elementary school), with a student
population of 437 and school B (the middle school), with a
student population of 513 were chosen from among seven other
schools from a list given to the researcher by the closest
Regional State Bureau of Education, The researcher
approached the Bureau and met with its director to explain
the research and to ask for a list of schools. Interviews
were conducted with all the principals and, in terms of
availability, these two schools were found most suitable.
The schools’ proximity to the university where the
researcher and his research assistants were students and the
principals' willingness to be part of the study, were
primary factors in selecting these schools.
Classes
School A, contained 19 classes, grades 3 to 5. School B,
contained 21 classes, grades 7 and 8. The academic levels in
both schools, according to standard state tests, was above
68
programs were the average. A variety of educational
available for different levels of students.
Class 1, in school A, was a third grade with a total
enrollment of 21 students. Classes 2 and 3, in school B,
were focused on remedial reading and were held in two
different periods: period 5 and period 7. Each group
contained 6 students.
Subjects
Two principals, two teachers and 19 students
participated. After the general purpose of the research was
explained to the principals, the researcher asked them to
participate and to present names of tenured teachers who
would like to take part in this research.
Principals
In school A, the principal, a Doctor of Education, was a
50 year old female with 24 years of experience as an
educator, during 9 of which she has served as an elementary
administrator. She had been the principal of this school for
the last three years and previously had been a principal of
another school in the system. Prior to that, she had been an
elementary teacher in 4, 5, and 6 grade.
In school B, the principal was a 50 years old male with
25 years of experience as a science teacher. For two years
69

he served as transition task force leader (transforming the
school from a junior high school to a middle school), and
has been the principal of this school for the past two
years. He held a M. Ed. degree and an extensive number of
credits toward a doctoral degree.
Teachers
The researcher asked the principals for names of tenured
teachers who would be likely to agree to participate.
Selection was limited to tenured teachers in order to avoid
the influence of tenure decisions as potential confounding
variables. The subjects were told that the researcher was
conducting a study in instructional leadership.
Participation required: 1) the presence of two or three
observers over a 5 - 8 weeks period; 2) in the second
experiment, participation by the teacher in an OBM training
session. The subjects were told that the observers would be
recording information about the behavior of the principal,
teacher and students .but that the regular routine of the
classrooms would be continued as usual. The exact nature of
the data collection procedures was not revealed because
their knowledge of all the details might have invalidated
the study. They were informed, however, that all the details
would be explained after the conclusion of the study.
In school A, teacher 1 was a 44 year old female with 16
years of experience. She had taught third and fourth grades
70
in the school for the last 14 years and held a M. Ed.
degree. In school B, teacher 2 was a 51 year old female with
24 years of experience. She held an M. Ed. degree and taught
reading and writing in this school for the last 18 years.
Students
In school A, class 1 had 21 students: 10 boys and 11
girls, ages 81/2-9 1/2 years old. Four girls and three
boys served as subjects. They were selected because of their
poor academic performance in learning multiplication tables.
This skill had been formally taught in the beginning of the
school year, over a period of three months but the student-
subjects had failed to master the tables despite the
teacher's best efforts. Classes 2 and 3, in school B,
contained six students each: class 2 in the 5th period had
one girl and five boys and, class 3, meeting in the 7th
period included three girls and three boys. These students
left their home-rooms for one hour of small group or
one-to-one tutoring with the aim of elevating their reading
levels to the average of other students.
Apparatus
Observers used mini tape recorders and a tape
prerecorded to give instructions each 30 second interval.
Ear phones prevented others from hearing the recording.
Clip boards, pens and different observation forms (See
71
Appendix A.) were also used by the observers. In each
experiment, a wall-chart was used to record the students'
academic performance. The wall-charts were different in each
classroom - according to the subject-matter learned.
Dependent Variablss
Throughout the research, measures were taken of
principal, teacher and student behavior and recorded on
observation sheets. The definitions of each variable
follows.
Principal variables
Principals were observed for the following behaviors:
1) Verbal praise: any positive feedback or praise to
students indicating approval or admiration for the academic
performance of math or reading. Examples: "Terrific job
_"Very good _"; "You worked very hard, _";
"Excellent _, you did it!!".
2) Positive non-verbal feedback: facial or hand gestures
indicating approval directed at the students. Examples:
smiles, pats, makes eye contact, nods, shakes hands.
3) Goal setting: any statement which defines specific
behavioral objectives for students. For example, the
principal asks a student what s/he thinks s/he can do for
next time.
72

Teacher variables
Teacher 2 was observed for the same variables as the two
principals.
Student variables
Achievement of academic performarirp
Experiment ]. Completion of multiplication tables:
number of correct answers to an oral or written quiz of 20
drills, based upon the multiplication tables yet unmastered
were calculated.
Experiment 2* The number of pages read during daily
period of silent reading was recorded. For the silent
period, the behavioral dimension of being "on-task" was:
student orienting head and eyes toward the book; "off-task":
student orienting head or eyes toward something other than
the book or toward someone in the class. Students who were
out of his/her seat because of not having a book to read or
needing to go to library to change the book, also were
considered as "off-task".
Ohs.£rxational_,Exgtem
Observers
Seven undergraduate students served as observers three
in the first experiment and four in the second experiment.
Notices advertising the need for observers for an
73

educational research project were posted throughout the
psychology building of the local university. After being
interviewed by the researcher, they were selected from a
pool of students who had been enrolled in an course in
Organizational Behavior Management offered the previous
semester and from an educational psychology class. The
observers received 3 undergraduate credits in independent
study for their participation.
Observer training
The observers were blind as to the nature of the
treatment variables, nor were they aware of the introduction
of experimental phases. The observers were trained by the
researcher in six 1 1/2 hour training sessions. They
practiced using data sheets, computing reliability on
different behaviors and they learned to score several
precise behavioral measurements by observing videotapes,
some of which were developed especially for the training
workshop; others were taped from a popular T.V. show. (See
Appendix B.) The behavioral recording techniques in which
they were trained: event recording, to record the number of
times a behavior occured during a specific period of time;
partial interval recording, to record the behavior when a
single instance of the behavior occurred in the interval;
and momentary time sampling, to record the behavior if
emitted at the moment the interval terminated. During the
training workshops, the observers communicated with one
74

another, from time to time, to clarify definitions and
recording methods. The observers practiced until an 85*
agreement score was achieved three successive times and
then, they continued to practice measuring principal,
teacher and student behaviors in one classroom for a period
of several weeks. The reliability of their scoring was
checked by calculating their coefficient of agreement
according to the formula:
number of agreements
number of agreements plus disagreements
for each behavior observed.
Observational Procedures
Experiment I Data were recorded three times a week for a
total of eight weeks.
Observation of principal.
After the principal A entered the class and went to the
wall-chart (See Appendix C.) to observe and comment on the
academic performance of the previous day, the principal was
observed when she took the seven student-subjects aside to
speak about their performance on the multiplication tables.
Usually, her visits were 10-15 minutes long. During each 30
second interval, a frequency count was made by the
observers, of the principal’s use of verbal praise,
non-verbal feedback and goal setting. The beginning and the
75

end of each interval was signaled by the tape. At the end of
each interval, the observers tallied their marks for each
category and at the conclusion of the daily observation, the
tallies were summed. Rate was computed by calculating the
number of verbal, non-verbal feedback and goal setting
statements over the number of intervals.
Hk-gervatjon of students.
The students were observed three times a week, during
the second recess of the day, for a period of 8 weeks. The
observers or the researcher gave them quizzes based upon the
multiplication tables: oral or written quizzes of 20 drills
such as 7 x2=?or6x8=? (The drills were similar to
those given in the class on regular basis, by the teacher).
In order to change to a new multiplication table, the grade
achieved was supposed to be 100%; if the grade were lower, a
new quiz was administered - in conformity with the goal set
between principal and students. The sessions in which they
were together with the principal, when she commented on
their academic performance, were observed, too.
Experiment II Data were recorded five times a week for a
period of five weeks. The 5th period class was observed
twice a week; the 7th period class - three times a week.
Observation of principal behavior*
Principal B was observed during his entrance into the
76

remedial reading classes during the 5th and 7th periods. His
rates of praise, positive non-verbal feedback and goal
setting were not recorded by the 30 second intervals but,
with a descriptive observation of his statements. For the
5th period, the principal based his comments on the
students' reading rates as displayed on a wall-chart
designed by the researcher (See Appendix C.); for the 7th
period, his comments were based on a daily report of the
students' self-recorded reading rates. (See Appendix D.)
The decision to use self-recording forms was based on
several studies in which the effect of self-recording in
classroom behavior and academic performance were measured.
(Broden, Hall, and Mitts, 1971; Fixsen, Phillips, and Wolf,
1972; Glynn, Thomas, and Shee, 1973; Bullard, and Glynn,
1975) In these studies, it was suggested that self-recording
procedures would be most effective if they were used in
conjunction with established reinforcement techniques such
as teacher praise.
Observation of teacher.
Similar to the first experiment (of the principal's
behavior), teacher 2's use of verbal praise, non- verbal
feedback and goal setting was recorded by a frequency count,
during 30 second intervals, for a period of 25 minutes.
Observation of students.
The students were within the visual and auditory range of
77

the observers and were observed during a silent reading
period of 15 minutes. Prior to the beginning of each daily
observation, the students were counted and their names were
on the observation sheet, from left to right. The observers
used the PLA-Check recording system (Wilczensky,
Sulzer-Azaroff, Feldman, and Fajardo, 1987). At the end of
each 30 second interval, the observers looked at each
student, starting from left of the classroom and proceeding
to right and quickly assessed if the student was on or
off-task. At the end of the daily silent reading period, the
students self-recorded the number of pages read. (At the
beginning of the research, the self-recording method was
explained to teacher 2 by the researcher. She began to use
this method immediately after explaining it to her students.
Because of the form’s simplicity, in terms of number of
items asked, in a very short period of time the students
performed the self-recording procedure as a routine part of
their duties in the classroom.)
Almost daily, they were divided in pairs and for 30
seconds each student was supposed to describe briefly what
he/she read. All 12 students’ comprehension of the material,
as well as the number of pages read during the silent
period, was checked by the teacher, by asking them questions
based upon this material. For example: The teacher would ask
a student "What do you think happened to X on page Y ?" or
"Give a brief summary of the last two pages you read".
78

fteliabilitv
Inter-observer agreement of principal, teacher and
student data was assessed during each experimental phase in
both experiments by having two trained observers record data
together during the observation session. The two observers
used either the same tape recorder with two ear phones or
two tape recorders pushed to play at the same time. The ear
phone cords were 5-6 feet in length and the observers were
thus able to sit apart, insuring greater independence of
assessment.
Reliability coefficients were calculated using the
formula:
number of agreements
number of agreements plus disagreements
Examples are given below.
Reliability of measurement of student behavior was
calculated in this manner: The number of agreements was
determined by comparing the number of students scored
off-task between the two observers; the difference was
subtracted from the total number of students to determine
the agreements.
79
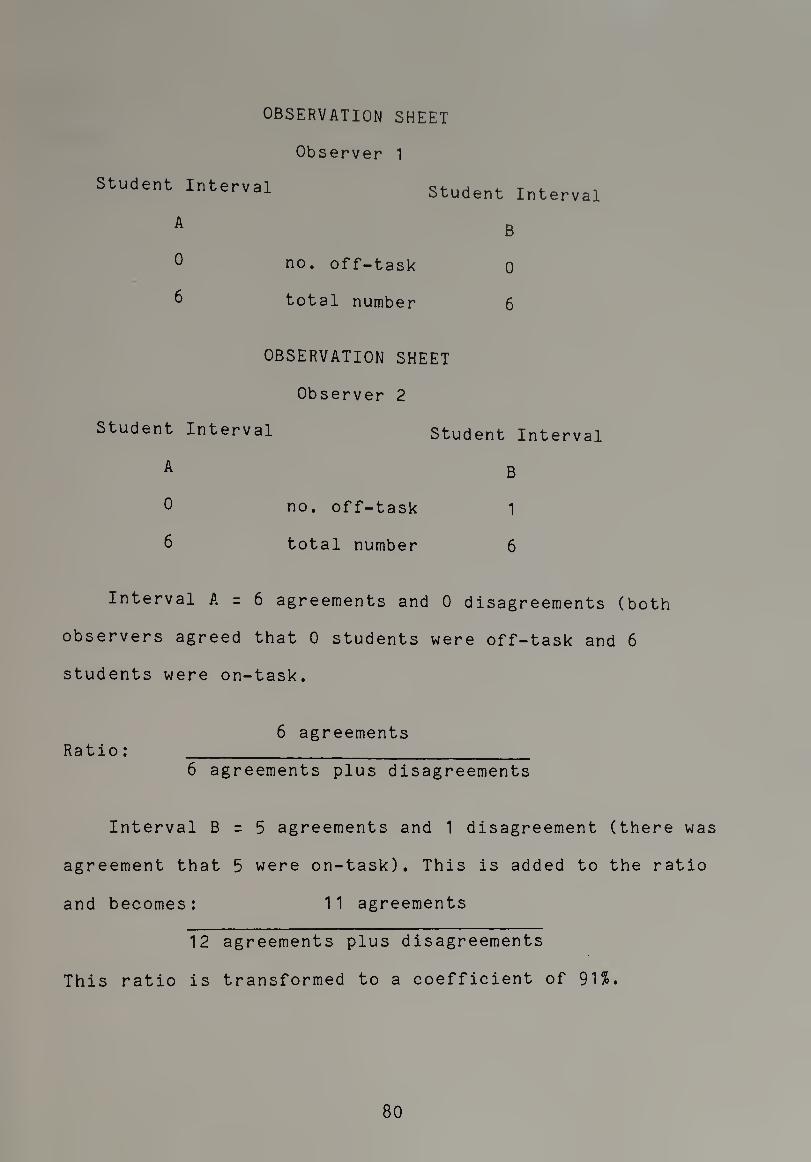
OBSERVATION SHEET
Observer 1
Student Interval
A
0
Student Interval
B
no. off-task o
total number 6
OBSERVATION SHEET
Observer 2
Student Interval Student Interval
A B
0 no. off-task 1
6 total number 6
Interval A = 6 agreements and 0 disagreements (both
observers agreed that 0 students were off-task and 6
students were on-task.
Ratio: 6 agreements
6 agreements plus disagreements
Interval B = 5 agreements and 1 disagreement (there was
agreement that 5 were on-task). This is added to the ratio
and becomes: 11 agreements
12 agreements plus disagreements
This ratio is transformed to a coefficient of 91?.
80
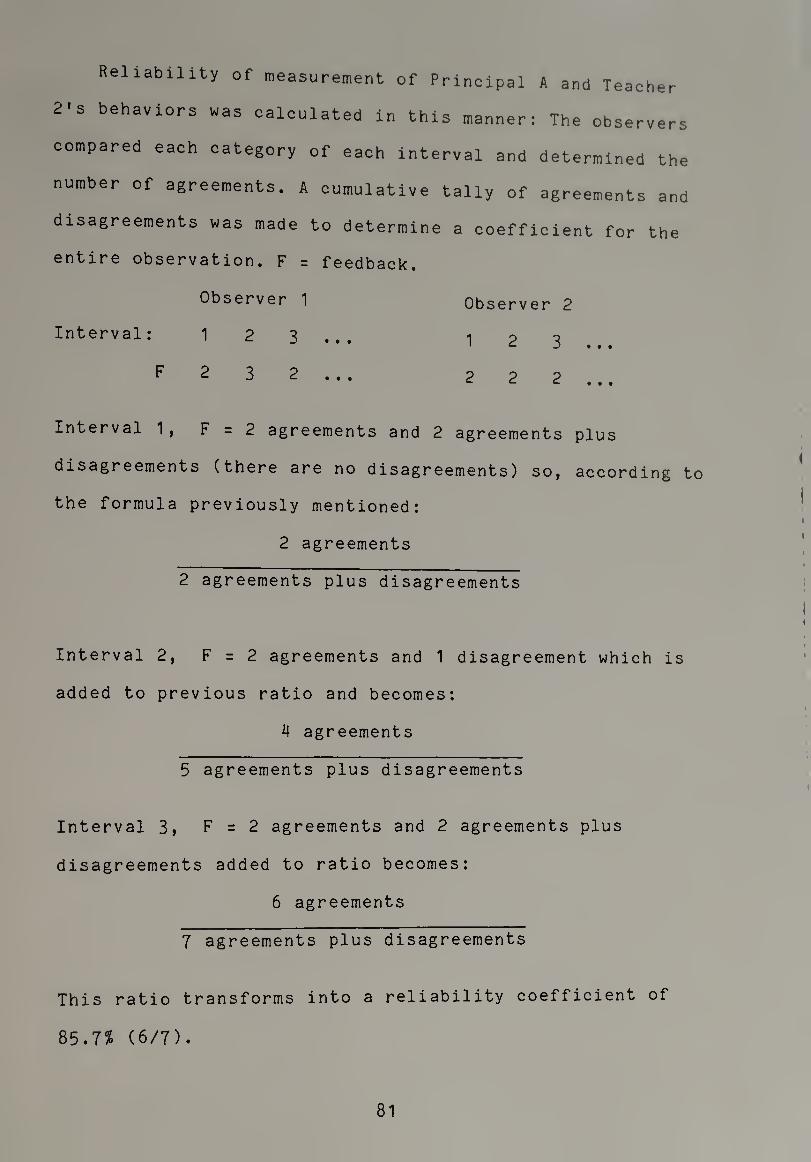
Reliability of measurement of Principal A and Teacher
2's behaviors was calculated in this manner: The observers
compared each category of each interval and determined the
number of agreements. A cumulative tally of agreements and
disagreements was made to determine a coefficient for the
entire observation. F = feedback.
Observer 1 Observer 2
Interval: 1 2 3 ... 123.
F 2 3 2 2 2 2
Interval 1, F = 2 agreements and 2 agreements plus
disagreements (there are no disagreements) so, according to
the formula previously mentioned:
2 agreements
2 agreements plus disagreements
Interval 2, F = 2 agreements and 1 disagreement which is
added to previous ratio and becomes:
4 agreements
5 agreements plus disagreements
Interval 3, F = 2 agreements and 2 agreements plus
disagreements added to ratio becomes:
6 agreements
7 agreements plus disagreements
This ratio transforms into a reliability coefficient of
85.7% (6/7).
81

Experimental Design
Experiment I
The experimental design was a "single subject" reversal
design. (ABAB) Borg and Gall (1983) defined this kind of
design. "As its label implies, the distinguishing feature of
a single-subject experiment is the fact that the sample of
subjects is one. If two or more subjects are treated as one
group, this also is considered a single-subject experiment",
(p. 706) They continued to explain: "In using this design,
the researcher needs to plan for four phases: initial period
of baseline observation - (A); initial introduction of the
treatment variable - (B); withdrawal or reversal of the
treatment variable, second baseline (A) and, reintroduction
of the treatment variable - (B). If the measurements of the
target behavior vary as expected, the researcher has a
convincing demonstration of the effects of the treatment
variable." Sulzer-Azaroff and Mayer (1977) have emphasized
the advantages of single-subject designs by stating that: "
It minimizes the effects of one of the strongest confounding
factors in behavioral research, individual client
differences. The single-subject design allows comparisons
between an individual’s behavior under one condition and
under other conditions." (p. 445)
Experiment II
The experimental design was a multiple baseline across
two sets of individual/subjects (Baer, Wolf, and Risley,
82

1968). Basically, this design involves: 1) collecting
baselines on the same behavior of several different
individuals; 2) applying the intervention first with one
individual while the the baseline conditions are continued
with the other individuals; 3) applying the intervention to
the second individual’s behavior as in 2 above. This
procedure is continued until it is determined whether or not
each individual's behavior changes systematically with the
intervention. As Sulzer-Azaroff and Mayer (1977) stated: i
"The object is to show that... the behavior of each
individual changes substantially when - and only when - the
intervention is introduced." (p. 454) I
I
1
Procedure < I
To be more specific about the experimental designs used t
in this present research: 1 1 1
Experiment I
Baseline During the Baseline I phase (A), principal A was
observed for her performance in terms of her engagement in
goal setting and use of verbal praise and non-verbal
feedback. The student-subjects were observed for their
academic performance, in terms of their knowledge of the
multiplication tables. Teacher A, passive in terms of the
experiment and continuing her day-by-day activities, managed
83
a wall-chart for the whole class that was based upon the
number of items accomplished from the multiplication tables.
lr_a.ining Of Principal Between the first baseline phase (A)
and the first treatment phase (B), an Organizational
Behavior Management training session was conducted for the
principal by the researcher. The training session focused on
the importance of verbal praise, positive non- verbal
feedback and goal setting. Definitions of reinforcement and
effective time management were stressed during the session.
iT-gatroent Phase I During the first treatment phase (B),
the research was divided in two different interventions:
1) the principal set goals, gave feedback and praised the
students for their mastering the multiplication tables.
2) The researcher gave the principal feedback and praise on
her performance of effective time management and OBM
strategies (goal setting, praise and feedback).
Return to Baseline In the third phase, return to baseline
(A), the treatment variables were withdrawn:
a) the principal continued her routine without any feedback
from the researcher and if she entered the classroom, she
was asked to refrain from giving any performance feedback,
any praise or to set any goals for the students.
b) the students continued to take quizzes, in order to
demonstrate mastery of the multiplication tables but,
without any feedback or praise.
84

Treatment Phase IT In the fourth phase, treatment II, (b)
the same intervention variables as in treatment I were
reintroduced. The principal followed the same procedure with
the students while the researcher praised and provided
feedback to the principal.
Following is a diagram of the experimental designs'
sequence.
I. Principal's performance and II. Students' performance
I. # of goal setting & feedback episodes
II. students’ performance
OBM baseline j training jinterven-jbaseline|interven-
1 ! tion | | tion
i i
# of days
Figure 2. Diagram of treatment conditions for
experiment I.
Experiment II
Baseline During the 5th and 7th periods, baselines were
collected on the same behaviors (number of pages read in the
classroom during a daily silent reading session of 15
85
minutes) for all the students-subjects - 6 in each
class/period. Teacher B's rates of verbal praise, positive
non-verbal feedback and goal setting were also recorded. The
researcher conducted an OBM training session with principal
B similar to that of principal A in the first experiment. In
this experiment, the principal was supposed to model for and
train the teacher, whose behavior, as mentioned before, was
scrutinized also.
Treatment—£_QP d i 13. op s While baseline conditions were
continued with the 6 student-subjects from the 7th period,
the 6 student-subjects from the 5th period were exposed to
treatment conditions. The principal entered the classroom
and, based upon the results from the wall-chart, praised the
students, gave them feedback and set goals for their
academic performance - in terms of numbers of pages read in
class during the silent reading period. An illustration of
his intervention follows: "I see _ you read seven pages
today. Excellent !! I think you did a very good job. You
read two pages more than yesterday and this is really
terrific !! How many pages do you think you can/will read
tomorrow ?,r A very important consideration in setting the
goals was the degree to which the goals were attainable, yet
challenging. The first one - attainability - was crucial
because it created more frequent opportunities for students
to receive positive reinforcement. Because of the remedial
nature of these two classes, to set goals for even one or
86
two pages was challenging and if these goals were not met,
every effort was made to achieve them the next day. The
principal also spoke about the time spent on reading at
home. (See further comments on this matter in the Discussion
chapter.)
As part of his role in the experiment, the principal
held an OBM training session at the end of one day with
teacher B outside her classroom. By modeling the procedures
of praising, goal setting, etc., for her, he emphasized the
definitions mentioned above. The purpose of this session was
to increase teacher B’s rate of verbal praise, positive
non-verbal feedback and goal setting in the 5th period.
After several days, the principal began to enter in the
7th period also, and the same treatment conditions were
introduced, as in the 5th period. His intervention was based
on the daily report from the students self-recording sheets,
that he had received previously, The teacher’s rates of
verbal praise, non-verbal feedback and goal setting were
observed in both periods and she received praise and
feedback on her performance from the principal and from the
researcher. The observers continued to record the students’
academic performance in both periods and the days in which
the principal was not in the classroom. On those days, the
teacher was the only one to deliver the verbal praise,
positive non-verbal feedback or set goals with the students.
87

Following is a diagram of the sequence of the
design: experimental
I. # of pages
read
II. % of times using g.s. feedback and praise
5th period:Baseline
7th period:Baseline
Intervention Intervention G.S.+F.+P. G.S.+F.+P.
— Principal Principal I Teacher
i Intervention
// of days
Figure 3. Diagram of treatment conditions for
experiment II.
88
CHAPTER I V
RESULTS
This research attempted to measure:
1) the effect of OBM procedures, such as: feedback, praise
and goal setting, performed by the principal, on the
academic performance of students (Experiment I)
2) The effect of the principals- modeling and training of
the teacher on the teachers' and the students, performance.
The data are presented graphically, according to the
experimental designs: "single-subject" reversal design and
multiple-baseline across individuals/subjects. A statistical
procedure was also employed for further analysis.
In order to determine average changes in levels of the
data, a mean was calculated for each phase to measure the
central tendency. As Borg and Gall (1983) state: "The mean
is generally considered the best measure of central
tendency", (p. 364) The mean was calculated by dividing the
sum of the scores by the number of scores. In order to
determine whether there was a statistically significant
change in behavior across phases, the statistical tool used
was the £test for differences between means (Bruning and
Kintz, 1968; Hays, 1963; Borg and Gall, 1983). The initial
step was to establish a null hypothesis: "There was no
89
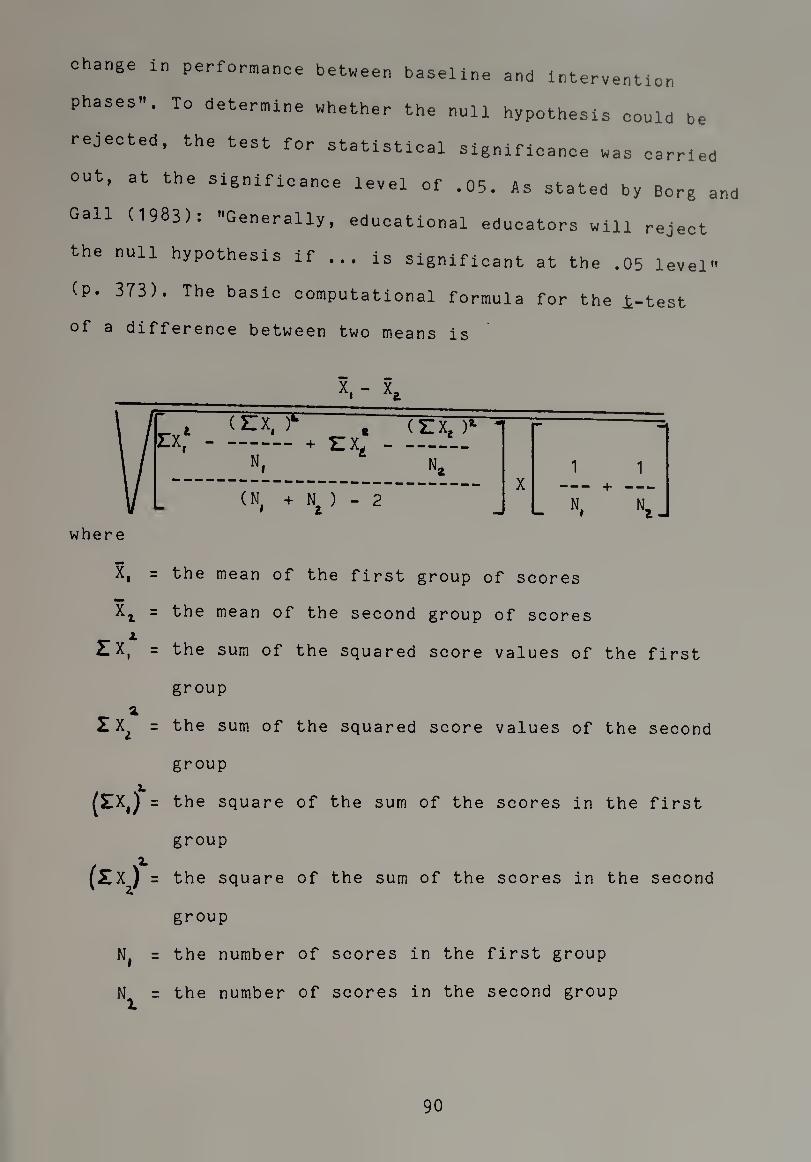
change in performance between baseline and intervention
phases". To determine whether the null hypothesis could be
rejected, the test for statistical significance was carried
out, at the Significance level of .05. As stated by Borg and
Gall (1983). Generally, educational educators will reject
the null hypothesis if ... is significant at the .05 level"
(p. 373). The basic computational formula for the i-test
of a difference between two means is
X
X
Zx 2.
1
(ZX,f =
(*4-
the mean of the first group of scores
the mean of the second group of scores
the sum of the squared score values of the first
group
the sum of the squared score values of the second
group
the square of the sum of the scores in the first
group
the square of the sum of the scores in the second
group
the number of scores in the first group
the number of scores in the second group
90
The t values of the test were compared to the critical
values of t statistic, and if found significant - the null
hypothesis would be rejected. (In other words: the
difference between baseline and intervention phases were
found to be "significant’r.)
■Reliability
Inter-observer reliability was calculated several times
during the phases of the two experiments, at least once a
week. The inter-observer agreements were as follow:
1. for principal A's behavior (Exp. I), it ranged from 84%
to 100%, with a mean of 94.8.;
2. for students’ performance in Exp. I - 100% and in Exp.
II, it ranged from 92% to 100%, with a mean of 98.6, and
3. for teacher B’s behavior, it ranged from 71% to 100%,
with a mean of 91.4.
The inter-observer reliability for principal A (Exp. I),
and Teacher 2 (Exp. II) follows on the next pages (See
Tables 1 and 2.)
91

Table 1
Inter-observer Reliability for Principal's Behavior
During Experiment I
Date Variable Phase Obs. 1 Obs. 2 ? Agr.
3/29 Non-verbal Feed. Base. I 2 2 100
4/ 1 Goal Setting Base. I 3 3 100
4/ 7 Praise Inte. I 7 8 87.5
4/15 Non-verbal Feed. Inte. I 16 15 93.75
4/20 Goal Setting Base.II 9 9 100
4/26 Praise Base.II 13 14 92.85
5/ 2 Goal Setting Inte.II 15 15 100
5/10 Praise Inte.II 21 24 84
Non-verbal Feed . = Non- verbal Feedback
Base. I/II = Baseline I - II;
Inte.I/II = Intervention I - II
92

Table 2
Inter-observer Reliability for Teacher’s Behavior
During Experiment II
Date Variable Phase Period Obs. 1 Obs.2 % Agr.
10/31 Goal Setting Base. 7 1 1 100
11/ 3 Non-verb.Feed. Base. 5 5 5 100
11/ 4 Praise Base. 7 3 3 100
11/10 Non-verb.Feed. Base. 5 5 7 71
11/15 Goal Setting Inte. 5 2 2 100
11/17 Praise Inte. 5 7 6 85.7
11/18 Non-verb.Feed. Inte. 5 9 10 90
11/18 Non-verb.Feed. Inte. 7 11 10 90.9
11/21 Praise Inte. 7 14 17 82.3
12/ 1 Praise Inte. 7 8 9 88.9
12/ 5 Non-verb.Feed. In te. 5 11 10 90.9
12/ 7 Non-verb.Feed. Inte 7 12 13 92.3
12/ 9 Goal Setting Inte. 5 5 5 100
12/ 9 Non-verb.Feed. Inte. 5 12 11 91.6
12/12 Non-verb.Feed. Inte. 7 13 14 92.8
12/14 Praise Inte. 7 21 18 85.7
Non-verb.Feed. = Non verbal Feedback
Base. = Baseline phase
Inte. = Intervention phase
93

Experiment- I
Principal Behavior
The data on observation of the principal indicate that
she made dramatic changes in her rate of praise, feedback
and goal setting throughout the experiment. The number of
positive comments (verbal praise and non-verbal feedback)
delivered to the students as well as the rate of setting
goals for them, increased across the interventions.
setting (Fig. 4) During the baseline phase, the mean
was 17. After the OBM training session and during the second
phase of the experiment, when the principal received
feedback and praise for her performance, the increase from
baseline was substantial: 71.25. According to the £ test,
the change from baseline I to the first intervention phase
was statistically significant at the <.05 level. (See Table
3.) During the intended return to baseline conditions, the
average fell to 40 but still was higher than the first
baseline phase. Finally, when the OBM procedures were
reintroduced, again, the increase was apparent: 83.75,
double the rate of the second baseline and five times higher
than the first one. This increase also, was statistically
significant, at the <.05 level.
Non-verbal feedback (Fig. 5) A similar trend as for the
goal setting was found in this part of the experiment.
94
During the first baseline phase, the average rate of
non-verbal feedback was 13.33, with an impressive increase
during the intervention phase to 57, more than four times
the baseline rates. A slight decrease occurred during the
second baseline, 49.33. In spite of the fact that the
treatment conditions were supposed to be withdrawn, the
principal continued to deliver the non-verbal feedback
increasingly - almost four times the rate of the first
baseline. When she was asked to reintroduce the treatment
conditions, her rate of change became even higher - 82. The
results of the statistical test corroborate this change.
(See Table 3. )
Verbal praise (Fig. 6) The results of this part of the
experiment were the most substantial. The average rate of
her use of verbal praise was the lowest among the three
baselines: 5.33. Introduction of the treatment conditions,
brought a dramatic change in the second phase - up to 53.5,
ten times the baseline rate. Within that phase, the increase
from the beginning up to the end of the phase was 46% - from
30% to 76%. Instructions to withdraw the intervention led to
a decrease the very next day - to 50% but, as a whole, the
mean of the second baseline remained high and almost similar
to the previous phase - 52.66 (only .84 lower). In the last
phase, the rate climbed to the highest point of the
experiment (96%) and with the highest mean also, 88 - 17
95
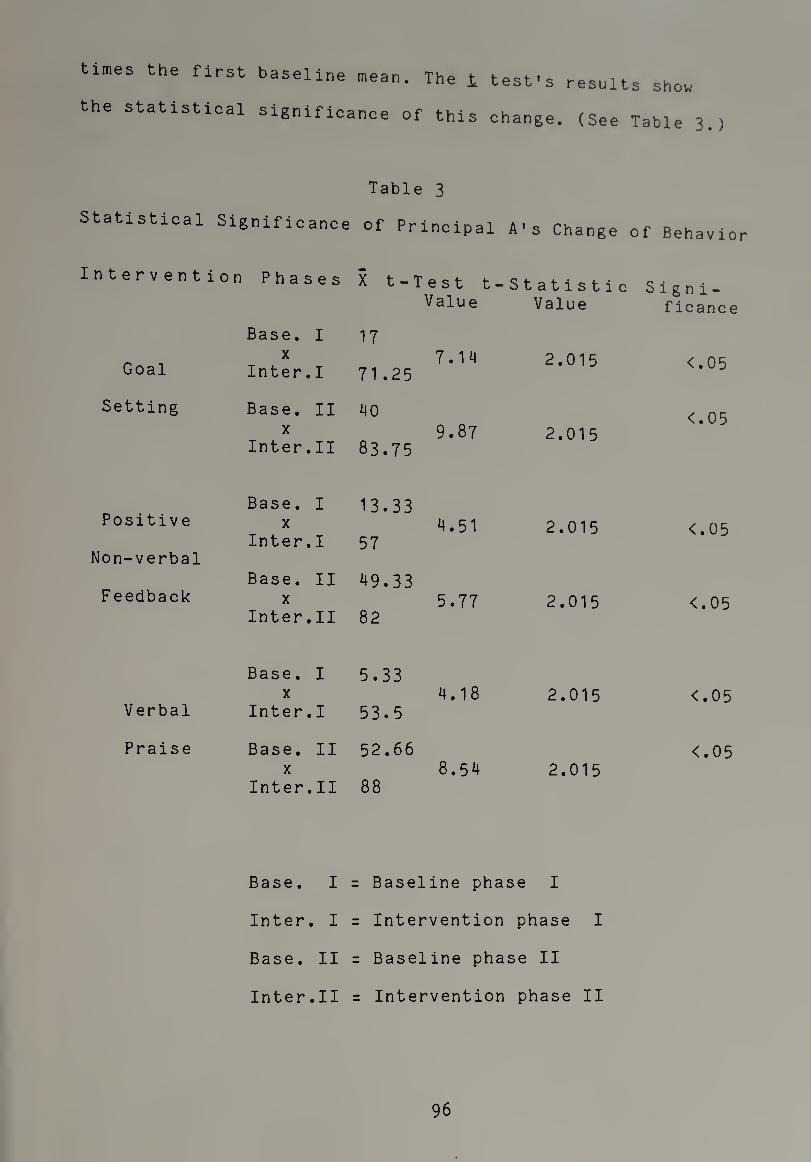
times the first baseline mean. The i test's results show
the statistical significance of this change. (See Table 3.)
Table 3
Statistical Significance of Principal A's Change of Behavior
ntervention Phases X t -' rest t- Statistic Signi¬ Value Value ficance
Base. I 17
Goal X
Inter.I 71.25 7.14 2.015 <.05
Setting Base. II 40 <.05 X 9.87 2.015
Inter.II 83.75
Base. I 13.33 Positive X 4.51 2.015 <.05
Inter.I 57 Non-verbal
Base. II 49.33 Feedback X 5.77 2.015 <.05
Inter.II 82
Base. I 5.33 X 4.18 2.015 <.05
Verbal Inter.I 53.5
Praise Base. II 52.66 <.05 X 8.54 2.015
Inter.II 88
Base. I = Baseline phase I
Inter. I = Intervention phase I
Base. II = Baseline phase II
Inter.II = Intervention phase II
96

Students’ academic performance (Figures 7-13)
During baseline I phase, the results of the quizzes,
based upon the tables previously not mastered showed that
none of them achieved a grade higher than 85* (student 2);
four of them received a mean less than 50*; student 1, 37%;
student 3, 44*; student 5, 45* and student 6, 47.5*; the
other three were approximately 67*: student 2, 73*; student
4, 69*; and student 7, 60*.
In phase two, when the principal set goals for the
students’ performance, gave them positive feedback and,
praised their achievements - substantial increases occurred.
The mean point for the group went from 53.5 in baseline I to
85.9 during this phase of intervention.
Individual achievements were interesting, as well.
Student 1 mastered one table (7), and by the end of this
phase, her grade was 100*. She was ready to begin a new
multiplication table (8). Her mean score was 85*, compared
to a 37* in the baseline. Student 2 finished one table (6),
immediately in the early part of the first intervention
phase. He then began a new table but, due to his absence on
one of the intervention days - his average was not much
higher than the baseline, 78 compared to 73. Student 3 did
not master the multiplication table (7) but, her grades on
the quizzes were higher than in the baseline (44) and her
average was much more higher, almost double, 85. Student 4
97

finished the multiplication table (6) in the beginning of
the phase after the first intervention, took another quiz on
the same table and again, received 100%. He began a new
table (7), and his quiz average was higher than in the
baseline, 85 compared to 69. Student 5 mastered one table
(7), and by the end of this phase, she received 100%,
bringing her average to 88.3 - almost double than the
baseline's average, 45. Student 6 finished one table (7) and
was ready to begin a new one. Her grades were much higher in
this phase, an average of 90. Impressive was the contrast
between the first grade she received on the new table in
this phase, 80% - with the grades she received during the
baseline, which had averaged only 47.5. Student 7 mastered
one table (7), achieved 100%, took another quiz on the same
table - again receiving 100% - and was ready for the next
table (8). The average on this phase, 90, was higher than in
the baseline - 60. (See Table 4.)
In the third phase, the treatment conditions were
reduced, the students continued to take quizzes on the
multiplication tables. As a whole, grades were lower than
during the previous phase of the experiment - only 68.9. Yet
an increase can be observed over the first baseline mean of
53.5. On the individual level most performed better in this
phase compared with the first baseline, especially student
1, 3, 5 and, 6. Student 6, with only minimal intervention of
98

the principal, accomplished another multiplication table
(6), preparing her for tackling third table (8) •
Table 4
Student/subjects ' Mastery of Multiplication Tables
Multipli¬ cation
Stud. Stud. Stud. Stud. Stud. Stud. Stud.
Table 1 2 3 4 5 6 7
2 A A A A A A A
3 A A A A A A A
4 A A A A A A A
5 A A A A A A A
6 A L A L A L A
7 L P L L L L L
8 L L P L L L L
9 A A A A A A A
10 A A A A A A A
11 A A A A A A A
A = Knew already; P = knew partially by the end of
study; L = learned by the end of study.
During the fourth phase, when the principal increased
the treatment conditions, the increase in the students’
grades was apparent, again, yielding an average of 89.7$.
All students performed better than during the previous phase
and most of them improved their averages, in comparison with
99

the first intervention phase (student 1, 4, 5, 6, 7). Five
of the seven accomplished all the multiplication tables,
ultimately scoring 100% (student 1, 4, 5, 6, 7) and the
sixth student (student 2) was close to mastering her third
and last table. She received 90% on the last day of this
phase and achieved 100% in the follow-up period.
In terms of the statistically significance, Table 5
shows that there was a change in the academic performance
from baseline I phase and intervention I phase, as well as
from baseline II phase to intervention II phase for students
1, 4, 5, and 7. For student 2, the change in performance
between baseline II phase and intervention II phase was
found statistically significant and for student 6, the first
change in performance, between baseline I phase and
intervention I phase, was found significant. Student 3 was
the only one with no statistically significance in her rate
of change. (t<.05)
Summary of Major Findings in Exp. I
1) There was an increase in the principal's rate of verbal
praise, non-verbal feedback and goal setting, especially
during the intervention phases, meaning - after the OBM
training session and as a function of instructing her to
deliver those antecedents and consequences, and of delivery
of the feedback and positive reinforcement to her.
100

2. Contiguous with the intervention mentioned above, the
student-subjects' academic performance was greatly increased
and each learned almost all the multiplication tables. The
trend of increase was statistically significant but, most
important was the success of achieving the mastery of the
multiplication, in a relatively short time.
Table 5
Statistical Significance of Students’ Change in
Their Academic Performance During Experiment I
Student Phases X 1
X 2
t-Test Value
t Stat. Value
Signi¬ ficance
1 Bas. 1 X Int. 1 37 85 3.41 1.895 <.05
Bas. 2 X Int.2 56.66 88.33 3.96 2.132 <.05
2 Bas. 1 X Int. 1 73 78.33 0.41 1.943 >.05
Bas. 2 X Int.2 72.50 87.50 2.24 2.132 <.05
3 Bas. 1 X Int. 1 44 85 1 .69 1.943 >.05
Bas. 2 X Int.2 76.66 81.25 0.43 2.012 <.05
n
Bas. 1 X Int. 1 69 85 1.86 1.085 <.05 “t
Bas. 2 X Int.2 70 93.30 4.17 2.353 <.05
c
Bas. 1 X Int. 1 45 88.33 4.64 1.943 <.05 D
Bas. 2 X Int.2 68.33 95 4.77 2.353 <.05
c Bas. 1 X Int. 1 47.50 90 6.03 2.015 <.05
0 Bas. 2 X Int.2 75 86.25 0.77 2.015 >.05
7 Bas. 1 X Int. 1 60 90 2.72 1.943 <.05
Bas. 2 X Int.2 63.33 96.66 7.07 2.132 <.05
101

BA
SEL
INE
INT
ER
VE
NT
ION
BA
SEL
INE
INT
ER
VE
NT
ION
AON3nD3HJ
102
Fig
ure
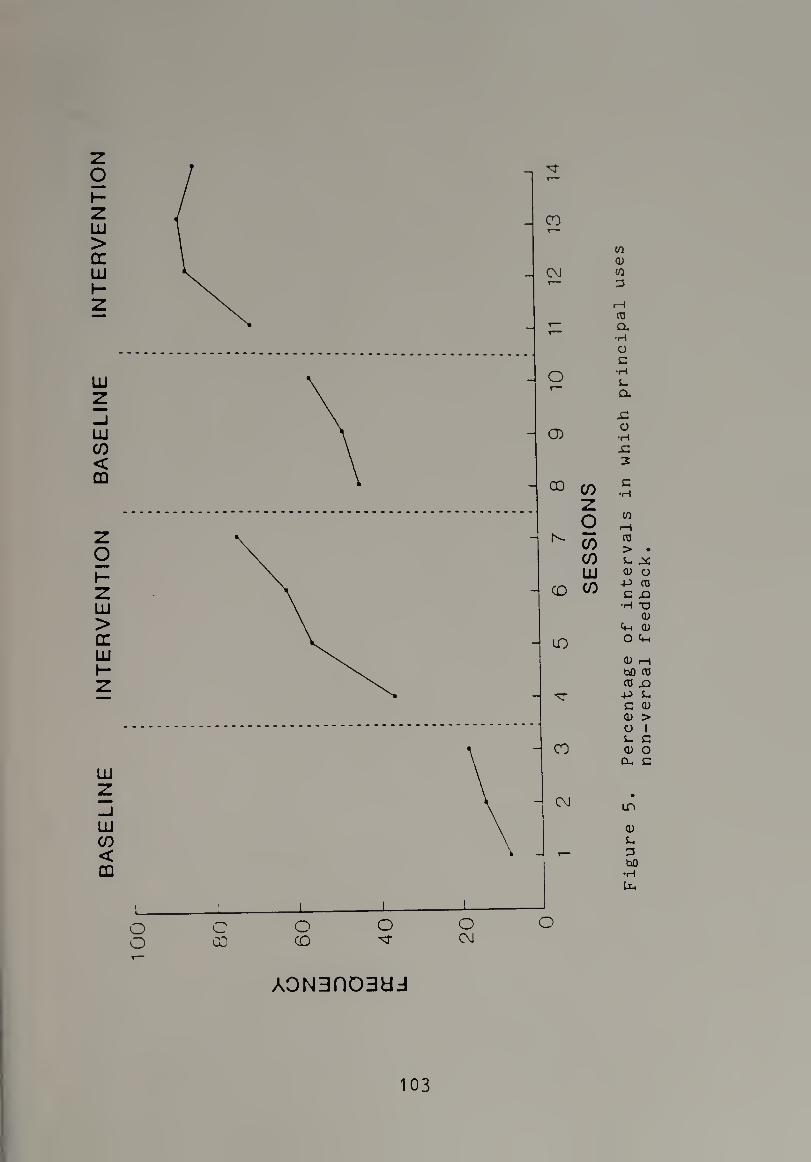
BA
SE
LIN
E
INT
ER
VE
NT
ION
BA
SE
LIN
E
INT
ER
VE
NT
ION
co z o CO CO ID CO
1 1
o c o o O CO CO ^
o o CM
CO
co 3
03 Q.
O c
•I—I s- a
s: o ■H sz 3 C
•i—l
CO
I—I 03 >
0) -p c
•H
o
03 i—| bo 03 03 JD -P i- c <u 03 > O I J- c 03 O a. c
1X3
03
3 bO
•H ti.
A0N3fl03dd
103
feed
back
.

BA
SE
LIN
E
INT
ER
VE
NT
ION
BA
SE
LIN
E
INT
ER
VE
NT
ION
A0N3n03Ud
104
Fig
ure

BA
SE
LIN
E
INT
ER
VE
NT
ION
BA
SE
LIN
E
INT
ER
VE
NT
ION
FO
LL
OW
A0N3D03dd
105
Fig
ure
7.
Stu
den
t 1:
Perf
orm
an
ce
in
quiz
zes
on
matr
icu
lati
on
ta
ble
s.
Th
e
bro
ken
data li
ne
repre
sents
an
un
reco
r sessio
n
because
the
stu
dent
was
ab
sen
t.

A0N3n03dd
106
Fig
ure
8.
Stu
dent
2:
Perf
orm
an
ce
in
qu
izzes
on
matr
icu
lati
on
ta
ble
s.
Th
e
bro
ken
data li
ne
represents
an
unre
cord
ed
sessio
n
because
the
stu
dent
was
ab
sen
t.
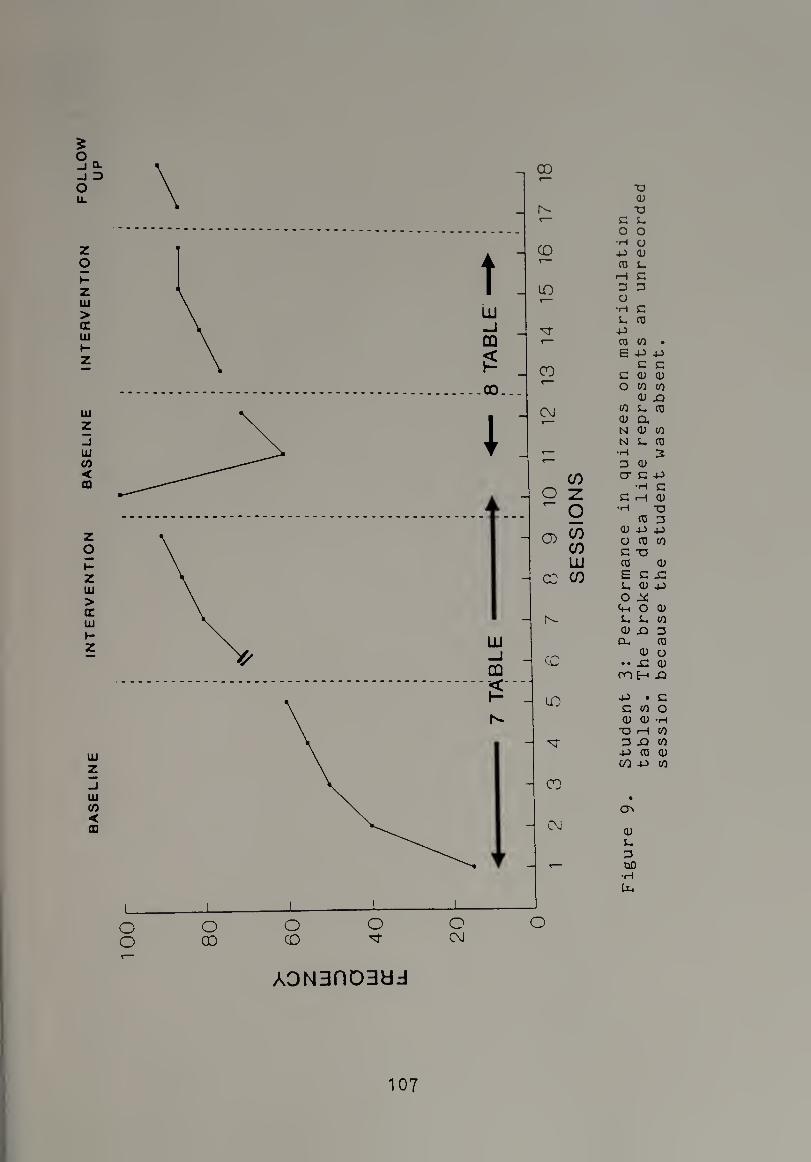
5
AONBflDBdd
107
Fig
ure
9.
Stu
den
t 3
: P
erf
orm
an
ce
in
qu
izzes
on
matr
icula
tion
ta
ble
s.
Th
e
bro
ken
data li
ne
rep
resen
ts
an
unrecor
sessio
n
because
the
stu
dent
was
ab
sen
t.
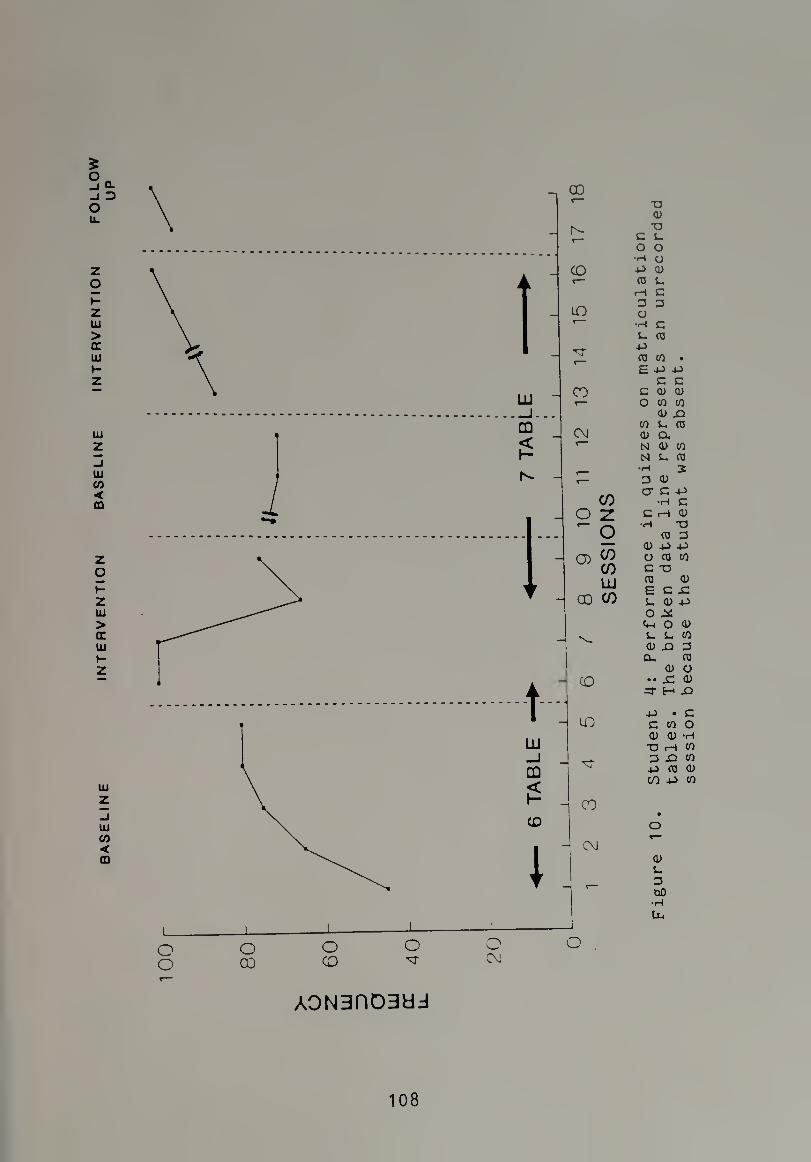
z o H Z UJ > tr UJ H Z
UJ z _l UJ (0 < m
z o
z UJ > tr UJ j- z
Ul z
Ul <0 < CD
■a <u •a
E Ui o o •H O X <U (0 e
i—I c 3 a o
•H C e ro x raw* E X X
c c E CL) 4) O CO CO
0) X c/i u ra OJ Cl, N CL) CO n e ra •H 3 3 a> a* e -p
•h e c ih a> •H T3
ro 3 d) X X o ra co e -o ra a> E e x E 0) X o !h O (D E E CO 0) X 3 a, ra
CD o •• X CD
•=r h x
X • E E CO O a) ra -h X i—I CO 3 X t/> x ra o C/1X co
o
a> E 3 bO
•H ti.
o o o 03
O O CO CM
o
A0N3flD3Ud
108

BA
SE
LIN
E
INT
ER
VE
NT
ION
BA
SE
LIN
E
INT
ER
VE
NT
ION
FO
LL
OW
A0N3fl03dd
109
Stu
den
t 5
: P
erf
orm
an
ce
in
qu
izzes
on
matr
icu
lati
on
ta
ble
s.
The
bro
ken
data li
ne
repre
sents
an
un
reco
r sessio
n
becau
se
the
stu
dent
was
absent.

BA
SE
LIN
E
INT
ER
VE
NT
ION
BA
SE
LIN
E
INT
ER
VE
NT
ION
FO
LL
OW
Q. 3
■a a> •a
c g o o •h o -p a> ra g
<h c
o •H C g ro -P 03 CO • E -P P
c c c <u <u o n n
<U jQ «U. (5 <d a n a> co n s, ra
•H 2 3 <D cr c -p
•H G c h a>
•H TO CO 3
<1) P -P o co co C TO co CD E c s: G 0> -P o ^
o <u
G G CO d) £ 3
Cl, CO CD O
•• -C <D vo h jo
-P • C C CO o 0) CD -H
TO i—I CO 3 JO CO -P CO <1) CO -P CO
C\J
<D G 3 bO
•H U-*
o o
o o o o 00 CD 'T CM
AONBRDBdd
o
110
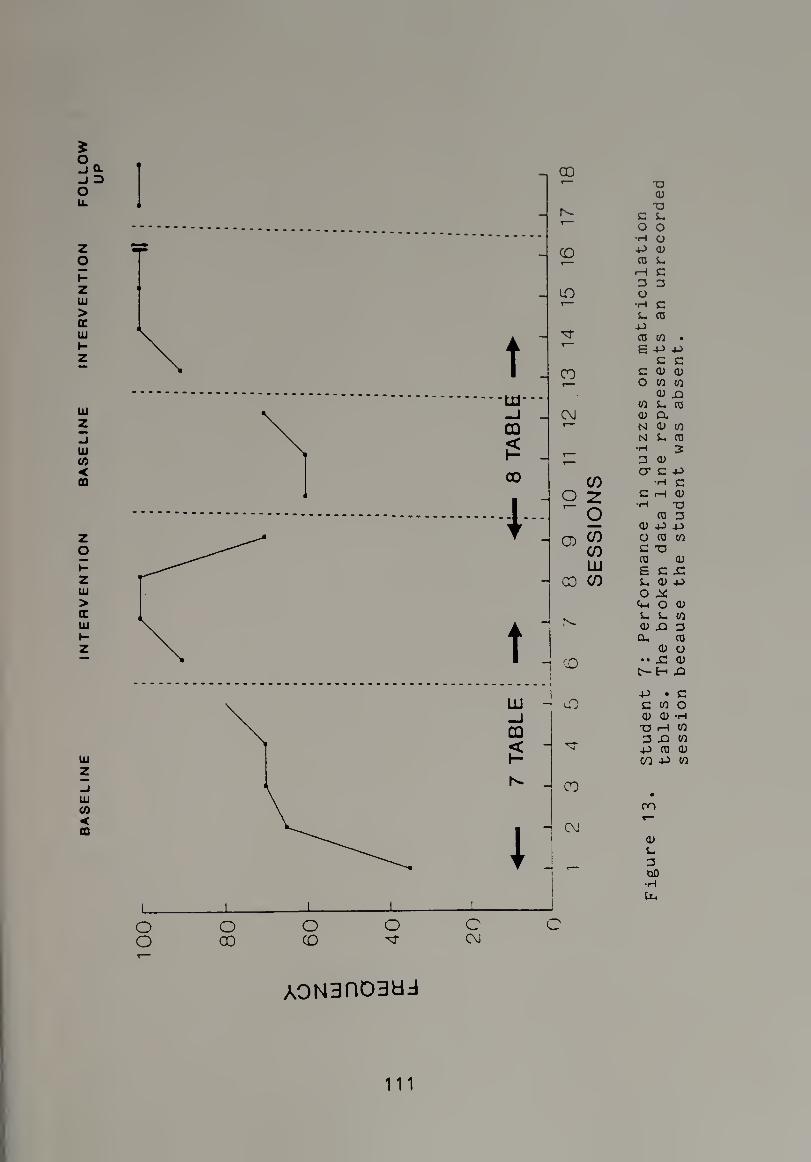
BA
SE
LIN
E
INT
ER
VE
NT
ION
BA
SE
LIN
E
INT
ER
VE
NT
ION
FO
LL
OW
a 3 ■a
<d X3
E E o o •H o 4-3 CD co e
rH e 3 3 o
•H C e co -p ffl w • E -P -P
c c e <d <d own
CD X) to e co a> o. N D W N l< (0
•H 3 3 CD cr e -p
■h c E i—I 4) •h -a
co 3 cu 4-3 -p o co co e -a co a; £ C£ E CD 4-3 O J* 4-i O CD E E CO a; 3 a, co
<D o •• SZ CD
H X3
4-) • E E co O CD CD -H •OH CO 3 4D CO
4-> CO CD 40 -P CO
m
CD E 3 bfl •H
Uh
O O O O
o oo CD c c C\j
A0N3nD3HJ
111
Experiment TT
Teacher Behavior
The data on observations of the teacher indicate an
impressive change in her rate of positive comments and goal
setting delivered to her students throughout the experiment,
in both classes. (See figures 14-15,)
Goal setting
During the baseline phase, the rate was low, in the 5th
period, the mean was .5 and in the 7th period, 2.8. When the
principal emphasized and modeled the OBM procedures then -
first in the 5th period and later, after several days, in
the 7th period - an increase in the rate of goal setting's
delivery occurred. The average during the 5th period
increased to 15.8 and in the 7th climbed to 29.1. Even if
these numbers are relatively low, comparing them to the
starting points in both periods - close to 0 - provides a
much clearer picture. It is also important to emphasize the
rate of the increase, especially for the 5th period: more
than thirty times that of baseline.
Non-verbal feedback
A similar trend of improvement occurred during the
intervention. During the baseline phase, in the 5th period,
the mean was 22, in the 7th period, 17.7. Throughout the
112
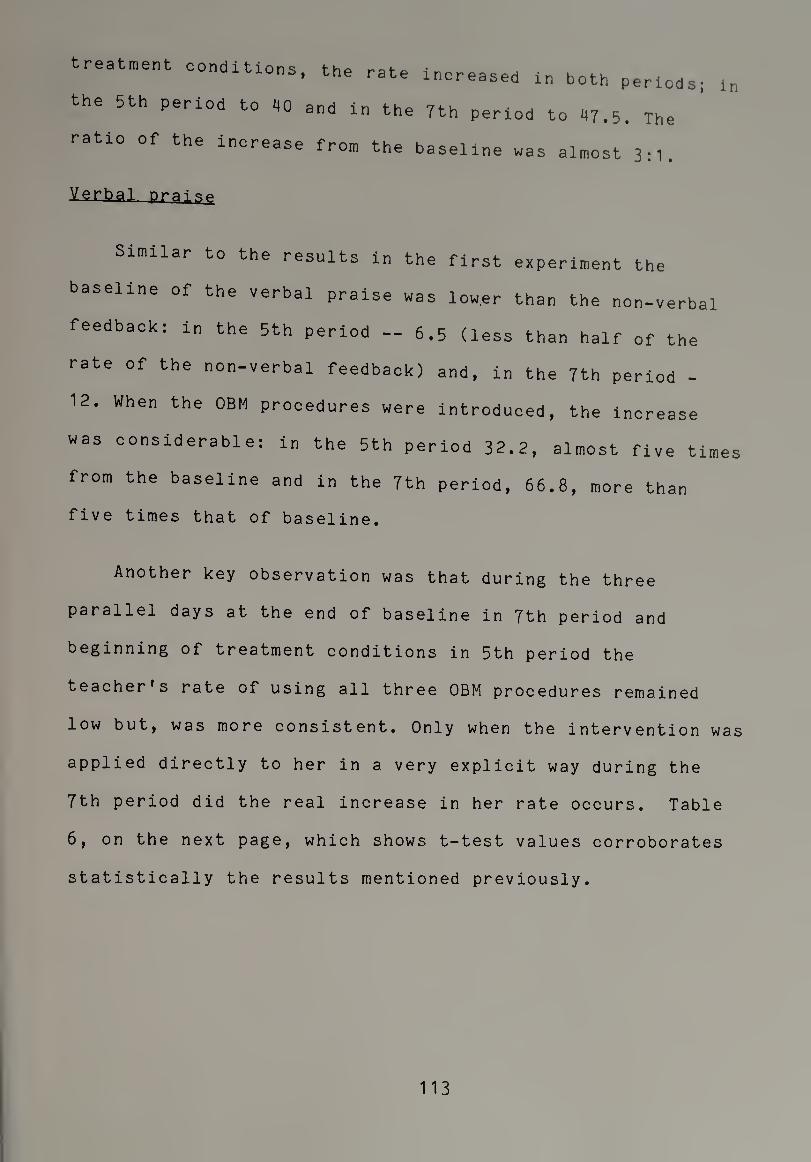
treatment conditions, the rate increased in both periods; ln
the 5th period to 40 and in the 7th period to 47.5. The
ratio of the increase from the baseline was almost 3:1.
Verbal prai,^
Similar to the results in the first experiment the
baseline of the verbal praise was lower than the non-verbal
feedback: in the 5th period — 6.5 (less than half of the
rate of the non-verbal feedback) and, in the 7th period -
12. When the OBM procedures were introduced, the increase
was considerable: in the 5th period 32.2, almost five times
from the baseline and in the 7th period, 66.8, more than
five times that of baseline.
Another key observation was that during the three
parallel days at the end of baseline in 7th period and
beginning of treatment conditions in 5th period the
teacher's rate of using all three OBM procedures remained
low but, was more consistent. Only when the intervention was
applied directly to her in a very explicit way during the
7th period did the real increase in her rate occurs. Table
6, on the next page, which shows t-test values corroborates
statistically the results mentioned previously.
113
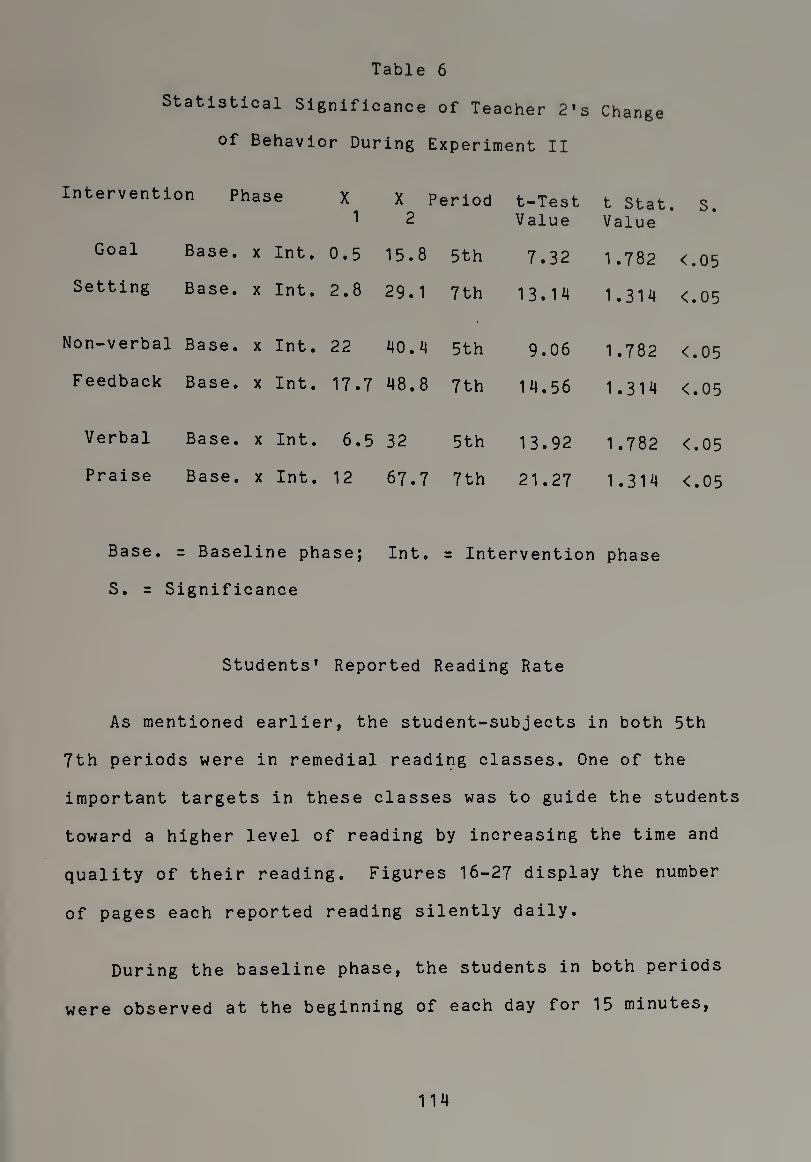
Table 6
Statistical Significance of Teacher 2's Change
of Behavior During Experiment II
Interventi on Phase X 1
X Period 2
t-Test Value
t Stat. Value
S.
Goal Base. X Int. 0.5 15.8 5th 7.32 1.782 <.05
Setting Base. X Int. 2.8 29.1 7th 13.14 1.314 <.05
Non-verbal Base. X Int. 22 40.4 5th 9.06 1.782 <.05
Feedback Base. X Int. 17.7 48.8 7th 14.56 1.314 <.05
Verbal Base. X Int. 6.5 32 5th 13.92 1.782 <.05
Praise Base. X Int. 12 67.7 7th 21.27 1.314 <.05
Base. = Baseline phase; Int. = Intervention phase
S. = Significance
Students’ Reported Reading Rate
As mentioned earlier, the student-subjects in both 5th
7th periods were in remedial reading classes. One of the
important targets in these classes was to guide the students
toward a higher level of reading by increasing the time and
quality of their reading. Figures 16-27 display the number
of pages each reported reading silently daily.
During the baseline phase, the students in both periods
were observed at the beginning of each day for 15 minutes,
114
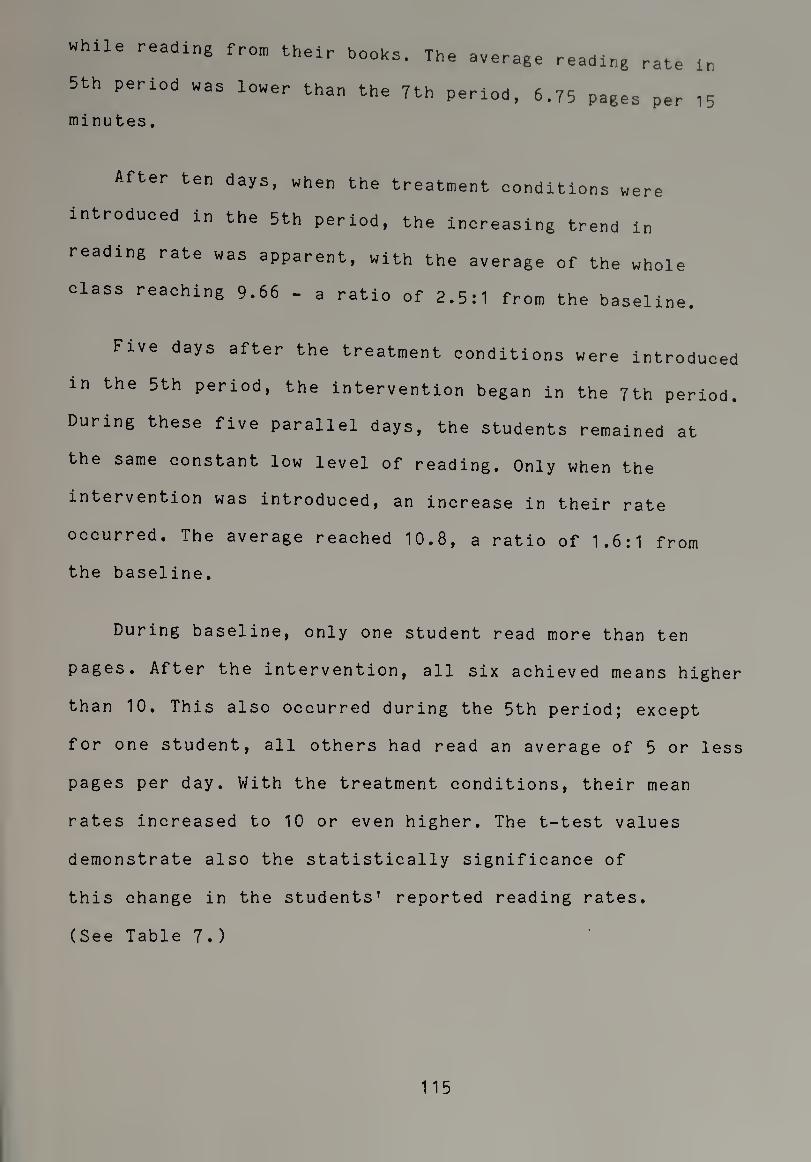
while reading from their books. The average reading rate in
5th period was lower than the 7th period, 6.75 pages per 15
minutes.
After ten days, when the treatment conditions were
introduced in the 5th period, the increasing trend in
reading rate was apparent, with the average of the whole
class reaching 9.66 - a ratio of 2.5:1 from the baseline.
Five days after the treatment conditions were introduced
m the 5th period, the intervention began in the 7th period.
During these five parallel days, the students remained at
the same constant low level of reading. Only when the
intervention was introduced, an increase in their rate
occurred. The average reached 10.8, a ratio of 1.6:1 from
the baseline.
During baseline, only one student read more than ten
pages. After the intervention, all six achieved means higher
than 10. This also occurred during the 5th period; except
for one student, all others had read an average of 5 or less
pages per day. With the treatment conditions, their mean
rates increased to 10 or even higher. The t-test values
demonstrate also the statistically significance of
this change in the students' reported reading rates.
(See Table 7.)
115

Table 7
Statistical Significance of Students’ Change in Their
Reported Reading Rates During Experiment II
Student Phase X 1
X 2
Period t-Test Value
t stat. Value
S.
1 Base. X Int. 5.8 14.08 5th 7.26 1.697 <.05 2 Base. X Int. 4.9 10.36 5th 4.87 1.697 <.05
3 Base. X Int. 2.1 8.4 5th 8.18 1.697 <.05
4 Base. X Int. 2.3 8 5th 9.82 1.697 <.05
5 Base. X Int. 3.25 6 5th 1.51 1.812 >.05
6 Base. X Int. 6.7 11.52 5th 7.89 1.697 <.05
1 Base. X Int. 10.06 17.7 7th 6.67 1.697 <.05
2 Base. X Int. 7.8 14.6 7th 8.27 1.697 <.05
3 Base. X Int. 5.2 10.3 7th 7.08 1.697 <.05
4 Base. X Int. 6.8 13.7 7th 3.47 1.747 <.05
5 Base. X Int. 6.7 16.2 7th 8.62 1.697 <.05
6 Base. X Int. 4.06 10.5 7th 7.24 1.697 <.05
Base. = Baseline phase; Int. = Intervention phase
S. = Significance.
As mentioned initially, verbal praise, non-verbal
feedback and goal setting were delivered by the principal
and, later on, by the teacher. Of special interest are the
116

days m which the teacher was the only one to deliver the
intervention. During most of those days, the students either
increased their rates after her intervention or, at least,
remained at the previous day's level. (Recall that the
teacher's own rate of verbal praise, non-verbal feedback and
goal setting increased after the OBM training session and
the principal's modeling.) Students' reading rates continued
to improve after the principal's intervention, as well.
As seen from the results, rate of reading by students in
the 5th period was lower than that of the 7th. As a matter
of fact, it was the lowest among all five periods this
teacher taught during the day. Three students, 3, 4 and, 5,
had been the most problematic in the class, in term of their
behavior, attendance and academics. Two of those students, 3
and 4, increased their reading rates to a greater extent
than all the students from both periods: student 3, from an
average 2.1 in the baseline to 8.4, a ratio of 4:1 (the
highest ratio of all students); student 4, from average of
2.3 in baseline to 8, a ratio of 3.47:1 (second best of all
students). Even student 5, who was absent 2/3 of the
experimental period during the treatment phase, showed
improvement over the baseline. Twice, when he was present
during the teacher’s intervention, he improved his rates
the very next day.
117

The results of students' on-task behavior, observed
during the silent reading period by the PLACheck recording
system, were relatively constant during all the experiment.
On average, the students were on-task 98% during the 15
minutes of the silent reading; most of the time, the score
was 100%.
Summary of Major Findings in Exp. II
1) Following the OBM training session, the principal's
modeling of giving feedback, praise and setting goals
for the students plus receiving her own feedback and
praise from the principal and from the researcher, the
teacher's rate of verbal praise, non-verbal feedback and
goal setting increased
2) Students' academic performance, in terms of number
of pages read daily, increased after the OBM procedures
were applied by the principal or by the teacher.
118

N(C o < CD Q
o LU
Z < LU
o CD Q
U_
_J o z
\— 2
LU LU u_
< CD
h- H-
LU DC LU > cc
_J < CD
LU >
i
cn _j
LU DC Z < H LU o O
Z > z O
□
tO
03 o bo
to 4~> 03 to
g 0)
JC o 03 03
4-> x: o
•H
X 3 C
to C rH O 03 C > g -a <u c -P 03 c •h a;
to G, -H
O 03 G
03 a, bO 03 to
■P 03 • C to T3 03 3 O O -H G TD G 03 C 03
Du 03 Q.
■=r
03 G 3 bO
•pH
U-.
A0N3nD3dd
119
-verb
al
feed
back
, in
the
5th

z o h- Z LU > cc LU I- z
LU z _J LU CO < CO
□
I □
tD
□
□
D
□ t i
□
co T“
lO
00
CM
C
CO
00 CO
Q o
o 00
o CO
o
CO I—I co o b0
CO 4-> <u to
E <u x: o CO
<u
x: o
•H
x: 3
(0 i—i co > e (U
c
C« O <U bO CO CO
4-> a; . c co -o D 3 O O -H L TJ S- a> e a>
Ol, (0 Q.
LTi
0 E 33 bO
AONanoaua
120
pra
ise
and
non-v
erb
al
feed
back
, in
the
7th

BA
SE
LIN
E
INT
ER
VE
NT
ION
PR
INC
IPA
L
PR
INC
IPA
L ♦
TE
AC
HE
R
FE
ED
BA
CK
♦ G
OA
L
SE
TT
ING
FE
ED
BA
CK ♦
GO
AL
SE
TT
ING
O 10 C\J
AVQ H3d QV3H
o 10
Q31HOd3d S39Vd
o
30 #
MD
a; L 3 bO
•rH
U4
121
Stu
den
t 1:
Num
ber
of
pag
es
report
ed
read
du
rin
g
5th
peri
od.
The
arr
ow
s
repre
sen
t te
acher's
inte
rventi
on.
BA
SE
LIN
E
INT
ER
VE
NT
ION
P
RIN
CIP
AL
PR
INC
IPA
L
• T
EA
CH
ER
F
EE
DB
AC
K
♦ G
OA
L
SE
TT
INQ
FE
ED
BA
CK ♦
GO
AL
SE
TT
ING
AVQ b3d avad a31HOd3b S39Vd 30 #
sz c •P o in -h
■P bO C c a>
•H > P L. 3 CD -a
c •a -h cd cd «
•- p
"O CD CD SZ
■P O P CD O CD CLP> CL) P -P
C W CL) a> c/i no a) CD P Q. Q.
0 Cm P O
CO P 3 CD o
X> P E P 3 CD 2
CD • • x:
CM H
•P • C X3 CD O
"O -H 3 P •P CD co a
CD p 3 bO •H U-.
122

O LO O LD O CM
AVQ dBd QV3U 031d0d3d S39Vd dO #
12 3
Fig
ure
18
. S
tudent
3:
Num
ber
of
pages
reporte
d
read
duri
ng
5th
p
erio
d.
The
arr
ow
s
represent
teacher's
inte
rv
en
tio
n.

BA
SE
LIN
E
INT
ER
VE
NT
ION
P
RIN
CIP
AL
PR
INC
IPA
L ♦
TE
AC
HE
R
FE
ED
BA
CK ♦
GO
AL
SE
TT
ING
FE
ED
BA
CK ♦
GO
AL
SE
TT
ING
AVQ H3d aV3U Q3iaOd3fcl S39Vd 30 #
a
<u i- p bO
•H
tx,
124
Stu
den
t 4:
Nu
mb
er
of
pages
report
ed
read
du
rin
g
5th
p
eri
od
. T
he
arr
ow
s
rep
resen
t te
ach
er's
inte
rv
en
tio
n.

BA
SE
LIN
E
INT
ER
VE
NT
ION
P
RIN
CIP
AL
PR
INC
IPA
L ♦
TE
AC
HE
R
FE
ED
BA
CK ♦
GO
AL
SE
TT
ING
FE
ED
BA
CK
* G
OA
L
SE
TT
ING
AVd H3d QV3U Q31HOd3U S30Vd dO #
125
Fig
ure
20.
Stu
dent
5:
Nu
mb
er
of
pag
es
report
ed
read
du
rin
g
5th
p
eri
od
. T
he
arr
ow
s
rep
resen
t te
acher's
inte
rventi
on.
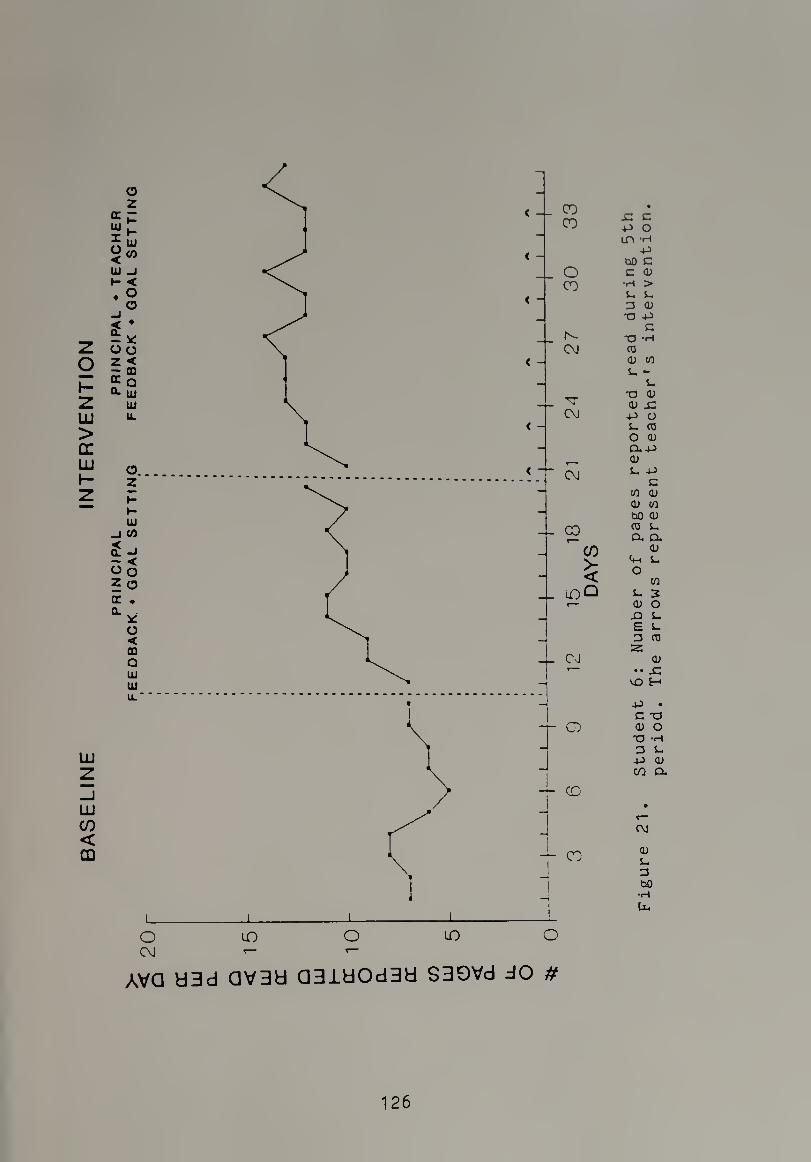
BA
SE
LIN
E
INT
ER
VE
NT
ION
P
RIN
CIP
AL
PR
INC
IPA
L ♦
TE
AC
HE
R
FE
ED
BA
CK ♦
GO
AL
SE
TT
ING
FE
ED
BA
CK ♦
GO
AL
SE
TT
ING
CO CO
o CO
N- C\J
CM
CM
-L 00 00
5
-L_ CM
CD
CO
AVQ U3d QV3H Q31HOd3H S39Vd dO #
SZ C -P o in 'H
-P bO C C CD
•H >
P P 3 CD
■a -p c
T3 -H CO CD CO P *-
P •a cd aj x -p a p co o <u Q..P CD p p>
c CO CD CD CO bO CD CO P Q. Q.
CD <*-t P O P (D
jz> E 3
CO
3 O P P co
<D •• SZ
vO H
-P • C "O CD O •a -h 3 P X CD C/0 Cu
CM
CD P 3 bO
•H U-*
126

BA
SE
LIN
E
INT
ER
VE
NT
ION
P
RIN
CIP
AL
PR
INC
IPA
L ♦
TE
AC
HE
R
FE
ED
BA
CK ♦
FE
ED
BA
CK ♦
GO
AL
SE
TT
ING
GO
AL
SE
TT
ING
AVQ d3d dV3d 031H0d3d S39Vd 30 #
127
Fie
ure
22
. S
tudent
1:
Num
ber
of
pages
report
ed
read
du
rin
g
7th
p
eri
od
. T
he
arr
ow
s
rep
resen
t te
acher's
inte
rv
en
tio
n.

BA
SE
LIN
E
INT
ER
VE
NT
ION
P
RIN
CIP
AL
PR
INC
IPA
L ♦
TE
AC
HE
R
FE
ED
BA
CK ♦
FE
ED
BA
CK ♦
GO
AL
SE
TT
ING
GO
AL
SE
TT
ING
AVQ d3d QV3d Q31dOd3d S39Vd 30 #
x: c 4-> o
'H 4->
bO C C 0)
•H >
3 d) -a
c -a -h CO <U CO i-. —
u •a a> a> x:
4-> o o co o <u 0,4-) <D S_ 4->
c CO CL) 0) CO bO 0) co O CL O.
a> C«-I O o
CO s- 3 a; o X) o E i- 3 CO 2
<u •• £
CM H
4-> • C T5 CD O •a -h 3 i- .p a> cn a
m CM
a; o 3 bO •H Ll.
128

BA
SE
LIN
E
INT
ER
VE
NT
ION
P
RIN
CIP
AL
PR
INC
IPA
L ♦
TE
AC
HE
R
FE
ED
BA
CK ♦
FE
ED
BA
CK ♦
GO
AL
SE
TT
ING
G
OA
L
SE
TT
ING
AVQ d3d QV3d Q3JLdOd3d S39Vd 30 #
129
Fie
ure
24.
Stu
den
t 3:
Nu
mb
er
of
pag
es
report
ed
read
du
rin
g
7th
p
eri
od
. T
he
arr
ow
s
rep
resen
t te
acher’
s
inte
rv
en
tio
n.

BA
SE
LIN
E
INT
ER
VE
NT
ION
PR
INC
IPA
L
PR
INC
IPA
L ♦
TE
AC
HE
R
FE
ED
BA
CK ♦
FE
ED
BA
CK ♦
GO
AL
SE
TT
ING
G
OA
L
SE
TT
ING
I_I_I_l_L
O iO O uO c C\J r-
AVQ d3d (3V3d CI31dOd3d S39Vd 30 it
130
Fig
ure
25.
Stu
dent
4:
Num
ber
of
pages
report
ed
read
du
rin
g
7th
p
eri
od
. T
he
arr
ow
s
repre
sent
teacher's
inte
rventi
on.

BA
SE
LIN
E
INT
ER
VE
NT
ION
CO
£ Q
AVQ d3d QV3d Q31dOd3d S39Vd 30 tt
131
Fig
ure
26
. S
tud
en
t 5
: N
um
ber
of
pag
es
report
ed
read
du
rin
g
7th
&
* p
eri
od
. T
he
arr
ow
s
rep
resen
t te
ach
er's
inte
rv
en
tio
n.

BA
SE
LIN
E
INT
ER
VE
NT
ION
o z
cr at X o < UJ
UJ co
< o a
oo z < - oa a q Q. LU
Ul U.
o Z
it
12 x Q
UJ CO
cr a.
UJ -i UJ < u. o
o
O LO O to o CM
AVQ U3d QV3B Q31dOd3d S39Vd 30 #
132
Fig
ure
27
. S
tud
en
t 6
: N
um
ber
of
pages
reporte
d
read
du
rin
g
7th
6
peri
od.
The
arr
ow
s
repre
sen
t te
acher's
inte
rv
en
tio
n.

CHAPTER V
DISCUSSION
The effectiveness of applying OBM procedures with both
principals, the teacher and a number of students was
demonstrated. The OBM training sessions appear to have
increased the rates of verbal praise, non-verbal feedback
and goal setting for the two principals. The results also
indicated that these procedures appeared to have had a great
impact on the students’ academic performance, in terms of
their math and reading skills. The positive effects of the
principal and teacher's praise, feedback and goal setting in
this research parallel results of many others who have shown
similar effects of experimenter’s praise, feedback and goal
setting on increasing the target behavior. This research has
demonstrated that the principals' application of OBM
procedures can provide an important form of instructional
leadership needed in classrooms.
Many observational and procedural issues were already
discussed previously but, several merit further
consideration. The two schools chosen, were different in
terms of their levels: one was an elementary school (A) and
the other a middle school (B). In spite of this difference,
the introduction of OBM procedures increased academic
performance in both schools. As mentioned in the review of
literature, most of the previous studies had been performed
133

at the elementary level while very few took place at higher
levels. The systematic replication employed in the second
experiment was important for the substantiation of the first
experiment's findings. As mentioned by Sidman (I960): "As a
tool to establish reliability, the experimenter will use the
data collected previously as a basis for performing new
experiments and obtaining additional related data.... Every
successful systematic replication demonstrates that the
finding in question can be observed under conditions
£ferent those prevailing in the original
experiment. Systematic replication can accomplish generality
and, at the same time, extend its generality over a wide
range of different situations. If it is successful, the
pay-off is handsome. Not only is the reliability of the
original finding increased, but also its generality with
respect to other organisms and to other experimental
procedures is greatly enhanced.” (p. 111-112)
The results of this research illustrate the systematic
effect of OBM procedures on the performance of students at
the middle school level, as well as at the elementary level.
Students aged 12 or older improved their rates of silent
reading as a function of the use of proper feedback, praise
and especially by setting realistic goals. Again, to
emphasize the importance of the success in the elementary
school, recall that weeks and months of endless efforts had
134

been spent in vain without the student-subjects learning
their multiplication tables. Only a few days after the OBM
procedures were implemented, however, the students began to
master the tables.
Implementing the OBM procedures with the teacher
increased her rates of verbal praise, non-verbal feedback
and goal setting. Additionally, a much more important
behavioral change occurred: her new skill generalized. The
teacher decided to post additional charts, for all her
classes, resembling the wall-chart example that had been
designed by the researcher. The wall-charts were used to
record the "at home reading time" students reported. The
results were impressive and again, demonstrated the
usefulness of OBM procedures. By spending a few more
minutes, daily to practice these OBM procedures she reported
improvement in the academic performance of her students
within a relatively very short period of time. (See
Appendix E.) Needless to say, while this teacher used these
OBM procedures on reading rate, the methods readily lend
themselves to application in many other fields of knowledge.
The effect of the study on the performance of the
principals was also quite impressive. As discussed in the
introduction, the main purpose of the research was to
investigate the potential for using OBM procedures to
increase the leadership skills of educational
135

administrators. This research demonstrated one way the
principal can perform a crucial instructional leadership
role in the school. In these two schools, OBM procedures
were implemented to the principals and by them to:
1) influence students’ behavior and academic
performance, either directly and/or indirectly via the
teaching staff; and
2) influence the teacher's performance by delivering
specific feedback, praise and by setting goals. (The
anticipated improvement in the teaching atmosphere,
ultimately resulted in higher levels of student academic
performance).
As mentioned in the review of the relevant literature,
among the characteristics of the effective principal, can be
found: a) High visibility in the classrooms and hallways of
the schools (Benjamin, 1981; Sweeney, 1981); b) Frequent
monitoring of pupil progress and clear statement of goals
and learning objectives (Edmonds, 1978; Pinero, 1982); and
c) Concentration of time and effort on instructional
matters and participation with teachers in inservice
training (Jansen, 1967; Pinero, 1982; Sweeney, 1981)
Corroborating these characteristics, the principals in this
research emphasized achievement, frequently evaluated
student progress in classrooms, supported and reinforced
teachers' and students' performance. As McIntyre and Morris
136
(1982) concluded their article, it would be unrealistic to
assume that the principals would ever be in a position to
give instructional improvement their number one priority.
Nevertheless, a growing body of research shows a positive
relationship between the leadership ability of principals
and student growth in basic skill achievement. This means
that if principals can improve their skills in and if their
leadership efforts focus on the characteristics of effective
teaching, as the two principals in this research did, one
can anticipate more successful schools.
As stated before, behavior modification has been
contributing toward making educational systems more
effective and satisfying to students and school personnel
(Sulzer-Azaroff, 1987). The field of OBM, representing the
behavior modification, not only helps us understand
behavior, it also gives us effective tools to managing it,
such as goal setting, performance feedback, positive
reinforcement, and behavior based training strategies. The
OBM procedures implemented in this research corroborate
findings of several other studies reported previously (Kim
and Hammer, 1976; Ivancic et al., 1981; Panyan, Boozer and
Morris, 1970; Quilitch, 1975; Riley and Frederiksen, 1984;
Sulzer-Azaroff, 1984). The results of this research and
other studies seem to make clear that feedback and goal
setting interventions can result in increases in desired
137
process behaviors and organizationally relevant outcomes. As
mentioned before, these results shows remarkable consistency
in terms of being the best approach for changing behavior
and performance, and is important especially because of the
applicability issue.
Ea.ctbrs and Issues That mav Have Affected the
As mentioned previously, the results indicate that OBM
procedures appeared to influence students' academic
performance. Two factors may have affected the results.
First, the principals' visits in the classrooms - usually,
teachers and students are unused to frequent visits by the
principal. The dramatic intentional increase in principals'
involvement, due to the characteristics of OBM procedures,
may possibly have influenced the students (and the teachers,
as well). The researcher sees this factor as positive, in
terms of the principals' roles as instructional leaders.
Second, the self-recording forms, introduced to students in
the second experiment, may have provided an additional
pressure on students to achieve their goals. The students'
involvement in the research became more active, through the
self-recorded forms, as a resource to receive the positive
reinforcement. As an instrument for educating students
toward greater self-control and self-management, the
self-recording system can be effective.
138
An increase in Principal A's and Teacher 2's rates of
non-verbal feedback and verbal praise was demonstrated.
Their improvements were greater for verbal praise than
non-verbal feedback. Various explanations of this finding
can be suggested: a) it is more difficult to change
non-verbal behavior than verbal behavior; b) it is more
difficult to give feedback and praise for the use of
non-verbal feedback because the former is more difficult to
observe. Another explanation for the smaller effect of the
interventions on non-verbal feedback may lie in the
observation procedures. It is possible that the observers
marked a verbal praise statement more readily and did not
score non- verbal praise when it was accompanied by verbal
praise. That is, the increased verbal praise may have masked
the increased non- verbal feedback because the former is
more readily discernible.
Co^^-benefit Analysis of OBM Procedures
A cost-benefit analysis of the OBM procedures described
in this research reveals promising results. In terms of
costs, in order to have the principals, and teachers use
goal setting, feedback and praise, several OBM training
workshops must be conducted. The first one or two workshops
a professional OBM instructor, the school psychologist or
counselor, or an outsider consultant (and this can be done
as a typical teacher training workshop) but, later on, the
139

strength of the training, from a cost view point, lies in
principals participation in maintenance of the skills
learned in the workshops. The principals are always housed
the school and the maintenance procedures take little of
the principals* time and can be accomplished whenever the
principals has a few free minutes. The minimal time
commitment by the principals for this instructional
leadership function is cost-justified since measurable
teacher behavior change and especially student academic
increased performance can be demonstrated, after using the
OBM procedures.
Indirect Benefits of. Principal Participation in orm Procedures
The advantages of principals* involvement in the OBM
training and procedures go beyond issues of cost and
convenience. Both principals in the research reported
benefits from their participation - unrelated to the
improvement of teacher’s use of feedback, praise and goal
setting or students' academic performance. The principals
found that their participation increased their knowledge of
the children, the curriculum, the classroom environment, and
various aspects of teacher behavior. Both principals
expressed the opinion that it was important for students and
teachers to see the principal in environments other than the
principal's office. By visiting the classrooms, the
principals showed their interest and involvement in
140

activities of the teachers and the students. The teachers
expressed the opinion that it was important for the
principal to see what particular children were like in
classroom situations so that the principal would understand
difficulty of dealing with them. The students showed
curiosity and maybe a little surprise (which may, as well,
have influenced or affected some of the results) but, again,
their increased academic performance has demonstrated the
importance of the principals' involvement in the classroom
and their application of OBM procedures.
E.Uturd—Applications_and Implications
As mentioned earlier, teacher 2 decided to apply some of
the OBM procedures to her other classes and begun planning
to continue to record students’ performance in reading
throughout the year. She intends to use original
standardized reading test results to compare this year’s
results with those of previous years. This teacher is part
of a team and she plans to convey the results of this
research at one of the team’s meetings. Were the principal
to be involved in this particular team, and others,
implementation of OBM procedures in many other subjects,
could be promoted within a broader range of the school
activities. Yet, academic performance is only one aspect of
this program - a variety of many other dimensions can
benefit from the OBM implementation such as health and
mi

safety, classroom management, social behaviors, and so on.
Moreover, this can be expanded to include other staff. The
strength of the program lies in the principal's willingness
to be an effective instructional leader.
As part of the principals' participation in such an
undertaking, OBM training sessions may be needed. As
mentioned previously, the time commitment from the principal
and from teachers for these sessions is minimal while the
subsequent behavior changes in the staff, should more than
compensate for this initial investment. It will be
appropriate at this time however, to warn that these novel
methods maybe threatening to staff initially, as any new
method of supervision might be. For instance, the
principal's involvement in an OBM training session plus
her/his observing and direct involvement in classrooms, may
make teachers uncomfortable, because teachers and principals
are unused to such an involvement. As discussed in Chapter
II in the review of the literature, principals tend to
observe classrooms once or twice a year, for a formal
critique or evaluation. Some teachers might feel threatened
by more a frequent observations and involvement by the
principal and the principal may feel more comfortable
remaining in the office. In order to change these habits and
attitudes, further explanation is needed and a clear vision
of all the eventual possibilities and benefits for the staff
and administration must be provided.
142
More research emphasis Is needed on training principals in
behavioral observational procedures, in setting goals and In
delivering appropriate feedback and reinforcement. This
study demonstrated the usefulness of these OBM procedures
but it did not focus on investigating training methods for
principals and teachers. Future research could address this
issue.
The present research is an initial inquiry into
promoting the effectiveness of the principal as an
instructional leader of staff and students. Further research
on this topic is needed. The present results indicated that
two principals in two different schools (in two different
environments — geographically and by level), could influence
the academic performance of students and improve the
teaching skills of their staff by using brief, simple
procedures. Implementation of the OBM procedures by other
principals, in other schools is necessary, to document the
general effectiveness of these procedures. It would be
important also to investigate a wide variety of possible
academic subjects within the school system, on which the
strategies mentioned above can be applied. Future studies
should attempt to examine the effectiveness of training
programs for principals and teachers, based upon the changes
in the teachers’ and students’ behavior and performance.
143

A- Personal statempnt
As mentioned in the review of literature, when
discussing the achievements of behavior analysis and the
needs of education, Sulzer-Azaroff (1986 ) emphasized factors
that may prevent acceptance of behavioral methods, among
them misinformation about the advantages of behavioral
strategies and a lack of sufficient skills to implement them
successfully. In the present research several discussions
were held with the two principals in this study, with
teacher 2 - before, during and, after the OBM training
sessions. Needless to say, these issues of acceptability
arose in these discussions. The success of this research was
not only in its results, but in the change of participants’
feelings, attitudes and behaviors. They expressed their
satisfaction both in words and especially in practical ways.
For instance, the fact that the principals left their
offices, in which many administrative duties remained, to
observe and to promote academic performance of students, and
that the teachers were willing to take "risks" and to
introduce new teaching strategies to improve students’
performance, provided convincing evidence of their positive
attitudes toward the new methods. This brings immense
satisfaction to this researcher. Over the 14 years of
experience this researcher has had as a teacher, principal,
and superintendent of schools, he has seen many changes in
144

educational approaches. The results of this present academic
research emphasize even more the potential value of using
procedures in educational settings. Much work needs to be
done, to teach and to learn the proper skills and to convey
the information and the benefits of these successful
approaches. The best ambassadors for this important task are
those who are willing to accept the "risks", while they
struggle toward achieving effectiveness.
145

APPENDICES
146

APPENDIX A
HB.SERVATTQNAT FORM for princtpai a
N A M F ri L —----DATE _
LIST QF PRINCIPAL'S BEHAVTOR.S
'• n c i p a i' a-Feedback-
that's good! j_
terrific job! |_ a) verbal remarks - excellent! |_
on the performance - very good! |_
you work hard! j_
smile
b) "physical" contact nod
with the student shake hand
eye contact
pat on the shoulder
2. ? r 1-n c i p a l1 s_Goal_S ting
a) asks student what s/he thinks s/he can do for next time;
b) give praise for student's decision/suggestion;
c) suggest a goal to the student for next time;
d) inform student about the goal to be achieved by the time agreed upon under (a)

OBSERVATIONAL FORM for TFArHF^ p
NAME DATE
LIST OF TEACHER»S BEHAVIORS
1 • Teacher
a) verbal remarks
on the performance
.F. eedhanfr
that’s good!
terrific job!
excellent!
very g00dj
you work hard!
smile
b) ’’physical" contact nod
with the student shake hand
eye contact
pat on the shoulder
2 . Teacher G Q a,. I—S, e t_ t j n g:
a) asks student what s/he thinks s/he can do for next time;
b) give praise for student’s decision/suggestion;
c) suggest a goal to the student for next time;
d) inform student about the goal to be achieved by the time agreed upon under (a)
I_!_i.
148

OBSERVATIONAL FDRM FOR STUDENTS
OBSERVER'S NAME DATE
149
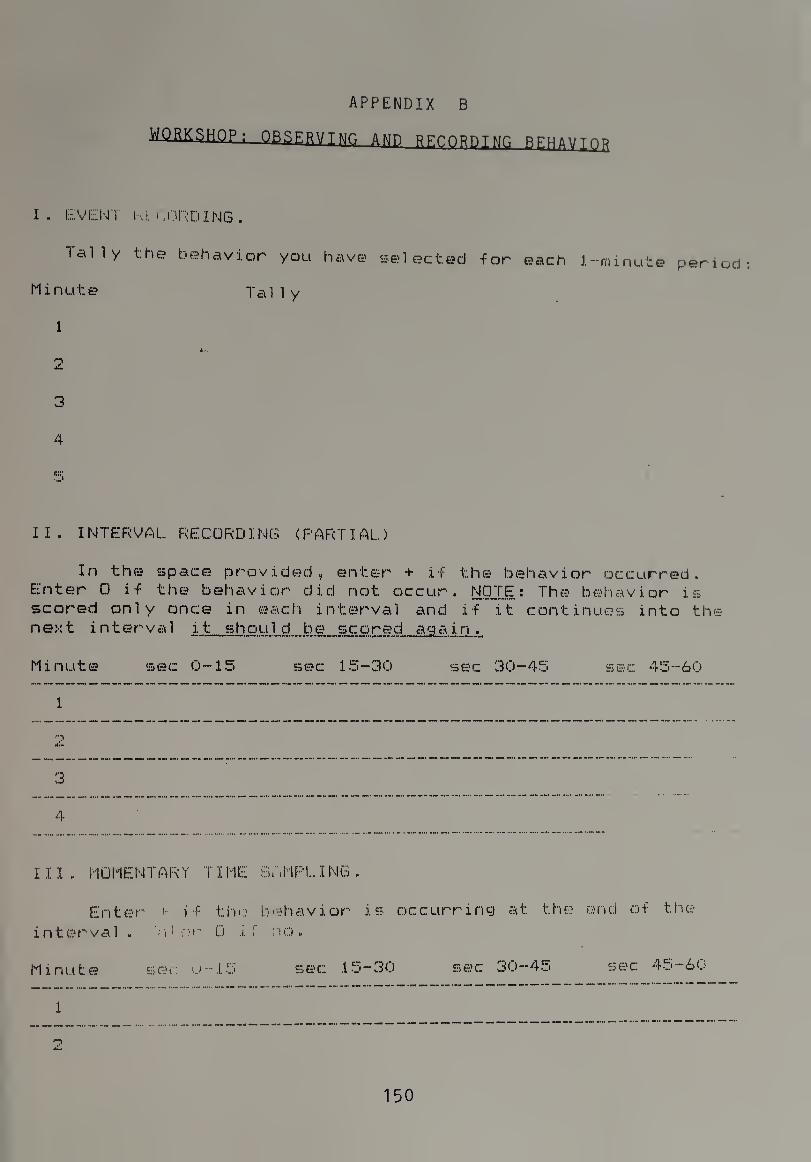
APPENDIX B
HflRKSHQP; OBSERVING AND RECORDING BFHAVTnp
I. EVENT RECORDING.
Tally the behavior you have selected for each 1-minute period:
Minute Tally
1 •
2
3
4
II. INTERVAL RECORDING (PARTIAL)
In the space provided, enter + if the behavior occurred. Enter 0 if the beh a v j. o r c:l i. d n o t occur. NOTE : T h e behavior i s scored only once in each interval and if it continues into the next interva1 it shou 1 d be scored again .
Minute sec 0-15 sec 15-30 sec 30-45 sec 45-60
1
3
III. MOMENTARY TIME SAMPLING.
Enter i- if the behavior is occurring at the end of the
interval . "r :• r 0 .i. f no ..
Minute sec u-J.5 sec 15-30 sec 30-45 sec 45-60
150
APPENDIX C
WALL-CHARTS
151

APPENDIX D
SELF-RECORDING form for students in expertmpNT tt
Name __Date
WEEKLY-CHART: "ON-TASK"- BEHAVIORS.
sAss i gnment On time 1
for I Have all the equipment § # of pages .
read Day class I pen/penci1 book folder 1 c 1 ass home
MONDAY
TUESDAY
WEDNESDAY
THURSDAY
FRIDAY
152
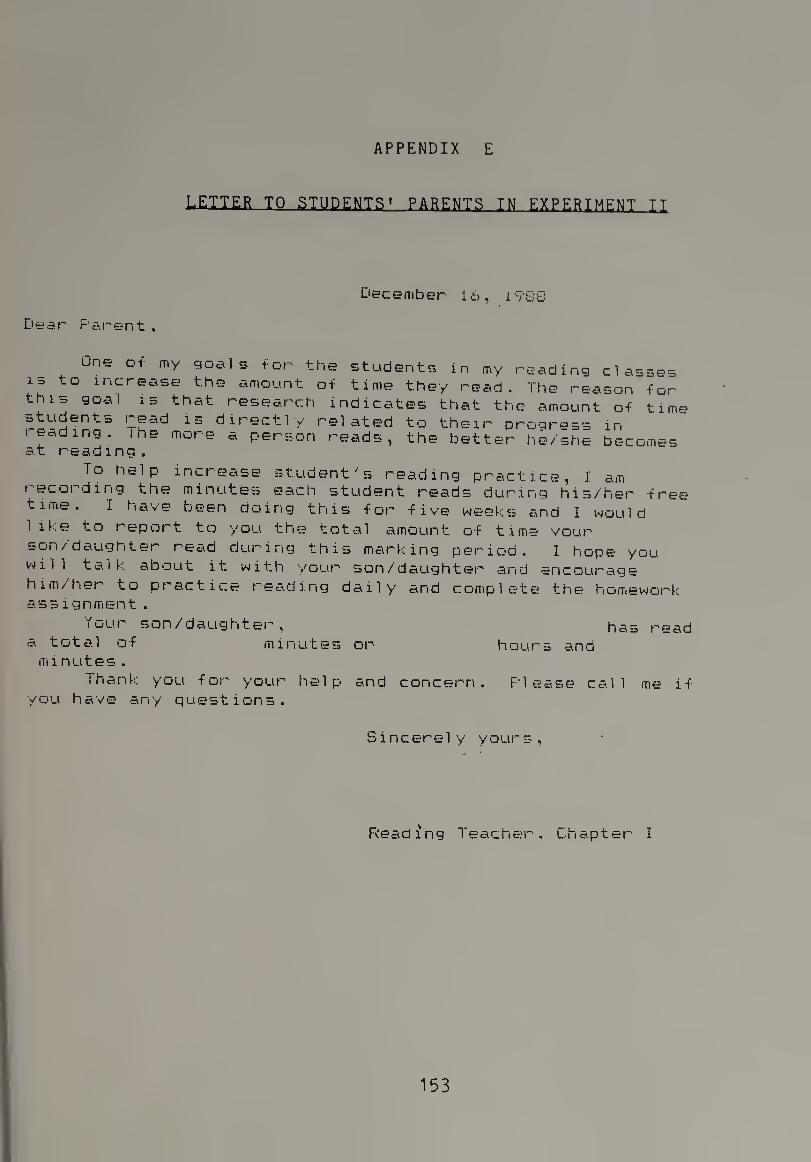
APPENDIX E
LETTER TO STUDENTS * PARENTS IN EXPERIMENT II
Dear Parent ,
December 16, 1988
une ot my goals tor the students in my reading classes 15 to increase the amount of time they read. The reason this goal is that research indicates that the amount of students read is directly related to their progres reading, ihe more a person reads, the better he/sh at reading.
f or t ime
in becomes
To help increase student's reading practice, I am recording the minutes each student reads during his/her free time. I have been doing this for five weeks and I would 1 ike to report to you the total amount of time your son/daughter read during this marking period. I hope you will talk about it with your son/daughter and encourage him/her to practice reading daily and complete the homework assignment .
You.r son/daughter, has read a total of minutes or hours and
minutes .
Thank you for your help and concern. Please call me if you have any questions.
Sincerely yours,
Reading Teacher, Chapter I
153

REFERENCES
Andrasik F. (1979). OBM in business settings: A methodological and content review. Journal of
-Organisational Behavior Management, 2, 85-102.
Babb» & K°PP,D. G. (1978). Application modification in organizations: A review and As-adomy of Management ReviPW) j_, 91-97.
of behavior critique.
Baer, D. M., Wolf,M. M. current dimensions Analysis, 1, 91-97.
& Risley, T. R. (1968). Some of ABA. J_onnnal of Applied Behavior
Balcazar, F. E., Hopkins, B. L., & Suarez, Y. (1985), A critical objective review of performance feedback. jLonrnal of ...Organisational-Behavior Management, 7 \3/ 1 / y 65-89•
Ballard, K. D., & Glynn, T. (1975). Behavioral self¬ management in story writing with elementary school children. Jjmcnal of Applied Behavior Analysis, £, 387-398.
Benjamin, R. (1981). Making schools work. New York: The Continuum Publishing Company.
Blumberg, A., & Greenfield, W. (1980). The effective principal. Boston: Allyn and Bacon.
Bogue, E. J. & Saunders, R. L. (1975). The educational manager. New York: Jones.
Borg, W. R., & Gall, M. G. (1983). Educational Research. London and New York: Longman.
Broden, M. , Hall, R. V., & Mitts, B. (1971). The effect of self-recording on the classroom behavior of two eigth- grade students. Journal of Applied Behavior Analysis. A, 191-9.
Brookover, W. B. ( 1979). School social system, .and student achievement school can roako a differenco. New York: Praeger
Brown, R. E., Copeland, R. E., & Hall, R. V. (1972). The school principal as a behavior modifier. J.QJJ.rH3.1—o£ Educational Research. M, 175-180.
154
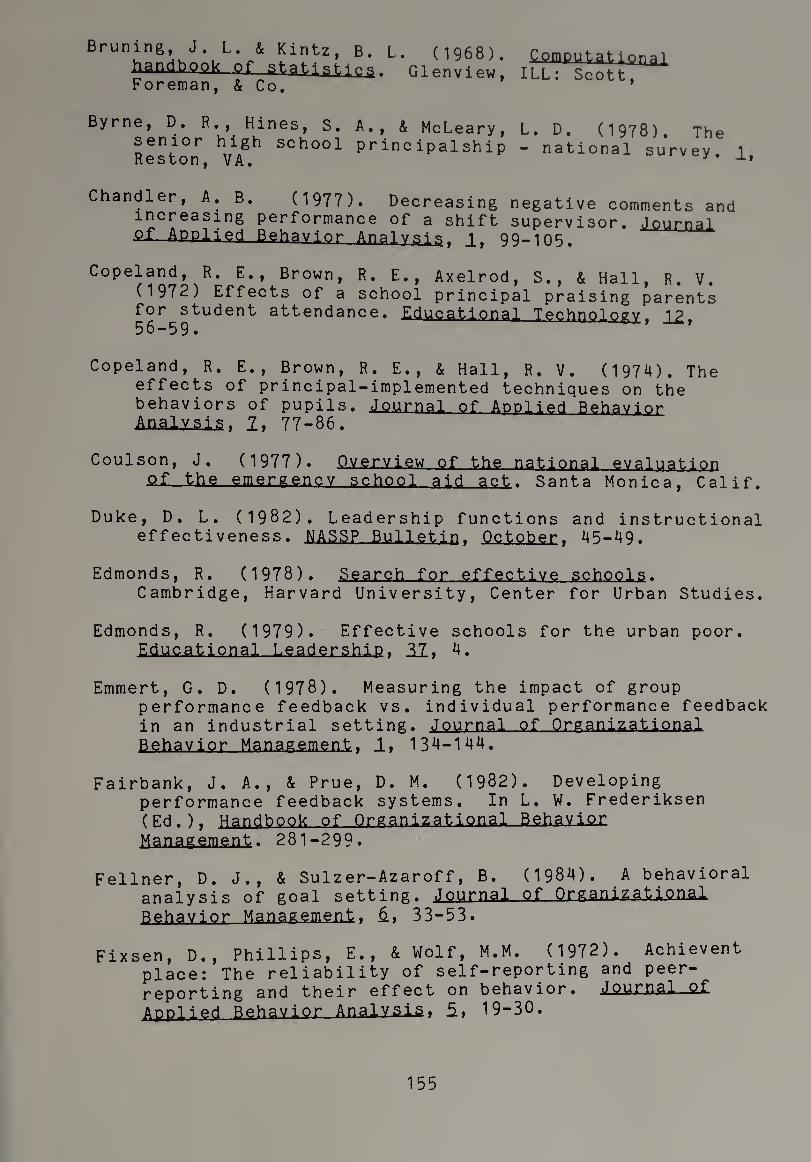
Bruning, J. L. & Kintz, B. L. (1968). JiandbOOk of—statisticS - Glenview. Foreman, & Co.
C-Qmputat ion^i ILL: Scott,
Byrne, D. F., Hines, S. A., & McLeary, senior high school principalship Reston, VA.
L. D. (1978). The — national survey. 2,
Chandler, A. B. (1977). Decreasing increasing performance of a shift
■9,f. Applied Behavior Analysis, i,
negative comments and supervisor. Journal
99-105.
Copeland, R. E. , Brown, R. E., Axelrod, S., & Hall, R. V. (1972) Effects of a school principal praising parents for student attendance. Educational Technology, l£, 56-59.
Copeland, R. E., Brown, R. E., & Hall, R. V. (1974). The effects of principal-implemented techniques on the behaviors of pupils. Journal of Applied Behavior Analysis, 2, 77-86.
Coulson, J. (1977). Overview of the national evaluation flf the emergency school aid act. Santa Monica, Calif.
Duke, D. L. (1982). Leadership functions and instructional effectiveness. NASSP Bulletin, October, 45-49.
Edmonds, R. (1978). Search for effective schools. Cambridge, Harvard University, Center for Urban Studies.
Edmonds, R. (1979). Effective schools for the urban poor. Educational Leadership, 22, 4.
Emmert, G. D. (1978). Measuring the impact of group performance feedback vs. individual performance feedback in an industrial setting. Journal of Organizational Behavior Management. 1, 134-144.
Fairbank, J. A., & Prue, D. M. (1982). Developing performance feedback systems. In L. W. Frederiksen (Ed.), Handbook of Organizational Behavior Management. 281-299.
Fellner, D. J., & Sulzer-Azaroff, B. (1984). A behavioral analysis of goal setting. Journal_of Organi?.a.t 10na.1 Behavior Management. £, 33-53.
Fixsen, D., Phillips, E., & Wolf, M.M. (1972). Achievent place: The reliability of self-reporting and peer¬ reporting and their effect on behavior. Journal—o£ Applied Behavior Analysis, fi, 19-30.
155
Ford, J. (1980) procedures. Management,
. A classification system for feedback j Urua1 Organizational Rphayjnr
F rederiksen, L. E. (1981/2). On the behavioral approach to managerial
Organization^ pph^vW -iZ—if *5—o9#
prospects of a effectiveness. ■Management,
F rederiksen, L. E. (Ed.), flrgamzational Behavior
(1982). Handbook of Management. New York: Willey.
Frederiksen, L. E., & Johnson, R. p. (1981) Organizational Behavior Management. In Hersen, M.
& MMlle^’ ,P* (Eds,): Progress in behavior modification. New York.
Frederiksen, L. E., & Lovett, S. B. (1980). Inside Organizational Behavior Management. Journal of flrg.anizat3.onal Behavior Management, £, 5-12.
Glynn, E. L., Thomas, J. D., & Shee, S. M. (1973). Behavioral self-control of on-task behaviors in an elementary classroom. Journal of Applied Behavior Analysis, 6, 105-113.
Goldhammer, E. (1971). Elementary school principals and schools. University of Oregon.
Hall, B. L. (1980). Editorial. Journal of Organizational BgJaa.vior Management, £, 145- 150.
Hays, W. (1963). Statistics for Psychologists. New York: Holt, Rinehart and Winston.
Hersen, M., & Barlow, D. H. (1976). Single case experimental designs: Strategies for studying behavior change. New York: Pergamon Press.
Howell, B. (1981). Profile of the principalship. Educational Leadership. IB, 4, 77-81.
Ivancic, M. T. , Reif, D. H., Iwata, B. A., Faw, G. D., & Page, T. J. (1981). Evaluating supervision program for developing and maintaining therapeutic staff-resident interactions during institution care routines. Journal of Applied Behavior Analysis. ±4, 95-107.
Jensen, T. (1967). Elementary school administration. New York: Lee.
156

Johnston, J. M., & Pennypacker, H. S. ( 1 980 ) straUau. .and, tactics of human behavioral research. Hillside,
Jersey: Lawrence Erlbaum Assoc. New
Killian, M. G ladder to 145-157.
, & Sexton, leadership.
M. J. MSSP
(1979). Climbing .Bulletin, March,
the
Kim J. S., & Hammer, W. C. (1976). Effect of feedback and goal setting on productivity satisfaction in an organizational setting. Applied Psychology, £i, 48-57.
performance and lournal of
Klopf, G. (1982). The essentials of effectiveness: A job description for principals. The Principal, March.
Komaki, J. (1981/2). Managerial effectiveness: Potential contributors of the behavioral approach. Journa1 of Qrganigatignal Behavior Management, 3/3, 71-83.
Komaki,J., Collins,R. L., & Thoene, T. J. F. (1980). Behavioral measurement in business, industry, and government. Behavioral Assesment, £, 103-123.
Kreitner, R. (1981/2). The feedward and feedback control of job performance through Organizational Behavior Management. Journal of Organizational Behavior Management, 3, 3-19.
Kroeze, D. J. (1982). Effective principals as instructional leaders: New directions for research. A.dm.inistratpr-f.s Notebook, ill.
Latham, G. P., & Locke, E. A. (1979). Goal setting: A motivational technique that works. Organizational Dynamics, Autumn, 68-79.
Latham, G. P., & Yukl, G. A. (1975,a). Assigned versus participative goal setting with educated and uneducated woodworkers. Journal of Applied Psychology. M, 299-302.
Latham, G. P., & Yukl, G. A. (1975,b). A review of research on the application of goal-setting in organizations. Academy of Management Journal. 13, 824-845.
Lamal, P., & Benfield, A. (1978). The effect of self¬ monitoring on job tardiness and percentage of time spent working. Journal of Organizational BehaviPX Management. 1, 142-149
157

Leithwood, K. , & Montgomery, D. ( 1982). The role of the
Revi^fiw^nf^FH^aH Prin°iPal i" Program improvement. iLS.YlgW Of Educational Research, 12, 45-61.
Little, J. (1982). Hie effective principal. American Education.
New York
Locke, E. A. ( 1968). Toward a theory of task motivation
ierfor::nceIe^5gniZati0nfl1 ^ ^
Lopresti, P. L. (1982). Building a Principal, Hax, 177-185.
better principal. The
Luthans, L. F. (1982). Improving performance: A behavioral problem-solving approach". In L. Frederiksen (Ed.): Handbook Of. Organizational Behavior Management. New York.
Luthans, L. F., & Kreitner, R. (1974). Management of behavioral contingencies. Personnel .Journal , Julv-August, 7-16.
Luthans, L. F., & Martinko, M. J. (1982). Organizational Behavior Management: A way to bridge the gap between academic research and real world application". Journal
Q.f—Organizational Behavior Management, 4, 33-52.
Maher, C. A. (1981). Training of managers in program planning and evaluation: Comparison of two approaches. Journal of. Organizational Behavior Management, 2, 45-56.
Maher, C. A. (1982). Performance feedback to improve the planning and evaluation of instructional programs. Journal pH.Q-L&anisational, Boh.aY.lor Management, 2, 33-40.
Manasse, L. A. (1982). Effective principals: Effective at what? The Principal, March, 10-15.
Mawhinney, T. C. (1984). Philosophical and ethical aspects of Organizational Behavior Management: Some evaluative feedback. Journal of Organizational Behavior Management. £, 5-31.
Mazzarella, J. A. (1982). Portrait of a leader. Uie Principal, Hax, 23-25
McIntyre, J. D., & Morris, W. R. (1982). Time management and instructional supervision. Clearing Houaa, 5H.
158

MintNewr!irk; Hlrplr\ Rowf natUr6 °f manaReria1 work.
Nau,P. A., VanHouten, R., & O'Neil, A. (1981). The effects of feedback and a principal mediated timeout procedure on the disruptive behavior of junior high- aCh?ni !^dents* Sducatien and Treatment of Children ii j lUl — I 1 j *
Owens, R. G. (1978). Organizational behavior in g-Q-Ueation» Englewood Cliffs, New Jersey: Prentice.
Panyan, M. C., Boozer, H., & Morris, N. (1970). Feedback to attendants as a reinforcer for applying operant techniques. Journal of Applied Behavior Analysis, 2,
I "■ H «
Park, D. (1980). What management is and is not. Educational Record, 167-178.
Peterson, K. D. (1977). The principal's task. Administrator's Notebook, XXVI.
Pinero, U. C. (1982). Wanted: Strong instructional leaders. The Principal, October, 34-37.
Prue, D. M., & Fairbank, J. A. (1981). Performance feedback in Organizational Behavior Management: A review. Journal Qf_Organizational Behavior Management, 1, 1-16.
Prue,D. M., Frederiksen, L. E., & Bacon, A. (1978). Organizational Behavior Management: An annotated bibliography Journal of Organizational Behavior Management, 1, 216-257
Quilitch, H. R. (1975). A comparison of three staff management procedures. Journal of Applied Behavior Analysis, £, 59-66.
Riley,A. W., & Frederiksen, L. E. (1984). Organizational Behavior Management in human service setting: Problems and prospects. Journal of Organizational Behavior Management, £, 35-47.
Rosenblum, S., & Jastrzab, J. (1980). The rele Of the principal in change, the teacher com. Cambridge: Abt. Associates.
Rutherford, W. (1985). School principals as effective leaders. Phi Delta Kappan. M, 56-58.
159

Seifert, E, H., & Beck, J. J, (1981). principals; Instructional leaders or Zhi Delta Kappan. 41, 45-48.
Elementary school managers.
Skinner, B. F. (1966). What of behavior? Journal of the Behavior, 213-218.
is the experimental analysis -Experimental Analysis of
Snyder, K.J. (1983). Instructional leadership for productive school. Educational Leadership, 4Q, 3.
Souweine, J. W., Sulzer-Azaroff, B., & Frederickson, R. H.
nri nl i nal ^ ll]R ™ Pg ^ * eaC h e r Braise thrnnph principal attention. Paper presented at the meeting the American Association of Behavioral Therapists Atlanta.
of
Sulzer-Azaroff, B. (1978). Behavioral ecology and accident prevention. Journal of Organizational Behavior Management, £, 11-44.
Sulzer-Azaroff, B. (1981). Issues and trends in behavior; Modification in the classroom. In Bijou, S., & Aviz, R_ (Eds.), Behavior modification; Contribution to education. 63-93. Hillsdale, New Jersey.
Sulzer-Azaroff, B. (1985). A behaviorist*s response to the report of the National Commission on Excellence in Education. The Behavior Analyst, 4, 29-38.
Sulzer-Azaroff, B. (1986). Behavior analysis and education: Crowning achievements and crying needs. The Recorder, 55-65
Sulzer-Azaroff, B. (1987). Accepting the challenge: A behavioral perspective on improving educational performance Invited Address: American Psychological Association, New York
Sulzer-Azaroff, B., & de Santamaria, M. C. (1980). Industrial safety hazard reduction through performance feedback. Journal of Applied Behavior Analysis, 13, 287-295.
Sulzer-Azaroff, B., Drabman, R. S., Greer, R. D., Hall, R. V., Iwata, B. A., & O'Leary, S. G. (Eds). ( 1988). Behavior analysis in educations968-19.82 from the Journal of Applied Behavior Analysis.
Sulzer-Azaroff, B., & Mayer, G. R. (1977). Applying hPhavinr analysis procedures with children and youth. New York: Holt, Rinehart and Winston.
160

Sulzer-Azaroff, B., & Mayer, G. R. (1986). Achieving educational .excellence using behavioral strategies. New York: Holt, Rinehart and Winston.
Sweeney, J. (1982). Research synthesys on effective school leadership. Educational Leadership, 35, 5.
Vaill, P. B. (1981). The purposing of high performing system. Paper presented at a conference, University of Illinois.
Venezky, R., & Winfield, L. (1980). Schools that succeed bevond expectations in teaching reading. Newark, DE: University of Delaware Studies in Education.
Wilczensky, F. L., Sulzer-Azaroff, B., Feldman, R. S., & Fajardo, D. E. (1987). Feedback to teachers on student engagement as a consultation tool. Professional School Psychologist. 2(H1, 261-272.
Wolcutt, H. F. (1983). The man in the principal's office: An ethnography. New York: Holt, Rinehart and Wilson.
Zaleznick, A. (1977) Managers and leaders: Are they different? Harvard Business review. 55, 3-11.
161

Related Documents


