Improving the Outbound Logistics Process at KLM Engineering & Maintenance An algorithmic approach to improve the process in terms of personnel’s capacity Stefania Porozantzidou Delft, 2015 Master Thesis Stefania Porozantzidou

Welcome message from author
This document is posted to help you gain knowledge. Please leave a comment to let me know what you think about it! Share it to your friends and learn new things together.
Transcript

Improving the Outbound Logistics Process at
KLM Engineering & Maintenance
An algorithmic approach to improve the process in terms of
personnel’s capacity
Stefania Porozantzidou
Delft, 2015 Master Thesis Stefania Porozantzidou

Preface
2

Preface
i
Improving the Outbound Logistics Process
at KLM Engineering & Maintenance
by
S.Porozantzidou
to obtain the degree of Master of Science at Delft University of Technology,
to be defended publicly on Monday November 9, 2015 at 10:00 AM.
Information
Author Stefania Porozantizdou
Student Number 4313828
Email [email protected]
Project Duration February, 2015 - September, 2015
Academic Information
University Delft University of Technology
Faculty Faculty of Technology, Policy and Management
Master Program MSc Management of Technology
Specialization Supply Chain Management
Graduation Committee
Chairman Prof.dr.ir. Marijn Janssen (Information & Communication Technology and Governance)
1st Supervisor TUDelft Ir. Marcel W. Ludema (Transport Policy and Logistics Organization)
2nd Supervisor TUDelft Dr.ir. Zofia Lukszo (Energy and Industry)
External Supervisor Bastiaan Kroes (Leans Six Sigma Blackbelt KLM Engineering Maintenance, CS Logistics)
An electronic version of this thesis is available at http://repository.tudelft.nl/.

Preface
ii

Preface
iii
Preface With this report of my graduate project at the Logistcs Center of KLM Engineering &
Maintenance, I complete my Master of Science degree in Management of Technology at Delft
University of Technology in the faculty of Technology, Policy and Management.
The research regards to an algorithmic approach towards the improvement of the outbound
Logistics process within the Logistics Center of KLM Engineering & Mainentance. After the
suggested algorithm's development its application requires an extensive analysis to collect
realible and representative data to simulate the process, run and test several scheduling
scenarios.
The project could not be able to be completed without the supervision and support of sevaral
pleople to whom I would like to express my graditude.
Firstly many thanks go to my supervisor at KLM Engineering & Maintenance mr B.Kroes, who
gave me the opportunity to graduate from this great company. Futher, his guidance and
support concerning my project was of high importance for its success.
During the period of my intership in the company many people within KLM Engineering &
Maintenance assisted me, by gladly providing their knowlegde and sharing their experience. I
am particularly very grateful of mr M.Wennekes' contribution to my final result. I would also
like to express my regards to all the employees of the Logisitcs Center without whose
cooperation and kidness I could not proceed with the project's excecution.
Many thanks go to my supervisors at TUDelft: mr M.Ludema, mr M.Janssen and mrs Z.Lukszo
for their time, assistance as well as their important advice and feedback they gave me in
order to continue with the research in a scientificaly and academically valid way.
Finaly, I can not forget to thank my beloved family, old friends from Greece, as well as new
friends that I met during my studies in the Netherlands. The love, courage and support no
matter the encountered problems and concerns were pricesless weapons in my experience
towards becoming a Master of Science.

Preface
iv

Summary
v
Summary Abstract
Within this report, a process improvement framework is developed and applied in the case of
the outbound Logistics process at KLM Engineering & Maintenance. The methodology
proposed for the improvement of the process includes a synergy of three different, but
related theories: Lean, Six Sigma and Engineering Design. The integration of their critical
steps are followed in order to develop improvement recommendations. These are to define
the current state and the existing point, measure the process performance in terms of the
predefined performance metrics making use of reliable data, develop and analyze
improvement techniques. In the context of the analysis phase and due to certain limitations,
a specific work scope has been chosen and an algorithmic approach has been applied in
order to develop personnel's scheduling scenarios, test and evaluate them in terms of
Turnaround Time, Quality and Cost. Next the improvement step includes the proposal of
feasible solutions based on the analysis performed. Finally, the control phase helps the
continuous improvement of the outbound Logistics through performance management tools.
Situation
The outbound Logistics process concerns the activities of receiving the unserviceable
components at the Logistics center, performing an administrative inspection and delivering
the components to the repair vendors, who are accountable for their test, repair and
overhaul. The operation of the Logistics center, including the outbound Logistics has the form
of a job shop, where jobs (tasks) consist of a number of operations that need to be
performed on different machines (or in this case different type of employees). In the current
state the Logistics process' quality is not possible to be clearly defined and in the meanwhile
the Logistics center is unable to meet the time requirements of the components' deliveries to
the repair vendors, therefore, poor performance has been recorded and inefficient process
steps have been suspected.
Problem
The main objective of the project is "to control the incoming goods within the Logistics center
and provide their right delivery to the customers". This objective can be achieved by creating
the following sub objectives: to analyze the current performance of the outbound Logistics,
define the problem and improve it by suggesting a set of solutions. In order to complete
objectives mentioned, the following main research question has to be answered.
"How to improve the outbound Logistics process within the Logistics Center at
KLM Engineering & Maintenance in terms of Quality, Turnaround Time and Cost?”
Several sub questions have been formed in order to facilitate the project's execution and give
an answer to the main research question stated above. The questions presented below have
been created in such way that the actions taken to answer them follow the academic
approach's steps.
RQ1: What is the current outbound Logistics process within the Logistics Center at KLM
Engineering & Maintenance?
RQ2: What can we learn from literature regarding to the improvement of Logistics processes?
Summary
vi
RQ3: What are the selected KPIs and data to measure the performance of the outbound
Logistics process?
RQ4: What is the performance of outbound Logistics process?
RQ5: What are the suggested solution areas for the future outbound Logistics process within
the Logistic center at KLM Engineering & Maintenance?
RQ6: How can the outbound Logistics process within the Logistics center at KLM Engineering
& Maintenance be simulated and tested in respect with its manpower performance?
RQ7: How can the improvement strategies be implemented?
Approach
After having introduced the main problem, for the purposes of the research a specific
methodology has been followed. Literature review has helped decide which tools and
techniques have been applied successfully in similar past projects. The framework developed
for this research is compromised by a combination of three useful methodologies. Lean, Six
Sigma and an Engineering Design have been integrated and have formed a unique academic
framework. The benefits from this synergy have been to create a flexible and adjustable
approach, while achieving unprecedented improvements and facilitating the organizational
communication.
Define
The first step of the approach has been to make the detailed description of the company and
the process' current state. KLM Royal Dutch Airlines is the oldest operating airline in the
Netherlands and includes three core businesses: Passenger Transportation, Cargo Division
and Engineering & Maintenance. The project is conducted for the later unit of KLM, whose
main business is to provide Maintenance, Repair and Overhaul services to its internal or
external costumers. KLM Engineering & Maintenance is divided in three departments: the
Aircraft Maintenance, Engine Services and Component Services. The Logistics center of KLM
Engineering & Maintenance belongs to the Component Services' division.
The overall operation of the Logistics center is decomposed into five units: the expedition, the
customs, outbound and inbound Logistics and the warehouse. During Aircrafts' maintenance,
several components that need to be tested, repaired or overhauled are extracted from it and
sent to KLM Engineering & Maintenance Logistics center that is accountable for delivering the
components to the contracted repair vendors, either internal or external (Outbound
Logistics). After being processed by the repair vendors the components are once again sent
to the Logistics Center where are stored or (in certain cases) delivered directly back to the
aircraft (Inbound Logistics). In the meanwhile, the appropriate components from the
warehouse are selected to replace the ones extracted from them. Separate type of employees
are assigned to performed the customs formalities.
As the focus of this project has been in the outbound Logistics, the tasks performed in this
process has been presented and defined in order to identify the bottlenecks that undermine
the process' performance. The main tasks of the outbound Logistics start from the moment
that the unserviceable components have been separated from the expedition personnel,
passed (if needed) though import and have been placed in an area in the Logistics center,
where a buffer is created. The physical inspector, the first type of employees, picks one
Summary
vii
components at a time from this buffer. His/her task includes checking the data and
information in the forms that are sent with the component and on the physical component
itself. The output of the physical inspector's task is one single document including verified
information and data related to each component that facilitates the creation of the repair
order. There are cases in which there are either missing, wrong or indistinguishable
information, or components that are not supposed to follow the outbound Logistics. In these
case the components are placed to a special buffer for extended inspection. Another buffer
exists in the Logistics center, where physical inspectors place the components that have
completed. The repair administrator is the next type of employees, whose assignment is to
create a repair order for each component that is located in the second buffer. After picking
the component in first in first out priority. The repair administration includes configurations in
the systems and cross checking data and information so as the correct repair order is
created. After completing this task the repair administrator dispatches the component to a
place where expedition personnel and export deal with final task before the components
leave the Logistics center and are transported to their respective repair vendors.
Value stream mapping sessions and focus groups in combination with personal observations
of the process, have resulted to identifying several problematic areas in the process flow. The
main problem of the outbound Logistics is the inefficient process that undermines the overall
performance of the Logistics center in terms of quality, turnaround time and cost. Searching
in theory and investigating in the real field, the root causes of this problem have been listed
and summarized in a fishbone diagram. The causes are included in six categories: Method,
Material, Man, Machine, Environment and Suppliers/Customers. For each of these categories,
features have been attached which might negatively influence the overall process'
performance.
In order to make the outbound Logistics performance measurable, performance metrics have
been defined, known as Key Performance Indicators (KPIs). The most critical KPIs recognized
in the outbound Logistics describe the turnaround time requirements in terms of the critical
buffer in the end of the day and the total operating cost of the outbound Logistics process.
Turnaround time regards to the maximum time of the component's flow in the outbound,
from the moment that is received in the expedition to the time that is ready for delivery to
the repair vendors. 48 hours is the Turnaround Time based on the agreements with the
company's contracted customers. For the purposes of the project quality has been separated
in internal (process quality) and external (components quality). Poor process quality refers to
the features that create waste in the process and undermine its performance. Unnecessary
transportation and movement, long waiting times and over processing due to components
defects are some of the recognized wastes in the process. Further, components quality can
be described by the condition of the components that are delivered in the Logistics center.
Missing, wrong data and/or other issues that might influence the normal process flow of the
outbound Logistics can be considered as components quality factors. The lack of employees
personal development and motivation have been aspects that can be considered as waste
influencing the process' performance. For the purposes of this project, quality has been
quantified in terms of waste within the process and measured as the number of components
situated in the critical buffer, that is the temporary storage, between the tasks. More than 25
components for four subsequent shifts, mean that the buffer has reached its limit and the
employees are unable to handle to components and deliver them to the repair vendors on
time. Therefore, waste, or poor quality has been identified. The KPI concerning to the cost is
the result of the previously mentioned factors, Turnaround Time and Quality. In more details
Summary
viii
delays in turnaround time and poor quality either internal or external can possibly result to
excessive costs.
Measure
The next step after having defined the elements included in the outbound Logistics is to
measure its performance and present the results, so as to develop improvement solutions.
Performance measurement requires the collection of reliable and consistent data. A data
collection plan has been applied. Information about the components location and date has
been retrieved from tracking system and summarized to create several graphs of the
component's turnaround times. Moreover, personal measurements have been conducted
while joining shifts with the employees and following the components' flow. The later task
has given information regarding to the components' quality (external quality) and their impact
on the final turnaround time. The measurements justified the poor performance of the
outbound Logistics process. Therefore problematic areas, including late deliveries and several
quality issues that delay the employees' task, have been notice.
Analyze
The analysis follows the performance measurement. According to the theory and literature on
past projects in Lean Six Sigma have helped develop a set of solutions that would solve the
root causes of the problematic areas in the outbound Logistics.
The solutions propose tasks that need to be performed in order to elaborate on the data
requirements for completing a repair order and thus, having a component ready for delivery
and set up strict rules and a standardized way of working. Having the previously mentioned
in place, the contract details and agreements with the customers can be revised, so as every
component can only be sent and accepted in the Logistics center with the important
information and correct condition.
Communication among the employees, supervisors and managers in a daily basis is very
essential for the personnel's assistance in their tasks, motivation to work, involvement in the
process and accountability for the result. Frequent communication can enhance the process
quality and therefore influence the turnaround time.
Forecasting the daily incoming workload of unserviceable components in the Logistics center
is a task that has to be performed in order to evaluate the personnel's capability and make
sure that every day enough personnel to handle the deliveries is working. Taken into
consideration historical data and the company's potential in future growth have helped
analyze the yearly, monthly, daily and hourly workload. Personnel's scheduling is an aspect
that needs to be further investigated and analyzed.
A future state design of the outbound Logistics has proposed the combination of the tasks
performed in the process. In other words only one type of employees should perform the
physical inspection and directly after the repair administration. In that way the in between
buffer ( buffer 2) has been immediately removed. Further research has been performed so as
to check the personnel's capability to handled the forecasted workload in the future state.
A final step for the improvement of the outbound Logistics is the introduction of performance
management techniques. The existing tracking system and future RFID system can be
employed to retrieve information about the process' workflow and create reliable
performance reports any time needed. Performance management techniques can

Summary
ix
automatically identify possible bottlenecks within the process and on time corrective action
can guarantee continuous improvement of the outbound Logistics.
Another solution for providing more efficient Logistics services that perform better in terms of
quality, Turnaround Time and cost recommends outsourcing the business of the Logistics
center. Extend cost benefit analysis and investigation need to be conducted so as to decide
whether or not the solution proposed can benefit the overall company.
Due to certain limitations and/or lack of authorization and time constraints the solutions and
their execution plans have only been proposed but not applied in the actual working field.
Nevertheless, extreme focus has been given to the personnel's scheduling. Insufficient or
excessive number of employees in some cases have either caused big delays, or expensive
unused personnel. Scheduling has to be programmed according to the process needs, the
expected incoming workload, the available time to complete the task and operational daily
cost.
Literature has shown that simulation is a suitable tool to visualize the process. In terms of
simulation an algorithmic approach has been followed to create a calculation model in which
several scheduling scenarios have been first tested and then evaluated and compared to give
to the one that scored the best results. The algorithm developed for this project, in its
general form can be used in any supply chain system that is modeled in a job shop model.
Data regarding to the physical inspectors' and repair administrators' handling times, the
number of components delivered in the outbound Logistics in every shift have been retrieved
from the data analysis and used in the calculation. Scheduling scenarios included different
combinations and number of employees in every shift, skipping in some cases the most
expensive shift (evening and weekends).
All the figures and scenarios presented above have been applied in the calculation model for
the two version of the outbound Logistics (current and future state, as presented previously).
The deliverable of the calculation model has been the number of uncompleted components
in the critical buffer and the operational cost of the personnel employed in every shift.
Analysis of this figure implies the percentage of on time deliveries to the repair vendors of the
existing daily workload by the number of employees suggested in every tested scenario.
Improve
The results have shown that for short term implementation in the current state of the
Logistics center weekend shifts can be removed from the weekly schedule. This change has
not influenced the components' on time delivery whilst providing an economic solution.
Moreover, in long term the second version of the outbound Logistics proposed in this project
present comparative better results. Only for this case full time and weekend shifts have been
included so as to provide on time deliveries any time and minimizing the cost for the
company.
Recommendation
In the end of the report several recommendations have been presented. The complete set of
solutions has been the result of brainstorming sessions for which cooperation of multiple
people was required. The solutions proposed for this project include action plans for further
research and future projects. A list of data requirements for a component ready for delivery,
based on which the standard way of working can be defined, has been one of the initiatives

Summary
x
of the project. Moreover, a future project would recommend the redefinition of strict contract
details, including the data requirements from the Logistics center to its customers, that has
been researched in the previous steps. Communication would play a very critical role in the
process efficiency. Good communication among employees, supervisors and managers can
contribute to the employees’ involvement and motivation to be a part of a healthy and social
working environment. Moreover, regular meetings and trainings regarding to changes in the
process are suggested as they would add significant value for people. Clear definition of the
expected workload has been investigated and used for the personnel’s new scheduling
proposal. Having completed the research for the previous action plans, the future state
design of the outbound Logistics has been introduced and finally performance management
techniques have been proposed aiming to the process’ control and continuous improvement.
Another different proposal for the Logistics center has been the outsourcing the Logistics’ of
KLM Engineering & Maintenance. Extended research should be performed to evaluate the
costs and benefits out of this action.
Due to certain limitations and constrains, the implementation of the complete set of solutions
could not be realized in the context of this project. Nevertheless, according to the chosen
scope, the best personnel's scenarios have been suggested. Finally, further research and cost
benefit analysis must be made for other alternatives aiming to the process' improvement,
such as outsourcing the entire Logistics process.
Contribution
The research has an added value for the company, literature and society. First, the success of
the project and its result are very important once implemented in the real field. Based on the
outcomes stated in this report, the outbound process can be improved. Furthermore, the
methodology proposed for this project can be followed for similar processes within the
Logistics center (Inbound Logistics) and for the entire supply chain as well. Besides the
methodology that combines Lean, Six Sigma and Engineering Design, the algorithm's
development has been the main scientific creation for the company. The theory and
knowledge which lies behind its function is transmitted to the company's supervisor and the
company's specialists, who can share and spread it to other departments of KLM Engineering
& Maintenance. Significant has also been the contribution of the project in literature. The
proposed methodology and its exact application in a process similar to the outbound Logistics
has been a novelty. Moreover, the framework developed for the creation of the algorithm and
calculation model can be used in other projects and further researches.

<Table of Contents
xi
Table of Contents Preface ..................................................................................................................................... iii
Summary ................................................................................................................................. v
Table of Contents ................................................................................................................. xi
List of Figures ..................................................................................................................... xiii
List of Tables ....................................................................................................................... xiv
1. Introduction ...................................................................................................................... 1
1.1 Introduction to KLM Engineering & Maintenance ........................................ 1
1.2 Problem Description: Waste within the Logistics Process .......................... 3
1.3 Research Questions ................................................................................................. 6
1.4 Research Methodology ............................................................................................ 9
1.5 Deliverables .............................................................................................................. 16
1.6 Scientific Contribution ......................................................................................... 16
1.7 Research Outline .................................................................................................... 17
2. Outbound Logistics Process Overview ................................................................... 19
2.1 Background of KLM ............................................................................................... 19
2.2 Terminology for the Logistics Center ............................................................... 20
2.3 Current State of the Outbound Logistics Process ....................................... 23
2.4 Conclusion ............................................................................................................... 32
3. Literature Review .......................................................................................................... 33
3.1 Job Shop Model ...................................................................................................... 33
3.2 Performance Metrics and Key Performance Indicators .............................. 34
3.3 Lean Six Sigma ....................................................................................................... 35
3.4 Algorithmic Approach for Personnel Scheduling ......................................... 37
3.5 Simulation ................................................................................................................ 37
3.6 Conclusion ............................................................................................................... 38
4. Data Analysis of the Current Outbound Logistics Process ............................. 41
4.1. Key Performance Indicators Definition and Methodology ........................ 41
4.2 Tracing by IT Systems .......................................................................................... 44
4.3 Data Analysis Results of the Current Outbound Logistics Process ...... 44
4.4 Conclusion ............................................................................................................... 51
5. Findings and Set of Solutions for the Improvement of the Outbound
Logistics Process ................................................................................................................ 53

<Table of Contents
xii
5.1 Solutions Overview ................................................................................................ 53
5.3 Project's Scope and Limitations ........................................................................ 61
5.4 Conclusion ............................................................................................................... 61
6. Algorithm's Development for the Improvement of the Outbound Logistics63
6.1 Algorithm's Development ..................................................................................... 63
6.2 Algorithm's Implementation ............................................................................... 67
6.3 Conclusion ............................................................................................................... 74
7. Conclusions and Recommendations ...................................................................... 77
7.1 Conclusion ............................................................................................................... 77
7.2 Thesis Reflections .................................................................................................. 80
7.3 Recommendation for Further Research Projects ......................................... 81
Reference .............................................................................................................................. 83
Appendix ............................................................................................................................... 87
Appendix A List of Customers ................................................................................... 87
Appendix B Sidestep Processes ................................................................................ 88
Appendix C Outbound Logistics Areas ................................................................... 89
Appendix D Interviews, Observations and Internal Sessions ......................... 91
Appendix E Scanning Points ...................................................................................... 92
Appendix F Data Measurements .............................................................................. 94
Appendix G Ready for Outsource List .................................................................... 94
Appendix I Formal Statement of the Algorithm ................................................... 96
Appendix J Data Creation .......................................................................................... 99
Appendix K Simulation Results .............................................................................. 100

List of Figures
xiii
List of Figures Figure 1: KLM Engineering & Maintenance Supply Chain ......................................................... 2
Figure 2: Fishbone Diagram - Cause and Effect ......................................................................... 4
Figure 3: Research Design and Methodology .......................................................................... 10
Figure 4: Lean circle (Hines, 2000) .......................................................................................... 11
Figure 5: Six Sigma DMAIC Steps (Navona, 2012) ................................................................... 11
Figure 6: Engineering Design Process Steps (Dym, 2005) ....................................................... 12
Figure 7: Framework– Integration of Lean, Six Sigma and Engineering Design ...................... 13
Figure 8: Research Approach ................................................................................................... 14
Figure 9: Simulation's Design (Law, 2003) ............................................................................... 16
Figure 10: Outbound Logistics Process .................................................................................... 24
Figure 11: Provide Outbound Logistics .................................................................................... 25
Figure 12: Receive Incoming Goods ........................................................................................ 26
Figure 13: Physical Inspection ................................................................................................. 27
Figure 14: Administrative Inspection ...................................................................................... 28
Figure 15: Main Process Steps ................................................................................................. 29
Figure 16: Current State Design Lay out and Scanning Points ................................................ 30
Figure 17: Rough Touch Times' Estimation ............................................................................. 42
Figure 18: Outbound Logistics Measurement Points TAT ....................................................... 43
Figure 19: Occurred Issues in the Outbound Logistics (N=467 components) ......................... 45
Figure 20: Time Series Plot of Physical Inspector's Waiting Time (Buffer 1) ........................... 46
Figure 21: Time Series Plot of Physical Inspector's Touch Time .............................................. 46
Figure 22: Time Series Plot of Repair Administrator's Waiting Time (Buffer 2) ...................... 47
Figure 23: Time Series Plot of Repair Administrator's Touch Time plus Buffer 3 ................... 47
Figure 24: Time Series Plot of Critical Buffer Level ................................................................. 49
Figure 25: Pire Chart of the Defects' Impact on Mean Touch Time ........................................ 51
Figure 26: Project's Initiatives and Set of Solutions ................................................................ 53
Figure 27: Set of Solutions Workflow ...................................................................................... 54
Figure 28: Aeroxchange Format .............................................................................................. 56
Figure 29: Monthly Deliveries in the Outbound Logistics ...................................................... 57
Figure 30: Weekly Deliveries in the Outbound Logistics ......................................................... 57
Figure 31: Hourly Deliveries in the Outbound Logistics .......................................................... 58
Figure 32: Future Process Steps .............................................................................................. 59
Figure 33: Future State Design Lay out and Scanning Points .................................................. 60
Figure 34: Algorithm's Flowchart ............................................................................................ 66
Figure 35: Scoping Sidestep ..................................................................................................... 89
Figure 36: Troubleshooting Sidestep ....................................................................................... 89
Figure 37: Photo of Components at Buffer 1 .......................................................................... 90
Figure 38: Physical Inspector's Working Place ........................................................................ 90
Figure 39: Components at Buffer 2 ......................................................................................... 91
Figure 40: Example of Scanning Point ..................................................................................... 93
Figure 41: Critical Buffer Level Scenario 1.1 .......................................................................... 100
Figure 42: Critical Buffer Level Scenario 1.2 .......................................................................... 100

List of Tables
xiv
Figure 43: Critical Buffer Level Scenario 1.3 .......................................................................... 101
Figure 44: Critical Buffer Level Scenario 1.4 .......................................................................... 101
Figure 45: Critical Buffer Level Scenario 1.5 .......................................................................... 102
Figure 46: Critical Buffer Level Scenario 1.6 .......................................................................... 102
Figure 47: Critical Buffer Level Scenario 2.1 .......................................................................... 103
Figure 48: Critical Buffer Level Scenario 2.2 .......................................................................... 103
Figure 49: Critical Buffer Level Scenario 2.3 .......................................................................... 104
Figure 50: Critical Buffer Level Scenario 2.4 .......................................................................... 104
List of Tables Table 1: Literature Review ....................................................................................................... 38
Table 2: Summary Statistics of Expedition .............................................................................. 46
Table 3: Summary Statistics of Buffer 1 .................................................................................. 46
Table 4: Summary Statistics of Physical Inspector .................................................................. 47
Table 5: Summary Statistics of Buffer 2 .................................................................................. 47
Table 6: Summary Statistics of Repair Administrator.............................................................. 47
Table 7: Defects' Impact on Physical Inspector's Touch Time ................................................. 49
Table 8: Defects' Impact on Repair Administrator's Touch Time ............................................ 50
Table 9: Scenarios Version 1 .................................................................................................... 68
Table 10: Scenario 1.1 Full Time Shifts .................................................................................... 69
Table 11: Scenario 1.2 Day Shifts ............................................................................................ 69
Table 12: Scenario 1.3 Weekdays Shifts .................................................................................. 70
Table 13: Scenario 1.4 Day and Weekday Shifts ..................................................................... 70
Table 14: Physical Inspector-Day Shifts, Repair Administrator-Full Time ............................... 70
Table 15: Physical Inspector-Weekday Shifts, Repair Administrator-Full Time ...................... 70
Table 16: Scenarios Version 2 .................................................................................................. 71
Table 17: Scenario 2.1 Full Time Shifts .................................................................................... 71
Table 18: Scenario 2.2 Day Shifts ............................................................................................ 71
Table 19: Scenario 2.3 Weekdays Shifts .................................................................................. 72
Table 20: Scenario 2.4 Weekdays Day Shifts ........................................................................... 72
Table 21: Simulation's Results ................................................................................................. 73
Table 22: Best Scenarios .......................................................................................................... 75
Table 23: List of KLM Engineering & Maintenance Customers ............................................... 87
Table 24: Existing Scanning Points .......................................................................................... 92
Table 25: Future State Scanning Points ................................................................................... 93
Table 26: Measurements Checklist for Physical Inspectors .................................................... 94
Table 27: Measurement's Checklist for Repair Administrators ............................................... 94
Table 28: Ready for Outsource Pool VC .................................................................................. 95
Table 29: Ready for Outsource FE ........................................................................................... 95
Table 32: Type of Components and Percentages of Occurrence ............................................ 99
Table 33: Physical Inspector's Touch Times per Type of Component & Capacity ................... 99
Table 34: Repair Administrator's Touch Times per Type of Component & Capacity .............. 99

1. Introduction
1
1. Introduction
1.1 Introduction to KLM Engineering & Maintenance
KLM Royal Dutch Airlines, the oldest operating airline in the Netherlands, was founded in
1919 and since then is a very important worldwide employee in aviation. KLM is a part of AIR
France - KLM group since 2004 and owns KLM Cityhopper (KLM, n.d.), Transavia.com and
Martinair.
KLM Engineering & Maintenance (E&M) is one of the core units of AIR France - KLM group,
besides KLM Passengers and KLM Cargo. KLM Engineering & Maintenance can be considered
a separate company interrelated with KLM Royal Dutch Airlines. The main business of KLM
Engineering & Maintenance is to provide Maintenance Repair and Overhaul (MRO) services
that guarantee air safety, managing aircraft operation management, and cost minimization.
The company's objective is to become the world largest provider of MRO services for
aircrafts. Within KLM Engineering & Maintenance there are several operating departments
that are responsible for the implementation of their skills for serving the company's goals and
its customers' needs. There is a united organization responsible for strategy, marketing,
business development, sales force and external communication.
The research was conducted within the Logistics department of KLM Engineering &
Maintenance, which is accountable for handling the aircrafts components and is the only
entrance and exit of components at KLM Engineering & Maintenance, more specifically the
Logistics center provides:
import and export custom formalities
warehouse for the serviceable aircraft components
administration of repaired deliveries (Inbound Logistics)
administration of repair orders (Outbound Logistics)
The figure below (Figure 1) shows the components’ flow through the Logistics center. As it is
shown, the main operation of the Logistics center is divided into two streams that flow in
parallel. The two flows are distinguished according to the type of components that enter the
Logistics center: serviceable and unserviceable. Unserviceable components are supplied to
the Logistics center from internal (KLM) or external customers (other airlines e.g. Jet, Virgin
etc). This type of components regards to those that are in need to be tested, repaired,
overhauled or in other words are unserviceable (“dirty”) and inappropriate to fly with the
aircraft. The reason of removal and the complaint of the components operation are identified
by the aircrafts engineers during the regular or not checks, so the component arrives always
with a repair description in the Logistics center. The Logistics center is accountable for their
right administration (outbound) and their right delivery to the repair vendors. Meanwhile
serviceable components arrive at the Logistics center and follow the inbound process.
Serviceable components are the ones that return to the Logistics center form the repair
station as serviceable (“clean”), that means well-functioning. Right administration is
completed by the employees so that the component can be formally and securely stored in
the Logistics Central Warehouse. As these processes flow, the Logistics center is once more

1. Introduction
2
responsible for supplying their customers with serviceable components from their stock as
requested.
Figure 1: KLM Engineering & Maintenance Supply Chain
The scope of the research has been on the outbound Logistics that includes the activities for
handling the outbound flow at the Logistics center, such as receiving, inspecting,
administrating and dispatching components to the repair vendors. The outbound flow consists
of all the packages that arrive from other KLM units or external parties, after the regular or
not checks of aircrafts that require test, repair or overhaul. As it has been mentioned the
outbound Logistics is accountable for the right delivery of the unserviceable components to
the repair vendor (Figure 1). Right delivery includes several factors, such as safe
transportation, undamaged component, right paperwork included, right destination and right
time so that it can meet the contract requirements.
In the context of a project that has been launched within different departments of KLM
Engineering & Maintenance at December 2014, a question had been raised regarding to the
overall performance of MRO services of KLM Engineering & Maintenance. Attention has been
given to the Logistics center, as several defects were identified that resulted to inefficient
Logistics processes. Thus the objective has been: "To control the incoming goods within the
Logistics center and provide their right delivery to the customers". Therefore the aim of this

1. Introduction
3
research is to recommend to KLM Engineering & Maintenance an improvement strategy for
the Logistics process with a major focus on the outbound Logistics.
1.2 Problem Description: Waste within the Logistics Process
The managers of KLM Engineering & Maintenance Logistics center evaluated the current
Logistics process within the Logistics center as inefficient. The main cause of the inefficiency
in the process lies to the fact that little is known about the performance of the outbound
Logistics sub processes. The lack of standardizations makes the process execution and every
decision making related to that, difficult to perform and impossible to give correct results.
Therefore, in this research three main abnormalities have been identified that can also be
considered as the most important performance indicators. Quality, Turnaround Time (TAT)
and Cost are the variables that need to be taken into consideration when referring to process
performance and in the current state are underperforming in the Logistics center at KLM
E&M. Results from analysis and observations have shown that the existing state in the
Logistics center presents several inefficiencies in the overall process, which have been
elaborated in the following chapters. According to Lean theory, the first and most important
step is to recognize the problem while observing and being a part of the process (Hines,
2000), (Six, 2015).
The identified defects can be seen in the fishbone diagram below (Figure 2). For the
construction of the diagram, several observations and informal interviews with employees,
supervisors and managers have been conducted. The root causes belong to the following
fields; four of them concern the 4 M’s (Method, Material, Machine, and Man) and the rest
present problematic areas in the internal environment and external factors which the
customer or the supplier. The root causes that result in failing to meet the company’s TAT,
Quality and Cost requirements, can be separately analyzed, processed and improved
(Hackman et al., 1995), (Ishikawa, 1976). Several causes have been identified. The data
analysis performed in Chapter 4 has shown the most critical focus areas that can be
recognized out of this diagram below.

1. Introduction
4
Figure 2: Fishbone Diagram - Cause and Effect
In order to proceed into further research and to provide a better definition of the existing
problem in the Logistics center, detailed definitions of what Quality, Turnaround Time and
Cost stand for the outbound Logistics in KLM Engineering & Maintenance have been provided.
Quality Def inition
Quality is a very broad concept in theory and in business as well. However, its definition
though has been narrowed to the KLM’s needs when it comes to examining the root causes
of its underperformance and suggest improvement strategies. Quality mostly concerns to the
process' quality, which has a great impact on the overall performance. Bad quality according
to Lean theory can be described as waste that needs to be removed from the process. The
following list presents what is the waste in the outbound processes in the Logistics center
(Karlsson et al., 1996), (Hines et al., 2000), (Six, 2015), (Kroes, 2015).
Transportation: Internal transportation
Movement: Walking, search
Waiting: Waiting for answers, decision etc.
Defects: Component processed multiple times
Personal Development: Employees knowledge, training and motivation
Buffers: Temporary storages
However, little is known about the performance of the outbound process in real figures. One
of the outcomes of the research is to come up with certain performance measurements for
the quality of the outbound Logistics processes.
All the previously mentioned definitions of waste have been found in the outbound Logistics.
Nevertheless, their quantification has been a difficult task to perform, due to time constrains

1. Introduction
5
or inability to measure. For example, internal transportation and movement are not the most
significant quality factors, but they have been proven to be inefficient, such less meters
and/or time spent in dispatching the component could have been saved if the infrastructure
were differently designed. Waste regarding to waiting for answers and decisions and defects
that require one component to be processed multiple times, can be explained by the
components' condition and their correct papers when delivered in the Logistics center. After
extended research and measurements it came as a result that there have been cases when
defected components with missing data, incomplete information, wrong packaging etc., have
had great impact on the process' quality, causing long waiting times for decision, over
processing and failed FIFO (First In First Out) prioritization. Personnel's development is
another factor that could not be quantified to measure its influence on the process' quality.
However, research has shown that employees' insufficient training, knowledge, lack of
involvement and motivation to work can have a negative effect on the process overall
performance.
Critical Buffer
One form of waste that has been clearly defined, quantified and used for the performance
measurement has been the critical buffer. The buffers are temporary storages, where the
components are placed after one task is completed and before the next one starts. The
critical buffer regards to the second buffer in sequence, which is created after the physical
inspector's task. It can be measured by the number of uncompleted components by the
repair administrators at the end of their shift. Extended research has been conducted in order
to define the exact critical buffer's level based on the average workload, the personnel's
capability and the turnaround time requirements defined in the contracts.
Turnaround Time Def inition
Turnaround time (TAT) is the total amount of time needed to complete a task (Silberschatz
et. al, 2008). In more details, the maximum time of the component's flow in the outbound,
from the moment that is received in the expedition to the time that is ready for delivery to
the repair vendors, is the turnaround time that is required for a component. The turnaround
time is a predefined number of 48 hours stated in the agreements with every contracted
costumer of KLM Engineering & Maintenance. However, the Logistics center fails to achieve
the predefined turnaround time stated in the contracts, in many cases, causing many
variations in the completion time. The improved process included suggestions contributing to
meeting and stabilizing the completion time of the entire outbound process, assuring that
every component’s delivery meets the time constraints (Six, 2015).
Cost Def inition
For this research the cost has been considered to be the result of the two previously
mentioned factors, quality and turnaround time. In order to check the performance results
and translate it into cost; the main interest of managers and the higher levels in hierarchy of
the company, in the research cost attributes have been attached in the KPIs definition as
well. The operational cost from the personnel's employment has been taken into
consideration, scored among several improvement alternatives and used as a determining
factor for the best possible scenario’s selection. Another aspect of the cost definition in the
project refers to the cost saving that is related and connected to the improvement of quality
and turnaround time through the process’ redesign. In other words, the attempt of improving

1. Introduction
6
the Logistics processes in terms of quality and turnaround time will eventually lead to cost
minimization (Ruffa et al., 2000).
1.3 Research Questions
The company’s initiative is "To control the incoming goods within the Logistics center and
provide their right delivery to the customers". For this research, knowledge and expertise in
the field should be obtained, that can be triggered by the main research question that is
mentioned below.
"How to improve the outbound Logistics process within the Logistics Center at
KLM Engineering & Maintenance in terms of Quality, Turnaround Time and Cost?”
A combination of methodologies is used for the purpose of the objective in question. At this
point there should be a clear distinction between the two basic cores of the work that has to
be done. Although the biggest part of the assignment is considered to be mainly a design
project, an extended research and analysis has been performed first in order to define the
critical KPIs. After having gathered the complete set of reliable data and proposed a set of
possible solutions, the design phase has taken place. The project's scope has been narrowed
down and shifted to analyze further and provide suggestions for one of the solutions. This
phase concerns the design of an algorithm that simulates the outbound Logistics process and
aims to test several alternatives and score their performance resulting to the best
improvement strategy and its proposal to the company.
The following questions have helped structure the research, define better and realize the
design objective. The methods that have been used in answering the questions have been
included in the description above them.
RQ1: What is the current outbound Logistics process within the Logistics Center at
KLM Engineering & Maintenance?
The process flow map that includes every critical task has been created in order to present
the current state in the outbound Logistics in the Logistics center. This has provided an
overview over the existing processes, the bottlenecks and defects that have resulted in poor
quality, variations in turnaround time and therefore, additional costs. In chapter 2 there has
been a detailed description of the current process, important elements and variables have
been explained as well helping the reader to get a good insight of the situation in question.
Observations, unstructured interviews and group sessions have been conducted to define and
present reliable information concerning to the current process.
RQ2: What can we learn from literature regarding to the improvement of Logistics
processes?
After getting a good insight of the current Logistics processes of KLM Engineering &
Maintenance and identifying what the main problem has been and its root causes, an
extended literature review has provided a better understanding and knowledge about tools
and methods that have been used for organizing processes similar to the outbound Logistics
within the Logistics center at KLM Engineering & Maintenance. The value and use of process
management in Logistics centers and the engineering redesign of Logistics processes have
been the keywords of this research that helped in the process improvement of the case in
question. Multiple theories had been found in literature for process improvement. Lean, Six
Sigma and Engineering Design have been integrated from the purposes of the research.
Study cases and other literature have helped come up with solutions towards improvement.

1. Introduction
7
Finally, features form the existing algorithmic approaches for the personnel's scheduling have
been used for the calculation model's development. Chapter 3 cites the literature that has
been used and the knowledge that has been obtained from scientific papers and academic
work for the construction of the project in question.
RQ3: What are the selected KPIs and data to measure the performance of the
outbound Logistics process?
One of the most critical tasks of the research has been the data collection. Attention had
been given in acquiring the right data for modeling the processes. Inside knowledge from
experts, observations and measurements have been performed to collect the useful data.
Joining shifts and taking detailed notes in every step led to the correct and reliable data's
acquisition. Data has been properly categorized and analyzed statistically in order to proceed
to further steps in the research. The collected data and their analysis have been further used
for the process’ simulation and testing. Due to the problem definition the performance
metrics based on which the process has to be improved, have also been the critical KPIs:
Quality, Turnaround Time, Cost.
RQ4: What is the performance of outbound Logistics process?
As it has been mentioned before, little was known about the performance of the outbound
Logistics process’ quality and the reason of huge variation in TAT. Therefore, the
performance of the outbound Logistics had to become measurable, by the definition of the
critical Key Performance Indicators (KPIs) related to these processes.
According to the fishbone diagram (Figure 2) the most critical factors that cause defects in
the process are the 4 M’s, the environment and the suppliers/customer, which have been
attached to the KPIs during their definition. In that way the overall existing performance
could measured and better results in Quality, Turnaround Time and Cost could be achieved
when steering one or more of these factors. Information that is available in different systems
has been used to define the critical KPIs, measure the overall performance of the outbound
Logistics and therefore improve the processes within the Logistics center. Chapter 4 is
dedicated to the data gathering and analysis for the process’ performance measurement.
RQ5: What are the suggested solution areas for the future Outbound Logistics
process within the Logistic Center at KLM Engineering & Maintenance?
Certain initiatives had been defined for the improvement of the outbound Logistics. The
initiatives have been categorized according to the 4 M’s that compromise the process' internal
factors of inefficiency and the external factors that are the environment and
suppliers/customers. The factors presented in the fishbone diagram (Figure 2) can be
adjusted according to the company’s requirements in respect to Quality, Turnaround Time
and Cost. For each initiative several people are accountable, whose communication and
interconnection is very essential to the success of the general goal. After research and
analysis the respective initiatives have been defined.
The first step of the design phase has been to identify solution areas and define actions
according to the initiatives, throughout the data analysis and brainstorming meetings. For
each of the discussed initiatives, a set of solutions has been suggested for the process'
improvement. Finally, a new process flow (Hines et al., 1998) has been created in order to
make a representation of the new design of the outbound processes in the Logistics center.
The research has obtained a design driven characteristic and for that purpose the

1. Introduction
8
recommended steps of the Engineering Design have been followed (Dym et al., 2013). For
every solution, the new design had to be tested and compared to the current state, so as to
give the best improvement alternative over the process.
Active contribution to the company’s internal meetings, which have be scheduled in order to
come to an agreement for the desired future state map had been given. The future state has
been derived from internal sessions and brainstorming among managers, Blackbelts and
employees within the Logistics center. Several meetings have taken place in order to make a
clear definition of the current state situation, define the defects and finally come up with
requirements for the future state based on the company's objectives. Gathering information
regarding the existing process by interviewing managers and employees in the Logistics
center, joining shifts with them and internal reports that are available in the intranet was one
of the most critical tasks of the research. Participation has played an important role in giving
the proposed method a scientific character. Chapter 5 presents the solution areas that have
been identified, throughout the previously mentioned process. Moreover, the existing
limitations and constrains have been explained, justifying the reason why the scope of the
project is narrowed down to one specific solution that concern the personnel's scheduling.
RQ6: How can the outbound Logistics process within the Logistics center at KLM
Engineering & Maintenance be simulated and tested in respect with its manpower
performance?
The outbound Logistics is too complex to analyze in a numeric way and time constrains have
not allowed to perform a real time execution. That has been the reason why an algorithm has
been developed that simulates the actual outbound Logistics process. In its general form the
constructed algorithm can represent any similar process with successive steps and different
types of employees per task or flow shops. The calculation model created out of the
developed algorithm can identify the bottlenecks within the process and measure the overall
performance in respect with the KPIs that have been defined in the previous stages of the
research. Manpower was a variable that has been tested in respect with cost and turnaround
time. Moreover, the simulation model can be used either for understanding the behavior of
the system or for evaluating various strategies for its operation.
One of the most critical parts of the project has been the calculation and testing applying the
developed model. After having created a reliable set of data from the data analysis in chapter
4, several scenarios regarding the personnel's scheduling have been tested. After the
simulation and the scenarios testing the best alternative has been proposed. The literature
review together with consultation from managers and the supervisor helped develop a
complete improvement strategy towards the improvement of the outbound Logistics.
Chapter 6 introduces the algorithm in its general form and explains the calculation model that
had been used to simulate the existing outbound process of the Logistics center. Finally, its
application and the results have been presented in the end of the chapter.
RQ7: How can the improvement strategies be implemented?
The final conclusion of the research has been presented in Chapter 7. An overview of the
used methodology and the complete set of the recommendations and how can these
implemented in the case of the outbound Logistics, compromise the proposal for the
improvement of the outbound Logistics.

1. Introduction
9
1.4 Research Methodology
The project in question is considered an action research that has been performed in the
Logistics center of KLM Engineering & Maintenance. The action research regards to the real
time participation of the researcher in the company's business, not only as an observer but as
an active member in the decision making (Eden et al., 1996). Valuable input and proposals
had been given at the internal meetings that have been held together with the company’s
supervisor. Although this type of research is not always scientifically valid, it has been
enhanced and supported by academic research and tools. The use of Lean Six Sigma
principles has helped to achieve this task and approach the problem in a scientific way
(Daniel, 1997). According to research, solving this problem with an algorithmic approach and
the use of a calculation model would fit best for analyzing, measuring and coming up with a
new design for the Logistics improvement. Information from contracts with customers and
internal target rules have been used to define the KPIs related to Turnaround Time and
Quality in respect to the 4 M’s, which had been further compared with the performance of the
suggested design, set the targets for the improved future state and finally develop
improvement strategies.
For the purposes of this research triangulation and action research had been used. The
triangulation regards to the data collection and includes literature review, interviews and
observations. Moreover, action research for businesses has been performed, according to
which scientific knowledge from the literature review and trainings within the company,
actions in the decision making and suggestions have been applied (Eden et al., 1996). The
figure below (Figure 3) presents the design methodology that has been followed for the
research and the link between the research questions and the methods that have been used
to answer them.

1. Introduction
10
Figure 3: Research Design and Methodology
Lean, Six Sigma and Engineering Design
Lean
Lean regards to a theory and a way of thinking, whose main goal is to remove the waste
from the process, so that every task is value adding. Value adding process is from the
customers’ perspective. Lean Theory is based on four pillars (Figure 4) that need to be taken
into consideration in order to achieve Lean in business and aims towards continuous
improvement (Hines, 2000), (Six, 2015). The Lean steps have been basically used for the
problem's definition and data collection. Observations, measurements and being part of the
process are proposed in Lean theory and applied in the existing project.

1. Introduction
11
Figure 4: Lean circle (Hines, 2000)
Six Sigma
Six Sigma proposes a five phases approach for improving the Logistic in businesses known as
DMAIC (Define- Measure- Analyze- Improve- Control) (Figure 5). Six Sigma is a tool that
strives to identify and remove the causes of defects and errors in a process. Several
management and statistical methods are used to create a dedicated infrastructure of people
within the organization who contribute to the process’ performance. Literature search in
academic papers and reports prove that the proposed approach will lead to the desired
results. Similar problem solving approach is used in this research (Nanova et al., 2012).
Useful statistical tools from Six Sigma theory have been utilized for the data analysis which
has led to the bottleneck's identification.
Figure 5: Six Sigma DMAIC Steps (Navona, 2012)
Although Lean and Six Sigma are two different theories, their principals can be combined for
the operation of businesses to achieve better results. For more than five years KLM
Engineering & Maintenance has engaged Lean Six Sigma approach to its philosophy and way
of working. Advantages from Lean Six Sigma application are multiple, including increased
efficiency, development of effective people, decreased cost and increase in revenues and can
benefit the entire business (Daniel et al., 1997).
Define
Plan Act
Check
Define
Measure
Analyze
Improve
Control

1. Introduction
12
Engineering Design
A structured methodology has been followed according to the Engineering Design (Eden et
al., 1996). This process includes several steps that can be integrated with the Lean Six Sigma
theory so as to meet company’s principles. The figure below (Figure 6) presents the steps
that have been recommended for the research (Dym et al., 2005). The Engineering Design
has been mainly used for the deepest level of the project's scope, which is the design and
application of certain solutions.
Figure 6: Engineering Design Process Steps (Dym, 2005)
Lean, Six Sigma and Engineering Design
As shown below, all three strategies use similar milestones in some cases in a more explicit
way while in some other more direct and straight. Therefore, the design approach that has
been developed for the project in question, integrates the principles of Lean Six Sigma and
Engineering Design. The most critical steps of the theories have been combined and
incorporated to produce an efficient design framework (Figure 7). The integration of these
three approaches can provide results that exceed the benefits of each individual approach.
Their combination can achieve unprecedented improvements and facilitate the organizational
communication, when different departments are accountable for different problem-solving
methods. While Lean Six Sigma applies tools like Likert scales, surveys, interviews and focus
groups, aiming to customer satisfaction, the Engineering Design focuses more on earnings
and feasibility to implement. Therefore, Lean Six Sigma benefits from customer
communication helps the approval and design making of proposals by Design. As far as the
data collection, Lean Six Sigma develops and analyzes process map, creates formal data
collection plans and measurements. On the other hand Engineering Design only declares the
need and importance of data collection. Moreover, Lean Six Sigma makes use of specific
frameworks (SIPOC) to overview the process and the define the problem, while Engineering
Design uses that frameworks for the process analysis. Engineering Design develops execution
plans for the implementation following best practices, whereas Lean Six Sigma is more
disciplined when it comes to implementation. Finally, Lean Six Sigma applies control plans to
Problem Definition
Backround Research
Data requireme
nts
Solutions Optimal Solution
Prototype
Test & Redesign

1. Introduction
13
ensure the correct implementation and corrective action plan in cases that the execution does
not performs as planned. The features mentioned above include several elements with which
the Lean Six Sigma can enhance and improve the Engineering Design approach. The
integration of the mentioned methodologies can assure that every important information is
taken into consideration during the implementation phase and can guarantee its successful
execution.
There are multiple tools to address issues in the design of engineering systems. The benefits
of creating and implementing a new framework, which integrates the principles of the three
mentioned theories, are multiple. The application of Lean Six Sigma concepts in an
Engineering Design can result to an adaptable and flexible framework. The integrated
approach applied for this research provides a better visualization of the process, its
interaction with its elements and helps identify the bottlenecks leading towards continuous
improvement. The basic framework of Lean Theory (PDCA) is taken as a beginning.
Thereafter, elements and proposed actions from Six Sigma and Engineering Design are
adopted and combined in order to enhance the methodology and have more flexibility in the
actions and decisions taken.
Figure 7: Framework– Integration of Lean, Six Sigma and Engineering Design
The steps that have been followed to accomplish the design objective are given in the
proposed design framework and are described by the DMAIC phase in a more explicit way
that was closer to Engineering Design and Lean approach (Figure 8). The framework begins
with the "Define" phase, which is common for the three approaches and includes the
definition of several elements related to the problem. The "Measure" and "Analyze" step can
be correlated to the "Plan" phase of the Lean theory and "Background Research", "Data
Requirements" and "Solutions" of Engineering Design. In these steps the performance
measurement and a complete set of solutions is developed. Part of the solution regards to
scoping among the solutions due to limitations and applicability in the project. For the
purposes of the Analysis phase, the process' simulation through a calculation model and an
algorithmic approach has helped create a prototype of the process. Further, the "Improve"
Design Methodology-
LSSED

1. Introduction
14
step of the developed framework, corresponds to the "Act" phase of Lean theory and
"Prototype" phase of the Engineering Design. The improvement phase, regards mainly to the
selection of the best scenario resulted from the calculation model and finally suggest the
strategy towards improving the outbound Logistics. In the end, the "Control" step, "Check"
and "Test and Redesign" steps respectively to the other theories, require the development of
a control plan that would guarantee continuous improvement of the process.
Figure 8: Research Approach
Def ine
The first phase of the proposed approach included a set of definitions. These definitions help
have a clear overview of the existing process and its essential features. The current state of
the outbound Logistics is studied in details. Observations, interviews and joining shifts on the
floor result in the understanding of the current process. Several diagrams visualize the
outbound Logistics, the tasks performed, their input and output and the mechanisms
employed in every step.
Define current state
Define problem
Define KPIs
Define defects & root causes
Data Collection
Performance Measumerment
Set of Solutions Creation
Develop Algorithm/Simulation Design
Apply calculation/Test Scenarios
Analyse Scenarios
Select best Scenario
Suggest improvement strategies
Creat process control plan
Performance Management
Continuous improvement

1. Introduction
15
Further, extended research on the floor, focus groups and value stream mapping sessions
(see Appendix Interviews, Observations and Internal Sessions) resulted in identifying the
main problem within the outbound Logistics.
The critical KPIs have been defined through Literature. Having studied and researched in
similar cases in books and papers have contributed in understanding which important
performance indicators could be taken into consideration for this project. Quality, Turnaround
Time and Cost are the main performance indicators that can help measure the overall
performance of the outbound Logistics.
At the end of the definition phase and after having defined the existing process, the critical
KPIs have helped identify the problematic areas and bottlenecks that undermine the
performance of the existing outbound Logistics process. Additional value stream mapping
sessions, focus groups and internal sessions with employees, supervisors and managers have
helped define the causes and root causes of poor quality, delayed turnaround time and
excess operational costs.
Measure
The following step includes the performance measurement of the current state in the
outbound Logistics. First, a data collection plan is required in order to gather the correct,
reliable and consistent information and measure the process performance in terms of the
critical KPIs. A combination of personal measurements for real timings, information from
tracking systems and internal reports include the sources of the data needed.
Statistical tools have been used to measure the performance and create meaningful plots,
table and diagrams presenting the process' performance. The comparison of the results from
this action with the KPIs point out the problematic areas within the process.
Taken into consideration the problematic areas and realizing how these can be solved,
contributing to the overall improvement of the process; several solutions have been
developed and proposed. Scoping on a single solution based on the feasibility of creating and
testing a complete action plan, leads to following the next steps of the process.
Analyze
This phase includes the analysis of the chosen solution of focus. The personnel's scheduling
has been proven to contribute to a more efficient process flow in terms of quality, turnaround
time and cost. The development of the algorithm that simulates the process and test certain
scenarios concerning to the personnel scheduling has been a part of the analysis phase.
Next the application of the calculation model, using data and information from the
performance measurements is an essential part of the analysis. Several scenarios of
scheduling combinations that include different number of employees' emplacement and
therefore, different operational costs.
Finally, the calculation model presents results for every scenario in terms of the KPIs and
critical performance indicators. On time delivery scores, based on the required turnaround
time, and overall cost of every scenario are summarized in tables and presented in graphs.
Improve

1. Introduction
16
The improvement phase requires the selection of the scenario with the best results, in terms
of on time deliveries and cost. Finally, this step provides a complete recommendation with
every feasible solution that can be implemented for the improvement of the outbound
Logistics process.
Control- Sustain
This final step is left out of the project's scope. Nevertheless, action plans for the process
control and its performance sustainability have been proposed. Performance management
techniques and topics for further research projects have been briefly analyzed.
1.5 Deliverables
Set of solutions for the problem
As it has been mentioned the research objective is to develop a future state of the outbound
Logistics process with less waste. A set of solutions has been the result of several internal
meetings, interviews and literature based on the data analysis that has been performed and
has identified the problematic areas within the process (Appendix B Interview, Measurements
and Observations). In general the new process should include more standardized steps that
perform more efficiently in comparison to the current state. The deliverable has included a
combination of solutions that could be implemented simultaneously and regarded in different
aspects of the problem. However, due to constrains and limitations the deliverable is
described only in terms of an action plan for further and additional projects.
Personnel’s Scheduling
Out of the several set of solutions further research has been conducted in the Personnel’s
scheduling. The personnel’s capacity for ensuring the right and on time delivery based on the
incoming goods workload has been approached by simulating the process and testing several
possible scheduling scenarios. The model for realizing the simulation has been created based
on the algorithm developed and introduced for the purposes of this research. The following
figure (Figure 9) represents the design methodology for the simulation. Law’s (Law, 2003)
steps for a simulation study have been taken as a guide map for the work done in Chapter 6.
Different scenarios have been tested using the calculation model and assessed based on cost
minimization and time constraints. Finally, based on the calculation's results, the best
scenario for the company has been proposed and in the end a complete proposal for the
improvement of the outbound Logistics process has been suggested.
Figure 9: Simulation's Design (Law, 2003)
1.6 Scientific Contribution
The contribution of this research has been divided in three separate fields: scientific,
managerial and societal.
Problem Formulation
Algorithm Development
Data & Scenarios Creation
Algorithm’s Verification &
Validation
Simulate, Run & Test
1. Introduction
17
First, the research is related to a managerial aspect of KLM Engineering & Maintenance and
contributes to its business by making a quantitative and scientifically proved recommendation
for the improvement of the Logistic processes. Moreover, the algorithm developed to simulate
the outbound Logistics process can be adjusted to simulate the entire supply chain of KLM
Engineering & Maintenance and therefore identify any existing bottlenecks and improve the
company's process.
By applying an algorithm and a calculation-simulation model for measuring the current state
and testing several scenarios for the improved future state, the research acquires a scientific
character as well. The literature review justifies that little is known in Lean Six Sigma theory
regarding to the use of algorithms to simulate the Logistics process, the creation and use of
scenarios to test their performance. Therefore, this research introduces a slightly altered
version of Lean Six Sigma approach that makes use of an algorithmic approach to simulate
the process identify the bottlenecks and improve it by suggesting the best scenario that is
tested. Moreover, the research provides a scientific contribution on improvement strategies
by stimulating the personnel's occupation.
The societal relevance regards to providing right services to the customers. One of the
biggest goals of KLM Engineering & Maintenance is to become the world leader in MRO
business. This could be accomplished by integrating the Seven Rights of Logistic to its
business (Right product, Right place, Right time, Right price, Right quality, Right quantity,
and Right customer) (Robeson, 1994). The improvement of the outbound Logistic processes
in the Logistics Center is a great contribution towards this goal and could also be extended to
the serve the needs of the entire Logistics chain.
1.7 Research Outline
The report has been structured based on the methodology and the steps that have been
taken chronologically. The following chapter introduces the reader to the company. Every
background information, terminology and details concerning KLM E&M, its Logistics center
and the outbound process that has been the main focus of the research are stated in the
second chapter. Chapter 3 cites the literature that has been utilized in order to gain better
knowledge over the performance indicators and metrics, understand the theory behind the
research that was followed, and justify the reason why simulation is a very useful tool for the
project in question. Data analysis is a very big part of the research. Chapter 4 first describes
the indicators and metrics that were essential for performance measurement. In following
sections, the used methods for conducting the data analysis and collecting reliable
information are explained. Lastly, the results from the data analysis justify that the process
shows big margins of improvement. A combination of brainstorm meetings and knowledge
from literature results to several solution areas, which are listed and described thoroughly in
Chapter 5. Chapter 6 includes the process’ simulation. First there is the formal statement and
explanation of the algorithm and the calculation model that has been developed for the needs
of the project. Thereafter its application for the outbound Logistics process is performed by
creating the set of input data and scenarios to be tested. The results analysis and the
selection of the best scenario conclude the chapter. The one that minimizes the total cost and
leaves no uncompleted components in the end of multiple subsequent shifts, meaning that
the time requirements are met, is the best scenario. Finally, chapter 7 concludes the project
and provides recommendations for further research.

1. Introduction
18

2. Outbound Logistics Process Overview
19
2. Outbound Logistics Process
Overview This chapter presents the activities, actors, and parties that are involved in the outbound
Logistics process at the Logistics Center of KLM E&M. First a general view of the company’s
design is presented in Section 2.1. The terminology is explained in the Section 2.2 and
Section 2.3 provides an insight of the supply chain of the components that arrive and leave
the Logistics Center. Further in Section 2.4 a Value Stream Map is employed for the detailed
representation of the outbound Logistics process and finally Section 2.5 explains the
personnel’s scheduling at the Logistics Center. The summary and the conclusion of this
chapter are stated in Section 2.6.
2.1 Background of KLM
This Section provides an introduction to KLM, the main business of KLM Engineering &
Maintenance and its department of Logistics Center.
2.1.1 KLM Royal Dutch Airlines
KLM Royal Dutch Airlines, the oldest operating airline in the Netherlands, was founded in
1919 and since then is a very important worldwide employee in aviation. KLM is a part of AIR
France - KLM group since 2004 and owns KLM Cityhopper (KLC), Transavia.com and
Martinair.
KLM is the largest airline in the Netherland that carries about 23 million passengers and half a
million tons of freight annually (KLM, n.d.). Three are the core business of the KLM:
Passenger Transportation, Cargo division, and Engineering & Maintenance (E&M) which is the
main focus of this research.
2.1.2 KLM Engineering & Maintenance
As mentioned above KLM Engineering & Maintenance is one of the core units of AIR France-
KLM group. The main business of KLM Engineering & Maintenance is to provide Maintenance
Repair and Overhaul (MRO) services that guarantee air safety, managing aircraft operation
management, and costs minimization to both internal and external clients. The company has
around 5,000 employees and acquires a large portfolio of activities provided by three
departments: Aircraft Maintenance, Engine Services and Component Services.
The activities of Aircraft Maintenance include Line Maintenance and Base Maintenance of
aircrafts that 80% of the cases come from internal customers. Line Maintenance is an
unscheduled maintenance on aircrafts that are in service, either on-site or in a hangar. Base
Maintenance is scheduled and more thorough maintenance; it takes place in a hangar on
aircrafts that are out of service.
Engine Services provides maintenance, repair, and overhaul (MRO) services on four types of
aircraft engines that are all produced by General Electric. Approximately 250 engines are
repaired every year of which 40% are engines from internal customers and the rest come
from third parties (internal report, Castro et al., 2010).
The Component Services is accountable for supplying serviceable components to both
internal (KLM) and external customers (see Appendix A List of Customers). Component

2. Outbound Logistics Process Overview
20
Services delivers repair & overhaul services for components, maintains the warehouse of
components in stock, and provides the internal transportation of components at Schiphol
between the 6 maintenance units of the three business units of Engineering & Maintenance
and the Logistics Center.
The company's objective is to become the world largest provider of MRO services for
aircrafts. The aforementioned operating departments are responsible for implementing their
skills for serving the company's goals and its customers' needs. There is a united organization
responsible for strategy, marketing, business development, sales force and external
communication.
The research is conducted within the Logistics Center of KLM Engineering & Maintenance
Component Services. Its detailed overview is presented in the next section.
2.1.3 Logistics Center of KLM Engineering & Maintenance
This section provides a detail description of the operational process that is performed in different areas within the Logistics center, as depicted in the sketch of the following section
(Figure 16). The description will follow the components’ physical route in the Logistics center.
Expedition
The expedition is the only entrance an escape of the components to the building. The expedition personnel are responsible for the transportation of the components within the
Logistics center. Several incoming components’ final destination is not in the Logistics center. These are directly, sometimes after import clearance activities, send for transport. The
personnel in charge is also accountable that every component that enters the Logistics center
keeps flowing or is located in the correct lane for further transport. Incoming custom clearance goods are first handled by the import department that will be soon replaced by an
external company outside the Logistics center.
Shop VC
After these custom clearance administrative activities, the goods are offered to the expedition
for (internal LC) transport. Shop VC performs the administrative activities required to send and receive components for/from external repair. Shop VC outbound ensures the right
documentation and the right vendor information for goods to be send to vendors. Shop VC inbound inspects all incoming components (new, internally repaired and externally repaired)
for the correct permits and licenses after which the components are declared serviceable.
Warehouse Logistics Center
When finishing their processes, the goods are offered to the expedition for internal LC
transport. MLC (Warehouse Logistics Center) is the only KLM Engineering & Maintenance component warehouse in the Schiphol-Oost area. Ordered components are picked,
administratively booked out the warehouse and offered to the expedition for internal LC transport. Export, outbound goods with a destination outside the European Union are custom
cleared for export and pick up by KLM Cargo.
2.2 Terminology for the Logistics Center
Some important terminology should be explained, before going deeper into the Logistics
process at the Logistics Center. The terminology can facilitate the reader to understand the
basic operation of the Logistics center and connect it with the analysis that has been
performed for the research.
2. Outbound Logistics Process Overview
21
IT systems
IT systems are necessary for the successful administration of components in the Logistics
center. Their interface links administrative and logistics procedures and helps the stakeholder
keep track and extract valuable information regarding the components.
SAP is one of the most essential systems and is widely used in every organization’s core
business. Most of the administrative work in the Logistics center is completed in SAP system
that is used in various formats to create material orders (Shop order, Purchase order, Repair
Orders, Warranty Orders and Material documents.
The following Logistics information can be found in SAP orders
• DV: Date and Time stamp product delivered at Vendor (for Repair parts)
• PV: Date and Time stamp product picked up at Vendor.
• CR: Date and Time stamp product cleared for (inbound) customs
• DM: Date and Time stamp product delivered at KLM Engineering & Maintenance logistics
center.
• GR: Date and Time stamp “goods received” by the KLM Engineering & Maintenance
department which placed the order
Component Services uses Crocos to register components’ information regarding their life
cycle and logistics status. Crocos is a system that provides identification for every component
in its data base. Information about its physical location is always available in this system,
helping the warehouse and inventory management process. Moreover, Crocos provides
notifications about the components’ necessary checks and automatic registration of a
component’s removal, request for installation or placement in the warehouse. The main input
data that is required from Crocos is the component’s unique label number that is attached in
its package.
Another useful system that provides track and trace information is the Tracking system. Its
interface with SAP and Crocos give reliable data regarding the physical location of the
component, information about its origin and destination. A tracking sticker with a unique
barcode indicating the component’s final destination can be created by the Tracking system.
Regular scans in specific scanning points within the Logistics center are required in order to
update the system about the internal component’s flow and define turnaround time in each
process. Thus, monitoring, track and trace becomes more reliable and consistent data can be
extracted by this task.
Purchase Order
A Purchase Order (PO) is attached to every component that is accepted in the Logistics
center. A PO is created by the corresponding department that orders the product. A PO is
registered in SAP, the ERP system used all the departments in KLM Engineering &
Maintenance. It can be considered as the identification by which an order is followed. The PO
is created at the start of a purchase or external repair process.
During aircrafts’ maintenance, all parts are technically inspected and in case an inspector
decides that a component requires an external repair, test or overhaul that means it is no
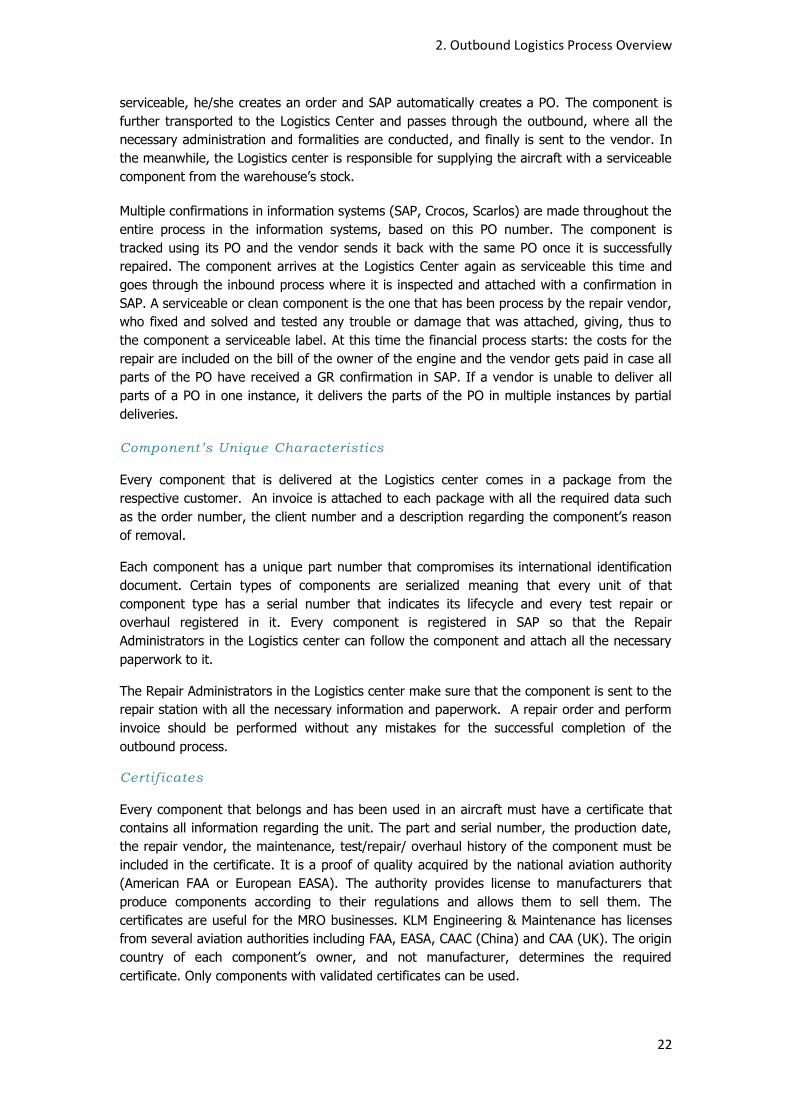
2. Outbound Logistics Process Overview
22
serviceable, he/she creates an order and SAP automatically creates a PO. The component is
further transported to the Logistics Center and passes through the outbound, where all the
necessary administration and formalities are conducted, and finally is sent to the vendor. In
the meanwhile, the Logistics center is responsible for supplying the aircraft with a serviceable
component from the warehouse’s stock.
Multiple confirmations in information systems (SAP, Crocos, Scarlos) are made throughout the
entire process in the information systems, based on this PO number. The component is
tracked using its PO and the vendor sends it back with the same PO once it is successfully
repaired. The component arrives at the Logistics Center again as serviceable this time and
goes through the inbound process where it is inspected and attached with a confirmation in
SAP. A serviceable or clean component is the one that has been process by the repair vendor,
who fixed and solved and tested any trouble or damage that was attached, giving, thus to
the component a serviceable label. At this time the financial process starts: the costs for the
repair are included on the bill of the owner of the engine and the vendor gets paid in case all
parts of the PO have received a GR confirmation in SAP. If a vendor is unable to deliver all
parts of a PO in one instance, it delivers the parts of the PO in multiple instances by partial
deliveries.
Component’s Unique Characteristics
Every component that is delivered at the Logistics center comes in a package from the
respective customer. An invoice is attached to each package with all the required data such
as the order number, the client number and a description regarding the component’s reason
of removal.
Each component has a unique part number that compromises its international identification
document. Certain types of components are serialized meaning that every unit of that
component type has a serial number that indicates its lifecycle and every test repair or
overhaul registered in it. Every component is registered in SAP so that the Repair
Administrators in the Logistics center can follow the component and attach all the necessary
paperwork to it.
The Repair Administrators in the Logistics center make sure that the component is sent to the
repair station with all the necessary information and paperwork. A repair order and perform
invoice should be performed without any mistakes for the successful completion of the
outbound process.
Certif icates
Every component that belongs and has been used in an aircraft must have a certificate that
contains all information regarding the unit. The part and serial number, the production date,
the repair vendor, the maintenance, test/repair/ overhaul history of the component must be
included in the certificate. It is a proof of quality acquired by the national aviation authority
(American FAA or European EASA). The authority provides license to manufacturers that
produce components according to their regulations and allows them to sell them. The
certificates are useful for the MRO businesses. KLM Engineering & Maintenance has licenses
from several aviation authorities including FAA, EASA, CAAC (China) and CAA (UK). The origin
country of each component’s owner, and not manufacturer, determines the required
certificate. Only components with validated certificates can be used.

2. Outbound Logistics Process Overview
23
Employees at the Logistics Center
There are several types of employees in the Logistics center, each of them responsible for
separate tasks in the process.
General Expedition personnel receive packages from the import with the necessary papers
needed including the components information needed to make it known in the system
(Crocos) that the component arrived in the Logistics center. After updating the system, they
are responsible for making a distinction between serviceable and unserviceable components
and transport them to the proper places within the Logistics center attaching a tracking
sticker to the package.
Physical Inspectors are responsible for checking the condition of dirty components.
Certificates, paperwork and damages on the component are checked and reported by the
employees. After performing a thorough check about the physical condition of the
component, the inspector validates whether the data that are reported in the Invoice
correspond to the id plate and creates a form with all the correct information that can be
used further in the process.
Repair Administrators are more skilled personnel that are responsible for the administrative
work in the computer. Certain data, besides the physical component, are required and need
to be inserted in the appropriate system (Crocos, SAP), so as to register the components
purchase and/or repair order and create the paperwork in order to send the right component
to the right repair vendor.
Component's streams - Pool, Forward exchange, Closed Loop Amsterdam
The Logistics Center of KLM Engineering & Maintenance, accepts components from multiple
customers all over the world. Thus, different contract details describe the agreements with
every customer, concerning the turnaround time of the components, the compatible repair
vendors etc. Moreover, different configurations and different systems are used for every
customer. Therefore, there has been a clear distinction between three main streams in the
delivered components; Pool, Forward Exchange (FE) and Closed Loop Amsterdam (CLA). A
unique barcode is attached to every component, according to the type of stream that each it
belongs and is located in the respective place in the Outbound Logistics and handled by
different type of employees.
Components that belong in the Pool and Forward Exchange stream have a barcode initiating
with "SPLVC" and are placed together in the same lane. Only when the components data
(code number) is visible the physical inspector can make a distinction between Pool and FE
components. From that time the appropriate employee can handle the components that are
assigned to this stream.
Closed Loop Amsterdam components are separated from the rest as they are assigned with
barcodes starting with SPLCLA and are placed from the expedition to a different lane.
Therefore the CLA employees can easily distinguish their components and handle them
correctly.
2.3 Current State of the Outbound Logistics Process
This chapter provides a detailed description of the current state in the outbound Logistics.
The physical flow of the components from the moment that are delivered in the Logistics
center until the moment that they are out for delivery in the repair vendors and all the critical

2. Outbound Logistics Process Overview
24
tasks that are completed in between are presented in section 2.3.1. The section 2.3.2
provides a visual description of the design lay out and section 2.3.3 makes an introduction to
the employees scheduling that will become one of the main solution topics in the following
chapters.
2.3.1 Description of the Outbound Logistics Process
This section elaborates on the outbound process that is the flow that unserviceable
components follow within the Logistics center. The following IDEF0 (Integrated Computer
Aided Manufacturing DEFinition for Function Modeling) diagrams have been designed in
BPwin to model, describe and visualize the activities that take place in the Logistics Center.
The diagrams include a rectangular box that represents the main activity of the outbound
Logistics process that is "to Provide Outbound Logistics" (Figure 10). The arrows that are
used have a different meaning based on their position and direction with respect to the main
box. Input and output are presented in the horizontal arrows that point in and out of the
main box. The vertical arrow that comes from the top of the main activity's box declares the
elements that control the activity in order to give the desired output, while the arrow coming
from the bottom to the main box represent the mechanism, operators and software that is
used to complete the activity and process the input to deliver the output. The main activity is
decomposed to several sub activities that represent the tasks performed in the Logistics
center to complete the outbound process (Figure 11). The sub activities are further
decomposed and visualized to the deepest level in the following figures (Figures 12-15). The
diagrams visualize subsequent steps that represent the physical flow of the unserviceable
components in the outbound Logistics process. Therefore, the time distance between the
diagrams is of great importance and has been identified during the data analysis. This action
helps gain a general view of the normal timeframe that is needed to complete the process
without any waste and/or defects.
Figure 10: Outbound Logistics Process
2. Outbound Logistics Process Overview
25
First the component is dropped off at the Expedition of the Logistics center and goes through
Import. In case of domestic components’ the import makes the package custom free or else
custom taxes should be issued. After the component is transported to shop VC where there is
a buffer waiting for physical inspection and repair administration. Then the component goes
through export and is finally left to the expedition waiting to be picked and transported to the
repair vendor (Figure 12).
Figure 11: Provide Outbound Logistics
Receiving incoming goods
The process of receiving packages at the Expedition is designed to facilitate receiving the
component and divided them based on whether they are unserviceable and need to go
through outbound or serviceable, which follow the inbound flow. This process is performed by
the expedition employee.
Components are delivered at the expedition several times per day by different delivery
services. Most of the times unserviceable components come from the Hangars located in
Schiphol Oost technical area, from France via the shuffle or are sent by external customers.
Serviceable components arrive at the expedition from several repair vendors and customers
domestic or not. Based on the origin of the delivered package, it must go through import
which issues the Customs Release notice in SAP including all the necessary information for
the expedition employee to update the system and make it known. The employee creates a
tracking sticker that indicates the final destination of the component in the Logistics center.
The next task is to determine the route that the component will follow within the Logistics
center. Some serviceable components are sent directly to the customer, whereas others need
to go through the Logistics center’s process either to be stored at the warehouse or to be
delivered to customers as well. The later needs to be separated from the others and
transported to the correct location in the inbound section of the Logistics center. As for the

2. Outbound Logistics Process Overview
26
unserviceable components, they have to pass through the outbound process and be handled
administratively before sent to the respective repair vendor. These components are
transported to the shop VC where they are placed in different lanes if they are coming from
CLA (Jet airways, Air Morocco) or not customers. After identifying the component and its
destination, the employee loads the packages into a cart and transports them to the
respective place in Logistics center. A critical step in this task is to scan the tracking sticker in
each phase so that the relevant information, regarding to the time and location, can be
obtained. The following figure (Figure 12) represents the process of receiving components in
the Expedition. The processes described above compromise the outbound process that the
component goes through in order to be sent to the repair vendor.
Figure 12: Receive Incoming Goods
Physical Inspection
The physical inspector is responsible for assuring the quality of the received unserviceable
component. The employee takes the components out of the buffer in Shop VC according to
FIFO priority, although the rule is not always followed (See Section 3.1.1). Two parallel
streams are working simultaneously for handling CLA and other components. The reason of
that lies to the fact that different customers, thus different contract, have separate
requirements and demands. Therefore, expertise should be acquired for CLA customers.
Nevertheless, both employees guarantee that the component meets the quality requirements
and has the right certificate and documentation according to the aviation authorities for
flight. The visual inspectors open the packages check for the documents and verifies that the
components is delivered without any damage other than the reported in the enclosed invoice.
There is no technical inspection performed at this step, as the component that arrives at the
Logistics center must be accepted only with the relevant description and reason of removal
that is written by expert technicians. If the component is in the proper condition, the
physical inspector fills in a form with all the information that can be obtained from the

2. Outbound Logistics Process Overview
27
components id label (serial/part/following number etc.). Dimensions and weight of the
package are also reported in this form that facilitates and saves valuable time for the repair
administrator, who uses these data as an input for making the correct order. After
completing the check and reporting the components data, the employee places the packaged
to a buffer, from which it will be picked for further handling (Figure 13). A physical's inspector
handling time lasts on average for 15 minutes. Detailed figures of the physical inspector's
handling time can be found in the Data Analysis performed in Chapter 4. The following
Section 2.3.3 describes the physical inspectors' scheduling and their average production
rates.
In cases of missing data in this step, or any defects that may be encounter and cannot be
solved by the physical inspector, the components should be left to the scoping buffer. From
there the component follows another process for the clarification of the problems that have
been reported in the physical inspection phase.
Figure 13: Physical Inspection
Administrative Inspection
The repair administrator is accountable for checking the certificates and documents that are
sent in the package. He/she is picks components from the buffer following again the FIFO
priority rule. The repair administrator in general verifies the information on the certificates in
accordance with the data obtained by SAP and on the physical component as it is reported in
the previous step by the physical inspector. Then the employee matches the requests with
the PO and. In the respective systems, SAP and Crocos the repair administrator determines
the work scope and the repair vendor that is accountable for each component. The final step
is to Perform Invoice with all the necessary data and description regarding to the component
for each repair vendor. A list of the data requirements that need to be included in the
package before being sent to the repair vendor is presented in the Appendix. After

2. Outbound Logistics Process Overview
28
completing the administration a new tracking sticker is matched to the previous one and
attached in the package. The sticker is scanned in the current location. All printed paperwork
should be packed in the package and a last visual inspection is required. The employee
transports the component to the drop point, from where it is picked by the runner and placed
to the expedition area. It is essential that the sticker is again scanned so that it is known in
the system that the component is left and picked from the specific location (Figure 14). On
average the physical inspector's task takes up to 20 minutes (see Chapter 4). Section 2.3.3
cites an overview of how the personnel is managed in the outbound Logistics based on their
production rates.
Figure 14: Administrative Inspection
In cases of troubles, missing or incorrect data the repair administrator should dispatch the
component to the troubleshooting buffer for further inspection. A list of all the possible
problems that could be encountered in this phase is shown in Appendix A Process Sidesteps.
Export and Transportation
After completing the necessary inspection and administration in each component, a buffer is
created in the expedition area, where the components are left until they are further
processed for export formalities. Thereafter, a batch of packages waits for trucks to arrive. In
this area loads of packages are placed including those that are unserviceable and need to be
sent to repair vendors and clean ones that are requested by customers. Almost every half an
hour there are truck arrivals, which collect the packages. Proper separation and handling
should be performed so that the right component is dispatched to the correct truck for
transportation.

2. Outbound Logistics Process Overview
29
Scoping and Troubleshooting
Scoping and Troubleshooting processes are out of the scope of this research. However, a
brief description is provided in order to understand better the entire process. The processes'
diagrammatic representation is cited in Appendix B Side Step Processes (Figure 35 and Figure
36). Both sub processes include sidesteps of the main process flow that is required only when
the employees handling the components encounter issues in identifying a component's data
that are necessary for completing their task. It is common, that the customer sends a
component with insufficient information about its condition or indistinct data that are required
for its configuration in the system. Some of these issues can be solved easily by checking in
the system by the employees that have access to it. Nevertheless, this is not always the case.
In some cases further investigation is needed and therefore the components need to follow
the sub process to complete and solve the issue without delaying the normal flow of the
other components. The employees that are responsible for scoping and troubleshooting try to
give solution to the issues as soon as possible and return the component to the normal flow
with all the complete information needed. Around 5 per cent of the incoming unserviceable
components end to Scoping or Troubleshooting ranks every day.
The following figure (Figure 15) visualizes the main process steps that compromise only the
Outbound Logistics. This representation will be the milestone for the analysis, whereas more
attention will be given to the "Physical Inspection" and "Repair Administration", as they are
the more essential activities of the Outbound Logistics and most of the defects occur. In the
Appendix C Outbound Logistics Critical Areas, there are some photos visualizing areas where
the critical task and the in between buffers are performed.
Figure 15: Main Process Steps
Conclusion
The section provided a detailed description of the outbound processes in the Logistics center.
Four are the main stages that the component passes through in the outbound after being
delivered from the customers and before being transported to the repair vendors.
The unserviceable component is received in the expedition and goes through import if
necessary. A new tracking sticker is created by the employee and then is dispatched to Shop
VC where physical inspection takes place. Administrative inspection assures that the
component acquires the correct paperwork and Perform Invoice is issued. Tracking sticker is
created and regular scans make sure that the components flow is recorded in the systems for
monitoring its route and counting the overall performance of the process in terms of time.
1
Expedition
3
Physical Inspection
4
Repair Administration
5-6
Export &
Expedition
7
Transport

2. Outbound Logistics Process Overview
30
Two sidesteps are added in the outbound process, which occur in cases of problematic orders
and any kind of defects in the delivered component, see Appendix B Sidestep Processes
(Figure 35 and Figure 36).
2.3.2 Design Process Lay-out of the Logistics Center
The outbound Logistics process is design in similar ways as other MRO Logistics centers. As it
is mentioned, KLM practices Lean Six Sigma in organizing its businesses (Section 3.4). A
Kaizen event should be performed for the re organization of the Logistics center and
therefore the improvement of the process’s performance (Hines, 2000), (Six, 2015). The
Kaizen event requires the whole department focused for a certain period of time on
improving the entire process, including re constructing the lay out. The aim of this task is to
redesign the entire Logistics process, in order to come up with a normal flow of the
components, minimize the buffers and thus contribute to the quality and turnaround time
improvement. Significant input for the Kaizen event is given by the researcher after analysis
of the outbound. The current lay out of the Logistics center is depicted in the sketch below
(Figure 16). The arrows and the number in sequence follow the physical flow of the
component in the outbound Logistics process. Moreover, the points where scanning is
performed using every component's unique barcode to insert its location in the tracking
system are depicted in this figure. The scanning points and their actions performed are
described in the Appendix E Scanning Points (Table 23) and are very important for monitoring
the workflow and contribute to the performance management.
Figure 16: Current State Design Lay out and Scanning Points

2. Outbound Logistics Process Overview
31
2.3.3 Process Overview
This section describes some important elements that influence the process flow in the
outbound Logistics. Due to the employee's production rates, their scheduling is explained in
order to meet the turnaround time requirements. Moreover, the dispatching rules that are
used are explained in details in the last paragraph.
Personnel's Scheduling
The employees' scheduling within the Logistics center can result in significant cost savings.
Therefore, good planning and personnel’s management is very essential for accomplishing
the Lean in the Logistics center. This section describes briefly the existing employees
scheduling that work for the outbound Logistics.
There are three groups of employees working in the Logistics process (Section 2.2 Employees
at the Logistics Center); the General Expedition personnel, the Physical Inspectors and the
Repair Administrators. Nevertheless, detailed analysis have been performed for the two types
of employees the Physical Inspector and Repair Administrator, who work only for the
outbound Logistics and influence the process' performance.
At the Logistics center the scheduling is based on a 7x2 roster. That means that the
operations run seven days a week in two shifts (day and evening), because the Logistics
center is responsible for receiving and delivering components to customers when needed.
The aircraft MRO business requires services any time and any day of the year (24/7/365).
Every day can be divided into two shifts; the day shift (7:00-15:00) and evening shift (15:00-
23:00). Each shift is 8hours (480 minutes), however, due to overlapping, lunch/dinner and
coffee breaks and any other reasons the real productive shifts time has been calculated to be
6.5 (390 minutes).
Production Rates
As it has been mentioned the average handling time of physical inspector is 10 minutes; that
means that his/her production rate would be around 39 components per shift. The same for
the second type of employee; 20 minutes are required for a repair administrator to completed
their task, therefore, 19 components per shift are their average production rate. The
calculations above result to the fact that the production rate of physical inspector is twice of
the repair administrator's. As a result, for a normal process flow in the outbound Logistics the
number of repair administrators is expected to be at least twice than the physical inspectors.
However, the outbound Logistics personnel's scheduling is complex to described since there is
no standardization. Generally, the employees are dispersed in shifts that at least 6 repair
administrators (4 day, 2 evening shift) and 3 physical inspectors (2 day, 1 evening or 3 day
shift) are working every day including weekends. That has been the main reason why in this
research extreme focus has been given to the personnel's scheduling (Chapter 6).
Priority Rules
FIFO is used in the Logistics center as it is an efficient tool for minimizing the components'
average flow time (Jayamohan, 2000). However, this is not always the case. Customers'
satisfaction and their components’ due date, defined in the contracts, are final factors that
determine the components’ priority (Philipoom, 2000). Most of the times employees
deliberately choose components with emergency request or components that are left in the
solved scoping buffer. This fact might facilitate the overall turnaround time performance of

2. Outbound Logistics Process Overview
32
the outbound since components with high importance are eventually handled in time, but one
the other hand it might create extra delays for other components.
2.4 Conclusion
This chapter explained the physical flow of the unserviceable components delivered in the
Logistics center. A general description of the Logistics center is provided. Important
terminology has also been provided to help the reader follow the internal vocabulary.
Moreover, the critical steps, employees and systems which comprise the entire chain of
outbound Logistics have been described in details. Finally, the representation of the process
has been depicted in a process flow diagram and the design of the Logistics center has been
provided in order to visualize and gain a better insight and overview over the environment
that has been examined.
All the components that arrive in the Logistics center are accepted in the expedition. Trucks
arrive multiple times in a daily basis without following a fixed schedule. The personnel in
expedition make a distinction between serviceable and unserviceable components by their
label and sender. Thereafter, they create tracking stickers with unique barcodes for every
component and transport the components in the correct lane of the Logistics center.
The unserviceable components are placed in the outbound Logistics, where various tasks are
performed to complete the components' handling and create the correct order for the correct
repair vendor. Two different types of employees are working for the outbound Logistics. The
physical inspector that checks the physical condition of the components and completes a form
with every required data and information found on the component or the papers that come
with it. The repair administrator's task begins only when the physical inspector has completed
his. Administration and configuration in the IT systems are performed by the repair
administrator who is accountable for completing the components’ order and necessary
paperwork to send it to the contracted repair vendor.
The personnel from expedition is once again assigned to collect all the completed
components and arrange their placement to the trucks that distribute them to the respective
repair vendor.
The scheduling of the personnel in the outbound Logistics is very essential to be mentioned
and be taken into consideration when creating the improvement scenarios. The capacity of
personnel is a determinant factor for minimizing the cost of working hands while using the
most effort possible. Different scheduling alternatives have been tested and selected based
on meeting the turnaround time requirements and cost saving.

3. Literature Review
33
3. Literature Review The review presented in this chapter provides the reader with an introduction to the literature
that is relevant to the topic in question. The first section presents some literature regarding
to Performance Metrics and Key Performance Indicators that will help make a clear definition
of the performance measurements for the outbound process. For this purpose, the outbound
Logistics have been related to job shop model. The following two sections give insight on
methods and tools that have been previously used for achieving the Quality improvement and
Turnaround Time reduction. An excessive review of Lean Six Sigma practices and how they
can be applied in KLM Engineering & Maintenance is presented in section 3.3. Finally, the last
section describes why an algorithmic approach and a simulation in terms of a calculation
model is a useful tool for the purposes of this research and how it can contribute to the
process improvement.
3.1 Job Shop Model
The outbound Logistics center can be considered as a job flow, in which jobs consist of a
number of operations performed on different machines (Pinedo, 2005). For the case of the
Logistics center a special type of job flow is recognized: the flexible flow show, where jobs go
through a number parallel work centers, which consists of identical machines in parallel
(Pinedo, 2005). More specifically in the Logistics center (outbound) the jobs are represented
by the components (unserviceable), work centers are the logistical departments (expedition,
physical inspection, repair administration and sidesteps) and the respective employees
handling the components can be considered as the machines.
The objective of a flexible job flow scheduling problem is to organize the tasks in such a way
that quality, turnaround time and cost are minimized. There are numerous versions of this
problem in literature and different approaches to solve the scheduling problem. Researchers
studied the components' process in batches (Shen et al., 2012), with no fixed order by the
employees (Zu et al., 2006) and other optimization objectives (Xia et al., 2005).
In general the job shop scheduling problem is NP-hard (Garey et al., 1976); meaning that its
computational time increases with the number of jobs. Therefore, it has been really hard to
solve such a problem for the entire supply chain of KLM Engineering & Maintenance, where
there is unlimited number of components in each flow. Nevertheless, optimizing methods
(dynamic programming), heuristics (simulation) and hybrids (combining both) (Zhu et al.,
2006). In the following section there is an explanation why simulation has been used in this
project.
3.1.1 Dispatching Rules
In a job shop such as the Logistics center, dispatching rules prescribe which component
should be handled by any type of employees and in which priority (Holthaus et al., 1997).
Outbound Logistics uses FIFO (First In First Out) rule. Researchers have shown that FIFO's
performance is poor on flow time factors and good on maximum flow time (Philippom, 2000).
FIFO has been an efficient tool for the Logistics center for minimizing the components'
average flow time (Jayamohan, 2000). Customers' satisfaction is the final factor that
determines the dispatching rules, based according to the due date (Philipoom, 2000).
3.1.2 Workload Control

3. Literature Review
34
Similar to the dispatching, the workload control rules the number of components released is
controlled. Basically, the workload control helps the normal flow of the process without
external dynamics and uncertainties, by controlling the turnaround time (Soepenberg et al.,
2012). In many case, employees in the outbound Logistics engage Order Review and Release
tactics in order to meet the customer's satisfaction while failing the FIFO rules (Philipoom et
al., 1999).
3.1.3 Manpower
Extreme focus has been given to the availability and capacity of manpower in the process.
Manpower is a very significant factor determining the normal process flow in a job shop.
Amin Sahraeian (Sahraeian, 2012) developed and used a mathematical optimization model
for determining the resources to minimize the total competition time for production planning
using linear programming.
In cases of unexpected disruptions that may occur in real life Logistics services, rescheduling
is critical to minimize the impact on performance. Ketrina Katragjini (Katragjini et al., 2013)
generated and used three types of disruptions in a flow shop. For the context of her research
she developed rescheduling algorithms aiming to establish a standard framework and
proposing rescheduling methods that seek a good trade-off between schedule, quality and
stability.
Cannel (Cannel et al., 2004) in his book enhances the importance of human's management in
the overall productivity, by proposing a complete set of human's strategies including human
flows, policies, trainings, personnel's involvement etc.
3.2 Performance Metrics and Key Performance Indicators
Significant amount of attention has been given in the study of Performance Metrics and Key
Performance Indicators regarding to Logistics processes. In order to gain a deeper
understanding and define the KPIs corresponding to the case in question several scientific
papers have been studied.
Krakovics, Leal and others (Krakovics et al. 2008), proposed that KPIs should be process
oriented rather than functional oriented in order to evaluate the actual effectiveness in terms
of customers’ needs. Process oriented KPIs have been identified for this research as well.
In their article Mentzer and Kornad present performance measurement practices in terms of
efficiency and effectiveness (Mentzer et al. 1991). Byrne and Markaham’s article focus on
quality and the conceptual treatment of performance indicators for various dimensions of
logistics (Byrne et al. 1991). Customer service is also a significant aspect that should become
measurable when assessing the performance of Logistics processes. La Londe, Cooper and
Noordewier (La Londe et al. 1988) have conducted surveys among shippers, carrier and
warehouse executives in order to come up with certain customer service metrics. The
previously mentioned articles have been studied and valuable information has been used for
the conceptualization of the performance metrics.
Several other articles have been studied to make the definition of performance clear and
straight. Clarke (Clarke 1991) in his study determines which performance indicators are
appropriate for measuring productivity whereas Yavas, Luqani and Quraeshi (Yavas et al,
1989) provide information on efficiency measurements.

3. Literature Review
35
Finally findings from literature have been used in order to come up with methods of
measuring the performance in Logistics centers. Read and Miller (Read et al, 1990) studied
quality in logistics assessing samples from firms on consultant’s mailing list. The end result of
the study was a gap between the attention that is given to the Logistics’ quality and the
metrics that are actually used. Quality metrics such as on time delivery, zero defects,
employee awareness of quality importance, employee education etc. are some of the
performance metrics that have been studied and used in this research. Gassenheimer,
Sterling and Robicheaux (Gassenheimer et al. 1989) approached the performance
measurement by a factor analysis. Finally, Cooper’s, Browne and Peters (Cooper et al. 1992)
study focused certain performance indicators resulting in significant variations in logistics
efficiency depending on the respective performance indicators used.
Performance measurement is the basic step towards process improvement. Over the past few
years significant developments have been made regarding to the supply chain performance
measurement. A variety of approaches and techniques have been used targeting on different
goals in various companies.
A balance scorecard is introduced by Bhagwat and Sharma (Bhagwat et al. 2007) in small and
medium sized companies. The paper proposes a quantitative approach and tools such as
information systems, cost management, improvement systems and multi criteria decision
support for the logistics chain. Martinsons et al, 1999 have created a framework for
measuring the performance of information systems and the interface between IT
implementation, Supply Chain Integration and Supply Chain Performance. Muchiri et al
(Muchiri et al. 2010) suggested a conceptual framework for the alignment of the key
performance indicators with the company’s objectives. A definition of performance
measurement system is introduced by Neely (Neely et al. 1996) and studied structured
processes for their definition.
Pinheiro (Pinheiro de Lima et al. 2009) suggested a process for the integration of operations
strategy to the design of operations performance measurement systems. Xu (Xu et al. 2009)
presented the factors that affect the supply chain performance evaluation by developing a
model based on Rough Data Envelopment Analysis.
3.3 Lean Six Sigma
KLM Engineering & Maintenance has adopted Lean Six Sigma approach in the company’s
philosophy. The combination of Lean Manufacturing and Six Sigma is proven a successful tool
for the company’s businesses and is implemented in all different kinds of departments and
processes including the Logistics. This section presents Lean Six Sigma, its principles and
practices in companies the aim in process improvement within their businesses.
Lean Manufacturing
Lean Manufacturing includes guiding principles towards reaching the company’s goals and
practical tools and techniques that can lead to these objectives (Shah et al. 2007). Shah
(Shah et al. 2007) managed to make a concrete definition after an extensive literature
regarding to various descriptions of Lean Manufacturing “Lean Production is an integrated
socio technical system whose main objective is to eliminate the waste by concurrently
reducing or minimizing supplier customer and internal variability”.
From the company’s perspective Lean Manufacturing principles strive to remove non value
adding activities so as to maximize the value for the company and the end customer. Ohno

3. Literature Review
36
(Ohno 1988) made a list of the types of waste that Lean Manufacturing aims to remove from
the company’s processes. The list above is used for the purposes of the research in order to
identify potential waste and bottlenecks in the outbound process in the Logistics center in
KLM Engineering & Maintenance.
Transportation: unnecessary transportation of components
Inventory: buffers with components waiting for the next step in the process
Motion: unnecessary movement of employees in the working space
Waiting: unnecessary waiting of employees to start the next step in the process
Over processing: unnecessary/ extra steps
Over production: completing more components than the trucks capacity (often
caused by speed in process resulting defects)
Defects: damaged component, missing data, missing/incomplete paperwork
The main principles of Lean manufacturing proposed by Womack (Womack et al. 1996)
include:
Defining value
Identifying the value stream
Making the value adding activities flow
Transforming processes into pull
Pursuing perfection by continuous improvement
The aforementioned principles are adjusted in the case of KLM Engineering & Maintenance
and combined with the appropriate tools compromise the main approach for the outbound
process' improvement.
Quality management, pull production, preventive maintenance and human resources
management are according to Cua (Cua et al., 2001) ad Shah (Shah et al., 2008) the basic
blocks that Lean Manufacturing can be implemented. Just in time production, turnaround
time reduction, maintenance improvement and cost reduction are certain practices that help
identify and remove the waste in the processes.
The application of these practices requires the use of proper tools, methods and techniques.
The Value Stream Mapping (Hopp et al., 2004) (Akbulut- Bailey et al, 2012) is one the many
tools to define the adding value stream in the process and identify waste within the
processes.
Six Sigma
Six Sigma focuses mainly on identifying the sources of variability and reducing them from the
process (Linderman et al., 2003). In contrast with Lean manufacturing it concerns a method
of variability reduction rather a strategy towards improvement (Hopp et al., 2004). The
failure rate of the company’s performance should be defined as all parts that are outside the
specification limit of six standard deviations (sigma) from the mean, as the name Sig Sigma
denotes, meaning that there may be 1 defect per 3.4 million parts.
Schroeder (Schroeder et al. 2008) describes Six Sigma as “an organized, parallel-meso
structure to reduce variation in organizational processes by using improvement specialists, a
structured method and performance metrics with the aim of achieving strategic objectives”.

3. Literature Review
37
Six Sigma applications require the support of a parallel-meso structure team of specialists
that operate outside of the company’s normal business. The Blackbelts compromise the full
time improvement specialists, which are trained in the Six Sigma approach focusing on
continuous improvement.
The Six Sigma method includes five steps known as Define, Measure, Analyze, Improve,
Control (DMAIC), aiming at identifying the root cause of problems in the company’s operation
using quality tools and statistical process control. Several performance metrics that can be
either customer or financial oriented.
Lean Six Sigma in KLM Engineering & Maintenance Logistics process
KLM Engineering & Maintenance employed teams of Blackbelts that operate in the core
business searching ways to reduce variability and create stability in quality and turnaround
time while removing the defects and waste in the overall process. As Lean Six Sigma
proposes the performance measurement is based on the P95 measure which means the
95%-percentile, the value below which 95% of all observations fall. The company attempts to
define the extreme values, solve the root causes and thus reduce the span, creating stability
and reliability in the process.
The main objective of Lean Six Sigma is to maximize the customer value, by measuring the
quality performance and turnaround time. The same principle applies to the case in question.
In order to achieve that for the outbound Logistics process waste removal should be
performed and variability in the quality should be eliminated.
3.4 Algorithmic Approach for Personnel Scheduling
Santoso and others (Santonso et al., 2003), produce a formal problem statement of the
supply chain’s strategic planning and develop algorithms for its solution. Strategic planning includes configurations regarding number, location, capacity etc. For the process’
improvement strategic planning is a very critical factor. The scheduling problem in job shops can be approached by heuristics for the process optimization in terms of turnaround time and
cost minimization (Jagabandhu et al, 1996). In their paper regarding the algorithmic approach for scheduling in flow shops, Jagabandu and others propose a genetic algorithm
that is compared with a multi criterion heuristic, where alterations are made to initialize
subpopulations for scheduling. The outbound Logistics process can be considered as a n Job, m machine process flow, where “job“ is the task that needs to be completed, is described by
the type of employee and “machine” is the number of employees per task (Campbell et al., 1970). Campbell and others describe in their paper a simple algorithm that solves the n job,
m machine problem. The problem refers to finding the best solution in tasks’ scheduling in
flow shops. In their work Ho and others (Ho et al., 1991) present an improved heuristic for solving the same flow shop scheduling problem. Basic thinking and algorithmic theories have
been used from the literature mentioned above to create and develop the algorithm that is developed in the context of this report.
3.5 Simulation
Analytical evaluation is a very complex task to perform in real world systems (Law et al.
2000). This is also the case for the future state of the outbound Logistics process, as its
implementation and normal flow requires a lot of time. Input requirements, inspection and
the employees’ motivation and training to the new standards are too complex to give reliable
results. This is the reason why it is decided to study the outbound Logistics process by means
of simulation (Law et al., 2000). In the paper of Shannon (Shannon, 1975), he introduced a
process of designing a model of a system and conducting experiments with this model for the

3. Literature Review
38
purpose either of understanding the behavior of the system, measuring its performance or
evaluating strategies in terms of predefined criteria and objectives.
In several cases Lean Six Sigma can employ a simulation tool to approach process
improvement (Fowler et al., 2004). Simulation can be used in several ways for the benefit of
Lean strategy, such as problem identification, evaluation of improvement strategies, and their
impact prediction (Adams et al., 1999). Some of the benefits of using simulation are its
ability of combining measurements of financial, operational and customer satisfaction
indicators for the same analysis (Ferrin et al., 2005). The reasons of employing simulation
software for enhancing the Lean process are according to Standridge and Marvel (Standridge,
2006) the following:
Structural and random variation must be addressed
Reliable collection of data must be analyzed to understand the random nature of the
system
Interaction between systems must be assessed
Validation of the Future state is very essential
Alternatives and improvement suggestions in the future state can be considered
For the purposes of the research it has been introduced a framework for combining the Lean
Six Sigma approach with the application of simulation tool in order to measure the process’
performance, identify defects and propose improvement alternatives. First the respective
algorithm that simulates the process and solves the personnel’s capacity problem, based on
resources’ minimization (turnaround time, cost) is created. Afterwards, historical data and
measurements and alternative scenarios are used as input for the algorithms implementation
in excel. The formulas created give the completion time and the number of components in
buffers, combined with cost calculation. The figures mentioned are the determinant factors
for the best alternative’s selection.
3.6 Conclusion
To conclude, this Chapter presented the literature and important knowledge obtained from
previous researches. In order to come up with a certain approach towards process'
improvement the outbound Logistics has been correlated to a job shop model. Priority rules,
workload control and manpower described in literature have been related to the project.
Methodologies for performance metrics' definition have been found in literature which helped
identify and calculate the required Key Performance Indicators. Lean and Six Sigma theories
have been studied and important techniques of their application have been used for the
research's development. Finally, several projects and case studies in which algorithmic
approaches had been developed for the personnel's scheduling have been found. The
research concerning the algorithms' development and application of simulation for process'
improvement justifies the uses of a similar method for the project in question. The following
table (Table 1) summarizes the useful literature and theories studied and applied for the
project's execution.
Table 1: Literature Review
Category Title Author Year
Job Shop Model: Theory Planning and Scheduling in Manufacturing and Services
Pinedo, M. L. 2005
Scheduling Problem:
Optimization Objectives
An effective hybrid optimization
approach for multi-objective flexible job-shop scheduling
Xia, W. & Wu, Z. 2005
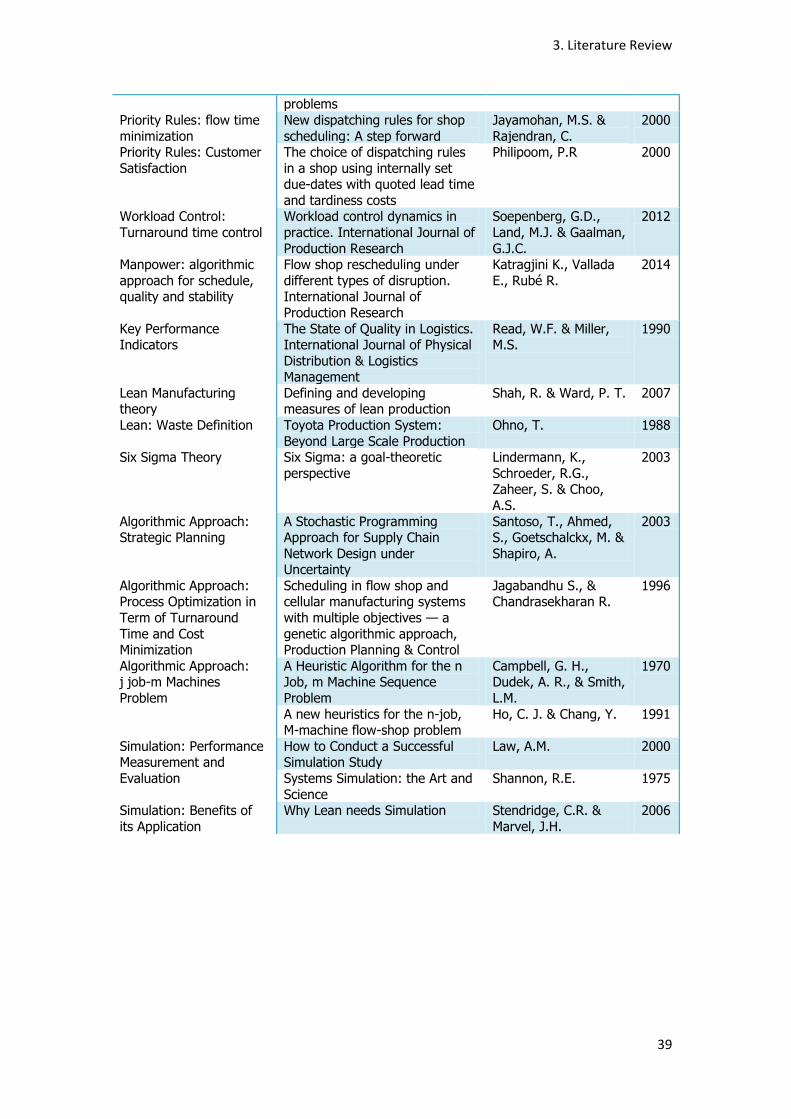
3. Literature Review
39
problems
Priority Rules: flow time
minimization
New dispatching rules for shop
scheduling: A step forward
Jayamohan, M.S. &
Rajendran, C.
2000
Priority Rules: Customer
Satisfaction
The choice of dispatching rules
in a shop using internally set due-dates with quoted lead time
and tardiness costs
Philipoom, P.R 2000
Workload Control:
Turnaround time control
Workload control dynamics in
practice. International Journal of
Production Research
Soepenberg, G.D.,
Land, M.J. & Gaalman,
G.J.C.
2012
Manpower: algorithmic
approach for schedule, quality and stability
Flow shop rescheduling under
different types of disruption. International Journal of
Production Research
Katragjini K., Vallada
E., Rubé R.
2014
Key Performance Indicators
The State of Quality in Logistics. International Journal of Physical
Distribution & Logistics Management
Read, W.F. & Miller, M.S.
1990
Lean Manufacturing theory
Defining and developing measures of lean production
Shah, R. & Ward, P. T. 2007
Lean: Waste Definition Toyota Production System:
Beyond Large Scale Production
Ohno, T. 1988
Six Sigma Theory Six Sigma: a goal-theoretic
perspective
Lindermann, K.,
Schroeder, R.G., Zaheer, S. & Choo,
A.S.
2003
Algorithmic Approach: Strategic Planning
A Stochastic Programming Approach for Supply Chain
Network Design under Uncertainty
Santoso, T., Ahmed, S., Goetschalckx, M. &
Shapiro, A.
2003
Algorithmic Approach: Process Optimization in
Term of Turnaround
Time and Cost Minimization
Scheduling in flow shop and cellular manufacturing systems
with multiple objectives — a
genetic algorithmic approach, Production Planning & Control
Jagabandhu S., & Chandrasekharan R.
1996
Algorithmic Approach: j job-m Machines
Problem
A Heuristic Algorithm for the n Job, m Machine Sequence
Problem
Campbell, G. H., Dudek, A. R., & Smith,
L.M.
1970
A new heuristics for the n-job, M-machine flow-shop problem
Ho, C. J. & Chang, Y. 1991
Simulation: Performance Measurement and
Evaluation
How to Conduct a Successful Simulation Study
Law, A.M. 2000
Systems Simulation: the Art and
Science
Shannon, R.E. 1975
Simulation: Benefits of
its Application
Why Lean needs Simulation Stendridge, C.R. &
Marvel, J.H.
2006

3. Literature Review
40

4. Data Analysis of the Current Outbound Logistics Process
41
4. Data Analysis of the Current
Outbound Logistics Process This chapter describes the results taken from the data analysis, which have been necessary
for measuring the performance of the outbound Logistics and for gathering the data needed
for the calculation model. The first section 4.1 discusses the most critical KPIs that have been
identified during the research together with the company’s supervisors and the methodology
that has been used in order to collect reliable and consistent data. The following section 4.2
describes the system that has been used to track the components in all the information
systems. Section 4.3 presents the measurements’ results regarding the important KPIs and
finally section 4.3 concludes the chapter.
4.1. Key Performance Indicators Definition and Methodology
It had been very essential for the next steps research to have a clear definition of
performance metrics and the Key Performance Indicators that played an important role in the
Logistics center. Some of them have been predefined by the department’s specialists.
However, further research and study has been made in the contexts of the case in question,
due to inadequate information regarding to performance measurements, to the process
capability. This task has made the performance analysis more accurate and related to the
company’s objectives.
The goal of improving the outbound Logistics process within the Logistics center of KLM
Engineering & Maintenance is to come up with a process that performs better in terms of
quality, turnaround time and cost. Changes in the process flow, the standard instructions and
personnel scheduling would facilitate in meeting the requirements over the defined KPIs. The
new process design and the instructions will not only benefit the quality of the outbound
operations but also facilitate the process’ speed. Finally, roster’s rescheduling will only
contribute in speeding the process and meeting the turnaround time requirements.
4.1.1 Quality Definition: Critical Buffer Level
The goal of the research had been first to improve the quality of the outbound process. That
means stabilizing the quality’s performance and turnaround time. As it has been mentioned in
Chapter 1, the factor defining the process' performance in terms of quality at the end of the
day indicates the number of uncompleted components that are place in Buffer 2. The Critical
Buffer Level is the KPI that has been used for this research. Since the turnaround time has
already been defined based on the contracts and the touch times have been measured, the
personnel's daily capability can also be calculated. The employee that determines the
components' release from buffer 2 is the repair administrator, therefore his/her capability is
the one of great importance. Taken into consideration that 390 minutes is the pure working
time per shift and 30 minutes per component is the touch time for a repair administrator, this
means that on average 13 components can be processed per shift. Assuming that at least 2
employees are working per day, then 26 components per day is the minimum number of
components that can be completed at the end of the day. Leaving more than 26 components
in buffer 2 for more than 48 subsequent hours would mean that even if no other components
will be added in the meantime, the Logistics center will fail to deliver the entire batch on time
to the repair vendors. In contrast taken into consideration the First In Fist Out priority, the 26
or less components in buffer 2 would be the first to be handled in the next shift and be
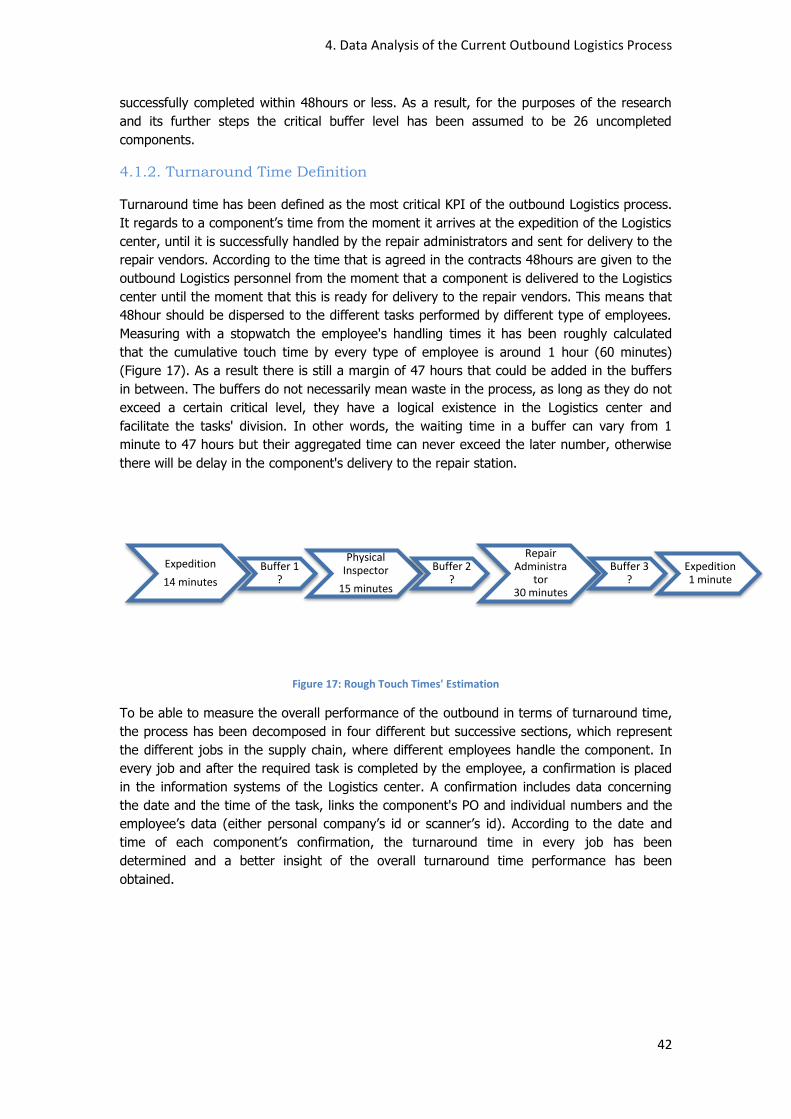
4. Data Analysis of the Current Outbound Logistics Process
42
successfully completed within 48hours or less. As a result, for the purposes of the research
and its further steps the critical buffer level has been assumed to be 26 uncompleted
components.
4.1.2. Turnaround Time Definition
Turnaround time has been defined as the most critical KPI of the outbound Logistics process.
It regards to a component’s time from the moment it arrives at the expedition of the Logistics
center, until it is successfully handled by the repair administrators and sent for delivery to the
repair vendors. According to the time that is agreed in the contracts 48hours are given to the
outbound Logistics personnel from the moment that a component is delivered to the Logistics
center until the moment that this is ready for delivery to the repair vendors. This means that
48hour should be dispersed to the different tasks performed by different type of employees.
Measuring with a stopwatch the employee's handling times it has been roughly calculated
that the cumulative touch time by every type of employee is around 1 hour (60 minutes)
(Figure 17). As a result there is still a margin of 47 hours that could be added in the buffers
in between. The buffers do not necessarily mean waste in the process, as long as they do not
exceed a certain critical level, they have a logical existence in the Logistics center and
facilitate the tasks' division. In other words, the waiting time in a buffer can vary from 1
minute to 47 hours but their aggregated time can never exceed the later number, otherwise
there will be delay in the component's delivery to the repair station.
Figure 17: Rough Touch Times' Estimation
To be able to measure the overall performance of the outbound in terms of turnaround time,
the process has been decomposed in four different but successive sections, which represent
the different jobs in the supply chain, where different employees handle the component. In
every job and after the required task is completed by the employee, a confirmation is placed
in the information systems of the Logistics center. A confirmation includes data concerning
the date and the time of the task, links the component's PO and individual numbers and the
employee’s data (either personal company’s id or scanner’s id). According to the date and
time of each component’s confirmation, the turnaround time in every job has been
determined and a better insight of the overall turnaround time performance has been
obtained.
Expedition
14 minutes
Buffer 1 ?
Physical Inspector
15 minutes
Buffer 2 ?
Repair Administra
tor 30 minutes
Buffer 3 ?
Expedition 1 minute

4. Data Analysis of the Current Outbound Logistics Process
43
4.1.4 Data Collection Methodology
The data collection included the action of certain measurements in the process. Some
measurements have been performed in the real work floor by means of following the
components' flow for 30 days. For this task, extra personnel had been hired so that the
collection of the data could be reliable, consistent and would not intervening with the normal
process. They have been working in a daily basis in shifts as the existing personnel does. One
extra personnel per station within the Logistics center (Expedition, Physical Inspection, Repair
Administration Pool, FE and CLA) has been accompanying the employees. The external
observers, have completed checklists and performed scanning in the right points and the
right time. The checklists are cited in the Appendix D Data Measurements (Table 24 and
Table 25). The role of the researcher has been to supervise the task and participate when
needed, collect the forms including the required data and inserting them in an excel file at
the end of the day. At the end of the measurement period, reports have been created and
presented to the management and the employees, demonstrating graphs through the results'
statistical analysis of approximately 353 unserviceable components.
In order to make the entire outbound process measurable, it has been divided into four main
areas described by the different type of employees that handle the component in the
respective station and the buffers in between, where the components are left before
proceeding to the next employee. The following chart (Figure 18) represents the stations
where the measurements have taken place and the respective data collection method have
been used. The scope of this research was narrowed to the second till fifth station; however,
the measurements have been performed for the overall process. The checklists have been
created in order to measure the quality of the components that are delivered in the Logistics
center. The results from the quality measurements have been compared to the tracking data
so as to see the impact of the components' quality to the overall handling time and
turnaround time. The checklists and their description can be found in the Appendix D Data
Measurements. During the period of one month several components have been measured in
person (467), however only a part of them could be traced in the tracking system and give
reliable results, because of the inconsistent scanning actions. The percentages in Figure 19
are the representative sample of the overall components that have been measured. However,
1: Expedition
Tracking
2: Buffer 1
Checklist
Tracking
3: Physical Inspector
Checklist
Tracking
3.1-3.2:Buffer 2
Tracking
4: Repair Administrator
Checklist
Tracking/Stopwatch
5: Buffer Tracking
6: Expedition Tracking
Figure 18: Outbound Logistics Measurement Points TAT

4. Data Analysis of the Current Outbound Logistics Process
44
the plots shown in Figures 2-23 calculate the measured components' timings that have been
found in the Tracking system.
4.2 Tracing by IT Systems
Several information systems like SAP, Tracking and Scarlos have been used in order to follow
the components in the supply chain of KLM E&M. For the needs of the research the tracking
system has been mainly used in order to count the touch time of every type of employee in
every task for every type of component. Information about one year's tracking data has been
exported from the system and statistical analysis has been performed to present the required
graphs for the process' performance.
4.3 Data Analysis Results of the Current Outbound Logistics
Process
The previous section described the data collection methodology; what kind of data have been
gathered, the means and sources of their collection. This section presents the measurements'
results and their detailed analysis. Several graphs that derive from an analysis in Minitab
using a combination of historical data and measurements are included together with
cumulative tables regarding the quality and handling times.
4.3.1 Quality: Defects
Figure 19 shows in a general map of the outbound Logistics the percentages of incurred
issues of the measured components in every critical process step. The issues mentioned
below are defects, that means waste that influences the process' quality (failed priority rules,
lack of standardization etc), shown in blue and external quality issues (missing data/warning
sticker/ reason of removal etc., wrong data/packaging etc.), shown in red. As it has been
mentioned, quality KPI cannot be quantified, nevertheless the percentages scored from the
measurements, shown in the figure below (Figure 19) have shown inefficient quality that can
undermine the process' performance. Section 4.3.4 quality's impact on the employees'
handling time is calculated, providing a quantitative description of the importance of quality in
the process.

4. Data Analysis of the Current Outbound Logistics Process
45
Figure 19: Occurred Issues in the Outbound Logistics (N=467 components)
4.3.2 Turnaround Time
Turnaround time is a very critical KIP for the outbound process. Data from the tracking
system in combination with stopwatch provide information regarding to the employees'
handling times and the waiting times in the buffers between. As it has been mentioned, it
was impossible to trace every component during that period of time. Missed scanning during
especially during evening shifts, unconsciousness and other reasons have given only a part of
components' measurements from the tracking system.
Time series plots have been created in Minitab to show the waiting times and touch times of
every task in the outbound Logistics process (Figures 20-23). According to Six Sigma, the
time series plot is a very useful tool that can give an overview of the components' measured
timings (Lindermann et al., 2003). Several features have been defined by the representation
of data in time series plot and can identify the bottlenecks within the process (George et al.,
2005). These features include:
Outliers: values that are not consistent with the rest data
Trends: general tendencies in movement or direction
Periodicities: recurrences at regular intervals
The following tables (Table 2 -Table 5) display the summary statistics of the turnaround times
between the measurement points in the outbound Logistics. The number of components
Customer
Expedition
Buffer 1 Tracking sticker 5%
Date Label 75%
FIFO
Physical Inspection
Data 26%
Warning Sticker 11%
Reason of Removal 11%
Code Plate 10%
Packaging 3%
Others (Wrong Lane) 4%
Buffer 2 FIFO
No Data
Repair Administration Reason of Removal 9%
Warranty Conversion 5%
Data 2%
Other (ICT, facilities etc.) 13%
Buffer 3
Expedition
Repair Vendor

4. Data Analysis of the Current Outbound Logistics Process
46
measured is very important figure to have an overview of the data's reliability and
consistency. The mean turnaround time is presented in minutes for the tasks performed and
in hours for the waiting times in the buffers, the differentiation of timings in minutes and
hours can enhance the excess time of components spent in the buffers. The standard
deviation presents the variation or dispersion of collected data.
Table 2: Summary Statistics of Expedition
N (#of components) 773
Mean turnaround Time (minutes) 96.93
Standard Deviation 153.5
Adjusted Average 95.910
Figure 20: Time Series Plot of Physical Inspector's Waiting Time (Buffer 1)
Table 3: Summary Statistics of Buffer 1
N (#of components) 302
Mean turnaround Time (hours) 24.15
Standard Deviation 30.36
Adjusted Average 27.366
Figure 21: Time Series Plot of Physical Inspector's Touch Time

4. Data Analysis of the Current Outbound Logistics Process
47
Table 4: Summary Statistics of Physical Inspector
N (#of components) 312
Mean turnaround Time (minutes) 11.55
Standard Deviation 8.175
Adjusted Average 12.794
Figure 22: Time Series Plot of Repair Administrator's Waiting Time (Buffer 2)
Table 5: Summary Statistics of Buffer 2
N (#of components) 67
Mean turnaround Time (hours) 28.93
Standard Deviation 51.63
Adjusted Average 11.185
Figure 23: Time Series Plot of Repair Administrator's Touch Time plus Buffer 3
Table 6: Summary Statistics of Repair Administrator
N (#of components) 110
Mean turnaround Time (minutes) 31.47
Standard Deviation 31.73

4. Data Analysis of the Current Outbound Logistics Process
48
Adjusted Average 22.452
Many conclusions have resulted from the time series plots that are presented above. First of
all, it is very important to note the insufficient data that have been collected. Despite the
inconsistency and the huge shortage of the data for the measured stations, the outliers and
trends in the graphs are obvious.
Employees' Touch Times
The touch times that are presented in the graphs above (Figure 20 and Figure 23) have
shown several outliers. Outliers concern to the observations that are inconsistent with the
rest data set (Barnett et. al., 1991). These abnormalities can be explained by different factors
such as wrong scanning actions due to human errors, IT system errors and failed
configurations to the systems. Therefore, the high peaks can be removed from the data and
not be taken into consideration.
The trends in the graphs are not always consistent, meaning that the touch times can never
be stable. For big deviations from the average touch time or remarkably large turnaround
times imply that certain types of components require extra handling due to the issues
mentioned above and/or there has been a defect in the system slowing down the task
completion. Smaller deviations in touch times can be justified by the difference between the
employee's productivity and motivation to work. Because of the nature of the measured
element, the periodicities of the timing presented in the graph are meaningless and there is
not much to be explained about them.
The touch times statistics for the physical inspectors have presented a small standard
deviation (8.175), which can be explained by some of the existing outliers. The physical
inspector's measured touch times are much closed to the expected mean value (11.55
minutes). Therefore, the adjusted average (12.794 minutes), which represents the average
touch time after the outliers' removal is very closed to the mean.
In contrast, the repair administrator's standard deviation has a higher value (31.73); this can
be explained by the fact that fewer measurements (110 components) with more outliers have
been derived from the data analysis. As a result, the adjusted average (22.452 minutes) of
the repair administrator’s touch time deviates almost 10 minutes from the measured mean
(31.47 minutes).
Waiting Times in Buffers
As far as the waiting times are concerned, the outliers describe a complete different situation
in the Logistics center. The waiting times are basically the time a component is placed in the
buffers, therefore, the outliers which show long times in the buffer can either mean excess
amount of workload delivered in the outbound Logistics, or lack of personnel's capacity to
work with the existing workload, or the combination of the two. Periodicities can also be seen
in the graph, however, their existences do not necessarily have a negative impact in the
process. From the periodicities the workload can be determined, since more workload means
more time is needed to complete it and thus more buffering time for the uncompleted
workload. In other words one can see the intervals when excess workload should be
expected. The main conclusion from the time series plots of the buffer is that they have
presented long waiting time in the buffer that most of the times exceeds their predefined
turnaround times.

4. Data Analysis of the Current Outbound Logistics Process
49
In the statistical tables of the buffers (Table 3 and Table 4), different observations have been
concluded. First, the standard deviation (30.36) of buffer 1 has shown that the data deviate
from the mean value (24.15 hours). This has been explained by the big outliers presented in
the time series plots. Relatively small deviation among mean and adjusted average value
(27.366 hours) has been presented when then outliers have been removed. However, the
same does not apply for the buffer 2. The very small number of data (67 components) has
resulted many extreme values and big outliers and therefore huge standard deviation
(51.63). Therefore, a significantly smaller adjusted average (11.185 hours) is more
representative figure for the waiting time in buffer 2.
4.3.3 Quality: Critical Buffer Level
Another feature that has been calculated is the critical buffer level that provides an overview
of the process' performance by indicating the number of uncompleted components in the end
of the day. The critical buffer can undermine the process' quality as its existence and
overloading implies waste within the process. The following graph presents the critical buffer
level. A predefined critical level of 26 uncompleted components for two subsequent days (48
hours) can identify a problematic process flow, meaning that the Logistics Center is unable to
meet the turnaround time requirements and fails on time delivery. The most important
conclusion from the graphical representation (Figure 24) of the critical buffer level during last
year is that most of the times the number of uncompleted components exceeds the
predefined KPI. It is logical that there are no standard tendencies in same directions, in
contrast the are several steep changes, which explain the immediate buffer release to catch
up the turnaround time.
Figure 24: Time Series Plot of Critical Buffer Level
4.3.4 Quality's Impact on Turnaround Time
The most commonly occurred issues have been categorized, listed and presenting in the
following table. For every defect- issue the percentage of occurrence, its impact on the
process and its impact on the average touch time per employee has been defined by the
measurements. The following tables (Table 7 and Table 8) summarize the aforementioned
results for the physical inspector and repair administrator.
Table 7: Defects' Impact on Physical Inspector's Touch Time
0
10
20
30
40
50
60
70
80
1
13
25
37
49
61
73
85
97
10
9
12
1
13
3
14
5
15
7
16
9
18
1
19
3
20
5
21
7
22
9
24
1
25
3
26
5
27
7
28
9
30
1
31
3
32
5
33
7
34
9
36
1

4. Data Analysis of the Current Outbound Logistics Process
50
Defect Percentage Impact Impact on Average
touch time
Missing Data 26% Over processing No significant impact
Missing ID/Code Plate
11% Over processing No significant impact
Missing Reason of
Removal/Complaint
11% Over processing No significant impact
Missing Warning Sticker
10% Safety 0:13:38- 0:12:00= 0:02:24
Wrong Packaging 3% Safety Space & Cost
saving
0:21:06- 0:12:00= 0:09:06
Other (Wrong
Lane)
4% Over processing 0:15:13- 0:12:00=
0:03:13
Table 8: Defects' Impact on Repair Administrator's Touch Time
Defect Percentage Impact Impact on Average touch
time
Missing Reason of Removal/Complaint
9% Over processing 0:32:23-0:22:30=
0:09:53
Warranty
Conversion
5% Over processing 0:36:04-
0:22:30= 0:13:34
Missing Data 2% Over processing 0:43:00-
0:22:30=
0:20:30
Other (ICT,
facilities, talent)
15% Quality
Delay
0:46:24-
0:22:30= 0:23:54
The following figure (Figure 25) shows the most common defects and their percentages
based on their scored impact on the employees' mean touch time. From the chart below it
can be derived that missing warning sticker has the small impact on time, whereas missing
reason of removal and warranty conversion can cause longer delays in the process. This
analysis has proved the importance of accepting components with the required quality in
order to have a normal process flow and no delays.

4. Data Analysis of the Current Outbound Logistics Process
51
Figure 25: Pire Chart of the Defects' Impact on Mean Touch Time
4.4 Conclusion
The data analysis has been the most time consuming task performed for the research. After
having defined the Key Performance Indicator, the main goal of the data analysis has been to
measure the performance of the outbound Logistics and identify the problematic areas that
concern both quality and the turnaround time. For the turnaround time, the 48 hours defined
in the contracts can be divided in the touch times of the tasks and the waiting times in the
buffers between them. Another attribute has been added and relates mostly to the quality
and relates to the overall turnaround time is the critical buffer level described by the number
of uncompleted components still placed in buffer 2 at the end of the day. From literature the
critical KPIs have been defined and calculated, thereafter a data collection plan has been
developed. The plan included measurements in the actual working field by actively
participating in the process and joining shifts. Reliable data has also been retrieved by the
tracking system. Finally the figures that have been presented above show the process' poor
performance and the bottlenecks have been finally identified. The main conclusion of the data
analysis is that the outbound Logistics most of the times fails to handle the complete
workload on time, and this can be justified in various ways. Excess workload, lack of
personnel's capacity to complete the expected workload, low personnel's productivity,
components with defects that require extra work or inefficient process steps and in general
waste are some of the findings from the performance measurement and observations during
its execution. The results of the data analysis and the presentation of the current process'
performance have been used as milestones for developing a certain set of solutions that are
presented and elaborated in the following chapter.
2%
11% 4%
12%
17% 25%
29%
Defects' Impact on Mean Touch Time
Missing Warning Sticker
Wrong Packaging
Other (Wrong Lane)
Missing Reason of Removal/Complaint
Warranty Conversion

4. Data Analysis of the Current Outbound Logistics Process
52

5. Findings and Set of Solutions for the Improvement of the Outbound Logistics Process
53
5. Findings and Set of Solutions
for the Improvement of the
Outbound Logistics Process After the literature review, action research has been performed. The Kaizen event is one
action tool that according to Lean manufacturing can be used in order to improve the overall
Logistics process (Akbulut-Bailey, et al. 2012). Active participation and valuable input from
have been given in the decision making concerning the future state. This task has been
performed to develop a completely new design of the outbound Logistics. Based on the Lean
strategy (Cua, et al.2001), (Shah, et al. 2008), changes have been proposed not only in the
design layout of the Logistics center, but also in the physical process flow of the component
and the personnel scheduling.
5.1 Solutions Overview
The main problem, its causes and their root causes have been defined and presented in the
fishbone diagram in Chapter 1 (Figure 2). The extended data analysis has shown the most
critical bottlenecks that undermine the process’ performance. The most critical factors of the
cause and effect analysis have identified the milestones for the project's initiatives that need
to be taken into consideration towards the improvement of the outbound Logistics. The figure
below (Figure 26) proposes one or more solutions for each factor that can trigger the
process' efficiency and effectiveness. A detailed elaboration and action plans for the
suggested solution as agreed together with the company’s supervisor and management
teams towards improving the process in a more lean way lay in the following sections.
Figure 26: Project's Initiatives and Set of Solutions
•Standard Way of Working
•Future State Design
•Performance Management
Method
•Requirement of the Complete Component
•Workload Material
•System Interface
•Printers Machine
•Schedulling
Man
•Communication
Environment
•Contract Details
Suppliers/
Customers
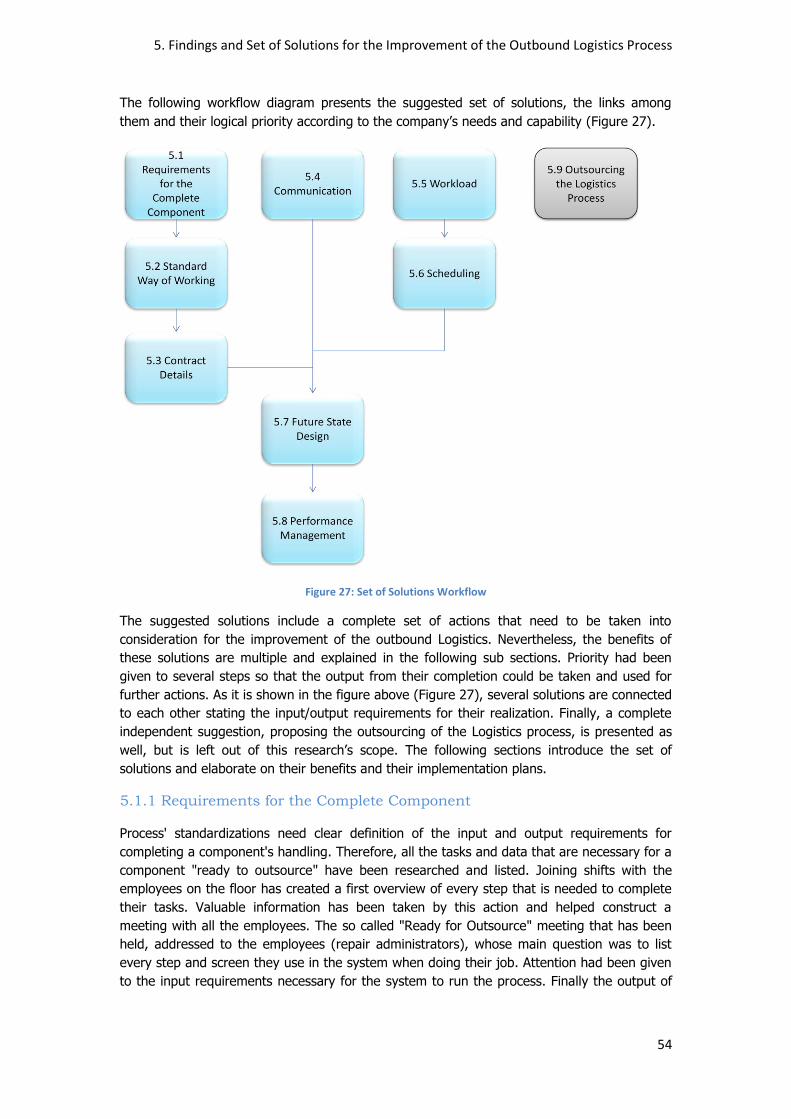
5. Findings and Set of Solutions for the Improvement of the Outbound Logistics Process
54
The following workflow diagram presents the suggested set of solutions, the links among
them and their logical priority according to the company’s needs and capability (Figure 27).
Figure 27: Set of Solutions Workflow
The suggested solutions include a complete set of actions that need to be taken into
consideration for the improvement of the outbound Logistics. Nevertheless, the benefits of
these solutions are multiple and explained in the following sub sections. Priority had been
given to several steps so that the output from their completion could be taken and used for
further actions. As it is shown in the figure above (Figure 27), several solutions are connected
to each other stating the input/output requirements for their realization. Finally, a complete
independent suggestion, proposing the outsourcing of the Logistics process, is presented as
well, but is left out of this research’s scope. The following sections introduce the set of
solutions and elaborate on their benefits and their implementation plans.
5.1.1 Requirements for the Complete Component
Process' standardizations need clear definition of the input and output requirements for
completing a component's handling. Therefore, all the tasks and data that are necessary for a
component "ready to outsource" have been researched and listed. Joining shifts with the
employees on the floor has created a first overview of every step that is needed to complete
their tasks. Valuable information has been taken by this action and helped construct a
meeting with all the employees. The so called "Ready for Outsource" meeting that has been
held, addressed to the employees (repair administrators), whose main question was to list
every step and screen they use in the system when doing their job. Attention had been given
to the input requirements necessary for the system to run the process. Finally the output of

5. Findings and Set of Solutions for the Improvement of the Outbound Logistics Process
55
every step taken had been clearly defined so that after examination and evaluation only
added value actions should exist in the finalized standard way of working.
Putting all the required information into a formal list was very essential for continuing the
process improvement and end up with standards regarding to the way of working and
processing the components (section 5.2). Therefore, standard rules and guiding lines can be
formally reported. The tables with all the data requirements for the components' completion
can be found in the Appendix G Ready for Outsource List (Tables 28-32).
5.1.2 Standard Way of Working
Multiple Value Stream Mapping sessions have been scheduled during the project’s execution.
The goal of the sessions was to come up with new process flows that would help the
personnel meet the quality and turnaround time requirements in more efficient way, avoiding
variations in the performance and thus making the process leaner (Hopp et al., 2004). More
clear and simple tasks for the complicated work of the repair administrators have been
assigned to the personnel. The information for the 'Ready for Outsource" meeting (Section
5.1.1) have been used in order to simplify the repair administrator's tasks while integrating
the IT systems workplaces so as more data could be retrieved with less used screens and
input.
After the IT department of KLM Engineering & Maintenance responsible for the project
mentioned above, have completed the software simplification, then the manager of the
Logistics center can create new working instructions and rules for the employees. The main
outcome of this solution would be to gain extra minutes from the repair administrators' task
and make the process run faster, because less complicated steps would be taken while more
output would be easily retrieved with the least required input.
5.1.3 Contract Details
In section 5.1.1 the input and output requirements for completing a task have been defined.
After processing the necessary data, a list of important requirements has been created.
Therefore, it is very essential that these requirements will be integrated in the contract details
with the customers, so that all the required information will always be available and ready to
be used in order to facilitate the employees work. A standard format should be introduced for
every customer and a single delivery process should be implemented, so that no other
deviations could possibly occur. Thus, no component’s delivery can be completed without
giving every information and data. An example of the Aeroxchange format is presented
above (Figure 28) and should be adopted by every customer of KLM Engineering &
Maintenance.
Client Interface department of KLM Engineering & Maintenance would be accountable for the
immediate communication with the customers. Although new agreements and contract with
the customers is a time and effort consuming task, the benefits that could results from this
action are very essential for the overall process. Given the proposed standardized delivery
format and the software capabilities, the process would become automated and the
percentages regarding to the bad quality performance will be reduced resulting to faster
turnaround time.

5. Findings and Set of Solutions for the Improvement of the Outbound Logistics Process
56
Figure 28: Aeroxchange Format
5.1.4 Communication
Communication is very essential to the improvement of the employees’ performance. For the
case in question, the communication has a double meaning. First, it refers to the bottom up
and up bottom communication of employees with the managers and supervisors. The
frequent physical presence of high managers in the workplace gives a very good example and
caring emotion for the business. Moreover, short daily meetings among supervisors and
employees create solidarity and a good atmosphere where people can share their problems,
thoughts and concerns. Thus, the communication between the employees is facilitated and
therefore, both employees and supervisors can have a mutual understanding and a feeling
that their voices are being heard. Research has shown that the good communication in all
levels of hierarchy can have a significant impact on the employees’ productivity and thus the
process' effectiveness (Darling et al., 2010).
5.1.5 Workload
The workload's definition is very essential for the forecast of the incoming components'
deliveries, so as to assure that there is enough capacity in the Outbound Logistics every day
and in every shift to complete and handle the components within the time constraints. The
process Analysts of the Logistics Center, who have complete access to the systems, are
accountable for creating reports regarding to incoming goods flow. Detailed reports should be
issued frequently and used in multiple ways to predict the workload that is expected in the
Logistics center. The graphs have been created from tracking system's data of the previous
year (Figures 29-31). The workload has been divided and presented for number of
components per month, day and hour for every stream of the Outbound Logistics (Pool, FE,
CLA). The trends presented in the graphs are valuable input for forecasting the busiest
periods where incoming workload could block the normal process flow.

5. Findings and Set of Solutions for the Improvement of the Outbound Logistics Process
57
The entire data set from the tracking system in combination with the quality measurements
in chapter 4.3 have been taken as input for the implementation of the process' simulation in
the following chapter.
Figure 29: Monthly Deliveries in the Outbound Logistics
The graph above (Figure 29) presents that the monthly workload. As it can be seen, the
monthly workloads of Pool and FE components are relatively stable during the year. However,
for CLA components, the data show that the busiest months are mostly January, April, May,
June and December. This can be explained by the fact that these months are also the busiest
months in operating flight due to holidays, therefore, more aircrafts require maintenance and
tests and consequently more unserviceable components are detected and sent to KLM
Engineering & Maintenance.
Figure 30: Weekly Deliveries in the Outbound Logistics
Similar analysis has been performed for the daily workload as well. The three components'
streams present similar trends. The most obvious outcome from the graph above (Figure 30)
is that weekdays are the busiest days during weeks, while less components should be
expected in the outbound Logistics. Due to the fact that most of the aircrafts' maintenance is
scheduled during weekdays and more personnel is working, the more unserviceable
0
500
1000
1500
2000
1 2 3 4 5 6 7 8 9 10 11 12
Total Components per month
July 2014 - June 2015
CLA
Pool
FE
0 1000 2000 3000 4000
Total Components per weekday
July 2014 - June 2015
CLA
Pool
FE

5. Findings and Set of Solutions for the Improvement of the Outbound Logistics Process
58
components are delivered in the Logistics center during these days. Based on this outcome
several scheduling scenarios have been created and tested in chapter 6.
Figure 31: Hourly Deliveries in the Outbound Logistics
The final analysis of the workload is presented in graph 31. This includes the hourly workload
of unserviceable components. Useful information from this graph has also been used for the
scenarios creation and evaluation of whether evening shifts are necessary. The most
significant outcome from the analysis is that the peak of unserviceable components' deliveries
in the Logistics center is between 13:00 and 17:00 for FE, 15:00 and 17:00 for CLA
components, while continuous flow of Pool unserviceable components from 6:00- 22:00 exists
in the Logistics center. Only a few or no components are delivered over night.
5.1.6 Scheduling
After having introduced a new process flowchart for the outbound Logistics and a completely
new design of the infrastructure layout in the Logistics center, an improved employees' roster
should be suggested. Experimenting with the personnel schedules could benefit the company
in many ways. During the Value Stream Mapping sessions, there has been identified lower
personnel's productivity in certain shifts and positions, more specifically during weekends and
hours during the day where there are no track arrivals in the expedition. Moreover, higher
salaries are given to the employees working on weekends and night shifts and there is not a
constant occupation of the employees during the day. By rescheduling the employees’ roster
within the outbound Logistics, significant amounts of cost can be saved and a full occupation
of employees can be achieved.
For the purposes of the research an algorithm has been developed in chapter 6. The
algorithm aims to solve the problem of limited capacity in the Outbound Logistics, by
providing the best scenario, over the number of employees needed per day and shift, while
minimizing the cost of their salaries. The best scenarios are selected based on their cost
minimization and the higher score on the critical buffer level. Multiple scenarios have been
created and simulated in excel to test their performance.
0
200
400
600
800
1000
1200
1400
1600
1800
1 3 5 7 9 11 13 15 17 19 21 23
Total Components per hour of the day
July 2014 - June 2015
CLA
Pool
FE

5. Findings and Set of Solutions for the Improvement of the Outbound Logistics Process
59
5.1.7 Future State Design
When talking about Lean, the need of a new design process lay-out should also be taken into
consideration. The following process steps (Figure 32) have been used as guide map for re
organizing the infrastructure within the Logistics center, while facilitating the physical flow of
the component in the outbound and assisting the personnel’s operations. The figure below
(Figure 33) represents the proposal of the Engineering Design lay-out according to the Lean
principles. The proposed design is not very different from the current state of the Outbound
Logistics. As mentioned in the process' description three different flows can be distinguished.
Therefore, there a clear separation between the three lanes has been created and special
employees have been assigned for every flow. The new design proposed the combination of
the "Pool's”, "FE's" and "CLA's) tasks by one employee type. In other words the task of the
physical inspector and repair administrator has been combined into a single one. The added
value of the new lay-out of the outbound Logistics within the Logistics center concerns to a
process with less waste due to less movement during the components' handling. Moreover,
less time would be spent in making critical decisions since experts from each stream would be
assigned to handle each type. Finally, the complete removal of the buffer between the
physical inspection and repair administrator (buffer 2), would save remarkable time as each
component could be completed within approximately 30 minutes once it is picked from the
initial buffer.
After integrating the previously mentioned plans for every solution, a new process flow has
been designed and should be taken into consideration for the process improvement. The new
state should be simulated, tested and compared with the existing process for every scenario
in order to select the best alternative, in terms of cost and critical buffer, for the improved
Outbound Logistics. The figure below represents the general future state process steps
(Figure 32). It is logical that radical changes cannot be implemented in the process, since it is
only described by the critical tasks that need to be completed in the Outbound Logistics.
However, it was considered more efficient to introduce a more incremental differentiation, by
combining the two most critical activities, which are the physical inspection and the repair
administration. In that way, the buffer 2, that is causing very big delay in the turnaround
time of the process, will be automatically removed. The same employee will be assigned to
complete both of the tasks subsequently for the same component, contributing to its faster
competition.
Figure 32: Future Process Steps
1
Expedition
3
Physical Inspection &
6
Export/
Expedition
7
Transport

5. Findings and Set of Solutions for the Improvement of the Outbound Logistics Process
60
Figure 33: Future State Design Lay out and Scanning Points
5.1.8 Performance Management
Performance management solutions have been investigated and attempted to be connected
to the Logistics center's operations. The most critical element that can become quantified and
measured regularly in the Outbound Logistics in the turnaround time. It has been confirmed
that the most reliable way of taking information about the turnaround time automatically is
the tracking system. Therefore, consistency in scanning is required in every station by every
employee in the Logistics center. Above, there is a design layout of the Outbound Logistics
with the proposed scanning points and rules that need to be followed strictly in order to
retrieve realistic data any time wanted. Deviations from the desired KPIs can indicate the
bottlenecks in the process and correctly actions can be performed immediately. In Appendix
G Scanning Points (Table 24) there is a description of the future state scanning points that
are shown in figure 32.
Another method that is still in an experimental phase regards the Radio Frequency
Identification (RFID). RFID uses wirelessly electromagnetic fields to automatically identify,
and track a component. When a component enters the Logistics center a unique RFID tag will
be issued, the component's documentation will be scanned and stored electronically to the
tag's data base. In contrast to the Tracking system's barcode, the tag does not necessarily
need to be within line of sight of the reader and may be embedded in the tracked
component. Valuable information and data of the component can automatically be retrieved
and used any time needed. The proposed method has been recently introduced in the
Logistics center. Its function can save time and effort that Tracking system requires while
minimizing the risk of inconsistent and unreliable data. Further research and investigation
should be performed for its correct installation and implementation and the recognition of its
full potentials and benefits.
Performance Management is a big project that needs to attention and constant supervision.
Initiators of the project in question can assign tasks to employees for the execution of
Performance Management. The project can acquire a scientific character by addressing to
students with technical and managerial background to assist in its realization. The proposed
project is of very big importance as it can contribute to the continuous improvement of the
outbound Logistics.
5.1.9 Outsourcing the Logistics Process

5. Findings and Set of Solutions for the Improvement of the Outbound Logistics Process
61
Another solution that is completely separate and independent from the ones mentioned
above proposes the outsourcing of the Logistics process of KLM Engineering & Maintenance
to external company. In few words, the company could benefit from outsourcing the Logistics
process in terms of space saving, personnel reduction, infrastructure and facilities occupation
and perhaps more reliable and efficient process. Outsourcing one of the company's
businesses requires more research and an extended cost benefit analysis to show the real
savings that might come out of this action. Moreover, the selection of the appropriate
Logistics Company would regard to a completely new project.
5.3 Project's Scope and Limitations
The scope of the report has been narrowed down out of the nine set of solutions presented
in the previous section. Several limitations have led to focus and elaborate more on the
personnel's scheduling.
First of all the identification of the process and orientation within the process turned out to be
a time consuming task. A great amount of time was also dedicated in data collection and
measurements performed within the Logistics center. The benefit out of these steps, have
been to define the process in a clear and as consistent way as possible. Moreover, the
acquisition of reliable and correct data has been very important for the project's development
and results.
The implementation of some of the previously mentioned solutions requires the permission
and approval of higher managers. For other topics discussed the collaboration of different
shareholder in and outside of the Logistics center is needed. Moreover, most of the solutions
propose application over time, long term results and time consuming implementation. That is
the reason why most of the previously mentioned topics are placed in this chapter in terms of
recommendation for further projects, while most of them are already in an execution process.
From the data analysis (Chapter 4) the main bottlenecks have been identified. The results
concluded that one of the reasons of long turnaround times and excess critical buffer is the
insufficient personnel's capacity to handle the incoming workload. One of the solutions
mentioned in the previous subsections suggested the organization of the outbound Logistics
in terms of manpower. The scope of the project has been narrowed down to one solution
that fits to a thesis time frames and its outcomes could have a scientific contribution, whilst
the model developed for this purpose can be used for future or similar projects. For this
reason, a new scheduling plan that would be able to minimize the turnaround times, reduce
or even remove the critical buffer and of course provide one more cost efficient solution have
been developed. The following Chapter 6 presents a scientific method to attack the problem
of inadequate personnel in the Logistics center and propose scheduling scenarios that provide
good performance and cost efficiency.
5.4 Conclusion
After the data analysis the bottlenecks and problematic areas within the process have been
identified. Chapter 5 presented a complete solution action plan that covers all the predefined
root causes of the waste within the process. Nine set of solutions have been proposed in this
research. Their description and people in charge of their implementation are stated in the
subsection. However, the implementation of most of them could not be included in this
report, due to certain limitations that have been explained above. The work scope has been
shifted to a specific solution that leads to the outbound Logistics process' improvement in
terms of quality, turnaround time and cost.

5. Findings and Set of Solutions for the Improvement of the Outbound Logistics Process
62

6. Algorithm's Development for the Improvement of the Outbound Logistics
63
6. Algorithm's Development for
the Improvement of the
Outbound Logistics
6.1 Algorithm's Development
This chapter introduces the algorithm that has been developed for the purposes of the
research. It mainly regards a tool that has been creating in order to solve one of the main
problems regarding the capacity of employees with respect to the daily workload. In the first
section there is a brief introduction to the main function of the algorithm. This Section
provides a detailed description of the algorithm, the main variables being used and the
functions that calculate the important elements and the diagram flow of the calculation model
that is used for the algorithm's application in excel. Further details and its formal statement
can be found in the appendix. The simulation of the outbound Logistics process has been
performed in terms of the calculation model and is cited in section 6.2. The data and
scenarios creation have explained in the subsection 6.2.1 and 6.2.2. The simulations results
and the algorithms' verification and validation have been presented next. Finally, Chapter 6
concludes the approach that is followed to solve the scheduling problem and proposes the
best scenarios according to the simulation's results.
6.1.1 Introduction to the Algorithm
As it has already been mentioned in the methodology followed for the research in chapter 1,
the workload regards the unserviceable components' flow. It can be considered as a
parameter that cannot be influenced nor ignored, only forecasted by historical data and an
analysis of the existing customers. Therefore, the system of the outbound Logistics is a push
system, in other words every component that enters the Logistics center must be process and
completed as soon as possible and no later than the time requirements indicated in the
contract with the costumers. As a result the personnel's capacity can be used as a variable
that when it is stimulated according to the workload, the process flow can run successfully,
while minimizing the operating cost of the Logistics center and assuring that the time
requirements are always met.
The algorithm being developed in this report tests the multiple scenarios for the employees
scheduling. Two different versions of the algorithm have been examined in order to calculate
the two states of the process that are being proposed in the solution. The two versions of the
algorithm are based in the same philosophy; the only differentiation is that the first one
represents the process as it is, while the second combines the two main tasks of the
outbound Logistics using one type of employee.
The algorithm includes mainly a repeat loop that represents the shifts in the Outbound
Logistics. For every repetition or shift the number of components that are delivered in the
Logistics Center, the number of employees per task (physical inspector and repair
administrator) and their capacity in handling any type of component, are given. Moreover, a
maximization function is calculating the maximum number of components that can be
processed by each employee. For every loop the algorithm calculates the number of each
type of components and their handling time by every employee. Finally, based on the

6. Algorithm's Development for the Improvement of the Outbound Logistics
64
handling time calculated, the algorithm gives the number of completed components and the
number of uncompleted components. If the number of uncompleted components of the end
task (repair administrator), is bigger than the KPI that has been defined, then the algorithm
should give the order to hire more staff in the shift. The repeat loop continues until giving the
minimum number of employees that are needed in order to complete the required number of
components on time that means not exceeding the predefined KPI.
6.1.2 Description of the Algorithm
For understanding better the orders and the function of the developed algorithm, its formal
statement has been presented in a pseudo code in the appendix (Appendix I Formal
Statement of the Algorithm) and in a flow diagram in the next section. The algorithm is
described by constants, independent and dependent variables and their constraints. Below,
there is a brief definition of the algorithm's function.
The first step that needs to be done for the calculation model has been to define the
independent variables. A complete set of constants and variables that have been measured
within the existing process have been taken as input for the model developed.
In the context of this simulation two different types of employees have been taken (1.
physical inspector, 2. repair administrator and two in between buffers and one critical buffer
that represents the number of uncompleted components in the end of the shift.
The number of unserviceable component delivered in the Logistics center, can be categorized
in 8 different types. Each of these types of components has difference percentage of
occurrence in the process and different touch times are attached for every of the employees.
A random value between minimum and maximum measured time has been selected each
time during the simulation's execution.
Another constant that should be taken into consideration is the maximum process capability
for every employee based on the number of components delivered in the Logistics center and
their required touch times. In other worlds, the maximum number of components that can be
handled by the employees during one shift is calculated by a maximization function. The
employees’ process capability per shift is a very useful figure, as it will define the number of
completed component in later phases.
In the next steps the model performs a set of variables' calculations to be used for the final
output. The number of components existing in buffer 1 can be calculated by the number of
components delivered in every shift plus the number of unprocessed in buffer 1 from the
previous shift. Moreover the buffer is divided in different type of component based on the
known percentages. The number of components per type and their touch time have been
used to calculate the overall handling time of the physical inspector. The calculated handling
time includes the time that the physical inspectors, working in the shift, need to complete the
entire buffer 1. This handling time divided by the number of physical inspectors gives the
turnaround time for one physical inspector. A conditional function calculates that if the
handling time is longer than the shift's time (390) then it means that the physical inspector
can only provide his/her maximum capability, leaving the rest uncompleted components in
buffer 1 for the next shift. Otherwise, if the handling time is less or equal to 390 minutes, it
basically means that the physical inspectors are capable to complete all the components in
buffer 1. Finally, the number of completed components from this task is added to buffer 2,
where the unprocessed components from the repair administrators are placed.

6. Algorithm's Development for the Improvement of the Outbound Logistics
65
The same calculations are performed for the second type of employees, the repair
administrator. Different touch times and therefore process capability are attached to the
repair administrators' data. Further, it is logical that for the normal process flow more repair
administrators are needed per shift.
Finally, the number of uncompleted components by the repair administrators has been added
to the critical buffer, which defines the end process capability and implies the components' on
time delivery to the repair vendors. Based on the Logistics center's rules and turnaround
time's requirements, a critical buffer that excess the predefined KPI (26 components) for four
subsequent shifts or more, means that the buffer is significantly overloaded, has touched the
limit and the components cannot be completed within the contracted requirements and thus
more employees are needed to handle the workload. More than 26 components in buffer
(maximum number of components that can be handled per shift) mean that the component's
turnaround time will exceed 48 hours that are agreed in the contract with the customer.
Best Scenario Selection
The output of the algorithm included information regarding to weekly cost of personnel’s
employment. Every scenario created compromises by different number of employees per
shift and day and multiple combinations have been created. Based on the calculation model
regarding to their handling times and number of incoming components, the critical buffer
level in the end of the shift can be calculated. The best scenario for the outbound Logistics
should include a proposal of the minimum cost combined with the highest critical level
accomplishment.
6.1.3 Flow Diagram of the Algorithm
The flow diagram presented below shows a schematic representation of the algorithms'
calculation model (Figure 34). The exact steps that are followed and calculations performed
to deliver the requested results can be found in this flow diagram. The algorithm is not only
formally stated in a pseudo code but also designed in a flowchart to emphasize the its logical
calculation steps rather than the syntax of a specific programming language. Thus, the flow
diagram can be converted to several major programming languages.
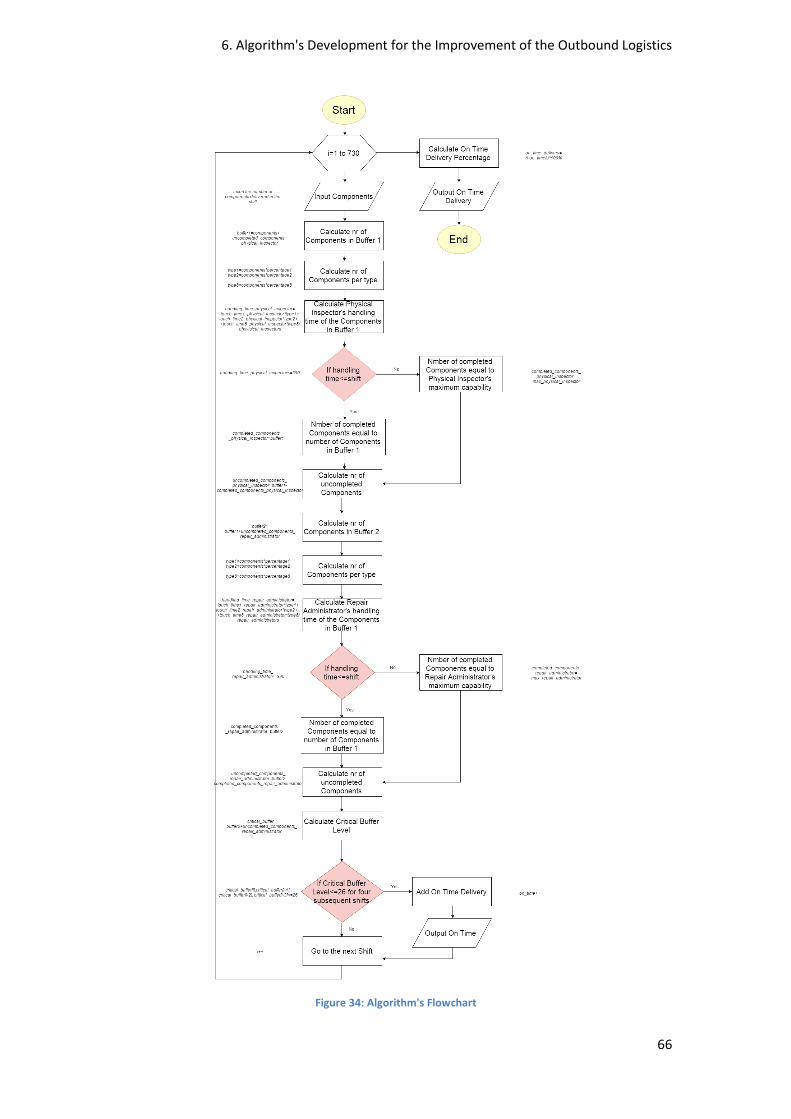
6. Algorithm's Development for the Improvement of the Outbound Logistics
66
Figure 34: Algorithm's Flowchart

6. Algorithm's Development for the Improvement of the Outbound Logistics
67
6.2 Algorithm's Implementation
The simulation model and all the steps for its design are described in this chapter. The reason
of using simulation for the research is to test the future state of the outbound process and
measure its performance on multiple scenarios. The simulation regards basically to the
implementation of the algorithm developed in the previous chapter, adjusted in the
requirements of the process in case. Several scenarios have been created and tested in excel,
providing results for the process' performance.
6.2.1 Data Creation
The data used for the simulation have been created by different means and therefore
represents a reliable sample for testing the realistic process in the outbound Logistics.
Personal measurements and joining shifts with the employees have helped define eight types
of components, described according to their condition (complete, missing data etc.), see
Appendix J Data Creation (Table 32). The method for the collection of the required data has
been elaborated in Chapter 4, where the data analysis has taken place. As it is mentioned,
extra personnel was hired to act as an external observer and monitor the components' flow,
while completing several forms, for 30 days. The forms included aspects regarding to
components' quality, when arriving in the Logistics center and the actual handling time of the
components by the employees. Finally, summarized tables have been created including
information of 353 unserviceable components. The percentages of their occurrences have
been summed up and attached in every type of component. Different touch times per type of
component and employees have also defined by the counting with stopwatch during the
measurements in combination with the tracking system (Table 33 and Table 34). For every
type of component a function estimates a random value between the minimum and maximum
estimated touch times. The random function provides a more realistic figure for the used
touch times. Finally the maximum capacity per shift had to be taken into consideration. A
maximization function calculates the maximum number of components that could be
completed by every type of employee (physical inspector and repair administrator) within 390
minutes, which is the estimated actual productive time per shift.
The number of components delivered in the Logistics center per month, day and shift has
been taken by last year's tracking data. The tracking system has been used to retrieve
information for the touch times of every type of component by every employee. Information
regarding the number of physical inspectors and repair administrators per shift (scheduling),
together with the cost of every employee per day and shift have been retrieved from the
company's network folders.
6.2.2 Scenarios Creation
The scenarios that have been tested are based on the previously mentioned information and
have been approved by the company's supervisors. There are two versions of the process
that have been tested in order to define the best process design. The first version is similar to
the existing process, defined by two different tasks which must be completed by two
employees, the physical inspector and the repair administrator. Following the components'
physical flow the repair administrator could start processing the component only when the
physical inspector had completed it. The second version presents a significant adjustment to
the process; according to this version, the tasks in the outbound Logistics have been
combined and executed by the same employee, in other words there is only one task by one
employee type. As expected, the data have been adjusted to the needs of the new process.

6. Algorithm's Development for the Improvement of the Outbound Logistics
68
Therefore, the touch time has been changed and the number of employees (scheduling) and
their cost has altered. For the scenarios creation it has been taken into consideration that the
company is a 24/7/365 business.
Since KLM Engineering & Maintenance operation is dependent to its customers (airlines and
KLM), full time employment is required in order to satisfy its customers and always meet the
time requirements. Therefore, the entire supply chain never stops running. The same applies
for the Logistics center as well. Never ending process flow demands sufficient manpower to
cope with the daily workload. Full time shifts are suggested by the first scenarios of two
versions.
From the workload analysis performed in sub section 5.1.5 the daily average workload can
vary depending the month of the year and the hour of the day. A rough estimation of the
forecasted workload requires from 1-4 employees per day to handle the components and
deliver them on time to the repair vendors. Since the repair administrator's task is more time
consuming than the physical inspector's, the latter's capacity is bigger than the repair
administrators, thus, for every scenario fewer physical inspectors are required per shift in
comparison to the repair administrators.
In many cases, however, it would be possible to skip certain shifts. Analyzing the previous
year's workload it has been concluded that most incoming goods are delivered to the
Logistics center in the morning shifts and during week days. As a result, evening and
weekend shifts can be removed from the weekly schedule. In the calculation model the
scenarios have tested the suggested alternations in the schedule. Two of the scenarios per
each version propose either shift only during weekdays or only day shifts, since evening and
weekend shifts pay higher wages to the employees.
As it has been mentioned the need of full physical inspector's capacity is not always
necessary. As long as the repair administrators cannot process the entire workload, the
physical inspector's full time employment does not add any value to the process, besides that
buffer 2 overloading that can be considered waste. Therefore, certain scenarios of version 1
test the process performance when no physical inspectors work either during evening or
weekend shifts, which are the most expensive shifts.
Version 1 Scenarios
Table 9 summarizes all the suggested scenarios that have been created and tested for the
first version and their descriptions are presented above.
Table 9: Scenarios Version 1
Scenarios Weekday/Weekend Day/Evening Physical Inspector Repair Administrator
1.1 Weekday
Day
Evening
3
1
4
2
Weekend Day Evening
1 1
4 2
1.2 Weekday Day Evening
3 0
4 0
Weekend Day
Evening
1
0
4
0 1.3 Weekday
Day
Evening
3
1
4
2 Weekend Day 0 0

6. Algorithm's Development for the Improvement of the Outbound Logistics
69
Evening 0 0
1.4 Weekday
Day
Evening
3
0
4
0 Weekend Day
Evening
0
0
0
0 1.5 Weekday Day
Evening
3
0
4
2 Weekend Day
Evening
1
0
4
2
1.6 Weekday
Day Evening
3 1
4 2
Weekend Day Evening
0 0
4 2
1.1 Full Time Shif ts
The first scenario represents an alternative that is very close to the current state in the
outbound Logistics center that means that there during weekdays there are 3 physical
inspectors in day shifts and 1 in the evening. During weekends there is only one physical
inspector for the morning and one for the evening shifts. The schedule of the repair
administrators is the same for the entire week, 4 in the morning and 2 in the evening (Table
10).
Table 10: Scenario 1.1 Full Time Shifts
Scenarios Weekday/Weekend Day/Evening Physical Inspector Repair Administrator
1.1 Weekday
Day
Evening
3
1
4
2 Weekend Day
Evening
1
1
4
2
1.2: Day Shifts
Scenario 1.2 testes the process' performance with no evening shifts, as higher wages are
paid during these shifts. 3 and 1 physical inspectors during weekdays and weekends
respectively and 4 for every day shift of the week are proposed in this scenario (Table 11).
Table 11: Scenario 1.2 Day Shifts
Scenarios Weekday/Weekend Day/Evening Physical Inspector Repair Administrator
1.2 Weekday Day Evening
3 0
4 0
Weekend Day
Evening
1
0
4
0
1.3: Weekday Shifts
In contrast with the previous scenario 1.2, this scenario suggests no weekend shifts. The
number of physical inspectors in day and evening shift would be 3 and 1, while the repair
administrators 4 and 2 (Table 12). The reason why no weekend shifts are included in this
scenario lies to the fact that maximum wage is paid for the employees working during
weekends.

6. Algorithm's Development for the Improvement of the Outbound Logistics
70
Table 12: Scenario 1.3 Weekdays Shifts
Scenarios Weekday/Weekend Day/Evening Physical Inspector Repair Administrator
1.3 Weekday
Day
Evening
3
1
4
2
Weekend Day Evening
0 0
0 0
1.4: Day & Weekday Shifts
This scenario tests how would the process perform if no there would be no one working on
the evenings and the entire weekend. Basically, only day week shifts are included in scenario
1.4, whereas the most expensive shifts are excluded from the weekly schedule (Table 13).
Table 13: Scenario 1.4 Day and Weekday Shifts
Scenarios Weekday/Weekend Day/Evening Physical Inspector Repair Administrator
1.4 Weekday
Day
Evening
3
0
4
0 Weekend Day
Evening
0
0
0
0
1.5: Physical Inspector-Day Shif ts, Repair Administrator-Full Time
As it has been mentioned the constant presence of physical inspectors does not always add
value to the process' performance. Therefore, a scenario should be tested in which the
physical inspector does not work during evening shifts (Table 14).
Table 14: Physical Inspector-Day Shifts, Repair Administrator-Full Time
Scenarios Weekday/Weekend Day/Evening Physical Inspector Repair Administrator
1.5 Weekday Day Evening
3 0
4 2
Weekend Day Evening
1 0
4 2
1.6: Physical Inspector-Weekday Shifts, Repair Administrator-Full
Time
In respect to the previous scenario 1.5, this scenario testes the process flow when no
physical inspector is working during weekends (Table 15).
Table 15: Physical Inspector-Weekday Shifts, Repair Administrator-Full Time
Scenarios Weekday/Weekend Day/Evening Physical Inspector Repair Administrator
1.6 Weekday
Day
Evening
3
1
4
2 Weekend Day
Evening
0
0
4
2
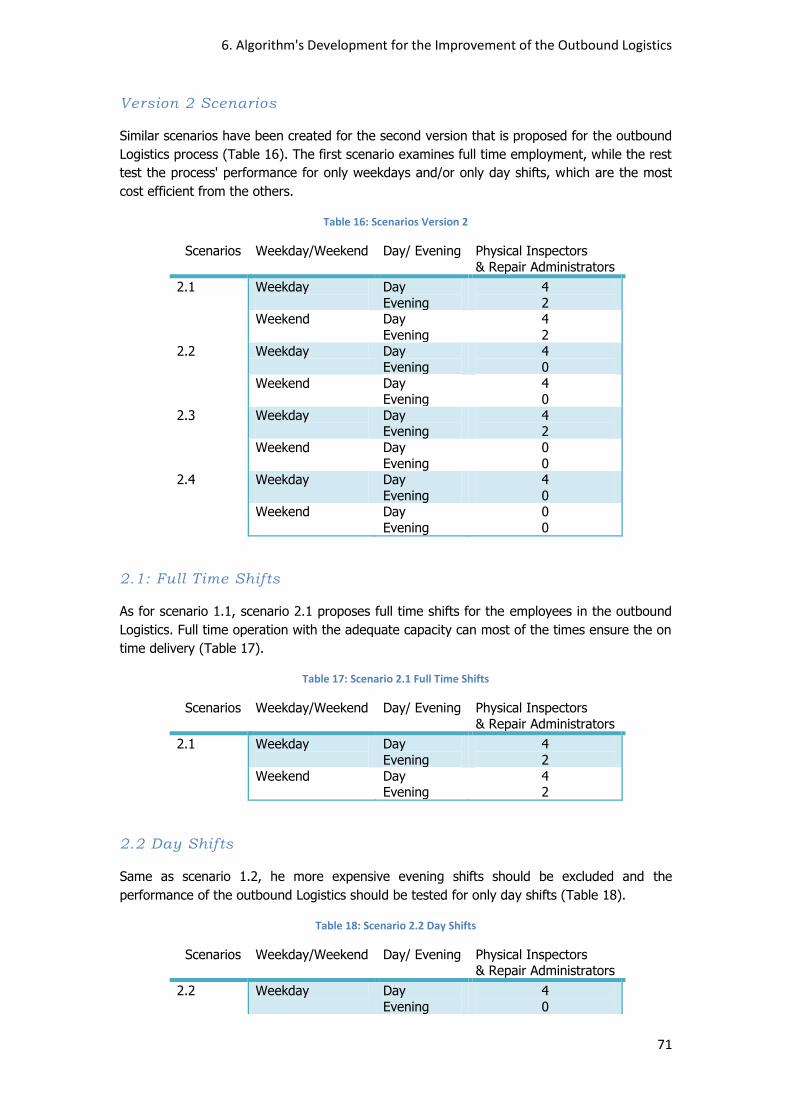
6. Algorithm's Development for the Improvement of the Outbound Logistics
71
Version 2 Scenarios
Similar scenarios have been created for the second version that is proposed for the outbound
Logistics process (Table 16). The first scenario examines full time employment, while the rest
test the process' performance for only weekdays and/or only day shifts, which are the most
cost efficient from the others.
Table 16: Scenarios Version 2
Scenarios Weekday/Weekend Day/ Evening Physical Inspectors
& Repair Administrators
2.1 Weekday
Day
Evening
4
2 Weekend Day
Evening
4
2
2.2 Weekday Day Evening
4 0
Weekend Day Evening
4 0
2.3 Weekday
Day Evening
4 2
Weekend Day
Evening
0
0 2.4 Weekday
Day
Evening
4
0 Weekend Day
Evening
0
0
2.1: Full Time Shifts
As for scenario 1.1, scenario 2.1 proposes full time shifts for the employees in the outbound
Logistics. Full time operation with the adequate capacity can most of the times ensure the on
time delivery (Table 17).
Table 17: Scenario 2.1 Full Time Shifts
Scenarios Weekday/Weekend Day/ Evening Physical Inspectors
& Repair Administrators
2.1 Weekday
Day
Evening
4
2
Weekend Day Evening
4 2
2.2 Day Shif ts
Same as scenario 1.2, he more expensive evening shifts should be excluded and the
performance of the outbound Logistics should be tested for only day shifts (Table 18).
Table 18: Scenario 2.2 Day Shifts
Scenarios Weekday/Weekend Day/ Evening Physical Inspectors & Repair Administrators
2.2 Weekday Day
Evening
4
0

6. Algorithm's Development for the Improvement of the Outbound Logistics
72
Weekend Day
Evening
4
0
2.3: Weekdays Shifts
Same as the previous scenario, Scenario 2.3 tests the process and on time deliveries when no
one is working during weekend shifts (Table 19). The most expensive shift is removed and
therefore the critical buffer level should be the determinant factor.
Table 19: Scenario 2.3 Weekdays Shifts
Scenarios Weekday/Weekend Day/ Evening Physical Inspectors
& Repair Administrators
2.3 Weekday
Day
Evening
4
2
Weekend Day Evening
0 0
2.4: Weekdays Day Shifts
One final scenario that could be tested suggests the operation of the outbound Logistics only
the weekday's day shifts (Table 20). The shift with the lower wage would be the only active
during week.
Table 20: Scenario 2.4 Weekdays Day Shifts
Scenarios Weekday/Weekend Day/ Evening Physical Inspectors
& Repair Administrators
2.4 Weekday
Day Evening
4 0
Weekend Day Evening
0 0
6.2.1 Implementation and Results
Different scenarios have been presented in the following tables (Table 8 and Table 15). The
scenarios have been adjusted to the independent variables' data sets that are the
percentages of types of components that regard the quality and have had an impact on the
overall touch time; and the number of employees per shift and day that represents the
capacity of the outbound Logistics. The Appendix J Data Creation includes the entire data
sets and constants that have been used for the process' simulation (Table 32, Table 33 and
Table 34). The main elements that the scenarios have tested are the shifts and days when no
employees, either physical inspectors or repair administrators or both, are working in the
outbound Logistics. Cutting hours from the weekly schedule has resulted less costs for the
company. Therefore, the proposed calculation model should provide the best scenario in
terms of cost while meeting the turnaround time requirements and minimizing the critical
buffer level. A combination of different number of employees per day and shift are described
in each scenario have been presented in the previous section.
The scenarios mentioned above have been simulated in excel using the algorithm developed
in section 6.1. The graphs that show the results regarding to the critical buffer level and as a

6. Algorithm's Development for the Improvement of the Outbound Logistics
73
conclusion the on time delivery, can be found in the Appendix K Simulation Results. The
following table (Table 21) scores the scenarios' performance in respect to the defined KPIs.
The decision making factors for selecting the best scenario are reflected to the critical buffer
level that is connected to the turnaround time and the cost efficiency. The main outcome of
the process' simulation is the number of uncompleted components that remain in the end of
the shift, depending on the employees' scheduling. It has already been mentioned that this
number should not exceed a certain number for several continuous shifts; otherwise the
components will be delivered with delay, failing to meet the turnaround time (48hours). The
graphs in the Appendix K Simulation Results (Figures 41-50) represent the number of
uncompleted components. Those that have not exceeded the critical level (26 components in
the end of the shift) for more than four subsequent times have been counted and translated
into percentages of on time delivery in Table 21. After implementing and testing the
scenarios, the scores of exceeding this critical level or not have been presented.
The cost of employing the employees needs to be taken into consideration. A very critical
factor in the decision making process of selecting the best scenario is to minimize the cost.
For every scenario, different schedules have been proposed. As the cost of every employee
per shift is already known, from internal sources, the calculation of their weekly cost has
been presented in the table below (Table 21).
Table 21: Simulation's Results
Scenarios On time delivery Cost (Euros)
Version 1 Version 2 Version 1 Version 2
1 100% 100% 21645 14625
2 88% 0% 14040 9360
3 99.99% 50% 14820 9360
4 0% 1% 9750 5850
5 100% 19305
6 99.99% 20085 6.2.4 Verification and Validation
The verification and validation are two concepts closely related to each other and are very
important to justify the reliability of the calculation model's results and ensure its correct
execution. After verification and validation of the calculation model valuable, analysis and
conclusions can be presented. Verification regards to the determination of whether the
models assumptions, variables and data have been correctly translated into the used
computer software. Whereas, the validation is concerned the accurate representation of the
process is the simulation model (Law et al., 2000). This section presents the efforts that have
been made to verify and validate the model.
First, the model has been constructed gradually; meaning that its creation has started with a
low in details calculation model and then gradually its complexity has been increased by
adding more elements. After each step, output data is requested so as to verify that the
model has been built correctly.
Another useful technique that has been used was to step through the calculation model.
Several input parameters have been changed during the execution to see whether the model
would respond in the expected way. For example, there has been tested the critical buffer
levels if the employees' touch times would significantly change.

6. Algorithm's Development for the Improvement of the Outbound Logistics
74
Finally, there has been checked whether the complex sources of the variability have been
modeled correctly though results validation. This has been realized by comparing the
calculation model's results with the results derived from the data analysis. For example, the
time series plot of the critical buffer level in the end of the simulation for some cases and
more specifically for the selected scenarios has presented similar trends and outliers with the
real existing state in the outbound Logistics. Since the plots that have been created by the
simulation's results resemble to the one from the data analysis, it has been concluded that
the calculation model is valid. Therefore, the use of data input and the resulted outputs have
been correctly modeled and correspond to the realistic case.
6.2.5 Best Scenarios
Based on the decision making factors mentioned in the previous section the best scenario has
been selected. The best alternative should combine the highest score of on time delivery and
the employees' employment cost minimization. First, there has been an evaluation of the
scenarios of the different versions tested and afterwards there a comparison between those
two for the final proposal has been performing leading to a final proposal.
For the first version of the Outbound Logistics process the scenarios 1.1, 1.5 have scored
100% on time components' delivery and cost €21645 and €19305 per week respectively. In
contrast scenario 1.4 showed the minimum score of on time delivery to the repair vendors,
whilst costing the least amount for the company (€9750/week). Benefits from the cost
reduction cannot equilibrate the loss of uncompleted components in the end of the shift,
therefore scenario 1.4 can be considered as the worst scenario. The second worst scenario of
version 1.1 is scenario 1.2, followed by scenario 1.6, where delayed delivery occurred only
0.01% whereas cost is relatively advanced. Nevertheless, scenario 1.3 should be taken into
serious consideration as it presents a relatively small cost for the company (€14820/week)
while at the same time the critical level is merely exceeded (1). The analysis above results to
the conclusion that the best scenario for version 11. of the outbound Logistics is Scenario 1.3,
according to which weekend shifts, that are less busy but more expensive for employees'
occupation, have been removed from the weekly schedule. Based on the simulation the
process can flow normally as all the components could be completed within 48hours, meeting
thus the time requirements on time.
The same decision making process has been made for the second version that represents the
future state's proposal in this research. It is obvious that Scenario 2.1 is the best alternative
for version 2.2. The results of the scenarios 2.2 and 2.4 scored the minimum cost (€9360 and
€5850 per week) but had been proven to always delay (100%) deliver the components to the
repair vendor. Scenario's 2.3 cost is also minor compared to Scenario 2.1 and same as
Scenario 2.2 (€9360/week), however components' on time completion and delivery is only
50% guaranteed. While Scenario 2.1 is the most expensive compared to the rest scenarios of
version 2.2 (€14625/week), the 100% level of on time delivery scored in the simulation
justifies its selection for the best scenario. Version's 2 Scenario 2.1 proposes a 24/7/365
schedule for the employees working in the Logistics center, taken into account that the tasks
of the physical inspector and repair administrator are combined and performed by the same
employee.
6.3 Conclusion
This chapter presented the results of the process simulation. For the purposes of the
simulation data and scenarios have been created. A validation and verification of the
algorithm assures the used framework provides reliable and valid results.

6. Algorithm's Development for the Improvement of the Outbound Logistics
75
To finalize the improvement process of the Outbound Logistics, two different versions of the
process together with the best scheduling scenario have been suggested. In the simulation
Version 1 Scenario 1.3 and Version 2 Scenario 2.1 have presented similar performance in the
critical level regarding to the components on time completion and cost almost the same
amount of money per week for the company. The best alternatives (Table 22) have been
proposed for a specific time frame. For short term results and instant implementation of
scenario 1.3 is the most efficient in terms of cost and time requirements. The scenario
suggests the operation of the outbound Logistics only during weekdays; the most expensive
shifts (weekend shifts) are remove, while there is still enough capacity to catch up the lost
hours from the weekend shifts and meet the final time requirements. Its implementation is
easy to be realized as no reorganization in the infrastructure is needed. Incremental changes
demand the employees perform the same tasks as before with changes only on their daily
schedule. For long term implementation and better results for the future, 2.1 has been
suggested. According to this alternative radical changes have been proposed. The
combination of Physical Inspector's and Repair Administrator's activities requires the
employees' additional training and execution of more complicated tasks. Moreover,
adjustments in the infrastructure in the Logistics center should be made so that space for the
physical inspection is available to every employee. The extra in between buffer has been
removed, therefore its space should be used for the purpose mentioned above. Nevertheless,
this scenario requires full time occupation, including day, evening, weekday and weekend
shifts. However, no additional employees need to be hired so as the time requirements will
be met.
Table 22: Best Scenarios
Scenario Schedule On time Delivery Cost in Euros per
week
1.3 Separate tasks
Weekday Shifts
100% 14820
2.1 Combined tasks
Full Time (24/7/365
shifts
99.99% 14625

6. Algorithm's Development for the Improvement of the Outbound Logistics
76
7. Conclusions and Recommendations
77
7. Conclusions and
Recommendations This is the final chapter of the report that concludes the research performed in the Logistics
Center of KLM Engineering & Maintenance. The main research questions, the methodology
followed to answer them and the results summarize this report. The reflection is included in
this chapter and later advice for further research and final remarks is presented.
7.1 Conclusion
It is very significant for businesses to work continuously on improving the performance of
their processes. As a result, decisions, actions and coordination towards continuous
improvement are some of the main core practices in the working field. Specialized teams of
experts are assigned to work on the projects and deliver improved, effective and efficient
processes. Lean Six Sigma Blackbelts are trained employees that apply the Lean Six Sigma
principles and philosophies, combined with supporting systems and tools in the working filed
so as to improve the process.
This research has been conducted in the context of a Lean Six Sigma project within the
Logistics Center of KLM Engineering & Maintenance. The main objective of this project has
been to "How improve the Outbound Logistics process within the Logistics Center
at KLM Engineering & Maintenance in terms of Quality, Turnaround Time and
Cost?”.
To accomplish this objective several research questions have been made and presented
below to conclude the report.
RQ1: What is the current outbound Logistics process within the Logistics Center at
KLM Engineering & Maintenance?
The Logistics center of KLM Engineering & Maintenance is a part of the supply chain of the
company's core business. The Logistics center is the physical place where every aircraft
component goes through for import/export formalities, administrator, storage and delivery to
the repair vendors and/or customers (internal KLM, external airlines). The Logistics center
consists of two divisions: the Inbound and the Outbound. More specifically, the outbound
Logistics process include the tasks performed when an unserviceable aircraft component
requires to be tested, repaired or overhauled. Those tasks are completed by different type of
employees working in the Logistics center.
The aircraft components are received in the Expedition where a tracking sticker with a unique
barcode is attached to them and a first confirmation in the system is being performed. The
employees separate the components based on their condition (serviceable or unserviceable)
and place them in the respective lane at the Logistics Center. Thereafter, the physical
inspection takes place during which the employees check the physical condition of the
component, its paperwork including the information and identification numbers and cross
check if both of them correspond to each other. The result of this task is a completed form
that includes all the component's characteristics to be used by the next employees in
sequence. The component is placed in a buffer until, according to FIFO priority, it will be
picked by the repair administrator who is accountable for the component's right
administration in the system. This type of employee completes the paperwork, invoice and

7. Conclusions and Recommendations
78
configuration in the system so that the component is sent to its respective repair vendor, on
time and with the required data, description etc. The component is then moved to another
side of the Expedition where the employees make sure that an entire batch of components
are placed to the right tracks and transported to the repair vendors.
The inbound Logistics, the other division of the Logistics center, concerns the reverse
process. The inbound Logistics includes the activities of receiving serviceable components,
storing them to the warehouse and/or sending them directly to the customer airline which
has requested it.
RQ2: What can we learn from literature regarding to the improvement of Logistics
processes?
Valuable information has been used from literature and academic papers regarding to the
Lean Six Sigma theory. Lean Six Sigma has been the most useful tool for making a process
flow more efficient in terms of Quality, Turnaround Time and Cost in KLM Engineering &
Maintenance. A combination of the theory mentioned together with the Engineering Design
has been applied in this research. A proposed technique for minimizing the waste within
process includes the capacity planning and scheduling. After that, an extended research in
algorithmic approaches and simulation to attack similar problems in industries has been
performed.
RQ3: What are the selected KPIs and data to measure the performance of the
outbound Logistics process?
The definition of the critical KPIs has been a very critical task in order to create a data
collection plan, gather the correct and reliable data to measure the performance of the
outbound Logistics and use them in for further research. The most important identified KPIs
describe quality by means of uncompleted components, missing data wrong packaging etc
and turnaround time which is further decomposed to the actual employees' touch time and
waiting times in the in-between buffers. Measurements and joining shifts with the employees
on floor has been proven to be the most reliable, but time and effort consuming method for
obtaining the needed data. Important information from historical data has also been retrieved
from the tracking system.
RQ4: What is the performance of Outbound Logistics process?
The data analysis has followed after the data collection. Statistical analysis and cumulative
reports represent the current performance of the outbound Logistics. The results from the
analysis have led to the conclusion that the poor quality of the received components, in
combination with complicated process tasks, delay the entire process and the components'
delivery to their end destination (repair vendor). Moreover, inefficient process steps and task
have created huge buffers, characterized by long waiting times.
RQ5: What are the suggested solution areas for the future Outbound Logistics
process within the Logistic Center at KLM Engineering & Maintenance?
From the analysis performed to answer the previous research questions, the bottlenecks and
problematic areas have been identified. Having reviewed the literature and participated in
brainstorming meetings several solutions have been proposed. The solutions have been
interdependent and their simultaneous implementation has been suggested for better results
that completely remove the waste from the process. The solutions areas include actions to be
7. Conclusions and Recommendations
79
taken for the specific data for revising the contracts. Communication among the employees,
supervisors and managers has been an essential area of interest, which would contribute to
the overall performance of the process. Defining and forecasting the daily workload has been
also a very significant part of the research, so as to have the process and capacity well
organized in advance. A new design of the outbound Logistics would indicate more
standardized process steps and rules. Finally, performance management has been the main
focus for a further research proposal. Another different solution area suggested after the data
analysis and performance analysis, has been the investigation of outsourcing the Logistics of
KLM Engineering & Maintenance.
RQ6: How can the outbound Logistics process within the Logistics center at KLM
Engineering & Maintenance be simulated and tested in respect with its manpower
performance?
An algorithm has been developed for the purposes of the research. A general form of the
algorithm can be used in order to simulate the entire process of KLM's supply chain. Input
has been taken from the data collection, used as dependent and independent variables. More
specifically, measurements regarding to the components' missing data, info etc., their
handling times and the daily workload definition has been used as a forecast for future
incoming deliveries have been reliable input for the process' calculation. Moreover several
scenarios have been created, based on the company's needs and potentials for scheduling
changes, which would contribute to the process quality and cost saving, and tested through
this simulation.
RQ7: How can improvement strategies can be implemented?
A set of solutions has been the result after the data analysis regarding to the process’
performance. The bottlenecks and ineffective areas have been identified. Literature review
together with brainstorming sessions have resulted to certain solutions to improve the
process.
A list of data requirements for a component ready for delivery, based on which the standard
way of working can be defined. In order to complete the list of the data required extended
research and evaluation of the work performed in the outbound Logistics has been
conducted. Understanding the steps taken and their added value in every task of the
outbound Logistics process, by joining shifts and questioning the employees, helped create
the desired list of data.
Based on the list created for this purpose, the customers’ contract can be rewritten in a way
that only components with required data will be accepted in the Logistics center. Revising
and spreading an update version of contracts to the customers is a time consuming and
difficult task, but it will be fruitful for both sides. Based on the new contracts components can
only be sent to the Logistics center only if every required information is included and is
available for usage. In this way, less issues regarding to components' deliveries and handling
will be encountered resulting to a faster process.
Good communication among people is very essential for the employees’ involvement and
motivation for work. Regular meetings and trainings would help the employees take more
responsibilities and initiatives on their assignment. Managers and supervisors should be
empowered with communication skills since they are the ones accountable for the good
rapport among the employees participating in the Logistics process.

7. Conclusions and Recommendations
80
A detailed analysis of the workload needs to be defined and updated regularly, so that a
forecast on incoming goods will be available and therefore the personnel’s capacity could be
adjusted according to the needs. Information regarding to the workload can be retrieved
primarily from the tracking system, out of which aggregated reports can be created. The
number of unserviceable components can be counted in a monthly, daily and hourly basis.
The reason of such a deep analysis lies in the fact that the supply of incoming goods differs,
but several trends and periodicities can be recorded.
Finally, a new outbound Logistics process can be designed, introducing more efficient steps.
After consultation and confirmation by people in charge, the idea of the new process design
has included the combination of the two main tasks performed in the outbound Logistics. In
other words, the one employees would perform the physical inspection and repair
administration in sequence, removing thus, the buffer between them.
Performance management has been proposed as new project that could ensure the process’
performance control. Additional research on performance management tools and techniques
should be the next step for the outbound process. This task would help measure the
performance in regular intervals, identify bottlenecks and control the process by intervening
any time needed. Finally, continuous improvement can be achieved by successfully
implementing a performance management plan.
The final result of the research’s scoping is recommendations that derive from the simulation
and the set of solution that have been described above. Short term and incremental changes
in the process include the removal of weekend shifts, whereas long term and more radical
changes propose a complete redesign of the outbound Logistics center while combining the
physical inspector's and repair administrator's activities into one.
Outsourcing the complete Logistics process is implied to have long term benefits for the
company. However, the research behind this action is left for a different future project.
7.2 Thesis Reflections
In order to analyze and evaluate the applicability of an algorithmic approach in a combination
of Lean Six Sigma and Engineering Design approach towards the process' improvement, the
case study of the outbound Logistics process within the Logistics center of KLM Engineering &
Maintenance has been studied. Several research questions have been formed so that the
main objective and topic of the project can be clear and consistent. Process improvement is a
very complex topic and there is a great amount of information regarding to the topic.
Therefore, a detailed approach was necessary. There has been a great challenge in
orientation and finding the appropriate work scope that can provide a scientific contribution.
However, following the Lean theory have helped go deeper in the analysis and identifying the
correct scope.
The presented framework, combining Lean Six Sigma and Engineering Design is generic and
allows flexibility. Flexibility is very essential due to the fact that the process' needs can vary
to meet consumer demands and process as much as the incoming workload. Moreover the
proposed approach develops techniques for rational decision making and attributes a
sustainable character.
Basically, the output of the research has been a set of solutions and actions that are needed
in order to achieve better performance in the process. Finally, extreme focus was given in the
development of an algorithm that can simulate the process within the Logistics Center, run

7. Conclusions and Recommendations
81
and test scheduling scenarios, in a way that the process can flow without waste and
minimizing the cost of employing excess personnel.
As it has been concluded, there have been several limitations within the suggested solutions.
For some cases the time constrains have prevented from realizing in depth research and
implementation of the entire set of solutions. Moreover, the lack of authorization and license
have left several topics untouched for the context of the project in question. Nevertheless,
concrete proposals have been suggested and assigned to the people in charge. Their
outcomes have been excluded from the report as their implementation is currently running.
The nature of the existing process in the Logistics center have presented a notable shortage
of data. Furthermore, the reliability of available data had been inconsistent and therefore it
was preferred to use only a small amount of reliable and consistent data. This resulted in
coming to hard conclusions and only a scope where the data could have been well used.
To conclude, the set of solutions and the algorithm developed for the purposes of the project
compromise a complete action plan derived from the combination of literature related to Lean
Six Sigma and Engineering Design and real field guidance and implementation.
The research has been conducted in the context of a Lean Six Sigma project launched in the
Logistics Center of KLM Engineering & Maintenance. Having completed courses in the Supply
Chain Management specialization helped gain the theoretical knowledge behind it. Moreover,
having been supervised by the Logistics center's Blackbelt and having worked with a
Greenbelt and other experts of Lean Six Sigma principles helped apply the university's
knowledge in real field and guided the project's execution according to the scientific theories.
Besides the theories and academic knowledge, very essential has been the interaction with
the employees and following the process flow several times so as to have a better
understanding of the factors that could undermine the process performance. Being a part of
the process has helped recognize the employees difficulties and therefore come up with
solutions that would satisfy their needs. Communication skills in a manly and multicultural
environment have been very useful for the connection of employees and their motivation to
be espoused with the project. The employees' contribution in the research has been the most
powerful input for the successful development of the process' improvement.
Despite the difficulties and limitations of the project, it was a very interesting experience that
increased my capabilities and helped develop new skills, while implementing my theoretical
background and knowledge to an actual working field. Having completed the master of
Management of Technology and conducted a project in real field had made me realize the
importance of combining technical and managerial skills for a successful business operation.
7.3 Recommendation for Further Research Projects
This research is limited to only propose several sets of generic solutions for the process'
improvement and check several scheduling scenarios for the outbound Logistics process.
Nevertheless, the methodology and most importantly the algorithm that is developed for the
purposes of this problem can be extended and implemented for the other division of the
Logistics center (Inbound process) and further for the entire supply chain of KLM Engineering
& Maintenance (Figure 1). Moreover, the suggested algorithm can be used as a general
model that can be applied in other programming languages and be executed to test the
process in a dynamic way and therefore make use of its full potentials.

7. Conclusions and Recommendations
82
Nevertheless, the methodology and the algorithmic approach developed and used for the
project can easily be applied for other products and processes in other industries as well. The
integration of Lean, Six Sigma and Engineering Design approach can be applicable to every
project that requires a process improvement. As for the algorithm, it can be used in its
general form to any job flow process model, as long as the required data are in place for the
reliable calculation model. The results from the calculation model will depend on the data
representing the real process, therefore attention should be given on the data collection.
The improvement of the supply chain requires an extended research of the processes and
sub processes, which compromise it. Such a project would be a rather complex and time
consuming task to perform. Therefore, it should be decomposed into several sub projects for
every department of the company. Integrating the forces of the company's divisions would
result to the overall improvement of the its core business.
To conclude, as it already mention in Section 5.9 the outsourcing of the entire Logistics
business is one task that requires further research. The benefits for outsourcing and
removing the Logistics center operation might give better results in a long term period of
time, might save extreme cost for the company and could even guarantee better services
from a reliable company specialized in Logistics. Nevertheless, extended research should be
assign to a specialized project group that would be compromised by KLM employees of
different departments.

Reference
83
Reference Adams, M., Componation, P., Czarnecki, H. & Schroer, B.J. (1999). Simulation as a tool for
continuous process improvement. Proceedings of the 1999 Winter Simulation Conference.
Akbulut-Bailey, A.Y., Motwani, J. & Smedley, E.M. (2012). When Lean and Six Sigma
converge: a case study of a successful implementation of Lean Six Sigma at an aerospace
company. International Journal of Technology Management, 57, 18–32.
Amin Sahraeian (2012). Minimizing Makespan in Flow Shop Scheduling Using a Network
Approach, Production Scheduling, Prof. Rodrigo Righi (Ed.), ISBN: 978-953-307-935-6.
Barnett, V. & Lewis, T. (1994). Outliers in Statistical Data, third edition. John Wiley & Sons,
New York, ISBN: 978-0-47-193094-5.
Bhagwat, R., & Sharma, M.K. (2007). Performance measurement of supply chain management: a balanced scorecard approach. Computers & Industrial Engineering, 53, 43-62
Byrne, P.M. & Markham, W.J., (1991). Improving Quality and Productivity in the Logistics Process. Council of Logistics Management.
Campbell, G. H., Dudek, A. R., & Smith, L.M., (1970). A Heuristic Algorithm for the n Job, m
Machine Sequence Problem. Management Science, 16 (10).
Cannel, M. (2004) Personnel Management: A Short History. London CIPD.
Clarke, R.L., (1991). The Measurement of Physical Distribution Productivity: South Carolina, a Case in Point. Transportation Journal, 31 (1), 14-21.
Cooper, J.C., Browne, M. & Peters, M., (1990). Logistics Performance in Europe: The
Challenge of 1992. International Journal of Logistics Management, 1(1), 28-34.
Cua, K.O., McKone, K.E. & Schroeder, R. G. (2001). Relationships between implementation of
TQM, JIT, and TPM and manufacturing performance. Journal of Operations Management 19,
675-694.
Daniel T., Jones P. & Hines N. R., (1997). Lean Logistics. International Journal of Physical
Distribution & Logistic Management, 27(3/4), 153–173. Retrieved
fromhttp://dx.doi.org/10.1108/09600039710170557.
Darling, A. & Dannels, D., (2010). Practicing Engineers Talk about Importance of Talk: A
Report on the Role of Oral Communication in the Workplace. Communication Education,
52(1).
Dym, C.,L. & Little P., (2013). Engineering Design: A Project-Based Introduction. Willey,
ISBN-13: 978-1118324585
Dym, C., L., Agogino A., M., Frey D., D., Eris O. & Leifer, L., J., (2005). Engineering design
thinking, teaching, and learning. Journal of Engineering Education, 94(1), 103-120.
Eden, C., &Huxham, C. (1996). Action research for the study of organizations.
Ferrin, D.M., Miller, M.J. & Muthler, D. (2005). Lean Sigma and Simulation, so what's the
correlation?. Winter Simulation Conference, 1.
Reference
84
Fowler, J.W. & Rose, O. (2004). Grand Challenges in Modeling and Simulation of Complex
Manufacturing Systems. Simulation, 80(9), 469-476.
Garey, M.R., Johnson, D.S. & Sethi, R. (1976). The Complexity of Flowshop and Jobshop
Scheduling. Mathematics of Operations Research, 1(2), 117-129.
Gassenheimer, J.B., Sterling, J.U. & Robicheaux, R.A., (1989). Long-term Channel Member
Relationships. International Journal of Physical Distribution & Logistics Management, 19(12), 15-28.
George, M.L., Rowlands, D., Price, M. & Maxey, J., (2005). The Lean Six Sigma Pocket Toolbook: A Quick Reference Guide to Nearly 100 Tools for Improving Process Quality,
Speed, and Complexity. McGraw-Hill Companies, ISBN 0-07-144119-0
Hackman, J. R., & Wageman, R. (1995). Total quality management: Empirical, conceptual,
and practical issues. Administrative science quarterly, 309-342.
Hines, P., Rich, N., Bicheno, J., Brunt, D., Taylor, D., Butterworth, C., & Sullivan, J. (1998).
Value Stream Management. The International Journal of Logistic Management, 9 (1), 22-25.
Retrieved from http://dx.doi.org/10.1108/09574099810805726
Hines, P., & Taylor, D. (2000). Going lean. Cardiff, UK: Lean Enterprise Research Centre
Cardiff Business School.
Ho, C. J. & Chang, Y., (1991). A new heuristics for the n-job, M-machine flow-shop problem. European Journal of Operational Research, 52(2), 194-202.
Holthaus, O. & Rajendran, C. (1997). Efficient dispatching rules for scheduling in a job shop.
International Journal of Production Economics, 48, 87-105.
Hopp, W.J. & Spearman, M.L. (2004). To Pull or Not to Pull: What Is the Question?.
Manufacturing & Service Operations Management, 6(2), 133-148.
Ishikawa, K., (1976). Guide to Quality Control. Asian Productivity Organization, ISBN 92-833-
1036-5
Jagabandhu S., & Chandrasekharan R., (1996). Scheduling in flow shop and cellular manufacturing systems with multiple objectives — a genetic algorithmic approach, Production
Planning & Control. The Management of Operations, 7(4), 374-382.
Jayamohan, M.S. & Rajendran, C. (2000). New dispatching rules for shop scheduling: A step
forward. International Journal of Production Research, 38(3), 563-586.
Karlsson, C., & Åhlström, P. (1996). Assessing changes towards lean production. International
Journal of Operations & Production Management, 16(2), 24-41.
Katragjini K., Vallada E., Rubé R., (2013). Flow shop rescheduling under different types of
disruption. International Journal of Production Research, 51(3), 780-797.
Kleijnen, J.P.C., (1992). Verification and validation of simulation models. Center and
Department of Information Systems and Auditing Katholieke Universiteit Brabant.
KLM (KoninklijkeLuchtvaartMaatschappij). (n.d.). BPM Business Process Management.
Retrieved from KLM Engineering & Maintenance
Intranet https://www.klm.com/corporate/myklm/web/engineering-maintenance/bpm

Reference
85
Krakovics, F., Leal, J.E., Mendes, P. Jr. & Santos, R.L. (2008). Defining and Calibrating
Performance Indicators of a 4PL in the Chemical Industry in Brazil. Int. J. Production
Economics, 115, 502-514
La Londe, B.J., Cooper, M. C. & Noordewier, T.D., (1988). Customer Service: A Management
Perspective. Council of Logistics Management.
Law, A.M. (2003). How to conduct a successful simulation study. Winter Simulation
Conference
Law, A. M. & Kelton, W.D. (2000). Simulation Modeling and Analysis. McGraw-Hill, ISBN:978-
0-07-059292-6.
Lindermann, K., Schroeder, R.G., Zaheer, S. & Choo, A.S. (2003). Six Sigma: a goal-theoretic
perspective. Journal of Operations Management, 21, 193-203.
Martinsons, M., Davison, R. & Tse, D., (1999). The balanced scorecard: a foundation for the
strategic management of information systems. Decision Support Systems 25, 71–88.
Mentzer, J.T. & Konrad, B.P., (1991). An Efficiency/Effectiveness Approach to Logistics Performance Analysis. Journal of Business Logistics, 12(1), 33-61.
Muchiri, P., Pintelon, L., Gelders, L. & Martin, H., (2010). Development of maintenance
function performance measurement framework and indicators. International Journal of
Production Economics.
Nanova, G., Dimitrov, L., Neshkov, T., Apostolopoulos, C. & Savvopoulos, P., T., (2012). Lean
Manufacturing in aircraft maintenance repair and overhaul. Recent, 13(3), 36
Neely, A., Mills, J., Platts, K., Gregory, M. & Richards, H., (1996). Performance measurement
system design: should process based approaches be adopted?. International Journal of
Production Economics, 423–431.
Ohno, T. (1988) Toyota Production System: Beyond Large Scale Production. Productivity
Press, ISBN: 978-0-915299-14-0.
Pinheiro de Lima, E., Gouvea da Costa, S.E. & Reis de Faria, A., (2009). Taking operations
strategy into practice: developing a process for defining priorities and performance measures.
International Journal of Production Economics, 122, 403–418.
Pinedo, M. L. (2005). Planning and Scheduling in Manufacturing and Services. Springer, ISBN:
978-0-387-22198-4.
Philipoom, P.R. (2000). The choice of dispatching rules in a shop using internally set due-
dates with quoted leadtime and tardiness costs. International Journal of Production Research,
38(7), 1641-1655.
Read, W.F. & Miller, M.S., (1990). The State of Quality in Logistics. International Journal of
Physical Distribution & Logistics Management, 21(6), 32-47.
Robeson, J. F. (1994). Logistics Handbook. Simon and Schuster

Reference
86
Ruffa, S. A., & Perozziello, M. J. (2000). Breaking the cost barrier: A proven approach to
managing and implementing lean manufacturing. John Wiley and Sons Inc.
Santoso, T., Ahmed, S., Goetschalckx, M. & Shapiro, A., (2003). A Stochastic Programming
Approach for Supply Chain Network Design under Uncertainty. School of Industrial & Systems
Engineering. Georgia Institute of Technology.
Schroeder, R.G., Lindermann, K., Liedtke, C., & Choo, A.S. (2008). Six Sigma: Definition and
underlying theory. Journal of Operations Management, 26, 536-554.
Shah, R. & Ward, P. T. (2007). Defining and developing measures of lean production. Journal
of Operations Management, 25, 785–805.
Shannon, R.E. (1975). Systems Simulation: the art and science. Prentice-Hall, Englewood
Cliffs, ISBN: 978-0-13-881839-5.
Shen, L. & Buscher, U. (2012). Solving the serial batching problem in job shop manufacturing
systems. European Journal of Operational Research, 221, 14–26.
Silberschatz, A., Galvin, P.B. & Gagne, G. (2008). Operating System Concepts. Willey & Sons,
ISBN: 978-81-265-0885-3.
Six, V. (2015, April). Lean Training in KLM Engineering & Maintenance.
Soepenberg, G.D., Land, M.J. & Gaalman, G.J.C. (2012). Workload control dynamics in
practice. International Journal of Production Research, 50(2), 443-460.
Stendridge, C.R. & Marvel, J.H. (2006). Why Lean needs Simulation. Winter Simulation
Conference.
Yavas, U., Luqmani, M. & Quraeshi, Z.A., (1989). Purchasing Efficacy in an Arabian Gulf
Country. International Journal of Physical Distribution & Logistics Management, 19(4), 20-5.
Xia, W. & Wu, Z. (2005). An effective hybrid optimization approach for multi-objective flexible
job-shop scheduling problems. Computers & Industrial Engineering, 48, 409–425.
Xu, J., Li, B. & Wu, D., (2009). Rough data envelopment analysis and its application to supply
chain performance evaluation. International Journal of Production Economics, 122, 628–638.
Zhu, X. & Wilhelm, W. E. (2006). Scheduling and lot sizing with sequence-dependent setup: A
literature review. IIE Transactions, 38(11), 987-1007.

Appendix
87
Appendix Appendix A List of Customers
The customers of KLM Engineering & Maintenance are listed in the table above (Table 23). Customers
are contracted with KLM Engineering & Maintenance. The send their unserviceable aircrafts components
from all over the world to the Logistics center of KLM Engineering & Maintenance. Based on the
contracts and agreements, the Logistics center employees perform the correct administration and
deliver the components internally to KLM shops or to external repair vendors. The contracted repair
vendors vary and origin form all over the world. The aircraft components are sent back to the Logistics
center of KLM Engineering & Maintenance after the repair process, where administration is performed
once again to deliver the components back to the customers or store them to the warehouse within the
Logistics center for later usage.
Table 23: List of KLM Engineering & Maintenance Customers
Customer
Aeroinstruments
Aerospace
Aerotech Aircraft Maintenance
AirFrance
Air Madagascar
Air New Zealand
Atlas Air
Atlantic Airways
Bangkok Airways
Boeing
Corendon Airlines
CSP
Epcor
Finnair
Garuda Indonesia
GMF Aeroasia
Hamiliton
Hero Technology
HK Aircraft Engineering
Jetz
Jet Airways
JetLite
Kenic Electric
Kenya Airways
KLM
KLM Miami
Lan Airlines
Latam Airlines
Polskie Linie Lotnicze LOT

Appendix
88
Appendix B Sidestep Processes
The following figures (Figure 35-36) visualize the process' sidesteps as they have been described in
Chapter 2. The "Scoping" and "Troubleshooting" process have not been including in the work scope of
the project, despite the big delay in time when the component follows the sidestep. They mainly regard
to giving solutions and investigating several issues or troubles encountered in the main process. The
case of missing certain type of information, which cannot be easily found in the system by the outbound
Logistics employees is very common and requires the attention of other employees whose main
occupation is to provide immediate solutions.
Malaysia Airlines
Martinair
MCR
MLC
Oman Airlines
Revima
Royal Brunei
Royal Air Maroco
South African Airways
Specialized Freight Forwarden BV
Sunwing Airlines
Thai Airways
TNT Airways
VGAL
Virgin Atlantic
Xiamen Airlines
Secura Plain
SR Technics
Taeco Aircraft Engineering
Transavia France
UH Engineering
Zodiac Aerospace

Appendix
89
Figure 35: Scoping Sidestep
Figure 36: Troubleshooting Sidestep
Appendix C Outbound Logistics Areas
The following photos (Figure 37-39) show the critical stations of the outbound Logistics in the Logistics
center at KLM Engineering & Maintenance. In the first picture (Figure 37), components are placed in
buffer 1 by expedition personnel. Each component is delivered within its appropriate package, on which
a tracking sticker and a date label are attached. If needed warning sticker must be put on the box at a
visible spot.

Appendix
90
Figure 37: Photo of Components at Buffer 1
Figure 38, presents the physical inspectors working place. A clean surface, where the boxes are placed and opened compromises the main working space of
the physical inspector. Important tools to complete its task are a computer, where he/she can search and/or check important information, a magnifying lens
for identifying small letters and numbers on the components’ ids, cleaning solution, in case of a dirty component, the requested form and several other tools
that would help the physical inspector successfully complete his/her task.
Figure 38: Physical Inspector's Working Place
Buffer 2 (Figure 39) is the step between the physical inspection and repair administration. Components
are dispatched there after physical inspection. Their important papers and the completed form from the
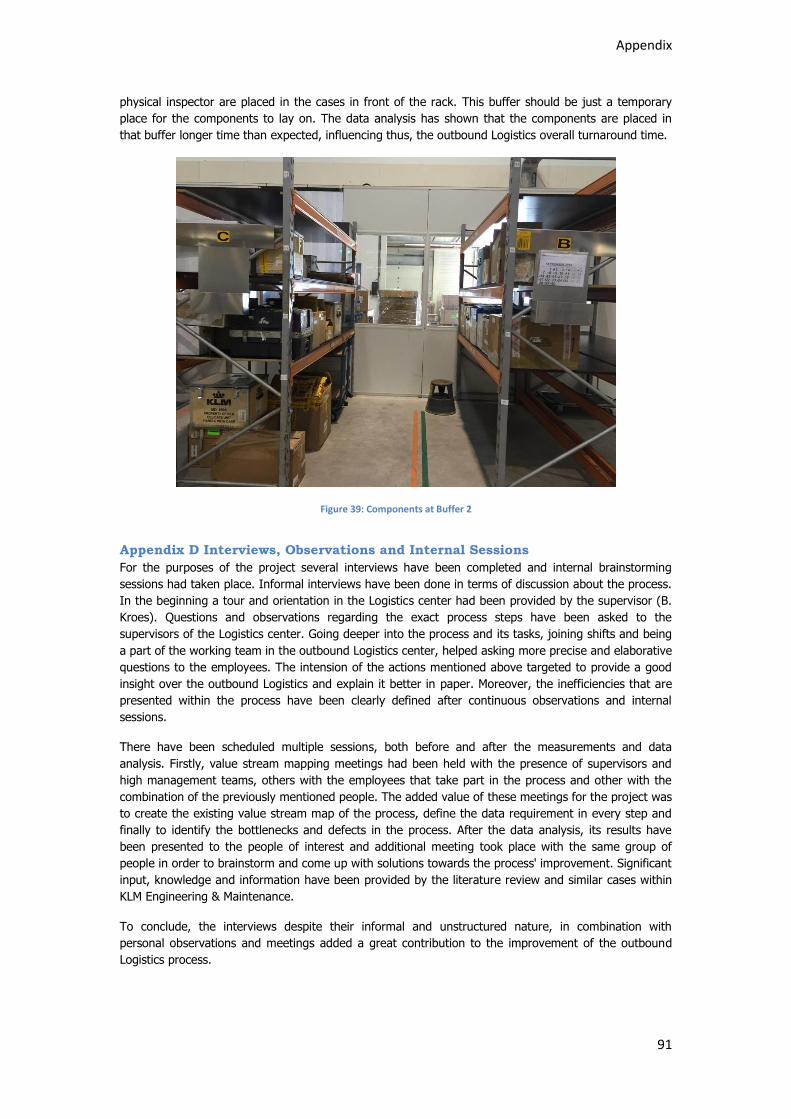
Appendix
91
physical inspector are placed in the cases in front of the rack. This buffer should be just a temporary
place for the components to lay on. The data analysis has shown that the components are placed in
that buffer longer time than expected, influencing thus, the outbound Logistics overall turnaround time.
Figure 39: Components at Buffer 2
Appendix D Interviews, Observations and Internal Sessions
For the purposes of the project several interviews have been completed and internal brainstorming
sessions had taken place. Informal interviews have been done in terms of discussion about the process.
In the beginning a tour and orientation in the Logistics center had been provided by the supervisor (B.
Kroes). Questions and observations regarding the exact process steps have been asked to the
supervisors of the Logistics center. Going deeper into the process and its tasks, joining shifts and being
a part of the working team in the outbound Logistics center, helped asking more precise and elaborative
questions to the employees. The intension of the actions mentioned above targeted to provide a good
insight over the outbound Logistics and explain it better in paper. Moreover, the inefficiencies that are
presented within the process have been clearly defined after continuous observations and internal
sessions.
There have been scheduled multiple sessions, both before and after the measurements and data
analysis. Firstly, value stream mapping meetings had been held with the presence of supervisors and
high management teams, others with the employees that take part in the process and other with the
combination of the previously mentioned people. The added value of these meetings for the project was
to create the existing value stream map of the process, define the data requirement in every step and
finally to identify the bottlenecks and defects in the process. After the data analysis, its results have
been presented to the people of interest and additional meeting took place with the same group of
people in order to brainstorm and come up with solutions towards the process' improvement. Significant
input, knowledge and information have been provided by the literature review and similar cases within
KLM Engineering & Maintenance.
To conclude, the interviews despite their informal and unstructured nature, in combination with
personal observations and meetings added a great contribution to the improvement of the outbound
Logistics process.
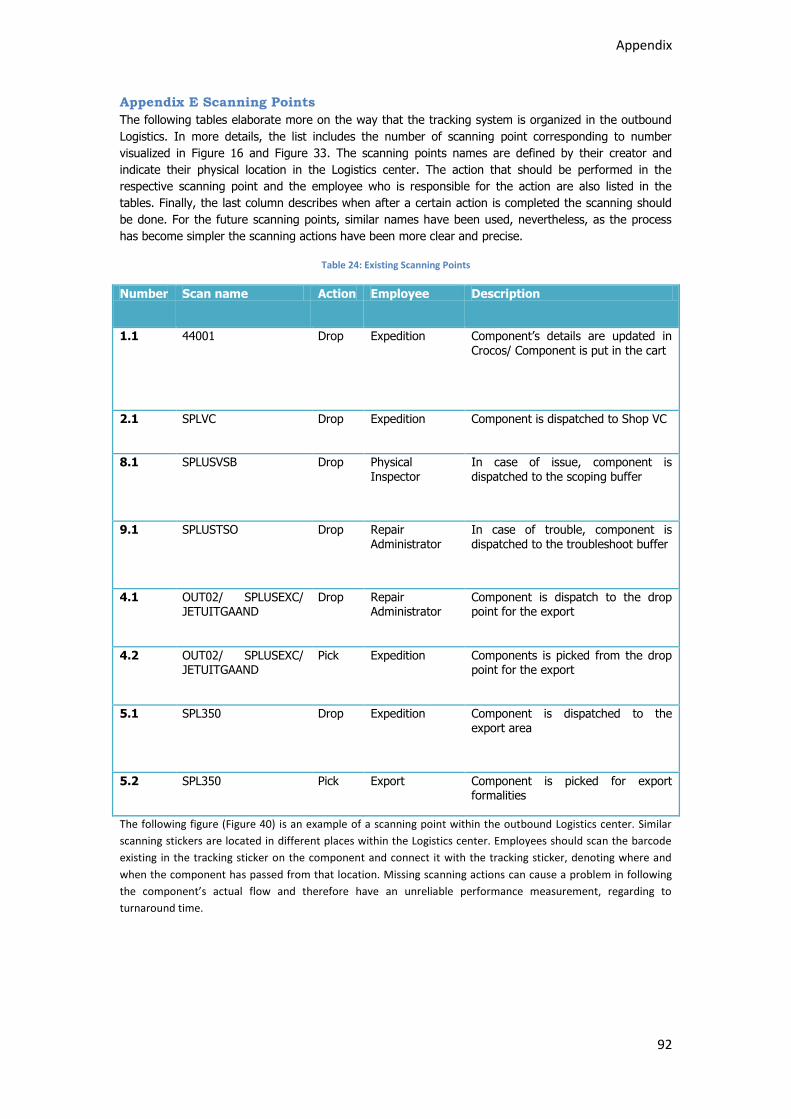
Appendix
92
Appendix E Scanning Points
The following tables elaborate more on the way that the tracking system is organized in the outbound
Logistics. In more details, the list includes the number of scanning point corresponding to number
visualized in Figure 16 and Figure 33. The scanning points names are defined by their creator and
indicate their physical location in the Logistics center. The action that should be performed in the
respective scanning point and the employee who is responsible for the action are also listed in the
tables. Finally, the last column describes when after a certain action is completed the scanning should
be done. For the future scanning points, similar names have been used, nevertheless, as the process
has become simpler the scanning actions have been more clear and precise.
Table 24: Existing Scanning Points
Number Scan name Action Employee Description
1.1 44001 Drop Expedition Component’s details are updated in Crocos/ Component is put in the cart
2.1 SPLVC Drop Expedition Component is dispatched to Shop VC
8.1 SPLUSVSB Drop Physical Inspector
In case of issue, component is dispatched to the scoping buffer
9.1 SPLUSTSO Drop Repair Administrator
In case of trouble, component is dispatched to the troubleshoot buffer
4.1 OUT02/ SPLUSEXC/ JETUITGAAND
Drop Repair Administrator
Component is dispatch to the drop point for the export
4.2 OUT02/ SPLUSEXC/ JETUITGAAND
Pick Expedition Components is picked from the drop point for the export
5.1 SPL350 Drop Expedition Component is dispatched to the export area
5.2 SPL350 Pick Export Component is picked for export formalities
The following figure (Figure 40) is an example of a scanning point within the outbound Logistics center. Similar
scanning stickers are located in different places within the Logistics center. Employees should scan the barcode
existing in the tracking sticker on the component and connect it with the tracking sticker, denoting where and
when the component has passed from that location. Missing scanning actions can cause a problem in following
the component’s actual flow and therefore have an unreliable performance measurement, regarding to
turnaround time.

Appendix
93
Figure 40: Example of Scanning Point
The table below (Table 25) lists the proposed scanning points and their description. The combination of existing
scanning points with some alterations and new scanning points would provide a very good tool for the
performance management in the Logistics center. The employees are requested to perform the correct scanning
action at the correct time in order to have a complete overview in the tracking system, retrieve reliable
information and therefore create representative performance reports.
Table 25: Future State Scanning Points
Number Scan Drop/Pick Employee Description
1.1 44001 Drop Expedition Component arrives to Expedition
1.2 44001 Pick Expedition Component’s details are updated in Crocos/ Component is put in the cart
2.1 SPLVC Drop Expedition Component is dispatch to Shop VC/ different lanes of KLM/ external/ forward
exchange
2.2 SPLVC Pick Physical Inspector & Repair Administrator
Component is picked for visual inspection and repair administration
7.1 SPLUSVSB Drop Physical Inspector & Repair Administrator
In case of issue, component is dispatched to the scoping buffer
7.2 SPLUSVSB Pick Physical Inspector & Repair Administrator
After scoping the repair administrator picks the component from the solved scoping buffer (always priority)
8.1 SPLUSTSO Drop Physical Inspector & Repair Administrator
In case of trouble, component is dispatched to the troubleshoot buffer
8.2 SPLUSTSO Pick Physical Inspector & Repair Administrator
After troubleshoot, repair administrator picks the component form the solve troubleshoot buffer (always priority)
3.1 OUT02 Drop Repair Administrator Component is dispatch to the drop point for the export
3.2 OUT02 Pick Expedition Components is picked from the drop point for the export
4.1 SPL350 Drop Expedition Component is dispatched to the export area
4.2 SPL350 Pick Export Component is picked for export formalities

Appendix
94
Appendix F Data Measurements
The following tables are the measurement checklists that have been created for the data collection and
measurement performed in the outbound Logistics for the purposes of the research. Multiple external
employees had been hired and helped completing the lists while joining some shifts with the Logistics
personnel. They had been assigned to follow the employees tasks and carefully fill in the forms
regarding to the components' data. Moreover, they have been asked to perform scanning to the correct
scanning points so that information about the exact time and location of the component can be stored
in the system and used further for the analysis.
Table 26: Measurements Checklist for Physical Inspectors
Data collection plan - Ingangscontrole
Date- Hour
Name
Employees
Physical Inspection Uitpakker VC
Comp Barcode Issue Scoping Customer
Codenumber
Following number
Other Remarks
1
2
3
4
5
Table 27: Measurement's Checklist for Repair Administrators
Data collection plan - Ingangscontrole
Date- Hour
Name
Employees
Repair Administration
Component Barcode
Completed form
Issue
Customer/Origin
Destination/ Repair Station
Shop Order
Scoping/TSO
New Barcode
Time (Start-Finish)
1
2
3
4
5
Appendix G Ready for Outsource List
The following tables are the result of three value stream meetings. Several employees (repair
administrators) and supervisors attended the meeting given the task to list the steps in sequence that
are taken in order to make a component ready for outsource. The table’s columns are the following:
Screen: in the system – software
Input: the required input that is given in every screen
Data not found: what action or alternative is taken if the required input data is not known
Output: the data that is retrieved by every screen
Notes: any comment related to the respective step

Appendix
95
Due to the fact that different steps are made for the different types of components’ streams, the same
list has been applied for the three main streams of the outbound Logistics (Pool VC, FE and internal and
external CLA). An example of the outcome is presented in the tables below (Table 28 and Table 29).
Table 28: Ready for Outsource Pool VC
Screen/ action Input Data is not found Output
TVI Code & following number
Cross check Check STRU/ UN/
TBL Code number Purchasing mail SPL/TP Vendor code
TKOU TUURK, label kist reg TSO Registration hours
IW33 Label number Check SAP status
Surplus check Code number Software Outsourcing Either Software Outsourcing or MDH
TRAM Code & following number
Control limits
TWEG Code & following number
Order notes
TREF Code & following number & kist reg
Contract indicator
TRAL Code & following number
Check assy structure
TWI Code & following number
Data correction
TWO Code & following number
Within report in WPH Physical WOP
TMG Code number Check sum/ UN
TWVI Code & following number
Mod/ SB/ EO/ etc.
RIAC Code & following number & kist reg
Software Outsourcing with reason: US
Complaint/ Reason of removal
AEX Search KI action Control
TUB Code & following number
Requisition number
Tracking sticker
creation
Requisition number sticker
Sticker connection Old and new sticker Connection in Tracking
ME21N Oi number Repair order (print)
AdsubCon Repair order Invoice
Mission taping incl control
TUBA Label number Final Software Outsourcing
Data storage
Table 29: Ready for Outsource FE
Screen/ action Input Data is not found?
Output
Sort in the buffer Code number: 33* 43* 68*
Packaging workshop code
FE
TVI Part number, serial number & label number
Info
IW33 Label number Check SAP status
TKOU TUURK, label kist reg TSO Registration hours
TBL Code number Purschasing mail SPL/TP
Vendor code
TRAM Code & following number Control limits
TWEG Code & following number Order notes

Appendix
96
TREF Code & following number & kist reg
Contract indicator
TRAL Code & following number Check assy structure
TWO Code & volg nr Binnen melden in WPH Fysieke WOP
TWPR Label number Code & following number
TMG Code number Control UN
TWVI Code & following number Mod/ SB/ EO/ etc
RIAC/ RMSA Code & following number & kist reg
Outsourcing with reason: US
Complaint/ Reason of removal
Tracking Sticker creation
Requisition number sticker
Sticker connection
Old and new sticker Connection in Tracking
FEXtool Code & following number, vliegtuig reg, complaint,
Vendorcontrol FWD (create invoice)
Pro forma Invoice Houres, TVI info Pro forma
Mission taping incl control
3x PI
TWS Label number Status IK VV
Tracking scan Barcode/ scanner scan
Data storage / paper scan
Appendix I Formal Statement of the Algorithm The algorithm is presented in the terms of pseudo code in this appendix. The notations used and the variables explanation have been defined in the following text.
Independen t var iab le s :
o: number of different types of employees
b: number of buffers between the employees
components: number of components delivered in the logistics center (drop VC) per month, day and shift (day shift:0-15, evening shift:16-23)
employee[n]: number of employees 1...n per shift
touch_time_employee[n]: random touch time of the employees 1...n between the measured timings
percentages: percentage of each type of component's occurrences, based on the measurements
max_employee:[n] the maximum number of components that can be process by employees 1...n
Dependent v ar iab les :
buffer[b]: Number of uncompleted components from previous shift plus the number of components delivered in the initial buffer[1]
type_employee[o]: Number of components in the buffer[b] times the percentage of type1...8. The percentage is retrieved from the "constant's" sheet and is calculated from personal
measurements in the logistics center
handling_time_employee[o]: the function calculates the time that is needed to complete the entire number of components in the buffer1. The touch time is retrieved from the "constant's"
sheet and is calculated by the tracking system and personal measurements per type of component. The handling time is divided by the number of employees in order to calculate the time
needed to complete the buffer 1 using the existing capacity. The number of employees is retrieved from the "schedule" sheet and is taken randomly. Different scenarios and schedules
need to be tested, examined and analyzed in order to find the best alternative.
completed_employee[o]: if the handling time is less than the shift's time (390 minutes) it means that the employees can complete all the components that are in buffer[b], otherwise we
make the assumption that they can complete only the maximum number of components per shift that is calculated in the maximization function in "constant's" sheet.
uncompleted_employee[o]: is the difference between the number of components that are in the buffer and the number of completed components
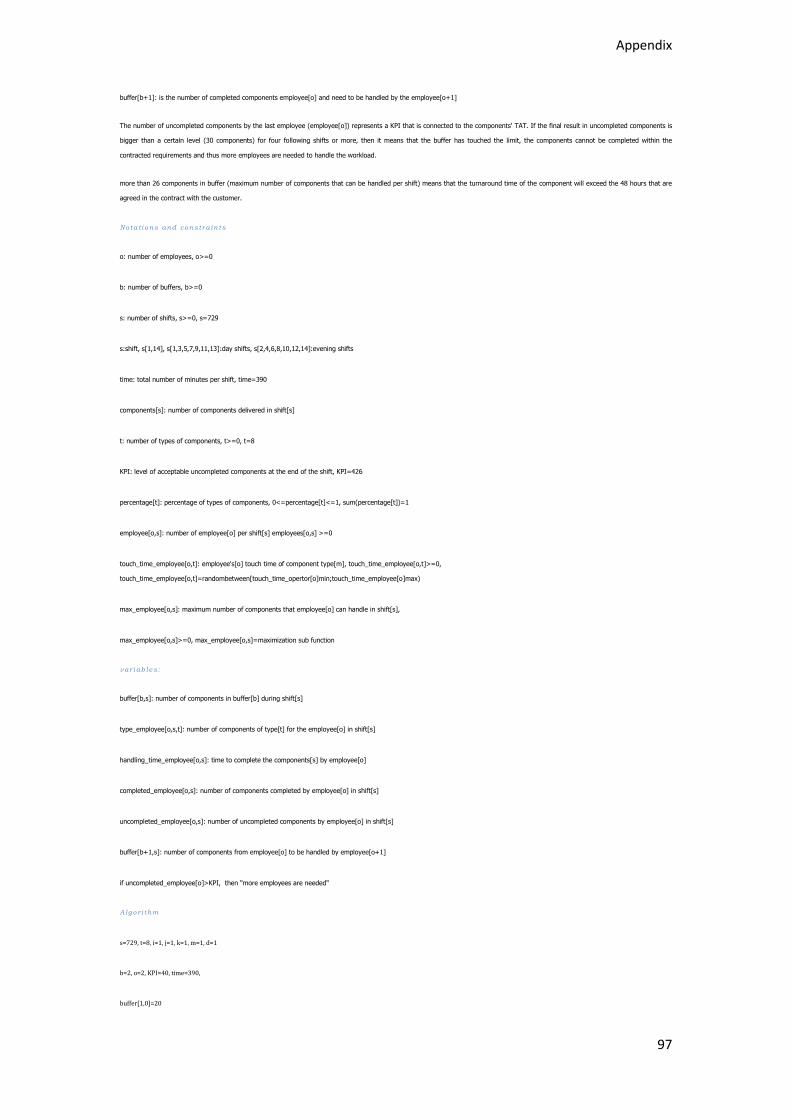
Appendix
97
buffer[b+1]: is the number of completed components employee[o] and need to be handled by the employee[o+1]
The number of uncompleted components by the last employee (employee[o]) represents a KPI that is connected to the components' TAT. If the final result in uncompleted components is
bigger than a certain level (30 components) for four following shifts or more, then it means that the buffer has touched the limit, the components cannot be completed within the
contracted requirements and thus more employees are needed to handle the workload.
more than 26 components in buffer (maximum number of components that can be handled per shift) means that the turnaround time of the component will exceed the 48 hours that are
agreed in the contract with the customer.
No ta t i ons and con s tr a in ts
o: number of employees, o>=0
b: number of buffers, b>=0
s: number of shifts, s>=0, s=729
s:shift, s[1,14], s[1,3,5,7,9,11,13]:day shifts, s[2,4,6,8,10,12,14]:evening shifts
time: total number of minutes per shift, time=390
components[s]: number of components delivered in shift[s]
t: number of types of components, t>=0, t=8
KPI: level of acceptable uncompleted components at the end of the shift, KPI=426
percentage[t]: percentage of types of components, 0<=percentage[t]<=1, sum(percentage[t])=1
employee[o,s]: number of employee[o] per shift[s] employees[o,s] >=0
touch_time_employee[o,t]: employee's[o] touch time of component type[m], touch_time_employee[o,t]>=0,
touch_time_employee[o,t]=randombetween[touch_time_opertor[o]min;touch_time_employee[o]max)
max_employee[o,s]: maximum number of components that employee[o] can handle in shift[s],
max_employee[o,s]>=0, max_employee[o,s]=maximization sub function
var iab les :
buffer[b,s]: number of components in buffer[b] during shift[s]
type_employee[o,s,t]: number of components of type[t] for the employee[o] in shift[s]
handling_time_employee[o,s]: time to complete the components[s] by employee[o]
completed_employee[o,s]: number of components completed by employee[o] in shift[s]
uncompleted_employee[o,s]: number of uncompleted components by employee[o] in shift[s]
buffer[b+1,s]: number of components from employee[o] to be handled by employee[o+1]
if uncompleted_employee[o]>KPI, then "more employees are needed"
Alg o r i thm
s=729, t=8, i=1, j=1, k=1, m=1, d=1
b=2, o=2, KPI=40, time=390,
buffer[1,0]=20

Appendix
98
uncompleted_employee[2,0]=30
While i<=s
d=1
While k>=b, and m>=o
While d<=14
While uncompleted_employee[m,i,d]<=KPI
buffer[k,i]←components[i]+buffer[k,i-1]
While j<=t
type_employee[m,i,j] ← components[i]*percentage[j]
handling_time_employee[m,i] ←sum(touch_time_employee[m,i]*type_employee[m,i,j])/employee[m,d]
j++
END While
If handling_time_employee[m,i]<=time or buffer[k, i]<=max_employee[m, i] then
completed_employee[m,i] ←buffer[k, i]
else
completed_employee[k,i] ←max_employee[m,i]
End If
uncompleted_employee[m,i]←buffer[k, i]-completed_employee[m, i]
k++
m++
buffer[k,i]←completed_employee[m1,i]+uncompleted_employee[m,i1]
If buffer[k,i]>KPI then
"more employees are needed"
employee[m,i,d]← employee[m,i,d]+1
END if
i++
d++
END While
END While
END While

Appendix
99
Appendix J Data Creation
The following tables represent the data which have been created and used in the context of the calculation
model. First the components which are delivered in the Logistics center are categorized, based on their quality
(complete, missing data etc) and attached with a percentage of occurrence. Afterwards the minimum and
maximum physical inspector's and repair administrator's handling times per type of component have been listed
and a random time has been calculated each time that the simulation runs. Finally, the maximum personnel's
capability has been calculated based on the number of each type of components and their touch times per type
of employees.
Table 30: Type of Components and Percentages of Occurrence
Type Description Percentage
Type 1 Complete Component 0,3
Type 2 Missing Data 0,2
Type 3 Missing ID Plate 0,09
Type 4 Missing Reason of Removal 0,09
Type 5 Missing Warning Sticker 0,04
Type 6 Wrong Packaging 0,03
Type 7 Warranty Conversion 0,05
Type 8 Other 0,2
Table 31: Physical Inspector's Touch Times per Type of Component & Capacity
Type touch time
physical Inspector min
touch time
physical Inspector r max
touch time
physical Inspector
1 2,43 31,1 15
2 5,54 13 8
3 4,36 6 6
4 4,5 18,07 12
5 8 11,13 8
6 6,44 16,19 7
7 2,43 31,1 24
8 1,44 26 20
capacity 28
Table 32: Repair Administrator's Touch Times per Type of Component & Capacity
Type touch time
repair administrator
min
touch time
repair administrator
max
touch time
repair administrator
1 15 35 23
2 15 78 23
3 15 35 34
4 15 66 25
5 15 35 29
6 15 35 28

Appendix
100
7 15 66 38
8 15 120 94
capacity 27
Appendix K Simulation Results
The graphs below visualize the number of uncompleted components in the critical buffer at the end of every shift
as it has been given from the application of the calculation model. For each version and every scenario developed
different graphs have been resulted. From the graphs the percentage of on time deliveries can be easily
calculated and it has been listed in Table 21.
Figure 41: Critical Buffer Level Scenario 1.1
Figure 42: Critical Buffer Level Scenario 1.2
0
5
10
15
20
25
30
35
40
45
1
28
55
82
10
9
13
6
16
3
19
0
21
7
24
4
27
1
29
8
32
5
35
2
37
9
40
6
43
3
46
0
48
7
51
4
54
1
56
8
59
5
62
2
64
9
67
6
70
3
73
0
Number of uncompleted Components Version 1, Scenario 1
0
20
40
60
80
100
120
1
23
45
67
89
11
1
13
3
15
5
17
7
19
9
22
1
24
3
26
5
28
7
30
9
33
1
35
3
37
5
39
7
41
9
44
1
46
3
48
5
50
7
52
9
55
1
57
3
59
5
61
7
63
9
66
1
68
3
70
5
72
7
Number of uncompleted Components Version 1, Scenario 2
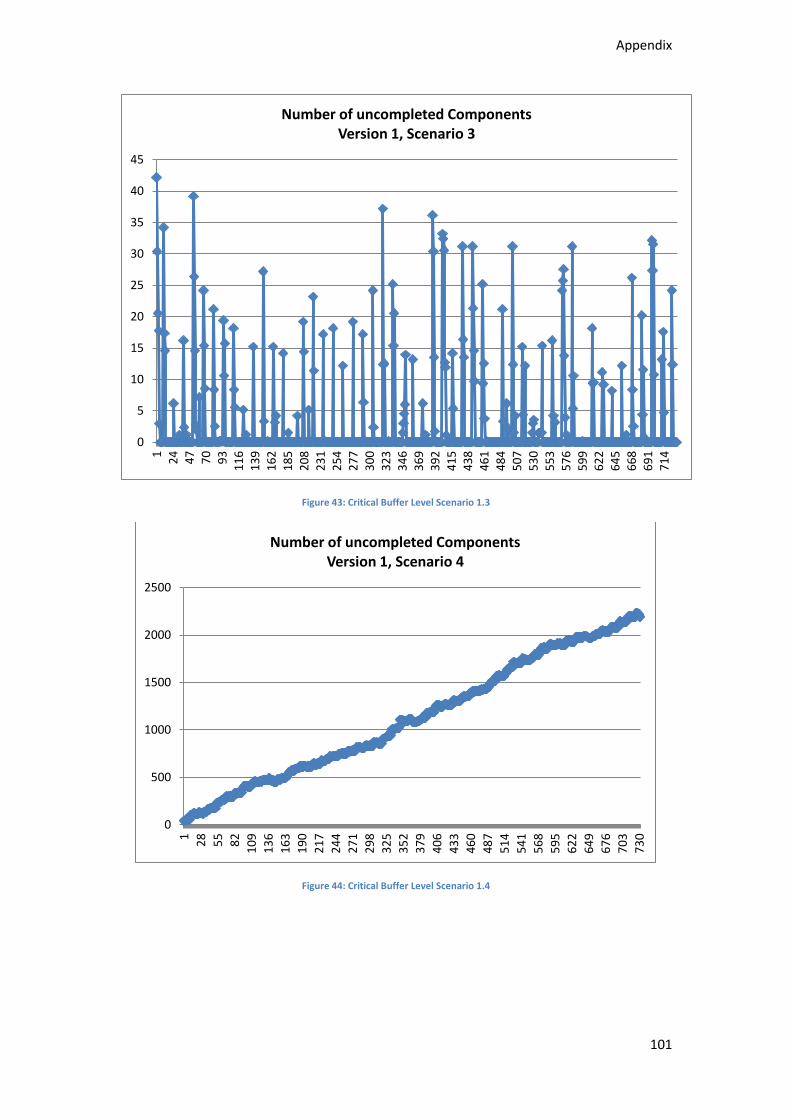
Appendix
101
Figure 43: Critical Buffer Level Scenario 1.3
Figure 44: Critical Buffer Level Scenario 1.4
0
5
10
15
20
25
30
35
40
45 1
2
4
47
7
0
93
1
16
1
39
1
62
1
85
2
08
2
31
2
54
2
77
3
00
3
23
3
46
3
69
3
92
4
15
4
38
4
61
4
84
5
07
5
30
5
53
5
76
5
99
6
22
6
45
6
68
6
91
7
14
Number of uncompleted Components Version 1, Scenario 3
0
500
1000
1500
2000
2500
1
28
55
82
10
9
13
6
16
3
19
0
21
7
24
4
27
1
29
8
32
5
35
2
37
9
40
6
43
3
46
0
48
7
51
4
54
1
56
8
59
5
62
2
64
9
67
6
70
3
73
0
Number of uncompleted Components Version 1, Scenario 4

Appendix
102
Figure 45: Critical Buffer Level Scenario 1.5
Figure 46: Critical Buffer Level Scenario 1.6
0
5
10
15
20
25
30
35
40
45 1
23
45
67
89
11
1
13
3
15
5
17
7
19
9
22
1
24
3
26
5
28
7
30
9
33
1
35
3
37
5
39
7
41
9
44
1
46
3
48
5
50
7
52
9
55
1
57
3
59
5
61
7
63
9
66
1
68
3
70
5
Number of uncompleted Components Version 1, Scenario 5
0
5
10
15
20
25
30
35
40
45
50
1
22
4
3
64
8
5
10
6
12
7
14
8
16
9
19
0
21
1
23
2
25
3
27
4
29
5
31
6
33
7
35
8
37
9
40
0
42
1
44
2
46
3
48
4
50
5
52
6
54
7
56
8
58
9
61
0
63
1
65
2
67
3
69
4
71
5
Number of uncompleted Components Version 1, Scenario 6

Appendix
103
Figure 47: Critical Buffer Level Scenario 2.1
Figure 48: Critical Buffer Level Scenario 2.2
0
5
10
15
20
25
30
35 1
26
51
76
10
1
12
6
15
1
17
6
20
1
22
6
25
1
27
6
30
1
32
6
35
1
37
6
40
1
42
6
45
1
47
6
50
1
52
6
55
1
57
6
60
1
62
6
65
1
67
6
70
1
72
6
Number of uncompleted Components Version 2, Scenario 1
0
500
1000
1500
2000
2500
3000
1
27
53
79
10
5
13
1
15
7
18
3
20
9
23
5
26
1
28
7
31
3
33
9
36
5
39
1
41
7
44
3
46
9
49
5
52
1
54
7
57
3
59
9
62
5
65
1
67
7
70
3
72
9
Number of uncompleted Components Version 2, Scenario 2

Appendix
104
Figure 49: Critical Buffer Level Scenario 2.3
Figure 50: Critical Buffer Level Scenario 2.4
0
20
40
60
80
100
120
140
160
180 1
23
45
67
89
11
1
13
3
15
5
17
7
19
9
22
1
24
3
26
5
28
7
30
9
33
1
35
3
37
5
39
7
41
9
44
1
46
3
48
5
50
7
52
9
55
1
57
3
59
5
61
7
63
9
66
1
68
3
70
5
72
7
Number of uncompleted Components Version 2, Scenario 3
0
500
1000
1500
2000
2500
3000
3500
4000
4500
5000
1
24
47
70
93
11
6
13
9
16
2
18
5
20
8
23
1
25
4
27
7
30
0
32
3
34
6
36
9
39
2
41
5
43
8
46
1
48
4
50
7
53
0
55
3
57
6
59
9
62
2
64
5
66
8
69
1
71
4
Number of uncompleted Components Version 2, Scenario 4

Appendix
105

Appendix
106
Related Documents