Improving Teaching and Learning in Intro Stat Classes with Student Response Systems: pre- Implementation Discussion Dr. Kehui Chen, Assistant Professor Dr. Nancy Pfenning, Senior Lecturer University of Pittsburgh Dept. of Statistics dB_SERC August 2015

Welcome message from author
This document is posted to help you gain knowledge. Please leave a comment to let me know what you think about it! Share it to your friends and learn new things together.
Transcript
Improving Teaching and Learning in Intro Stat Classes with Student Response Systems:
pre-Implementation Discussion
Dr. Kehui Chen, Assistant ProfessorDr. Nancy Pfenning, Senior Lecturer
University of Pittsburgh Dept. of StatisticsdB_SERC August 2015
Summary of Abstract
Proposed developing and conducting use of student response system (“clickers”) for • surveys and short quizzes throughout the semester
to achieve more effective communication between the instructor and students
• specially designed data-generating activities to improve concept learning in statistics sampling
• interactive case studies to help students apply statistical methods to real data analysis
Summary of Abstract (continued)
Proposal includes plans for• documentation, adaptation to other intro-
level statistics classes• assessment of learning gains and attitude
improvements
Background
Very broad cross-section of close to 1,000 Pitt students take intro stats each semester.Communication needed for optimal teaching/learning:• Students benefit from ongoing awareness of their
strengths and weaknesses relative to instructor’s expectations as well as their peers
• Instructors should closely monitor knowledge, understanding

General Challenge #1 for Intro Stats Instruction
Large class sizes (typically 80+) limit opportunities for..• in-class discussions so students can gauge self- and
peer- understanding (Typical hindrance to learning: Students inclined to give up because “everyone but me knows what’s going on”)• frequent graded quizzes so instructor can monitor all
students’ progress (Typical hindrance to instructor setting appropriate pace: Unaware of students’ failure to comprehend ideas until they perform poorly on an exam)
Facilitating Self- and Instructor- Awareness of Students’ Comprehension
Immediate anonymous responses with clickers facilitate:• Students’ gauging their own understanding
concurrently with that of peers in a way that saves time AND prevents embarrassment
• “Reality check” so instructor knows immediately when a skill or concept requires further explanation (or when it’s time to move on to new material)
General Challenge #2 for Intro Stats Instruction
Key processes in learning Statistics:• design of experiments/observational studies• data collection• data cleaning• data analysisBecause of time constraints, traditional lecture mainly just focuses on data analysis.

Clickers to Convey all Key Processes of Intro Stats Instruction
Activities can highlight:• study design: how to divide class into
treatment/control groups, etc.• data collection: anonymity, sampling bias, which
response options to provide, etc. • data cleaning: possible modification of response files• data analysis: opportunity for immediate displays and
summaries of meaningful data from students themselves
General Challenge #3 for Intro Stats Instruction
Common “missing link” in understanding:Probability and Sampling DistributionsWhereas recitations may be conducted in computer lab, with software available to explore behavior of repeated random samples, lecturers ordinarily can’t gather data on the spot from all class members electronically

Clickers to Convey Key Ideas of Probability and Sampling Distributions
Instead of students having to take it on faith that instructor has conjured up multiple random samples, each student participates actively in the process and witnesses patterns as they unfold in real time.
Proposed Transformations
1. Surveys and Short Quizzes• First-day clicker-based survey of students’ backgrounds• First-day administration of pre-test featuring well-established valid,
reliable conceptual questions taken from CAOS* instrument• Subsequent survey about attitudes and ability to self-assess
progress• Periodic insertion of questions for students to discuss, then answer
via clickers, addressing most challenging concepts as identified by the instructor and experienced TA
• Last-day administration of post-test(* Comprehensive Assessment of Outcomes in a first Statistics course, developed by delMas et al)

Proposed Transformations
2. Concept Learning via Clicker Activities (examples) • Sampling Distributions: Generate repeated collection of
sample means or proportions, explore as a group how patterns evolve, observe differences resulting from modifying population parameter, sample size, etc.
• Inference: Generate repeated collection of confidence intervals or hypothesis test P-values to best understand how these inference results behave in the long run
Proposed Transformations
3. Interactive Case Study and Peer InstructionGroup data analysis (eg. simple regression) by class using a real data set: Pose multiple-choice questions at each key step, have students discuss with classmates, then choose most appropriate way to proceed. This gives them experience in making appropriate problem solving decisions on their own, and developing critical thinking.

Goals and Assessments
Goal #1: More Effective CommunicationAssessment #1: Survey questions will ask students extent to which they agree with statements like, “For most of the lectures, I had a pretty good idea of how much my classmates and I were understanding new material.” Results will be compared with those of students in a non-clicker-based lecturer’s class.
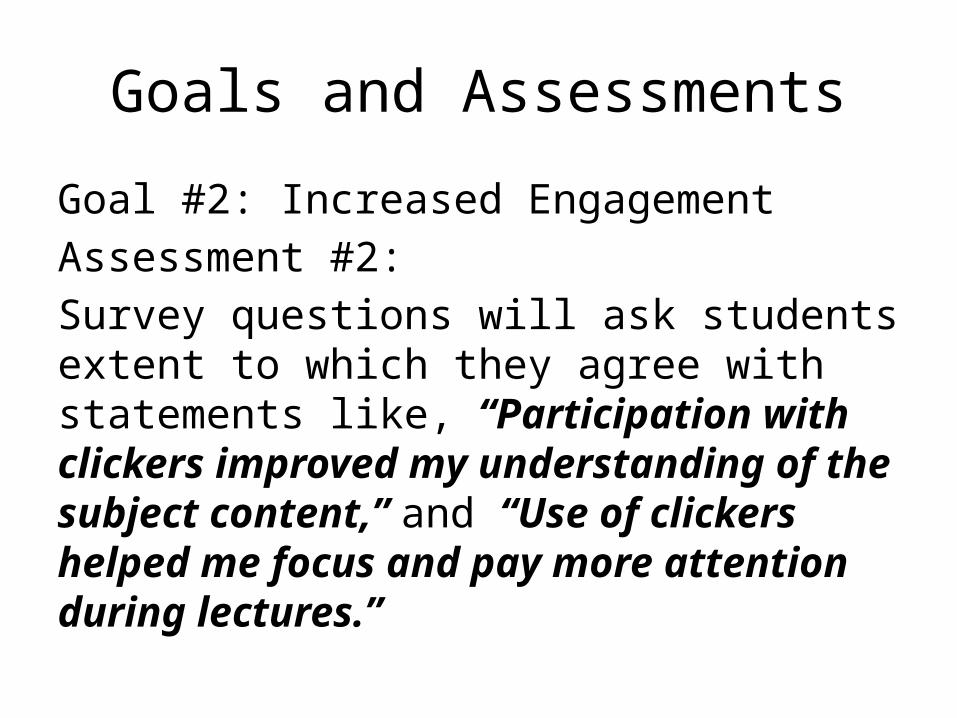
Goals and Assessments
Goal #2: Increased EngagementAssessment #2: Survey questions will ask students extent to which they agree with statements like, “Participation with clickers improved my understanding of the subject content,” and “Use of clickers helped me focus and pay more attention during lectures.”

Goals and Assessments
Goal #3: Improved Conceptual LearningAssessments #3: • Pre- to post-test: gains will be compared for
items based on “transformed” material versus items based on non-transformed material.
• Midterm and final exams: performance will be compared for items testing on “transformed” material versus items testing on non-transformed material.
Challenges and Responding Plans
To offset additional time taken up by use of clickers, students’ feedback will guide instructor to reduce time on topics that they grasp quickly.
Experienced Graduate TAs will be part of the course transformation. The instructor will have frequent communication with recitation TAs to use lecture time more effectively.

Sustainability, Scalability
• Clickers provided by this dB-SERC grant will be available for other Fall 2015 and future classes
• Testing of clicker function can be done periodically by students in lecture
• Maintenance costs (eg. replacement batteries) will be requested from Stats Dept.
• Materials developed (eg. questions, activities) will be made available to other intro-stats instructors
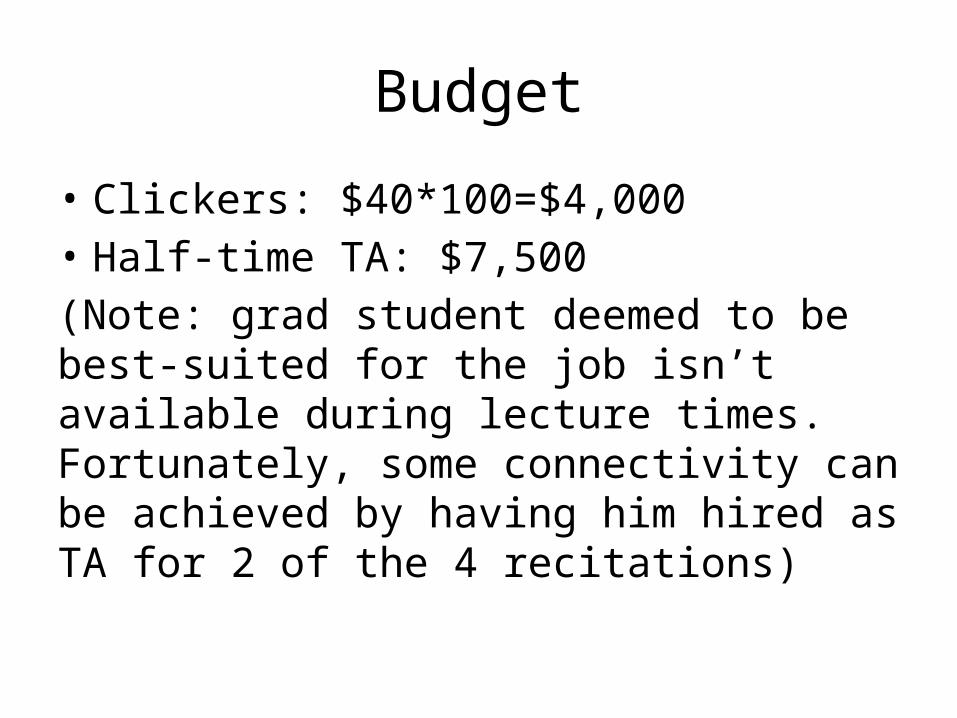
Budget
• Clickers: $40*100=$4,000• Half-time TA: $7,500(Note: grad student deemed to be best-suited for the job isn’t available during lecture times. Fortunately, some connectivity can be achieved by having him hired as TA for 2 of the 4 recitations)

Example 1: Clicker Activity for Understanding Standard Deviation
Display distribution and discuss standard deviations when students use clickers to haphazardly choose...• between options 1 and 5;• then between options 1, 2, 3, 4, 5;• then between options 2, 3, 4.(The first will have largest sd, the last will have smallest.)

Example 1 Concept: Understanding Standard Deviation
• CAOS Questions #14 & 15: Five histograms are presented below. Each histogram displays test scores on a scale of 0 to 10 for one of five different statistics classes.

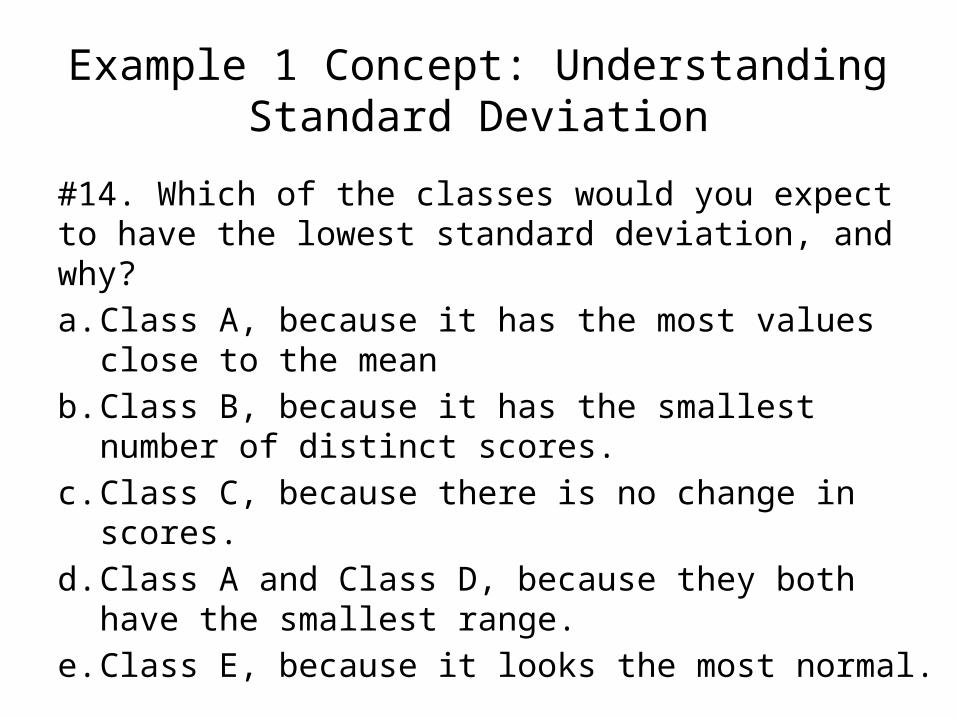
Example 1 Concept: Understanding Standard Deviation
#14. Which of the classes would you expect to have the lowest standard deviation, and why?a. Class A, because it has the most values close to
the meanb. Class B, because it has the smallest number of
distinct scores.c. Class C, because there is no change in scores.d. Class A and Class D, because they both have the
smallest range.e. Class E, because it looks the most normal.
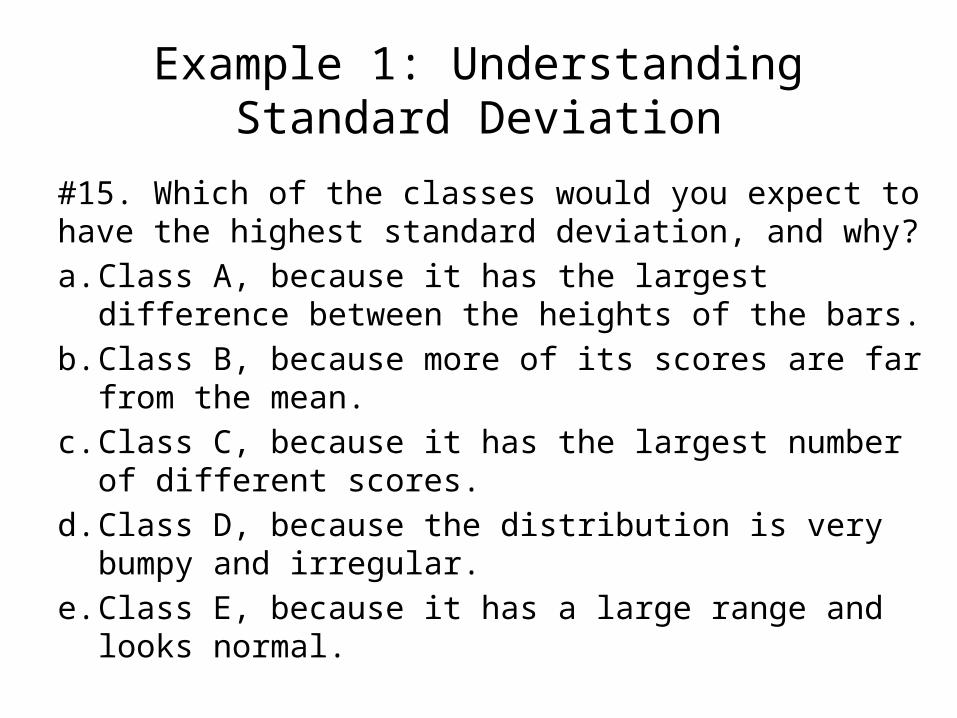
Example 1: Understanding Standard Deviation
#15. Which of the classes would you expect to have the highest standard deviation, and why?a. Class A, because it has the largest difference between
the heights of the bars.b. Class B, because more of its scores are far from the
mean.c. Class C, because it has the largest number of different
scores.d. Class D, because the distribution is very bumpy and
irregular.e. Class E, because it has a large range and looks normal.

Example 1: Concept for comparison
Comparable CAOS questions on topic not taught with clickers:#17. Imagine you have a barrel that contains thousands of candies with several different colors. We know that the manufacturer produces 35% yellow candies. Five students each take a random sample of 20 candies, one at a time, and record the percentage of yellow candies in their sample. Which sequence below is the most plausible for the percent of yellow candies obtained in these five samples?a. 30%, 35%, 15%, 40%, 50%.b. 35%, 35%, 35%, 35%, 35%c. 5%, 60%, 10%, 50%, 95%d. Any of the above.
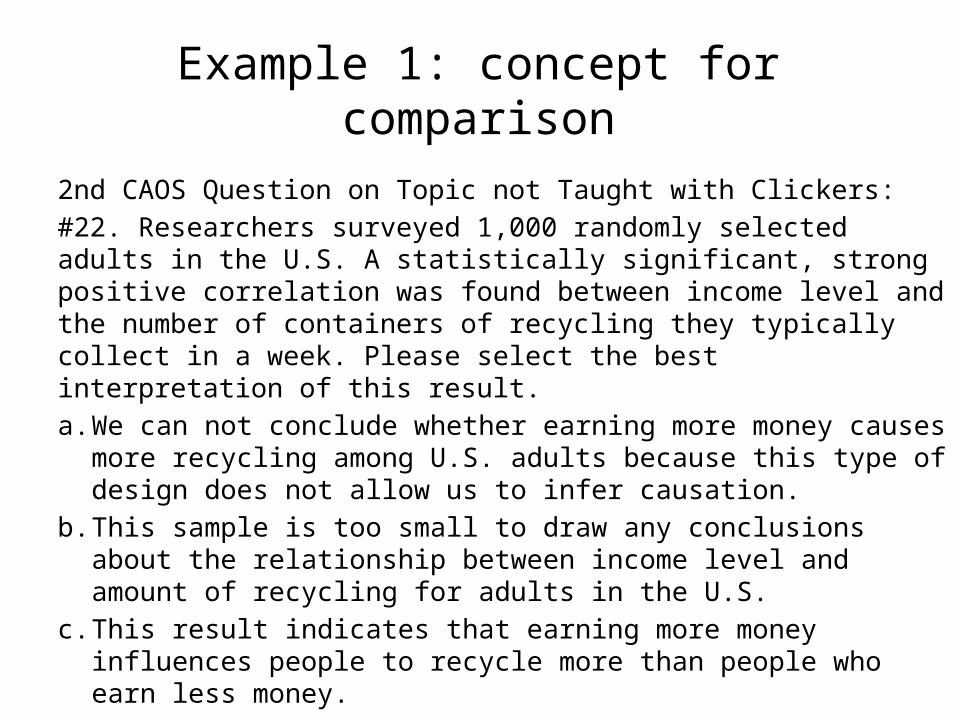
Example 1: concept for comparison
2nd CAOS Question on Topic not Taught with Clickers:#22. Researchers surveyed 1,000 randomly selected adults in the U.S. A statistically significant, strong positive correlation was found between income level and the number of containers of recycling they typically collect in a week. Please select the best interpretation of this result.a. We can not conclude whether earning more money causes more
recycling among U.S. adults because this type of design does not allow us to infer causation.
b. This sample is too small to draw any conclusions about the relationship between income level and amount of recycling for adults in the U.S.
c. This result indicates that earning more money influences people to recycle more than people who earn less money.
Example 2: Understanding Confidence Intervals in the Long Run
• CAOS Questions #28, 30, 31• CAOS Questions on topic not taught with
clickers: #25, 26, 27

Example 3: Understanding Hypothesis Tests and P-values in the Long Run
• CAOS Question #40• CAOS Question on topic not taught with clickers:
#36
Conclusion
Students and instructors alike will benefit from the implementation of this project made possible by dB-SERC. We look forward to reporting progress during the coming fall semester. Questions? Tips on clicker use? Please contact [email protected]@pitt.edu
Related Documents

![!Chen Taijiquan 2]. chen 38](https://static.cupdf.com/doc/110x72/5535fa5b550346640d8b4777/chen-taijiquan-2-chen-38.jpg)