Improving Student Achievement Through Teacher Collaboration Improving Student Achievement Through Teacher Collaboration By Gonzalo Miguel Pitpit, Northeast Leadership Academy “The point of teacher collaboration is to improve instruction for students and to ensure that all students learn.” - Karen Chenoweth, How It’s Being Done. 2009 ABSTRACT Improving student achievement through teacher collaboration is the focus of schools in the country today. While a myriad of studies have been conducted on this topic, there is limited information on the effectiveness of intensive or non-intensive collaboration in improving student achievement and vice versa. This problem of practice studied the effects of teacher collaboration on student achievement and whether intensive collaboration is more effective than non-intensive collaboration in improving student achievement. Data sources were from Bertie Middle School’s 7 th grade English Language Arts classes, benchmark tests, and the teachers’ responses to the teacher evaluation survey. Findings indicate that teacher collaboration affects student achievement and that intensive collaboration is more effective strategy in improving student achievement than non-intensive collaboration. CHAPTER I. INTRODUCTION Background of the Study In early September 2011, I observed the three 7 th grade English Language Arts (ELA) teachers at my internship school, Bertie Middle School. Ms. Collins spent time talking about students who have not been doing their homework. On her board, 19 students out of 20 did not turn in their homework for the day. Later on, she talked about late work. For 20 minutes, no Language Arts instruction took place on my first visit. In the room across the hall from Ms. Collins was Ms. Gray’s. Her students were checking their homework. They were making some predictions based on the chapter book they read last night. Students were all attentive as the teacher talked very fast and 1

Welcome message from author
This document is posted to help you gain knowledge. Please leave a comment to let me know what you think about it! Share it to your friends and learn new things together.
Transcript
Improving Student Achievement Through Teacher Collaboration
Improving Student Achievement Through Teacher Collaboration
By Gonzalo Miguel Pitpit,
Northeast Leadership Academy
“The point of teacher collaboration is to improve instruction for students
and to ensure that all students learn.”
- Karen Chenoweth, How It’s Being Done. 2009
ABSTRACT
Improving student achievement through teacher collaboration is the focus of schools in the
country today. While a myriad of studies have been conducted on this topic, there is limited
information on the effectiveness of intensive or non-intensive collaboration in improving student
achievement and vice versa. This problem of practice studied the effects of teacher collaboration
on student achievement and whether intensive collaboration is more effective than non-intensive
collaboration in improving student achievement. Data sources were from Bertie Middle School’s
7th grade English Language Arts classes, benchmark tests, and the teachers’ responses to the
teacher evaluation survey. Findings indicate that teacher collaboration affects student achievement
and that intensive collaboration is more effective strategy in improving student achievement than
non-intensive collaboration.
CHAPTER I. INTRODUCTION
Background of the Study
In early September 2011, I observed the three 7th grade English Language Arts (ELA)
teachers at my internship school, Bertie Middle School. Ms. Collins spent time talking about
students who have not been doing their homework. On her board, 19 students out of 20 did not turn
in their homework for the day. Later on, she talked about late work. For 20 minutes, no Language
Arts instruction took place on my first visit. In the room across the hall from Ms. Collins was Ms.
Gray’s. Her students were checking their homework. They were making some predictions based on
the chapter book they read last night. Students were all attentive as the teacher talked very fast and
1
Improving Student Achievement Through Teacher Collaboration
tried to keep on top of the discussions. Next to Ms. Collin’s room was Mr. Robert’s. Students were
on www.spellingcity.com. The words that the students were trying to spell were from the book,
Tuck Everlasting, a chapter book that they were assigned to read at the beginning of the year.
When they were finished, they used the words in meaningful sentences.
I did not observed any evidence supporting collaboration. I visited the same classes on the
following week and still, I came up with the same observation: the teachers did not collaborate at
all.
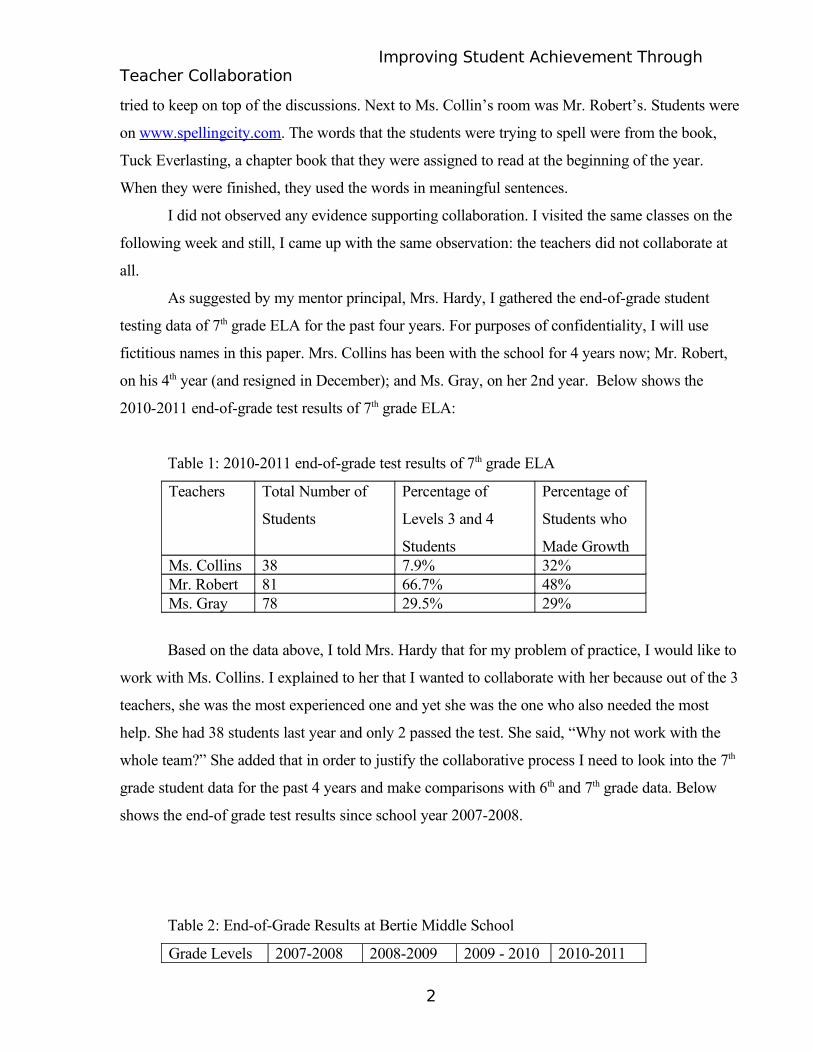
As suggested by my mentor principal, Mrs. Hardy, I gathered the end-of-grade student
testing data of 7th grade ELA for the past four years. For purposes of confidentiality, I will use
fictitious names in this paper. Mrs. Collins has been with the school for 4 years now; Mr. Robert,
on his 4th year (and resigned in December); and Ms. Gray, on her 2nd year. Below shows the
2010-2011 end-of-grade test results of 7th grade ELA:
Table 1: 2010-2011 end-of-grade test results of 7th grade ELA
Teachers Total Number of
Students
Percentage of
Levels 3 and 4
Students
Percentage of
Students who
Made GrowthMs. Collins 38 7.9% 32%Mr. Robert 81 66.7% 48%Ms. Gray 78 29.5% 29%
Based on the data above, I told Mrs. Hardy that for my problem of practice, I would like to
work with Ms. Collins. I explained to her that I wanted to collaborate with her because out of the 3
teachers, she was the most experienced one and yet she was the one who also needed the most
help. She had 38 students last year and only 2 passed the test. She said, “Why not work with the
whole team?” She added that in order to justify the collaborative process I need to look into the 7th
grade student data for the past 4 years and make comparisons with 6th and 7th grade data. Below
shows the end-of grade test results since school year 2007-2008.
Table 2: End-of-Grade Results at Bertie Middle School
Grade Levels 2007-2008 2008-2009 2009 - 2010 2010-2011
2

Improving Student Achievement Through Teacher Collaboration
6th 36.4% 47.6% 53% 57.6%7th 26.3% 43.2% 49.1% 40.5%8th 34.6% 46.8% 57% 44.7%
7th grade ELA always had the lowest score for the past 4 years compared with the other 2
grade levels. This would justify why I should be working with the whole team. This would
establish the sense of urgency.
Statement of the Problem:
At Bertie Middle School, teacher collaboration does not exist at the 7th grade’s English
Language Arts department. In my individual conversations with the teachers, they mentioned that
when they met, they discussed student discipline and objectives to teach, but never shared
strategies or resources. Sometimes Mr. Robert would share with the other 2 teachers resources or
strategies, but they had the choice to use or not to use them in their respective classes.
This problem of practice will try to find out if teacher collaboration can improve student
achievement. Specifically, it will answer the following questions:
1. Based on the results of the district’s benchmark 2 and benchmark 3,
A. Can teacher collaboration improve student achievement?
B. Which is more effective in improving student achievement, intensive collaboration
or non-intensive collaboration?
2. How many times did the teachers collaborate and how many times did each one use
strategies shared by their teammates and the intern?
3. Based on the teacher evaluation survey, how did the teachers see collaboration as an
effective strategy to improve student achievement?
Significance of the Problem of Practice:
This problem of practice focuses on teacher collaboration as a strategy to improve student
achievement in all 7th grade English Language Arts classes at Bertie Middle School.
This is significant for the following reasons:
1. Teachers share resources and strategies when planning for their day-to-day lessons;
2. When students are moved from one class to another, they will be taught the same topics
3
Improving Student Achievement Through Teacher Collaboration
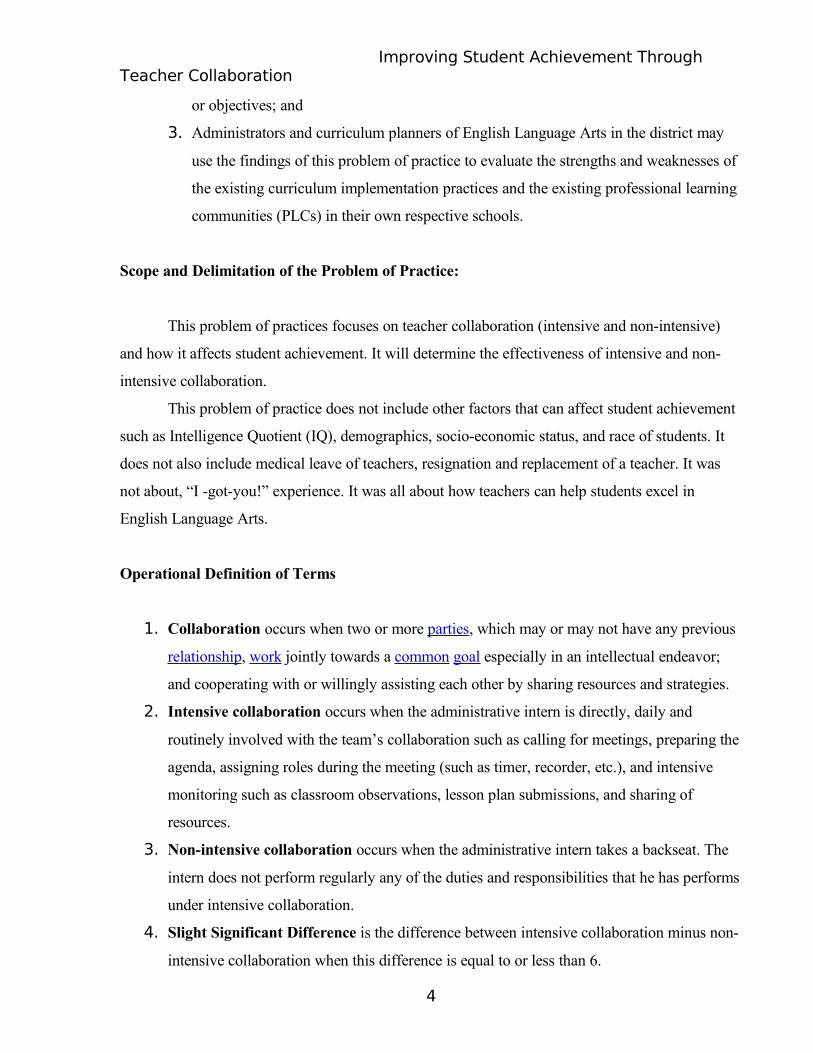
or objectives; and
3. Administrators and curriculum planners of English Language Arts in the district may
use the findings of this problem of practice to evaluate the strengths and weaknesses of
the existing curriculum implementation practices and the existing professional learning
communities (PLCs) in their own respective schools.
Scope and Delimitation of the Problem of Practice:
This problem of practices focuses on teacher collaboration (intensive and non-intensive)
and how it affects student achievement. It will determine the effectiveness of intensive and non-
intensive collaboration.
This problem of practice does not include other factors that can affect student achievement
such as Intelligence Quotient (IQ), demographics, socio-economic status, and race of students. It
does not also include medical leave of teachers, resignation and replacement of a teacher. It was
not about, “I -got-you!” experience. It was all about how teachers can help students excel in
English Language Arts.
Operational Definition of Terms
1. Collaboration occurs when two or more parties, which may or may not have any previous
relationship, work jointly towards a common goal especially in an intellectual endeavor;
and cooperating with or willingly assisting each other by sharing resources and strategies.
2. Intensive collaboration occurs when the administrative intern is directly, daily and
routinely involved with the team’s collaboration such as calling for meetings, preparing the
agenda, assigning roles during the meeting (such as timer, recorder, etc.), and intensive
monitoring such as classroom observations, lesson plan submissions, and sharing of
resources.
3. Non-intensive collaboration occurs when the administrative intern takes a backseat. The
intern does not perform regularly any of the duties and responsibilities that he has performs
under intensive collaboration.
4. Slight Significant Difference is the difference between intensive collaboration minus non-
intensive collaboration when this difference is equal to or less than 6.
4

Improving Student Achievement Through Teacher Collaboration
5. Significant Difference is the difference between intensive collaboration minus non-
intensive collaboration when this difference is equal to 6 or more.
6. No Significant Difference is when intensive collaboration and non-intensive collaboration
are the same and the difference between them is 0.
CHAPTER 11: REVIEW OF RELATED LITERATURE AND STUDIES,
LOGIC MODEL, AND THEORY OF ACTION
Review of Related Literature and Studies:
Teacher collaboration has been around for years (Brownell, Yeager, Rennells, & Riley,
1997; Louis, Marks, & Kruse (1996) cited in Goddard, Goddard & Tschannen-Moran (2007)).
Morse (2000) cited in Goddard, Goddard & Tschannen-Moran (2007) explained that collaboration
is imperative in education in order to effect change, and refusing to implement is not an option.
Goddard, et al. conducted a study using hierarchical linear modeling (HLM) to analyze data. They
wanted to determine the relationship between a theoretically driven measure of teacher
collaboration for school improvement and student achievement. These researchers found out that
higher levels of teacher collaboration for school improvement yielded higher student achievement
among fourth grade students located in the Midwestern United States.
Teacher collaboration is shaped by teacher interaction (Friend & Cook, 1992; Mostert,
1998; West, 1990) cited in Moolenaar, Sleegers & Daly (2012). Because of this, researches shifted
their focus on teacher collaboration networks as the basis to analyze attempts of schools to
implement it as a lens to study collaborative efforts in schools (Coburn & Russell, 2008; Daly et
al., 2010; Moolenaar et al., 2010; Lima, 2004; Penuel, Frank, & Krause, 2007; Penuel & Riel,
2007) cited in Moolenaar, Sleegers & Daly (2012).
Moolenaar, Sleegers & Daly (2012) averred that through collaborative networks, teachers
have easy access to a myriad of resources, materials, ideas, support, knowledge, and information.
They added that this process facilitated meeting educational goals and overcoming barriers that
happen in daily teaching practice.
Chenoweth (2009) stated that the key to teacher collaboration is improving student
achievement. She explained that no teacher knows all components of the curriculum, all strategies
to teach it, and knows how to teach each student in his or her class. She added that while it was
5

Improving Student Achievement Through Teacher Collaboration
true that no one can be an expert in everything, each one may have an expertise that others in the
team could use in their classes to improve instruction.
Logic Model
gr
Theory of Action
IF
Teachers collaborate on lesson planning, implementation, and assessment,
Teachers teach reading strategies or skills and vocabulary development explicitly,
Teachers analyze student-testing data to drive instruction,
6
INPUTSExisting
Resources
OUTPUTSActivitiesOUTCOMES
Planning PhaseCollaborative meetings - analysis or evaluation of existing practicesPresentation of end-of-Grade (EOG) student testing data to 7th grade English Language Arts (ELA) teachers and mentor principal
Implementation PhaseIntensive and non-intensive collaborative on lesson planning, & implementation.Implementation of common assessmentsExplicit teaching of reading skills/strategies & vocabulary skills
Evaluation PhaseGather/collect/analyze data from benchmark tests 2 & 3 and
common assessments.Teacher evaluation survey
ULTIMATEGOAL
Increased lesson planning, implementation, and assessment collaboration
Increased explicit teaching of reading strategies or skills and vocabulary development
Increased student-testing data presentation and analysis
Improved student achievement on common assessments and district benchmark tests in reading
Improved students’ understanding on reading strategies and vocabulary development
Improved collaborative processes
Improved Student Achievement
Bertie Middle School staff and administration
Bertie County resources including district benchmark tests
Bertie Middle School media center resources including books and technology resources
Student testing data
Experience on teaching Language Arts in 7th grade
OBJECTIVESTo collaborate in lesson planning, implementation, and assessment To collect, present, and analyze student-testing data and make effective decisions to accelerate or remediate studentsTo teach reading skills or strategies and vocabulary development explicitly To evaluate the collaborative processes
Improving Student Achievement Through Teacher Collaboration
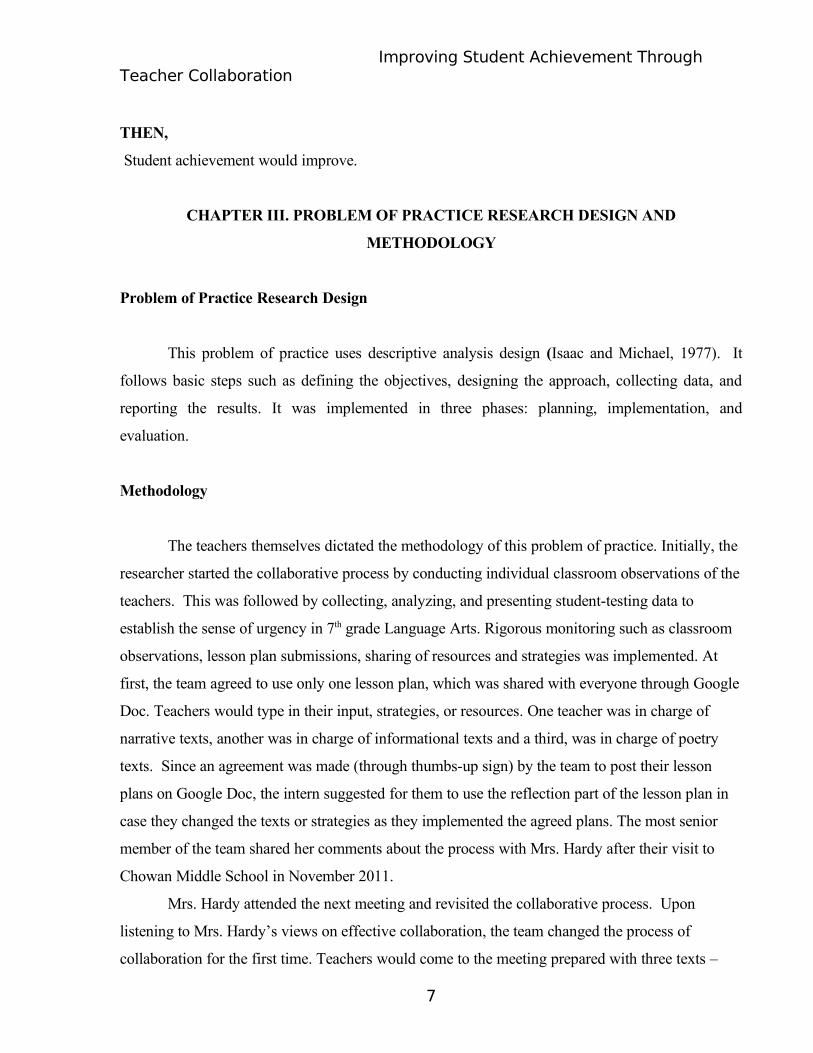
THEN,
Student achievement would improve.
CHAPTER III. PROBLEM OF PRACTICE RESEARCH DESIGN AND
METHODOLOGY
Problem of Practice Research Design
This problem of practice uses descriptive analysis design (Isaac and Michael, 1977). It
follows basic steps such as defining the objectives, designing the approach, collecting data, and
reporting the results. It was implemented in three phases: planning, implementation, and
evaluation.
Methodology
The teachers themselves dictated the methodology of this problem of practice. Initially, the
researcher started the collaborative process by conducting individual classroom observations of the
teachers. This was followed by collecting, analyzing, and presenting student-testing data to
establish the sense of urgency in 7th grade Language Arts. Rigorous monitoring such as classroom
observations, lesson plan submissions, sharing of resources and strategies was implemented. At
first, the team agreed to use only one lesson plan, which was shared with everyone through Google
Doc. Teachers would type in their input, strategies, or resources. One teacher was in charge of
narrative texts, another was in charge of informational texts and a third, was in charge of poetry
texts. Since an agreement was made (through thumbs-up sign) by the team to post their lesson
plans on Google Doc, the intern suggested for them to use the reflection part of the lesson plan in
case they changed the texts or strategies as they implemented the agreed plans. The most senior
member of the team shared her comments about the process with Mrs. Hardy after their visit to
Chowan Middle School in November 2011.
Mrs. Hardy attended the next meeting and revisited the collaborative process. Upon
listening to Mrs. Hardy’s views on effective collaboration, the team changed the process of
collaboration for the first time. Teachers would come to the meeting prepared with three texts –
7
Improving Student Achievement Through Teacher Collaboration
narrative, informational, and poetry. They would then share these texts with the team and share
strategies that they would use with each text. Because of these developments, the intern later
called this phase, intensive collaboration. This process ended with the administration of
benchmark 2 to all students.
In January 2012, the same senior member of the team shared again her comments about
how the collaborative process was being done. She felt that the presence of the intern was “too
much;” that she already learned a lot, particularly the sharing of student testing data; and that she
would like the team to continue with the process with little input from the intern. Upon the
recommendation of Mrs. Hardy, the administrative intern took a backseat. Teachers would call for
the meetings themselves. The intern would not be even invited to attend those meetings. He would
ask the most senior member of the team to meet once in a while, and in that meeting, he asked her
if she could facilitate. Unfortunately upon inquiry I found out that they never met at all. This
prompted me to call for the meetings myself. Teachers were not monitored or observed on a
regular basis except for taking notes of what they posted on Google Doc and looking for pieces of
evidence or artifacts showing collaboration among the teachers. This changed the collaborative
process for the second time giving birth to non-intensive collaboration. This process ended with
the administration of benchmark 3 to all students.
The problem of practice officially started on September 22, 2011 and ended on March 15,
2012. Below is a summary of activities during the three phases of the implementation of this
problem of the practice.
A. Planning Phase – Laying the Foundations
1. Number of Meetings: 11 times – 9/23, 9/28, 9/29, 10/6, 10/10, 10/13, 10/14, 10/20,
10/21, and 10/31.) At first, meetings were conducted once a week, then because of
sense of urgency and with the approval of the principal, meetings were held twice a
week.
2. Some of the things that were done during this phase:
a. The intern presented to the team student testing data for the past four years.
b. Sharing of literature such as Multiple Measures, Understanding by Design, The
Fabulous Five- Strategies for Improving Achievement
c. Consolidating the pacing guide, What Is Being Taught? – Reading skills/
strategies were identified.
d. Explicit teaching of reading strategies.
8
Improving Student Achievement Through Teacher Collaboration
e. Explicit teaching of vocabulary development.
f. Creating and posting of lesson plans on Google Doc.
g. Discussion on the components of ideal/effective lesson plans.
h. Sharing of resources and strategies.
i. Sharing of student testing data.
j. Regular classroom visits/observations
B. Implementation Phase – Application
1. Intensive Collaboration
a. Number of Meetings: 14 times – 11/9, 11/10, 11/18, 11/21, 11/23, 12/2, 12/9,
12/14, 12/16, 12/19*, 1/6**, 1/7, 1/9, and 1/13. (Note: * Special
meeting/Budget Meeting; ** Intern was not present.)
b. Some of the things that were done during this phase:
1) Explicit teaching of reading strategies
2) Explicit teaching of vocabulary development
3) Creating and posting of lesson plans on Google Doc
4) Sharing of student-testing data
5) Regular Classroom Visits/Observations
6) Implementing the 7th Grade Teaching Vocabulary Plan
7) Implementing the 7th Grade ELA AR Plan
2. Non-intensive Collaboration
a. Number of Meetings: 6 times – 1/20*, 1/21**, 1/25**, 1/26***, 2/10**, and
2/17**.
(* Mrs. Hardy called for this meeting; ** the intern called for this meeting; ***
the team met on their own; the teachers did not call for any meeting in March
before benchmark 3.)
b. Some of the things that were done during this phase:
1) Explicit teaching of reading strategies
2) Explicit teaching of vocabulary development
3) Creating and posting of lesson plans on Google Doc
4) Sharing of resources and strategies
5) Sharing of student testing data
6) Irregular classroom visits/observations
9

Improving Student Achievement Through Teacher Collaboration
C. Evaluation Phase
3. Teacher Evaluation Survey
4. Presentation of Problem of Practice Data/Results (to teachers – April 5, 2012)
The Subjects
The subjects of this problem of practice were 7th grade English Language Arts teachers at
Bertie Middle School. Mrs. Collins has been at the school since the opening in 2007. She was the
most senior member of the team. She is in her late 40s or early 50s. Ms. Gray is in her mid 20s.
She is in her 2nd year at the school. Mr. Robert was on his 4th year in the school until he resigned in
December. He was in her late 20s. Ms. Greg, a very experienced teacher, replaced Mr. Robert in
January.
Data Sources
This problem of practice uses the following data sources to determine improvement in
student achievement:
1. Comprehensive benchmark tests 2 and 3
(Benchmark test 1 was not used because it was cumulative.)
2. Teacher Evaluation Survey
CHAPTER IV. PRESENTATION AND ANALYSIS OF DATA
This chapter aims to answer the 3 specific questions raised in this problem of practice. It
presents the quantitative and qualitative data gathered from the research including the descriptive
analysis of these data.
The quantitative part focuses on the results of the benchmark tests 2 and 3. These tests
were administered to determine if teacher collaboration has an effect on student achievement. It is
also hoped that through this problem of practice, the researcher could determine if intensive
collaboration is more effective than non-intensive collaboration and vise versa in improving
student achievement. For this problem of practice, the researcher utilized some terms such as slight
significant difference, significant difference, and no significant difference to describe the
difference between benchmark 2 and benchmark 3.
10
Improving Student Achievement Through Teacher Collaboration
The qualitative part includes a description of all student-testing data. It also includes a
description of the teacher evaluation survey results to determine factors that affect student
achievement in the teachers’ respective ELA classes and what they think of the whole
collaborative processes.
A. Analysis on the Effects of Intensive and Non-intensive Collaboration on Student
Achievement
Significant Difference, Slight Significant Difference, No Significant Difference
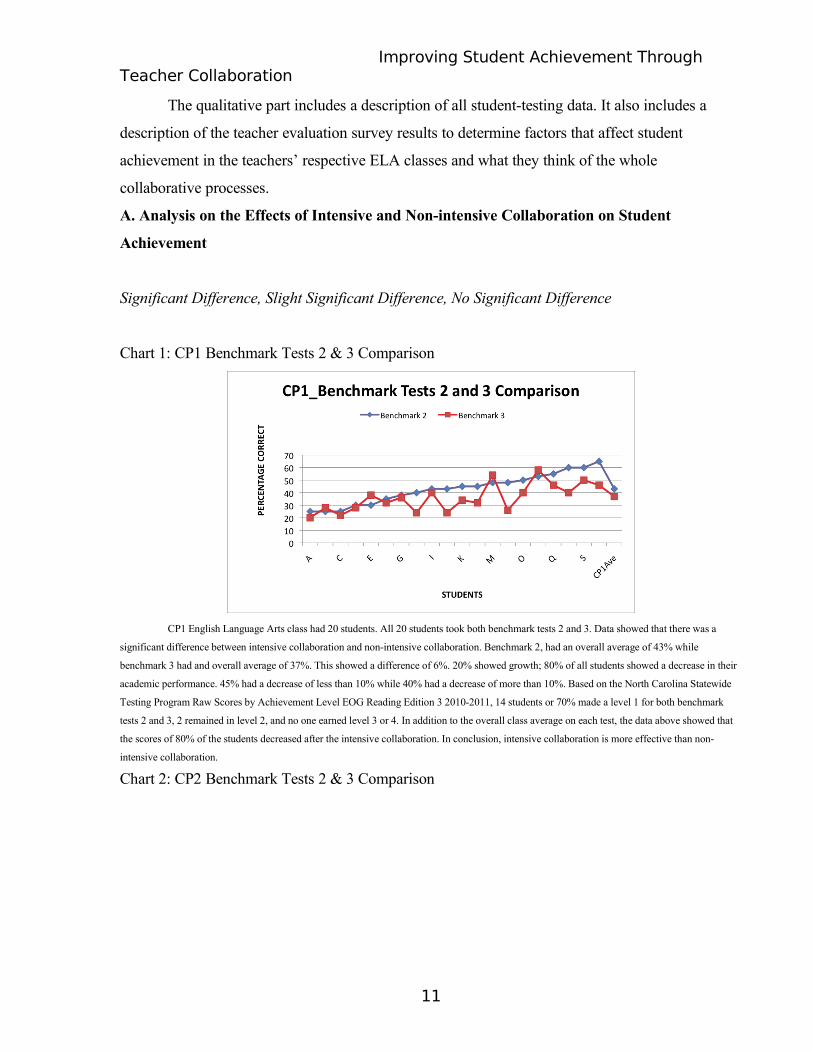
Chart 1: CP1 Benchmark Tests 2 & 3 Comparison
CP1 English Language Arts class had 20 students. All 20 students took both benchmark tests 2 and 3. Data showed that there was a
significant difference between intensive collaboration and non-intensive collaboration. Benchmark 2, had an overall average of 43% while
benchmark 3 had and overall average of 37%. This showed a difference of 6%. 20% showed growth; 80% of all students showed a decrease in their
academic performance. 45% had a decrease of less than 10% while 40% had a decrease of more than 10%. Based on the North Carolina Statewide
Testing Program Raw Scores by Achievement Level EOG Reading Edition 3 2010-2011, 14 students or 70% made a level 1 for both benchmark
tests 2 and 3, 2 remained in level 2, and no one earned level 3 or 4. In addition to the overall class average on each test, the data above showed that
the scores of 80% of the students decreased after the intensive collaboration. In conclusion, intensive collaboration is more effective than non-
intensive collaboration.
Chart 2: CP2 Benchmark Tests 2 & 3 Comparison
11
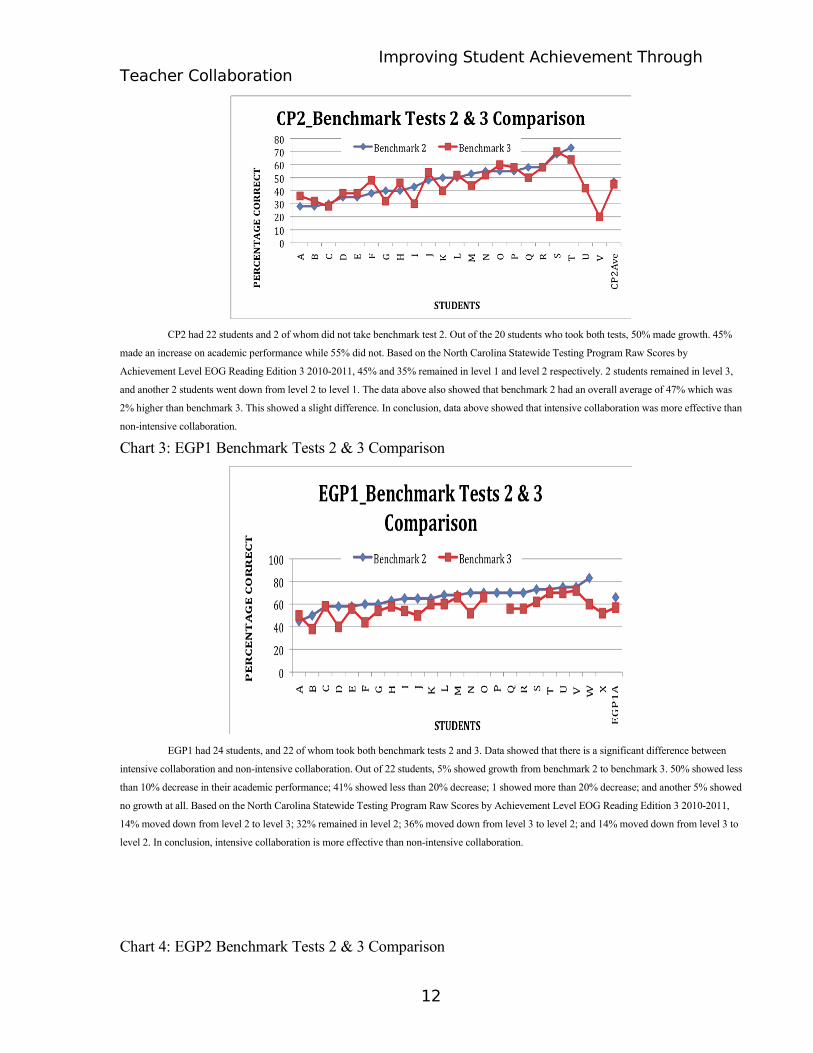
Improving Student Achievement Through Teacher Collaboration
CP2 had 22 students and 2 of whom did not take benchmark test 2. Out of the 20 students who took both tests, 50% made growth. 45%
made an increase on academic performance while 55% did not. Based on the North Carolina Statewide Testing Program Raw Scores by
Achievement Level EOG Reading Edition 3 2010-2011, 45% and 35% remained in level 1 and level 2 respectively. 2 students remained in level 3,
and another 2 students went down from level 2 to level 1. The data above also showed that benchmark 2 had an overall average of 47% which was
2% higher than benchmark 3. This showed a slight difference. In conclusion, data above showed that intensive collaboration was more effective than
non-intensive collaboration.
Chart 3: EGP1 Benchmark Tests 2 & 3 Comparison
EGP1 had 24 students, and 22 of whom took both benchmark tests 2 and 3. Data showed that there is a significant difference between
intensive collaboration and non-intensive collaboration. Out of 22 students, 5% showed growth from benchmark 2 to benchmark 3. 50% showed less
than 10% decrease in their academic performance; 41% showed less than 20% decrease; 1 showed more than 20% decrease; and another 5% showed
no growth at all. Based on the North Carolina Statewide Testing Program Raw Scores by Achievement Level EOG Reading Edition 3 2010-2011,
14% moved down from level 2 to level 3; 32% remained in level 2; 36% moved down from level 3 to level 2; and 14% moved down from level 3 to
level 2. In conclusion, intensive collaboration is more effective than non-intensive collaboration.
Chart 4: EGP2 Benchmark Tests 2 & 3 Comparison
12
Improving Student Achievement Through Teacher Collaboration
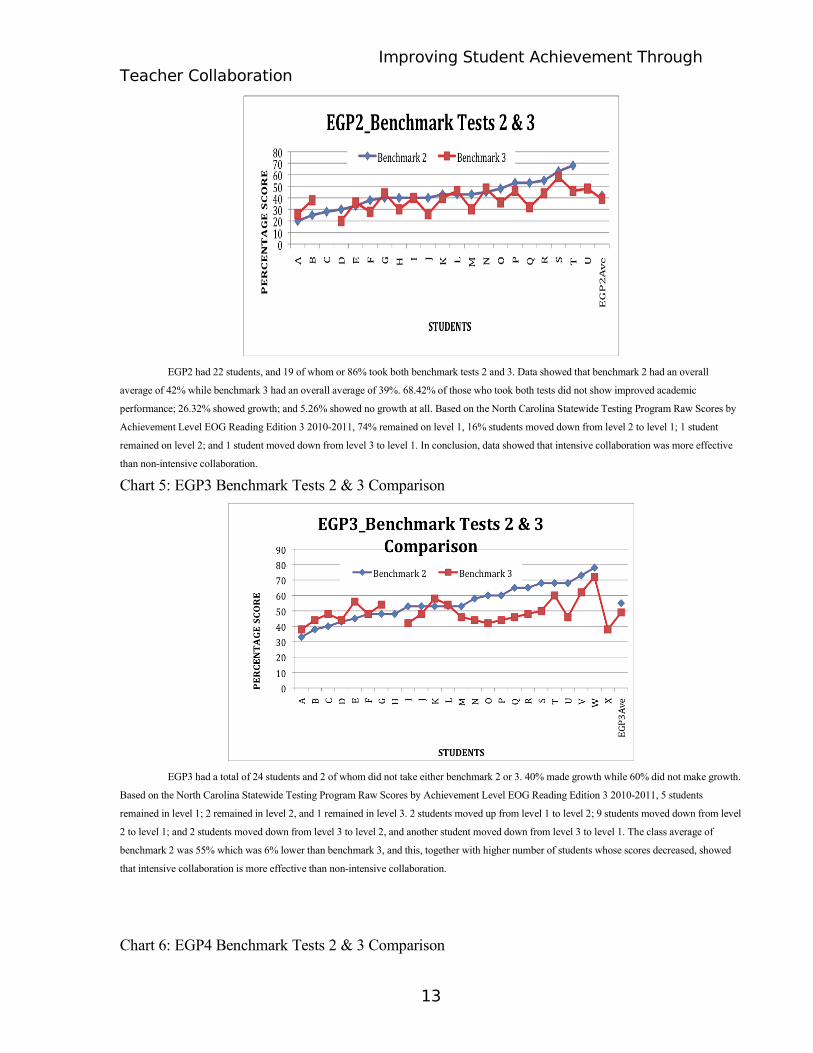
EGP2 had 22 students, and 19 of whom or 86% took both benchmark tests 2 and 3. Data showed that benchmark 2 had an overall
average of 42% while benchmark 3 had an overall average of 39%. 68.42% of those who took both tests did not show improved academic
performance; 26.32% showed growth; and 5.26% showed no growth at all. Based on the North Carolina Statewide Testing Program Raw Scores by
Achievement Level EOG Reading Edition 3 2010-2011, 74% remained on level 1, 16% students moved down from level 2 to level 1; 1 student
remained on level 2; and 1 student moved down from level 3 to level 1. In conclusion, data showed that intensive collaboration was more effective
than non-intensive collaboration.
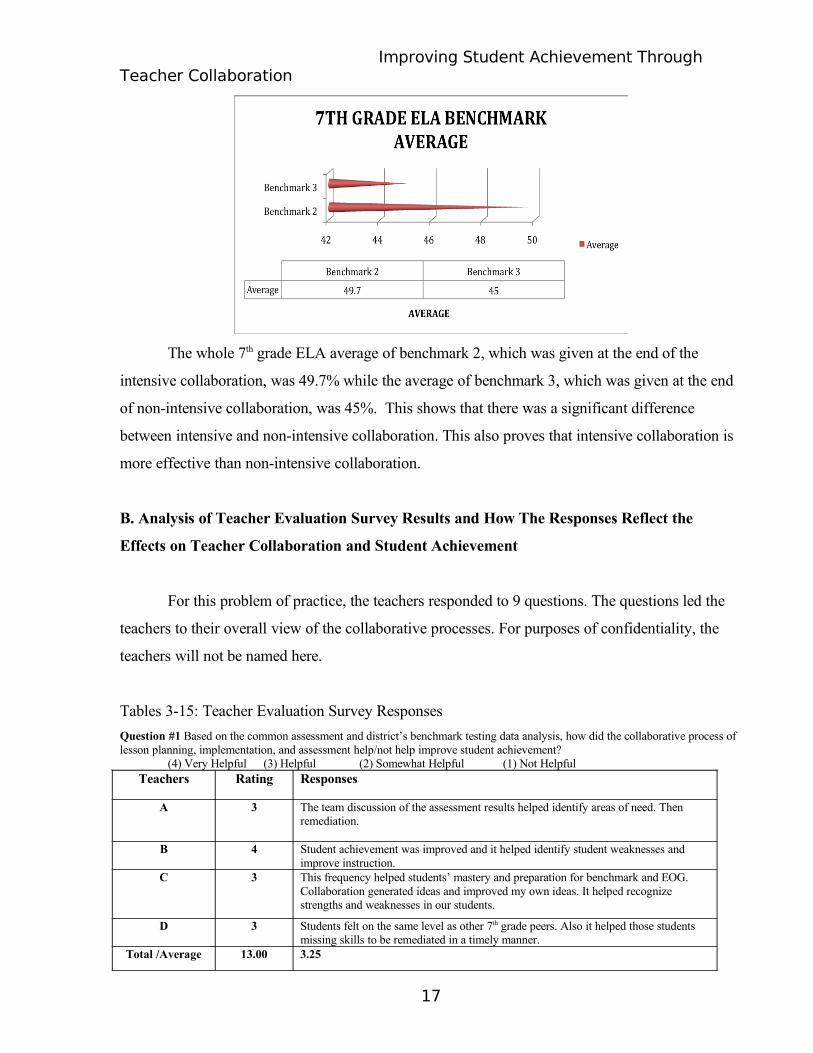
Chart 5: EGP3 Benchmark Tests 2 & 3 Comparison
EGP3 had a total of 24 students and 2 of whom did not take either benchmark 2 or 3. 40% made growth while 60% did not make growth.
Based on the North Carolina Statewide Testing Program Raw Scores by Achievement Level EOG Reading Edition 3 2010-2011, 5 students
remained in level 1; 2 remained in level 2, and 1 remained in level 3. 2 students moved up from level 1 to level 2; 9 students moved down from level
2 to level 1; and 2 students moved down from level 3 to level 2, and another student moved down from level 3 to level 1. The class average of
benchmark 2 was 55% which was 6% lower than benchmark 3, and this, together with higher number of students whose scores decreased, showed
that intensive collaboration is more effective than non-intensive collaboration.
Chart 6: EGP4 Benchmark Tests 2 & 3 Comparison
13

Improving Student Achievement Through Teacher Collaboration
EGP4 had 20 students. All but 1 took both benchmark tests 2 and 3. Data showed also that 17 students or 89% had decreased academic
performance, and 2 students had shown no growth at all. The scores of 4 students decreased by 20% but not more than 35%; 6 students’ scores
decreased by 10% but not more than 18%; and 7 students’ scores decreased by at least 1% but not more than 6%. Based on the North Carolina
Statewide Testing Program Raw Scores by Achievement Level EOG Reading Edition 3 2010-2011, 8 students went down from level 3 to level 2; 3
students remained in level 3 and another 3 remained in level 2. The data above showed that benchmark 2 had an overall average of 65% which was
10% higher than benchmark 3. In conclusion, intensive collaboration is more effective than non-intensive collaboration.
Chart 7: TGP1 Benchmark Tests 2 & 3 Comparison
TGP1 had 23 students, and 20 of whom had taken both benchmark tests 2 and 3. Data showed that 8 students or 40% made growth and
12 or 60% did not.2 students’ scored decreased by more than 20%; 4 students’ scores decreased by less than 20% but not more than 10%. Based on
the North Carolina Statewide Testing Program Raw Scores by Achievement Level EOG Reading Edition 3 2010-2011, 11 students or 55% and 2
students remained in level 1and level 2 respectively. Benchmark 2 had an overall average of 43 which was 2% higher than benchmark 3. In
conclusion, there was a slight significant difference between intensive and non-intensive collaboration. Furthermore, intensive collaboration is more
effective than non-intensive collaboration.
Chart 8: TGP2 Benchmark Tests 2 & 3 Comparison
14

Improving Student Achievement Through Teacher Collaboration
TGP2 had a total of 23 students, and all took both benchmark 2 and benchmark 3 tests. The data above showed that 4 students or 17%
made growth while 19 students or 83% showed decreased academic performance. 9 student’s scores decreased by 1% but not more than 8% while
10 students’ scores decreased by 13% but not more than 23%. Based on the North Carolina Statewide Testing Program Raw Scores by Achievement
Level EOG Reading Edition 3 2010-2011, 8 students or 35% and 4 students remained in level 1 and level 2 respectively. One student moved up
from level 2 to level 3 while 7 students moved down from level 2 to level 1. The data above also showed that there is a significant difference
between intensive collaboration and non-intensive collaboration. Benchmark 2 had an overall average of 49% which was 8% higher than benchmark
3. In conclusion, intensive collaboration is more effective than non-intensive collaboration.
Chart 9: TGP3 Benchmark Tests 2 & 3 Comparison
TGP3 had 22 students. All but 1 took both benchmark tests 2 and 3, and 6 of whom or 29% showed growth. Out of the 6 who made
growth 2 had an increased academic achievement of more than 30%. On the other hand, 5 of those did not make growth had a decreased academic
achievement of more than 10% and less than 30%. Based on the North Carolina Statewide Testing Program Raw Scores by Achievement Level
EOG Reading Edition 3 2010-2011, 57% remained in level 1 and 10% remained in level 2. 2 students moved up from level 1 to level 2 and 1 student
moved down from level 3 to level 2. Overall, the class’ average for both tests was 43%. Since 71% of the class had higher scores in benchmark 1
than benchmark 2, then the data showed that there was a significant difference between intensive collaboration and non-intensive collaboration.
Chart 10: TGP4 Benchmark Tests 2 & 3 Comparison
15

Improving Student Achievement Through Teacher Collaboration
TGP4 had 18 students, and 5 of whom did not take either benchmark test 2 or 3. Out of the13 students who took both tests, 15% made
growth. Data showed that based on the North Carolina Statewide Testing Program Raw Scores by Achievement Level EOG Reading Edition 3
2010-2011, 46% remained on level 1 and 1 remained in level 2; and 15% moved down from level 2 to level 1. Furthermore, the class’ overall
average was 44%, which was 1% higher than the average of benchmark 3. This, therefore, indicated that there was a slight difference between
intensive collaboration than non-intensive collaboration; thus, leading to the conclusion that intensive collaboration is more effective than non-
intensive collaboration.
Summary of Benchmark Tests 2 & 3 Comparisons
Chart 11: Summary of Benchmark Tests 2 & 3 Comparison
The data above showed the overall average of 47.35%, which was 22.65% lower than 70%,
set by the team as the passing score at the beginning of the collaborative project. CP1 had the
lowest average, which was 40%, and EGP1 had the highest average, which was 61.5% with a
difference of 21.5%. Based on the North Carolina Statewide Testing Program Raw Scores by
Achievement Level EOG Reading Edition 3 2010-2011, 7 classes or 70% achieved level 1 and 3
classes or 30% achieved level 2. No class achieved level 3 or level 4.
Chart 12: Overall Benchmark Tests 2 and 3 Average
16
Improving Student Achievement Through Teacher Collaboration
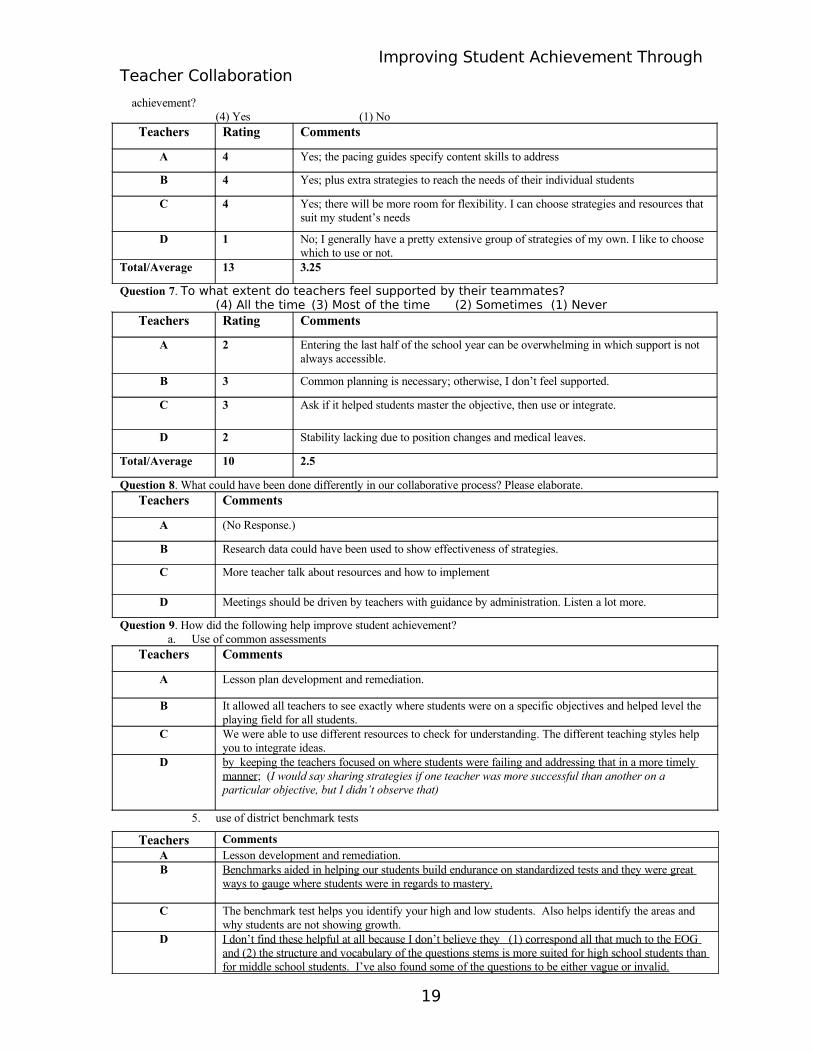
The whole 7th grade ELA average of benchmark 2, which was given at the end of the
intensive collaboration, was 49.7% while the average of benchmark 3, which was given at the end
of non-intensive collaboration, was 45%. This shows that there was a significant difference
between intensive and non-intensive collaboration. This also proves that intensive collaboration is
more effective than non-intensive collaboration.
B. Analysis of Teacher Evaluation Survey Results and How The Responses Reflect the
Effects on Teacher Collaboration and Student Achievement
For this problem of practice, the teachers responded to 9 questions. The questions led the
teachers to their overall view of the collaborative processes. For purposes of confidentiality, the
teachers will not be named here.
Tables 3-15: Teacher Evaluation Survey Responses
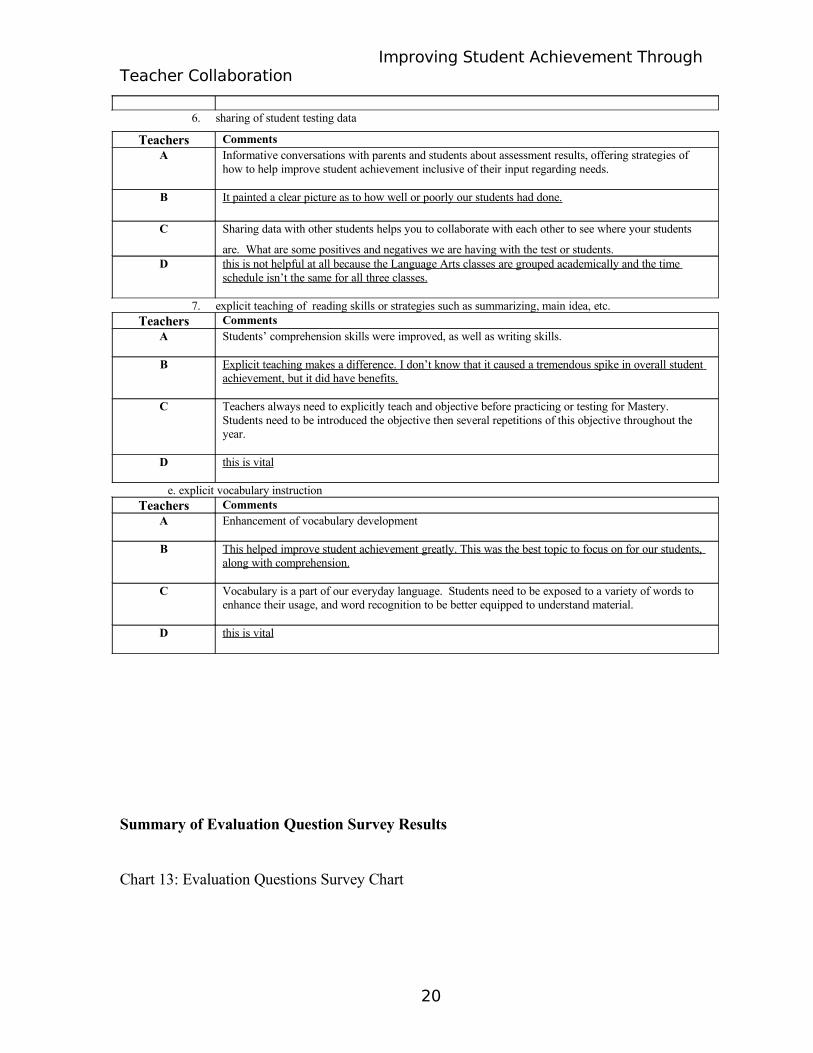
Question #1 Based on the common assessment and district’s benchmark testing data analysis, how did the collaborative process of lesson planning, implementation, and assessment help/not help improve student achievement?
(4) Very Helpful (3) Helpful (2) Somewhat Helpful (1) Not HelpfulTeachers Rating Responses
A 3 The team discussion of the assessment results helped identify areas of need. Then remediation.
B 4 Student achievement was improved and it helped identify student weaknesses and improve instruction.
C 3 This frequency helped students’ mastery and preparation for benchmark and EOG. Collaboration generated ideas and improved my own ideas. It helped recognize strengths and weaknesses in our students.
D 3 Students felt on the same level as other 7th grade peers. Also it helped those students missing skills to be remediated in a timely manner.
Total /Average 13.00 3.25
17

Improving Student Achievement Through Teacher Collaboration
Question 2. How do you feel about the collaborative process – sharing lessons, strategies, resources, and assessments? Is the collaborative process effective? Why or why not?
(4) Very Effective (3) Effective (2) Somewhat Effective (1) Not EffectiveTeachers Rating Comments
A 3 Effective and useful.
B 4 Allows for more differentiation. Teachers can reach a larger number of students who would be lost otherwise
C 3 Children do not all learn the same way so this is needed. Variety makes differentiation easier. Can express my style to others
D 2 I don’t believe it made a definitive difference in student achievement. Good for new teachers. Teachers naturally collaborate. This way brings resentment.
Total/Average 12.00 3.00
Question 3. Will you continue implementing the collaborative even after this year? Why or why not?(4) I will definitely continue without reservations. (2) I’m not sure if I continue or not (3) I will continue (only at times I feel necessary). (1) I will NOT continue
Teachers Rating Comments
A 4 This also strengthens cohesiveness among colleagues.
B 4 I will continue without reservation
C 4 This method has always been a traditional aspect for a Teacher to be effective throughout my career
D 4 I do like the structure; however sharing lesson plans through email and Google Doc is overkill. I find some use mandatory sharing of lesson plans as an excuse not to write their own.
Total/Average 16.00 4.00
Question 4. To what extent should the collaborative process be done?(4) On a regular basis (2) Whenever necessary
(3) Once in a while (1) Not needed; Not Necessary
Teachers Rating Comments
A 4 Regularly; with respect to possible changes in schedules.
B 4 Regularly; Collaboration should be completed on a weekly/daily basis.
C 4 Regularly; Integration of ideas can help enhance teaching styles to address different learning styles of students.
D 4 Regularly.
Total/Average 16.00 4.00
Question 5. How often do you use the common resources and strategies shared during meetings or on Google Doc?(4) On a regular basis (2) Whenever necessary(3) Once in a while (1) Not needed; Not Necessary
Teachers Rating Comments
A 3 (4) On a regular basis; and (2) Whenever necessary.
B 4 Regularly; I utilized common resources regularly when I was in the classroom.
C 4 Regularly; If we all teach the same things, and some teachers send to me their students, the same students would receive the same materials.
D 3 Once in a while; I really dislike having the “perfect” resource and not being able to use it because of a preagreed upon one. It also kills the impromptu “teaching moments” that impact students so strongly.
Total/Average 14.00 3.50
Question 6. Do you use the common resources and to what extent do you use these to drive instruction and improve student
18
Improving Student Achievement Through Teacher Collaboration
achievement? (4) Yes (1) No
Teachers Rating Comments
A 4 Yes; the pacing guides specify content skills to address
B 4 Yes; plus extra strategies to reach the needs of their individual students
C 4 Yes; there will be more room for flexibility. I can choose strategies and resources that suit my student’s needs
D 1 No; I generally have a pretty extensive group of strategies of my own. I like to choose which to use or not.
Total/Average 13 3.25
Question 7. To what extent do teachers feel supported by their teammates? (4) All the time (3) Most of the time (2) Sometimes (1) Never
Teachers Rating Comments
A 2 Entering the last half of the school year can be overwhelming in which support is not always accessible.
B 3 Common planning is necessary; otherwise, I don’t feel supported.
C 3 Ask if it helped students master the objective, then use or integrate.
D 2 Stability lacking due to position changes and medical leaves.
Total/Average 10 2.5
Question 8. What could have been done differently in our collaborative process? Please elaborate. Teachers Comments
A (No Response.)
B Research data could have been used to show effectiveness of strategies.
C More teacher talk about resources and how to implement
D Meetings should be driven by teachers with guidance by administration. Listen a lot more.
Question 9. How did the following help improve student achievement?a. Use of common assessments
Teachers Comments
A Lesson plan development and remediation.
B It allowed all teachers to see exactly where students were on a specific objectives and helped level the playing field for all students.
C We were able to use different resources to check for understanding. The different teaching styles help you to integrate ideas.
D by keeping the teachers focused on where students were failing and addressing that in a more timely manner; (I would say sharing strategies if one teacher was more successful than another on a particular objective, but I didn’t observe that)
5. use of district benchmark tests
Teachers Comments A Lesson development and remediation.B Benchmarks aided in helping our students build endurance on standardized tests and they were great
ways to gauge where students were in regards to mastery.
C The benchmark test helps you identify your high and low students. Also helps identify the areas and why students are not showing growth.
D I don’t find these helpful at all because I don’t believe they (1) correspond all that much to the EOG and (2) the structure and vocabulary of the questions stems is more suited for high school students than for middle school students. I’ve also found some of the questions to be either vague or invalid.
19
Improving Student Achievement Through Teacher Collaboration
6. sharing of student testing data
Teachers Comments A Informative conversations with parents and students about assessment results, offering strategies of
how to help improve student achievement inclusive of their input regarding needs.
B It painted a clear picture as to how well or poorly our students had done.
C Sharing data with other students helps you to collaborate with each other to see where your students
are. What are some positives and negatives we are having with the test or students. D this is not helpful at all because the Language Arts classes are grouped academically and the time
schedule isn’t the same for all three classes.
7. explicit teaching of reading skills or strategies such as summarizing, main idea, etc.Teachers Comments
A Students’ comprehension skills were improved, as well as writing skills.
B Explicit teaching makes a difference. I don’t know that it caused a tremendous spike in overall student achievement, but it did have benefits.
C Teachers always need to explicitly teach and objective before practicing or testing for Mastery. Students need to be introduced the objective then several repetitions of this objective throughout the year.
D this is vital
e. explicit vocabulary instructionTeachers Comments
A Enhancement of vocabulary development
B This helped improve student achievement greatly. This was the best topic to focus on for our students, along with comprehension.
C Vocabulary is a part of our everyday language. Students need to be exposed to a variety of words to enhance their usage, and word recognition to be better equipped to understand material.
D this is vital
Summary of Evaluation Question Survey Results
Chart 13: Evaluation Questions Survey Chart
20

Improving Student Achievement Through Teacher Collaboration
The data above shows the teachers’ evaluation of the problem of practice. In question #1,
50% of the teachers believed that teacher collaboration was helpful in improving student
achievement while the other 50% believed that it was very helpful. Question #2 shows that 75%
believes that the sharing of lessons, strategies, resources, and assessments was very effective; 25%
believed that it was somewhat effective. Questions #3 and #4 show that teachers will continue
collaborating even after this year and that they will do it on a regular basis respectively. Question
#5 shows that 50% used common resources and strategies on a regular basis while 25% responded
once in a while; the other 25% gave 2 answers – on a regular basis (4) and whenever necessary (2)
– and the average (3) was recorded on the chart. Question #6 shows that 75% used common
resources and strategies to drive instruction while 25% do not use them. Question #7 shows that
50% of the teachers sometimes felt they got the support of their teammates while another 50% said
most of the time.
Chart 14: Evaluation Questions Survey Average – By Questions
21

Improving Student Achievement Through Teacher Collaboration
Based on the data above, teachers rated questions 3 and 4 the highest. They declared that
they will continue with the collaborative processes even after this year, and that they will do it on a
regular basis. On the other hand, they rated question 7, which was about teamwork, the lowest. The
overall average of 3.35 out of 4.00 determines that the teachers find teacher collaboration effective
and helpful in improving student achievement.
Chart 15: Evaluation Questions Survey Average – By Teachers
Overall, most of the teachers believe that teacher collaboration can help improve student
achievement. 75% rated the collaborative processes 3.71 out of 4.00, which was between helpful
and very helpful, and 25% rated 2. 71, which was between helpful and somewhat helpful. All
teachers said that they would continue with the collaborative processes – sharing of resources,
strategies, and ideas, and implementing common assessments. They all believe that the common
assessments place all their students in the same level as they all take the same tests weekly. In
summary, the teachers rated the whole collaboration processes 3.51 out of 4.00 which means that
teacher collaboration is effective and helpful in improving student achievement.
CHAPTER V. SUMMARY, CONCLUSIONS, AND RECOMMENDATIONS
22

Improving Student Achievement Through Teacher Collaboration
This chapter gives the summary of the findings of the problem of practice as well as the
conclusions and recommendations based on the said findings. It presents the answers to the 3
specific questions that this problem of practice aims to answer.
SUMMARY
1. Based on the results of the district’s benchmark 2 and benchmark 3,
A. Can teacher collaboration improve student achievement?
B. Which is more effective in improving student achievement, intensive collaboration or
non-intensive collaboration?
The quantitative and qualitative analyses yielded favorable results to the theory of
action that if teachers collaborate on lesson planning, lesson implementation and implementing
common assessment; teach reading strategies or skills and vocabulary development explicitly; and
analyze student-testing data to drive instruction, then student achievement would improve.
Student testing data from the benchmark tests and teacher evaluation survey responses
from the teachers were utilized to prove the theory of action. Benchmark test #2 yielded higher
average for all 7th grade ELA students at Bertie Middle School than benchmark #3. The teacher
evaluation survey was interpreted in two ways: by questions and by teachers. The teacher
evaluation survey by questions yielded an average of 3.35 and the teacher evaluation survey by
teachers yielded an average of 3.51 which both mean that teacher collaboration is effective and
helpful in improving student achievement.
Based on the student testing data from benchmark tests, intensive collaboration is more
effective than non-intensive collaboration in improving student achievement.
2. How many times did the teachers collaborate, analyze and present data, and how often did
they use common resources and strategies shared by their teammates and the intern?
Overall, the teachers met 30 times from September 22, 2011 through March 15, 2012.
Below is a list of day the team met with the main agenda for each day.
Table 16: Summary of Collaborative Meetings and Data Analyses and Presentations
23

Improving Student Achievement Through Teacher Collaboration
PLANNING PHASE
Collaboration on Lesson Planning, Implementation and Assessment
Data Analyses and Presentations
September 22, 2011 October 14, 2011
September 28, 2011 October 20, 2011
October 6, 2011 October 21, 2011
October 10, 2011 October 31, 2011
October 13, 2011
September 23, 2011
September 29, 2012
IMPLEMENTATION PHASE: INTENSIVE COLLABORATIONNovember 10, 2011 December 16, 2011
November 18, 2011 January 6, 2012
November 21, 2011 January 7, 2012
December 2, 2011 January 9, 2012
December 7, 2011 January 13, 2012
December 9, 2011
November 9, 2011
December 14, 2011
SPECIAL MEETING: BUDGET MEETING. December 19, 2012
IMPLEMENTATION PHASE: NON- INTENSIVE COLLABORATION
January 20, 2012
January 21, 2012
January 25, 2012
January 26, 2012
February 10, 2012
February 17, 2012
January 20, 2012 (AR Results)
SPECIAL MEETING: April 5, 2012
PROBLEM OF PRACTICE DATA PRESENTATION TO TEACHERS AND MENTOR PRINCIPAL.
Overall, the team met 26 times to collaborate on lesson planning, lesson implementation,
and planning for common assessments. In addition, they met 5 times on data analyses and
presentations. It should be noted here that the team met 8 times more during the intensive
collaboration than non-intensive collaboration, and based on the benchmark results, intensive
collaboration yielded higher benchmark average for students than non-intensive collaboration.
Below shows how often the teachers use common resources and strategies based on the
teacher evaluation survey results:
24

Improving Student Achievement Through Teacher Collaboration
Chart 16: Frequency of Using Common Resources and Strategies by Teachers
Teachers B and C use common resources and strategies on a regular basis while teachers A
and D use them one in a while. Incidentally, teachers B and C are the younger teachers.
3. Based on the teacher evaluation survey, how did the teachers see collaboration as an
effective strategy to improve student achievement?
The teacher evaluation survey results were categorized into two groups – average by
questions and average by teachers’ overall response. Based on the data on average by questions,
teachers rated themselves the lowest on teamwork (2.5) and highest on continuing the collaborative
processes on a regular basis after this year (4.0). On the other hand, based on the data on average
by teachers’ overall response, 75% of the teachers believe that teacher collaboration is between
helpful and very helpful and 25% believe that it is somewhat helpful. The overall average of 3.35
out of 4.00 for all questions and 3.51 out of 4.00 for all teachers show that the teachers see
collaboration as an effective strategy to improve student achievement.
Conclusion
Based on benchmark tests 2 and 3 results and teacher evaluation survey results, teacher
25
Improving Student Achievement Through Teacher Collaboration
collaboration is an effective strategy to improve student achievement. In addition, intensive teacher
collaboration is more effective than non-intensive collaboration in improving student achievement.
Recommendations
For New Teachers:
I recommend that intensive collaboration be implemented. Intensive collaboration works
better for new teachers. This is very evident in this problem of practice. The new teacher of the
team even had to defend her responses to the teacher evaluation questions when the most senior
member of the team commented that everybody is not honest in answering survey questions. The
new teacher in the team said that she learned a lot from the teacher collaborative processes.
For Senior Teachers:
Intensive collaboration does not work for most, if not all, of the senior teachers in the team.
When implementing change, there is a tendency that not all senior teachers are open to the new
ideas, new strategies, and new administrators. They also have the tendency to believe that the
strategies that they have been utilizing in years work better than the new ones on the table. If they
have not done collaboration in the truest sense of the word in the many years of being teachers,
then there is also a big tendency for them to oppose these changes. They want to be in control all
the time. They do not want anybody to come in and change the way things are.
At the end, when student-testing data shows that their students are not performing academically,
they have the tendency to blame others. Because of all of these tendencies that I have experienced
and observed in action during the implementation of my problem of practice, I recommend the
following:
1. Address their concerns. If you try to educate them and introduce changes, you must have
a policy that you need to constantly revisit. Communicate expectations clearly and
consistently remind them of these expectations.
2. Know whom you are dealing with. For example, when senior teachers in the team – do
not know their content; their track records (student testing data) were consistently low in
years and would blame other people for the results; and oppose change – do not implement
intensive collaboration. Do not capitalize on their shortcomings because they have a
tendency to take things personally. First, build strong relationship with them. Second, build
26
Improving Student Achievement Through Teacher Collaboration
trust. Third, emphasize their strength in your conversations with them. Fourth, use existing
policies on collaboration and if the school has none, create some. Finally, once these are in
place, gradually move in and encourage them to do better, prepare better, and look at
criticisms constructively.
For Administrators
I recommend patience. Change cannot happen overnight. Though you know that there is a
sense of urgency, introduce change slowly. Develop a plan. Establish goals. Communicate
expectations. Reflect on your actions and be mindful that your actions maybe misinterpreted.
Speak with proof. Use data to support your statements. Do not be discouraged when things go
wrong. Learn from your mistakes. Be strong.
Recognize that collaboration is not easy. Be a facilitator. Do not come in as an
authoritative figure. Come up with policies to deal with issues. Create some policies for
collaboration. Ask teachers not to take comments personally and look at the bigger picture. When a
new idea is introduced, advise them not take it as “Here is somebody telling me what to do,” but
instead contemplate, “How can this new idea be used to improve student achievement?”
For Future Research
I recommend that further research should be conducted on intensive teacher collaboration
that focuses on lateral entry teachers or on teachers who have been in the field for years and how
this would affect student achievement.
When I presented the overall problem of practice data to the teachers, Mrs. Hardy
mentioned that another reason why the students are not performing was because of how teachers
handle discipline in the classrooms. In this connection, I recommend that further research should
be conducted on teacher collaboration that focuses on implementing behavioral intervention
strategies and how these interventions affect student achievement.
REFERENCES
Chenoweth, K. (2009). HOW It’s Being Done. USA: Harvard Education Press
27
Improving Student Achievement Through Teacher Collaboration
Goddard, Y.L., Goddard, R.D., & Tschannen-Moran, M. (2007). A Theoretical and Empirical
Investigation of Teacher Collaboration for School Improvement and Student Achievement
in Public Elementary Schools. Teacher College Record, v109 n4 p877-896 2007. Retrieved
April 5, 2012, from http://www.tcrecord.org/Content.asp?ContentID=12871
Moolenaar, N. M., Sleegers, P. J. C., & Daly, A. J. (2012). Teaming up: Linking collaboration
networks, collective efficacy, and student achievement. Teaching and Teacher
Education, 28(2), 251-262. DOI: 10.1016/j.tate.2011.10.001. Retrieved April 5, 2012
From http://utwente.academia.edu/NienkeMoolenaar/Papers/313201/Teaming_up
_Linking_Collaboration_Networks_Collective_Efficacy_and_Student_Achievement
28
Related Documents


