Consultant’s Report This consultant’s report does not necessarily reflect the views of ADB or the Government concerned, and ADB and the Government cannot be held liable for its contents. (For project preparatory technical assistance: All the views expressed herein may not be incorporated into the proposed project’s design. Project Number: 43105-012 December 2018 India: Improving Small Farmers’ Access to Market in Bihar and Maharashtra (Financed by the Japan Fund for Poverty Reduction) Prepared by Pricewaterhouse Coopers Pvt. Ltd. Pune, India For Department of Cooperation, Marketing and Textile Maharashtra State Agricultural Marketing Board

Welcome message from author
This document is posted to help you gain knowledge. Please leave a comment to let me know what you think about it! Share it to your friends and learn new things together.
Transcript
Consultant’s Report
This consultant’s report does not necessarily reflect the views of ADB or the Government concerned, and ADB and the Government cannot be held liable for its contents. (For project preparatory technical assistance: All the views expressed herein may not be incorporated into the proposed project’s design.
Project Number: 43105-012 December 2018
India: Improving Small Farmers’ Access to Market in Bihar and Maharashtra (Financed by the Japan Fund for Poverty Reduction)
Prepared by Pricewaterhouse Coopers Pvt. Ltd.
Pune, India
For Department of Cooperation, Marketing and Textile Maharashtra State Agricultural Marketing Board
www.pwc.com
Improving Small Farmers' Access to Markets in Maharashtra Final End line Survey Report
December 27, 2018
Final
Strictly Private and Confidential
Registered Office - PricewaterhouseCoopers Private Limited, Y-14, Block EP, Sector V, Salt Lake, Kolkata 700 091 Telephone (033) 2357 9100, Facsimile (033) 2357 3394 Regional Office - Tower A – Wing 1, 7th Floor, Business Bay, Airport Road, Yerwada, Pune-411006, Maharashtra, India Corporate Identity Number or CIN: U74140WB1983PTC036093 Telephone (0124) 3306000, Facsimile (0124) 3306999, www.pwc.in
December 27, 2018
To,
Mrs. Nilima Gaikwad Project Director GIU-JFPR Plot No. F/E/78, Ground Floor, Land Development Bank (LDB) Building, Market Yard, Gultekdi, Pune-411037
Subject: Consultancy Services for Poverty Impact Assessment Survey - Submission of Final End line survey report
Dear Ma’am,
In accordance with your instructions as confirmed in our engagement letter dated 6 March 2018, we are pleased to submit the final End Line Survey Report as the final deliverable for the above consultancy services.
This Report constitutes the deliverable indicated in project milestone of the assignment as indicated in our engagement letter.
We request you not to make copies of this report available to other persons except as described in the Letter of Engagement and Terms of Business. Where provision has been made copies are subject to the conditions described therein. We will not accept any duty of care (whether in contract, tort (including negligence) or otherwise) to any person other than you, except under the arrangements described in the Letter of Engagement and Terms of Business.
If you require any clarification or further information, please do not hesitate to contact Ajay Kakra on +91-98713 55503 or email: [email protected].
Yours Sincerely,
Authorized Signatory
Ashok Varma
Partner
PricewaterhouseCoopers Pvt. Ltd.
Final
Improving Small Farmers' Access to Markets in Maharashtra December 27, 2018
PwC 2
Executive Summary
Context & Background
The Japan Fund for Poverty Reduction (JFPR) project-Improving Small Farmers’ Access to Market in Bihar and Maharashtra with grant provided by Asian Development Bank (ADB) seeked to increase income of small scale farmers’ through access to alternative channels of higher return markets. The expected outcome was enhanced integration small-scale fresh fruits and vegetable farmers into the horticultural value chains in the state. The project broadly comprised of the following components/activities:
i. Formation of farmer groups and producer companies ii. Capacity development of farmers’ and farmer groups
iii. Facilitation of farmer-buyer linkages iv. Project management, monitoring and evaluation
Objectives
The objectives of the assignment are broadly listed below:
To measure the impact of the Project, the levels of average annual household income before and after the Project measured among randomly selected farmers within the same production clusters.
To understand the outcomes achieved in terms of enhanced integration of small-scale fresh fruits and vegetable farmers into high value horticultural value chains in the target sites.
Approach & Methodology
In order to maintain parity between the findings of baseline and end line survey, we had undertaken a detailed review of the baseline survey questionnaire for target farmers. Based on the review, we held discussion with officials of GIU-JFPR in order to undertake need based modifications of questionnaire keeping in view the objectives of end line survey.
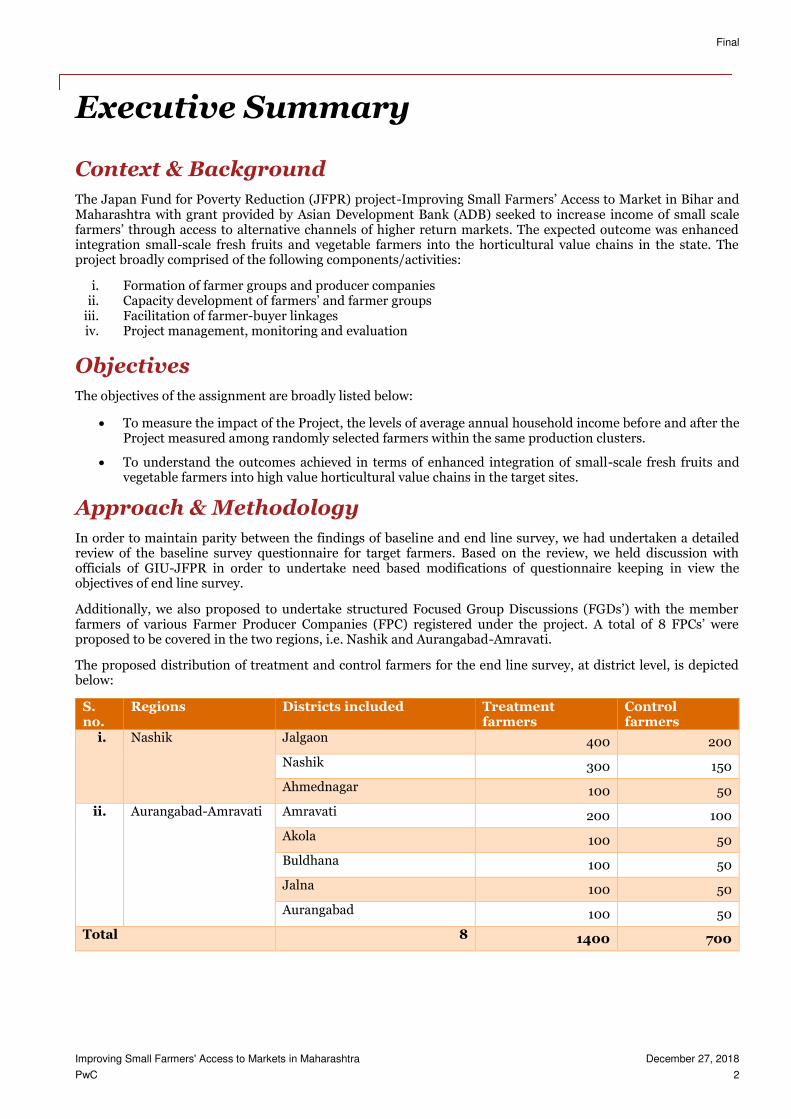
Additionally, we also proposed to undertake structured Focused Group Discussions (FGDs’) with the member farmers of various Farmer Producer Companies (FPC) registered under the project. A total of 8 FPCs’ were proposed to be covered in the two regions, i.e. Nashik and Aurangabad-Amravati.
The proposed distribution of treatment and control farmers for the end line survey, at district level, is depicted below:
S. no.
Regions Districts included Treatment farmers
Control farmers
i. Nashik Jalgaon 400 200
Nashik 300 150
Ahmednagar 100 50
ii. Aurangabad-Amravati Amravati 200 100
Akola 100 50
Buldhana 100 50
Jalna 100 50
Aurangabad 100 50
Total 8 1400 700
Final
Improving Small Farmers' Access to Markets in Maharashtra December 27, 2018
PwC 3
Selection of sample farmers at spoke level: The first preference for selection of treatment sample beneficiaries were the farmers covered in the baseline survey and who joined the Farmer Producer Companies (FPC) registered under the project. It was communicated by the project, that all the farmers covered in the baseline survey had not joined the project registered FPCs’. Thus, the remaining treatment farmers were be selected from the member farmers of the project registered FPCs’1 using random or systematic random sampling technique.
Selection of sample farmers at village level: In line with the sampling design in baseline survey, we had proposed to cover 20 treatment farmers per village, thus covering a total of 70 villages spread across 14 spokes and 8 districts. Apart from the treatment farmers, total of 10 control farmers per village (from same village as that of treatment farmers) were also be selected for comparison.
Key output and outcome focussed parameters and indicators finalized to capture the progress and status of the interventions of the project are as follows:
Output focused parameters and indicators:
1. Enhanced ability of target farmers to provide consistent FF&V supply that meets the requirements of modern markets
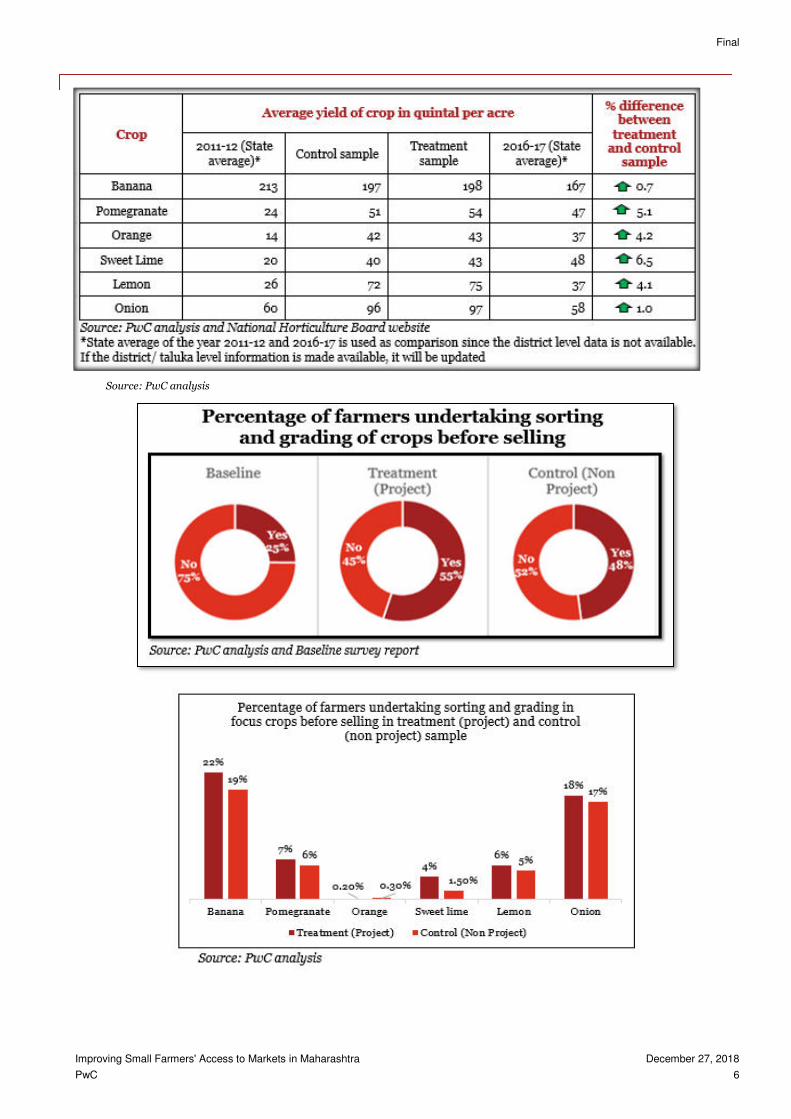
a. Number of Producer Groups (PG) formed in each of the two IVC’s (Integrated Value Chain) b. Percentage of members from vulnerable categories (SC, ST, women) in PGs’ and FPCs’ c. Productivity of focus crops d. Improved technical knowledge on modern farming practices e. Percentage of farmers undertaking sorting & grading practices in focus crops f. Percentage Grade A (Top quality) produce
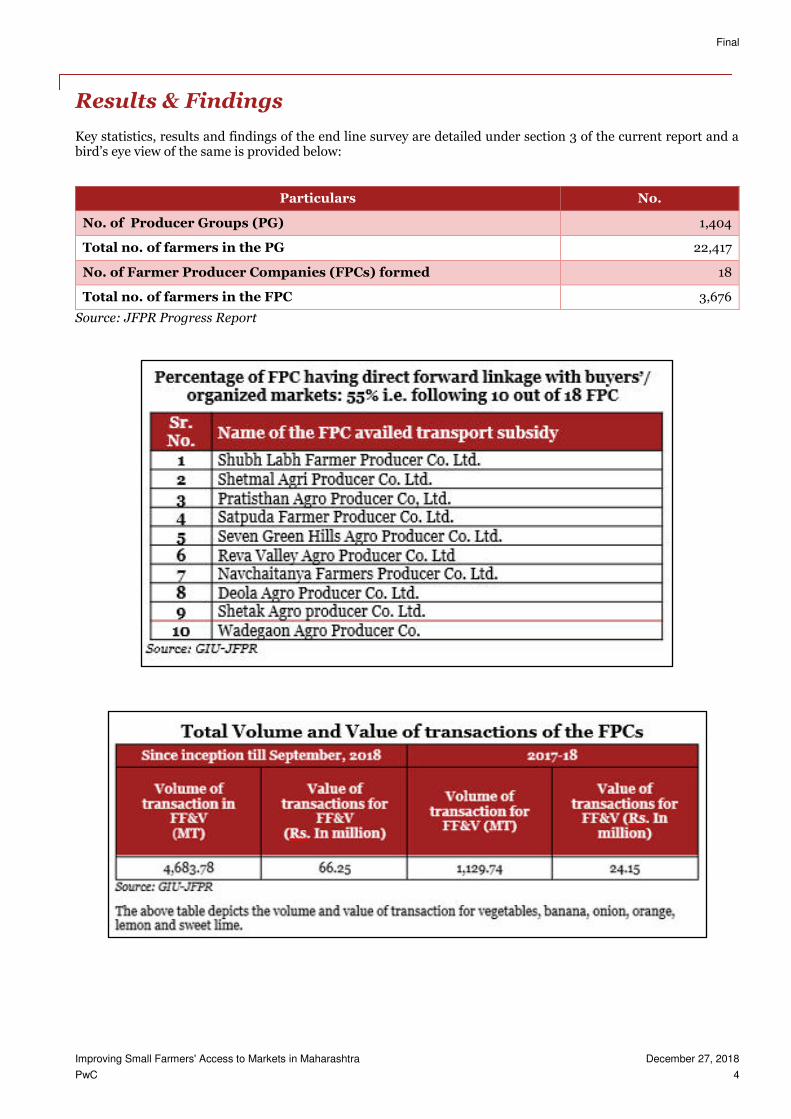
2. Improved linkage between target farmers and the market a. Number of registered Farmer Producer (FPC) Companies b. Percentage of FPC having direct forward linkage with buyers’/organized markets c. Volume/value of transactions of FPC in agricultural year 2017-18 d. Number of FPC’s availing revolving funds
Outcome and impact focused indicators:
1. Increased income of the small scale fresh fruit and vegetable (FF&V) farmers in the target sites a. Average farmer household income
2. Enhanced integration of small scale FF&V farmers into high value horticulture value chains in the target sites
a. Percentage target farmers selling their produce through value chain buyers b. Percentage of target farmers’ products’ sold through value chain buyers c. Price realized by target farmers for focus crops
We also attempted to undertake analysis of beneficiary (treatment farmers/members of FPC) feedback as regards the JFPR project interventions in terms of:
Usefulness in increasing productivity and adoption of modern production and post-harvest practices in
focus crops
Knowledge and information sharing
Collective buying of inputs and sale of produce
Ability to access alternate/organized channels of marketing
Increase in sales value realized
Overall satisfaction with project
Issues and challenges in operation of FPCs’ Recommendations/suggestions
1 To the extent possible first preference will be given to member farmers’ who have received training on agricultural production or post-harvest technologies from the lead farmers’ and the lead farmers’ themselves.
Final
Improving Small Farmers' Access to Markets in Maharashtra December 27, 2018
PwC 4
Results & Findings
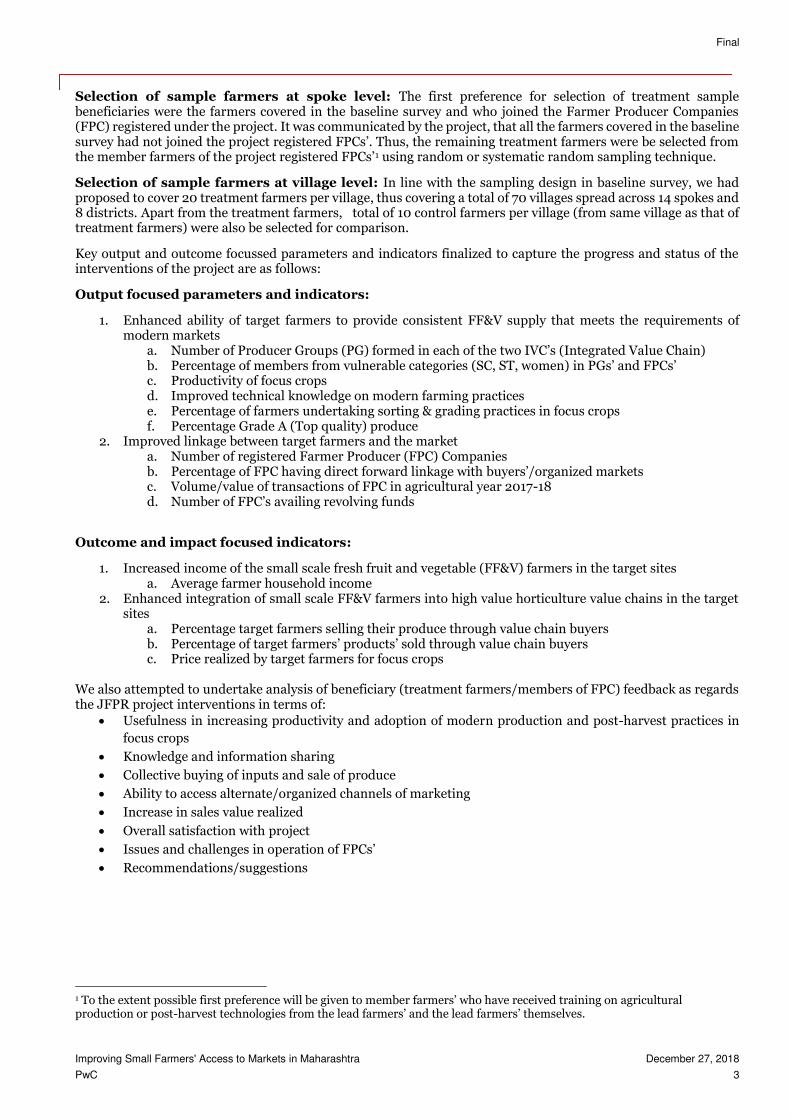
Key statistics, results and findings of the end line survey are detailed under section 3 of the current report and a bird’s eye view of the same is provided below:
Particulars No.
No. of Producer Groups (PG) 1,404
Total no. of farmers in the PG 22,417
No. of Farmer Producer Companies (FPCs) formed 18
Total no. of farmers in the FPC 3,676
Source: JFPR Progress Report
Final
Improving Small Farmers' Access to Markets in Maharashtra December 27, 2018
PwC 5
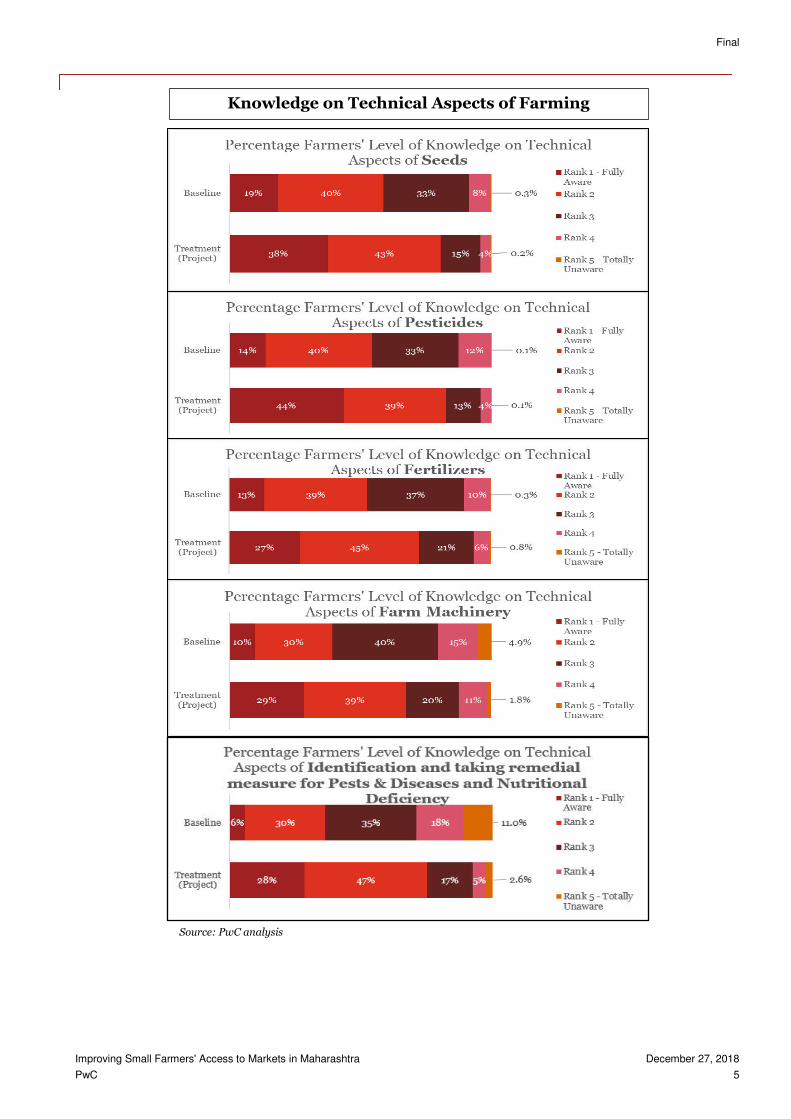
Knowledge on Technical Aspects of Farming
Source: PwC analysis
Final
Improving Small Farmers' Access to Markets in Maharashtra December 27, 2018
PwC 6
Source: PwC analysis
Final
Improving Small Farmers' Access to Markets in Maharashtra December 27, 2018
PwC 7
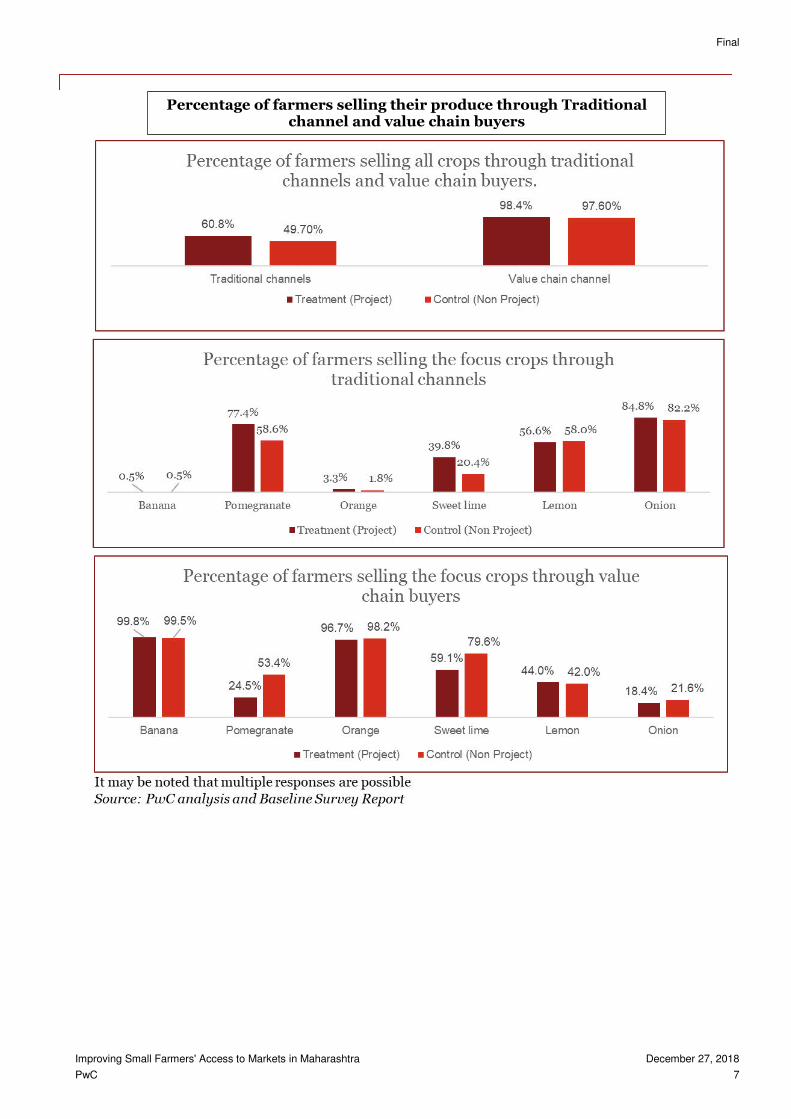
Percentage of farmers selling their produce through Traditional channel and value chain buyers
Final
Improving Small Farmers' Access to Markets in Maharashtra December 27, 2018
PwC 8
Overall satisfaction of the treatment (project) farmers with the Project
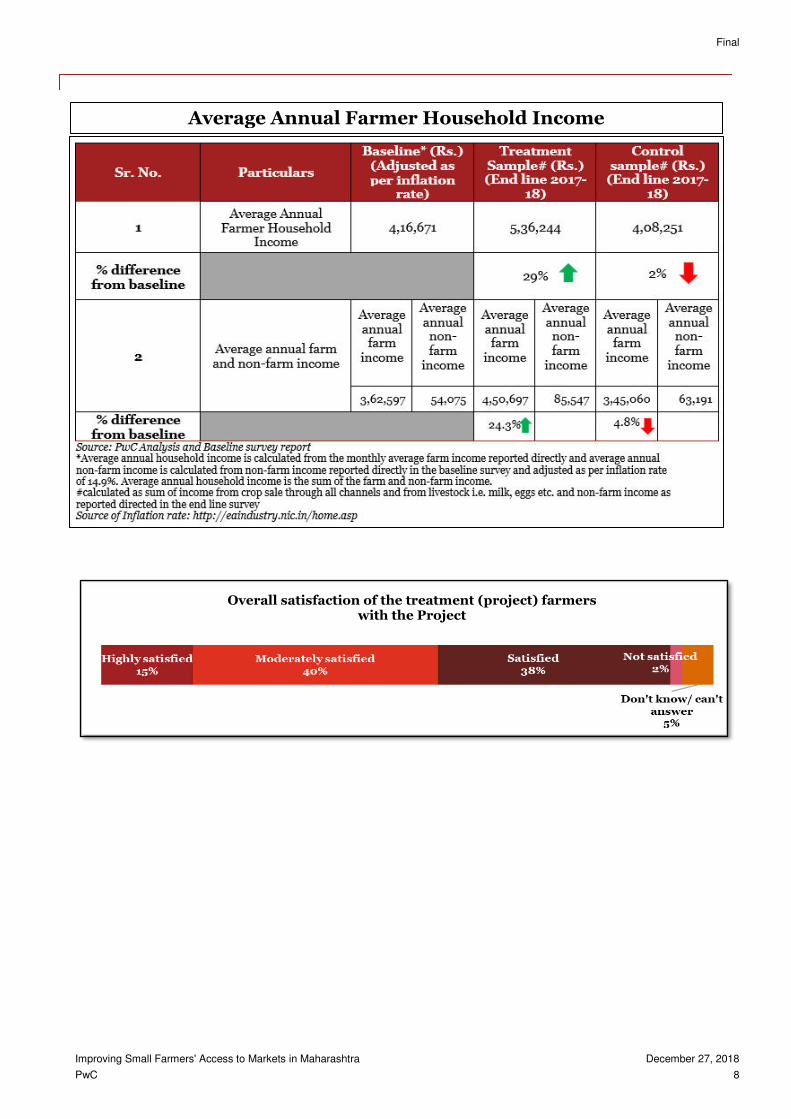
Average Annual Farmer Household Income
Final
Improving Small Farmers' Access to Markets in Maharashtra December 27, 2018
PwC 9
Salient observations
With respect to the benefits of association of the farmers with the project, 10%, 49% and 30% of the treatment (project) farmers ranked increased access to alternate channels (Private market, direct marketing, organized wholesaler/retailer/processer) of marketing as high, medium and low respectively.
10%, 47% and 32% of the treatment (project) farmers ranked increased ability to take independent decision in terms of production and marketing of fresh fruits and vegetables as benefit of association with the project as high, medium and low respectively.
23%, 53% and 13% of the treatment (project) farmers ranked productivity increase of horticulture crops cultivated as a benefit of association with the project as high, medium and low respectively.
14%, 54% and 22% of the treatment (project) farmers ranked increase in quality of produce harvested as a benefit of association with the project as high, medium and low respectively.
8%, 50% and 30% of the treatment (project) farmers ranked reduced cost of inputs due to collective buying as benefit of association with the project as high, medium and low respectively.
10%, 47% and 32% of the treatment (project) farmers ranked increased ability to take independent decision in terms of production and marketing of fresh fruits and vegetables as benefit of association with the project as high, medium and low respectively.
14%, 54% and 25% of the treatment (project) farmers ranked improved sharing of knowledge regarding cultivation and marketing of fresh fruits and vegetables by being part of farmer group/company as benefit of association with the project as high, medium and low respectively.
15% of the treatment (project) farmers are highly satisfied, 40% of the treatment (project) farmers are moderately satisfied, 38% of the treatment (project) farmers are satisfied and 2% of the treatment (project) farmers are not satisfied with the project.
Majority of the treatment (project) farmers together reported to have been highly and moderately satisfied with the project interventions.
Since the interventions under the projects have just been completed or still under completion, more time is required to gauge the effectiveness of the project.
With the advent of on farm processing and packing in banana, the usage of pack house or collection center might become redundant and hence the benefits of the infrastructure provided under the project need to be revisited and modified, if required.
During initial formation of the FPCs, target crop was cultivated by most of the members, however due to vagaries of monsoon/hail storms significant change in product mix of members is necessitated, leading to longer gestation and revisiting some of the activities.
Farmers are realizing the benefits of marketing their produce and purchasing inputs through FPC.
Social capital formed in the nature of FPC has been leveraged effectively to introduce new or unexplored horticulture crops in the region.
As per discussion with the members of the FPC, the exposure visits were received well by them and individually some FPCs have tapped the opportunity and established trade linkages with distant/ new markets.
On the basis of the analysis, 50% and 8% of the treatment farmers ranked benefit of association with MSAMB as reduced cost of inputs due to collective buying as medium and high respectively. This resonated during the interaction with FPC members.
On the basis of the information regarding revolving funds shared by GIU-JFPR only 10 FPC have benefitted from the intervention. On further discussions it was reported that the initial use of revolving fund based market transactions has benefitted relatively few members of the FPC, mostly in single digits.
Final
Improving Small Farmers' Access to Markets in Maharashtra December 27, 2018
PwC 10
This page is intentionally left blank.
Final
Improving Small Farmers' Access to Markets in Maharashtra December 27, 2018 PwC 11
Table of Contents
1. Context & Background ..........................................................................................................13
1.1. Project Background and Introduction....................................................................................................... 13
1.2. Objective of the assignment ...................................................................................................................... 14
2. End line survey framework .................................................................................................. 15
2.1. Approach and methodology ...................................................................................................................... 15
2.2. Scope of the end line survey ...................................................................................................................... 15
2.3 Assessment framework of the end line survey .......................................................................................... 16
2.4 Research design for the study .................................................................................................................... 17
2.5 End line survey parameters ....................................................................................................................... 19
2.5.1 Output focussed parameters and indicators .......................................................................................... 19
2.5.2 Outcome and impact focussed indicators ............................................................................................. 20
2.5.3 Beneficiary feedback............................................................................................................................... 20
3. Result findings .....................................................................................................................21
3.1. Sample Profile ............................................................................................................................................ 21
3.1.1. District-Wise Summary .................................................................................................................... 21
3.1.2. Gender Profile .................................................................................................................................. 21
3.1.3. Age Profile ....................................................................................................................................... 22
3.1.4. Religion and Social Group .............................................................................................................. 23
3.1.5. Literacy Level .................................................................................................................................. 24
3.1.6. Occupation ...................................................................................................................................... 26
3.1.7. Income Levels .................................................................................................................................. 27
3.1.8. Type & Extent of Landholding ....................................................................................................... 29
3.1.9. Availability of Irrigation Facilities .................................................................................................. 31
3.2. Access to Post Harvest Facilities ............................................................................................................. 32
3.3. Ownership of Livestock and Assets ......................................................................................................... 38
3.4. Credit ......................................................................................................................................................... 40
3.5. Modern Crop Management Practices undertaken by treatment (project) farmers .............................. 42
3.6. Information Sources used by Farmers .................................................................................................... 44
3.7. Output Focused Parameters and Indicators ........................................................................................... 46
3.7.1. Enhanced ability of target farmers to provide consistent FF&V supply that meets the
requirements of the modern markets ...................................................................................................... 46
3.7.2. Improved linkage between target farmers and the market .......................................................... 53
3.8. Income and Outcome Focused Parameters and Indicators ................................................................... 56
3.8.1. Increased income of small scale fresh fruits and vegetables (FF&V) farmers in the target sites56
3.8.2. Enhanced integration of small scale FF&V farmers into high value horticulture value chains in
the target sites ........................................................................................................................................... 57
4. Salient observations ............................................................................................................ 61
4.1. Benefits of association with MSAMB ........................................................................................................ 61
4.2. Conclusion and Focused Group Discussion findings ............................................................................. 62
Final
Improving Small Farmers' Access to Markets in Maharashtra December 27, 2018 PwC 12
5. Comments from Workshop for information dissemination ................................................ 65
Appendices ............................................................................................................................. 69
Farmer household schedule ............................................................................................................................ 69
List of Farmer Producer Companies registered ............................................................................................. 83
Volume and value of transactions of the FPC since inception till September, 2018 and during the
agricultural year 2017-18 ................................................................................................................................. 84
Markets accessed by FPC since inception ...................................................................................................... 85
Final
Improving Small Farmers' Access to Markets in Maharashtra December 27, 2018 PwC 13
1. Context & Background
1.1. Project Background and Introduction
The Japan Fund for Poverty Reduction (JFPR) project-Improving Small Farmers’ Access to Market in Bihar and Maharashtra with grant provided by Asian Development Bank (ADB) seeked to increase income of small scale farmers’ through access to alternative channels of higher return markets. The expected outcome was enhanced integration small-scale fresh fruits and vegetable farmers into the horticultural value chains in the state. The project broadly comprised of the following components/activities:
i. Formation of farmer groups and producer companies ii. Capacity development of farmers’ and farmer groups
iii. Facilitation of farmer-buyer linkages iv. Project management, monitoring and evaluation
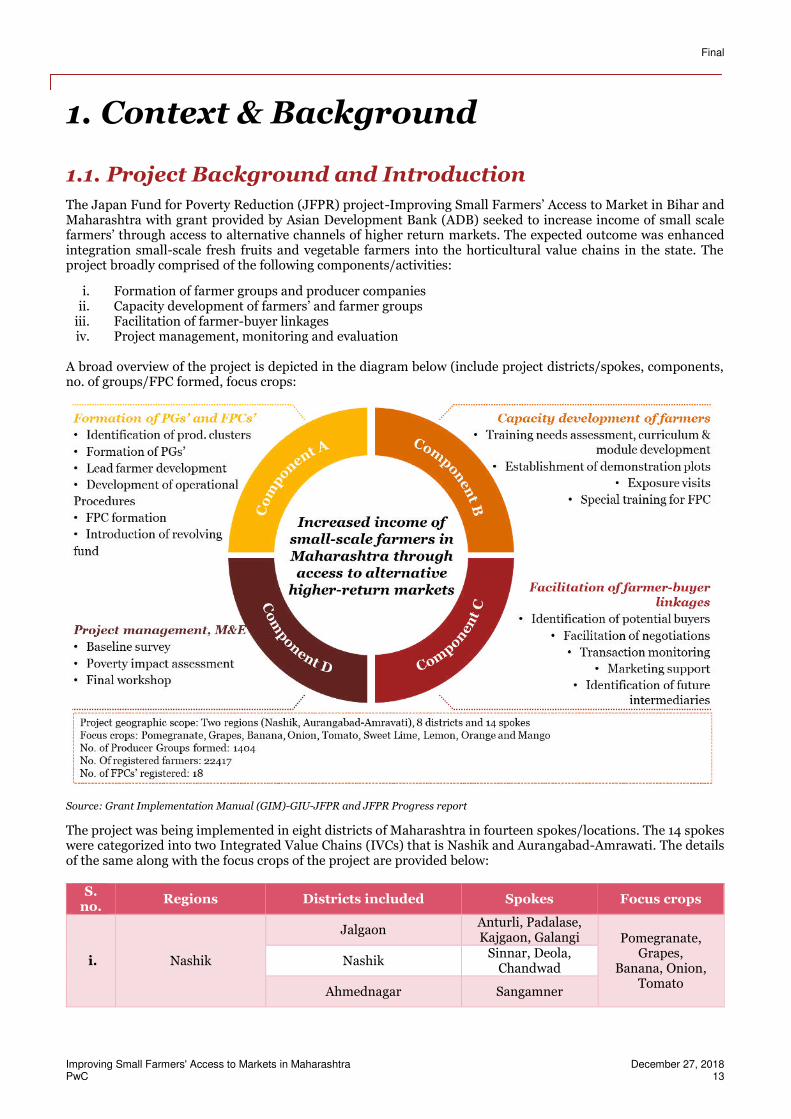
A broad overview of the project is depicted in the diagram below (include project districts/spokes, components, no. of groups/FPC formed, focus crops:
Source: Grant Implementation Manual (GIM)-GIU-JFPR and JFPR Progress report
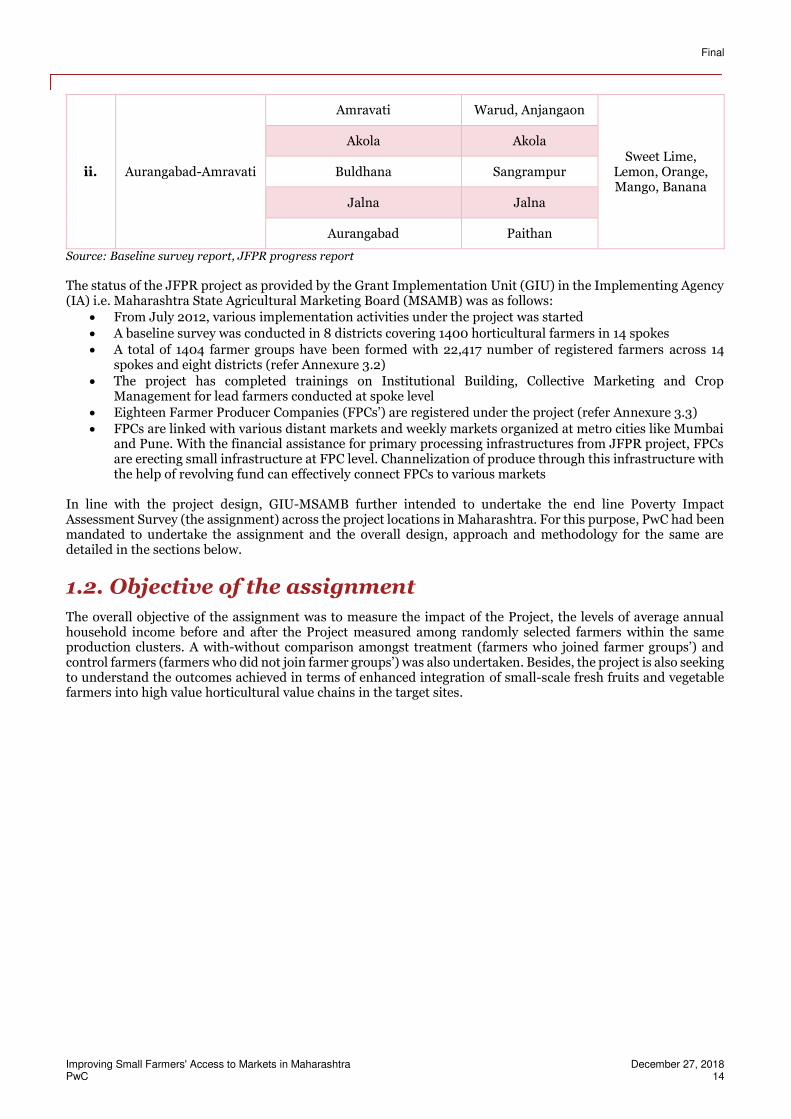
The project was being implemented in eight districts of Maharashtra in fourteen spokes/locations. The 14 spokes were categorized into two Integrated Value Chains (IVCs) that is Nashik and Aurangabad-Amrawati. The details of the same along with the focus crops of the project are provided below:
S. no.
Regions Districts included Spokes Focus crops
i. Nashik
Jalgaon Anturli, Padalase, Kajgaon, Galangi Pomegranate,
Grapes, Banana, Onion,
Tomato
Nashik Sinnar, Deola,
Chandwad
Ahmednagar Sangamner
Final
Improving Small Farmers' Access to Markets in Maharashtra December 27, 2018 PwC 14
ii. Aurangabad-Amravati
Amravati Warud, Anjangaon
Sweet Lime, Lemon, Orange, Mango, Banana
Akola Akola
Buldhana Sangrampur
Jalna Jalna
Aurangabad Paithan
Source: Baseline survey report, JFPR progress report
The status of the JFPR project as provided by the Grant Implementation Unit (GIU) in the Implementing Agency (IA) i.e. Maharashtra State Agricultural Marketing Board (MSAMB) was as follows:
From July 2012, various implementation activities under the project was started
A baseline survey was conducted in 8 districts covering 1400 horticultural farmers in 14 spokes
A total of 1404 farmer groups have been formed with 22,417 number of registered farmers across 14 spokes and eight districts (refer Annexure 3.2)
The project has completed trainings on Institutional Building, Collective Marketing and Crop Management for lead farmers conducted at spoke level
Eighteen Farmer Producer Companies (FPCs’) are registered under the project (refer Annexure 3.3)
FPCs are linked with various distant markets and weekly markets organized at metro cities like Mumbai and Pune. With the financial assistance for primary processing infrastructures from JFPR project, FPCs are erecting small infrastructure at FPC level. Channelization of produce through this infrastructure with the help of revolving fund can effectively connect FPCs to various markets
In line with the project design, GIU-MSAMB further intended to undertake the end line Poverty Impact Assessment Survey (the assignment) across the project locations in Maharashtra. For this purpose, PwC had been mandated to undertake the assignment and the overall design, approach and methodology for the same are detailed in the sections below.
1.2. Objective of the assignment
The overall objective of the assignment was to measure the impact of the Project, the levels of average annual household income before and after the Project measured among randomly selected farmers within the same production clusters. A with-without comparison amongst treatment (farmers who joined farmer groups’) and control farmers (farmers who did not join farmer groups’) was also undertaken. Besides, the project is also seeking to understand the outcomes achieved in terms of enhanced integration of small-scale fresh fruits and vegetable farmers into high value horticultural value chains in the target sites.
Final
Improving Small Farmers' Access to Markets in Maharashtra December 27, 2018 PwC 15
2. End line survey framework
2.1. Approach and methodology
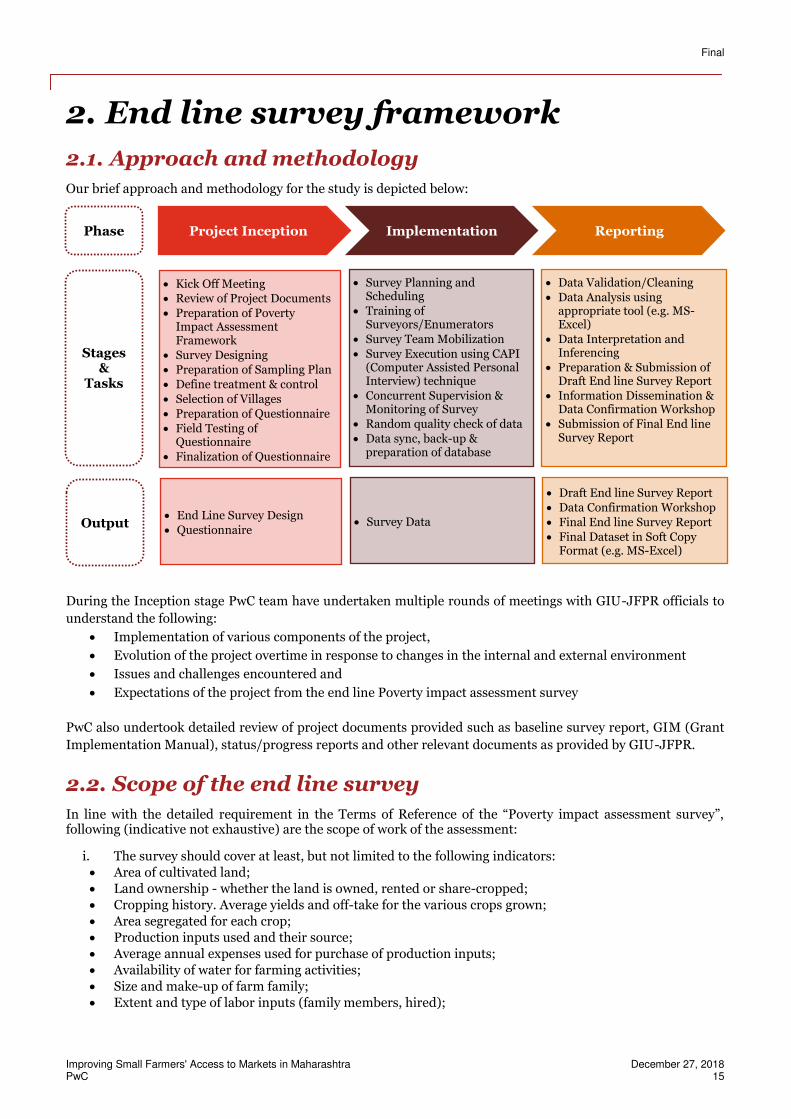
Our brief approach and methodology for the study is depicted below:
During the Inception stage PwC team have undertaken multiple rounds of meetings with GIU-JFPR officials to
understand the following:
Implementation of various components of the project,
Evolution of the project overtime in response to changes in the internal and external environment
Issues and challenges encountered and
Expectations of the project from the end line Poverty impact assessment survey
PwC also undertook detailed review of project documents provided such as baseline survey report, GIM (Grant
Implementation Manual), status/progress reports and other relevant documents as provided by GIU-JFPR.
2.2. Scope of the end line survey
In line with the detailed requirement in the Terms of Reference of the “Poverty impact assessment survey”, following (indicative not exhaustive) are the scope of work of the assessment:
i. The survey should cover at least, but not limited to the following indicators:
Area of cultivated land;
Land ownership - whether the land is owned, rented or share-cropped;
Cropping history. Average yields and off-take for the various crops grown;
Area segregated for each crop;
Production inputs used and their source;
Average annual expenses used for purchase of production inputs;
Availability of water for farming activities;
Size and make-up of farm family;
Extent and type of labor inputs (family members, hired);
Project Inception Implementation Reporting Phase
Stages &
Tasks
Kick Off Meeting Review of Project Documents
Preparation of Poverty Impact Assessment Framework
Survey Designing Preparation of Sampling Plan
Define treatment & control
Selection of Villages
Preparation of Questionnaire
Field Testing of Questionnaire
Finalization of Questionnaire
Survey Planning and Scheduling
Training of Surveyors/Enumerators
Survey Team Mobilization
Survey Execution using CAPI (Computer Assisted Personal Interview) technique
Concurrent Supervision & Monitoring of Survey
Random quality check of data
Data sync, back-up & preparation of database
Data Validation/Cleaning
Data Analysis using appropriate tool (e.g. MS-Excel)
Data Interpretation and Inferencing
Preparation & Submission of Draft End line Survey Report
Information Dissemination & Data Confirmation Workshop
Submission of Final End line Survey Report
Output End Line Survey Design
Questionnaire Survey Data
Draft End line Survey Report
Data Confirmation Workshop
Final End line Survey Report
Final Dataset in Soft Copy Format (e.g. MS-Excel)
Final
Improving Small Farmers' Access to Markets in Maharashtra December 27, 2018 PwC 16
Proportion of production of fruits and/or vegetables used at home and quantities sold in the market or marketing agents;
Proportion of FF&V crops sold to various market channels;
Annual average FF&V crop sales value, percentage of profits;
Sale intervals of each crop/harvest (production cycles product wise);
Number of farmers that sell their FF&V products to buyers such as organized retailers or wholesalers;
Identification of current markets, mode of sales, and buyers;
Sale of produce is in credit or cash down. If on credit – credit period and norms/terms of credit;
Success rate in timely receipt of payment for credit sales;
Is storage facility available with the individual and or public storage available on rent; if yes for which products (collect details on the facility);
Is storage space used for unsold products; if no – why? Collect details;
Average volume of produce wasted or damaged due to lack of storage space/ timely sale of product/ vagaries of weather/ market prices, etc.;
Do these farmers have crop insurance? If yes details of insurance, compensations received, etc., if no – reasons;
Average annual family income from farming and non-farm activities (capture the nature of non-farm activity);
Level of farmers' technical knowledge and skills on modern production and post-harvest activities; Current production and post-harvest practices;
Any on-farm value addition done? Willingness to do so in the future? If no – reasons;
Access to technical information regarding production and post-harvest practices including source; what additional information do they expect?
Experience in marketing / sale negotiations (capture the practice followed by the farmer);
The survey should ensure coverage key social indicators (if any not covered above) of the beneficiaries in the identified villages in each region;
Prepare and submit draft report with detail analysis vis-à-vis the goals, objectives and activities proposed under the JFPR project.
ii. Incorporation of the comments / suggestions / inputs on draft report and present the final report in a
formal workshop at the state level iii. Submission of data collected in electronic formats
2.3 Assessment framework of the end line survey
• We collected both quantitative and qualitative data to triangulate the evidence of outcome and impact of
intervention on project beneficiaries.
Levels of assessment:
We used both quantitative and qualitative measures for impact assessment of the interventions. The exercise was undertaken at three distinct levels as follows:
Final
Improving Small Farmers' Access to Markets in Maharashtra December 27, 2018 PwC 17
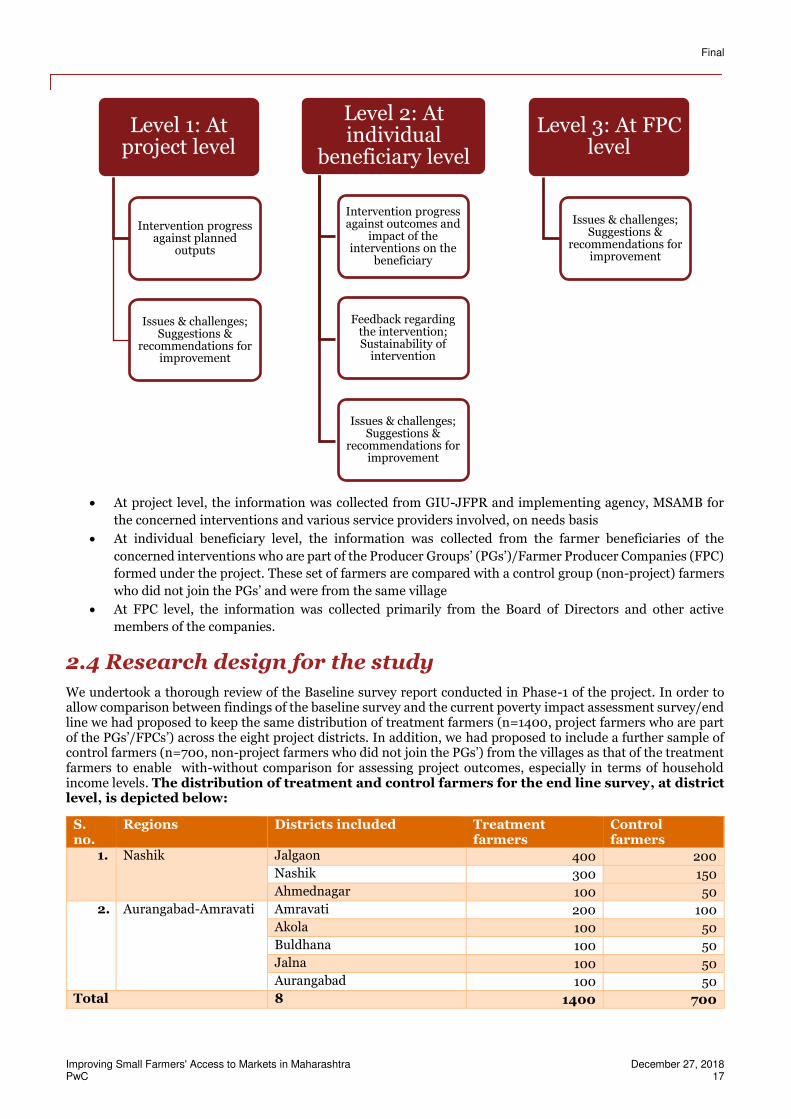
At project level, the information was collected from GIU-JFPR and implementing agency, MSAMB for
the concerned interventions and various service providers involved, on needs basis
At individual beneficiary level, the information was collected from the farmer beneficiaries of the
concerned interventions who are part of the Producer Groups’ (PGs’)/Farmer Producer Companies (FPC) formed under the project. These set of farmers are compared with a control group (non-project) farmers
who did not join the PGs’ and were from the same village
At FPC level, the information was collected primarily from the Board of Directors and other active
members of the companies.
2.4 Research design for the study
We undertook a thorough review of the Baseline survey report conducted in Phase-1 of the project. In order to allow comparison between findings of the baseline survey and the current poverty impact assessment survey/end line we had proposed to keep the same distribution of treatment farmers (n=1400, project farmers who are part of the PGs’/FPCs’) across the eight project districts. In addition, we had proposed to include a further sample of control farmers (n=700, non-project farmers who did not join the PGs’) from the villages as that of the treatment farmers to enable with-without comparison for assessing project outcomes, especially in terms of household income levels. The distribution of treatment and control farmers for the end line survey, at district level, is depicted below:
S. no.
Regions Districts included Treatment farmers
Control farmers
1. Nashik Jalgaon 400 200
Nashik 300 150
Ahmednagar 100 50
2. Aurangabad-Amravati Amravati 200 100
Akola 100 50
Buldhana 100 50
Jalna 100 50
Aurangabad 100 50
Total 8 1400 700
Level 1: At project level
Intervention progress against planned
outputs
Issues & challenges; Suggestions &
recommendations for improvement
Level 2: At individual
beneficiary level
Intervention progress against outcomes and
impact of the interventions on the
beneficiary
Feedback regarding the intervention; Sustainability of
intervention
Issues & challenges; Suggestions &
recommendations for improvement
Level 3: At FPC level
Issues & challenges; Suggestions &
recommendations for improvement
Final
Improving Small Farmers' Access to Markets in Maharashtra December 27, 2018 PwC 18
Considering that the total registered farmers under the various Producer Groups (PGs’) formed by the project is reported at 22,417, the end line survey covered around 6 percent of the total beneficiaries. At the overall project level, the end line survey results would thus be statistically significant at a higher precision which will be better than 95 percent confidence level and 5 percent margin of error.
Selection of sample farmers at spoke level:
We had proposed to distribute the treatment farmers in each district as in the baseline, with 100 farmers covered per spoke (total 14 spokes under the project with 18 registered FPCs’). The first preference for selection of treatment sample beneficiaries were the farmers covered in the baseline survey and who joined the Farmer Producer Companies (FPC) registered under the project. It was communicated by the project, that all the farmers covered in the baseline survey had not joined the project registered FPCs’. Thus, the remaining treatment farmers were be selected from the member farmers of the project registered FPCs’2 using random or systematic random sampling technique.
For the above, we requested the project to provide us with the following:
1. Complete member farmer list of the 18 FPC with farmer name, district, taluka and village name with
phone number
2. Details of farmers (farmer name, district, taluka, village name, project FPC in which farmer is member
and phone number) who were in baseline survey and are now members of the project registered FPC
Selection of sample farmers at village level:
In line with the sampling design in baseline survey, we had proposed to cover 20 treatment farmers per village, thus covering a total of 70 villages spread across 14 spokes and 8 districts. The sample of treatment farmers were selected using random or systematic random sampling technique with members of FPCs’ as the sampling frame (which included those farmers from baseline survey who have joined the project registered FPCs’). A total of 10 control farmers per village (from same village as that of treatment farmers) were also be selected for comparison.
Survey instruments:
In order to maintain parity between the findings of baseline and end line survey, we had undertaken a detailed review of the baseline survey questionnaire for target farmers. Based on the review, we held discussion with officials of GIU-JFPR in order to undertake need based modifications of questionnaire keeping in view the objectives of end line survey. Based on review and discussions a final end line survey questionnaire for target farmers had been developed and the same is attached in the Appendix. Please note that the questionnaire may be reviewed and updated based on the pilot survey to be conducted before commencement of the end line survey.
Additionally, we also proposed to undertake structured Focused Group Discussions (FGDs’) with the member farmers of various Farmer Producer Companies (FPC) registered under the project. A total of 8 FPCs’ were covered in the two regions, i.e. Nashik and Aurangabad-Amravati.
A checklist containing the following key areas will form a part of the FGDs’ with the members of FPC in terms of assistance from project:
Identification of potential buyers
Facilitation of farmer-buyer negotiations
Transaction monitoring
Identification of future intermediaries that would be interested in acting as intermediaries between the farmer groups and buyers beyond the Project
Marketing support for FPC (revolving fund. transport subsidy, packaging subsidy, small primary processing infrastructure-vehicle, pack house, plastic crates, grading machine, weighing machine)
2 To the extent possible first preference will be given to member farmers’ who have received training on agricultural production or post-harvest technologies from the lead farmers’ and the lead farmers’ themselves.
Final
Improving Small Farmers' Access to Markets in Maharashtra December 27, 2018 PwC 19
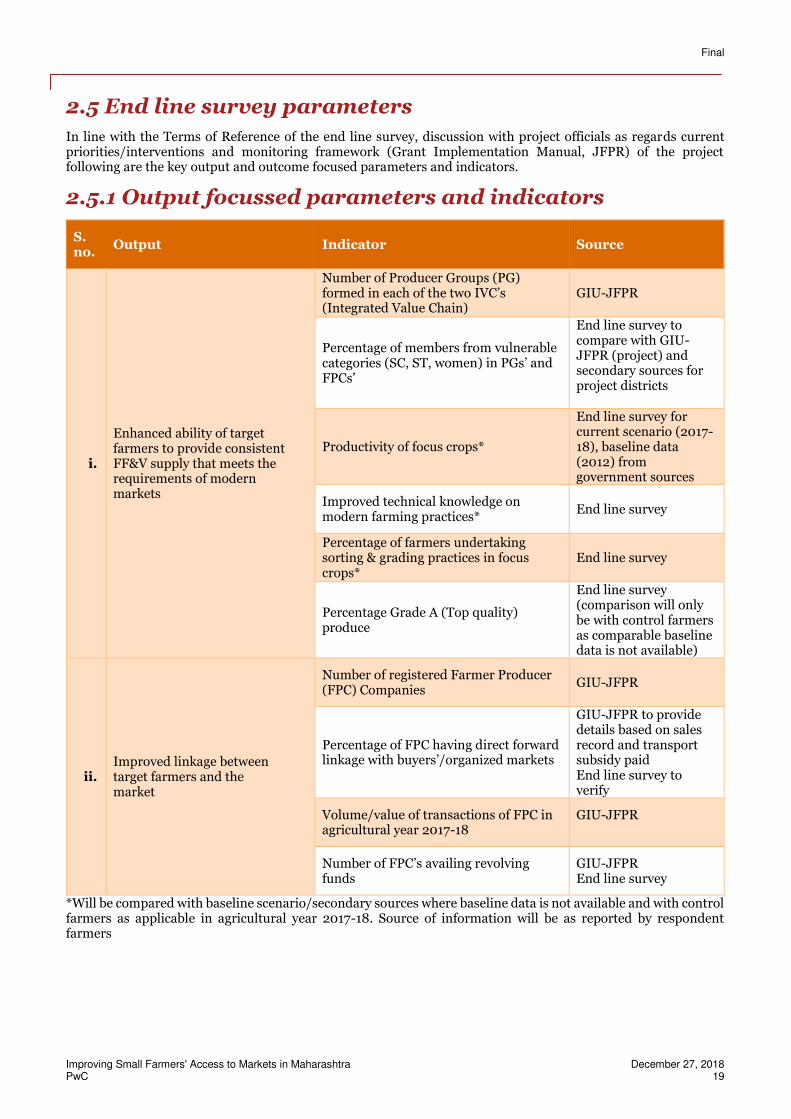
2.5 End line survey parameters
In line with the Terms of Reference of the end line survey, discussion with project officials as regards current priorities/interventions and monitoring framework (Grant Implementation Manual, JFPR) of the project following are the key output and outcome focused parameters and indicators.
2.5.1 Output focussed parameters and indicators
S. no.
Output Indicator Source
i.
Enhanced ability of target farmers to provide consistent FF&V supply that meets the requirements of modern markets
Number of Producer Groups (PG) formed in each of the two IVC’s (Integrated Value Chain)
GIU-JFPR
Percentage of members from vulnerable categories (SC, ST, women) in PGs’ and FPCs’
End line survey to compare with GIU-JFPR (project) and secondary sources for project districts
Productivity of focus crops*
End line survey for current scenario (2017-18), baseline data (2012) from government sources
Improved technical knowledge on modern farming practices*
End line survey
Percentage of farmers undertaking sorting & grading practices in focus crops*
End line survey
Percentage Grade A (Top quality) produce
End line survey (comparison will only be with control farmers as comparable baseline data is not available)
ii. Improved linkage between target farmers and the market
Number of registered Farmer Producer (FPC) Companies
GIU-JFPR
Percentage of FPC having direct forward linkage with buyers’/organized markets
GIU-JFPR to provide details based on sales record and transport subsidy paid End line survey to verify
Volume/value of transactions of FPC in agricultural year 2017-18
GIU-JFPR
Number of FPC’s availing revolving funds
GIU-JFPR End line survey
*Will be compared with baseline scenario/secondary sources where baseline data is not available and with control farmers as applicable in agricultural year 2017-18. Source of information will be as reported by respondent farmers
Final
Improving Small Farmers' Access to Markets in Maharashtra December 27, 2018 PwC 20
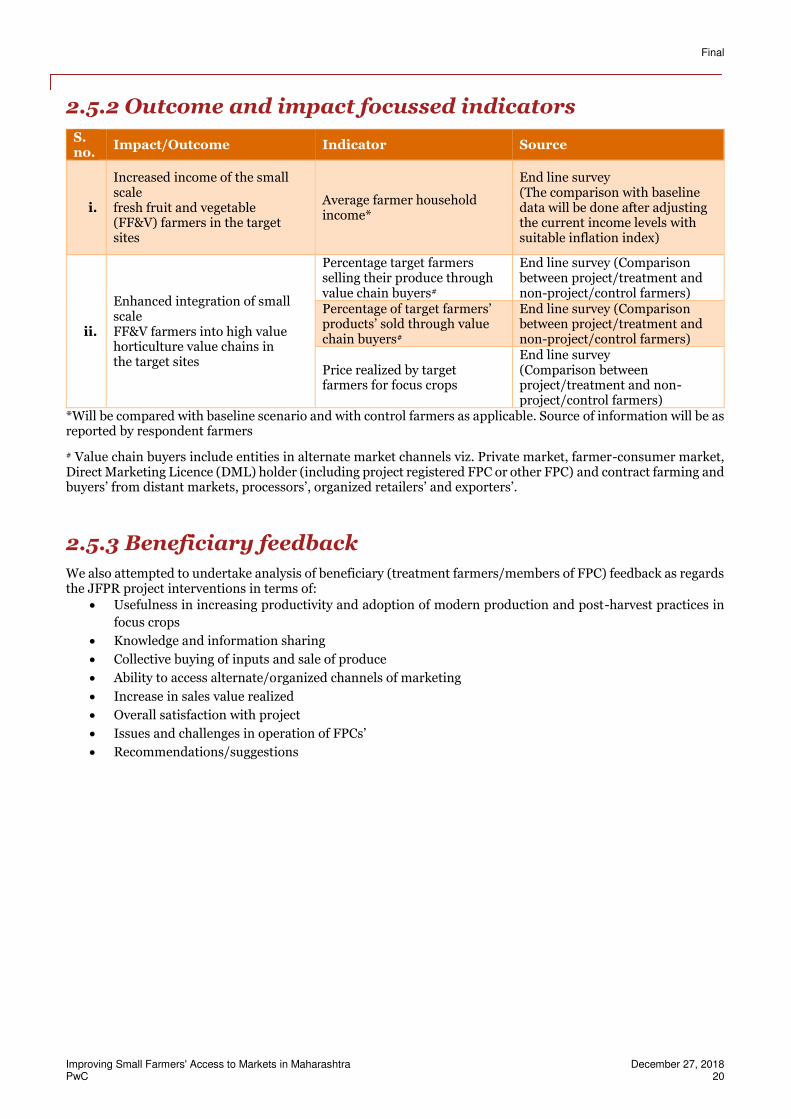
2.5.2 Outcome and impact focussed indicators
S. no.
Impact/Outcome Indicator Source
i.
Increased income of the small scale fresh fruit and vegetable (FF&V) farmers in the target sites
Average farmer household income*
End line survey (The comparison with baseline data will be done after adjusting the current income levels with suitable inflation index)
ii.
Enhanced integration of small scale FF&V farmers into high value horticulture value chains in the target sites
Percentage target farmers selling their produce through value chain buyers#
End line survey (Comparison between project/treatment and non-project/control farmers)
Percentage of target farmers’ products’ sold through value chain buyers#
End line survey (Comparison between project/treatment and non-project/control farmers)
Price realized by target farmers for focus crops
End line survey (Comparison between project/treatment and non-project/control farmers)
*Will be compared with baseline scenario and with control farmers as applicable. Source of information will be as reported by respondent farmers
# Value chain buyers include entities in alternate market channels viz. Private market, farmer-consumer market, Direct Marketing Licence (DML) holder (including project registered FPC or other FPC) and contract farming and buyers’ from distant markets, processors’, organized retailers’ and exporters’.
2.5.3 Beneficiary feedback
We also attempted to undertake analysis of beneficiary (treatment farmers/members of FPC) feedback as regards the JFPR project interventions in terms of:
Usefulness in increasing productivity and adoption of modern production and post-harvest practices in
focus crops
Knowledge and information sharing
Collective buying of inputs and sale of produce
Ability to access alternate/organized channels of marketing
Increase in sales value realized
Overall satisfaction with project
Issues and challenges in operation of FPCs’ Recommendations/suggestions
Final
Improving Small Farmers' Access to Markets in Maharashtra December 27, 2018 PwC 21
3. Result findings
3.1. Sample Profile
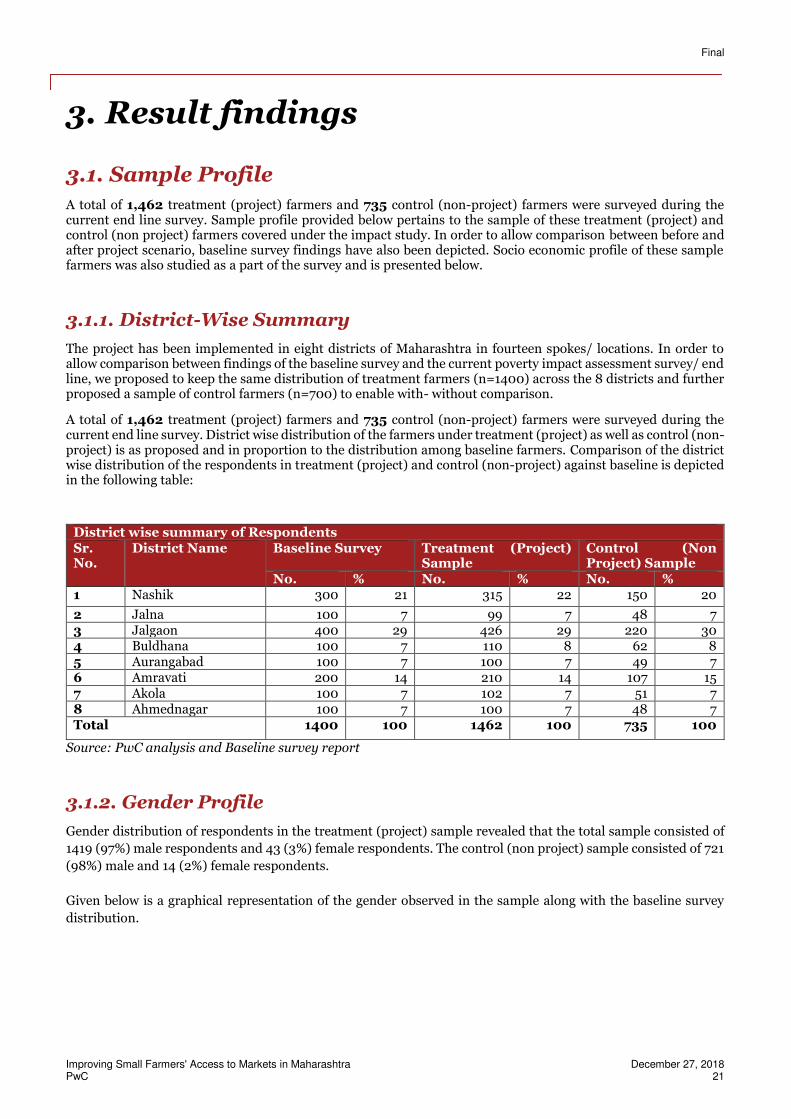
A total of 1,462 treatment (project) farmers and 735 control (non-project) farmers were surveyed during the current end line survey. Sample profile provided below pertains to the sample of these treatment (project) and control (non project) farmers covered under the impact study. In order to allow comparison between before and after project scenario, baseline survey findings have also been depicted. Socio economic profile of these sample farmers was also studied as a part of the survey and is presented below.
3.1.1. District-Wise Summary
The project has been implemented in eight districts of Maharashtra in fourteen spokes/ locations. In order to allow comparison between findings of the baseline survey and the current poverty impact assessment survey/ end line, we proposed to keep the same distribution of treatment farmers (n=1400) across the 8 districts and further proposed a sample of control farmers (n=700) to enable with- without comparison.
A total of 1,462 treatment (project) farmers and 735 control (non-project) farmers were surveyed during the current end line survey. District wise distribution of the farmers under treatment (project) as well as control (non-project) is as proposed and in proportion to the distribution among baseline farmers. Comparison of the district wise distribution of the respondents in treatment (project) and control (non-project) against baseline is depicted in the following table:
District wise summary of Respondents Sr. No.
District Name Baseline Survey Treatment (Project) Sample
Control (Non Project) Sample
No. % No. % No. % 1 Nashik 300 21 315 22 150 20
2 Jalna 100 7 99 7 48 7 3 Jalgaon 400 29 426 29 220 30 4 Buldhana 100 7 110 8 62 8 5 Aurangabad 100 7 100 7 49 7 6 Amravati 200 14 210 14 107 15 7 Akola 100 7 102 7 51 7 8 Ahmednagar 100 7 100 7 48 7 Total 1400 100 1462 100 735 100
Source: PwC analysis and Baseline survey report
3.1.2. Gender Profile
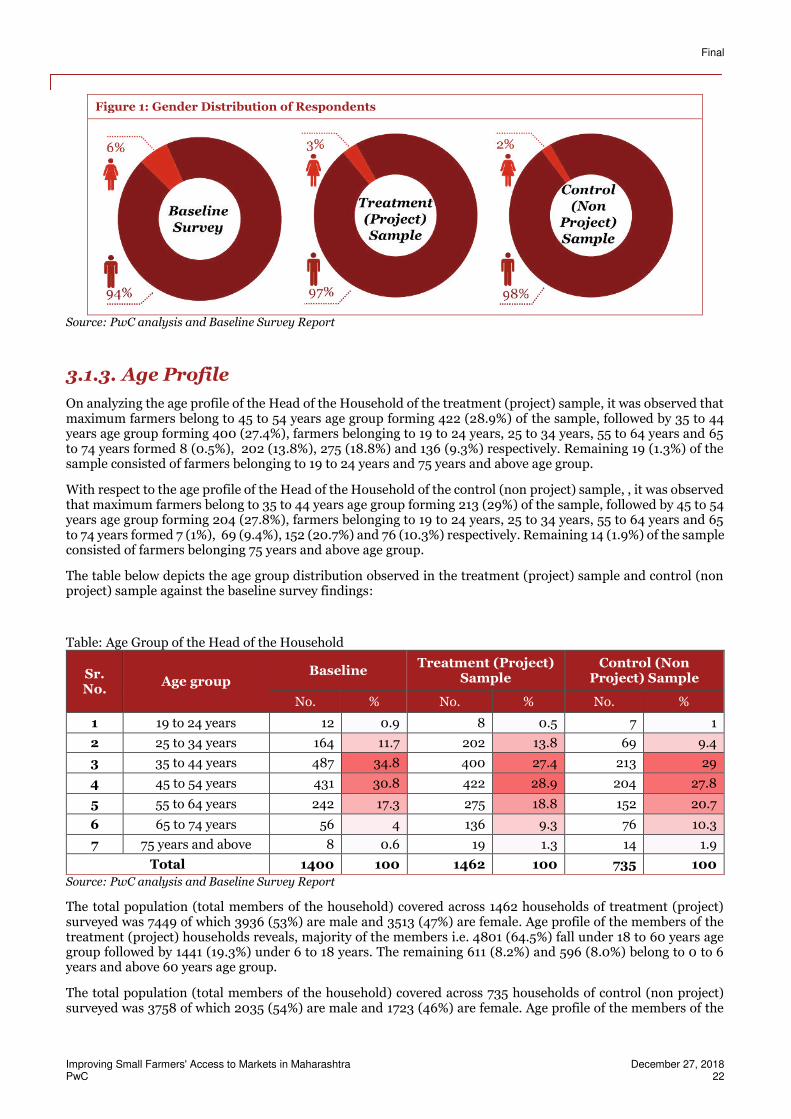
Gender distribution of respondents in the treatment (project) sample revealed that the total sample consisted of
1419 (97%) male respondents and 43 (3%) female respondents. The control (non project) sample consisted of 721
(98%) male and 14 (2%) female respondents.
Given below is a graphical representation of the gender observed in the sample along with the baseline survey
distribution.
Final
Improving Small Farmers' Access to Markets in Maharashtra December 27, 2018 PwC 22
Figure 1: Gender Distribution of Respondents
Source: PwC analysis and Baseline Survey Report
3.1.3. Age Profile
On analyzing the age profile of the Head of the Household of the treatment (project) sample, it was observed that maximum farmers belong to 45 to 54 years age group forming 422 (28.9%) of the sample, followed by 35 to 44 years age group forming 400 (27.4%), farmers belonging to 19 to 24 years, 25 to 34 years, 55 to 64 years and 65 to 74 years formed 8 (0.5%), 202 (13.8%), 275 (18.8%) and 136 (9.3%) respectively. Remaining 19 (1.3%) of the sample consisted of farmers belonging to 19 to 24 years and 75 years and above age group.
With respect to the age profile of the Head of the Household of the control (non project) sample, , it was observed that maximum farmers belong to 35 to 44 years age group forming 213 (29%) of the sample, followed by 45 to 54 years age group forming 204 (27.8%), farmers belonging to 19 to 24 years, 25 to 34 years, 55 to 64 years and 65 to 74 years formed 7 (1%), 69 (9.4%), 152 (20.7%) and 76 (10.3%) respectively. Remaining 14 (1.9%) of the sample consisted of farmers belonging 75 years and above age group.
The table below depicts the age group distribution observed in the treatment (project) sample and control (non project) sample against the baseline survey findings:
Table: Age Group of the Head of the Household
Sr. No.
Age group Baseline
Treatment (Project) Sample
Control (Non Project) Sample
No. % No. % No. %
1 19 to 24 years 12 0.9 8 0.5 7 1
2 25 to 34 years 164 11.7 202 13.8 69 9.4
3 35 to 44 years 487 34.8 400 27.4 213 29
4 45 to 54 years 431 30.8 422 28.9 204 27.8
5 55 to 64 years 242 17.3 275 18.8 152 20.7
6 65 to 74 years 56 4 136 9.3 76 10.3
7 75 years and above 8 0.6 19 1.3 14 1.9
Total 1400 100 1462 100 735 100
Source: PwC analysis and Baseline Survey Report
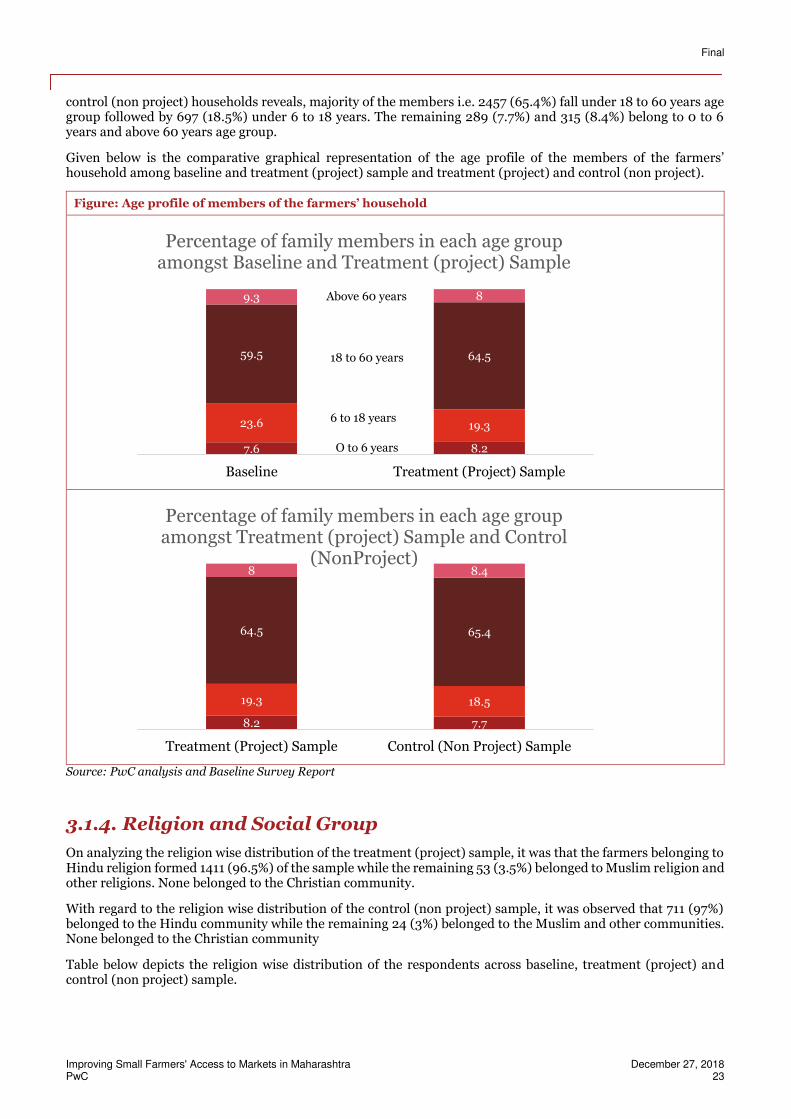
The total population (total members of the household) covered across 1462 households of treatment (project) surveyed was 7449 of which 3936 (53%) are male and 3513 (47%) are female. Age profile of the members of the treatment (project) households reveals, majority of the members i.e. 4801 (64.5%) fall under 18 to 60 years age group followed by 1441 (19.3%) under 6 to 18 years. The remaining 611 (8.2%) and 596 (8.0%) belong to 0 to 6 years and above 60 years age group.
The total population (total members of the household) covered across 735 households of control (non project) surveyed was 3758 of which 2035 (54%) are male and 1723 (46%) are female. Age profile of the members of the
Final
Improving Small Farmers' Access to Markets in Maharashtra December 27, 2018 PwC 23
control (non project) households reveals, majority of the members i.e. 2457 (65.4%) fall under 18 to 60 years age group followed by 697 (18.5%) under 6 to 18 years. The remaining 289 (7.7%) and 315 (8.4%) belong to 0 to 6 years and above 60 years age group.
Given below is the comparative graphical representation of the age profile of the members of the farmers’ household among baseline and treatment (project) sample and treatment (project) and control (non project).
Figure: Age profile of members of the farmers’ household
Source: PwC analysis and Baseline Survey Report
3.1.4. Religion and Social Group
On analyzing the religion wise distribution of the treatment (project) sample, it was that the farmers belonging to Hindu religion formed 1411 (96.5%) of the sample while the remaining 53 (3.5%) belonged to Muslim religion and other religions. None belonged to the Christian community.
With regard to the religion wise distribution of the control (non project) sample, it was observed that 711 (97%) belonged to the Hindu community while the remaining 24 (3%) belonged to the Muslim and other communities. None belonged to the Christian community
Table below depicts the religion wise distribution of the respondents across baseline, treatment (project) and control (non project) sample.
7.6 8.2
23.6 19.3
59.5 64.5
9.3 8
Baseline Treatment (Project) Sample
Percentage of family members in each age group amongst Baseline and Treatment (project) Sample
8.2 7.7
19.3 18.5
64.5 65.4
8 8.4
Treatment (Project) Sample Control (Non Project) Sample
Percentage of family members in each age group amongst Treatment (project) Sample and Control
(NonProject)
Above 60 years
18 to 60 years
6 to 18 years
O to 6 years
Final
Improving Small Farmers' Access to Markets in Maharashtra December 27, 2018 PwC 24
Table: Religion of the respondents
Sr. No. Religion Baseline
Treatment (Project) Sample
Control (Non Project) Sample
No. % No. % No. %
1 Hindu 1369 97.8 1411 96.5 711 97
2 Muslim 16 1.1 4 0.3 10 1
3 Christian 8 0.6 0 0 0 0
4 Others 7 0.5 47 3.2 14 2
Total 1400 100 1462 100 735 100 Source: PwC analysis and Baseline Survey Report
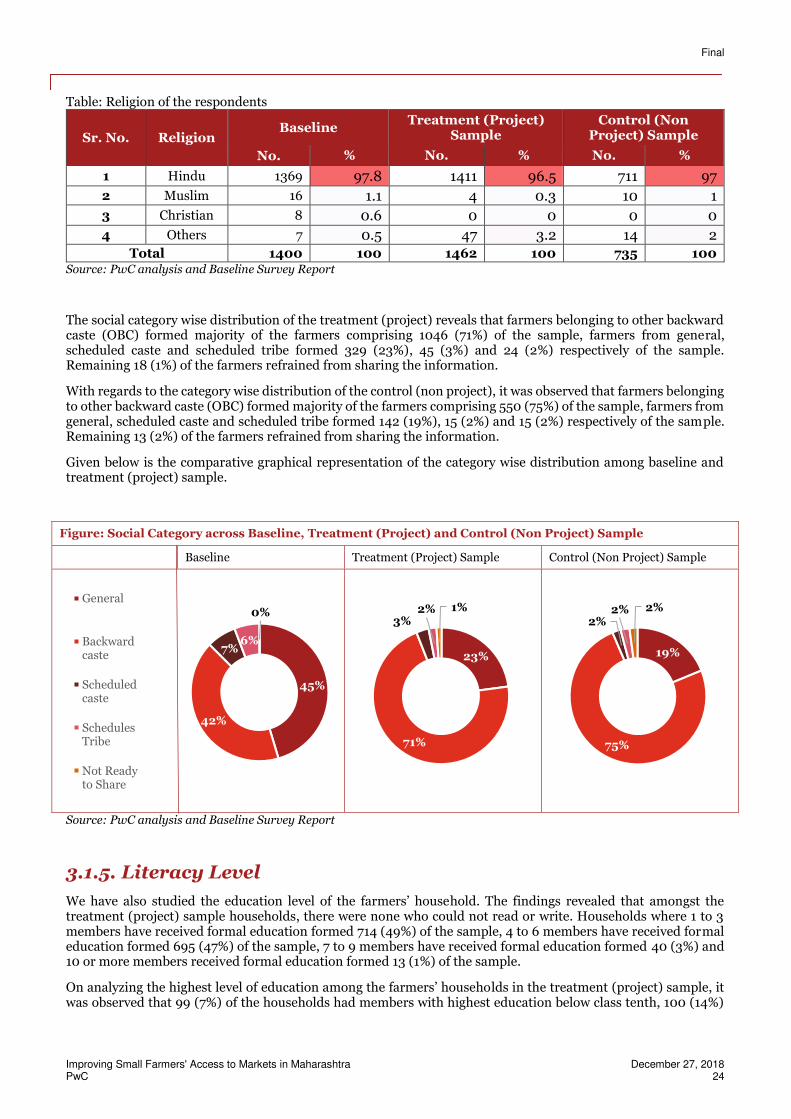
The social category wise distribution of the treatment (project) reveals that farmers belonging to other backward caste (OBC) formed majority of the farmers comprising 1046 (71%) of the sample, farmers from general, scheduled caste and scheduled tribe formed 329 (23%), 45 (3%) and 24 (2%) respectively of the sample. Remaining 18 (1%) of the farmers refrained from sharing the information.
With regards to the category wise distribution of the control (non project), it was observed that farmers belonging to other backward caste (OBC) formed majority of the farmers comprising 550 (75%) of the sample, farmers from general, scheduled caste and scheduled tribe formed 142 (19%), 15 (2%) and 15 (2%) respectively of the sample. Remaining 13 (2%) of the farmers refrained from sharing the information.
Given below is the comparative graphical representation of the category wise distribution among baseline and treatment (project) sample.
Figure: Social Category across Baseline, Treatment (Project) and Control (Non Project) Sample
Baseline Treatment (Project) Sample Control (Non Project) Sample
Source: PwC analysis and Baseline Survey Report
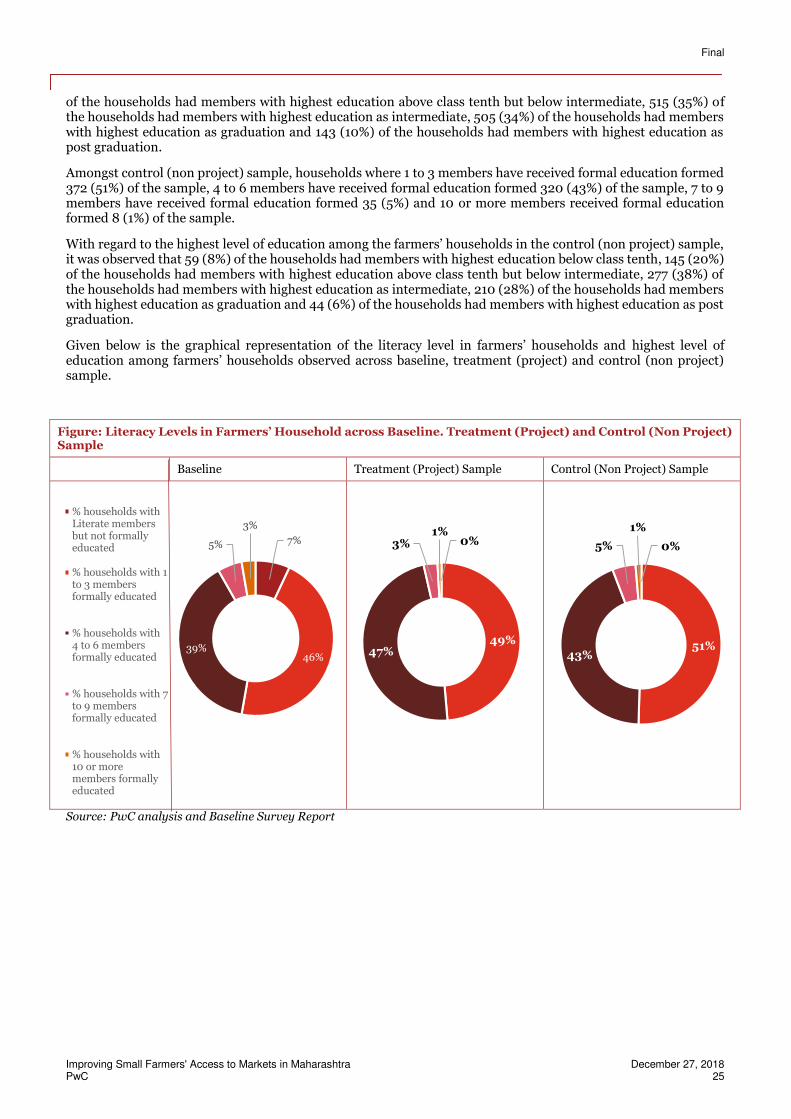
3.1.5. Literacy Level
We have also studied the education level of the farmers’ household. The findings revealed that amongst the treatment (project) sample households, there were none who could not read or write. Households where 1 to 3 members have received formal education formed 714 (49%) of the sample, 4 to 6 members have received formal education formed 695 (47%) of the sample, 7 to 9 members have received formal education formed 40 (3%) and 10 or more members received formal education formed 13 (1%) of the sample.
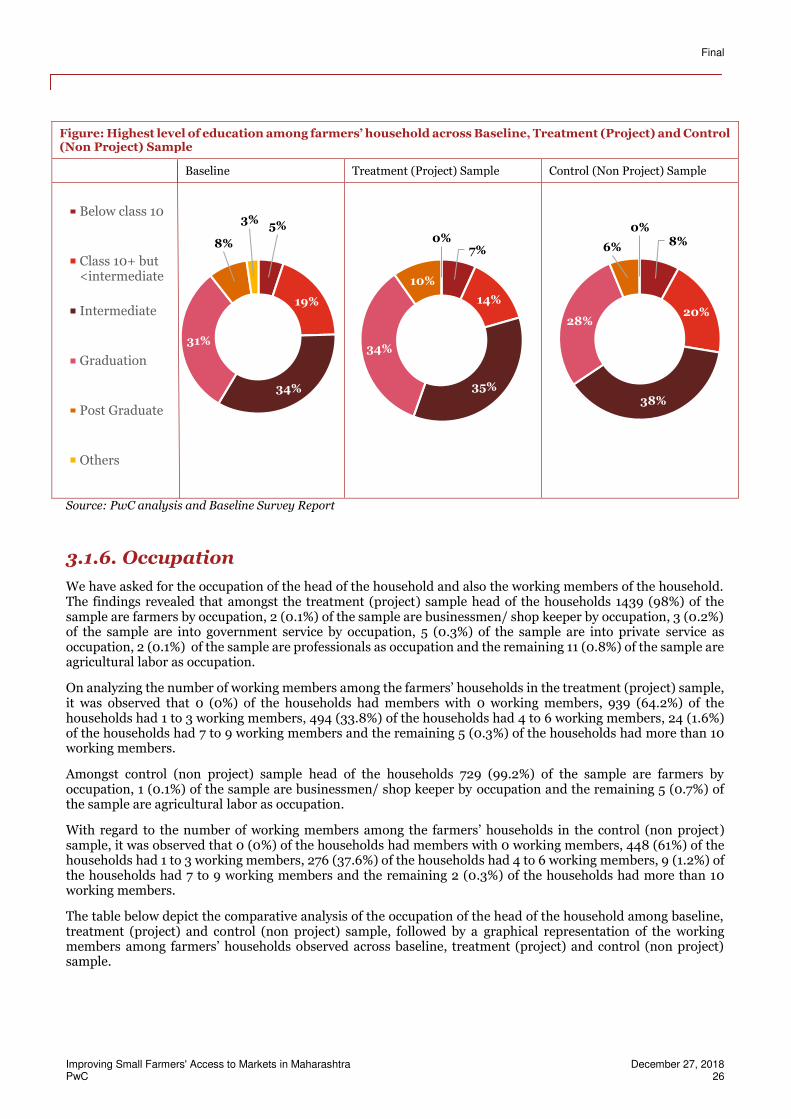
On analyzing the highest level of education among the farmers’ households in the treatment (project) sample, it was observed that 99 (7%) of the households had members with highest education below class tenth, 100 (14%)
45%
42%
7%6%
0%General
Backwardcaste
Scheduledcaste
SchedulesTribe
Not Readyto Share
23%
71%
3%2% 1%
19%
75%
2%2% 2%
Final
Improving Small Farmers' Access to Markets in Maharashtra December 27, 2018 PwC 25
of the households had members with highest education above class tenth but below intermediate, 515 (35%) of the households had members with highest education as intermediate, 505 (34%) of the households had members with highest education as graduation and 143 (10%) of the households had members with highest education as post graduation.
Amongst control (non project) sample, households where 1 to 3 members have received formal education formed 372 (51%) of the sample, 4 to 6 members have received formal education formed 320 (43%) of the sample, 7 to 9 members have received formal education formed 35 (5%) and 10 or more members received formal education formed 8 (1%) of the sample.
With regard to the highest level of education among the farmers’ households in the control (non project) sample, it was observed that 59 (8%) of the households had members with highest education below class tenth, 145 (20%) of the households had members with highest education above class tenth but below intermediate, 277 (38%) of the households had members with highest education as intermediate, 210 (28%) of the households had members with highest education as graduation and 44 (6%) of the households had members with highest education as post graduation.
Given below is the graphical representation of the literacy level in farmers’ households and highest level of education among farmers’ households observed across baseline, treatment (project) and control (non project) sample.
Figure: Literacy Levels in Farmers’ Household across Baseline. Treatment (Project) and Control (Non Project) Sample
Baseline Treatment (Project) Sample Control (Non Project) Sample
Source: PwC analysis and Baseline Survey Report
7%
46%39%
5%
3%
% households withLiterate membersbut not formallyeducated
% households with 1to 3 membersformally educated
% households with4 to 6 membersformally educated
% households with 7to 9 membersformally educated
% households with10 or moremembers formallyeducated
0%
49%47%
3%1%
0%
51%43%
5%
1%
Final
Improving Small Farmers' Access to Markets in Maharashtra December 27, 2018 PwC 26
Figure: Highest level of education among farmers’ household across Baseline, Treatment (Project) and Control (Non Project) Sample
Baseline Treatment (Project) Sample Control (Non Project) Sample
Source: PwC analysis and Baseline Survey Report
3.1.6. Occupation
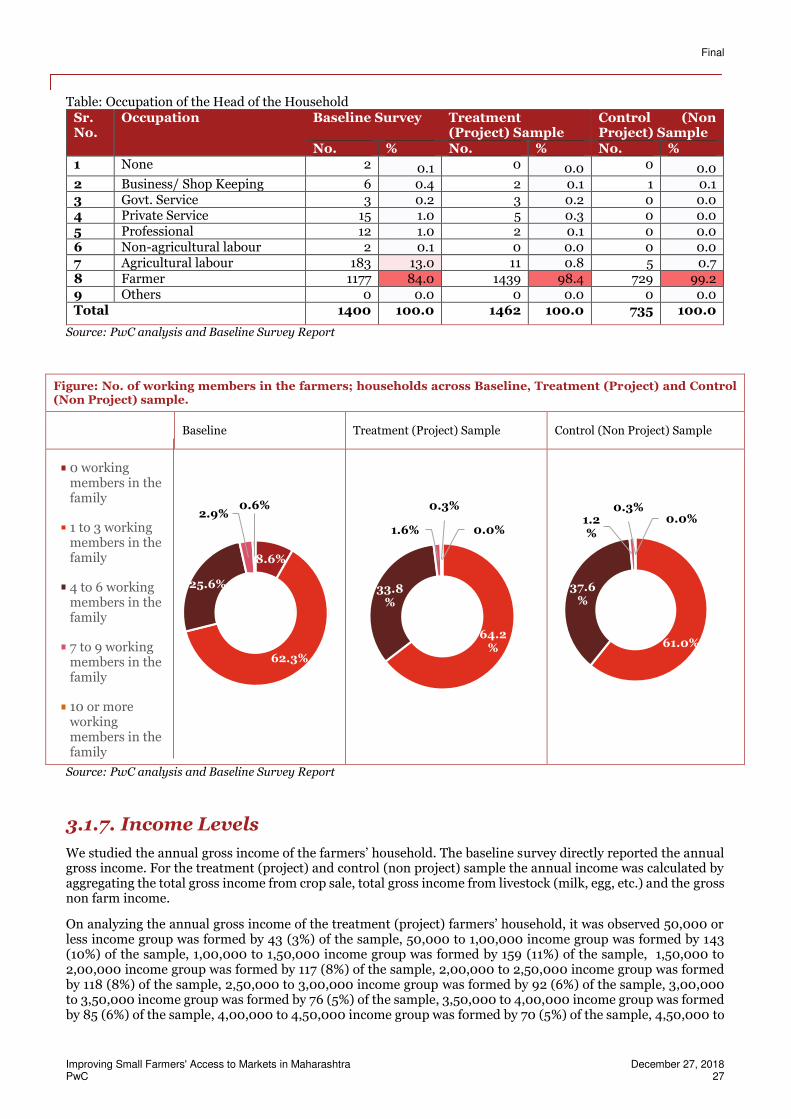
We have asked for the occupation of the head of the household and also the working members of the household. The findings revealed that amongst the treatment (project) sample head of the households 1439 (98%) of the sample are farmers by occupation, 2 (0.1%) of the sample are businessmen/ shop keeper by occupation, 3 (0.2%) of the sample are into government service by occupation, 5 (0.3%) of the sample are into private service as occupation, 2 (0.1%) of the sample are professionals as occupation and the remaining 11 (0.8%) of the sample are agricultural labor as occupation.
On analyzing the number of working members among the farmers’ households in the treatment (project) sample, it was observed that 0 (0%) of the households had members with 0 working members, 939 (64.2%) of the households had 1 to 3 working members, 494 (33.8%) of the households had 4 to 6 working members, 24 (1.6%) of the households had 7 to 9 working members and the remaining 5 (0.3%) of the households had more than 10 working members.
Amongst control (non project) sample head of the households 729 (99.2%) of the sample are farmers by occupation, 1 (0.1%) of the sample are businessmen/ shop keeper by occupation and the remaining 5 (0.7%) of the sample are agricultural labor as occupation.
With regard to the number of working members among the farmers’ households in the control (non project) sample, it was observed that 0 (0%) of the households had members with 0 working members, 448 (61%) of the households had 1 to 3 working members, 276 (37.6%) of the households had 4 to 6 working members, 9 (1.2%) of the households had 7 to 9 working members and the remaining 2 (0.3%) of the households had more than 10 working members.
The table below depict the comparative analysis of the occupation of the head of the household among baseline, treatment (project) and control (non project) sample, followed by a graphical representation of the working members among farmers’ households observed across baseline, treatment (project) and control (non project) sample.
5%
19%
34%
31%
8%
3%Below class 10
Class 10+ but<intermediate
Intermediate
Graduation
Post Graduate
Others
7%
14%
35%
34%
10%
0% 8%
20%
38%
28%
6%
0%
Final
Improving Small Farmers' Access to Markets in Maharashtra December 27, 2018 PwC 27
Table: Occupation of the Head of the Household Sr. No.
Occupation Baseline Survey Treatment (Project) Sample
Control (Non Project) Sample
No. % No. % No. % 1 None 2 0.1 0 0.0 0 0.0 2 Business/ Shop Keeping 6 0.4 2 0.1 1 0.1 3 Govt. Service 3 0.2 3 0.2 0 0.0 4 Private Service 15 1.0 5 0.3 0 0.0 5 Professional 12 1.0 2 0.1 0 0.0 6 Non-agricultural labour 2 0.1 0 0.0 0 0.0 7 Agricultural labour 183 13.0 11 0.8 5 0.7 8 Farmer 1177 84.0 1439 98.4 729 99.2 9 Others 0 0.0 0 0.0 0 0.0 Total 1400 100.0 1462 100.0 735 100.0
Source: PwC analysis and Baseline Survey Report
Figure: No. of working members in the farmers; households across Baseline, Treatment (Project) and Control (Non Project) sample.
Baseline Treatment (Project) Sample Control (Non Project) Sample
Source: PwC analysis and Baseline Survey Report
3.1.7. Income Levels
We studied the annual gross income of the farmers’ household. The baseline survey directly reported the annual gross income. For the treatment (project) and control (non project) sample the annual income was calculated by aggregating the total gross income from crop sale, total gross income from livestock (milk, egg, etc.) and the gross non farm income.
On analyzing the annual gross income of the treatment (project) farmers’ household, it was observed 50,000 or less income group was formed by 43 (3%) of the sample, 50,000 to 1,00,000 income group was formed by 143 (10%) of the sample, 1,00,000 to 1,50,000 income group was formed by 159 (11%) of the sample, 1,50,000 to 2,00,000 income group was formed by 117 (8%) of the sample, 2,00,000 to 2,50,000 income group was formed by 118 (8%) of the sample, 2,50,000 to 3,00,000 income group was formed by 92 (6%) of the sample, 3,00,000 to 3,50,000 income group was formed by 76 (5%) of the sample, 3,50,000 to 4,00,000 income group was formed by 85 (6%) of the sample, 4,00,000 to 4,50,000 income group was formed by 70 (5%) of the sample, 4,50,000 to
8.6%
62.3%
25.6%
2.9%0.6%
0 workingmembers in thefamily
1 to 3 workingmembers in thefamily
4 to 6 workingmembers in thefamily
7 to 9 workingmembers in thefamily
10 or moreworkingmembers in thefamily
0.0%
64.2%
33.8%
1.6%
0.3%0.0%
61.0%
37.6%
1.2%
0.3%
Final
Improving Small Farmers' Access to Markets in Maharashtra December 27, 2018 PwC 28
5,00,000 income group was formed by 53 (4%) of the sample, 5,00,000 to 6,00,000 income group was formed by 99 (7%) of the sample, 6,00,000 to 7,00,000 income group was formed by 83 (6%) of the sample, 7,00,000 to 8,00,000 income group was formed by 65 (4%) of the sample, 8,00,000 to 9,00,000 income group was formed by 43 (3%) of the sample, 9,00,000 to 10,00,000 income group was formed by 25 (2%) of the sample, 10,00,000 to 20,00,000 income group was formed by 145 (10%) of the sample and 20,00,000 and above income group was formed by 46 (3%) of the sample.
With regard to the annual gross income of the control (non project) farmers’ household, it was observed 50,000 or less income group was formed by 44 (6%) of the sample, 50,000 to 1,00,000 income group was formed by 84 (11%) of the sample, 1,00,000 to 1,50,000 income group was formed by 93 (13%) of the sample, 1,50,000 to 2,00,000 income group was formed by 62 (8%) of the sample, 2,00,000 to 2,50,000 income group was formed by 51 (7%) of the sample, 2,50,000 to 3,00,000 income group was formed by 64 (9%) of the sample, 3,00,000 to 3,50,000 income group was formed by 46 (7%) of the sample, 3,50,000 to 4,00,000 income group was formed by 39 (5%) of the sample, 4,00,000 to 4,50,000 income group was formed by 36 (5%) of the sample, 4,50,000 to 5,00,000 income group was formed by 26 (4%) of the sample, 5,00,000 to 6,00,000 income group was formed by 57 (8%) of the sample, 6,00,000 to 7,00,000 income group was formed by 35 (5%) of the sample, 7,00,000 to 8,00,000 income group was formed by 24 (3%) of the sample, 8,00,000 to 9,00,000 income group was formed by 13 (2%) of the sample, 9,00,000 to 10,00,000 income group was formed by 14 (2%) of the sample, 10,00,000 to 20,00,000 income group was formed by 37 (5%) of the sample and 20,00,000 and above income group was formed by 9 (1%) of the sample.
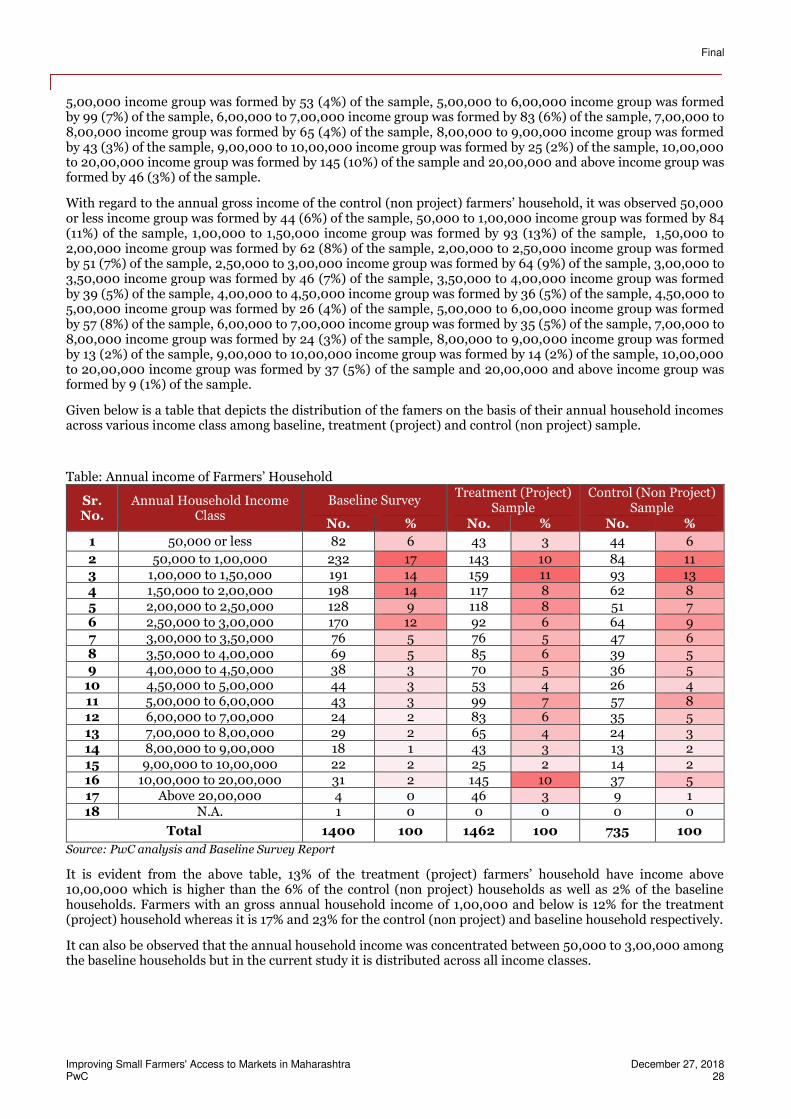
Given below is a table that depicts the distribution of the famers on the basis of their annual household incomes across various income class among baseline, treatment (project) and control (non project) sample.
Table: Annual income of Farmers’ Household
Sr. No.
Annual Household Income Class
Baseline Survey Treatment (Project)
Sample Control (Non Project)
Sample No. % No. % No. %
1 50,000 or less 82 6 43 3 44 6
2 50,000 to 1,00,000 232 17 143 10 84 11 3 1,00,000 to 1,50,000 191 14 159 11 93 13 4 1,50,000 to 2,00,000 198 14 117 8 62 8 5 2,00,000 to 2,50,000 128 9 118 8 51 7 6 2,50,000 to 3,00,000 170 12 92 6 64 9 7 3,00,000 to 3,50,000 76 5 76 5 47 6 8 3,50,000 to 4,00,000 69 5 85 6 39 5 9 4,00,000 to 4,50,000 38 3 70 5 36 5
10 4,50,000 to 5,00,000 44 3 53 4 26 4 11 5,00,000 to 6,00,000 43 3 99 7 57 8 12 6,00,000 to 7,00,000 24 2 83 6 35 5 13 7,00,000 to 8,00,000 29 2 65 4 24 3 14 8,00,000 to 9,00,000 18 1 43 3 13 2 15 9,00,000 to 10,00,000 22 2 25 2 14 2 16 10,00,000 to 20,00,000 31 2 145 10 37 5 17 Above 20,00,000 4 0 46 3 9 1 18 N.A. 1 0 0 0 0 0
Total 1400 100 1462 100 735 100
Source: PwC analysis and Baseline Survey Report
It is evident from the above table, 13% of the treatment (project) farmers’ household have income above 10,00,000 which is higher than the 6% of the control (non project) households as well as 2% of the baseline households. Farmers with an gross annual household income of 1,00,000 and below is 12% for the treatment (project) household whereas it is 17% and 23% for the control (non project) and baseline household respectively.
It can also be observed that the annual household income was concentrated between 50,000 to 3,00,000 among the baseline households but in the current study it is distributed across all income classes.
Final
Improving Small Farmers' Access to Markets in Maharashtra December 27, 2018 PwC 29
3.1.8. Type & Extent of Landholding
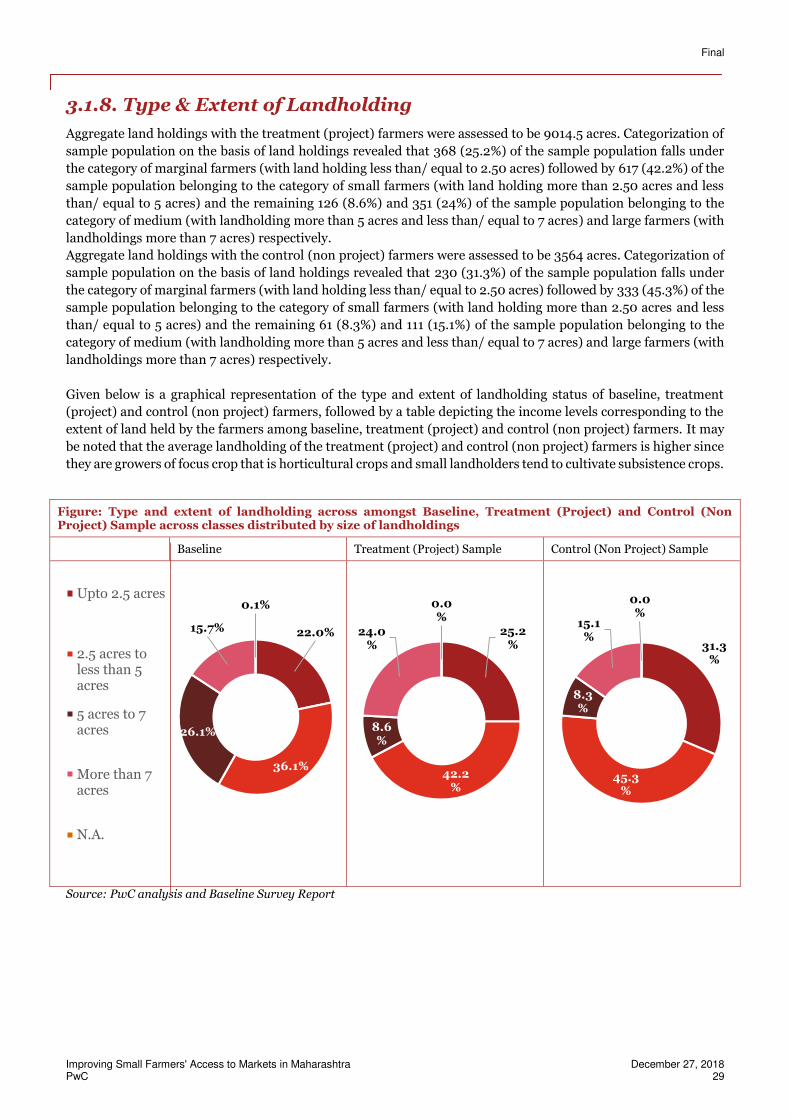
Aggregate land holdings with the treatment (project) farmers were assessed to be 9014.5 acres. Categorization of
sample population on the basis of land holdings revealed that 368 (25.2%) of the sample population falls under
the category of marginal farmers (with land holding less than/ equal to 2.50 acres) followed by 617 (42.2%) of the
sample population belonging to the category of small farmers (with land holding more than 2.50 acres and less
than/ equal to 5 acres) and the remaining 126 (8.6%) and 351 (24%) of the sample population belonging to the
category of medium (with landholding more than 5 acres and less than/ equal to 7 acres) and large farmers (with
landholdings more than 7 acres) respectively.
Aggregate land holdings with the control (non project) farmers were assessed to be 3564 acres. Categorization of
sample population on the basis of land holdings revealed that 230 (31.3%) of the sample population falls under
the category of marginal farmers (with land holding less than/ equal to 2.50 acres) followed by 333 (45.3%) of the
sample population belonging to the category of small farmers (with land holding more than 2.50 acres and less
than/ equal to 5 acres) and the remaining 61 (8.3%) and 111 (15.1%) of the sample population belonging to the
category of medium (with landholding more than 5 acres and less than/ equal to 7 acres) and large farmers (with
landholdings more than 7 acres) respectively.
Given below is a graphical representation of the type and extent of landholding status of baseline, treatment
(project) and control (non project) farmers, followed by a table depicting the income levels corresponding to the
extent of land held by the farmers among baseline, treatment (project) and control (non project) farmers. It may
be noted that the average landholding of the treatment (project) and control (non project) farmers is higher since
they are growers of focus crop that is horticultural crops and small landholders tend to cultivate subsistence crops.
Figure: Type and extent of landholding across amongst Baseline, Treatment (Project) and Control (Non Project) Sample across classes distributed by size of landholdings
Baseline Treatment (Project) Sample Control (Non Project) Sample
Source: PwC analysis and Baseline Survey Report
22.0%
36.1%
26.1%
15.7%
0.1%Upto 2.5 acres
2.5 acres toless than 5acres
5 acres to 7acres
More than 7acres
N.A.
25.2%
42.2%
8.6%
24.0%
0.0%
31.3%
45.3%
8.3%
15.1%
0.0%
Final
Improving Small Farmers' Access to Markets in Maharashtra December 27, 2018 PwC 30
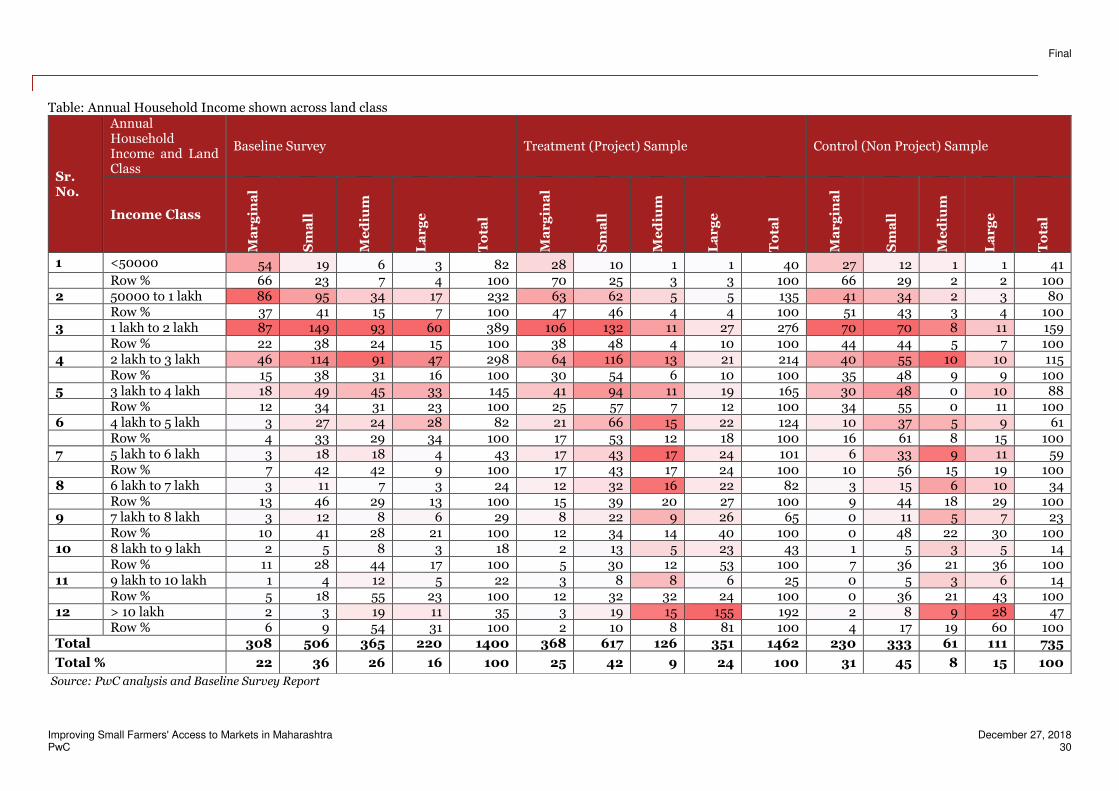
Table: Annual Household Income shown across land class
Source: PwC analysis and Baseline Survey Report
Sr. No.
Annual Household Income and Land Class
Baseline Survey Treatment (Project) Sample Control (Non Project) Sample
Income Class
Ma
rg
ina
l
Sm
all
Me
diu
m
La
rg
e
To
tal
Ma
rg
ina
l
Sm
all
Me
diu
m
La
rg
e
To
tal
Ma
rg
ina
l
Sm
all
Me
diu
m
La
rg
e
To
tal
1 <50000 54 19 6 3 82 28 10 1 1 40 27 12 1 1 41 Row % 66 23 7 4 100 70 25 3 3 100 66 29 2 2 100 2 50000 to 1 lakh 86 95 34 17 232 63 62 5 5 135 41 34 2 3 80 Row % 37 41 15 7 100 47 46 4 4 100 51 43 3 4 100 3 1 lakh to 2 lakh 87 149 93 60 389 106 132 11 27 276 70 70 8 11 159 Row % 22 38 24 15 100 38 48 4 10 100 44 44 5 7 100 4 2 lakh to 3 lakh 46 114 91 47 298 64 116 13 21 214 40 55 10 10 115 Row % 15 38 31 16 100 30 54 6 10 100 35 48 9 9 100 5 3 lakh to 4 lakh 18 49 45 33 145 41 94 11 19 165 30 48 0 10 88 Row % 12 34 31 23 100 25 57 7 12 100 34 55 0 11 100 6 4 lakh to 5 lakh 3 27 24 28 82 21 66 15 22 124 10 37 5 9 61 Row % 4 33 29 34 100 17 53 12 18 100 16 61 8 15 100 7 5 lakh to 6 lakh 3 18 18 4 43 17 43 17 24 101 6 33 9 11 59 Row % 7 42 42 9 100 17 43 17 24 100 10 56 15 19 100 8 6 lakh to 7 lakh 3 11 7 3 24 12 32 16 22 82 3 15 6 10 34 Row % 13 46 29 13 100 15 39 20 27 100 9 44 18 29 100 9 7 lakh to 8 lakh 3 12 8 6 29 8 22 9 26 65 0 11 5 7 23 Row % 10 41 28 21 100 12 34 14 40 100 0 48 22 30 100 10 8 lakh to 9 lakh 2 5 8 3 18 2 13 5 23 43 1 5 3 5 14 Row % 11 28 44 17 100 5 30 12 53 100 7 36 21 36 100 11 9 lakh to 10 lakh 1 4 12 5 22 3 8 8 6 25 0 5 3 6 14 Row % 5 18 55 23 100 12 32 32 24 100 0 36 21 43 100 12 > 10 lakh 2 3 19 11 35 3 19 15 155 192 2 8 9 28 47 Row % 6 9 54 31 100 2 10 8 81 100 4 17 19 60 100 Total 308 506 365 220 1400 368 617 126 351 1462 230 333 61 111 735
Total % 22 36 26 16 100 25 42 9 24 100 31 45 8 15 100
Final
Improving Small Farmers' Access to Markets in Maharashtra December 27, 2018 PwC 31
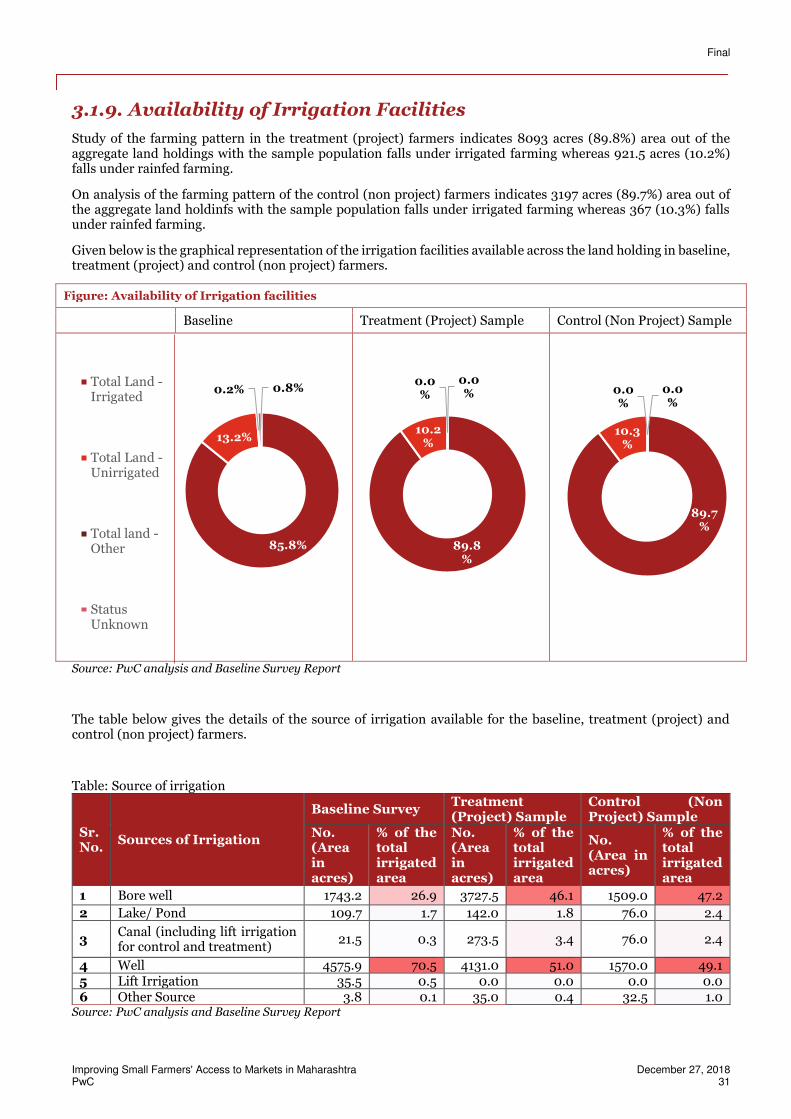
3.1.9. Availability of Irrigation Facilities
Study of the farming pattern in the treatment (project) farmers indicates 8093 acres (89.8%) area out of the aggregate land holdings with the sample population falls under irrigated farming whereas 921.5 acres (10.2%) falls under rainfed farming.
On analysis of the farming pattern of the control (non project) farmers indicates 3197 acres (89.7%) area out of the aggregate land holdinfs with the sample population falls under irrigated farming whereas 367 (10.3%) falls under rainfed farming.
Given below is the graphical representation of the irrigation facilities available across the land holding in baseline, treatment (project) and control (non project) farmers.
Figure: Availability of Irrigation facilities
Baseline Treatment (Project) Sample Control (Non Project) Sample
Source: PwC analysis and Baseline Survey Report
The table below gives the details of the source of irrigation available for the baseline, treatment (project) and control (non project) farmers.
Table: Source of irrigation
Sr. No.
Sources of Irrigation
Baseline Survey Treatment (Project) Sample
Control (Non Project) Sample
No. (Area in acres)
% of the total irrigated area
No. (Area in acres)
% of the total irrigated area
No. (Area in acres)
% of the total irrigated area
1 Bore well 1743.2 26.9 3727.5 46.1 1509.0 47.2
2 Lake/ Pond 109.7 1.7 142.0 1.8 76.0 2.4
3 Canal (including lift irrigation for control and treatment)
21.5 0.3 273.5 3.4 76.0 2.4
4 Well 4575.9 70.5 4131.0 51.0 1570.0 49.1 5 Lift Irrigation 35.5 0.5 0.0 0.0 0.0 0.0 6 Other Source 3.8 0.1 35.0 0.4 32.5 1.0
Source: PwC analysis and Baseline Survey Report
85.8%
13.2%
0.2% 0.8%Total Land -Irrigated
Total Land -Unirrigated
Total land -Other
StatusUnknown
89.8%
10.2%
0.0%
0.0%
89.7%
10.3%
0.0%
0.0%
Final
Improving Small Farmers' Access to Markets in Maharashtra December 27, 2018 PwC 32
It is evident from the table above, the major source of irrigation for treatment (project) farmers is well covering 4131 acres (51.0%) of the total irrigated area, followed by bore well covering 3727.5 acres (46.1%) of the total irrigated area and Canal, Lake/ pond and other sources covering 273.5 (3.4%), 142.0 (1.8%) and 35 acres (0.4%) of the total irrigated land.
For the control (non project) farmers, major source of irrigation is well 1570 acres (49.1%) of the total irrigated area, followed by bore well covering 1509 (47.2%) of the total irrigated area and canal, lake/ pond and other sources covering 76 acres (2.4%), 76 acres (2.4%) and 32.5 acres (1,0%) of the total irrigated area.
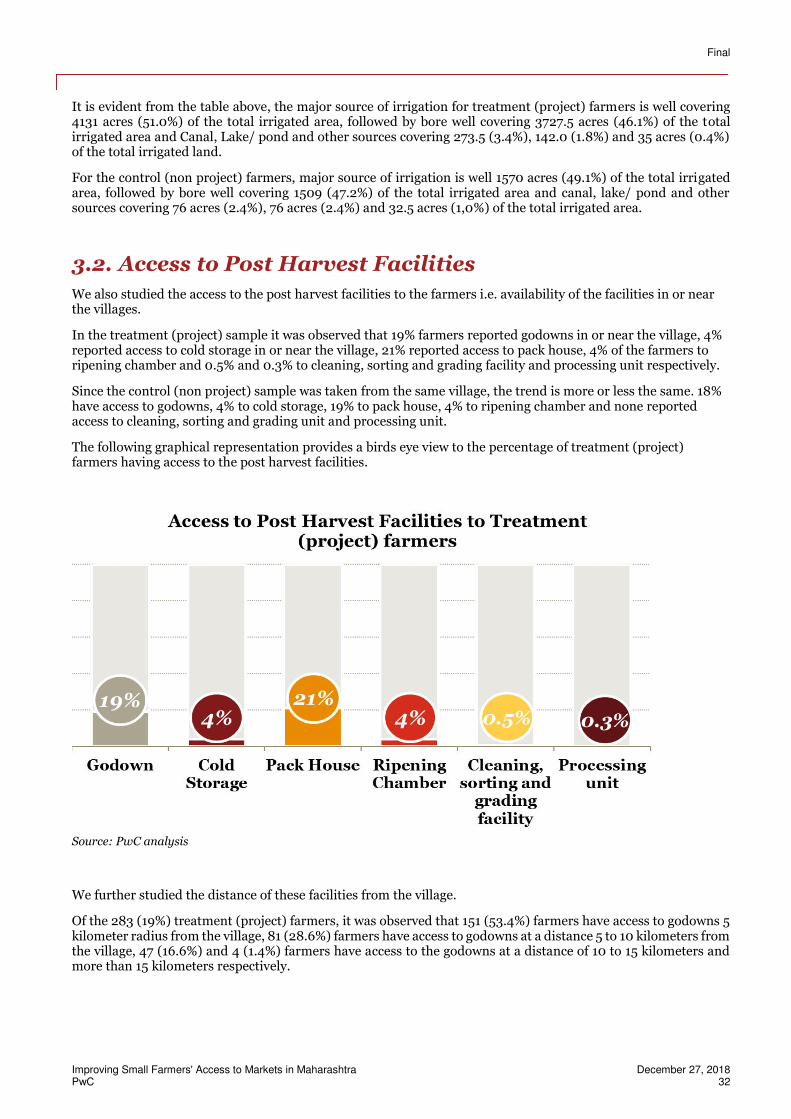
3.2. Access to Post Harvest Facilities
We also studied the access to the post harvest facilities to the farmers i.e. availability of the facilities in or near the villages.
In the treatment (project) sample it was observed that 19% farmers reported godowns in or near the village, 4% reported access to cold storage in or near the village, 21% reported access to pack house, 4% of the farmers to ripening chamber and 0.5% and 0.3% to cleaning, sorting and grading facility and processing unit respectively.
Since the control (non project) sample was taken from the same village, the trend is more or less the same. 18% have access to godowns, 4% to cold storage, 19% to pack house, 4% to ripening chamber and none reported access to cleaning, sorting and grading unit and processing unit.
The following graphical representation provides a birds eye view to the percentage of treatment (project) farmers having access to the post harvest facilities.
Source: PwC analysis
We further studied the distance of these facilities from the village.
Of the 283 (19%) treatment (project) farmers, it was observed that 151 (53.4%) farmers have access to godowns 5 kilometer radius from the village, 81 (28.6%) farmers have access to godowns at a distance 5 to 10 kilometers from the village, 47 (16.6%) and 4 (1.4%) farmers have access to the godowns at a distance of 10 to 15 kilometers and more than 15 kilometers respectively.
Final
Improving Small Farmers' Access to Markets in Maharashtra December 27, 2018 PwC 33
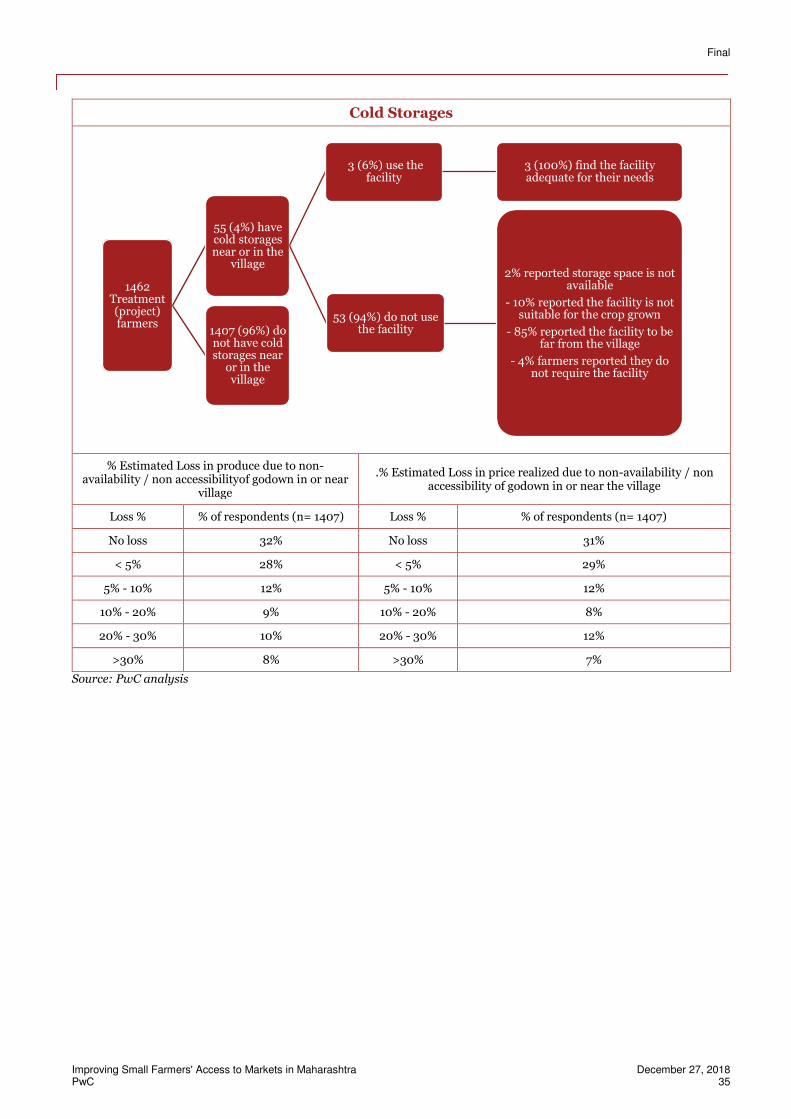
Similarly, of the 55 (4%) treatment (project) farmers, it was observed that 54 (98.2%) farmers have access to cold storages 5 kilometer radius from the village and the remaining 1 (1.2%) farmers have access to cold storages at a distance 5 to 10 kilometers from the village.
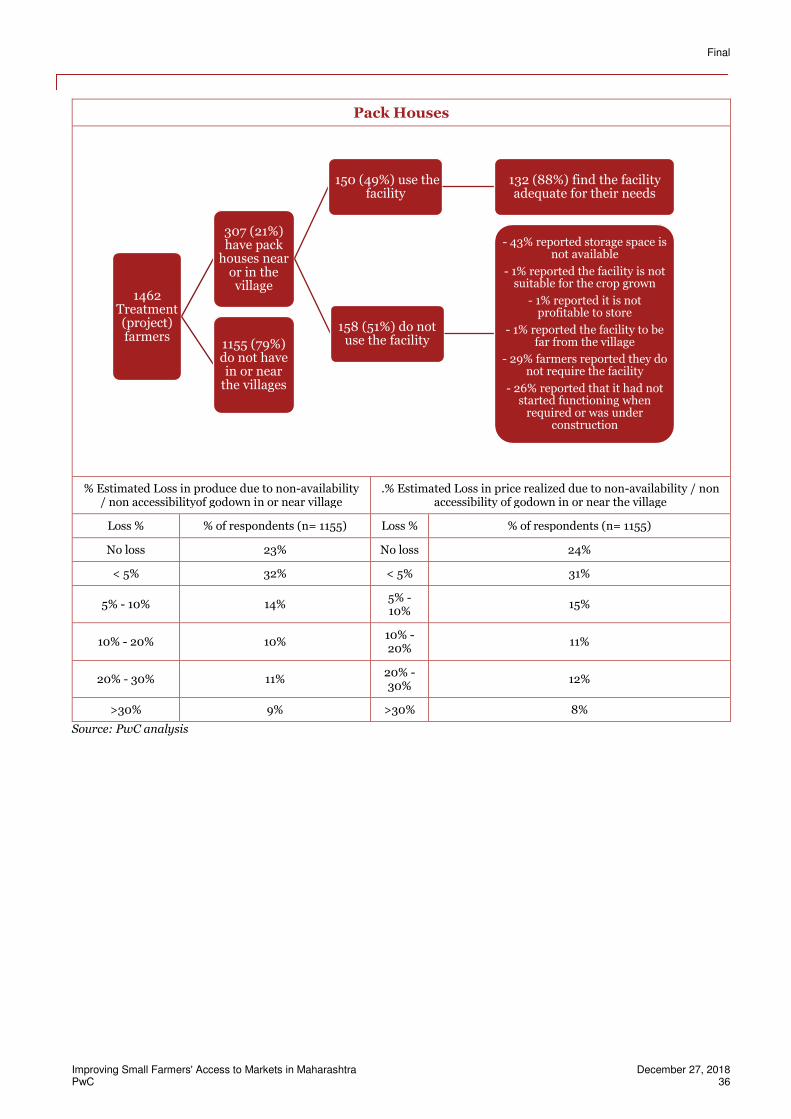
For the pack houses, out of the 307 (21%) treatment (project) farmers, it was observed that 291 (94.8%) farmers have access to pack houses 5 kilometer radius from the village, 9 (2.9%) farmers have access to pack houses at a distance 5 to 10 kilometers from the village, 4 (1.3%) and 3 (1.0%) farmers have access to the pack houses at a distance of 10 to 15 kilometers and more than 15 kilometers respectively.
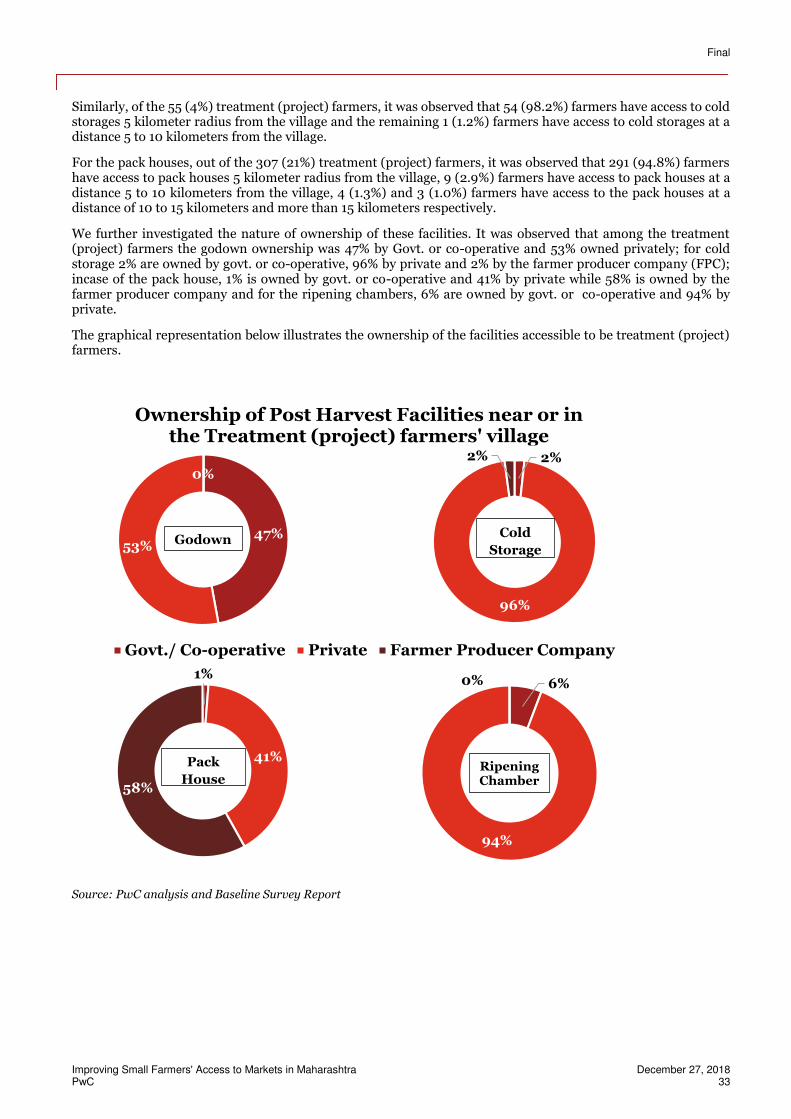
We further investigated the nature of ownership of these facilities. It was observed that among the treatment (project) farmers the godown ownership was 47% by Govt. or co-operative and 53% owned privately; for cold storage 2% are owned by govt. or co-operative, 96% by private and 2% by the farmer producer company (FPC); incase of the pack house, 1% is owned by govt. or co-operative and 41% by private while 58% is owned by the farmer producer company and for the ripening chambers, 6% are owned by govt. or co-operative and 94% by private.
The graphical representation below illustrates the ownership of the facilities accessible to be treatment (project) farmers.
Source: PwC analysis and Baseline Survey Report
47%53%
0%
Ownership of Post Harvest Facilities near or in the Treatment (project) farmers' village
1%
41%
58%
Govt./ Co-operative Private Farmer Producer Company
Pack
House
2%
96%
2%
Cold
Storage
6%
94%
0%
Godown
Ripening Chamber
Final
Improving Small Farmers' Access to Markets in Maharashtra December 27, 2018 PwC 34
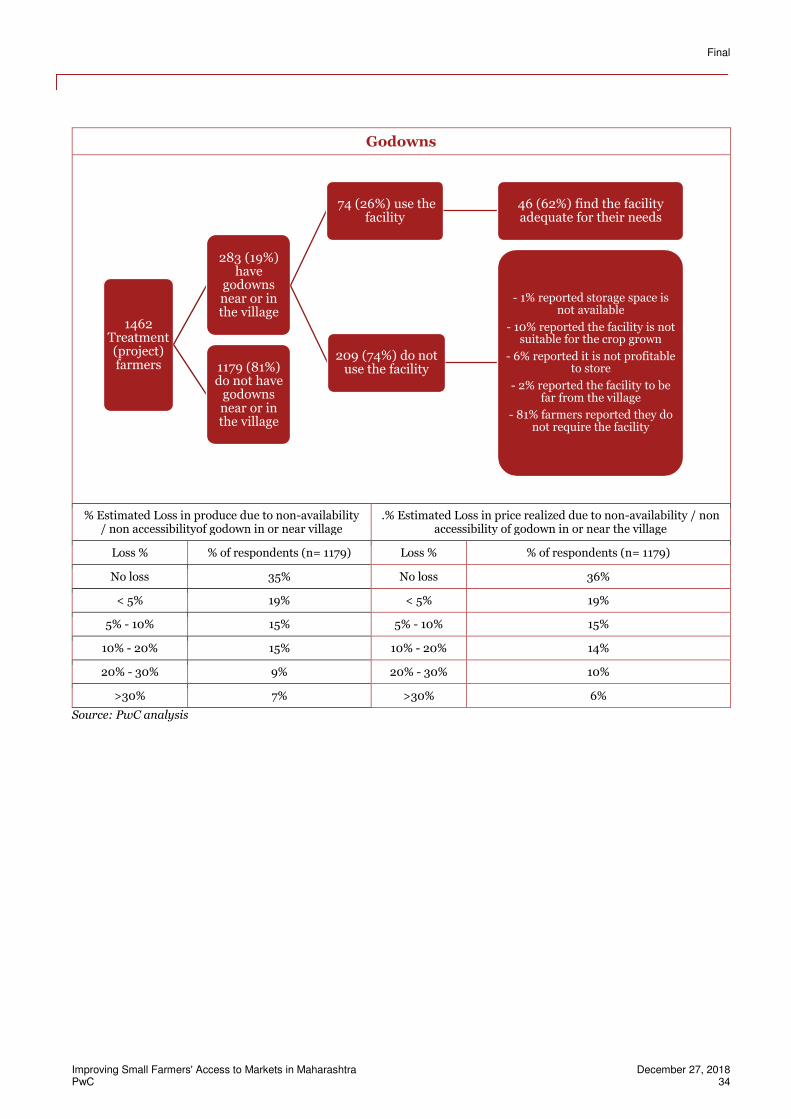
Godowns
% Estimated Loss in produce due to non-availability / non accessibilityof godown in or near village
.% Estimated Loss in price realized due to non-availability / non accessibility of godown in or near the village
Loss % % of respondents (n= 1179) Loss % % of respondents (n= 1179)
No loss 35% No loss 36%
< 5% 19% < 5% 19%
5% - 10% 15% 5% - 10% 15%
10% - 20% 15% 10% - 20% 14%
20% - 30% 9% 20% - 30% 10%
>30% 7% >30% 6%
Source: PwC analysis
1462 Treatment (project) farmers
283 (19%) have
godowns near or in the village
74 (26%) use the facility
46 (62%) find the facility adequate for their needs
209 (74%) do not use the facility
- 1% reported storage space is not available
- 10% reported the facility is not suitable for the crop grown
- 6% reported it is not profitable to store
- 2% reported the facility to be far from the village
- 81% farmers reported they do not require the facility
1179 (81%) do not have
godowns near or in the village
Final
Improving Small Farmers' Access to Markets in Maharashtra December 27, 2018 PwC 35
Cold Storages
% Estimated Loss in produce due to non-availability / non accessibilityof godown in or near
village
.% Estimated Loss in price realized due to non-availability / non accessibility of godown in or near the village
Loss % % of respondents (n= 1407) Loss % % of respondents (n= 1407)
No loss 32% No loss 31%
< 5% 28% < 5% 29%
5% - 10% 12% 5% - 10% 12%
10% - 20% 9% 10% - 20% 8%
20% - 30% 10% 20% - 30% 12%
>30% 8% >30% 7%
Source: PwC analysis
1462 Treatment (project) farmers
55 (4%) have cold storages near or in the
village
3 (6%) use the facility
3 (100%) find the facility adequate for their needs
53 (94%) do not use the facility
2% reported storage space is not available
- 10% reported the facility is not suitable for the crop grown
- 85% reported the facility to be far from the village
- 4% farmers reported they do not require the facility
1407 (96%) do not have cold storages near
or in the village
Final
Improving Small Farmers' Access to Markets in Maharashtra December 27, 2018 PwC 36
Pack Houses
% Estimated Loss in produce due to non-availability / non accessibilityof godown in or near village
.% Estimated Loss in price realized due to non-availability / non accessibility of godown in or near the village
Loss % % of respondents (n= 1155) Loss % % of respondents (n= 1155)
No loss 23% No loss 24%
< 5% 32% < 5% 31%
5% - 10% 14% 5% - 10%
15%
10% - 20% 10% 10% - 20%
11%
20% - 30% 11% 20% - 30%
12%
>30% 9% >30% 8%
Source: PwC analysis
1462 Treatment (project) farmers
307 (21%) have pack
houses near or in the village
150 (49%) use the facility
132 (88%) find the facility adequate for their needs
158 (51%) do not use the facility
- 43% reported storage space is not available
- 1% reported the facility is not suitable for the crop grown
- 1% reported it is not profitable to store
- 1% reported the facility to be far from the village
- 29% farmers reported they do not require the facility
- 26% reported that it had not started functioning when
required or was under construction
1155 (79%) do not have in or near
the villages
Final
Improving Small Farmers' Access to Markets in Maharashtra December 27, 2018 PwC 37
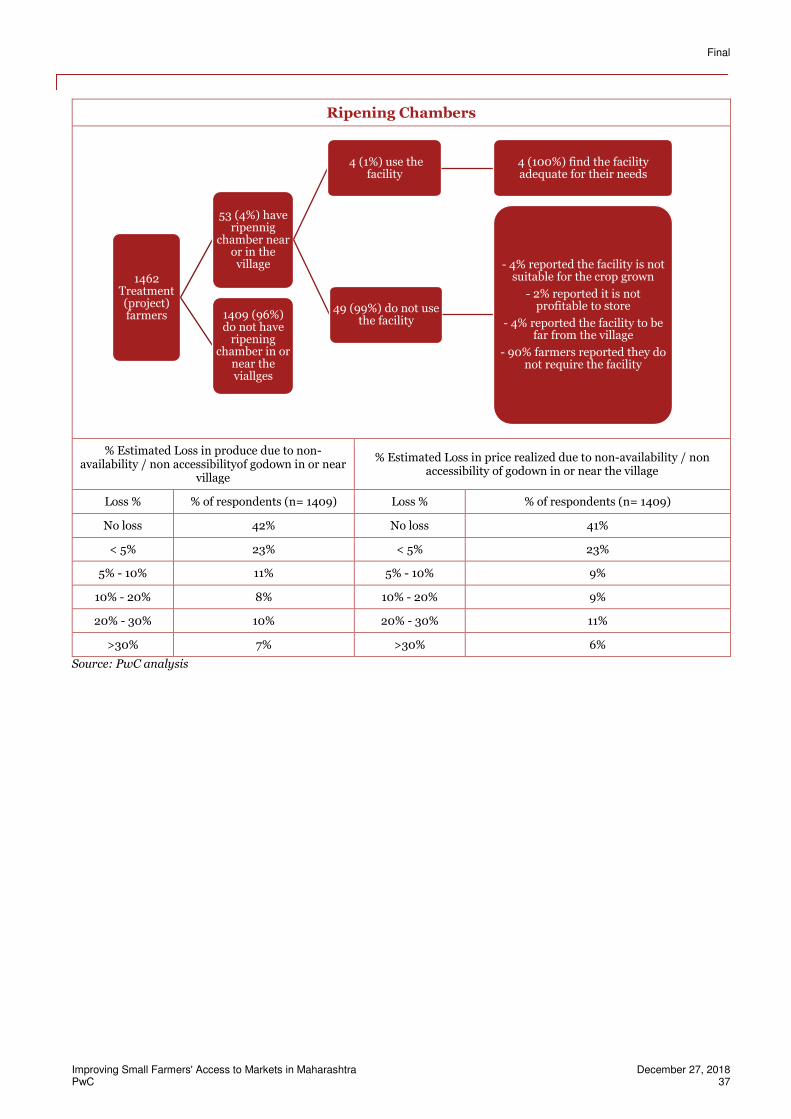
Ripening Chambers
% Estimated Loss in produce due to non-availability / non accessibilityof godown in or near
village
% Estimated Loss in price realized due to non-availability / non accessibility of godown in or near the village
Loss % % of respondents (n= 1409) Loss % % of respondents (n= 1409)
No loss 42% No loss 41%
< 5% 23% < 5% 23%
5% - 10% 11% 5% - 10% 9%
10% - 20% 8% 10% - 20% 9%
20% - 30% 10% 20% - 30% 11%
>30% 7% >30% 6%
Source: PwC analysis
1462 Treatment (project) farmers
53 (4%) have ripennig
chamber near or in the village
4 (1%) use the facility
4 (100%) find the facility adequate for their needs
49 (99%) do not use the facility
- 4% reported the facility is not suitable for the crop grown
- 2% reported it is not profitable to store
- 4% reported the facility to be far from the village
- 90% farmers reported they do not require the facility
1409 (96%) do not have
ripening chamber in or
near the viallges
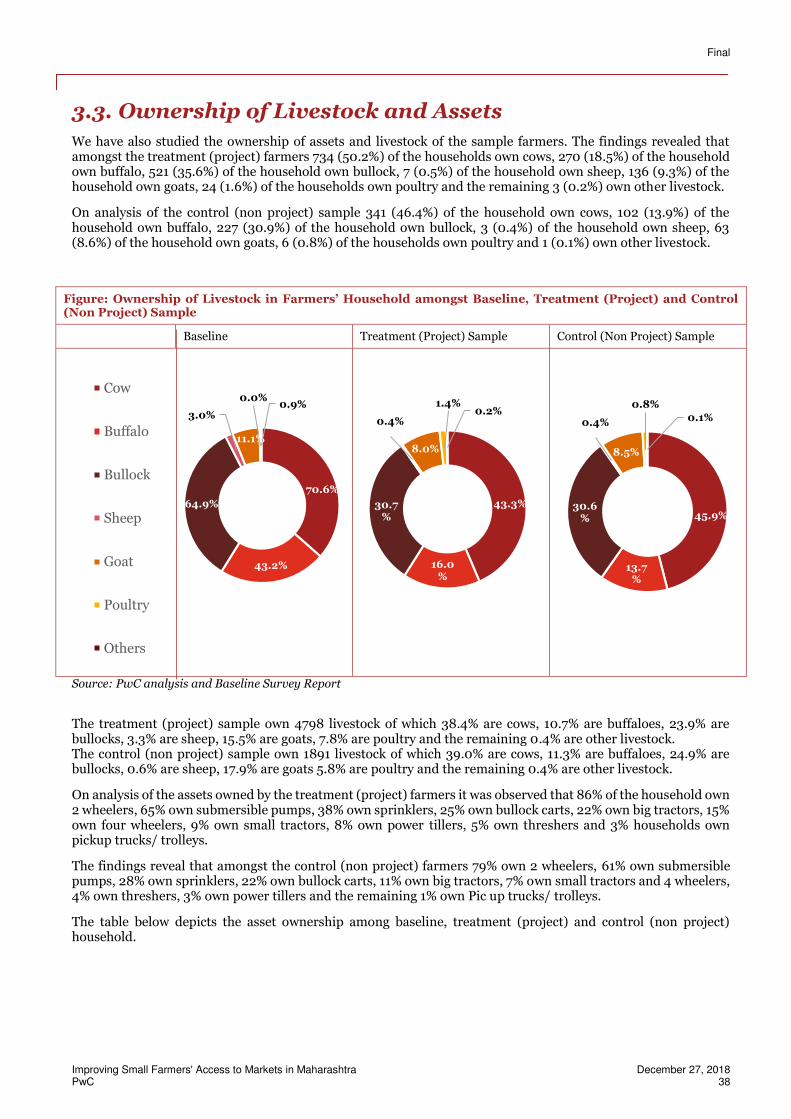
Final
Improving Small Farmers' Access to Markets in Maharashtra December 27, 2018 PwC 38
3.3. Ownership of Livestock and Assets
We have also studied the ownership of assets and livestock of the sample farmers. The findings revealed that amongst the treatment (project) farmers 734 (50.2%) of the households own cows, 270 (18.5%) of the household own buffalo, 521 (35.6%) of the household own bullock, 7 (0.5%) of the household own sheep, 136 (9.3%) of the household own goats, 24 (1.6%) of the households own poultry and the remaining 3 (0.2%) own other livestock.
On analysis of the control (non project) sample 341 (46.4%) of the household own cows, 102 (13.9%) of the household own buffalo, 227 (30.9%) of the household own bullock, 3 (0.4%) of the household own sheep, 63 (8.6%) of the household own goats, 6 (0.8%) of the households own poultry and 1 (0.1%) own other livestock.
Figure: Ownership of Livestock in Farmers’ Household amongst Baseline, Treatment (Project) and Control (Non Project) Sample
Baseline Treatment (Project) Sample Control (Non Project) Sample
Source: PwC analysis and Baseline Survey Report
The treatment (project) sample own 4798 livestock of which 38.4% are cows, 10.7% are buffaloes, 23.9% are bullocks, 3.3% are sheep, 15.5% are goats, 7.8% are poultry and the remaining 0.4% are other livestock. The control (non project) sample own 1891 livestock of which 39.0% are cows, 11.3% are buffaloes, 24.9% are bullocks, 0.6% are sheep, 17.9% are goats 5.8% are poultry and the remaining 0.4% are other livestock.
On analysis of the assets owned by the treatment (project) farmers it was observed that 86% of the household own 2 wheelers, 65% own submersible pumps, 38% own sprinklers, 25% own bullock carts, 22% own big tractors, 15% own four wheelers, 9% own small tractors, 8% own power tillers, 5% own threshers and 3% households own pickup trucks/ trolleys.
The findings reveal that amongst the control (non project) farmers 79% own 2 wheelers, 61% own submersible pumps, 28% own sprinklers, 22% own bullock carts, 11% own big tractors, 7% own small tractors and 4 wheelers, 4% own threshers, 3% own power tillers and the remaining 1% own Pic up trucks/ trolleys.
The table below depicts the asset ownership among baseline, treatment (project) and control (non project) household.
70.6%
43.2%
64.9%
3.0%
11.1%
0.0%0.9%
Cow
Buffalo
Bullock
Sheep
Goat
Poultry
Others
43.3%
16.0%
30.7%
0.4%
8.0%
1.4%0.2%
45.9%
13.7%
30.6%
0.4%
8.5%
0.8%
0.1%
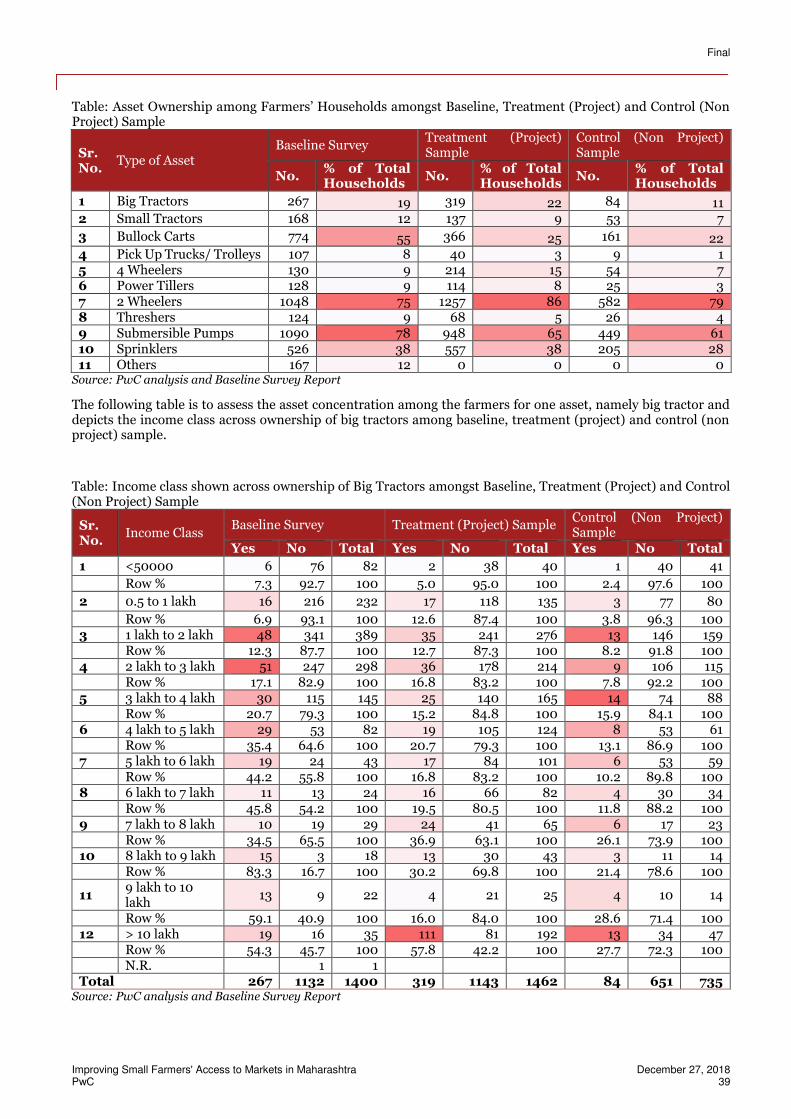
Final
Improving Small Farmers' Access to Markets in Maharashtra December 27, 2018 PwC 39
Table: Asset Ownership among Farmers’ Households amongst Baseline, Treatment (Project) and Control (Non Project) Sample
Sr. No.
Type of Asset Baseline Survey
Treatment (Project) Sample
Control (Non Project) Sample
No. % of Total Households
No. % of Total Households
No. % of Total Households
1 Big Tractors 267 19 319 22 84 11 2 Small Tractors 168 12 137 9 53 7
3 Bullock Carts 774 55 366 25 161 22 4 Pick Up Trucks/ Trolleys 107 8 40 3 9 1 5 4 Wheelers 130 9 214 15 54 7 6 Power Tillers 128 9 114 8 25 3 7 2 Wheelers 1048 75 1257 86 582 79 8 Threshers 124 9 68 5 26 4 9 Submersible Pumps 1090 78 948 65 449 61 10 Sprinklers 526 38 557 38 205 28 11 Others 167 12 0 0 0 0
Source: PwC analysis and Baseline Survey Report
The following table is to assess the asset concentration among the farmers for one asset, namely big tractor and depicts the income class across ownership of big tractors among baseline, treatment (project) and control (non project) sample.
Table: Income class shown across ownership of Big Tractors amongst Baseline, Treatment (Project) and Control (Non Project) Sample
Sr. No.
Income Class Baseline Survey Treatment (Project) Sample
Control (Non Project) Sample
Yes No Total Yes No Total Yes No Total
1 <50000 6 76 82 2 38 40 1 40 41
Row % 7.3 92.7 100 5.0 95.0 100 2.4 97.6 100
2 0.5 to 1 lakh 16 216 232 17 118 135 3 77 80
Row % 6.9 93.1 100 12.6 87.4 100 3.8 96.3 100 3 1 lakh to 2 lakh 48 341 389 35 241 276 13 146 159 Row % 12.3 87.7 100 12.7 87.3 100 8.2 91.8 100 4 2 lakh to 3 lakh 51 247 298 36 178 214 9 106 115 Row % 17.1 82.9 100 16.8 83.2 100 7.8 92.2 100 5 3 lakh to 4 lakh 30 115 145 25 140 165 14 74 88 Row % 20.7 79.3 100 15.2 84.8 100 15.9 84.1 100 6 4 lakh to 5 lakh 29 53 82 19 105 124 8 53 61 Row % 35.4 64.6 100 20.7 79.3 100 13.1 86.9 100 7 5 lakh to 6 lakh 19 24 43 17 84 101 6 53 59 Row % 44.2 55.8 100 16.8 83.2 100 10.2 89.8 100 8 6 lakh to 7 lakh 11 13 24 16 66 82 4 30 34 Row % 45.8 54.2 100 19.5 80.5 100 11.8 88.2 100 9 7 lakh to 8 lakh 10 19 29 24 41 65 6 17 23 Row % 34.5 65.5 100 36.9 63.1 100 26.1 73.9 100 10 8 lakh to 9 lakh 15 3 18 13 30 43 3 11 14 Row % 83.3 16.7 100 30.2 69.8 100 21.4 78.6 100
11 9 lakh to 10 lakh
13 9 22 4 21 25 4 10 14
Row % 59.1 40.9 100 16.0 84.0 100 28.6 71.4 100 12 > 10 lakh 19 16 35 111 81 192 13 34 47 Row % 54.3 45.7 100 57.8 42.2 100 27.7 72.3 100 N.R. 1 1 Total 267 1132 1400 319 1143 1462 84 651 735
Source: PwC analysis and Baseline Survey Report
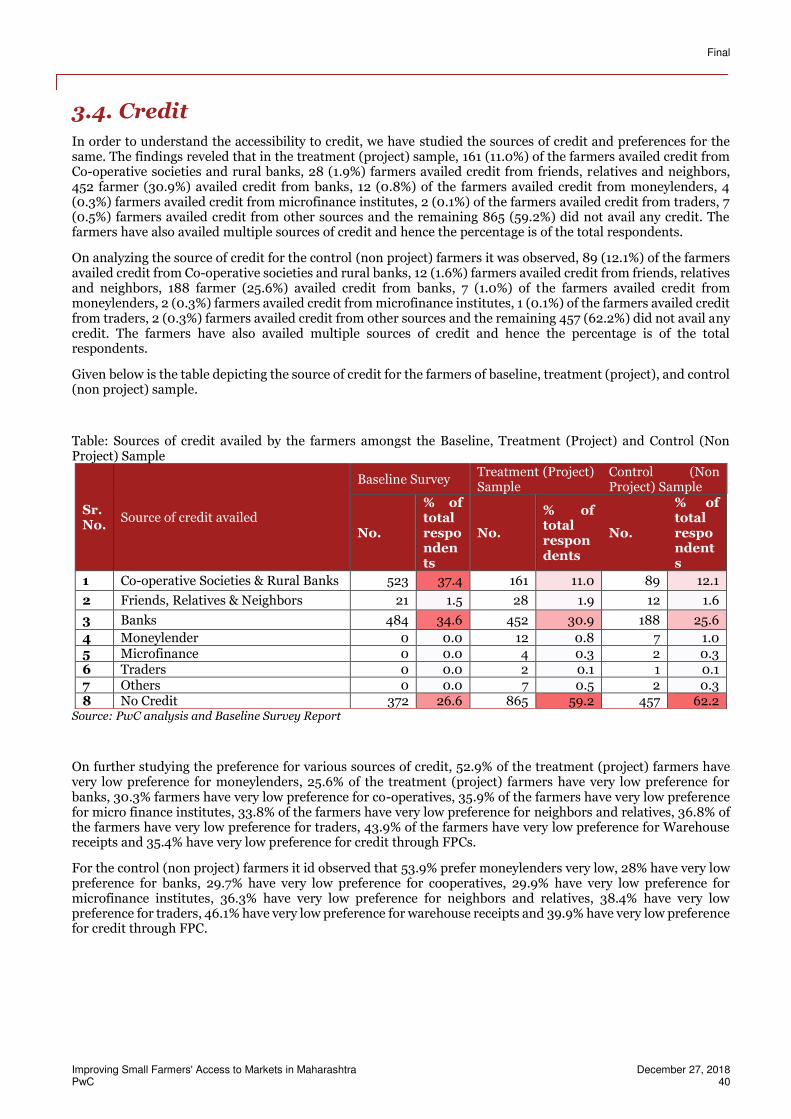
Final
Improving Small Farmers' Access to Markets in Maharashtra December 27, 2018 PwC 40
3.4. Credit
In order to understand the accessibility to credit, we have studied the sources of credit and preferences for the same. The findings reveled that in the treatment (project) sample, 161 (11.0%) of the farmers availed credit from Co-operative societies and rural banks, 28 (1.9%) farmers availed credit from friends, relatives and neighbors, 452 farmer (30.9%) availed credit from banks, 12 (0.8%) of the farmers availed credit from moneylenders, 4 (0.3%) farmers availed credit from microfinance institutes, 2 (0.1%) of the farmers availed credit from traders, 7 (0.5%) farmers availed credit from other sources and the remaining 865 (59.2%) did not avail any credit. The farmers have also availed multiple sources of credit and hence the percentage is of the total respondents.
On analyzing the source of credit for the control (non project) farmers it was observed, 89 (12.1%) of the farmers availed credit from Co-operative societies and rural banks, 12 (1.6%) farmers availed credit from friends, relatives and neighbors, 188 farmer (25.6%) availed credit from banks, 7 (1.0%) of the farmers availed credit from moneylenders, 2 (0.3%) farmers availed credit from microfinance institutes, 1 (0.1%) of the farmers availed credit from traders, 2 (0.3%) farmers availed credit from other sources and the remaining 457 (62.2%) did not avail any credit. The farmers have also availed multiple sources of credit and hence the percentage is of the total respondents.
Given below is the table depicting the source of credit for the farmers of baseline, treatment (project), and control (non project) sample.
Table: Sources of credit availed by the farmers amongst the Baseline, Treatment (Project) and Control (Non Project) Sample
Sr. No.
Source of credit availed
Baseline Survey Treatment (Project) Sample
Control (Non Project) Sample
No.
% of total respondents
No.
% of total respondents
No.
% of total respondents
1 Co-operative Societies & Rural Banks 523 37.4 161 11.0 89 12.1
2 Friends, Relatives & Neighbors 21 1.5 28 1.9 12 1.6
3 Banks 484 34.6 452 30.9 188 25.6
4 Moneylender 0 0.0 12 0.8 7 1.0 5 Microfinance 0 0.0 4 0.3 2 0.3 6 Traders 0 0.0 2 0.1 1 0.1 7 Others 0 0.0 7 0.5 2 0.3 8 No Credit 372 26.6 865 59.2 457 62.2
Source: PwC analysis and Baseline Survey Report
On further studying the preference for various sources of credit, 52.9% of the treatment (project) farmers have very low preference for moneylenders, 25.6% of the treatment (project) farmers have very low preference for banks, 30.3% farmers have very low preference for co-operatives, 35.9% of the farmers have very low preference for micro finance institutes, 33.8% of the farmers have very low preference for neighbors and relatives, 36.8% of the farmers have very low preference for traders, 43.9% of the farmers have very low preference for Warehouse receipts and 35.4% have very low preference for credit through FPCs.
For the control (non project) farmers it id observed that 53.9% prefer moneylenders very low, 28% have very low preference for banks, 29.7% have very low preference for cooperatives, 29.9% have very low preference for microfinance institutes, 36.3% have very low preference for neighbors and relatives, 38.4% have very low preference for traders, 46.1% have very low preference for warehouse receipts and 39.9% have very low preference for credit through FPC.
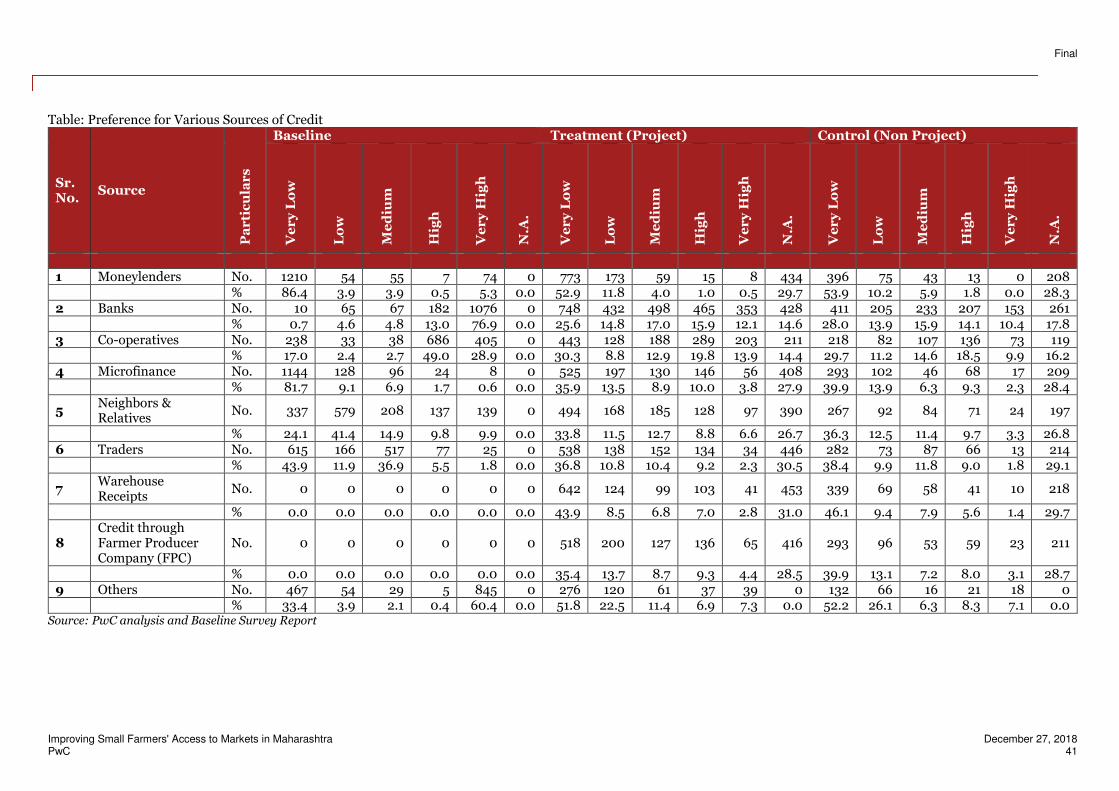
Final
Improving Small Farmers' Access to Markets in Maharashtra December 27, 2018 PwC 41
Table: Preference for Various Sources of Credit
Sr. No.
Source
Pa
rti
cu
lar
s
Baseline Treatment (Project) Control (Non Project)
Ve
ry
Lo
w
Lo
w
Me
diu
m
Hig
h
Ve
ry
Hig
h
N.A
.
Ve
ry
Lo
w
Lo
w
Me
diu
m
Hig
h
Ve
ry
Hig
h
N.A
.
Ve
ry
Lo
w
Lo
w
Me
diu
m
Hig
h
Ve
ry
Hig
h
N.A
.
1 Moneylenders No. 1210 54 55 7 74 0 773 173 59 15 8 434 396 75 43 13 0 208 % 86.4 3.9 3.9 0.5 5.3 0.0 52.9 11.8 4.0 1.0 0.5 29.7 53.9 10.2 5.9 1.8 0.0 28.3 2 Banks No. 10 65 67 182 1076 0 748 432 498 465 353 428 411 205 233 207 153 261 % 0.7 4.6 4.8 13.0 76.9 0.0 25.6 14.8 17.0 15.9 12.1 14.6 28.0 13.9 15.9 14.1 10.4 17.8 3 Co-operatives No. 238 33 38 686 405 0 443 128 188 289 203 211 218 82 107 136 73 119 % 17.0 2.4 2.7 49.0 28.9 0.0 30.3 8.8 12.9 19.8 13.9 14.4 29.7 11.2 14.6 18.5 9.9 16.2 4 Microfinance No. 1144 128 96 24 8 0 525 197 130 146 56 408 293 102 46 68 17 209 % 81.7 9.1 6.9 1.7 0.6 0.0 35.9 13.5 8.9 10.0 3.8 27.9 39.9 13.9 6.3 9.3 2.3 28.4
5 Neighbors & Relatives
No. 337 579 208 137 139 0 494 168 185 128 97 390 267 92 84 71 24 197
% 24.1 41.4 14.9 9.8 9.9 0.0 33.8 11.5 12.7 8.8 6.6 26.7 36.3 12.5 11.4 9.7 3.3 26.8 6 Traders No. 615 166 517 77 25 0 538 138 152 134 34 446 282 73 87 66 13 214 % 43.9 11.9 36.9 5.5 1.8 0.0 36.8 10.8 10.4 9.2 2.3 30.5 38.4 9.9 11.8 9.0 1.8 29.1
7 Warehouse Receipts
No. 0 0 0 0 0 0 642 124 99 103 41 453 339 69 58 41 10 218
% 0.0 0.0 0.0 0.0 0.0 0.0 43.9 8.5 6.8 7.0 2.8 31.0 46.1 9.4 7.9 5.6 1.4 29.7
8 Credit through Farmer Producer Company (FPC)
No. 0 0 0 0 0 0 518 200 127 136 65 416 293 96 53 59 23 211
% 0.0 0.0 0.0 0.0 0.0 0.0 35.4 13.7 8.7 9.3 4.4 28.5 39.9 13.1 7.2 8.0 3.1 28.7 9 Others No. 467 54 29 5 845 0 276 120 61 37 39 0 132 66 16 21 18 0 % 33.4 3.9 2.1 0.4 60.4 0.0 51.8 22.5 11.4 6.9 7.3 0.0 52.2 26.1 6.3 8.3 7.1 0.0
Source: PwC analysis and Baseline Survey Report
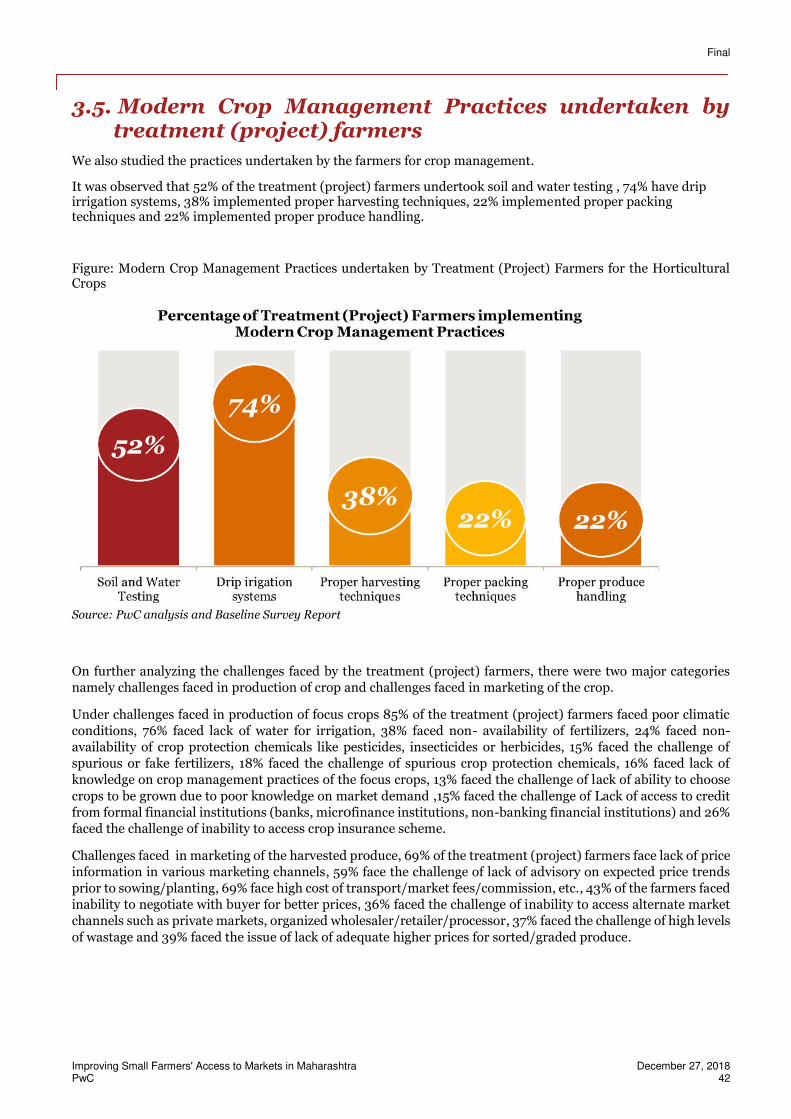
Final
Improving Small Farmers' Access to Markets in Maharashtra December 27, 2018 PwC 42
3.5. Modern Crop Management Practices undertaken by treatment (project) farmers
We also studied the practices undertaken by the farmers for crop management.
It was observed that 52% of the treatment (project) farmers undertook soil and water testing , 74% have drip irrigation systems, 38% implemented proper harvesting techniques, 22% implemented proper packing techniques and 22% implemented proper produce handling.
Figure: Modern Crop Management Practices undertaken by Treatment (Project) Farmers for the Horticultural Crops
Source: PwC analysis and Baseline Survey Report
On further analyzing the challenges faced by the treatment (project) farmers, there were two major categories
namely challenges faced in production of crop and challenges faced in marketing of the crop.
Under challenges faced in production of focus crops 85% of the treatment (project) farmers faced poor climatic
conditions, 76% faced lack of water for irrigation, 38% faced non- availability of fertilizers, 24% faced non-
availability of crop protection chemicals like pesticides, insecticides or herbicides, 15% faced the challenge of
spurious or fake fertilizers, 18% faced the challenge of spurious crop protection chemicals, 16% faced lack of
knowledge on crop management practices of the focus crops, 13% faced the challenge of lack of ability to choose
crops to be grown due to poor knowledge on market demand ,15% faced the challenge of Lack of access to credit
from formal financial institutions (banks, micr0finance institutions, non-banking financial institutions) and 26%
faced the challenge of inability to access crop insurance scheme.
Challenges faced in marketing of the harvested produce, 69% of the treatment (project) farmers face lack of price
information in various marketing channels, 59% face the challenge of lack of advisory on expected price trends
prior to sowing/planting, 69% face high cost of transport/market fees/commission, etc., 43% of the farmers faced
inability to negotiate with buyer for better prices, 36% faced the challenge of inability to access alternate market
channels such as private markets, organized wholesaler/retailer/processor, 37% faced the challenge of high levels
of wastage and 39% faced the issue of lack of adequate higher prices for sorted/graded produce.
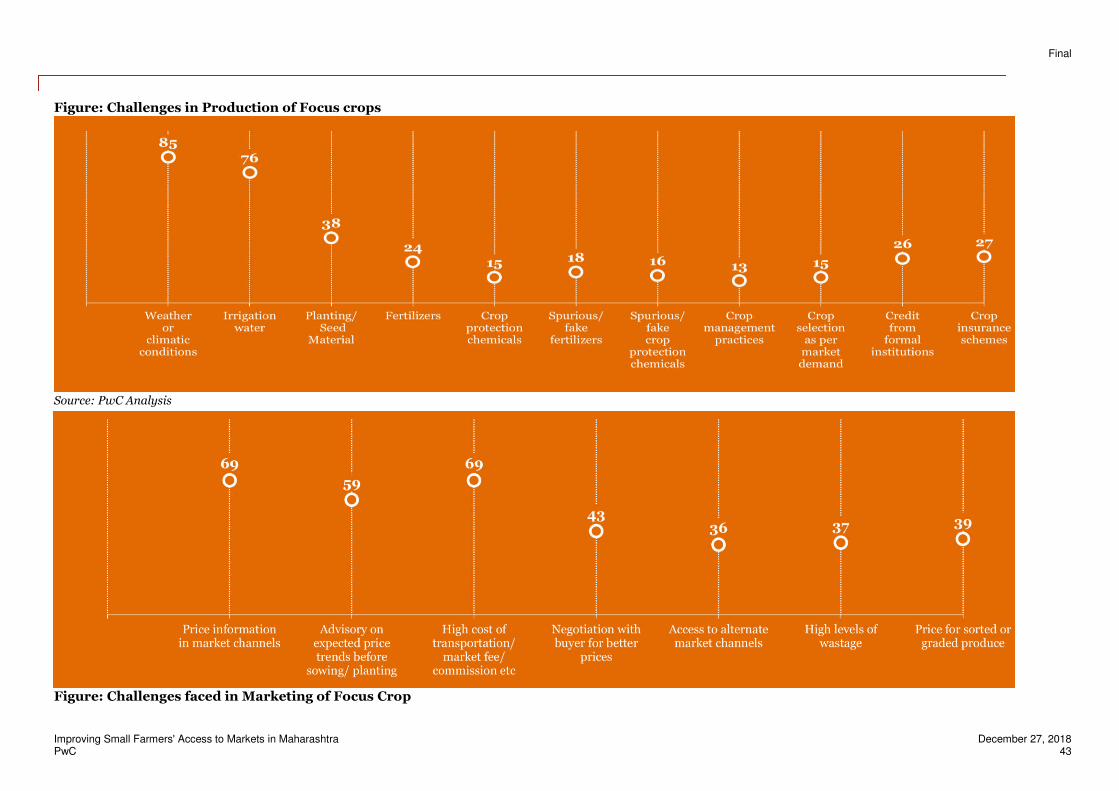
Final
Improving Small Farmers' Access to Markets in Maharashtra December 27, 2018 PwC 43
Figure: Challenges in Production of Focus crops
Source: PwC Analysis
Figure: Challenges faced in Marketing of Focus Crop
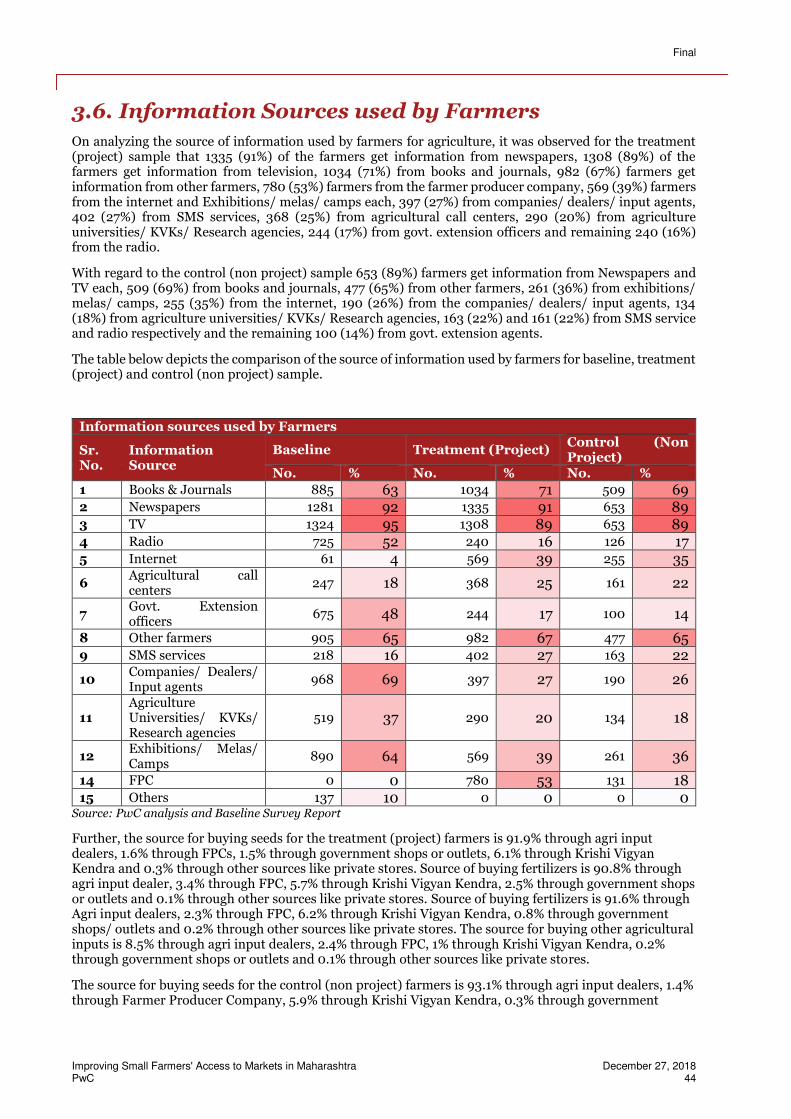
Final
Improving Small Farmers' Access to Markets in Maharashtra December 27, 2018 PwC 44
3.6. Information Sources used by Farmers
On analyzing the source of information used by farmers for agriculture, it was observed for the treatment (project) sample that 1335 (91%) of the farmers get information from newspapers, 1308 (89%) of the farmers get information from television, 1034 (71%) from books and journals, 982 (67%) farmers get information from other farmers, 780 (53%) farmers from the farmer producer company, 569 (39%) farmers from the internet and Exhibitions/ melas/ camps each, 397 (27%) from companies/ dealers/ input agents, 402 (27%) from SMS services, 368 (25%) from agricultural call centers, 290 (20%) from agriculture universities/ KVKs/ Research agencies, 244 (17%) from govt. extension officers and remaining 240 (16%) from the radio.
With regard to the control (non project) sample 653 (89%) farmers get information from Newspapers and TV each, 509 (69%) from books and journals, 477 (65%) from other farmers, 261 (36%) from exhibitions/ melas/ camps, 255 (35%) from the internet, 190 (26%) from the companies/ dealers/ input agents, 134 (18%) from agriculture universities/ KVKs/ Research agencies, 163 (22%) and 161 (22%) from SMS service and radio respectively and the remaining 100 (14%) from govt. extension agents.
The table below depicts the comparison of the source of information used by farmers for baseline, treatment (project) and control (non project) sample.
Information sources used by Farmers
Sr. No.
Information Source
Baseline Treatment (Project) Control (Non Project)
No. % No. % No. %
1 Books & Journals 885 63 1034 71 509 69 2 Newspapers 1281 92 1335 91 653 89 3 TV 1324 95 1308 89 653 89 4 Radio 725 52 240 16 126 17 5 Internet 61 4 569 39 255 35
6 Agricultural call centers
247 18 368 25 161 22
7 Govt. Extension officers
675 48 244 17 100 14
8 Other farmers 905 65 982 67 477 65 9 SMS services 218 16 402 27 163 22
10 Companies/ Dealers/ Input agents
968 69 397 27 190 26
11 Agriculture Universities/ KVKs/ Research agencies
519 37 290 20 134 18
12 Exhibitions/ Melas/ Camps
890 64 569 39 261 36
14 FPC 0 0 780 53 131 18 15 Others 137 10 0 0 0 0
Source: PwC analysis and Baseline Survey Report
Further, the source for buying seeds for the treatment (project) farmers is 91.9% through agri input dealers, 1.6% through FPCs, 1.5% through government shops or outlets, 6.1% through Krishi Vigyan Kendra and 0.3% through other sources like private stores. Source of buying fertilizers is 90.8% through agri input dealer, 3.4% through FPC, 5.7% through Krishi Vigyan Kendra, 2.5% through government shops or outlets and 0.1% through other sources like private stores. Source of buying fertilizers is 91.6% through Agri input dealers, 2.3% through FPC, 6.2% through Krishi Vigyan Kendra, 0.8% through government shops/ outlets and 0.2% through other sources like private stores. The source for buying other agricultural inputs is 8.5% through agri input dealers, 2.4% through FPC, 1% through Krishi Vigyan Kendra, 0.2% through government shops or outlets and 0.1% through other sources like private stores.
The source for buying seeds for the control (non project) farmers is 93.1% through agri input dealers, 1.4% through Farmer Producer Company, 5.9% through Krishi Vigyan Kendra, 0.3% through government
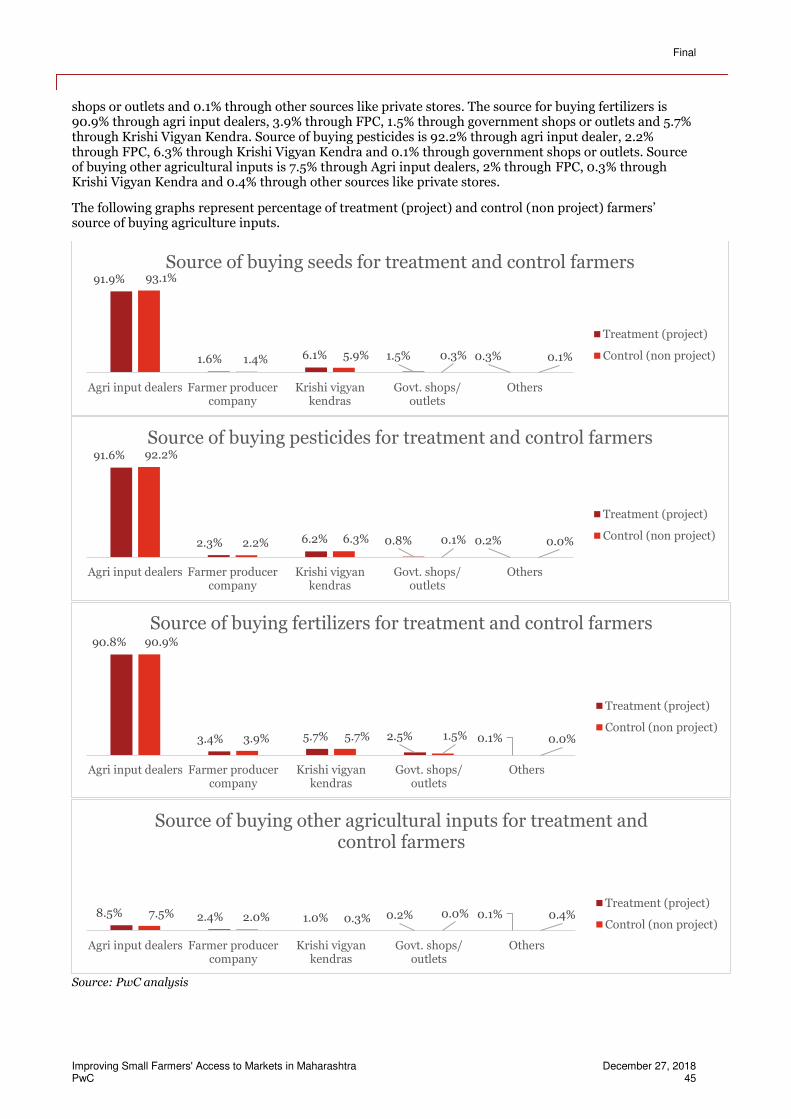
Final
Improving Small Farmers' Access to Markets in Maharashtra December 27, 2018 PwC 45
shops or outlets and 0.1% through other sources like private stores. The source for buying fertilizers is 90.9% through agri input dealers, 3.9% through FPC, 1.5% through government shops or outlets and 5.7% through Krishi Vigyan Kendra. Source of buying pesticides is 92.2% through agri input dealer, 2.2% through FPC, 6.3% through Krishi Vigyan Kendra and 0.1% through government shops or outlets. Source of buying other agricultural inputs is 7.5% through Agri input dealers, 2% through FPC, 0.3% through Krishi Vigyan Kendra and 0.4% through other sources like private stores.
The following graphs represent percentage of treatment (project) and control (non project) farmers’ source of buying agriculture inputs.
Source: PwC analysis
91.9%
1.6% 6.1% 1.5% 0.3%
93.1%
1.4% 5.9% 0.3% 0.1%
Agri input dealers Farmer producercompany
Krishi vigyankendras
Govt. shops/outlets
Others
Source of buying seeds for treatment and control farmers
Treatment (project)
Control (non project)
91.6%
2.3% 6.2% 0.8% 0.2%
92.2%
2.2% 6.3% 0.1% 0.0%
Agri input dealers Farmer producercompany
Krishi vigyankendras
Govt. shops/outlets
Others
Source of buying pesticides for treatment and control farmers
Treatment (project)
Control (non project)
90.8%
3.4% 5.7% 2.5% 0.1%
90.9%
3.9% 5.7% 1.5% 0.0%
Agri input dealers Farmer producercompany
Krishi vigyankendras
Govt. shops/outlets
Others
Source of buying fertilizers for treatment and control farmers
Treatment (project)
Control (non project)
8.5% 2.4% 1.0% 0.2% 0.1%7.5% 2.0% 0.3% 0.0% 0.4%
Agri input dealers Farmer producercompany
Krishi vigyankendras
Govt. shops/outlets
Others
Source of buying other agricultural inputs for treatment and control farmers
Treatment (project)
Control (non project)
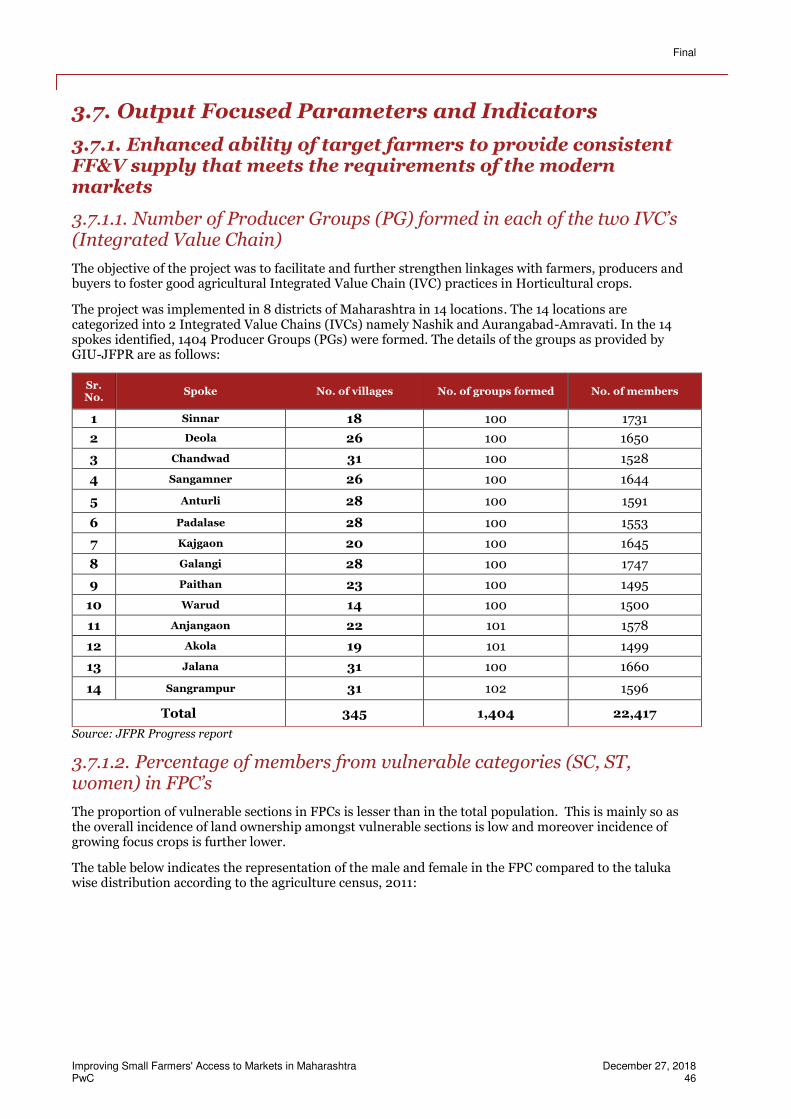
Final
Improving Small Farmers' Access to Markets in Maharashtra December 27, 2018 PwC 46
3.7. Output Focused Parameters and Indicators
3.7.1. Enhanced ability of target farmers to provide consistent FF&V supply that meets the requirements of the modern markets
3.7.1.1. Number of Producer Groups (PG) formed in each of the two IVC’s (Integrated Value Chain)
The objective of the project was to facilitate and further strengthen linkages with farmers, producers and buyers to foster good agricultural Integrated Value Chain (IVC) practices in Horticultural crops.
The project was implemented in 8 districts of Maharashtra in 14 locations. The 14 locations are categorized into 2 Integrated Value Chains (IVCs) namely Nashik and Aurangabad-Amravati. In the 14 spokes identified, 1404 Producer Groups (PGs) were formed. The details of the groups as provided by GIU-JFPR are as follows:
Sr. No.
Spoke No. of villages No. of groups formed No. of members
1 Sinnar 18 100 1731
2 Deola 26 100 1650
3 Chandwad 31 100 1528
4 Sangamner 26 100 1644
5 Anturli 28 100 1591
6 Padalase 28 100 1553
7 Kajgaon 20 100 1645
8 Galangi 28 100 1747
9 Paithan 23 100 1495
10 Warud 14 100 1500
11 Anjangaon 22 101 1578
12 Akola 19 101 1499
13 Jalana 31 100 1660
14 Sangrampur 31 102 1596
Total 345 1,404 22,417
Source: JFPR Progress report
3.7.1.2. Percentage of members from vulnerable categories (SC, ST, women) in FPC’s
The proportion of vulnerable sections in FPCs is lesser than in the total population. This is mainly so as the overall incidence of land ownership amongst vulnerable sections is low and moreover incidence of growing focus crops is further lower.
The table below indicates the representation of the male and female in the FPC compared to the taluka wise distribution according to the agriculture census, 2011:
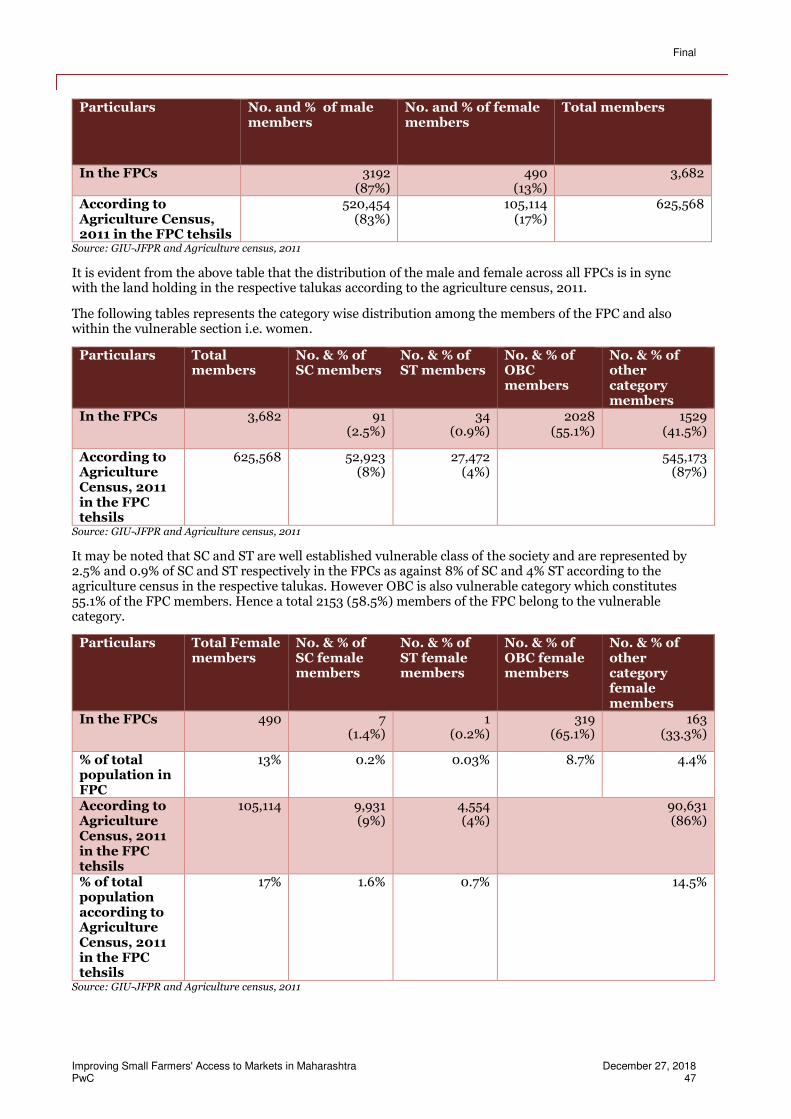
Final
Improving Small Farmers' Access to Markets in Maharashtra December 27, 2018 PwC 47
Particulars No. and % of male members
No. and % of female members
Total members
In the FPCs 3192 (87%)
490 (13%)
3,682
According to Agriculture Census, 2011 in the FPC tehsils
520,454 (83%)
105,114 (17%)
625,568
Source: GIU-JFPR and Agriculture census, 2011
It is evident from the above table that the distribution of the male and female across all FPCs is in sync with the land holding in the respective talukas according to the agriculture census, 2011.
The following tables represents the category wise distribution among the members of the FPC and also within the vulnerable section i.e. women.
Particulars Total members
No. & % of SC members
No. & % of ST members
No. & % of OBC members
No. & % of other category members
In the FPCs 3,682 91 (2.5%)
34 (0.9%)
2028 (55.1%)
1529 (41.5%)
According to Agriculture Census, 2011 in the FPC tehsils
625,568 52,923 (8%)
27,472 (4%)
545,173 (87%)
Source: GIU-JFPR and Agriculture census, 2011
It may be noted that SC and ST are well established vulnerable class of the society and are represented by 2.5% and 0.9% of SC and ST respectively in the FPCs as against 8% of SC and 4% ST according to the agriculture census in the respective talukas. However OBC is also vulnerable category which constitutes 55.1% of the FPC members. Hence a total 2153 (58.5%) members of the FPC belong to the vulnerable category.
Particulars Total Female members
No. & % of SC female members
No. & % of ST female members
No. & % of OBC female members
No. & % of other category female members
In the FPCs 490 7 (1.4%)
1 (0.2%)
319 (65.1%)
163 (33.3%)
% of total population in FPC
13% 0.2% 0.03% 8.7% 4.4%
According to Agriculture Census, 2011 in the FPC tehsils
105,114 9,931 (9%)
4,554 (4%)
90,631 (86%)
% of total population according to Agriculture Census, 2011 in the FPC tehsils
17% 1.6% 0.7% 14.5%
Source: GIU-JFPR and Agriculture census, 2011
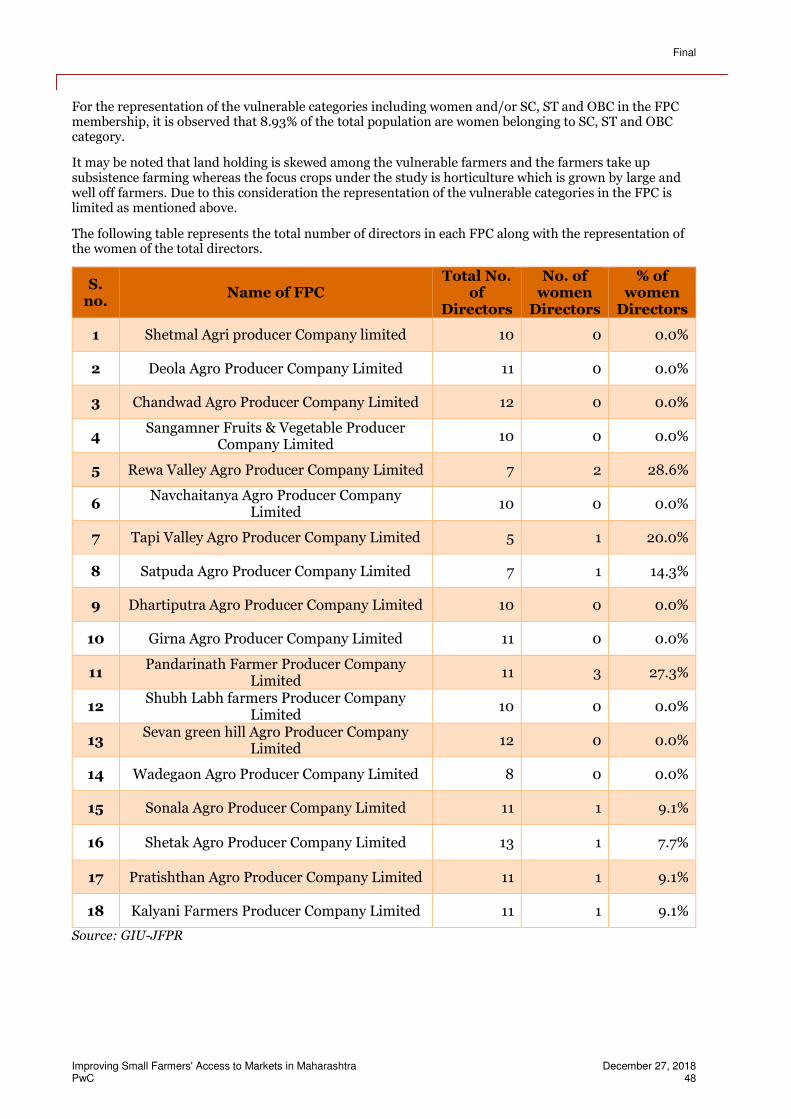
Final
Improving Small Farmers' Access to Markets in Maharashtra December 27, 2018 PwC 48
For the representation of the vulnerable categories including women and/or SC, ST and OBC in the FPC membership, it is observed that 8.93% of the total population are women belonging to SC, ST and OBC category.
It may be noted that land holding is skewed among the vulnerable farmers and the farmers take up subsistence farming whereas the focus crops under the study is horticulture which is grown by large and well off farmers. Due to this consideration the representation of the vulnerable categories in the FPC is limited as mentioned above.
The following table represents the total number of directors in each FPC along with the representation of the women of the total directors.
S. no.
Name of FPC Total No.
of Directors
No. of women
Directors
% of women
Directors
1 Shetmal Agri producer Company limited 10 0 0.0%
2 Deola Agro Producer Company Limited 11 0 0.0%
3 Chandwad Agro Producer Company Limited 12 0 0.0%
4 Sangamner Fruits & Vegetable Producer
Company Limited 10 0 0.0%
5 Rewa Valley Agro Producer Company Limited 7 2 28.6%
6 Navchaitanya Agro Producer Company
Limited 10 0 0.0%
7 Tapi Valley Agro Producer Company Limited 5 1 20.0%
8 Satpuda Agro Producer Company Limited 7 1 14.3%
9 Dhartiputra Agro Producer Company Limited 10 0 0.0%
10 Girna Agro Producer Company Limited 11 0 0.0%
11 Pandarinath Farmer Producer Company
Limited 11 3 27.3%
12 Shubh Labh farmers Producer Company
Limited 10 0 0.0%
13 Sevan green hill Agro Producer Company
Limited 12 0 0.0%
14 Wadegaon Agro Producer Company Limited 8 0 0.0%
15 Sonala Agro Producer Company Limited 11 1 9.1%
16 Shetak Agro Producer Company Limited 13 1 7.7%
17 Pratishthan Agro Producer Company Limited 11 1 9.1%
18 Kalyani Farmers Producer Company Limited 11 1 9.1%
Source: GIU-JFPR
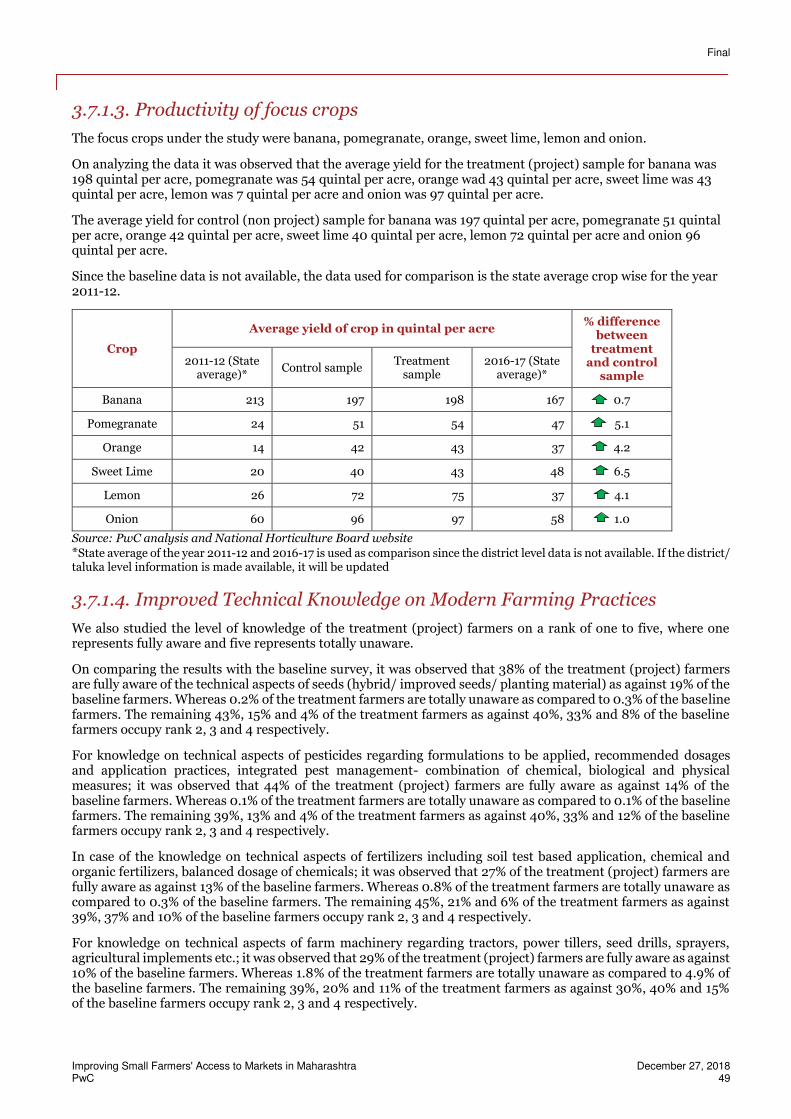
Final
Improving Small Farmers' Access to Markets in Maharashtra December 27, 2018 PwC 49
3.7.1.3. Productivity of focus crops
The focus crops under the study were banana, pomegranate, orange, sweet lime, lemon and onion.
On analyzing the data it was observed that the average yield for the treatment (project) sample for banana was 198 quintal per acre, pomegranate was 54 quintal per acre, orange wad 43 quintal per acre, sweet lime was 43 quintal per acre, lemon was 7 quintal per acre and onion was 97 quintal per acre.
The average yield for control (non project) sample for banana was 197 quintal per acre, pomegranate 51 quintal per acre, orange 42 quintal per acre, sweet lime 40 quintal per acre, lemon 72 quintal per acre and onion 96 quintal per acre.
Since the baseline data is not available, the data used for comparison is the state average crop wise for the year 2011-12.
Crop
Average yield of crop in quintal per acre % difference
between treatment
and control sample
2011-12 (State average)*
Control sample Treatment
sample 2016-17 (State
average)*
Banana 213 197 198 167 0.7
Pomegranate 24 51 54 47 5.1
Orange 14 42 43 37 4.2
Sweet Lime 20 40 43 48 6.5
Lemon 26 72 75 37 4.1
Onion 60 96 97 58 1.0
Source: PwC analysis and National Horticulture Board website
*State average of the year 2011-12 and 2016-17 is used as comparison since the district level data is not available. If the district/ taluka level information is made available, it will be updated
3.7.1.4. Improved Technical Knowledge on Modern Farming Practices
We also studied the level of knowledge of the treatment (project) farmers on a rank of one to five, where one represents fully aware and five represents totally unaware.
On comparing the results with the baseline survey, it was observed that 38% of the treatment (project) farmers are fully aware of the technical aspects of seeds (hybrid/ improved seeds/ planting material) as against 19% of the baseline farmers. Whereas 0.2% of the treatment farmers are totally unaware as compared to 0.3% of the baseline farmers. The remaining 43%, 15% and 4% of the treatment farmers as against 40%, 33% and 8% of the baseline farmers occupy rank 2, 3 and 4 respectively.
For knowledge on technical aspects of pesticides regarding formulations to be applied, recommended dosages and application practices, integrated pest management- combination of chemical, biological and physical measures; it was observed that 44% of the treatment (project) farmers are fully aware as against 14% of the baseline farmers. Whereas 0.1% of the treatment farmers are totally unaware as compared to 0.1% of the baseline farmers. The remaining 39%, 13% and 4% of the treatment farmers as against 40%, 33% and 12% of the baseline farmers occupy rank 2, 3 and 4 respectively.
In case of the knowledge on technical aspects of fertilizers including soil test based application, chemical and organic fertilizers, balanced dosage of chemicals; it was observed that 27% of the treatment (project) farmers are fully aware as against 13% of the baseline farmers. Whereas 0.8% of the treatment farmers are totally unaware as compared to 0.3% of the baseline farmers. The remaining 45%, 21% and 6% of the treatment farmers as against 39%, 37% and 10% of the baseline farmers occupy rank 2, 3 and 4 respectively.
For knowledge on technical aspects of farm machinery regarding tractors, power tillers, seed drills, sprayers, agricultural implements etc.; it was observed that 29% of the treatment (project) farmers are fully aware as against 10% of the baseline farmers. Whereas 1.8% of the treatment farmers are totally unaware as compared to 4.9% of the baseline farmers. The remaining 39%, 20% and 11% of the treatment farmers as against 30%, 40% and 15% of the baseline farmers occupy rank 2, 3 and 4 respectively.
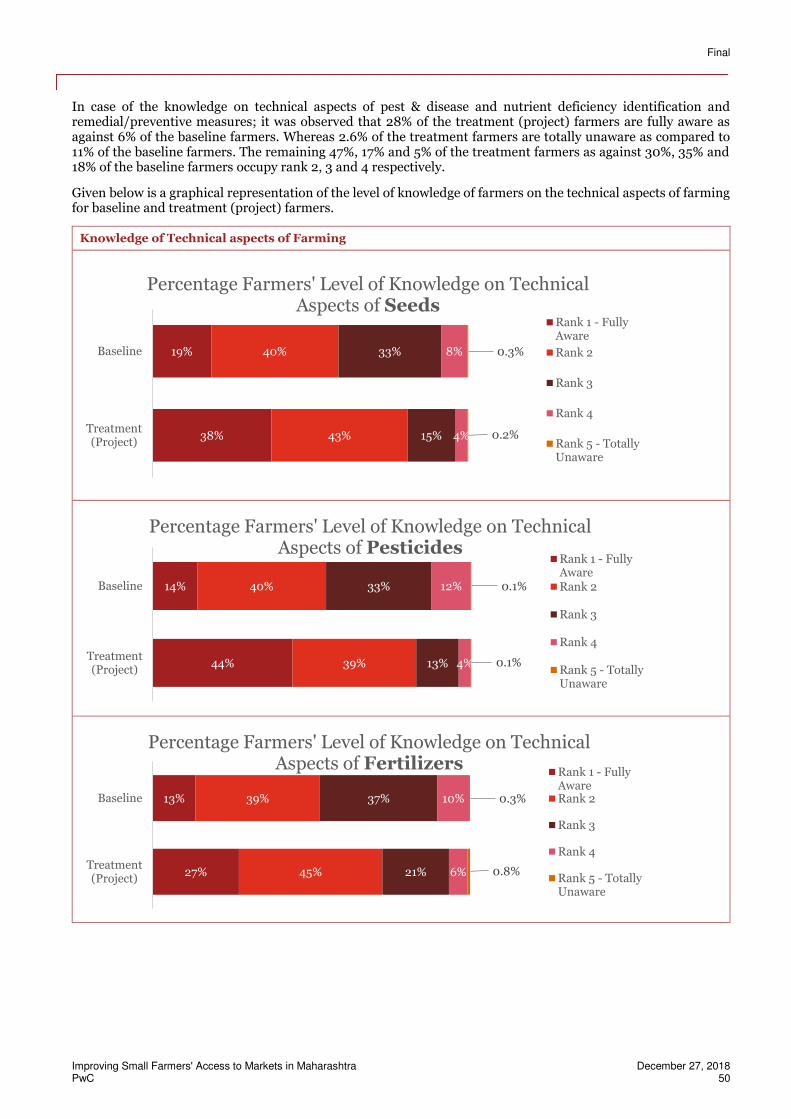
Final
Improving Small Farmers' Access to Markets in Maharashtra December 27, 2018 PwC 50
In case of the knowledge on technical aspects of pest & disease and nutrient deficiency identification and remedial/preventive measures; it was observed that 28% of the treatment (project) farmers are fully aware as against 6% of the baseline farmers. Whereas 2.6% of the treatment farmers are totally unaware as compared to 11% of the baseline farmers. The remaining 47%, 17% and 5% of the treatment farmers as against 30%, 35% and 18% of the baseline farmers occupy rank 2, 3 and 4 respectively.
Given below is a graphical representation of the level of knowledge of farmers on the technical aspects of farming for baseline and treatment (project) farmers.
Knowledge of Technical aspects of Farming
19%
38%
40%
43%
33%
15%
8%
4%
0.3%
0.2%
Baseline
Treatment(Project)
Percentage Farmers' Level of Knowledge on Technical Aspects of Seeds
Rank 1 - FullyAware
Rank 2
Rank 3
Rank 4
Rank 5 - TotallyUnaware
14%
44%
40%
39%
33%
13%
12%
4%
0.1%
0.1%
Baseline
Treatment(Project)
Percentage Farmers' Level of Knowledge on Technical Aspects of Pesticides
Rank 1 - FullyAwareRank 2
Rank 3
Rank 4
Rank 5 - TotallyUnaware
13%
27%
39%
45%
37%
21%
10%
6%
0.3%
0.8%
Baseline
Treatment(Project)
Percentage Farmers' Level of Knowledge on Technical Aspects of Fertilizers
Rank 1 - FullyAwareRank 2
Rank 3
Rank 4
Rank 5 - TotallyUnaware
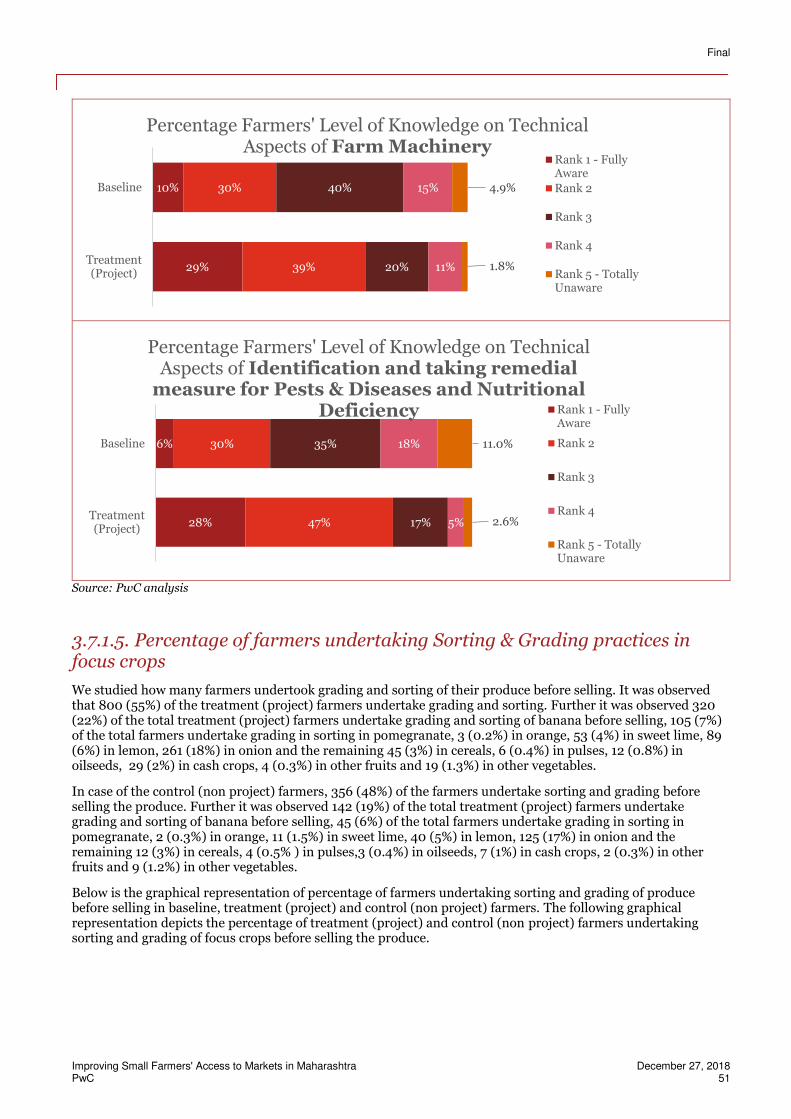
Final
Improving Small Farmers' Access to Markets in Maharashtra December 27, 2018 PwC 51
Source: PwC analysis
3.7.1.5. Percentage of farmers undertaking Sorting & Grading practices in focus crops
We studied how many farmers undertook grading and sorting of their produce before selling. It was observed that 800 (55%) of the treatment (project) farmers undertake grading and sorting. Further it was observed 320 (22%) of the total treatment (project) farmers undertake grading and sorting of banana before selling, 105 (7%) of the total farmers undertake grading in sorting in pomegranate, 3 (0.2%) in orange, 53 (4%) in sweet lime, 89 (6%) in lemon, 261 (18%) in onion and the remaining 45 (3%) in cereals, 6 (0.4%) in pulses, 12 (0.8%) in oilseeds, 29 (2%) in cash crops, 4 (0.3%) in other fruits and 19 (1.3%) in other vegetables.
In case of the control (non project) farmers, 356 (48%) of the farmers undertake sorting and grading before selling the produce. Further it was observed 142 (19%) of the total treatment (project) farmers undertake grading and sorting of banana before selling, 45 (6%) of the total farmers undertake grading in sorting in pomegranate, 2 (0.3%) in orange, 11 (1.5%) in sweet lime, 40 (5%) in lemon, 125 (17%) in onion and the remaining 12 (3%) in cereals, 4 (0.5% ) in pulses,3 (0.4%) in oilseeds, 7 (1%) in cash crops, 2 (0.3%) in other fruits and 9 (1.2%) in other vegetables.
Below is the graphical representation of percentage of farmers undertaking sorting and grading of produce before selling in baseline, treatment (project) and control (non project) farmers. The following graphical representation depicts the percentage of treatment (project) and control (non project) farmers undertaking sorting and grading of focus crops before selling the produce.
10%
29%
30%
39%
40%
20%
15%
11%
4.9%
1.8%
Baseline
Treatment(Project)
Percentage Farmers' Level of Knowledge on Technical Aspects of Farm Machinery
Rank 1 - FullyAware
Rank 2
Rank 3
Rank 4
Rank 5 - TotallyUnaware
6%
28%
30%
47%
35%
17%
18%
5%
11.0%
2.6%
Baseline
Treatment(Project)
Percentage Farmers' Level of Knowledge on Technical Aspects of Identification and taking remedial
measure for Pests & Diseases and Nutritional Deficiency Rank 1 - Fully
Aware
Rank 2
Rank 3
Rank 4
Rank 5 - TotallyUnaware
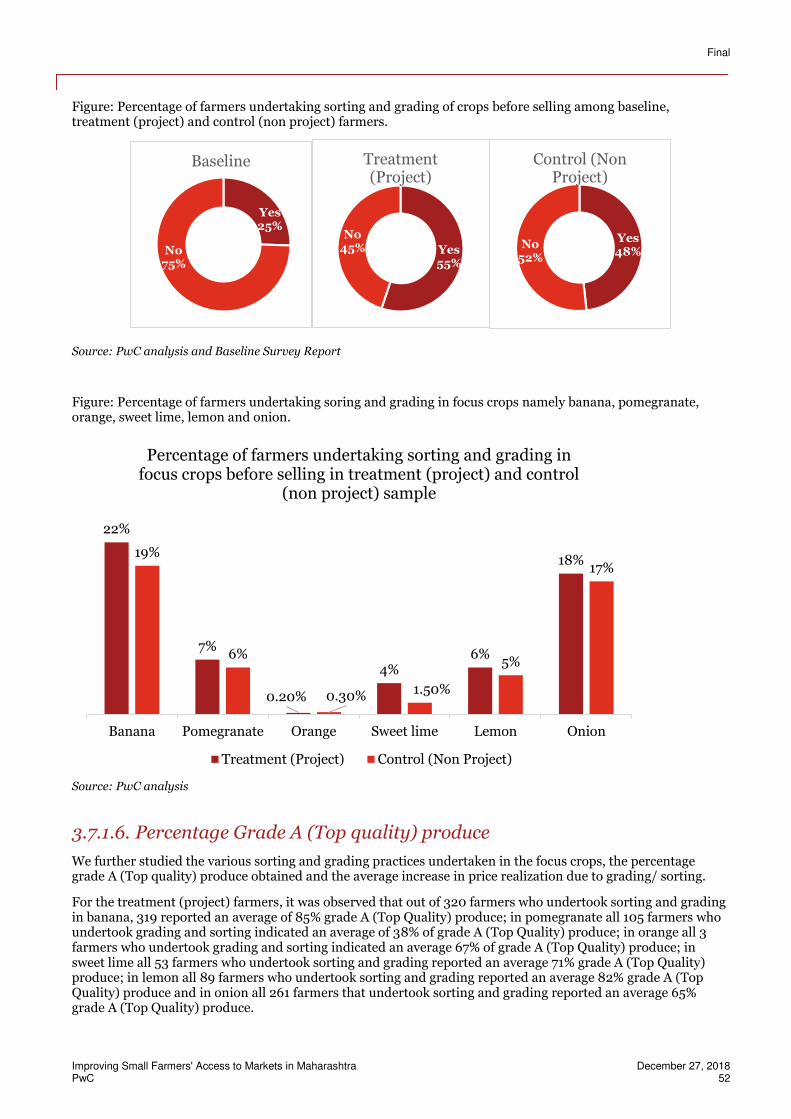
Final
Improving Small Farmers' Access to Markets in Maharashtra December 27, 2018 PwC 52
Figure: Percentage of farmers undertaking sorting and grading of crops before selling among baseline, treatment (project) and control (non project) farmers.
Source: PwC analysis and Baseline Survey Report
Figure: Percentage of farmers undertaking soring and grading in focus crops namely banana, pomegranate, orange, sweet lime, lemon and onion.
Source: PwC analysis
3.7.1.6. Percentage Grade A (Top quality) produce
We further studied the various sorting and grading practices undertaken in the focus crops, the percentage grade A (Top quality) produce obtained and the average increase in price realization due to grading/ sorting.
For the treatment (project) farmers, it was observed that out of 320 farmers who undertook sorting and grading in banana, 319 reported an average of 85% grade A (Top Quality) produce; in pomegranate all 105 farmers who undertook grading and sorting indicated an average of 38% of grade A (Top Quality) produce; in orange all 3 farmers who undertook grading and sorting indicated an average 67% of grade A (Top Quality) produce; in sweet lime all 53 farmers who undertook sorting and grading reported an average 71% grade A (Top Quality) produce; in lemon all 89 farmers who undertook sorting and grading reported an average 82% grade A (Top Quality) produce and in onion all 261 farmers that undertook sorting and grading reported an average 65% grade A (Top Quality) produce.
Yes25%
No75%
Baseline
Yes55%
No45%
Treatment (Project)
Yes48%
No52%
Control (Non Project)
22%
7%
0.20%
4%6%
18%19%
6%
0.30% 1.50%
5%
17%
Banana Pomegranate Orange Sweet lime Lemon Onion
Percentage of farmers undertaking sorting and grading in focus crops before selling in treatment (project) and control
(non project) sample
Treatment (Project) Control (Non Project)
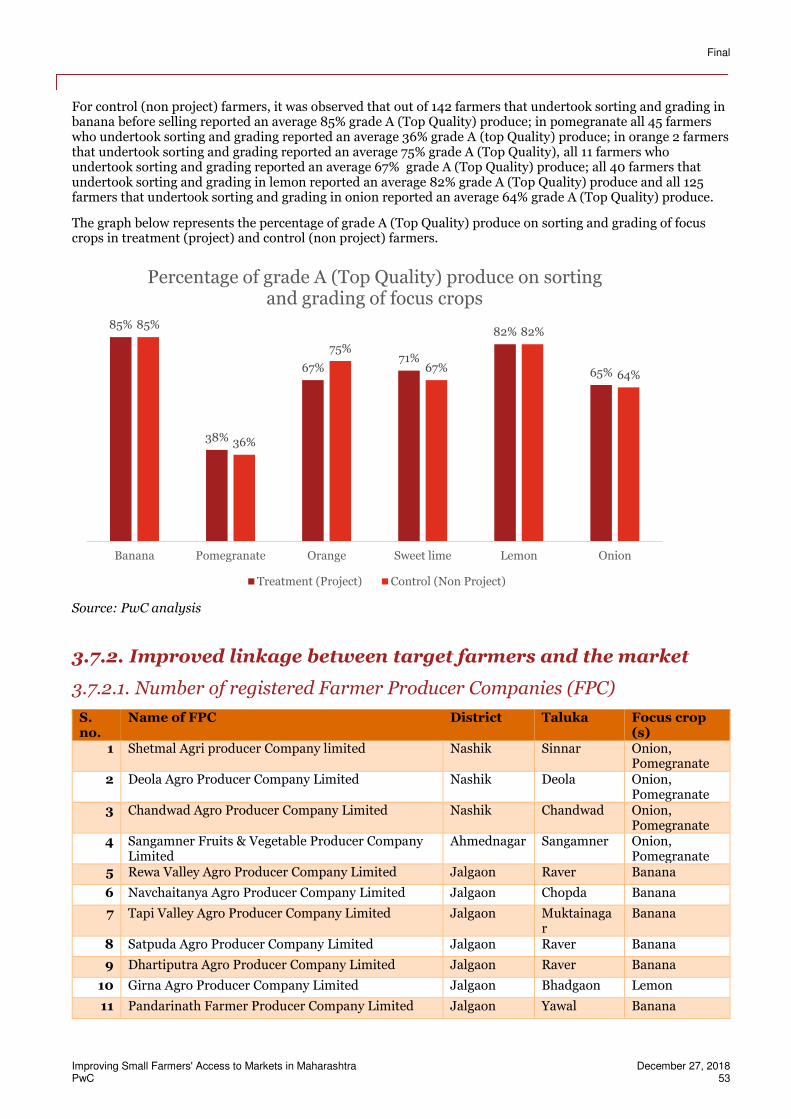
Final
Improving Small Farmers' Access to Markets in Maharashtra December 27, 2018 PwC 53
For control (non project) farmers, it was observed that out of 142 farmers that undertook sorting and grading in banana before selling reported an average 85% grade A (Top Quality) produce; in pomegranate all 45 farmers who undertook sorting and grading reported an average 36% grade A (top Quality) produce; in orange 2 farmers that undertook sorting and grading reported an average 75% grade A (Top Quality), all 11 farmers who undertook sorting and grading reported an average 67% grade A (Top Quality) produce; all 40 farmers that undertook sorting and grading in lemon reported an average 82% grade A (Top Quality) produce and all 125 farmers that undertook sorting and grading in onion reported an average 64% grade A (Top Quality) produce.
The graph below represents the percentage of grade A (Top Quality) produce on sorting and grading of focus crops in treatment (project) and control (non project) farmers.
Source: PwC analysis
3.7.2. Improved linkage between target farmers and the market
3.7.2.1. Number of registered Farmer Producer Companies (FPC)
S. no.
Name of FPC District Taluka Focus crop (s)
1 Shetmal Agri producer Company limited Nashik Sinnar Onion, Pomegranate
2 Deola Agro Producer Company Limited Nashik Deola Onion, Pomegranate
3 Chandwad Agro Producer Company Limited Nashik Chandwad Onion, Pomegranate
4 Sangamner Fruits & Vegetable Producer Company Limited
Ahmednagar Sangamner Onion, Pomegranate
5 Rewa Valley Agro Producer Company Limited Jalgaon Raver Banana
6 Navchaitanya Agro Producer Company Limited Jalgaon Chopda Banana
7 Tapi Valley Agro Producer Company Limited Jalgaon Muktainagar
Banana
8 Satpuda Agro Producer Company Limited Jalgaon Raver Banana
9 Dhartiputra Agro Producer Company Limited Jalgaon Raver Banana
10 Girna Agro Producer Company Limited Jalgaon Bhadgaon Lemon
11 Pandarinath Farmer Producer Company Limited Jalgaon Yawal Banana
85%
38%
67%71%
82%
65%
85%
36%
75%
67%
82%
64%
Banana Pomegranate Orange Sweet lime Lemon Onion
Percentage of grade A (Top Quality) produce on sorting and grading of focus crops
Treatment (Project) Control (Non Project)
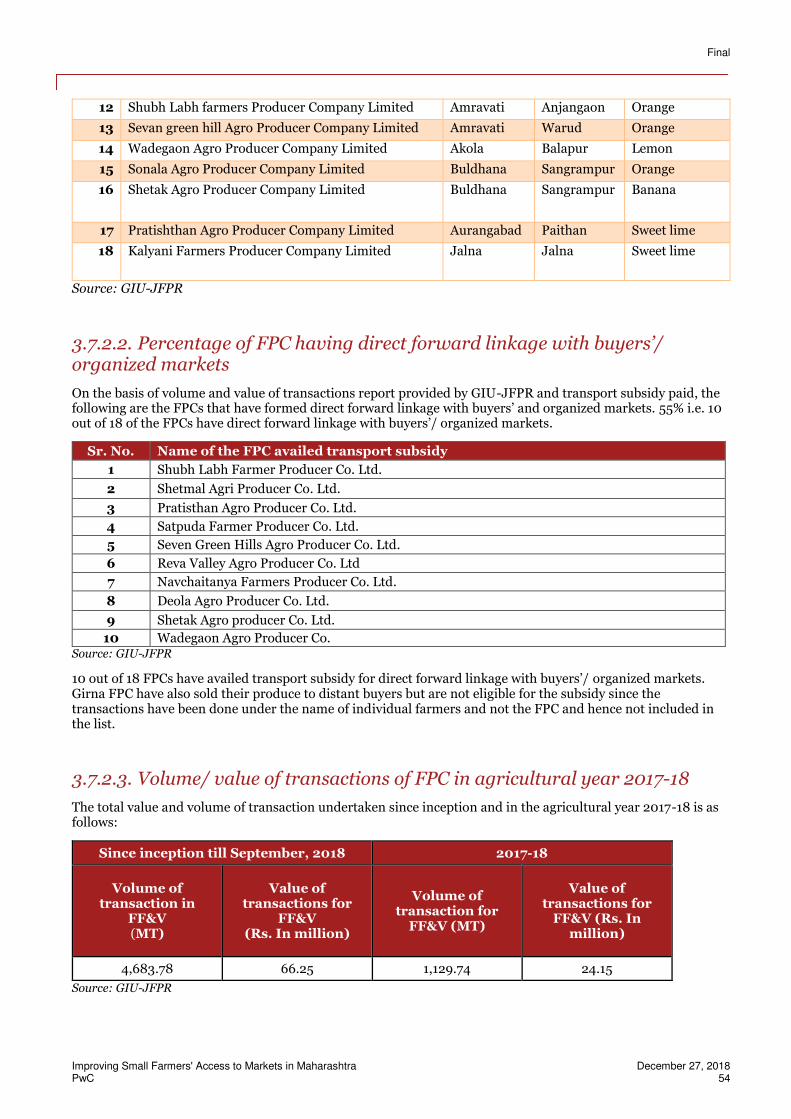
Final
Improving Small Farmers' Access to Markets in Maharashtra December 27, 2018 PwC 54
12 Shubh Labh farmers Producer Company Limited Amravati Anjangaon Orange
13 Sevan green hill Agro Producer Company Limited Amravati Warud Orange
14 Wadegaon Agro Producer Company Limited Akola Balapur Lemon
15 Sonala Agro Producer Company Limited Buldhana Sangrampur Orange
16 Shetak Agro Producer Company Limited Buldhana Sangrampur Banana
17 Pratishthan Agro Producer Company Limited Aurangabad Paithan Sweet lime
18 Kalyani Farmers Producer Company Limited Jalna Jalna Sweet lime
Source: GIU-JFPR
3.7.2.2. Percentage of FPC having direct forward linkage with buyers’/ organized markets
On the basis of volume and value of transactions report provided by GIU-JFPR and transport subsidy paid, the following are the FPCs that have formed direct forward linkage with buyers’ and organized markets. 55% i.e. 10 out of 18 of the FPCs have direct forward linkage with buyers’/ organized markets.
Sr. No. Name of the FPC availed transport subsidy
1 Shubh Labh Farmer Producer Co. Ltd.
2 Shetmal Agri Producer Co. Ltd.
3 Pratisthan Agro Producer Co. Ltd.
4 Satpuda Farmer Producer Co. Ltd.
5 Seven Green Hills Agro Producer Co. Ltd.
6 Reva Valley Agro Producer Co. Ltd
7 Navchaitanya Farmers Producer Co. Ltd.
8 Deola Agro Producer Co. Ltd.
9 Shetak Agro producer Co. Ltd.
10 Wadegaon Agro Producer Co. Source: GIU-JFPR
10 out of 18 FPCs have availed transport subsidy for direct forward linkage with buyers’/ organized markets. Girna FPC have also sold their produce to distant buyers but are not eligible for the subsidy since the transactions have been done under the name of individual farmers and not the FPC and hence not included in the list.
3.7.2.3. Volume/ value of transactions of FPC in agricultural year 2017-18
The total value and volume of transaction undertaken since inception and in the agricultural year 2017-18 is as follows:
Since inception till September, 2018 2017-18
Volume of transaction in
FF&V (MT)
Value of transactions for
FF&V (Rs. In million)
Volume of transaction for
FF&V (MT)
Value of transactions for
FF&V (Rs. In million)
4,683.78 66.25 1,129.74 24.15
Source: GIU-JFPR
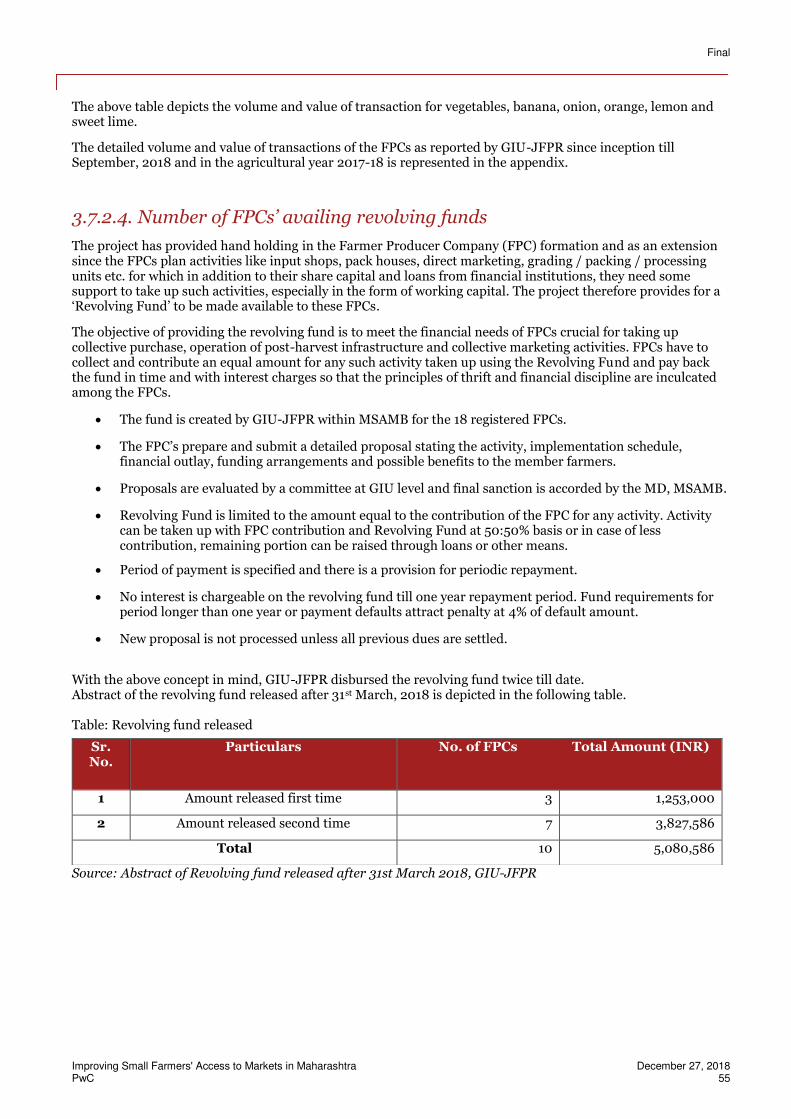
Final
Improving Small Farmers' Access to Markets in Maharashtra December 27, 2018 PwC 55
The above table depicts the volume and value of transaction for vegetables, banana, onion, orange, lemon and sweet lime.
The detailed volume and value of transactions of the FPCs as reported by GIU-JFPR since inception till September, 2018 and in the agricultural year 2017-18 is represented in the appendix.
3.7.2.4. Number of FPCs’ availing revolving funds
The project has provided hand holding in the Farmer Producer Company (FPC) formation and as an extension since the FPCs plan activities like input shops, pack houses, direct marketing, grading / packing / processing units etc. for which in addition to their share capital and loans from financial institutions, they need some support to take up such activities, especially in the form of working capital. The project therefore provides for a ‘Revolving Fund’ to be made available to these FPCs.
The objective of providing the revolving fund is to meet the financial needs of FPCs crucial for taking up collective purchase, operation of post-harvest infrastructure and collective marketing activities. FPCs have to collect and contribute an equal amount for any such activity taken up using the Revolving Fund and pay back the fund in time and with interest charges so that the principles of thrift and financial discipline are inculcated among the FPCs.
The fund is created by GIU-JFPR within MSAMB for the 18 registered FPCs.
The FPC’s prepare and submit a detailed proposal stating the activity, implementation schedule, financial outlay, funding arrangements and possible benefits to the member farmers.
Proposals are evaluated by a committee at GIU level and final sanction is accorded by the MD, MSAMB.
Revolving Fund is limited to the amount equal to the contribution of the FPC for any activity. Activity can be taken up with FPC contribution and Revolving Fund at 50:50% basis or in case of less contribution, remaining portion can be raised through loans or other means.
Period of payment is specified and there is a provision for periodic repayment.
No interest is chargeable on the revolving fund till one year repayment period. Fund requirements for period longer than one year or payment defaults attract penalty at 4% of default amount.
New proposal is not processed unless all previous dues are settled.
With the above concept in mind, GIU-JFPR disbursed the revolving fund twice till date. Abstract of the revolving fund released after 31st March, 2018 is depicted in the following table. Table: Revolving fund released
Source: Abstract of Revolving fund released after 31st March 2018, GIU-JFPR
Sr. No.
Particulars No. of FPCs Total Amount (INR)
1 Amount released first time 3 1,253,000
2 Amount released second time 7 3,827,586
Total 10 5,080,586
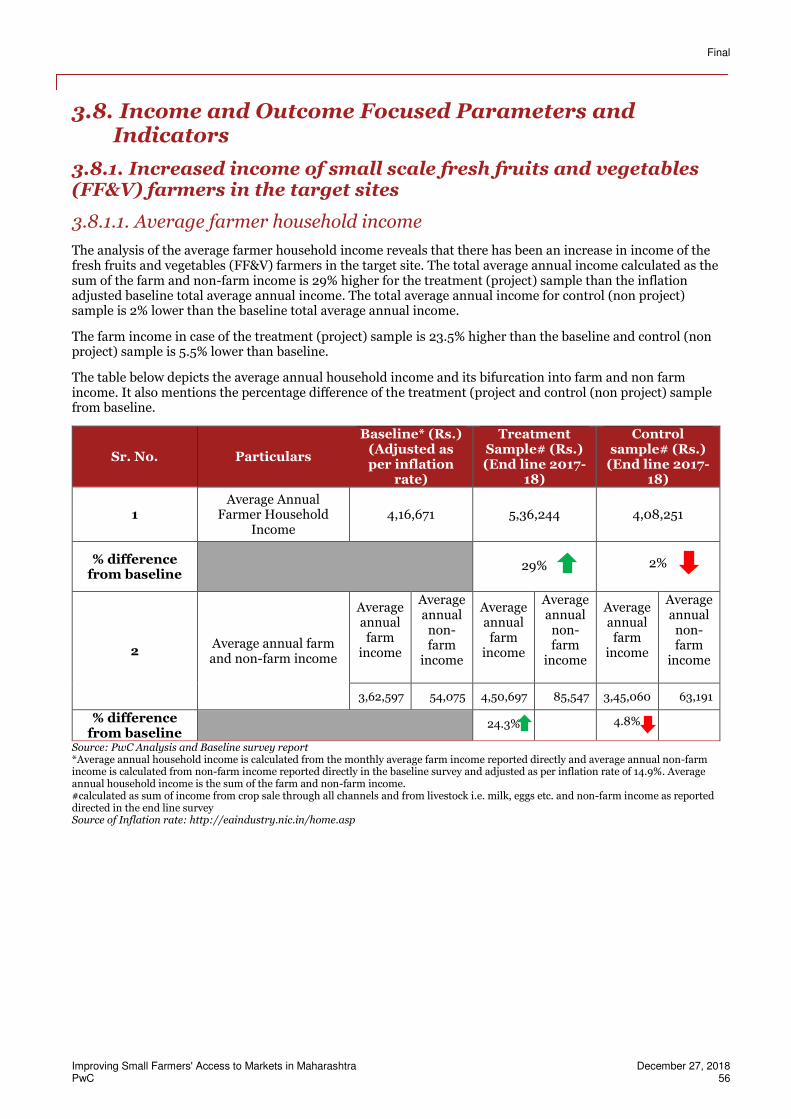
Final
Improving Small Farmers' Access to Markets in Maharashtra December 27, 2018 PwC 56
3.8. Income and Outcome Focused Parameters and Indicators
3.8.1. Increased income of small scale fresh fruits and vegetables (FF&V) farmers in the target sites
3.8.1.1. Average farmer household income
The analysis of the average farmer household income reveals that there has been an increase in income of the fresh fruits and vegetables (FF&V) farmers in the target site. The total average annual income calculated as the sum of the farm and non-farm income is 29% higher for the treatment (project) sample than the inflation adjusted baseline total average annual income. The total average annual income for control (non project) sample is 2% lower than the baseline total average annual income.
The farm income in case of the treatment (project) sample is 23.5% higher than the baseline and control (non project) sample is 5.5% lower than baseline.
The table below depicts the average annual household income and its bifurcation into farm and non farm income. It also mentions the percentage difference of the treatment (project and control (non project) sample from baseline.
Sr. No. Particulars
Baseline* (Rs.) (Adjusted as per inflation
rate)
Treatment Sample# (Rs.) (End line 2017-
18)
Control sample# (Rs.)
(End line 2017-18)
1 Average Annual
Farmer Household Income
4,16,671 5,36,244 4,08,251
% difference from baseline
29% 2%
2 Average annual farm and non-farm income
Average annual farm
income
Average annual non-farm
income
Average annual farm
income
Average annual non-farm
income
Average annual farm
income
Average annual non-farm
income
3,62,597 54,075 4,50,697 85,547 3,45,060 63,191
% difference from baseline
24.3% 4.8%
Source: PwC Analysis and Baseline survey report *Average annual household income is calculated from the monthly average farm income reported directly and average annual non-farm income is calculated from non-farm income reported directly in the baseline survey and adjusted as per inflation rate of 14.9%. Average annual household income is the sum of the farm and non-farm income. #calculated as sum of income from crop sale through all channels and from livestock i.e. milk, eggs etc. and non-farm income as reported directed in the end line survey Source of Inflation rate: http://eaindustry.nic.in/home.asp
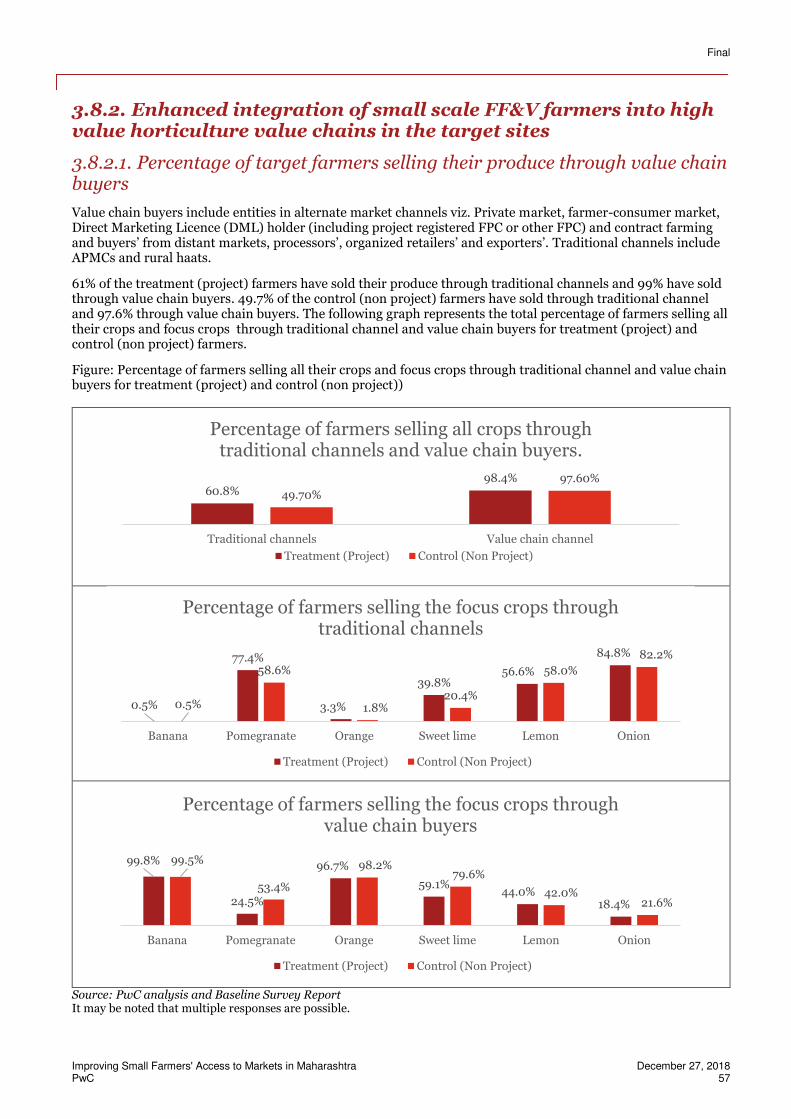
Final
Improving Small Farmers' Access to Markets in Maharashtra December 27, 2018 PwC 57
3.8.2. Enhanced integration of small scale FF&V farmers into high value horticulture value chains in the target sites
3.8.2.1. Percentage of target farmers selling their produce through value chain buyers
Value chain buyers include entities in alternate market channels viz. Private market, farmer-consumer market, Direct Marketing Licence (DML) holder (including project registered FPC or other FPC) and contract farming and buyers’ from distant markets, processors’, organized retailers’ and exporters’. Traditional channels include APMCs and rural haats.
61% of the treatment (project) farmers have sold their produce through traditional channels and 99% have sold through value chain buyers. 49.7% of the control (non project) farmers have sold through traditional channel and 97.6% through value chain buyers. The following graph represents the total percentage of farmers selling all their crops and focus crops through traditional channel and value chain buyers for treatment (project) and control (non project) farmers.
Figure: Percentage of farmers selling all their crops and focus crops through traditional channel and value chain buyers for treatment (project) and control (non project))
Source: PwC analysis and Baseline Survey Report It may be noted that multiple responses are possible.
60.8%98.4%
49.70%
97.60%
Traditional channels Value chain channel
Percentage of farmers selling all crops through traditional channels and value chain buyers.
Treatment (Project) Control (Non Project)
0.5%
77.4%
3.3%
39.8%56.6%
84.8%
0.5%
58.6%
1.8%20.4%
58.0%
82.2%
Banana Pomegranate Orange Sweet lime Lemon Onion
Percentage of farmers selling the focus crops through traditional channels
Treatment (Project) Control (Non Project)
99.8%
24.5%
96.7%
59.1%44.0%
18.4%
99.5%
53.4%
98.2%79.6%
42.0%21.6%
Banana Pomegranate Orange Sweet lime Lemon Onion
Percentage of farmers selling the focus crops through value chain buyers
Treatment (Project) Control (Non Project)
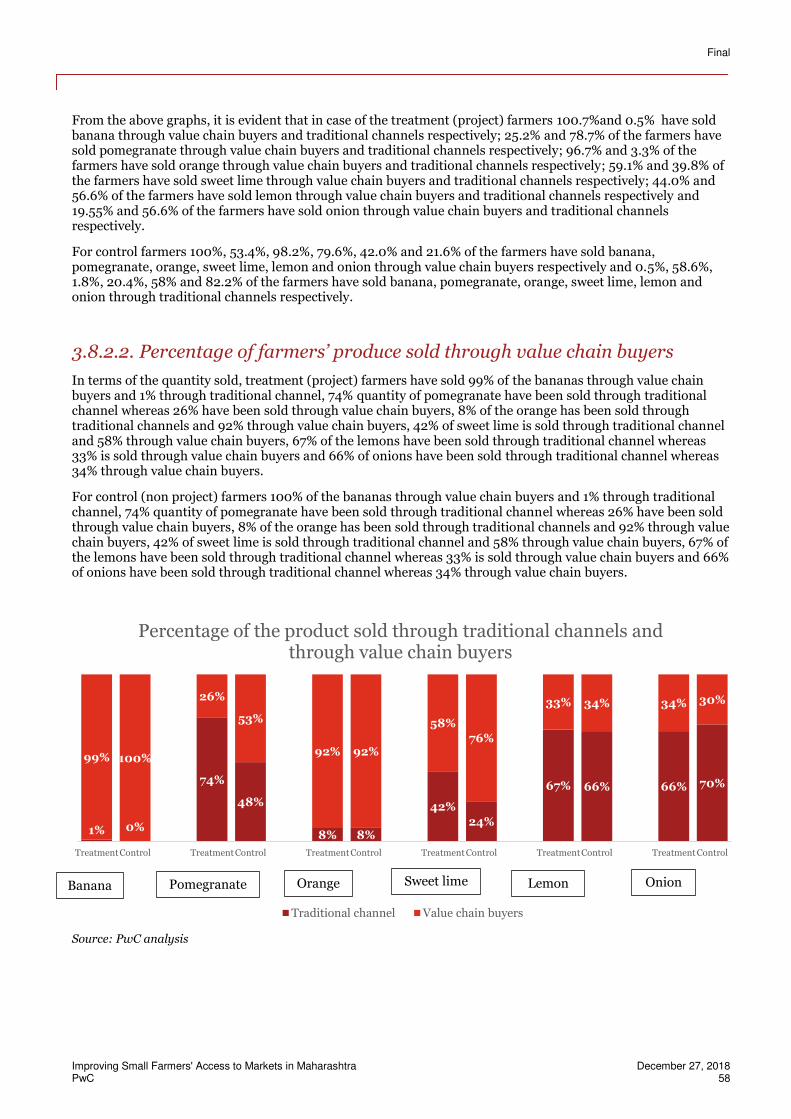
Final
Improving Small Farmers' Access to Markets in Maharashtra December 27, 2018 PwC 58
From the above graphs, it is evident that in case of the treatment (project) farmers 100.7%and 0.5% have sold banana through value chain buyers and traditional channels respectively; 25.2% and 78.7% of the farmers have sold pomegranate through value chain buyers and traditional channels respectively; 96.7% and 3.3% of the farmers have sold orange through value chain buyers and traditional channels respectively; 59.1% and 39.8% of the farmers have sold sweet lime through value chain buyers and traditional channels respectively; 44.0% and 56.6% of the farmers have sold lemon through value chain buyers and traditional channels respectively and 19.55% and 56.6% of the farmers have sold onion through value chain buyers and traditional channels respectively.
For control farmers 100%, 53.4%, 98.2%, 79.6%, 42.0% and 21.6% of the farmers have sold banana, pomegranate, orange, sweet lime, lemon and onion through value chain buyers respectively and 0.5%, 58.6%, 1.8%, 20.4%, 58% and 82.2% of the farmers have sold banana, pomegranate, orange, sweet lime, lemon and onion through traditional channels respectively.
3.8.2.2. Percentage of farmers’ produce sold through value chain buyers
In terms of the quantity sold, treatment (project) farmers have sold 99% of the bananas through value chain buyers and 1% through traditional channel, 74% quantity of pomegranate have been sold through traditional channel whereas 26% have been sold through value chain buyers, 8% of the orange has been sold through traditional channels and 92% through value chain buyers, 42% of sweet lime is sold through traditional channel and 58% through value chain buyers, 67% of the lemons have been sold through traditional channel whereas 33% is sold through value chain buyers and 66% of onions have been sold through traditional channel whereas 34% through value chain buyers.
For control (non project) farmers 100% of the bananas through value chain buyers and 1% through traditional channel, 74% quantity of pomegranate have been sold through traditional channel whereas 26% have been sold through value chain buyers, 8% of the orange has been sold through traditional channels and 92% through value chain buyers, 42% of sweet lime is sold through traditional channel and 58% through value chain buyers, 67% of the lemons have been sold through traditional channel whereas 33% is sold through value chain buyers and 66% of onions have been sold through traditional channel whereas 34% through value chain buyers.
Source: PwC analysis
1% 0%
74%
48%
8% 8%
42%
24%
67% 66% 66% 70%
99% 100%
26%
53%
92% 92%
58%
76%
33% 34% 34% 30%
Treatment Control Treatment Control Treatment Control Treatment Control Treatment Control Treatment Control
Percentage of the product sold through traditional channels and through value chain buyers
Traditional channel Value chain buyers
Banana Pomegranate Orange Sweet lime Lemon Onion
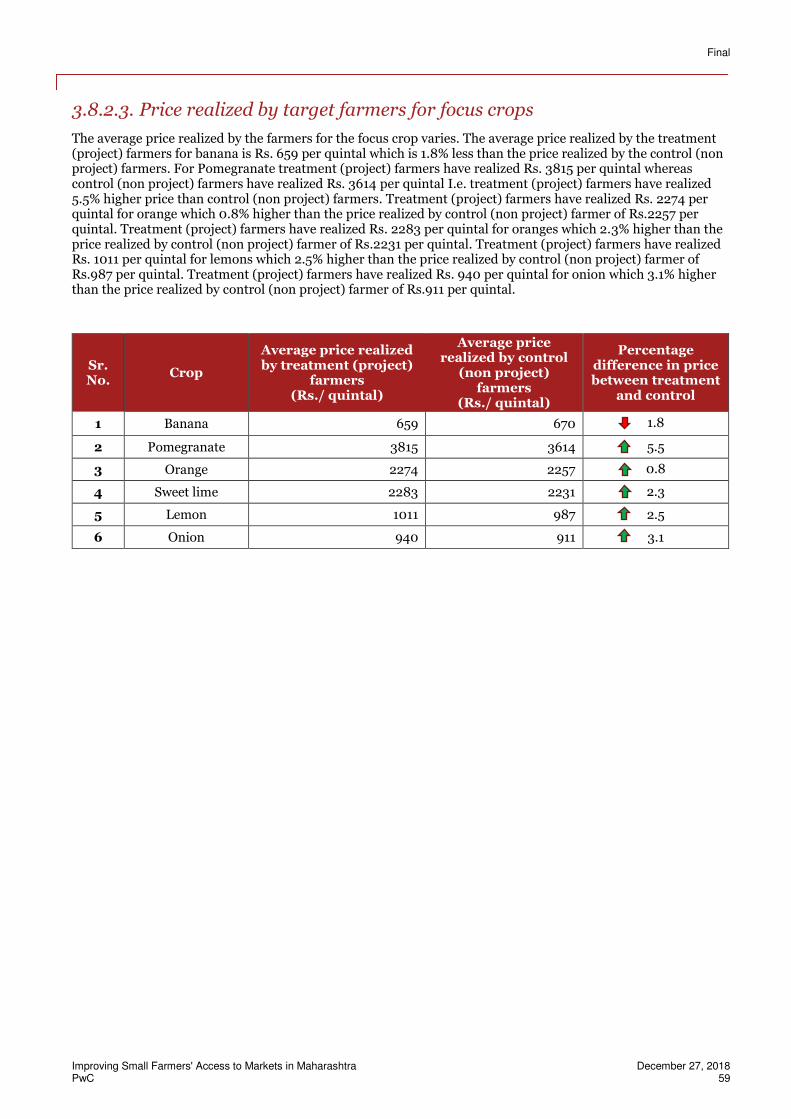
Final
Improving Small Farmers' Access to Markets in Maharashtra December 27, 2018 PwC 59
3.8.2.3. Price realized by target farmers for focus crops
The average price realized by the farmers for the focus crop varies. The average price realized by the treatment (project) farmers for banana is Rs. 659 per quintal which is 1.8% less than the price realized by the control (non project) farmers. For Pomegranate treatment (project) farmers have realized Rs. 3815 per quintal whereas control (non project) farmers have realized Rs. 3614 per quintal I.e. treatment (project) farmers have realized 5.5% higher price than control (non project) farmers. Treatment (project) farmers have realized Rs. 2274 per quintal for orange which 0.8% higher than the price realized by control (non project) farmer of Rs.2257 per quintal. Treatment (project) farmers have realized Rs. 2283 per quintal for oranges which 2.3% higher than the price realized by control (non project) farmer of Rs.2231 per quintal. Treatment (project) farmers have realized Rs. 1011 per quintal for lemons which 2.5% higher than the price realized by control (non project) farmer of Rs.987 per quintal. Treatment (project) farmers have realized Rs. 940 per quintal for onion which 3.1% higher than the price realized by control (non project) farmer of Rs.911 per quintal.
Sr. No.
Crop
Average price realized by treatment (project)
farmers (Rs./ quintal)
Average price realized by control
(non project) farmers
(Rs./ quintal)
Percentage difference in price between treatment
and control
1 Banana 659 670 1.8
2 Pomegranate 3815 3614 5.5
3 Orange 2274 2257 0.8
4 Sweet lime 2283 2231 2.3
5 Lemon 1011 987 2.5
6 Onion 940 911 3.1
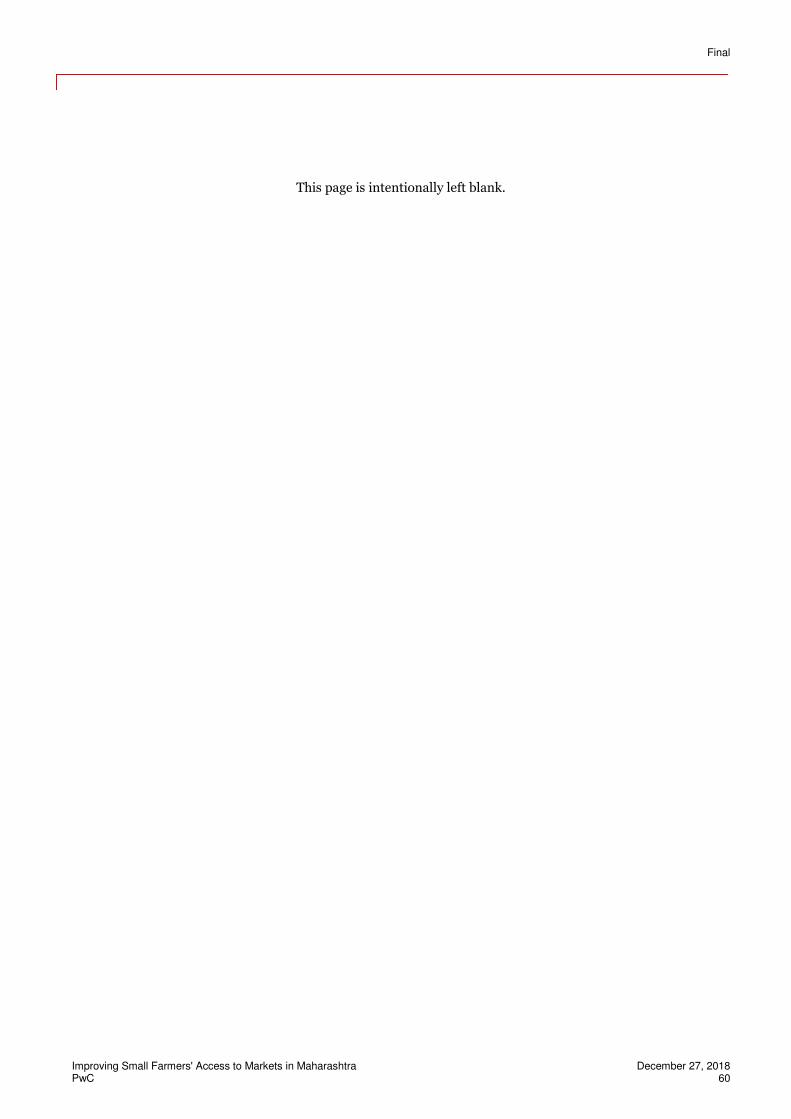
Final
Improving Small Farmers' Access to Markets in Maharashtra December 27, 2018 PwC 60
This page is intentionally left blank.
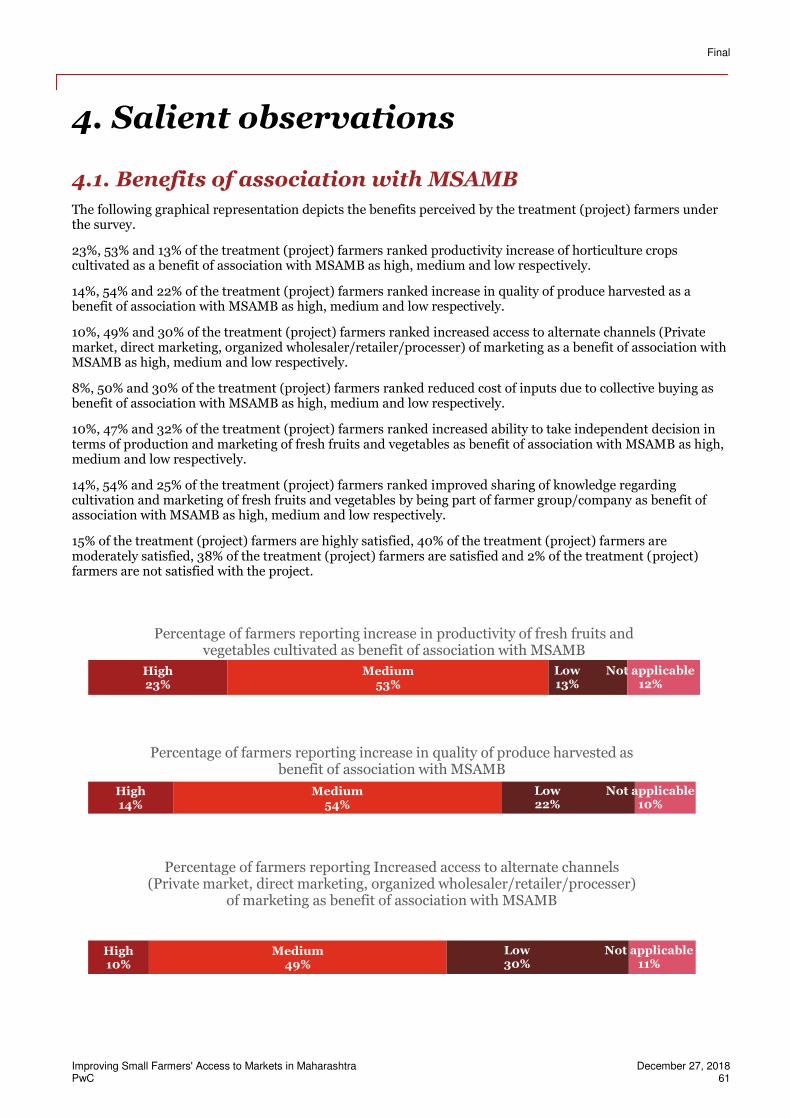
Final
Improving Small Farmers' Access to Markets in Maharashtra December 27, 2018 PwC 61
4. Salient observations
4.1. Benefits of association with MSAMB
The following graphical representation depicts the benefits perceived by the treatment (project) farmers under the survey.
23%, 53% and 13% of the treatment (project) farmers ranked productivity increase of horticulture crops cultivated as a benefit of association with MSAMB as high, medium and low respectively.
14%, 54% and 22% of the treatment (project) farmers ranked increase in quality of produce harvested as a benefit of association with MSAMB as high, medium and low respectively.
10%, 49% and 30% of the treatment (project) farmers ranked increased access to alternate channels (Private market, direct marketing, organized wholesaler/retailer/processer) of marketing as a benefit of association with MSAMB as high, medium and low respectively.
8%, 50% and 30% of the treatment (project) farmers ranked reduced cost of inputs due to collective buying as benefit of association with MSAMB as high, medium and low respectively.
10%, 47% and 32% of the treatment (project) farmers ranked increased ability to take independent decision in terms of production and marketing of fresh fruits and vegetables as benefit of association with MSAMB as high, medium and low respectively.
14%, 54% and 25% of the treatment (project) farmers ranked improved sharing of knowledge regarding cultivation and marketing of fresh fruits and vegetables by being part of farmer group/company as benefit of association with MSAMB as high, medium and low respectively.
15% of the treatment (project) farmers are highly satisfied, 40% of the treatment (project) farmers are moderately satisfied, 38% of the treatment (project) farmers are satisfied and 2% of the treatment (project) farmers are not satisfied with the project.
High23%
Medium53%
Low13%
Not applicable12%
Percentage of farmers reporting increase in productivity of fresh fruits and vegetables cultivated as benefit of association with MSAMB
High14%
Medium54%
Low22%
Not applicable10%
Percentage of farmers reporting increase in quality of produce harvested as benefit of association with MSAMB
High10%
Medium49%
Low30%
Not applicable11%
Percentage of farmers reporting Increased access to alternate channels (Private market, direct marketing, organized wholesaler/retailer/processer)
of marketing as benefit of association with MSAMB
Final
Improving Small Farmers' Access to Markets in Maharashtra December 27, 2018 PwC 62
4.2. Conclusion and Focused Group Discussion findings
On the basis of the findings and focused group discussions with the FPCs formed under the project, following were the salient observations:
a) Apart from the revolving fund information mentioned earlier in the report, following table depicts the fund allocation for infrastructure and its current status.
Sr. No.
FPC Infrastructure proposed Remarks
1 Deola Agro Producer Co. Ltd.
Collection Center (Onion & Vegetable), Transport Vehicle
Construction of Infrastructure completed. Proposal for final payment is received y GIU.
2 Shetmall Agri Producer Co. Ltd.
Marketing of Vegetables Construction of Infrastructure completed
3 Satpuda Farmer Producer Co. Ltd.
Collection Center(Banana) Construction is in process.
High8%
Medium50%
Low30%
Not applicable12%
Percentage of farmers reporting Reduced cost of inputs due to collective buying as benefit of association with MSAMB
High10%
Medium47%
Low32%
Not applicable11%
Percentage of farmers reporting Increased ability to take independent decision in terms of production and marketing of fresh fruits and vegetables as benefit of
association with MSAMB
High14%
Medium54%
Low25%
Not applicable8%
Percentage of farmers reporting Improved sharing of knowledge regarding cultivation and marketing of fresh fruits and vegetables by being part of farmer
group/company as benefit of association with MSAMB
Highly satisfied15%
Moderately satisfied40%
Satisfied38%
Not satisfied2%
Don't know/ can't answer
5%
Overall Satisfaction
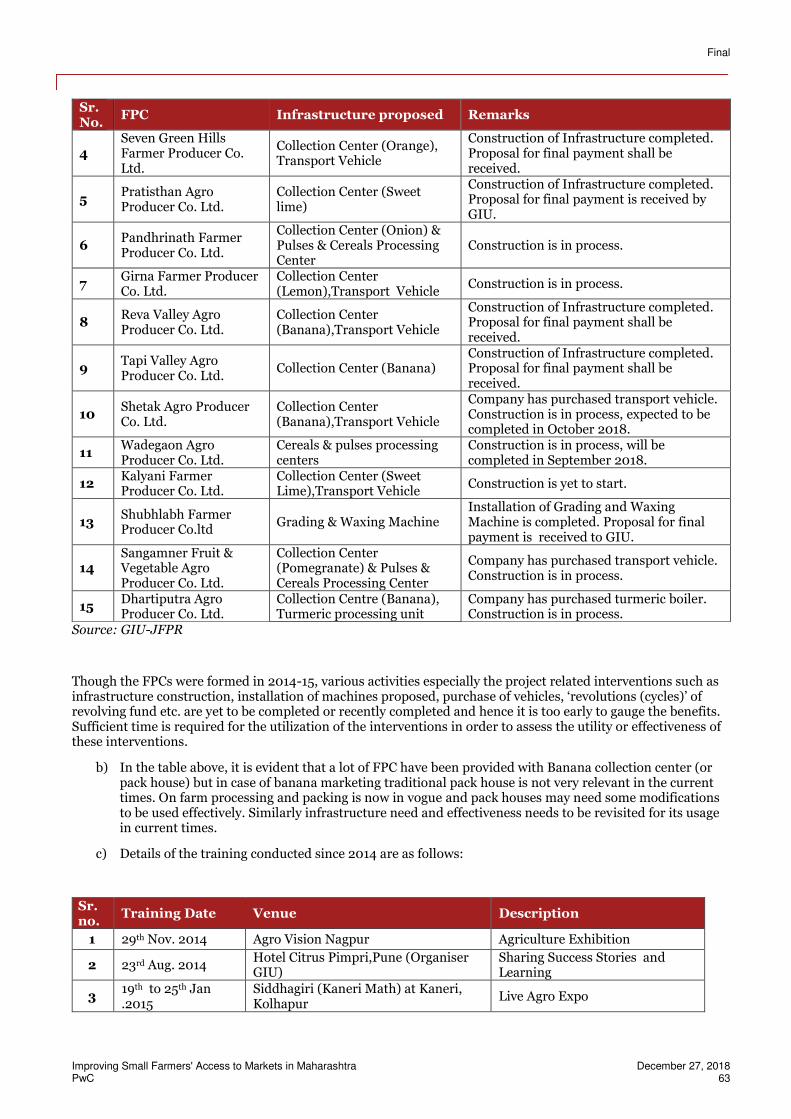
Final
Improving Small Farmers' Access to Markets in Maharashtra December 27, 2018 PwC 63
Sr. No.
FPC Infrastructure proposed Remarks
4 Seven Green Hills Farmer Producer Co. Ltd.
Collection Center (Orange), Transport Vehicle
Construction of Infrastructure completed. Proposal for final payment shall be received.
5 Pratisthan Agro Producer Co. Ltd.
Collection Center (Sweet lime)
Construction of Infrastructure completed. Proposal for final payment is received by GIU.
6 Pandhrinath Farmer Producer Co. Ltd.
Collection Center (Onion) & Pulses & Cereals Processing Center
Construction is in process.
7 Girna Farmer Producer Co. Ltd.
Collection Center (Lemon),Transport Vehicle
Construction is in process.
8 Reva Valley Agro Producer Co. Ltd.
Collection Center (Banana),Transport Vehicle
Construction of Infrastructure completed. Proposal for final payment shall be received.
9 Tapi Valley Agro Producer Co. Ltd.
Collection Center (Banana) Construction of Infrastructure completed. Proposal for final payment shall be received.
10 Shetak Agro Producer Co. Ltd.
Collection Center (Banana),Transport Vehicle
Company has purchased transport vehicle. Construction is in process, expected to be completed in October 2018.
11 Wadegaon Agro Producer Co. Ltd.
Cereals & pulses processing centers
Construction is in process, will be completed in September 2018.
12 Kalyani Farmer Producer Co. Ltd.
Collection Center (Sweet Lime),Transport Vehicle
Construction is yet to start.
13 Shubhlabh Farmer Producer Co.ltd
Grading & Waxing Machine Installation of Grading and Waxing Machine is completed. Proposal for final payment is received to GIU.
14 Sangamner Fruit & Vegetable Agro Producer Co. Ltd.
Collection Center (Pomegranate) & Pulses & Cereals Processing Center
Company has purchased transport vehicle. Construction is in process.
15 Dhartiputra Agro Producer Co. Ltd.
Collection Centre (Banana), Turmeric processing unit
Company has purchased turmeric boiler. Construction is in process.
Source: GIU-JFPR
Though the FPCs were formed in 2014-15, various activities especially the project related interventions such as infrastructure construction, installation of machines proposed, purchase of vehicles, ‘revolutions (cycles)’ of revolving fund etc. are yet to be completed or recently completed and hence it is too early to gauge the benefits. Sufficient time is required for the utilization of the interventions in order to assess the utility or effectiveness of these interventions.
b) In the table above, it is evident that a lot of FPC have been provided with Banana collection center (or pack house) but in case of banana marketing traditional pack house is not very relevant in the current times. On farm processing and packing is now in vogue and pack houses may need some modifications to be used effectively. Similarly infrastructure need and effectiveness needs to be revisited for its usage in current times.
c) Details of the training conducted since 2014 are as follows:
Sr. no.
Training Date Venue Description
1 29th Nov. 2014 Agro Vision Nagpur Agriculture Exhibition
2 23rd Aug. 2014 Hotel Citrus Pimpri,Pune (Organiser GIU)
Sharing Success Stories and Learning
3 19th to 25th Jan .2015
Siddhagiri (Kaneri Math) at Kaneri, Kolhapur
Live Agro Expo
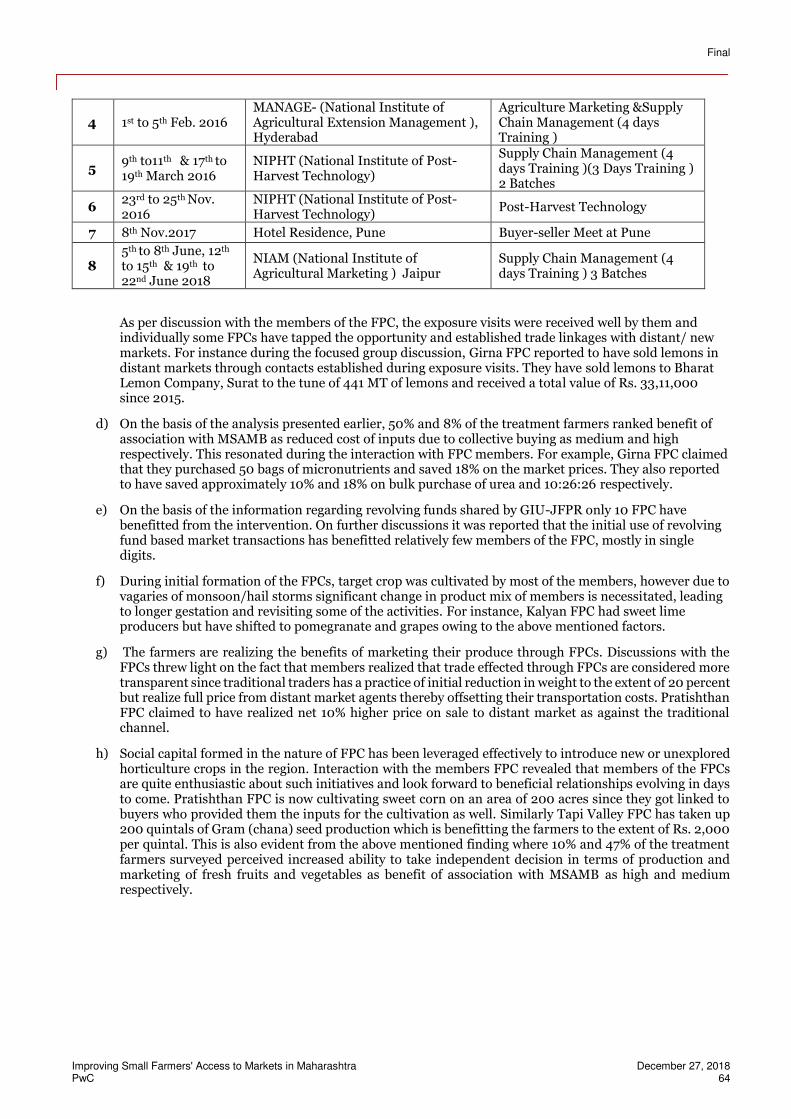
Final
Improving Small Farmers' Access to Markets in Maharashtra December 27, 2018 PwC 64
4 1st to 5th Feb. 2016 MANAGE- (National Institute of Agricultural Extension Management ), Hyderabad
Agriculture Marketing &Supply Chain Management (4 days Training )
5 9th to11th & 17th to 19th March 2016
NIPHT (National Institute of Post-Harvest Technology)
Supply Chain Management (4 days Training )(3 Days Training ) 2 Batches
6 23rd to 25th Nov. 2016
NIPHT (National Institute of Post-Harvest Technology)
Post-Harvest Technology
7 8th Nov.2017 Hotel Residence, Pune Buyer-seller Meet at Pune
8 5th to 8th June, 12th to 15th & 19th to 22nd June 2018
NIAM (National Institute of Agricultural Marketing ) Jaipur
Supply Chain Management (4 days Training ) 3 Batches
As per discussion with the members of the FPC, the exposure visits were received well by them and individually some FPCs have tapped the opportunity and established trade linkages with distant/ new markets. For instance during the focused group discussion, Girna FPC reported to have sold lemons in distant markets through contacts established during exposure visits. They have sold lemons to Bharat Lemon Company, Surat to the tune of 441 MT of lemons and received a total value of Rs. 33,11,000 since 2015.
d) On the basis of the analysis presented earlier, 50% and 8% of the treatment farmers ranked benefit of association with MSAMB as reduced cost of inputs due to collective buying as medium and high respectively. This resonated during the interaction with FPC members. For example, Girna FPC claimed that they purchased 50 bags of micronutrients and saved 18% on the market prices. They also reported to have saved approximately 10% and 18% on bulk purchase of urea and 10:26:26 respectively.
e) On the basis of the information regarding revolving funds shared by GIU-JFPR only 10 FPC have benefitted from the intervention. On further discussions it was reported that the initial use of revolving fund based market transactions has benefitted relatively few members of the FPC, mostly in single digits.
f) During initial formation of the FPCs, target crop was cultivated by most of the members, however due to vagaries of monsoon/hail storms significant change in product mix of members is necessitated, leading to longer gestation and revisiting some of the activities. For instance, Kalyan FPC had sweet lime producers but have shifted to pomegranate and grapes owing to the above mentioned factors.
g) The farmers are realizing the benefits of marketing their produce through FPCs. Discussions with the FPCs threw light on the fact that members realized that trade effected through FPCs are considered more transparent since traditional traders has a practice of initial reduction in weight to the extent of 20 percent but realize full price from distant market agents thereby offsetting their transportation costs. Pratishthan FPC claimed to have realized net 10% higher price on sale to distant market as against the traditional channel.
h) Social capital formed in the nature of FPC has been leveraged effectively to introduce new or unexplored horticulture crops in the region. Interaction with the members FPC revealed that members of the FPCs are quite enthusiastic about such initiatives and look forward to beneficial relationships evolving in days to come. Pratishthan FPC is now cultivating sweet corn on an area of 200 acres since they got linked to buyers who provided them the inputs for the cultivation as well. Similarly Tapi Valley FPC has taken up 200 quintals of Gram (chana) seed production which is benefitting the farmers to the extent of Rs. 2,000 per quintal. This is also evident from the above mentioned finding where 10% and 47% of the treatment farmers surveyed perceived increased ability to take independent decision in terms of production and marketing of fresh fruits and vegetables as benefit of association with MSAMB as high and medium respectively.
Final
Improving Small Farmers' Access to Markets in Maharashtra December 27, 2018 PwC 65
5. Comments from Workshop for information dissemination
During the workshop conducted for information dissemination with the representatives of the beneficiary Farmer Producer Companies (FPCs) and GIU-JFPR the objectives of the project, interventions undertaken and status of the interventions were discussed. The findings of the impact study were communicated to the beneficiaries which was followed by a question answer session and experience sharing by the FPC representatives. There were several successful experiences, challenges and suggestions shared by the FPC representatives that can be utilized in the future.
Revolving fund serving as working capital but there is need to adjust the repayment tenure to suit the season of the focus crop of the FPC
The project has provided hand holding in the Farmer Producer Company (FPC) formation in the form of revolving fund with an objective to meet the financial needs of the FPCs. FPCs have to collect and contribute an equal amount of Revolving fund for any activity like collective purchase, operation of post-harvest infrastructure and collective marketing activities and pay back the fund in time and with interest charges so that the principles of thrift and financial discipline are inculcated among the FPCs. The FPCs have collectively resonated that the intervention has been able to fulfill the objective to meet the working capital needs and is important for the progress of the FPC but the FPC representatives suggested that the repayment tenure of revolving fund be increased to suit the season of the focus crop in order to maintain continuity in the flow of funds and ensuring more cycles of trade in a season.
Transport subsidy as a game changer in accessing new and distant markets
Major advantages of various interventions undertaken in the project were well received and appreciated by the FPCs. FPC representatives reported that the transport subsidy has been a game changer in the way they conduct their business. They have been able to establish new linkages in different markets including distant markets and exports and are realizing higher price for the produce.
Packaging subsidy as a facilitator to realizing higher price for the produce
Another intervention, packaging subsidy has also reaped benefits to the FPCs. Banana producing FPC representatives quoted that they were able to sell medium grade banana at a higher price of approximately Rs. 1500 per tonne on packing into boxes and selling in distant markets. Though packaging for sale in distant markets and for exports have been undertaken by certain FPCs, there has been a suggestion to make the facility flexible for example, usage of wire mesh instead of corrugated board boxes maybe allowed.
Exposure visit as a source of information and increase in knowledge with respect to post harvest practices and marketing
Exposure visits organized under the project have proved to be enriching for the FPCs under various facets such as market linkage, mechanization in post-harvest handling, marketing and production activities across geographies such as processed fruits and vegetables amongst others. On the basis of the information gathered during the exposure visits, an orange cultivating FPC has purchased a waxing machine worth Rs. 20 lakhs with a capacity of 5 metric tonne per hour. They have researched the price for the produce and quoted to receive a premium of approximately 2 per cent to 4 per cent on sale of waxed orange as compared to non-waxed orange. One crate of 20 kilogram of non-waxed orange fetch them a price of Rs. 250 whereas one crate waxed orange will fetch them Rs. 260 -270 and expect to recover the capital cost in a span of 1 year only.
Need for dynamic, well informed management/ manager for marketing and decision making for sale and undertaking market research
Some FPC representatives also emphasized the need for undertaking market research and shared marketing techniques in order to identify the potential market and time for sale to reap maximum profits. In order to facilitate effective marketing techniques or tactics and decision making for sale, there is a need of a dynamic, well informed management or manager for the FPCs. The proactive role of directors of FPCs is of utmost importance in this respect as decisions have to be taken on the spot or in a short span of time.
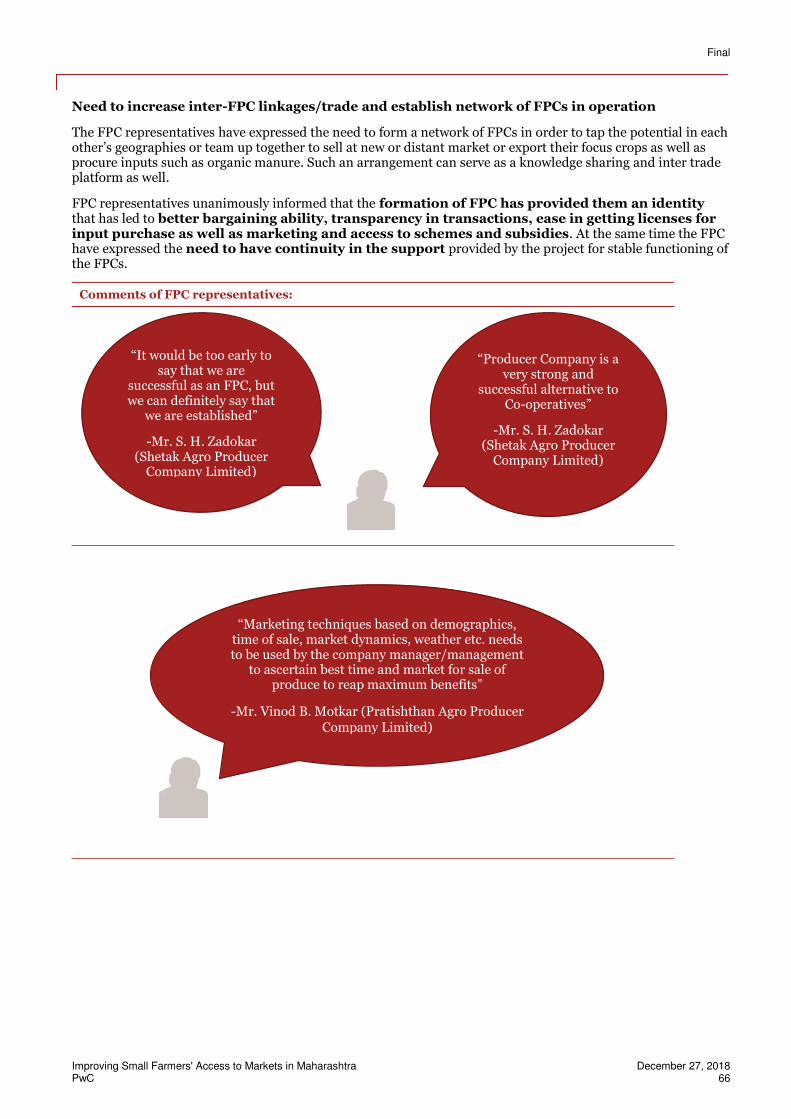
Final
Improving Small Farmers' Access to Markets in Maharashtra December 27, 2018 PwC 66
Need to increase inter-FPC linkages/trade and establish network of FPCs in operation
The FPC representatives have expressed the need to form a network of FPCs in order to tap the potential in each other’s geographies or team up together to sell at new or distant market or export their focus crops as well as procure inputs such as organic manure. Such an arrangement can serve as a knowledge sharing and inter trade platform as well.
FPC representatives unanimously informed that the formation of FPC has provided them an identity that has led to better bargaining ability, transparency in transactions, ease in getting licenses for input purchase as well as marketing and access to schemes and subsidies. At the same time the FPC have expressed the need to have continuity in the support provided by the project for stable functioning of the FPCs.
Comments of FPC representatives:
“It would be too early to say that we are
successful as an FPC, but we can definitely say that
we are established”
-Mr. S. H. Zadokar (Shetak Agro Producer
Company Limited)
“Marketing techniques based on demographics, time of sale, market dynamics, weather etc. needs to be used by the company manager/management
to ascertain best time and market for sale of produce to reap maximum benefits”
-Mr. Vinod B. Motkar (Pratishthan Agro Producer Company Limited)
“Producer Company is a very strong and
successful alternative to Co-operatives”
-Mr. S. H. Zadokar (Shetak Agro Producer
Company Limited)
Final
Improving Small Farmers' Access to Markets in Maharashtra December 27, 2018 PwC 67
Comments of FPC representatives:
“Earlier, due to lack of awareness of marketing opportunities farmers used to vent out their anger towards the system during glut in the market, by disposing off their produce on the roads leading to immense losses. Post the
formation of FPCs, aggregation of produce, access to distant or alternative market channels and awareness regarding
marketing and post-harvest techniques has led to reduction in such instances”
Mr. Jadhav (Deola Agro Producer Company Limited)
“The project has created awareness regarding various marketing channels including exports. There is immense potential in sale of certain quantity of produce through
retail channels such as weekly market and rural haats. These channels possess the advantage of higher price as compared to the wholesale markets and elimination of intermediaries
in the chain of sale”
-Mr. Kedar G D (Shetmal Agri producer Company Limited)
Final
Improving Small Farmers' Access to Markets in Maharashtra December 27, 2018 PwC 68
This page is intentionally left blank.
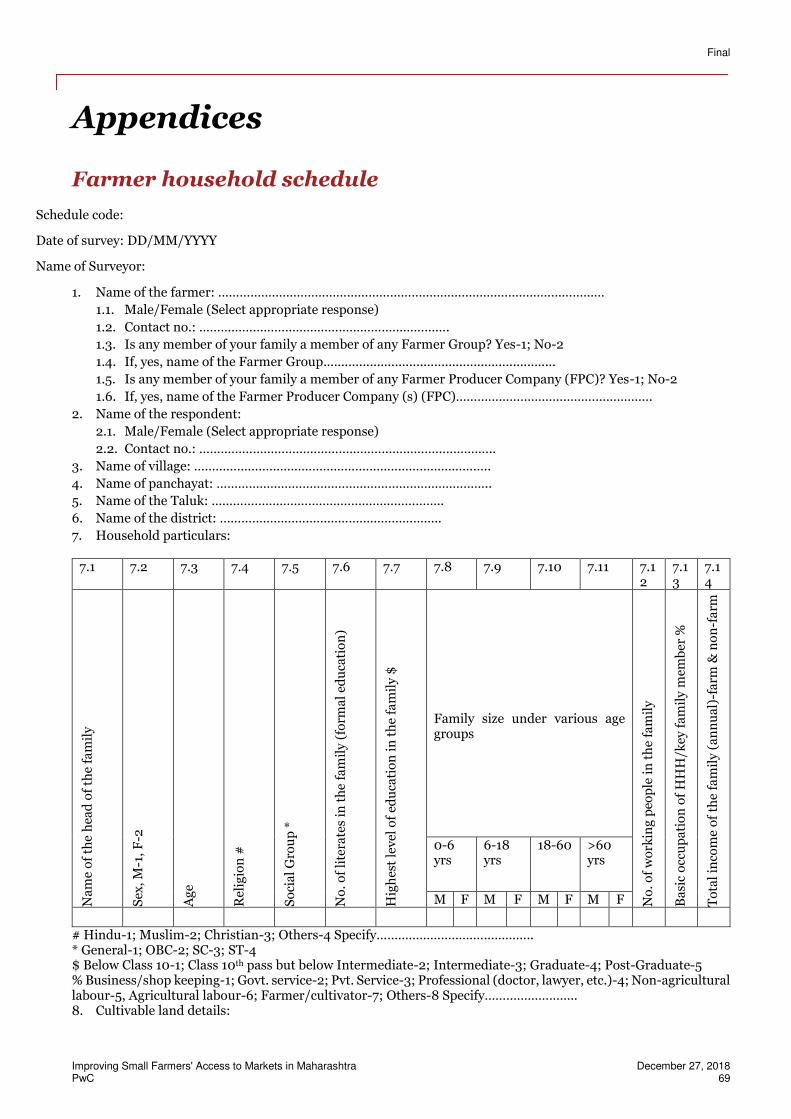
Final
Improving Small Farmers' Access to Markets in Maharashtra December 27, 2018 PwC 69
Appendices
Farmer household schedule
Schedule code:
Date of survey: DD/MM/YYYY
Name of Surveyor:
1. Name of the farmer: ………………………………………………………………………………………………
1.1. Male/Female (Select appropriate response)
1.2. Contact no.: ……………………………………………………………. 1.3. Is any member of your family a member of any Farmer Group? Yes-1; No-2
1.4. If, yes, name of the Farmer Group.................................................................
1.5. Is any member of your family a member of any Farmer Producer Company (FPC)? Yes-1; No-2
1.6. If, yes, name of the Farmer Producer Company (s) (FPC)………………………………………………. 2. Name of the respondent:
2.1. Male/Female (Select appropriate response)
2.2. Contact no.: ……………………………………………………………………….. 3. Name of village: ……………………………………………………………………….. 4. Name of panchayat: ………………………………………………………………….. 5. Name of the Taluk: ……………………………………………………….. 6. Name of the district: …………………………………………………….. 7. Household particulars:
7.1 7.2 7.3 7.4 7.5 7.6 7.7 7.8 7.9 7.10 7.11 7.12
7.13
7.14
Na
me
of
the
hea
d o
f th
e fa
mil
y
Sex
, M
-1,
F-2
A
ge
R
elig
ion
#
So
cia
l G
rou
p *
N
o.
of
lite
rate
s in
th
e f
am
ily
(fo
rma
l ed
uca
tio
n)
Hig
hes
t le
vel
of
edu
cati
on
in
th
e fa
mil
y $
Family size under various age groups
No
. o
f w
ork
ing
peo
ple
in
th
e fa
mil
y
Ba
sic
occ
up
ati
on
of
HH
H/k
ey f
am
ily
mem
be
r %
To
tal
inco
me
of
the
fa
mil
y (
an
nu
al)
-fa
rm &
no
n-f
arm
0-6 yrs
6-18 yrs
18-60 >60 yrs
M F M F M F M F
# Hindu-1; Muslim-2; Christian-3; Others-4 Specify…………………………………….. * General-1; OBC-2; SC-3; ST-4 $ Below Class 10-1; Class 10th pass but below Intermediate-2; Intermediate-3; Graduate-4; Post-Graduate-5 % Business/shop keeping-1; Govt. service-2; Pvt. Service-3; Professional (doctor, lawyer, etc.)-4; Non-agricultural labour-5, Agricultural labour-6; Farmer/cultivator-7; Others-8 Specify…………………….. 8. Cultivable land details:
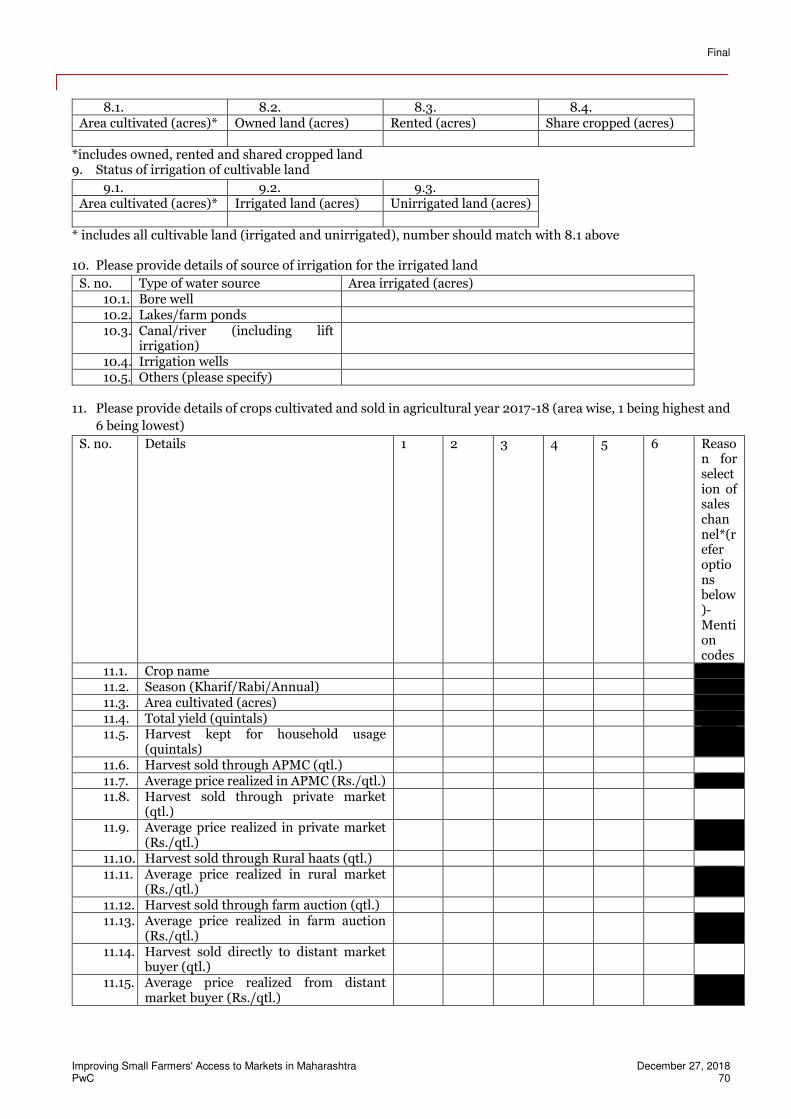
Final
Improving Small Farmers' Access to Markets in Maharashtra December 27, 2018 PwC 70
8.1. 8.2. 8.3. 8.4. Area cultivated (acres)* Owned land (acres) Rented (acres) Share cropped (acres)
*includes owned, rented and shared cropped land 9. Status of irrigation of cultivable land
9.1. 9.2. 9.3. Area cultivated (acres)* Irrigated land (acres) Unirrigated land (acres)
* includes all cultivable land (irrigated and unirrigated), number should match with 8.1 above 10. Please provide details of source of irrigation for the irrigated land
S. no. Type of water source Area irrigated (acres) 10.1. Bore well 10.2. Lakes/farm ponds 10.3. Canal/river (including lift
irrigation)
10.4. Irrigation wells 10.5. Others (please specify)
11. Please provide details of crops cultivated and sold in agricultural year 2017-18 (area wise, 1 being highest and
6 being lowest)
S. no. Details 1 2 3 4 5 6 Reason for selection of sales channel*(refer options below)-Mention codes
11.1. Crop name 11.2. Season (Kharif/Rabi/Annual) 11.3. Area cultivated (acres) 11.4. Total yield (quintals) 11.5. Harvest kept for household usage
(quintals)
11.6. Harvest sold through APMC (qtl.) 11.7. Average price realized in APMC (Rs./qtl.) 11.8. Harvest sold through private market
(qtl.)
11.9. Average price realized in private market (Rs./qtl.)
11.10. Harvest sold through Rural haats (qtl.) 11.11. Average price realized in rural market
(Rs./qtl.)
11.12. Harvest sold through farm auction (qtl.) 11.13. Average price realized in farm auction
(Rs./qtl.)
11.14. Harvest sold directly to distant market buyer (qtl.)
11.15. Average price realized from distant market buyer (Rs./qtl.)
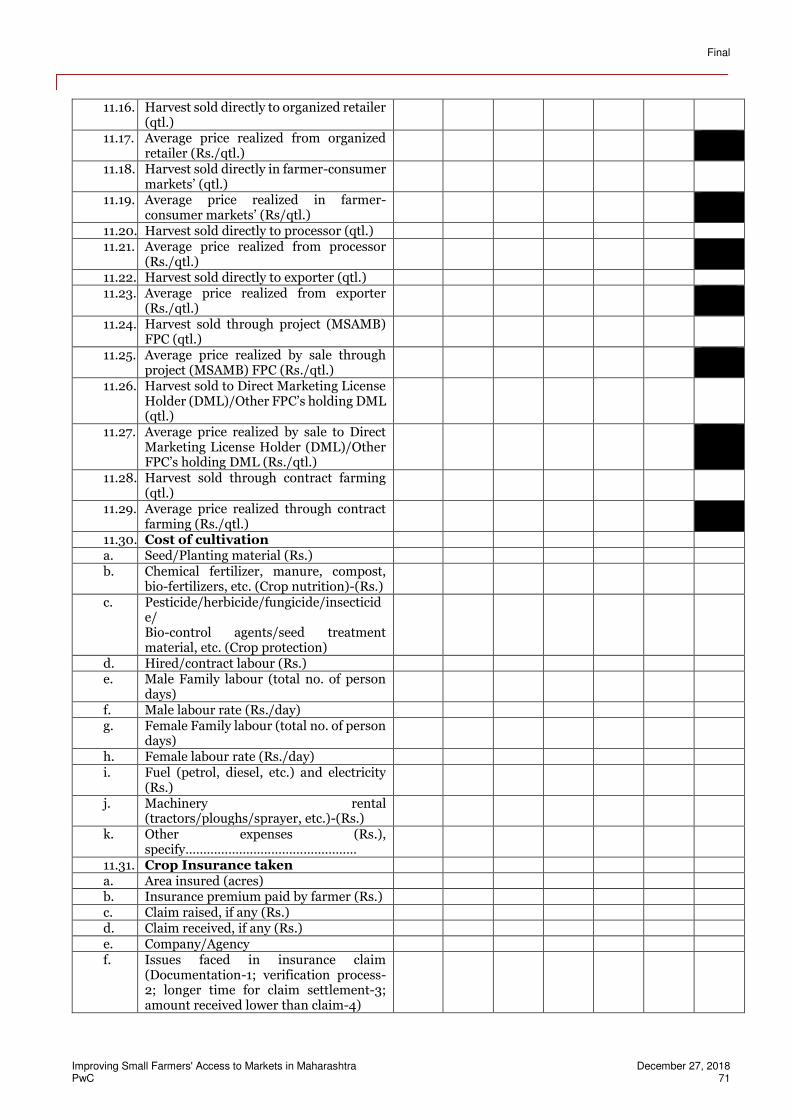
Final
Improving Small Farmers' Access to Markets in Maharashtra December 27, 2018 PwC 71
11.16. Harvest sold directly to organized retailer (qtl.)
11.17. Average price realized from organized retailer (Rs./qtl.)
11.18. Harvest sold directly in farmer-consumer markets’ (qtl.)
11.19. Average price realized in farmer-consumer markets’ (Rs/qtl.)
11.20. Harvest sold directly to processor (qtl.) 11.21. Average price realized from processor
(Rs./qtl.)
11.22. Harvest sold directly to exporter (qtl.) 11.23. Average price realized from exporter
(Rs./qtl.)
11.24. Harvest sold through project (MSAMB) FPC (qtl.)
11.25. Average price realized by sale through project (MSAMB) FPC (Rs./qtl.)
11.26. Harvest sold to Direct Marketing License Holder (DML)/Other FPC’s holding DML (qtl.)
11.27. Average price realized by sale to Direct Marketing License Holder (DML)/Other FPC’s holding DML (Rs./qtl.)
11.28. Harvest sold through contract farming (qtl.)
11.29. Average price realized through contract farming (Rs./qtl.)
11.30. Cost of cultivation a. Seed/Planting material (Rs.) b. Chemical fertilizer, manure, compost,
bio-fertilizers, etc. (Crop nutrition)-(Rs.)
c. Pesticide/herbicide/fungicide/insecticide/ Bio-control agents/seed treatment material, etc. (Crop protection)
d. Hired/contract labour (Rs.) e. Male Family labour (total no. of person
days)
f. Male labour rate (Rs./day) g. Female Family labour (total no. of person
days)
h. Female labour rate (Rs./day) i. Fuel (petrol, diesel, etc.) and electricity
(Rs.)
j. Machinery rental (tractors/ploughs/sprayer, etc.)-(Rs.)
k. Other expenses (Rs.), specify…………………………………………
11.31. Crop Insurance taken a. Area insured (acres) b. Insurance premium paid by farmer (Rs.) c. Claim raised, if any (Rs.) d. Claim received, if any (Rs.) e. Company/Agency f. Issues faced in insurance claim
(Documentation-1; verification process-2; longer time for claim settlement-3; amount received lower than claim-4)
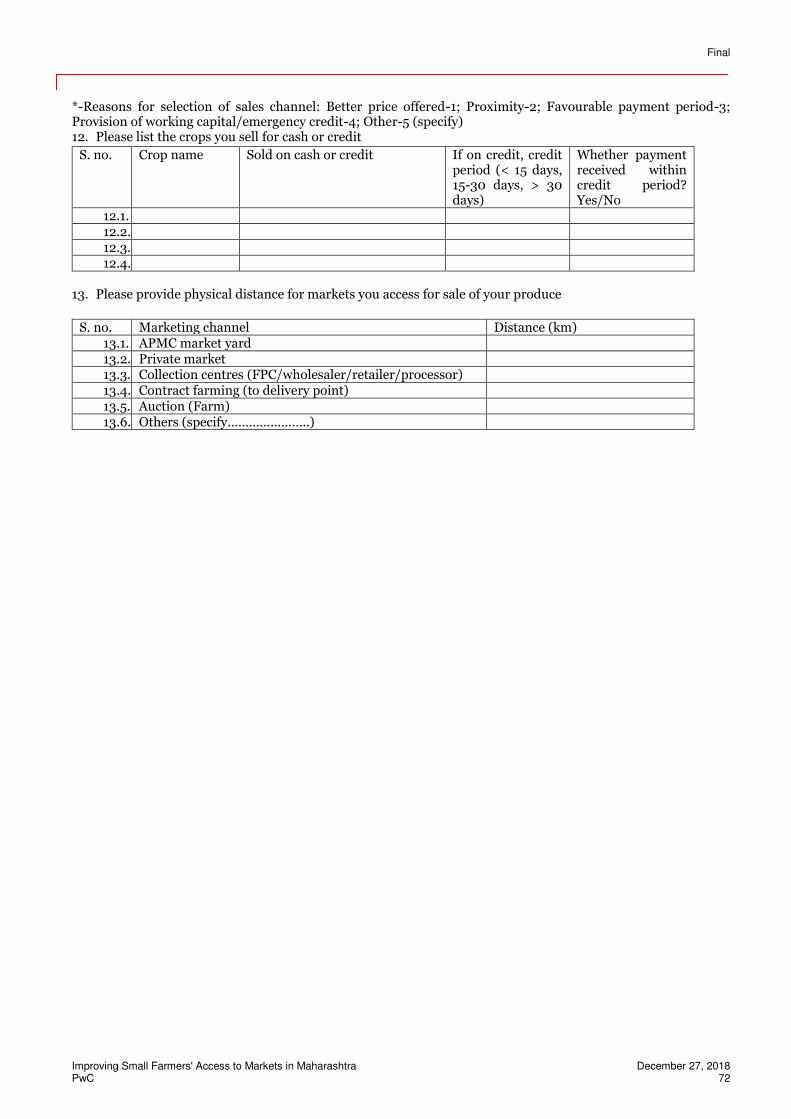
Final
Improving Small Farmers' Access to Markets in Maharashtra December 27, 2018 PwC 72
*-Reasons for selection of sales channel: Better price offered-1; Proximity-2; Favourable payment period-3; Provision of working capital/emergency credit-4; Other-5 (specify) 12. Please list the crops you sell for cash or credit
S. no. Crop name Sold on cash or credit If on credit, credit period (< 15 days, 15-30 days, > 30 days)
Whether payment received within credit period? Yes/No
12.1. 12.2. 12.3. 12.4.
13. Please provide physical distance for markets you access for sale of your produce
S. no. Marketing channel Distance (km)
13.1. APMC market yard 13.2. Private market 13.3. Collection centres (FPC/wholesaler/retailer/processor) 13.4. Contract farming (to delivery point) 13.5. Auction (Farm) 13.6. Others (specify…………………..)
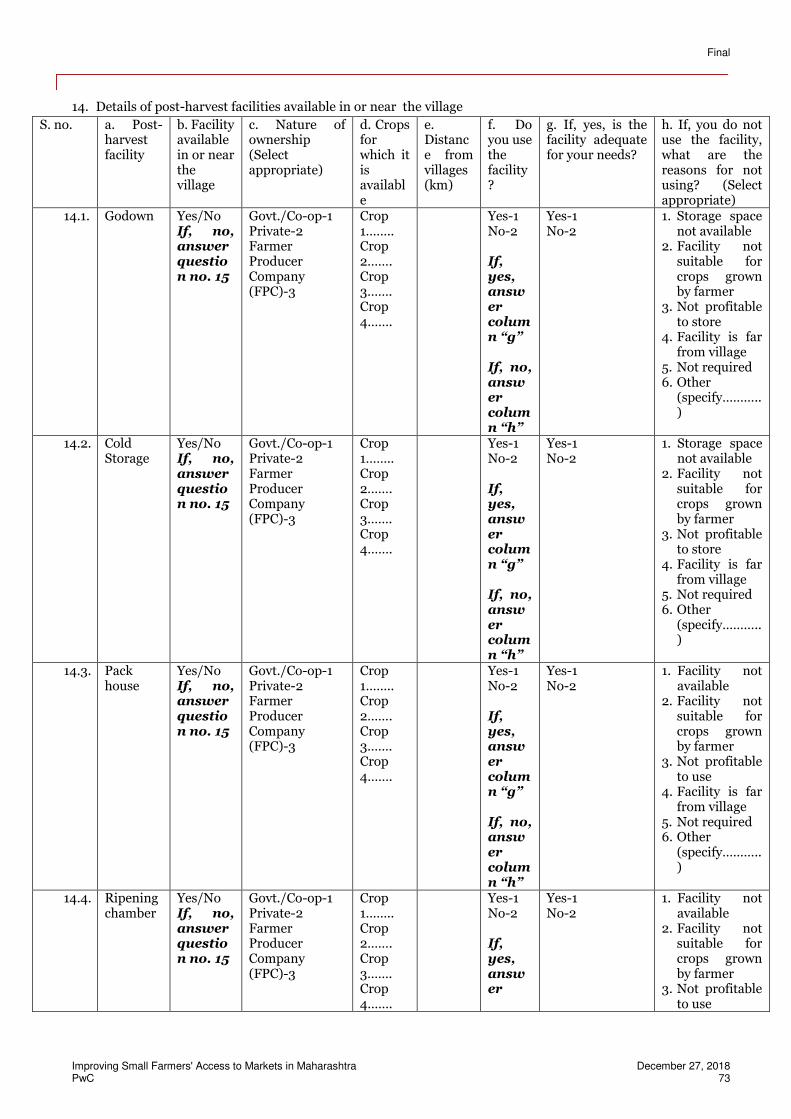
Final
Improving Small Farmers' Access to Markets in Maharashtra December 27, 2018 PwC 73
14. Details of post-harvest facilities available in or near the village
S. no. a. Post-harvest facility
b. Facility available in or near the village
c. Nature of ownership (Select appropriate)
d. Crops for which it is available
e. Distance from villages (km)
f. Do you use the facility?
g. If, yes, is the facility adequate for your needs?
h. If, you do not use the facility, what are the reasons for not using? (Select appropriate)
14.1. Godown Yes/No If, no, answer question no. 15
Govt./Co-op-1 Private-2 Farmer Producer Company (FPC)-3
Crop 1…….. Crop 2……. Crop 3……. Crop 4…….
Yes-1 No-2 If, yes, answer column “g” If, no, answer column “h”
Yes-1 No-2
1. Storage space not available
2. Facility not suitable for crops grown by farmer
3. Not profitable to store
4. Facility is far from village
5. Not required 6. Other
(specify………..)
14.2. Cold Storage
Yes/No If, no, answer question no. 15
Govt./Co-op-1 Private-2 Farmer Producer Company (FPC)-3
Crop 1…….. Crop 2……. Crop 3……. Crop 4…….
Yes-1 No-2 If, yes, answer column “g” If, no, answer column “h”
Yes-1 No-2
1. Storage space not available
2. Facility not suitable for crops grown by farmer
3. Not profitable to store
4. Facility is far from village
5. Not required 6. Other
(specify………..)
14.3. Pack house
Yes/No If, no, answer question no. 15
Govt./Co-op-1 Private-2 Farmer Producer Company (FPC)-3
Crop 1…….. Crop 2……. Crop 3……. Crop 4…….
Yes-1 No-2 If, yes, answer column “g” If, no, answer column “h”
Yes-1 No-2
1. Facility not available
2. Facility not suitable for crops grown by farmer
3. Not profitable to use
4. Facility is far from village
5. Not required 6. Other
(specify………..)
14.4. Ripening chamber
Yes/No If, no, answer question no. 15
Govt./Co-op-1 Private-2 Farmer Producer Company (FPC)-3
Crop 1…….. Crop 2……. Crop 3……. Crop 4…….
Yes-1 No-2 If, yes, answer
Yes-1 No-2
1. Facility not available
2. Facility not suitable for crops grown by farmer
3. Not profitable to use
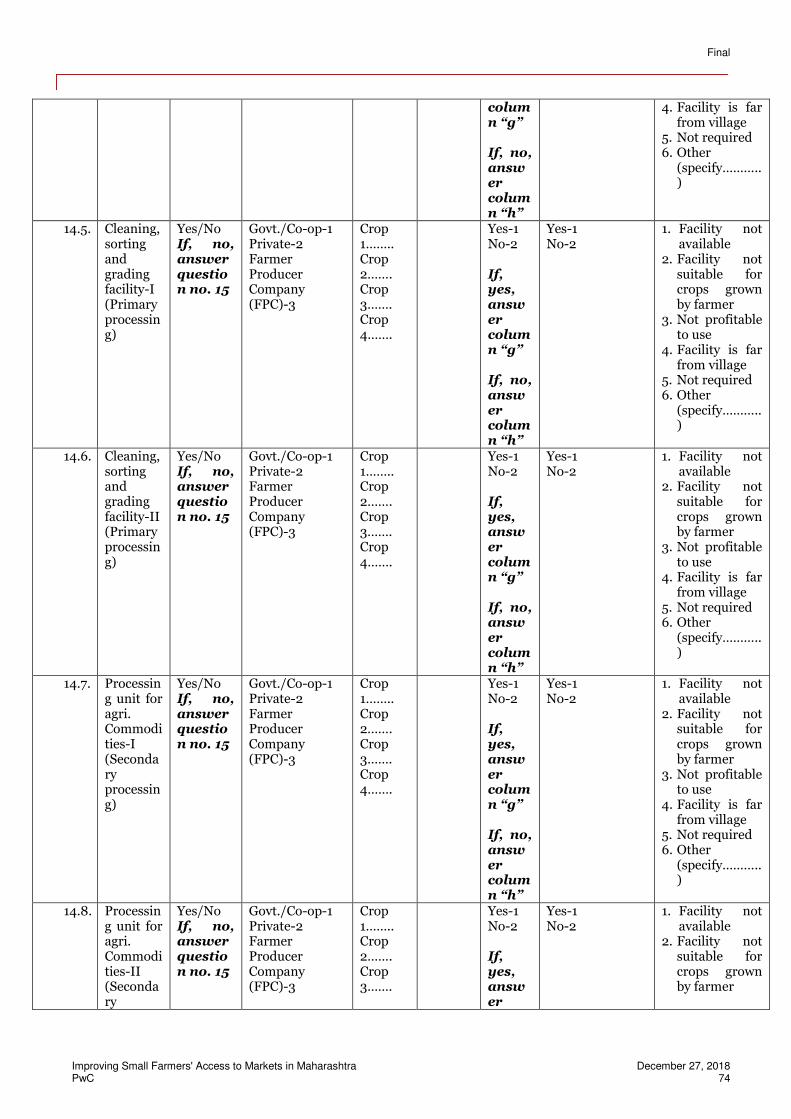
Final
Improving Small Farmers' Access to Markets in Maharashtra December 27, 2018 PwC 74
column “g” If, no, answer column “h”
4. Facility is far from village
5. Not required 6. Other
(specify………..)
14.5. Cleaning, sorting and grading facility-I (Primary processing)
Yes/No If, no, answer question no. 15
Govt./Co-op-1 Private-2 Farmer Producer Company (FPC)-3
Crop 1…….. Crop 2……. Crop 3……. Crop 4…….
Yes-1 No-2 If, yes, answer column “g” If, no, answer column “h”
Yes-1 No-2
1. Facility not available
2. Facility not suitable for crops grown by farmer
3. Not profitable to use
4. Facility is far from village
5. Not required 6. Other
(specify………..)
14.6. Cleaning, sorting and grading facility-II (Primary processing)
Yes/No If, no, answer question no. 15
Govt./Co-op-1 Private-2 Farmer Producer Company (FPC)-3
Crop 1…….. Crop 2……. Crop 3……. Crop 4…….
Yes-1 No-2 If, yes, answer column “g” If, no, answer column “h”
Yes-1 No-2
1. Facility not available
2. Facility not suitable for crops grown by farmer
3. Not profitable to use
4. Facility is far from village
5. Not required 6. Other
(specify………..)
14.7. Processing unit for agri. Commodities-I (Secondary processing)
Yes/No If, no, answer question no. 15
Govt./Co-op-1 Private-2 Farmer Producer Company (FPC)-3
Crop 1…….. Crop 2……. Crop 3……. Crop 4…….
Yes-1 No-2 If, yes, answer column “g” If, no, answer column “h”
Yes-1 No-2
1. Facility not available
2. Facility not suitable for crops grown by farmer
3. Not profitable to use
4. Facility is far from village
5. Not required 6. Other
(specify………..)
14.8. Processing unit for agri. Commodities-II (Secondary
Yes/No If, no, answer question no. 15
Govt./Co-op-1 Private-2 Farmer Producer Company (FPC)-3
Crop 1…….. Crop 2……. Crop 3…….
Yes-1 No-2 If, yes, answer
Yes-1 No-2
1. Facility not available
2. Facility not suitable for crops grown by farmer
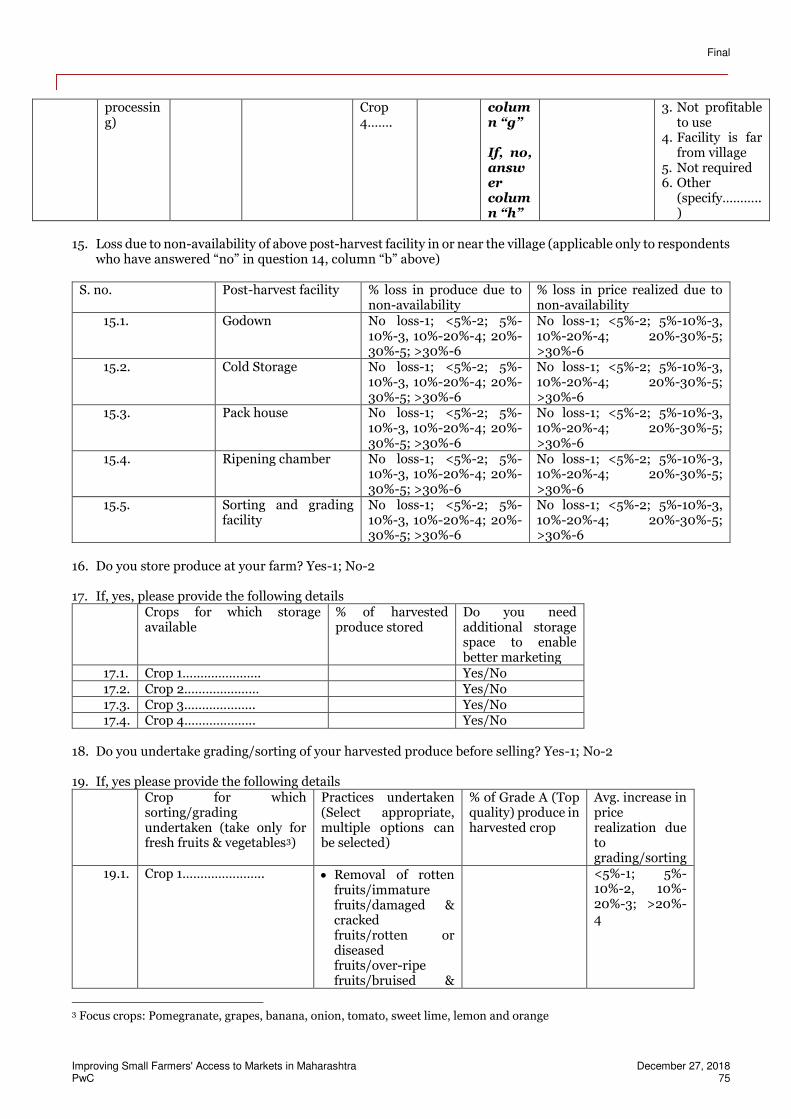
Final
Improving Small Farmers' Access to Markets in Maharashtra December 27, 2018 PwC 75
processing)
Crop 4…….
column “g” If, no, answer column “h”
3. Not profitable to use
4. Facility is far from village
5. Not required 6. Other
(specify………..)
15. Loss due to non-availability of above post-harvest facility in or near the village (applicable only to respondents
who have answered “no” in question 14, column “b” above)
S. no. Post-harvest facility % loss in produce due to non-availability
% loss in price realized due to non-availability
15.1. Godown No loss-1; <5%-2; 5%-10%-3, 10%-20%-4; 20%-30%-5; >30%-6
No loss-1; <5%-2; 5%-10%-3, 10%-20%-4; 20%-30%-5; >30%-6
15.2. Cold Storage No loss-1; <5%-2; 5%-10%-3, 10%-20%-4; 20%-30%-5; >30%-6
No loss-1; <5%-2; 5%-10%-3, 10%-20%-4; 20%-30%-5; >30%-6
15.3. Pack house No loss-1; <5%-2; 5%-10%-3, 10%-20%-4; 20%-30%-5; >30%-6
No loss-1; <5%-2; 5%-10%-3, 10%-20%-4; 20%-30%-5; >30%-6
15.4. Ripening chamber No loss-1; <5%-2; 5%-10%-3, 10%-20%-4; 20%-30%-5; >30%-6
No loss-1; <5%-2; 5%-10%-3, 10%-20%-4; 20%-30%-5; >30%-6
15.5. Sorting and grading facility
No loss-1; <5%-2; 5%-10%-3, 10%-20%-4; 20%-30%-5; >30%-6
No loss-1; <5%-2; 5%-10%-3, 10%-20%-4; 20%-30%-5; >30%-6
16. Do you store produce at your farm? Yes-1; No-2
17. If, yes, please provide the following details
Crops for which storage available
% of harvested produce stored
Do you need additional storage space to enable better marketing
17.1. Crop 1…………………. Yes/No 17.2. Crop 2………………… Yes/No 17.3. Crop 3……………….. Yes/No 17.4. Crop 4……………….. Yes/No
18. Do you undertake grading/sorting of your harvested produce before selling? Yes-1; No-2
19. If, yes please provide the following details
Crop for which sorting/grading undertaken (take only for fresh fruits & vegetables3)
Practices undertaken (Select appropriate, multiple options can be selected)
% of Grade A (Top quality) produce in harvested crop
Avg. increase in price realization due to grading/sorting
19.1. Crop 1………………….. Removal of rotten fruits/immature fruits/damaged & cracked fruits/rotten or diseased fruits/over-ripe fruits/bruised &
<5%-1; 5%-10%-2, 10%-20%-3; >20%-4
3 Focus crops: Pomegranate, grapes, banana, onion, tomato, sweet lime, lemon and orange
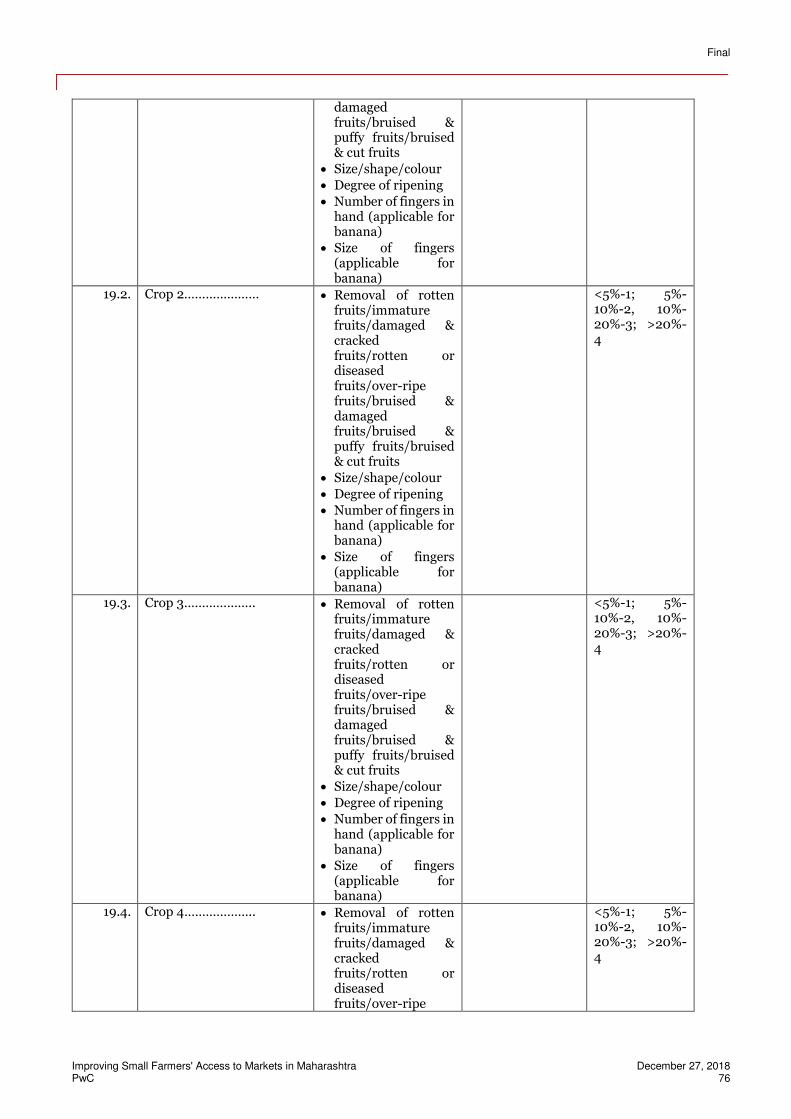
Final
Improving Small Farmers' Access to Markets in Maharashtra December 27, 2018 PwC 76
damaged fruits/bruised & puffy fruits/bruised & cut fruits
Size/shape/colour
Degree of ripening
Number of fingers in hand (applicable for banana)
Size of fingers (applicable for banana)
19.2. Crop 2………………… Removal of rotten fruits/immature fruits/damaged & cracked fruits/rotten or diseased fruits/over-ripe fruits/bruised & damaged fruits/bruised & puffy fruits/bruised & cut fruits
Size/shape/colour
Degree of ripening
Number of fingers in hand (applicable for banana)
Size of fingers (applicable for banana)
<5%-1; 5%-10%-2, 10%-20%-3; >20%-4
19.3. Crop 3……………….. Removal of rotten fruits/immature fruits/damaged & cracked fruits/rotten or diseased fruits/over-ripe fruits/bruised & damaged fruits/bruised & puffy fruits/bruised & cut fruits
Size/shape/colour
Degree of ripening
Number of fingers in hand (applicable for banana)
Size of fingers (applicable for banana)
<5%-1; 5%-10%-2, 10%-20%-3; >20%-4
19.4. Crop 4……………….. Removal of rotten fruits/immature fruits/damaged & cracked fruits/rotten or diseased fruits/over-ripe
<5%-1; 5%-10%-2, 10%-20%-3; >20%-4
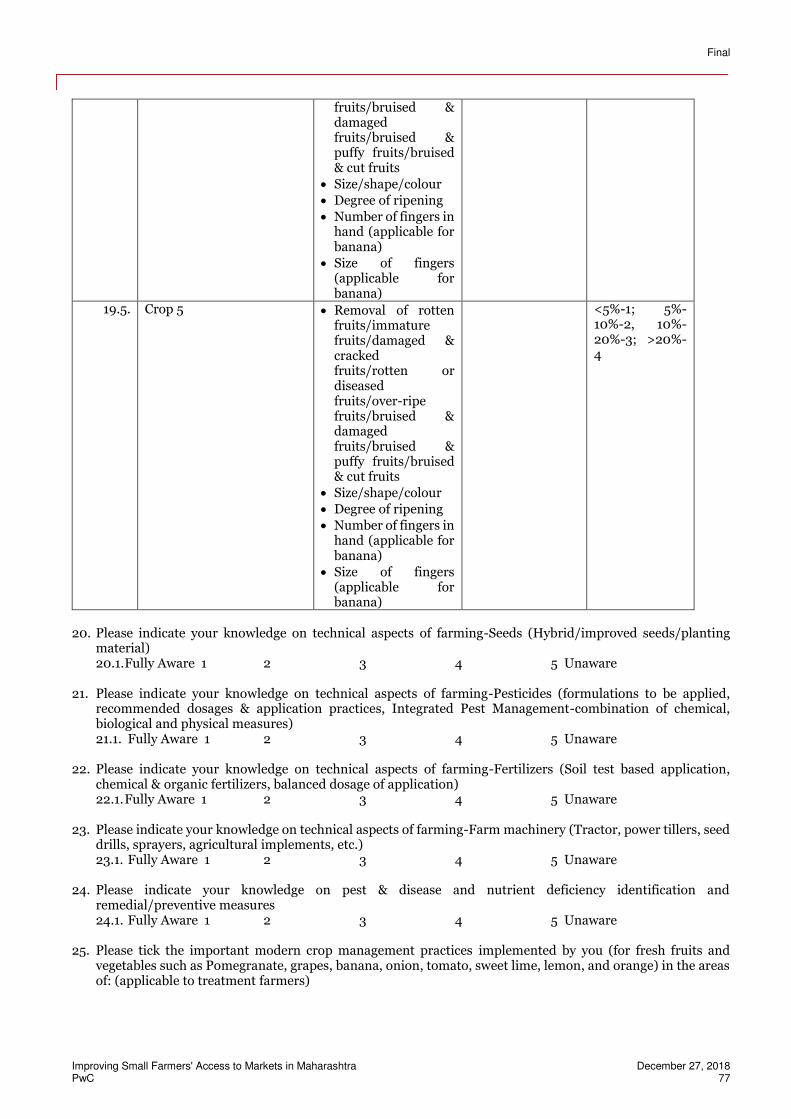
Final
Improving Small Farmers' Access to Markets in Maharashtra December 27, 2018 PwC 77
fruits/bruised & damaged fruits/bruised & puffy fruits/bruised & cut fruits
Size/shape/colour
Degree of ripening
Number of fingers in hand (applicable for banana)
Size of fingers (applicable for banana)
19.5. Crop 5 Removal of rotten fruits/immature fruits/damaged & cracked fruits/rotten or diseased fruits/over-ripe fruits/bruised & damaged fruits/bruised & puffy fruits/bruised & cut fruits
Size/shape/colour
Degree of ripening
Number of fingers in hand (applicable for banana)
Size of fingers (applicable for banana)
<5%-1; 5%-10%-2, 10%-20%-3; >20%-4
20. Please indicate your knowledge on technical aspects of farming-Seeds (Hybrid/improved seeds/planting
material) 20.1. Fully Aware 1 2 3 4 5 Unaware
21. Please indicate your knowledge on technical aspects of farming-Pesticides (formulations to be applied,
recommended dosages & application practices, Integrated Pest Management-combination of chemical, biological and physical measures) 21.1. Fully Aware 1 2 3 4 5 Unaware
22. Please indicate your knowledge on technical aspects of farming-Fertilizers (Soil test based application,
chemical & organic fertilizers, balanced dosage of application) 22.1. Fully Aware 1 2 3 4 5 Unaware
23. Please indicate your knowledge on technical aspects of farming-Farm machinery (Tractor, power tillers, seed
drills, sprayers, agricultural implements, etc.) 23.1. Fully Aware 1 2 3 4 5 Unaware
24. Please indicate your knowledge on pest & disease and nutrient deficiency identification and
remedial/preventive measures 24.1. Fully Aware 1 2 3 4 5 Unaware
25. Please tick the important modern crop management practices implemented by you (for fresh fruits and
vegetables such as Pomegranate, grapes, banana, onion, tomato, sweet lime, lemon, and orange) in the areas of: (applicable to treatment farmers)
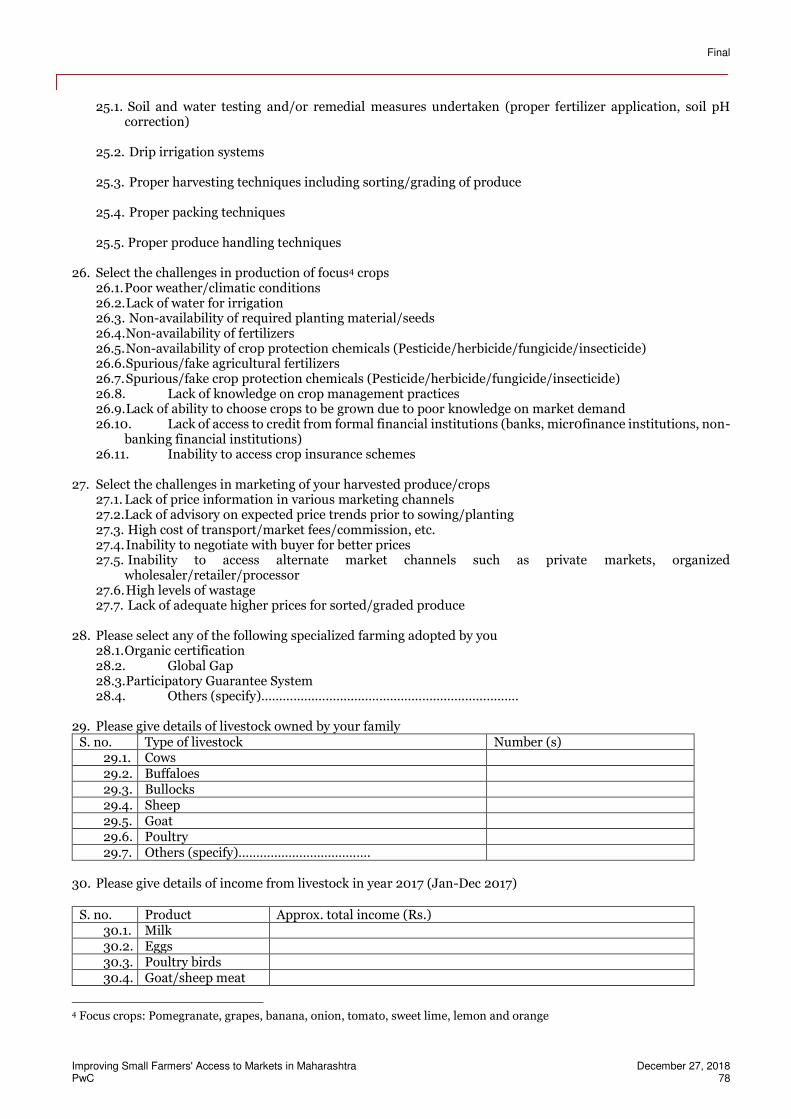
Final
Improving Small Farmers' Access to Markets in Maharashtra December 27, 2018 PwC 78
25.1. Soil and water testing and/or remedial measures undertaken (proper fertilizer application, soil pH correction)
25.2. Drip irrigation systems
25.3. Proper harvesting techniques including sorting/grading of produce
25.4. Proper packing techniques
25.5. Proper produce handling techniques
26. Select the challenges in production of focus4 crops 26.1. Poor weather/climatic conditions 26.2. Lack of water for irrigation 26.3. Non-availability of required planting material/seeds 26.4. Non-availability of fertilizers 26.5. Non-availability of crop protection chemicals (Pesticide/herbicide/fungicide/insecticide) 26.6. Spurious/fake agricultural fertilizers 26.7. Spurious/fake crop protection chemicals (Pesticide/herbicide/fungicide/insecticide) 26.8. Lack of knowledge on crop management practices 26.9. Lack of ability to choose crops to be grown due to poor knowledge on market demand 26.10. Lack of access to credit from formal financial institutions (banks, micr0finance institutions, non-
banking financial institutions) 26.11. Inability to access crop insurance schemes
27. Select the challenges in marketing of your harvested produce/crops
27.1. Lack of price information in various marketing channels 27.2.Lack of advisory on expected price trends prior to sowing/planting 27.3. High cost of transport/market fees/commission, etc. 27.4. Inability to negotiate with buyer for better prices 27.5. Inability to access alternate market channels such as private markets, organized
wholesaler/retailer/processor 27.6. High levels of wastage 27.7. Lack of adequate higher prices for sorted/graded produce
28. Please select any of the following specialized farming adopted by you
28.1. Organic certification 28.2. Global Gap 28.3. Participatory Guarantee System 28.4. Others (specify)………………………………………………………………
29. Please give details of livestock owned by your family S. no. Type of livestock Number (s)
29.1. Cows 29.2. Buffaloes 29.3. Bullocks 29.4. Sheep 29.5. Goat 29.6. Poultry 29.7. Others (specify)……………………………….
30. Please give details of income from livestock in year 2017 (Jan-Dec 2017)
S. no. Product Approx. total income (Rs.) 30.1. Milk 30.2. Eggs 30.3. Poultry birds 30.4. Goat/sheep meat
4 Focus crops: Pomegranate, grapes, banana, onion, tomato, sweet lime, lemon and orange
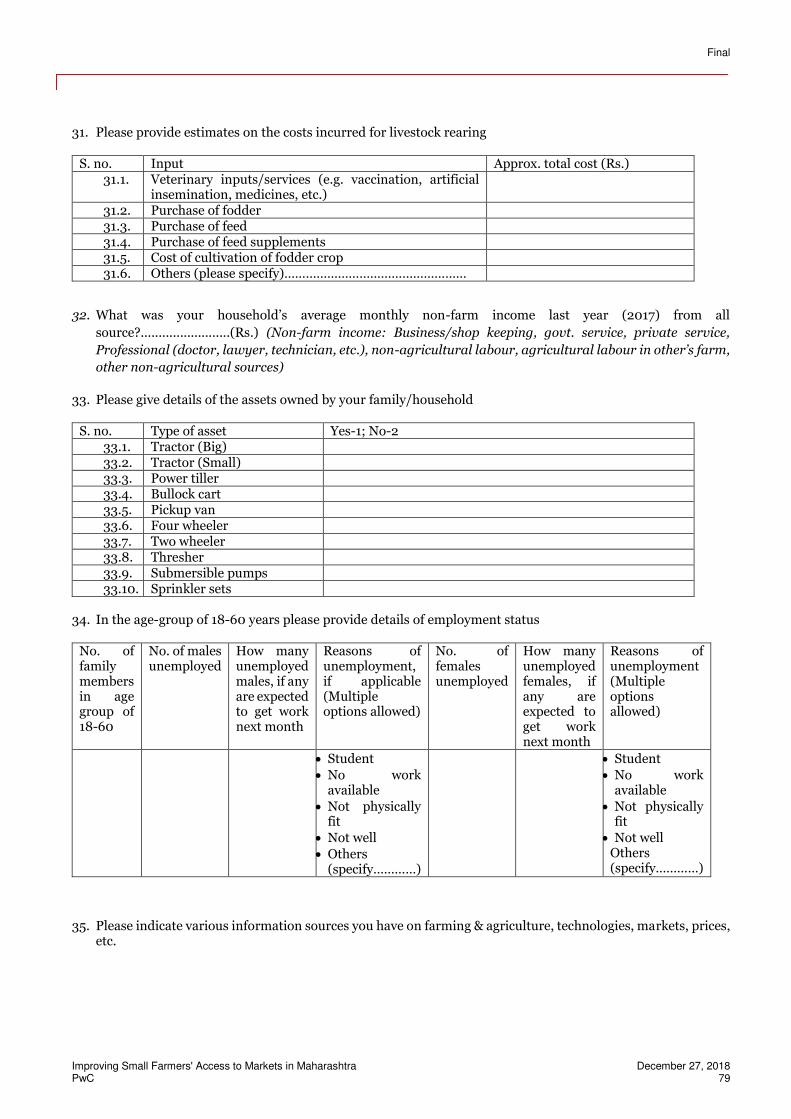
Final
Improving Small Farmers' Access to Markets in Maharashtra December 27, 2018 PwC 79
31. Please provide estimates on the costs incurred for livestock rearing
S. no. Input Approx. total cost (Rs.) 31.1. Veterinary inputs/services (e.g. vaccination, artificial
insemination, medicines, etc.)
31.2. Purchase of fodder 31.3. Purchase of feed 31.4. Purchase of feed supplements 31.5. Cost of cultivation of fodder crop 31.6. Others (please specify)……………………………………………
32. What was your household’s average monthly non-farm income last year (2017) from all
source?.........................(Rs.) (Non-farm income: Business/shop keeping, govt. service, private service,
Professional (doctor, lawyer, technician, etc.), non-agricultural labour, agricultural labour in other’s farm, other non-agricultural sources)
33. Please give details of the assets owned by your family/household
S. no. Type of asset Yes-1; No-2 33.1. Tractor (Big) 33.2. Tractor (Small) 33.3. Power tiller 33.4. Bullock cart 33.5. Pickup van 33.6. Four wheeler 33.7. Two wheeler 33.8. Thresher 33.9. Submersible pumps 33.10. Sprinkler sets
34. In the age-group of 18-60 years please provide details of employment status
No. of family members in age group of 18-60
No. of males unemployed
How many unemployed males, if any are expected to get work next month
Reasons of unemployment, if applicable (Multiple options allowed)
No. of females unemployed
How many unemployed females, if any are expected to get work next month
Reasons of unemployment (Multiple options allowed)
Student
No work available
Not physically fit
Not well
Others (specify…………)
Student
No work available
Not physically fit
Not well Others (specify…………)
35. Please indicate various information sources you have on farming & agriculture, technologies, markets, prices,
etc.
Final
Improving Small Farmers' Access to Markets in Maharashtra December 27, 2018 PwC 80
35.1. Books and Journals: Yes-1; No-2
35.2. Newspapers: Yes-1; No-2
35.3. Television: Yes-1; No-2
35.4. Radio: Yes-1; No-2
35.5. Internet: Yes-1; No-2
35.6. Agri. call centres: Yes-1; No-2
35.7. Govt. extension officers: Yes-1; No-2
35.8. Other farmers: Yes-1; No-2
35.9. SMS services: Yes-1; No-2
35.10. Companies/Dealers/Agri-input
agents: Yes-1; No-2
35.11. Universities/Krishi Vigyan
Kendras/Research agencies: Yes-1;
No-2
35.12. Exhibitions/Melas/Camps: Yes-1;
No-2
35.13. Farmer Producer Company (of which
the farmer is a member): Yes-1; No-2
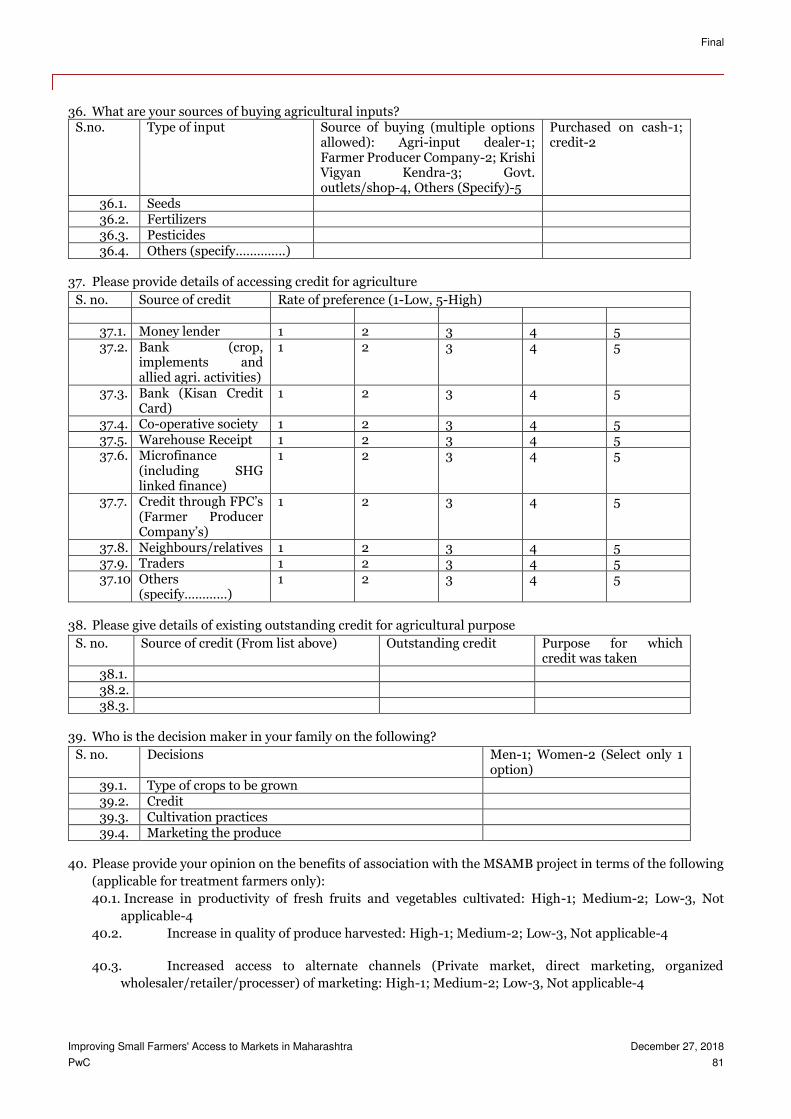
Final
Improving Small Farmers' Access to Markets in Maharashtra December 27, 2018
PwC 81
36. What are your sources of buying agricultural inputs?
S.no. Type of input Source of buying (multiple options allowed): Agri-input dealer-1; Farmer Producer Company-2; Krishi Vigyan Kendra-3; Govt. outlets/shop-4, Others (Specify)-5
Purchased on cash-1; credit-2
36.1. Seeds 36.2. Fertilizers 36.3. Pesticides 36.4. Others (specify…………..)
37. Please provide details of accessing credit for agriculture
S. no. Source of credit Rate of preference (1-Low, 5-High)
37.1. Money lender 1 2 3 4 5 37.2. Bank (crop,
implements and allied agri. activities)
1 2 3 4 5
37.3. Bank (Kisan Credit Card)
1 2 3 4 5
37.4. Co-operative society 1 2 3 4 5 37.5. Warehouse Receipt 1 2 3 4 5 37.6. Microfinance
(including SHG linked finance)
1 2 3 4 5
37.7. Credit through FPC’s (Farmer Producer Company’s)
1 2 3 4 5
37.8. Neighbours/relatives 1 2 3 4 5 37.9. Traders 1 2 3 4 5 37.10. Others
(specify…………) 1 2 3 4 5
38. Please give details of existing outstanding credit for agricultural purpose
S. no. Source of credit (From list above) Outstanding credit Purpose for which credit was taken
38.1. 38.2. 38.3.
39. Who is the decision maker in your family on the following?
S. no. Decisions Men-1; Women-2 (Select only 1 option)
39.1. Type of crops to be grown 39.2. Credit 39.3. Cultivation practices 39.4. Marketing the produce
40. Please provide your opinion on the benefits of association with the MSAMB project in terms of the following
(applicable for treatment farmers only):
40.1. Increase in productivity of fresh fruits and vegetables cultivated: High-1; Medium-2; Low-3, Not
applicable-4
40.2. Increase in quality of produce harvested: High-1; Medium-2; Low-3, Not applicable-4
40.3. Increased access to alternate channels (Private market, direct marketing, organized
wholesaler/retailer/processer) of marketing: High-1; Medium-2; Low-3, Not applicable-4
Final
Improving Small Farmers' Access to Markets in Maharashtra December 27, 2018
PwC 82
40.4. Increased price realization by sale through alternate channels of marketing/collective selling:
High-1; Medium-2; Low-3, Not applicable-4
40.5. Reduced cost of inputs due to collective buying: High-1; Medium-2; Low-3, Not applicable-4
40.6. Increased ability to take independent decision in terms of production and marketing of fresh
fruits and vegetables: High-1; Medium-2; Low-3, Not applicable-4
40.7. Improved sharing of knowledge regarding cultivation and marketing of fresh fruits and
vegetables by being part of farmer group/company: High-1; Medium-2; Low-3, Not applicable-4
41. What is your overall satisfaction as regards your association with the MSAMB project (applicable for
treatment farmers only)? Highly satisfied-1; Moderately satisfied-2; Satisfied-3; Not satisfied-4; Do not
know/cannot answer-5
42. Please provide your suggestions as regards similar future assistance from the government in terms of
(applicable for treatment farmers only):
42.1. Improvement in production of fresh fruits and vegetables
42.2. Improvement in marketing of fresh fruits and vegetables
42.3. Assistance for supporting business activities of Farmer Producer Company (FPC)/Farmer Groups
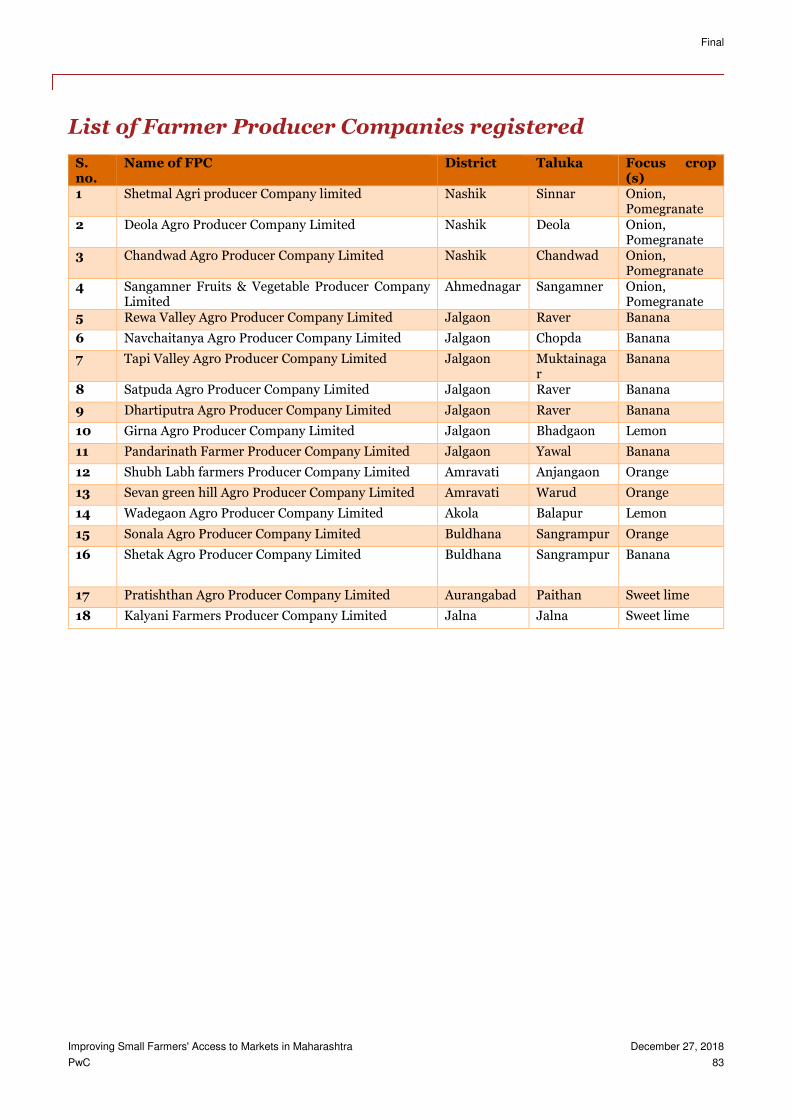
Final
Improving Small Farmers' Access to Markets in Maharashtra December 27, 2018
PwC 83
List of Farmer Producer Companies registered
S. no.
Name of FPC District Taluka Focus crop (s)
1 Shetmal Agri producer Company limited Nashik Sinnar Onion, Pomegranate
2 Deola Agro Producer Company Limited Nashik Deola Onion, Pomegranate
3 Chandwad Agro Producer Company Limited Nashik Chandwad Onion, Pomegranate
4 Sangamner Fruits & Vegetable Producer Company Limited
Ahmednagar Sangamner Onion, Pomegranate
5 Rewa Valley Agro Producer Company Limited Jalgaon Raver Banana
6 Navchaitanya Agro Producer Company Limited Jalgaon Chopda Banana
7 Tapi Valley Agro Producer Company Limited Jalgaon Muktainagar
Banana
8 Satpuda Agro Producer Company Limited Jalgaon Raver Banana
9 Dhartiputra Agro Producer Company Limited Jalgaon Raver Banana
10 Girna Agro Producer Company Limited Jalgaon Bhadgaon Lemon
11 Pandarinath Farmer Producer Company Limited Jalgaon Yawal Banana
12 Shubh Labh farmers Producer Company Limited Amravati Anjangaon Orange
13 Sevan green hill Agro Producer Company Limited Amravati Warud Orange
14 Wadegaon Agro Producer Company Limited Akola Balapur Lemon
15 Sonala Agro Producer Company Limited Buldhana Sangrampur Orange
16 Shetak Agro Producer Company Limited Buldhana Sangrampur Banana
17 Pratishthan Agro Producer Company Limited Aurangabad Paithan Sweet lime
18 Kalyani Farmers Producer Company Limited Jalna Jalna Sweet lime
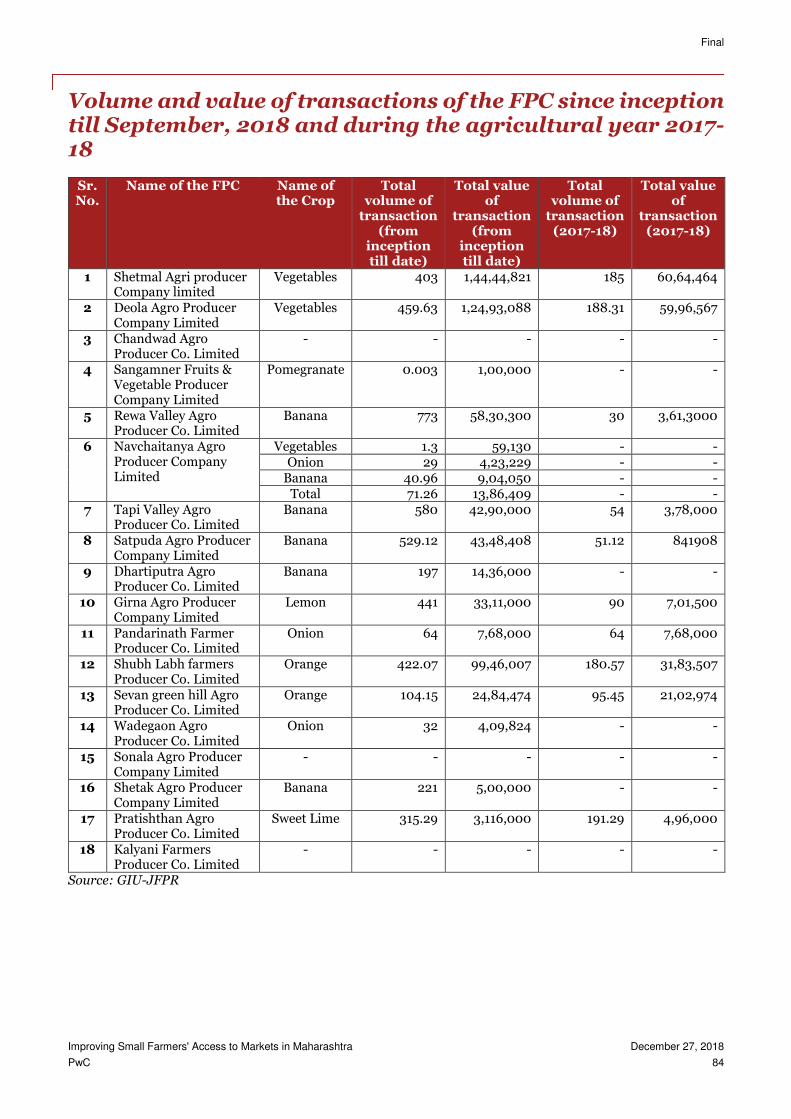
Final
Improving Small Farmers' Access to Markets in Maharashtra December 27, 2018
PwC 84
Volume and value of transactions of the FPC since inception till September, 2018 and during the agricultural year 2017-18
Sr. No.
Name of the FPC Name of the Crop
Total volume of
transaction (from
inception till date)
Total value of
transaction (from
inception till date)
Total volume of
transaction (2017-18)
Total value of
transaction (2017-18)
1 Shetmal Agri producer Company limited
Vegetables 403 1,44,44,821 185 60,64,464
2 Deola Agro Producer Company Limited
Vegetables 459.63 1,24,93,088 188.31 59,96,567
3 Chandwad Agro Producer Co. Limited
- - - - -
4 Sangamner Fruits & Vegetable Producer Company Limited
Pomegranate 0.003 1,00,000 - -
5 Rewa Valley Agro Producer Co. Limited
Banana 773 58,30,300 30 3,61,3000
6 Navchaitanya Agro Producer Company Limited
Vegetables 1.3 59,130 - - Onion 29 4,23,229 - -
Banana 40.96 9,04,050 - - Total 71.26 13,86,409 - -
7 Tapi Valley Agro Producer Co. Limited
Banana 580 42,90,000 54 3,78,000
8 Satpuda Agro Producer Company Limited
Banana 529.12 43,48,408 51.12 841908
9 Dhartiputra Agro Producer Co. Limited
Banana 197 14,36,000 - -
10 Girna Agro Producer Company Limited
Lemon 441 33,11,000 90 7,01,500
11 Pandarinath Farmer Producer Co. Limited
Onion 64 7,68,000 64 7,68,000
12 Shubh Labh farmers Producer Co. Limited
Orange 422.07 99,46,007 180.57 31,83,507
13 Sevan green hill Agro Producer Co. Limited
Orange 104.15 24,84,474 95.45 21,02,974
14 Wadegaon Agro Producer Co. Limited
Onion 32 4,09,824 - -
15 Sonala Agro Producer Company Limited
- - - - -
16 Shetak Agro Producer Company Limited
Banana 221 5,00,000 - -
17 Pratishthan Agro Producer Co. Limited
Sweet Lime 315.29 3,116,000 191.29 4,96,000
18 Kalyani Farmers Producer Co. Limited
- - - - -
Source: GIU-JFPR
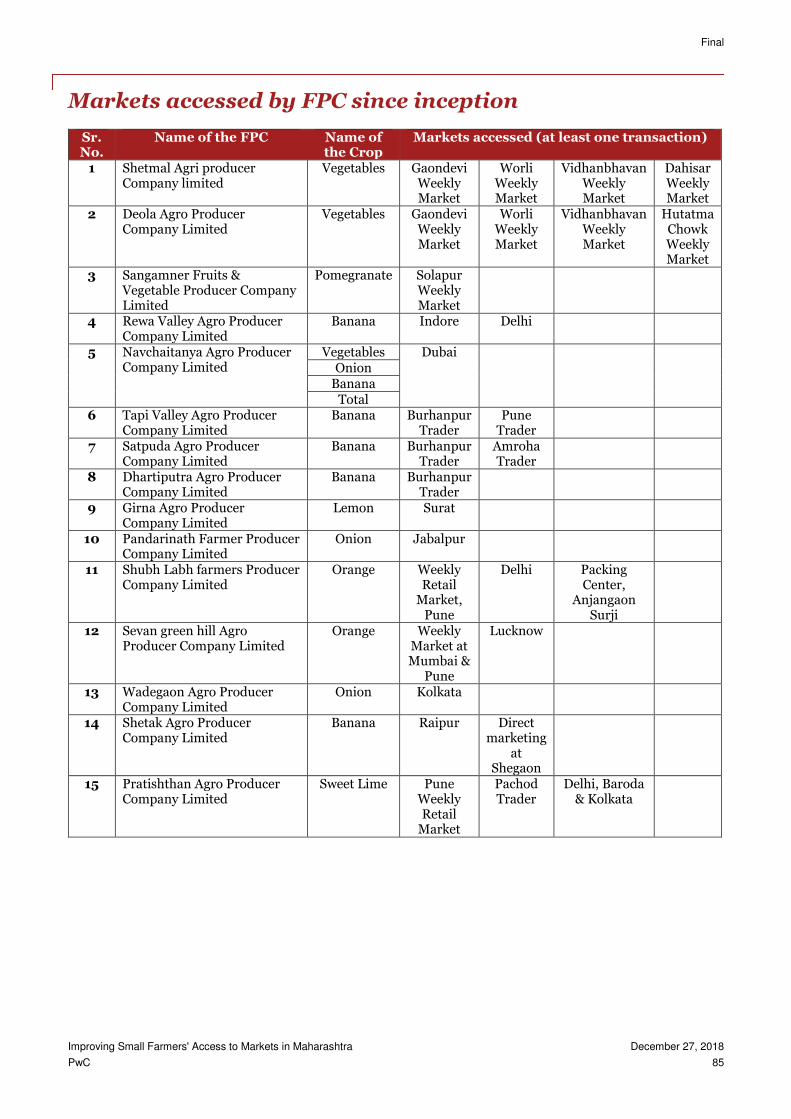
Final
Improving Small Farmers' Access to Markets in Maharashtra December 27, 2018
PwC 85
Markets accessed by FPC since inception
Sr. No.
Name of the FPC Name of the Crop
Markets accessed (at least one transaction)
1 Shetmal Agri producer Company limited
Vegetables Gaondevi Weekly Market
Worli Weekly Market
Vidhanbhavan Weekly Market
Dahisar Weekly Market
2 Deola Agro Producer Company Limited
Vegetables Gaondevi Weekly Market
Worli Weekly Market
Vidhanbhavan Weekly Market
Hutatma Chowk Weekly Market
3 Sangamner Fruits & Vegetable Producer Company Limited
Pomegranate Solapur Weekly Market
4 Rewa Valley Agro Producer Company Limited
Banana Indore Delhi
5 Navchaitanya Agro Producer Company Limited
Vegetables Dubai Onion
Banana Total
6 Tapi Valley Agro Producer Company Limited
Banana Burhanpur Trader
Pune Trader
7 Satpuda Agro Producer Company Limited
Banana Burhanpur Trader
Amroha Trader
8 Dhartiputra Agro Producer Company Limited
Banana Burhanpur Trader
9 Girna Agro Producer Company Limited
Lemon Surat
10 Pandarinath Farmer Producer Company Limited
Onion Jabalpur
11 Shubh Labh farmers Producer Company Limited
Orange Weekly Retail
Market, Pune
Delhi Packing Center,
Anjangaon Surji
12 Sevan green hill Agro Producer Company Limited
Orange Weekly Market at Mumbai &
Pune
Lucknow
13 Wadegaon Agro Producer Company Limited
Onion Kolkata
14 Shetak Agro Producer Company Limited
Banana Raipur Direct marketing
at Shegaon
15 Pratishthan Agro Producer Company Limited
Sweet Lime Pune Weekly Retail
Market
Pachod Trader
Delhi, Baroda & Kolkata
Final
This document has been prepared solely for Maharashtra State Agricultural Marketing Board (MSAMB), Govt. of Maharashtra, being the express addressee to this document. PwC does not accept or assume any liability, responsibility or duty of care for any use of or reliance on this document by anyone, other than (i) Maharashtra State Agricultural Marketing Board (MSAMB), Govt. of Maharashtra, to the extent agreed in the relevant contract for the matter to which this document relates (if any), or (ii) as expressly agreed by PwC in writing in advance. This publication (and any extract from it) may not be copied, paraphrased, reproduced, or distributed in any manner or form, whether by photocopying, electronically, by internet, within another document or otherwise, without the prior written permission of PwC. Further, any quotation, citation, or attribution of this publication, or any extract from it, is strictly prohibited without PwC’s prior written permission. © 2018 PricewaterhouseCoopers Private Limited. All rights reserved. In this document, “PwC” refers to PricewaterhouseCoopers Private Limited (a limited liability company in India), which is a member firm of PricewaterhouseCoopers International Limited, each member firm of which is a separate legal entity.
Related Documents