1 23 Scientometrics An International Journal for all Quantitative Aspects of the Science of Science, Communication in Science and Science Policy ISSN 0138-9130 Volume 89 Number 1 Scientometrics (2011) 89:153-176 DOI 10.1007/s11192-011-0419-5 Improving quality assessment of composite indicators in university rankings: a case study of French and German universities of excellence M. Benito & R. Romera

Welcome message from author
This document is posted to help you gain knowledge. Please leave a comment to let me know what you think about it! Share it to your friends and learn new things together.
Transcript

1 23
ScientometricsAn International Journal for allQuantitative Aspects of the Scienceof Science, Communication inScience and Science Policy ISSN 0138-9130Volume 89Number 1 Scientometrics (2011) 89:153-176DOI 10.1007/s11192-011-0419-5
Improving quality assessment ofcomposite indicators in universityrankings: a case study of French andGerman universities of excellence
M. Benito & R. Romera

1 23
Your article is protected by copyright and
all rights are held exclusively by Akadémiai
Kiadó, Budapest, Hungary. This e-offprint is
for personal use only and shall not be self-
archived in electronic repositories. If you
wish to self-archive your work, please use the
accepted author’s version for posting to your
own website or your institution’s repository.
You may further deposit the accepted author’s
version on a funder’s repository at a funder’s
request, provided it is not made publicly
available until 12 months after publication.

Improving quality assessment of composite indicatorsin university rankings: a case study of Frenchand German universities of excellence
M. Benito • R. Romera
Received: 22 February 2011 / Published online: 31 August 2011� Akademiai Kiado, Budapest, Hungary 2011
Abstract Composite indicators play an essential role for benchmarking higher education
institutions. One of the main sources of uncertainty building composite indicators and,
undoubtedly, the most debated problem in building composite indicators is the weighting
schemes (assigning weights to the simple indicators or subindicators) together with the
aggregation schemes (final composite indicator formula). Except the ideal situation where
weights are provided by the theory, there clearly is a need for improving quality assess-
ment of the final rank linked with a fixed vector of weights. We propose to use simulation
techniques to generate random perturbations around any initial vector of weights to obtain
robust and reliable ranks allowing to rank universities in a range bracket. The proposed
methodology is general enough to be applied no matter the weighting scheme used for the
composite indicator. The immediate benefit achieved is a reduction of the uncertainty
associated with the assessment of a specific rank which is not representative of the real
performance of the university, and an improvement of the quality assessment of composite
indicators used to rank. To illustrate the proposed methodology we rank the French and the
German universities involved in their respective 2008 Excellence Initiatives.
Keywords Composite indicators � Rankings � Benchmarking �Higher Education Institutions � Weighting schemes � Simulation techniques
Introduction
Composite indicators (or indices) are of increasing interest for benchmarking institutions’
performance. Organizations such as the United Nations, the European Commission and
others have developed and used composite indicators in order to provide rankings of
institutions or countries. Among the different instruments of quality assessment in higher
education, rankings probably get the most public attention. There clearly is a demand for
ranking in the field of higher education, but there are also questions about the quality,
M. Benito (&) � R. RomeraStatistics Department, Universidad Carlos III de Madrid, C/Madrid 126, Getafe 28903, Spaine-mail: [email protected]
123
Scientometrics (2011) 89:153–176DOI 10.1007/s11192-011-0419-5
Author's personal copy
impact and eventual validity of the outputs and the conclusions. It is claimed that rankings
have several purposes: to respond to demands from consumers for easily interpretable
information on the standing of higher education institutions, to stimulate competition
among institutions, to better understand the different types of institutions and programs, to
serve as part of a framework for national assessment, accountability and quality assurance
in the higher education system and, finally, linked to a national framework for quality,
rankings serve to generate a debate that contributes to the definition of ‘quality’ of higher
education, complementing the rigorous work conducted in the context of quality assess-
ment and review performed by public and independent accrediting agencies.
On the other hand, critiques of rankings (in the form of league tables) come from a
number of sources and are based on methodological, pragmatic, or even moral and
philosophical concerns. The main criticisms focus on the validity of the selection of
subindicators, dealing with missing values, normalization methods, weighting of indica-
tors, reliability/robustness in league positions or composite indicators formula’s changes
(Harvey 2008). In response to the legitimate concerns about the quality of Higher Edu-
cation Institutions rankings, in May 2006, the International Ranking Expert Group (IREG)
developed and endorsed a guideline document—the Berlin Principles on Ranking of
Higher Education Institutions (Berlin Principles in short), consisting of sixteen descriptive
and prescriptive principles for ranking covering four aspects: the purpose and goal of
ranking; the design and weighting of indicators; the collection and processing of data; and
the presentation of ranking results (CHE/CEPES/IHEP (2006)). Chen and Liu (2008)
propose concrete ‘Fourteen Criteria’ which, if followed, they claim could enhance the
quality of ranking.
As Sadlak et al. (2008) pointed out, although a positive view of rankings is not unan-
imously shared, it is likely that the naysayers are fighting a losing battle. The number of
meetings and references to ranking of higher education confirms a wide interest and
attention to this phenomenon.
There is no single concept or model of ranking. Rankings vary in their aims and target
groups as well as in terms of what they measure, how they measure it and how they
implicitly define quality (see for instance Pike 2004; Dill and Soo 2004; Usher and Savino
2007; Bastedo and Bowman 2010). Furthermore, Stolz et al. (2010) provide a Ranking ofrankings, a recent study benchmarking twenty-five higher education ranking systems in
Europe, and Aguillo et al. (2010) present an interesting comparison of rankings of world
universities by using a set of similarity measures.
There are different approaches among papers on university rankings: the largest cate-
gory is composed by papers that reflect on international or national rankings and the
smallest category consists of papers that contribute to the improvement of the methodol-
ogies of construction of the rankings. The present paper belongs to the latter group.
University rankings are very appealing, in that provide a single score that allows, at a
glance, to situate institutions in the worldwide context or in their national context. How-
ever, this simplicity of use can be highly misleading in that most rankings are based on a
simple formula that aggregate subjectively, most of the times, chosen indicators. Saisana
and D’Hombres (2008) present a thorough uncertainty and sensitivity analysis of the 2007
‘Shanghai Jiao Tong University Academy Ranking of World Universities’ (STJU) and the
2007 Times Higher Education Supplement (THES) ranking for the Top100 and Top200
universities, respectively. Findings and recommendations put forward by that report reveal
that the rank of more than half of the institutions is highly sensitive to the methodological
assumptions and the choice of indicators, consequently, robustness analysis is highly
recommended and for that purpose they propose a multi modeling approach based on
154 M. Benito, R. Romera
123
Author's personal copy

cross-validation principles. In a recent study, Geraci and Degli (2011) compare several
rankings used to evaluate the prestige and merit of Italian universities and consider
alternative approaches to academic rankings.
We believe that while standard university rankings may not be informative about the
real position of most of the institutions, a robust analysis applied to composite indicators
allows ranking universities in a range bracket providing more accurate information. The
immediate benefit achieved is a reduction of the uncertainty associated with the assessment
of a specific rank which is not representative of the real performance of the university, and
an improvement of the quality assessment of composite indicators used to rank. Although
we share a coincident viewpoint as in Saisana et al. (2005), our methodology is different in
what we do not follow a sensitivity analysis approach and we focus on robustness itself.
One of the main sources of uncertainty building composite indicators and, undoubtedly,
the most debated problem in building composite indicators is the weighting schemes
(assigning weights to the simple indicators or subindicators) together with the aggregation
schemes (final composite indicator formula). The difficulty lies in assessing properly the
different perspectives about the relevance of the simple indicators. The methodology
proposed in the present paper can help in any aggregation step of benchmarking exercises:
simple indicators or even composite indicators.
Ideally the weighting of indicators should be underpinned by theory but in practice it
seems that indicators are assigned weights not always in a rationale manner. Nevertheless,
a number of weighting techniques exits. Some of them are derived from statistical models
(factor analysis, data envelopment analysis and unobserved components models) and
others are derived from participatory methods (expert surveys, analytic hierarchy pro-
cesses, conjoint analysis). Ding and Qiu (2011) describes an approach to improve the
indicator weights integrating the subjective and objective weights to reflect both the
subjective considerations of experts and the objective information obtained by mathe-
matical methods. A different viewpoint follows the multidimensional Center for Higher
Education Development (CHE)’ ranking. Three central methodological principles of the
CHE ranking distinguish it from many other ranking approaches (Federkail 2008). First,
the main target group of the ranking is school leavers seeking to became university
entrants. Thus, according to specific subject or program, the ranking does not rank whole
universities, but only single subjects. Second, and in our perspective its most innovative
feature, the CHE ranking does not calculate an overall composite indicator. Instead, it
proposes a ‘self-service’ approach by providing a multidimensional ranking in which each
indicator is presented separately. Decisions about the relevance (or ‘weights’) of subin-
dicators are left to the user. Third, instead of league tables, the CHE-rank orders univer-
sities in three groups: according to the upper and the lowest quartiles, the best universities
are clustered into the top group; the worst into the bottom group; and the rest constitute an
intermediate middle group.
Whatever the criteria adopted to fix the weights except the ideal situation where weights
are provided by the theory, there is the need of searching for stability and robustness of the
final rank linked with that fixed vector of weights. How the ranked institutions react under
small changes in the relative importance of the simple indicators given by the weights
values?.
The main findings of the paper are: (1) to develop a general methodology in building
robust rankings based on simulation techniques and (2) to apply these results in bench-
marking some European universities included in Excellence Initiatives.
The rest of the paper is organized as follows. ‘‘Methodological aspects in building
robust ranks’’ section presents the methodological aspects in obtaining robust ranks by
Improving quality assessment of composite indicators 155
123
Author's personal copy

building perturbations of the weights of the composite indicators. ‘‘An application to the
French and German universities of excellence’’ section illustrates the proposed method-
ology providing robust ranks for a case-study: the 2008 excellence French and German
universities and compare these results with the ones obtained by using the weighting
scheme proposed by Ding and Qiu (2011). ‘‘Conclusions and extensions’’ section sum-
marizes our conclusions and extensions.
Methodological aspects in building robust ranks
General sources of uncertainty in building composite indicators arise from at least one of
the following steps in constructing composite indicators: selection of simple indicators,
data selection, data normalization, weighting scheme and weights’ vector, and aggregating
composite indicators (final composite indicator formula). We focus on the last two issues
and we develop a robust methodology general enough for linear weighting or aggregating
schemes.
The robustness principles
To assess robustness in some mechanism is generally understood as ‘‘to present the quality
of being able to withstand stresses, pressures, or changes in procedure or circumstance. A
system, organism or design may be said to be ‘‘robust’’ if it is capable of coping well with
variations (sometimes unpredictable variations) in its operating environment with minimal
damage, alteration or loss of functionality’’. From the statistical point of view, a robust
procedure is such that produce estimators that are not unduly affected by small departures
from model assumptions. In the higher education rankings’ context what we desire to
achieve is that small variations in the production of the rank have little effect in the ranked
group of institutions.
In what follows we focus on linear weighting schemes for which we develop the
robustness principles. Note that they equally hold for aggregating composite indicators
schemes. It should be emphasized when using a linear additive aggregation technique, a
necessary condition for the existence of a proper composite indicator is to achieve mutually
independence between simple indicators (at least mutually preferentially independence in
the sense of Debreu (1960)).
A composite indicator CIi for a given institution i is most often a simple linear weighted
function of a total of p simple normalized indicators Ii1,…,Iip with weights w1,…,wp
CIi ¼Xp
j¼1
Iijwj ð1Þ
Let xij be the raw value of the simple indicator Xj for country i. It is a standard practice
to normalize the data taking into account their properties with respect to the measurement
units in which the simple indicators are expressed. The most frequent normalization
procedures used in the literature for data normalization are (i) reescaling or (ii) stan-
dardizing. Thus, the p normalized simple indicators are given by
Iij ¼xij
maxifxijg; or Iij ¼
xij �minifxijgrangefXjg
ðiÞ
156 M. Benito, R. Romera
123
Author's personal copy

Iij ¼xij �medianfXjg
stdfXjgðiiÞ
respectively. The group of institutions is then ranked according to the CIi values (1).
From the methodological point of view we observe that the vector of the relative
weights of the simple indicators (w1,…,wp) is composed by non-negative values wj such
that
Xp
j¼1
wj ¼ 1 ð2Þ
Note that these values are individually used to assess the relative importance of each
simple indicator Xj into the convex linear combination (1). We propose to consider small
perturbations for each wj by adding or subtracting small random quantities ranging in (0,s)
where s is arbitrarily chosen according to the restrictions 0 \ s \ wj for all j, and such (2)
is guaranteed. Technically, for each wj we generate a number of uniform values over the
interval (wj - s, wj ? s) and for each vector of weights satisfying (2) we evaluate the
corresponding CIi values. Then, the institutions are ranked according to these values.
Let assume that after the simulations we obtain m vectors of distorted weights such that (2)
holds. It means that each institution has m rankings. Our suggestion is to generate the resulting
ranking in a robust manner. Thus, for each institution instead of the averaged ranking we
consider the Median and the range (5th-quantile, 95th-quantile) of the distribution of its
m rankings. Note that the information provided by the range (5th-quantile, 95th-quantile)
regards the expected ranked positions achieved by the institutions excluding the lower 5% and
the higher 5% of them. The simulations are carried out according to a general Monte Carlo
scheme (see Algorithm 1 in Appendix 1). From the geometrical point of view considers the
distorted vectors of weights as points randomly generated in <n such that they live in the
intersection of the n-dimensional hipercube and the n - 1-simplex in<n. Different schemes
of perturbation can be considered under this methodology. Note that different patterns of
variability of the weights generate different geometric areas to be considered in the Monte
Carlo simulations. According to a situation reflecting a more restrictive variability range of
the perturbations, we propose for example, to consider as random perturbations of the initial
vector of weights w(0), the vectors living in the hipersurface obtained as the intersection of the
sphere centered at the point w(0) and radius s and the n - 1-simplex in <n. This algorithm is
based on the methodology of Cook (1958) and Marsaglia (1972) (see Algorithm 2 in
Appendix 1). Complementary to the algorithms proposed, it would be informative to include
additional restrictions in any dimension. For instance, if in consultation with higher education
experts it is clear that some simple indicator has to be higher than a fixed threshold, the
algorithm would include an additional restriction over that weight. Or that we are interested in
assuming that the weight of the second simple indicator has to be twice the first. This is
equivalent to include the restriction w2 = 2w1 in Algorithm 2, that is, the plane w2 - 2w1 =
0, which generates a new geometric area.
This idea of random simulation we propose is the centerpiece to mitigate potential bias
in weights’ selection and offers a simple way to rank institutions in a robust manner
according to a plurality of possible scenarios. In addition, we propose to consider for each
institution the 5th, 50th and 95th quantiles of the distribution of its m generated rankings as
explained above.
With the proposed methodology there are some interesting improvements in comparison
to the work proposed by Ding and Qiu (2011): (1) the integration to the subjective weights
Improving quality assessment of composite indicators 157
123
Author's personal copy

and the objective weights using the additive and multiplicative mathematical model,
respectively, is highly influenced by the subjective judgment, whereas with the random
simulation we propose about the initial vector of weights (subjective weights) we obtain a
plurality of objective possible scenes, (2) Ding and Qiu choose the better between the
different weights by using the sum of the absolute difference in rank between the university
rankings in 5 years with each kind of weights just to minimize the fluctuations of the
university rankings. Nevertheless, with this idea there is an important loss of information
since it is not known how the ranked universities react under small changes in the weights
values and (3) the integrative weights computed by Ding and Qiu can indeed be included in
the resulting random simulation we propose.
An application to the French and German universities of excellence
Since 2007 the Excellence Initiative in Germany aims to promote top-level research and to
improve the quality of German universities and research institutions. The competition was
run by the German Research Foundation (DFG) (Deutsche Forschungsgemeinschaft) and
the German Council of Science and Humanities in three lines: (i) Graduate Schools to
promote young scientists and researchers, (ii) Clusters of Excellence to promote cutting-
edge research and (iii) Institutional Strategies on projects to promote top-level research. A
total of 1.9 billion Euros was made available by the Federal and State Governments to fund
the selected projects for the three funding lines of the initiative. This unique competition
has already had a sustained effect on changing the academic landscape, that also shines
across the whole country, its economy and society. In May 2009 the federal and state
governments decided to continue the Excellence Initiative beyond 2012, providing a total
of 2.7 billion Euros for the second 5-year phase from 2012 to 2017. Graduate schools play
a key role not only in developing internationally competitive centers of top-level research
and scientific excellence in Germany but also in increasing their recognition and prestige.
They serve as an instrument of quality assurance in promoting young researchers and are
based on the principle of training outstanding doctoral students within an excellent
research environment. Clusters of excellence will enable German university locations to
establish internationally visible, competitive research and training facilities, thereby
enhancing scientific networking and cooperation among the participating institutions. The
Excellence Initiative provides funding for Institutional strategies that are aimed at devel-
oping top-level university research in Germany and increasing its competitiveness at an
international level. Institutional Strategies aim to strengthen a university as a whole, so that
it can compete successfully with the leading players in the international science market. An
Institutional Strategy calls for a university to develop a long-term strategy on how it can
consistently expand and enhance its cutting-edge research and improve the promotion of
young scientists and researchers. This means identifying existing strengths and sharpening
profiles in all fields. To qualify for the third funding line, universities have to develop an
exceptional Institutional Strategy and must, additionally, each have at least one Graduate
School and one Cluster of Excellence. Under the Excellence Initiative, a total of nine
universities and their Institutional Strategies are funded for 5 years: Ludwig-Maximilians-
Universitat Munchen (LMU Munich), Technische Universitat Munchen (TU Munich),
Rheinisch-Westfaelische Technische Hochschule Aachen (RWTH Aachen), Universitat
Freiburg, Universitat Konstanze, Universitat Heidelberg, Universitat Karlsruhe and Georg-
August-Universitat.
158 M. Benito, R. Romera
123
Author's personal copy

In France, in 2006 it began the initiative of the so called Poles of Investigation and of
Higher Education-PRES- (Poles de recherche et d’enseignement superieur) with the aim to
extend and reinforce the top formation and the investigation to be a way to take place in the
scientific international competition. Between 2007 and 2010, 17 PRES has been composed
by 51 universities and other 51 organisms of investigation and public institutions (engi-
neers’ schools, hospital centers and territorial collectivities, between others). The creation
of the PRES has been a previous fundamental step for L’Operation Campus, a national
program for the aggregation and merger of universities to create internationally high
ranking universities. The PRES has two missions: (i) to prepare, between the charter
members the conditions of the merger of the universities, (ii) to guarantee the governance
and L’Operation Campus’s follow-up inside the frame of his mission, the PRES has to
assemble the university group and (iii) to organize the cooperation between partners and to
reinforce the competitiveness of the territory bringing the academic world over to the
industrial world. Launched in February 2008, the Operation Campus is a multi-billion-euro
investment program (5 billion Euros) with the goal to attract the best researchers and
students and place France among the top universities in the world. Through a massive
investment, this program aims to elevate France’s university campuses to the highest
international standards. With this initiative, urgency for building renovations making
campuses more user-friendly and involvement with regional authorities and businesses it is
required. The twelve successful projects chosen under the Operation Campus were selected
based on the following four criteria: scientific and educational scope and reach; degree of
urgency in the need for renovation of facilities; the potential to provide student housing;
and the likely impact of the project for the region, considered in light of its potential to
complement competitiveness clusters, research networks, and the efforts of local govern-
ments. Among the benefits, successful projects received substantial extra funds for con-
struction, upgrading and maintenance of buildings, improving safety standards and making
campuses more pleasant, user-friendly places in which to live. The twelve projects are
located in Aix-Marseille, Bordeaux, Condorcet-Paris-Aubervilliers, Grenoble, Lille, Lor-
raine, Lyon, Montpellier, Paris intra-muros, Saclay, Strasbourg and Toulouse. With these
commitments, the state reaffirmed more than ever its support to universities and research
and its willingness to promote, within France and in international competition, major
university centers founded on the regrouping of establishments, the sharing of skill and
talent, and the notable improvement of living conditions for students. For ranking the
excellence French universities, the project located in Paris intra-muros is not taken into
account in this study because the Minister for Higher Education and Research considered
this project as an exceptional case for the expansion and renovation of the Parisians
Universities. Thus, under the Operation Campus a total of 33 excellence universities are
selected: Universite de Provence (Aix-Marseille1), Universite de la Mediterranee (Aix-
Marseille2), Universite Paul Cezanne (Aix-Marseille3), Universite d’Avignon et des Pays
de Vaucluse (Avignon), Universite de Sciences Technologies de Bourdeaux (Bourdeaux1),
Universite Victor Segalen (Bourdeaux2), Universite Michel de Montaigne (Bourdeaux3),
Universite Montesquieu (Bourdeaux4), Universite de Pau et des Pays de l’Adour (UPPA),
Universite Joseph Fourier (Grenoble1), Universite Pierre Mendes France (Grenoble2),
Universite Stendhal (Grenoble3), Universite Lille1 Sciences et Technologies, Universite
Lille2 Droit et Sante, Universite Charles de Gaulle (Lille3), Universite Claude Bernard
(Lyon1), Universite Lumiere (Lyon2), Universite Jean Moulin (Lyon3), Universite
Montpellier1, Universite Montpellier2 Sciences et Techniques, Universite Paul-Valery
(Montpellier3), Universite Paul Verlaine (Metz), Universite Henri Poincare (Nancy1),
Nancy-Universite (Nancy2), Universite Paris 1 Pantheon-Sorbonne, Universite Vincennes-
Improving quality assessment of composite indicators 159
123
Author's personal copy

Saint-Denis (Paris8), Universite Paris Nord (Paris13), Universite de Strasbourg, Universite
Toulouse1 Capitole, Universite de Toulouse - Le Mirail (Toulouse2), Universite Paul
Sabatier (Toulouse3), Universite Paris Sud-11, and Universite de Versailles Saint-Quentin-
en-Yvelines (L’UVSQV).
Unlike most of the popular rankings we do not follow the construction of rankings based
on a final composite indicator obtained by aggregation of the composite indicators rep-
resentative of the different features of the institutions activity (profile, sustainability,
teaching, research, knowledge transfer, resources, and community engagement). Our goal
is to build robust rankings for each area of activity considered.
To illustrate the proposed robust analysis techniques in building composite indicators,
we rank the French and German universities of excellence across two broad categories
related to the mission and vision of higher education institutions: Academic Profile and
Institutional Sustainability.
Simple indicators for building composite indicators
For assessing the Academic Profile of a university, it is necessary to establish the role and
relative importance of the institution regionally, nationally and internationally in order to
acquire a solid understanding of the university’s enrolment prospects. Therefore, under-
standing the relative academic strengths of the institutions and the primary factors likely to
influence enrolment going forward is paramount in understanding its financial prospects. In
the analysis of Sustainability, emphasis is placed on the financial obligations carried by the
university in relation to the financial resources currently available of the institutions. In a
similar viewpoint as the CHE’ ranking, we provide a multidimensional ranking in which
single subjects (categories) are presented separately. In order to evaluate the Academic
Profile of the institutions we examined a set of variables that were possible to measure at
all the institutions and finally this category include four simple indicators: (i) percentage of
foreign students, (ii) percentage of academic staff with a PhD degree, (iii) percentage of
graduate studies (official Master’s and PhD) and (iv) percentage of graduate students
(enrolled in official Master’s and PhD).
Foreign students That is, the proportion of students with a foreign nationality to the
number of full-time students in the academic course 2007/2008. For French and German
institutions this information is collected from the websites and reports of the institutions.
Academic Staff with a Ph.D Represents the proportion of Doctors from full-time staff
number in the academic course 2007/2008. This simple indicator has been constructed
using the information published by the French Ministere de l’Enseignement Superieur et dela Recherche (MESR) and the websites and reports of the German institutions.
Graduate Studies Includes official Master’s and PhD courses offered by the institutions
in the academic course 2007/2008 relative to the overall official studies. We decide to
consider only official studies just because the non-official studies are measured by different
credits, duration, etc., which difficult the comparison between them. For French institutions
this information is collected from their websites and reports. For German institutions, the
information comes from the German Statistisches Bundesamt.Graduate Students Represents the students who are enrolled in graduate studies, that is,
in official Master’s and PhD courses in the academic course 2007/2008 relative to the total
number of students enrolled in official courses (undergraduate and graduate studies). In
both cases, the information comes from the websites and reports of the institutions.
In a second ranking, the Sustainability of the institutions is examined by looking at
the simple indicators: (i) third-party funding/total funding, (ii) employer’s expenses
160 M. Benito, R. Romera
123
Author's personal copy

(non-academic and academic staff support)/total funding, (iii) total funding/undergraduate
students and (iv) total funding/total students.
Third-party funding/total funding This simple indicator represents the income that
institutions receive for research from different public and private institutions. In Germany,
this funding comes from the German Research Foundation (DGF), the Federal Govern-
ment, the European Union, Industry and others (donations, sponsoring, etc.). Data collected
corresponds to 2008, the latest published information at the websites and reports of the
institutions. In France, third-party funding comes from the French Research National
Agency (ANR), Territorial Collectivities, the European Union, Organisms of Recherche
(CNRS, INSERM), Industry and others. This simple indicator corresponds to 2009 due to
the information for 2008 was not available. This information is provided by the French
Ministere de l’Enseignement Superieur et de la Recherche (MESR).
Employer’s expenses Represents the non-academic and academic expenses supported by
the institutions, relative to the total funding received by the institutions. It represents the
personal financial obligations carried by the university in relation to the financial resources.
This simple indicator uniquely is available for French institutions (2009), and is reported
by the MESR.
Total funding/undergraduate students This simple indicator reflects the financial
resources that institutions can arrange for his undergraduate students in facilities, invest-
ments and others. For French institutions, the information comes from the MESR (2009)
and for German institutions comes from their websites and reports (2008).
Total funding/total students This simple indicator reflects the financial resources that
institutions receive relative to the size of the institution measure as number of students
enrolled in the university. The sources of information are the same as the previous simple
indicator.
Next, the data collected from the institutions is normalized as follows. Let consider a
simple indicator Xj. If the larger the value, the better the performance of the institution (for
example, the percent of academic staff with a PhD degree), then we normalize the simple
indicator as follows
Ij ¼ 100� Xj
maxfXjg; ð3Þ
otherwise, if the smaller value, the better performance of the institution (for example,
employer’s expenses/total funding), then we normalize the simple indicator as follows,
Ij ¼ 100�minfXjgXj
: ð4Þ
In this way the maximum in each category, assigned to the best institution, is 100 points
and the rest of the institutions have scores according to their distance to the best. Once we
get the set of p normalized simple indicators I1,…, Ip the weights w1,…, wp are calculated
under the assumption that there is no external information about the weighting coefficients.
In this context, in absence of higher education expert opinions and excluding statistical
models, the initial vector of weights is computed as w(0) = (1/p,…,1/p) following a
principle of uniformity. Essentially, the true impact that a given simple indicator has on
assessing the quality of the institutions is really difficult to measure objectively, thus, an
interesting alternative is to assume that all the indicators have the same impact on the
ranking and generate small perturbations around this initial vector.
Improving quality assessment of composite indicators 161
123
Author's personal copy

Under this simulation scheme a plurality of scenarios that represent a wide range of
weights is considered, making the ranking more robust.
A key question arises about the level of perturbation s. How dependent is the position of
the ranked institution to the chosen value of s? First of all, the level of perturbation should
be small since high values of s would remove us from the principle of uniformity in the
weights that we propose in absence of higher education expert opinions. Secondly, the
higher the level of perturbation the higher the impact of the simple indicators’s variability
in the distribution of the composite indicator. In this sense, trying give answer to the
proposed question we consider different values of s and search how the ranked institutions
react under small changes in the values of s. As one can observe from Appendix 2, the
ranked positions achieved by the French universities almost remain unchanged no matter
the perturbations introduced in the weights. Only the expected ranked positions in the
range [5th-quantile, 95th-quantile] for a level of perturbation about 30% of wj present small
differences for some universities. For the German universities, the ranked positions remain
unchanged.
Based on these results, we propose to consider perturbations about 20 or 25% of wj, that
is, s = 0.2 9 wj or s = 0.25 9 wj (in this application we use the 20%) and generate
m = 100 uniform values, w(i), over the interval [(1/p) - s, (1/p) ? s]. At this point, the
underlying composite indicators CIi are calculated and the institutions are ranked
according to these values. The robust ranking based on random simulation (with
s = 0.2 9 1/p) of excellence French universities in the framework of Academic Profile
and Sustainability are shown in Tables 1 and 2, respectively. These tables display the
university ranks using the initial vector of weights, the median rank and the corresponding
5th and 95th percentiles of the distribution of its rankings. Tables 3 and 4 show the
excellence German university rankings.
From the evaluation of the Academic Profile of the French universities it is clear that
Paris8, Paris1, Strasbourg and Montpellier1 are the Top 4 universities that remain
undoubtedly in the first four positions when small perturbations around the initial vector of
weights are generated. As we move towards the middle ranked universities, the impact of
perturbations on the rank becomes more pronounced for some institutions. For example,
the University of Paris13, which is ranked in the 8th position when using uniform weights,
has a very uncertain position when acknowledging the perturbations: it could be ranked
anywhere between 5th and 11th position. The case of the University of Paris 11 offers
another pronounced example. In this case, we discover that although the University of
Paris 11 has a very good score in three of the four simple indicators, it has a percentage of
foreign students smaller than one can expect according to the rest of its scores. Thus, the
higher the percentage weighting of foreign students, the lower the value of the composite
indicator, which results in a worst position in the ranking. Universities that are ranked in
the lower end have a small degree of impact in their positions, just because these insti-
tutions have the lowest scores in all the simple indicators, thus, independently of the
weights they will be the worst in the ranking. About the Sustainability of the institutions, it
is interesting to observe that the impact of perturbations on the rank becomes more weaker
than in the previous observed ranking. This result suggests that the performance of the
institutions in all simple indicators are quite similar. For German institutions it is clear that
their positions in the ranking almost remain unchanged no matter the perturbations
introduced in the weights. Figures 1, 2, 3, 4 display the median (blue point) and the
corresponding 5th and 95th percentiles (bounds) of the distribution of the composite
indicator for French and German universities when evaluating the Academic Profile and
Sustainability.
162 M. Benito, R. Romera
123
Author's personal copy

Next, the results obtained in Tables 1 and 3 are discussed in comparison with the
university ranking obtained when using the integrative weights proposed by Ding and Qiu
(2011). There are two kind of integrative approach: ‘‘additive integration’’ and ‘‘multi-
plicative integration’’. When using uniform weights as subjective weights, we obtain that
the ‘‘multiplicative integration’’ is just the subjective weights. Ding and Qiu define the
objective weight of each simple indicator in terms of the contribution of its variation
coefficient to the total variability (computed as the total sum of variation coefficients).
The new weights obtained in ranking the French and German universities of excellence in
the Academic Profile are shown in Tables 5 and 6, respectively. Tables 7 and 8 show the
French and German university ranking using each kind of weights, respectively.
Table 1 Robust ranking forevaluating the Academic Profileperformance of the excellenceFrench universities
University Rank using uniformweights
Median rank [5th quantile,95th quantile]
Paris8 1 1 [1, 1]
Paris1 2 2 [2, 2]
Strasbourg 3 3 [3, 4]
Montpellier1 4 4 [3, 5]
Paris11 5 5 [4, 10]
Aix1 6 6 [5, 9]
Aix3 7 7 [5, 8]
Grenoble3 8 9 [7, 12]
Montpellier3 8 9 [7, 12]
Paris13 8 9 [5, 11]
Toulouse1 11 11 [8, 13]
Lille1 12 12 [9, 13]
Bourdeaux2 13 13 [10, 14]
Lyon3 14 14 [13, 14]
Aix2 15 15 [15, 15]
Bourdeaux1 16 16 [16, 18]
Grenoble2 17 17 [16, 19]
Lyon2 17 17 [16, 19]
Grenoble1 19 19 [18, 19]
Lyon1 20 20 [20, 20]
Montpellier2 21 21 [21, 21]
Toulouse2 22 22 [22, 22]
Bourdeaux4 23 23 [23, 25]
Nancy2 24 24 [23, 25]
Bourdeaux3 25 25 [23, 25]
Pau 26 26 [26, 27]
Toulouse3 27 27 [26, 29]
Lille2 28 28 [27, 29]
Metz 29 29 [27, 30]
Versailles 30 30 [29, 30]
Avignon 31 31 [31, 31]
Lille3 32 32 [32, 33]
Nancy1 33 33 [32, 33]
Improving quality assessment of composite indicators 163
123
Author's personal copy

From Tables 5 and 6 one can observe that the higher the variability of the simple
indicator, the higher the value of its weight in both, the ‘‘additive integration’’ and the
‘‘additive integration two’’, moving away from the subjective weight. We believe that with
a small number of simple indicators the final ranking will have a great bias because any
university with a very good performance in the indicator with highest variability and a
worse performance in the others will have a better position than other universities with a
good performance in all the indicators. Alternatively, if we are interested in taking into
account the variability of the indicators as Ding and Qiu propose, we can introduce the
following change in the simulation process. Suppose that the simple indicator with highest
variability should have the highest weight, wj. In such a case, one can include a restriction
Table 2 Robust ranking forevaluating the Sustainabilityperformance of the excellenceFrench universities
University Rank usinguniform weights
Median rank [5th quantile,95th quantile]
Paris11 1 1 [1, 1]
Grenoble1 2 2 [2, 2]
Strasbourg 3 3 [3, 3]
Bourdeaux1 4 4 [4, 4]
Lyon1 5 5 [5, 7]
Montpellier2 6 6 [5, 7]
Aix2 7 7 [5, 7]
Nancy1 8 8 [8, 9]
Toulouse3 9 9 [8, 9]
Bourdeaux2 10 10 [10, 10]
Lille1 11 11 [11, 11]
Pau 12 12 [12, 12]
Aix1 13 13 [13, 14]
Aix3 14 14 [14, 16]
Montpellier1 15 15 [13, 16]
Versailles 16 16 [14, 16]
Lille2 17 17 [17, 17]
Grenoble2 18 18 [18, 19]
Avignon 19 19 [18, 19]
Paris13 20 20 [20, 20]
Bourdeaux4 21 21 [21, 23]
Grenoble3 22 22 [21, 23]
Metz 23 23 [21, 23]
Lyon2 24 24 [24, 24]
Toulouse1 25 25 [25, 25]
Toulouse2 26 26 [26, 27]
Lyon3 27 27 [26, 27]
Paris8 28 28 [28, 28]
Lille3 29 29 [29, 29]
Montpellier3 30 30 [30, 30]
Nancy2 31 31 [31, 32]
Bourdeaux3 32 32 [31, 33]
Paris1 33 33 [32, 33]
164 M. Benito, R. Romera
123
Author's personal copy

over that weight in the simulation process, for instance, (1/p) \ wj \ a, where (1/p) is the
subjective weight and a is the coefficient of variation of that simple indicator. With this
restriction we can include an objective consideration about that simple indicator but the
final ranking is based on a range bracket of weights determined by subjective and objective
consideration, instead of a ranking highly influenced by the simple indicator with highest
variability.
Tables 7 and 8 show that the differences between ranks using the integrative approach
and the random simulation are bigger for the French universities. Particularly, when the
variation coefficient of some simple indicator is much bigger than the others (as we can
observe in the objective weights), this implies that institutions with a good (or bad)
performance in that simple indicator will obtain a better (or worst) ranking in the additive
integration, whereas with the random simulation they neither rewards nor penalizes for a
single simple indicators, as explained before. As an illustration, the university of Aix1 has
one of the lowest percentages of foreign students, whereas it has a very good performance
in the rest of simple indicators. Thus, using the ‘‘additive integration’’ this university is
ranked in the 11th position whereas with the random simulation it is ranked between the
5th and 9th position. The case of the University of Paris 11 and Paris 13 offer another
pronounced examples. This impact on the German universities becomes more weaker
because the performance of the institutions in all simple indicators are quite similar and the
fluctuations of the simple indicators not influence the final ranking.
Table 3 Robust ranking forevaluating the Academic Profileperformance of the excellenceGerman universities
University Rank usinguniform weights
Median rank [5th quantile,95th quantile]
Heidelberg 1 1 [1, 1]
Fu Berlin 2 2 [2, 3]
Gottingen 3 3 [2, 4]
TUMunich 4 4 [3, 4]
RWTHAachen 6 5 [5, 6]
Constance 5 6 [5, 6]
LMUMunich 7 7 [7, 7]
Freiburg 8 8 [8, 9]
Karlsruhe 9 9 [8, 9]
Table 4 Robust ranking forevaluating the Sustainabilityperformance of the excellenceGerman universities
University Rank usinguniform weights
Median rank [5th quantile,95th quantile]
TUMunich 1 1 [1, 1]
Karlsruhe 2 2 [2, 2]
RWTHAachen 3 3 [3, 3]
Constance 4 4 [4, 4]
Freiburg 5 5 [5, 6]
Gottingen 6 6 [5, 6]
Heidelberg 7 7 [7, 7]
FUBerlin 8 8 [8, 8]
LMUMunich 9 9 [9, 9]
Improving quality assessment of composite indicators 165
123
Author's personal copy

It is important to note that if we are interested in defining weights that highlights the
differences between institutions instead of uniform weights, a simple way to measure the
variability of the data is using some measure of global variability. In this way, the rele-
vance of each simple indicator can be defined in terms of the contribution of its variance to
the total variability. Then, this initial vector of weights can be used to generate random
Fig. 1 Composite indicator using uniform weights (blue point), and the corresponding distribution of thecomposite indicator (box) for the excellence French institutions in the framework of Academic Profile
166 M. Benito, R. Romera
123
Author's personal copy

simulation around it and there is no bias in the selection of weight’s vector due to sub-
jective criteria.
We may conclude that our random simulation approach is general enough to include all
the analysis carried out if Ding and Qiu’s proposal is followed.
Fig. 2 Composite indicator using uniform weights (blue point), and the corresponding distribution of thecomposite indicator (box) for the excellence French institutions in the framework of Sustainability
Improving quality assessment of composite indicators 167
123
Author's personal copy

Conclusions and extensions
The combination of stochastic simulation to generate stochastic perturbations around any
initial vector of weights and to rank universities in a range bracket provide a rigorous,
balanced and transparent complement to other models of university rankings. We believe
Fig. 3 Composite indicator using uniform weights (blue point), and the corresponding distribution of thecomposite indicator (box) for the excellence German institutions in the framework of Academic Profile
168 M. Benito, R. Romera
123
Author's personal copy
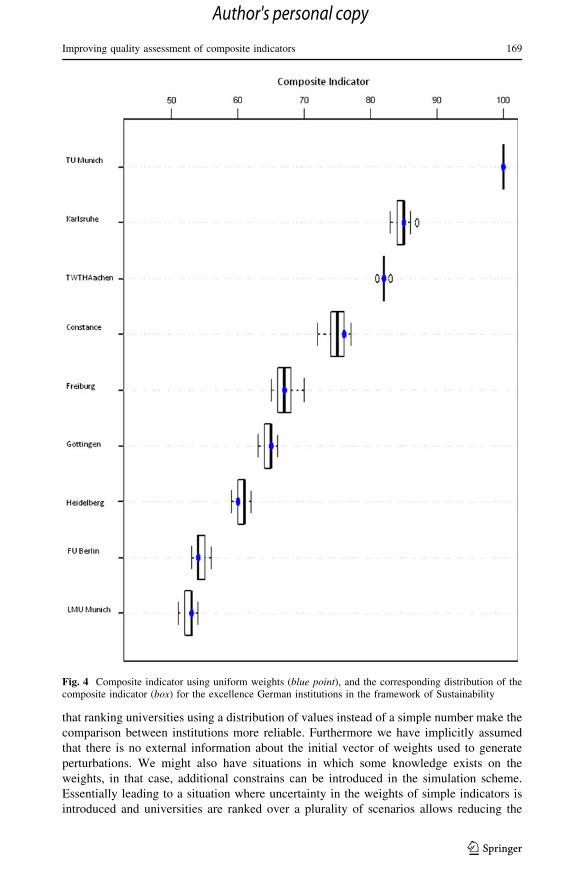
that ranking universities using a distribution of values instead of a simple number make the
comparison between institutions more reliable. Furthermore we have implicitly assumed
that there is no external information about the initial vector of weights used to generate
perturbations. We might also have situations in which some knowledge exists on the
weights, in that case, additional constrains can be introduced in the simulation scheme.
Essentially leading to a situation where uncertainty in the weights of simple indicators is
introduced and universities are ranked over a plurality of scenarios allows reducing the
Fig. 4 Composite indicator using uniform weights (blue point), and the corresponding distribution of thecomposite indicator (box) for the excellence German institutions in the framework of Sustainability
Improving quality assessment of composite indicators 169
123
Author's personal copy

Table 5 The indicator weights obtained by various kind of approach (Ding and Qiu) for ranking Frenchuniversities
Simple indicator Subjectiveweight
Objectiveweight
Additiveintegration
Additiveintegration two
Foreign students 0.25 0.580 0.522 0.415
Academic staff with a Ph.D 0.25 0.049 0.237 0.149
Graduate studies 0.25 0.245 0.343 0.248
Graduate students 0.25 0.126 0.278 0.188
Table 6 The indicator weights obtained by various kind of approach (Ding and Qiu) for ranking theGerman universities
Simple indicator Subjectiveweight
Objectiveweight
Additiveintegration
Additiveintegration two
Foreign students 0.25 0.353 0.374 0.301
Academic staff with a Ph.D 0.25 0.008 0.231 0.129
Graduate studies 0.25 0.554 0.458 0.402
Graduate students 0.25 0.085 0.263 0.168
Table 7 Ranking for French Excellence universities in the academic profile using various kind of approach
University Ranks using the weights proposed by Ding and Qiu (2011) Ranks with therandom simulation
Subjectiveweights
Objectiveweights
Additiveintegration
Additiveintegration two
[5th quantile,95th quantile]
Aix1 6 12 11 11 [5, 9]
Aix2 15 16 15 15 [15, 15]
Aix3 7 9 7 9 [5, 8]
Avignon 31 32 31 31 [31, 31]
Bourdeaux1 17 19 18 18 [16, 18]
Bourdeaux2 13 20 17 17 [10, 14]
Bourdeaux3 25 26 25 25 [23, 25]
Bourdeaux4 23 21 23 22 [23, 25]
Grenoble1 19 22 19 19 [18, 19]
Grenoble2 18 10 14 14 [16, 19]
Grenoble3 8 13 12 12 [7, 12]
Lille1 12 6 8 7 [9, 13]
Lille2 28 25 28 26 [27, 29]
Lille3 32 33 33 33 [32, 33]
Lyon1 20 24 21 23 [20, 20]
Lyon2 16 15 16 16 [16, 19]
Lyon3 14 8 9 8 [13, 14]
Montpellier1 4 11 10 10 [3, 5]
Montpellier2 21 17 20 20 [21, 21]
Montpellier3 8 14 13 13 [7, 12]
170 M. Benito, R. Romera
123
Author's personal copy

uncertainty associated with the assessment of a specific rank. The methodology proposed
in this work is illustrated ranking the French and German universities of excellence in each
of the two subject areas: Academic Profile and Institutional Sustainability. A first remark is
that those institutions with similar normalized values in all simple indicators will have a
very low variability in the composite indicator’s final distribution. Furthermore, inde-
pendently of the initial vector of weights they will be ranked in similar positions. On the
contrary, when some institution has done a very good perform in all the simple indicators
except at least one, in which has done a poor perform, that institution will have a higher
volatility in the composite indicator’s final distribution and it will be shifted several
positions in the ranking depending on the perturbations introduced in the weights’ vector.
In addition to the two algorithms proposed in this work for generating perturbations around
Table 8 Ranking for German Excellence Universities in the academic profile using various kind ofapproach
University Ranks using the weights proposed by Ding and Qiu (2011) Ranks with therandom simulation
Subjectiveweights
Objectiveweights
Additiveintegration
Additiveintegration two
[5th quantile,95th quantile]
Constance 6 8 6 6 [5, 6]
Freiburg 8 7 8 8 [8, 9]
FU Berlin 2 4 3 3 [2, 3]
Gottingen 3 2 2 2 [2, 4]
Heidelberg 1 1 1 1 [1, 1]
Karlsruhe 9 9 9 9 [8, 9]
LMU Munich 7 6 7 7 [7, 7]
RWTH Aachen 5 3 4 4 [5, 6]
TU Munich 4 5 5 5 [3, 4]
Table 7 continued
University Ranks using the weights proposed by Ding and Qiu (2011) Ranks with therandom simulation
Subjectiveweights
Objectiveweights
Additiveintegration
Additiveintegration two
[5th quantile,95th quantile]
Metz 29 27 30 29 [27, 30]
Nancy1 33 31 32 32 [32, 33]
Nancy2 24 23 24 24 [23, 25]
Paris1 2 3 2 2 [2, 2]
Paris8 1 1 1 1 [1, 1]
Paris11 5 7 6 6 [4, 10]
Paris13 8 2 4 4 [5, 11]
Pau 26 30 26 28 [26, 27]
Strasbourg 3 5 3 3 [3, 4]
Toulouse1 11 4 5 5 [8, 13]
Toulouse2 22 18 22 21 [22, 22]
Toulouse3 27 28 27 27 [26, 29]
Versailles 30 29 29 30 [29, 30]
Improving quality assessment of composite indicators 171
123
Author's personal copy

the initial vector of weights, another stochastic simulation schemes could be analyzed. This
allows for the option of searching for directions of maximum variability in the composite
indicator’s final distribution with a set of restrictions about the weights. These restrictions
would reflect prior information about the weights or include requirement for each simple
indicator to weight at least or no more that a fixed threshold.
By using the proposed robust and reliable techniques we have discovered some insta-
bilities underlying in the ranked French and German universities of excellence that had
remained invisible if the ranking had been built by standard techniques.
Appendix 1. Monte Carlo schemes
Algorithm 1
(a) Let w(0) = (w1,…,wp). Fix the radius s and the sample size m.
(b) Generate p - 1 uniform values w1(1),…, wp-1
(1) on (w1 - s,w1 ? s), (w2 - s,w2 ? s),
…, (wp-1 - s,wp-1 ? s), respectively.
(c) If (1 - (w1(1),…, wp-1
(1) )) belongs to the interval (wp - s,wp ? s) then w(1) = (w1(1),…,
wp-1(1) , 1 - (w1
(1),…, wp-1(1) )), otherwise reject.
(d) Iterate steps (b) and (c) to get w(1)… w(m).
Figure 5 shows the corresponding surface in <3 for the initial vector of weights w(0) = (1/
3,1/3,1/3) when the perturbations are generated around this point with s = 0.2wj following
Algorithm 1.
Algorithm 2
(a) Let w(0) = (w1,…,wp). Fix the radius s and the sample size m.
(b) Generate p uniform values w1(1),…, wp
(1) on (w1 - s,w1 ? s), (w2 - s,w2 ? s), …,
(wp - s,wp ? s), respectively.
(c) If (w1(1))2 +���+ (wp
(1))2 B s2, and w1(1) +…+ wp
(1) = 1, then w(1) = (w1(1),…, wp
(1)),
otherwise reject and re-select p uniform values following step b.
(d) Iterate steps (b) and (c) to get w(1)… w(m).
0.20.3
0.4
0.250.30.350.40.45
0.2
0.25
0.3
0.35
0.4
0.45
0.5
w1w2
w3
Fig. 5 Points randomlygenerated for the initial vector ofweights w(0) = (1/3,1/3,1/3) suchas they live in the intersection ofthe 3-dimensional hypercube andthe 2-simplex in R3
172 M. Benito, R. Romera
123
Author's personal copy

Ap
pen
dix
2.
Ro
bu
stra
nk
ing
usi
ng
dif
fere
nt
va
lues
of
the
lev
elo
fp
ertu
rba
tio
n
See
Tab
les
9an
d1
0.
Ta
ble
9R
ob
ust
rank
ing
for
eval
uat
ing
the
Aca
dem
icP
rofi
lep
erfo
rman
ceo
fth
eex
cell
ence
Fre
nch
un
iver
siti
esu
sin
gd
iffe
ren
tv
alu
eso
fth
ele
vel
of
per
turb
atio
ns
Med
ian
rank
[5th
qu
anti
le,
95
thq
uan
tile
]
s=
0.1
0w
js
=0
.15w
js
=0
.20w
js
=0
.25w
js
=0
.30w
js
=0
.10w
js
=0
.15w
js
=0
.20w
js
=0
.25w
js
=0
.30w
j
Aix
16
66
66
[5,
8]
[5,
8]
[5,
9]
[5,
9]
[4,
10
]
Aix
21
51
51
51
51
5[1
5,
15
][1
5,
15
][1
5,
15
][1
4,
15
][1
4,
15
]
Aix
37
77
77
[6,
7]
[5,
8]
[5,
8]
[6,
9]
[5,
8]
Av
ign
on
31
31
31
31
31
[31
,3
1]
[31
,3
1]
[31
,3
1]
[30
,3
1]
[30
,3
1]
Bou
rdea
ux
11
61
61
61
71
7[1
6,
18
][1
6,
18
][1
6,
18
][1
6,
18
][1
6,
18
]
Bou
rdea
ux
21
31
31
31
31
3[1
2,
14
][1
2,
14
][1
0,
14
][1
0,
14
][1
0,
15
]
Bou
rdea
ux
32
52
52
52
42
4[2
3,
25
][2
3,
25
][2
3,
25
][2
3,
25
][2
3,
25
]
Bou
rdea
ux
42
32
32
32
32
3[2
3,
24
][2
3,
25
][2
3,
25
][2
3,
25
][2
3,
25
]
Pau
26
26
26
26
26
[26
,2
6]
[26
,2
6]
[26
,2
7]
[26
,2
7]
[26
,2
7]
Gre
no
ble
11
91
91
91
91
9[1
9,
19
][1
8,
19
][1
8,
19
][1
8,
20
][1
7,
20
]
Gre
no
ble
21
71
71
71
71
7[1
6,
18
][1
6,
18
][1
6,
19
][1
6,
19
][1
6,
19
]
Gre
no
ble
38
99
88
[8,
11
][8
,1
2]
[7,
12
][7
,1
3]
[6,
13
]
Lil
le1
12
11
12
11
11
[10
,1
3]
[9,
12
][9
,1
3]
[8,
13
][7
,1
3]
Lil
le2
28
28
28
28
28
[28
,2
8]
[27
,2
8]
[27
,2
9]
[27
,2
9]
[27
,2
9]
Lil
le3
32
32
32
32
32
[32
,3
3]
[32
,3
3]
[32
,3
3]
[32
,3
3]
[32
,3
3]
Ly
on1
20
20
20
20
20
[20
,2
0]
[20
,2
0]
[20
,2
0]
[20
,2
0]
[20
,2
1]
Ly
on2
18
18
17
18
18
[16
,1
8]
[16
,1
9]
[16
,1
9]
[16
,1
9]
[16
,1
9]
Ly
on3
14
14
14
14
13
[13
,1
4]
[13
,1
4]
[13
,1
4]
[12
,1
4]
[12
,1
5]
Mo
ntp
elli
er1
44
44
4[4
,4
][3
,5
][3
,5
][3
,5
][3
,8
]
Mo
ntp
elli
er2
21
21
21
21
21
[21
,2
1]
[21
,2
1]
[21
,2
1]
[20
,2
1]
[20
,2
1]
Improving quality assessment of composite indicators 173
123
Author's personal copy

Tab
le9
con
tin
ued
Med
ian
ran
k[5
thq
uan
tile
,9
5th
qu
anti
le]
s=
0.1
0w
js
=0
.15w
js
=0
.20w
js
=0
.25w
js
=0
.30w
js
=0
.10w
js
=0
.15w
js
=0
.20w
js
=0
.25w
js
=0
.30w
j
Mo
ntp
elli
er3
99
99
9[7
,1
2]
[7,
12
][7
,1
2]
[6,
12
][6
,1
3]
Met
z2
92
92
92
92
9[2
9,
30
][2
8,
30
][2
7,
30
][2
7,
30
][2
7,
30
]
Nan
cy1
33
33
33
33
33
[32
,3
3]
[32
,3
3]
[32
,3
3]
[32
,3
3]
[32
,3
3]
Nan
cy2
24
24
24
24
24
[24
,2
5]
[23
,2
5]
[23
,2
5]
[23
,2
5]
[23
,2
5]
Par
is1
22
22
2[2
,2
][2
,2
][2
,2
][2
,2
][2
,2
]
Par
is8
11
11
1[1
,1
][1
,1
][1
,1
][1
,1
][1
,1
]
Par
is1
15
55
56
[5,
8]
[4,
9]
[4,
10
][4
,1
0]
[5,
10
]
Par
is1
31
09
91
09
[6,
10
][5
,1
1]
[5,
11
][5
,1
2]
[4,
12
]
Str
asb
ourg
33
33
3[3
,3
][3
,4
][3
,4
][3
,4
][3
,4
]
To
ulo
use
11
11
11
11
11
1[9
,1
2]
[9,
13
][8
,1
3]
[8,
13
][8
,1
4]
To
ulo
use
22
22
22
22
22
2[2
2,
22
][2
2,
22
][2
2,
22
][2
2,
22
][2
2,
22
]
To
ulo
use
32
72
72
72
72
7[2
7,
27
][2
7,
29
][2
6,
29
][2
6,
29
][2
6,
29
]
Ver
sail
les
30
30
30
30
30
[29
,3
0]
[29
,3
0]
[29
,3
0]
[29
,3
1]
[28
,3
1]
174 M. Benito, R. Romera
123
Author's personal copy

Ta
ble
10
Ro
bu
stra
nk
ing
for
eval
uat
ing
the
Aca
dem
icP
rofi
lep
erfo
rman
ceo
fth
eex
cell
ence
Ger
man
un
iver
siti
esu
sin
gd
iffe
ren
tv
alu
eso
fth
ep
ertu
rbat
ion
s
Med
ian
Ran
k[5
thq
uan
tile
,9
5th
qu
anti
le]
s=
0.1
0w
js
=0
.15w
js
=0
.20w
js
=0
.25w
js
=0
.30w
js
=0
.10w
js
=0
.15w
js
=0
.20w
js
=0
.25w
js
=0
.30w
j
Con
stan
ce6
66
66
[5,
6]
[5,
6]
[5,
6]
[5,
6]
[5,
6]
Fre
ibu
rg8
88
88
[8,
8]
[8,
9]
[8,
9]
[8,
9]
[8,
9]
Fu
Ber
lin
22
22
2[2
,2
][2
,3
][2
,3
][2
,3
][2
,3
]
Gott
ingen
33
33
3[3
,4
][2
,4
][2
,4
][2
,4
][2
,4
]
Hei
del
ber
g1
11
11
[1,
1]
[1,
1]
[1,
1]
[1,
1]
[1,
1]
Kar
lsru
he
99
99
9[9
,9
][8
,9
][8
,9
][8
,9
][8
,9
]
LM
UM
un
ich
77
77
7[7
,7
][7
,7
][7
,7
][7
,7
][7
,7
]
RW
TH
Aac
hen
55
55
5[5
,6
][5
,6
][5
,6
][5
,6
][5
,6
]
TU
Mun
ich
44
44
4[3
,4
][3
,4
][3
,4
][3
,4
][2
,4
]
Improving quality assessment of composite indicators 175
123
Author's personal copy

References
Aguillo, I., Bar-Ilan, J., Levene, M., & Ortega, J. L. (2010). Comparing university rankings. Scientometrics,85, 243–256.
Bastedo, M., & Bowman, N. (2010). College rankings as an interorganizational dependency: Establishingthe foundation for strategic and institutional accounts. Research in Higher Education. doi:10.1007/s11162-010-9185-0.
Centre for Higher Education Development (CHE), UNESCO European Centre for Higher Education (CE-PES), Institute for Higher Education Policy (IHEP). (2006). Berlin principles on ranking of highereducation institutions, Berlin. Available online at: http://www.che.de/downloads/Berlin/Principles/IREG/TEXTsymbol/534.pdf.
Chen, Y., & Liu, N. C. (2008). Examining major rankings according to the Berlin principles. HigherEducation in Europe, 33, 201–208.
Cook, J. M. (1958). Rational formulae for the production of a spherically symmetric probability distribution.Mathematical Tables and Other Aids to Computation, 11, 81–82.
Debreu, G. (1960). Topological methods in cardinal utility theory. In K. J. Arrow, S. Karlin, & P. Suppes(Eds.), Mathematical methods in the social sciences (pp. 16–26). Stanford: Stanford University Press.
Dill, D., & Soo, M. (2004). Is there a global definition of academic quality? A cross-national analysis ofuniversity ranking system. Public Policy for Academic Quality. Chapel Hill, NC: University of NorthCarolina.
Ding, J., & Qiu, J. (2011). An approach to improve the indicator weights of scientific and technologicalcompetitiveness evaluation of Chinese universities. Scientometrics, 86, 285–297. doi:10.1007/s11192-010-0268-7.
Federkail, G. (2008). Rankings and quality assurance in higher education. Higher Education in Europe, 33,219–231.
Geraci, M., & Degli, M. (2011). Where do Italian universities stand? An in-depth statistical analysis ofnational and international rankings. Scientometrics. doi:10.1007/s11192-011-0350-9.
Harvey, L. (Ed.) (2008). Rankings of higher education institutions: A critical review. Quality in HigherEducation, 14(3), 187–207.
Marsaglia, G. (1972). Choosing a point from the surface of a sphere. The Annals of Mathematical Statistics,43, 645–646.
Pike, G. R. (2004). Measuring quality: A comparison of U.S. News Rankings and NSSE Benchmarks.Research in Higher Education, 45(2), 193–208.
Sadlak, J., Merisotis, J., & Liu, N. C. (2008). University rankings: Seeking prestige. Raising visibility andembedding quality—the Editors’ views. Higher Education in Europe, 33, 195–199.
Saisana, M., & D’Hombres, B. (2008). Higher education rankings: Robustness and critical assessment. JRCScientific and Technical Reports, European Commission.
Saisana, M., Saltelli, A., & Tarantola, S. (2005). Uncertainty and sensitivity analysis techniques as tools forthe quality assessment of composite indicators. Journal of the Royal Statistical Association A, 168,307–323.
Stolz, I., Hendel, D., & Horn, A. (2010). Ranking of rankings: Benchmarking twenty-five higher educationranking systems in Europe. Higher Education, 60, 507–528.
Usher, A., & Savino, M. (2007). A global survey of university ranking and league tables. Higher Educationin Europe, 32(1), 5–15.
176 M. Benito, R. Romera
123
Author's personal copy
Related Documents