Improving MODIS spatial resolution for snow mapping using wavelet fusion and ARSIS concept Pascal Sirguey, Renaud Mathieu, Yves Arnaud, Muhammad Khan, Jocelyn Chanussot To cite this version: Pascal Sirguey, Renaud Mathieu, Yves Arnaud, Muhammad Khan, Jocelyn Chanussot. Improving MODIS spatial resolution for snow mapping using wavelet fusion and ARSIS concept. IEEE Geoscience and Remote Sensing Letterss, IEEE, 2008, 5 (1), pp.78-82. <10.1109/LGRS.2007.908884>. <hal-00348844> HAL Id: hal-00348844 https://hal.archives-ouvertes.fr/hal-00348844 Submitted on 22 Dec 2008 HAL is a multi-disciplinary open access archive for the deposit and dissemination of sci- entific research documents, whether they are pub- lished or not. The documents may come from teaching and research institutions in France or abroad, or from public or private research centers. L’archive ouverte pluridisciplinaire HAL, est destin´ ee au d´ epˆ ot et ` a la diffusion de documents scientifiques de niveau recherche, publi´ es ou non, ´ emanant des ´ etablissements d’enseignement et de recherche fran¸cais ou ´ etrangers, des laboratoires publics ou priv´ es.

Welcome message from author
This document is posted to help you gain knowledge. Please leave a comment to let me know what you think about it! Share it to your friends and learn new things together.
Transcript

Improving MODIS spatial resolution for snow mapping
using wavelet fusion and ARSIS concept
Pascal Sirguey, Renaud Mathieu, Yves Arnaud, Muhammad Khan, Jocelyn
Chanussot
To cite this version:
Pascal Sirguey, Renaud Mathieu, Yves Arnaud, Muhammad Khan, Jocelyn Chanussot.Improving MODIS spatial resolution for snow mapping using wavelet fusion and ARSISconcept. IEEE Geoscience and Remote Sensing Letterss, IEEE, 2008, 5 (1), pp.78-82.<10.1109/LGRS.2007.908884>. <hal-00348844>
HAL Id: hal-00348844
https://hal.archives-ouvertes.fr/hal-00348844
Submitted on 22 Dec 2008
HAL is a multi-disciplinary open accessarchive for the deposit and dissemination of sci-entific research documents, whether they are pub-lished or not. The documents may come fromteaching and research institutions in France orabroad, or from public or private research centers.
L’archive ouverte pluridisciplinaire HAL, estdestinee au depot et a la diffusion de documentsscientifiques de niveau recherche, publies ou non,emanant des etablissements d’enseignement et derecherche francais ou etrangers, des laboratoirespublics ou prives.

This article has been accepted for publication in a future issue of this journal, but has not been fully edited. Content may change prior to final publication.
78 IEEE GEOSCIENCE AND REMOTE SENSING LETTERS, VOL. 5, NO. 1, JANUARY 2008
Improving MODIS Spatial Resolution for SnowMapping Using Wavelet Fusion and ARSIS Concept
Pascal Sirguey, Renaud Mathieu, Yves Arnaud, Muhammad M. Khan,and Jocelyn Chanussot, Senior Member, IEEE
Abstract—We propose to fuse the high spatial content oftwo 250-m spectral bands of the Moderate Resolution ImagingSpectroradiometer (MODIS) into its five 500-m bands usingwavelet-based multiresolution analysis. Our objective was to testthe effectiveness of this technique to increase the accuracy ofsnow mapping in mountainous environments. To assess the per-formance of this approach, we took advantage of the simultaneitybetween the Advanced Spaceborne Thermal Emission and Re-flection Radiometer (ASTER) and MODIS sensors. With a 15-mspatial resolution, the ASTER sensor provided reference snowmaps, which were then compared to MODIS-derived snow maps.The benefit of the method was assessed through the investigationof various metrics, which showed an improvement from 3% to20%. Therefore, the enhanced snow map is of great benefit forenvironmental and hydrological applications in steep terrain.
Index Terms—ARSIS, Moderate Resolution Imaging Spectro-radiometer (MODIS), multispectral fusion, snow, wavelet.
I. INTRODUCTION
THE DAILY-repeat-time and multispectral capabilitiesof Moderate Resolution Imaging Spectroradiometer
(MODIS) make it a powerful tool for the operational mon-itoring of snow cover properties. In order to discriminatesnow from other targets, the normalized difference snow index(NDSI) is commonly used [1]–[3]. It takes advantage of thecontrast between the high reflectance of snow in the greenpart of the visible spectrum (band 4 at 555 nm) and its lowreflectance in the short-wave infrared (band 6 at 1640 nm)(see Fig. 1). The use of these bands constrains the mappingof snow cover at 500-m spatial resolution. This relativelycoarse spatial resolution limits our ability to accurately mapsnow cover, particularly when the slope becomes significant.However, the MODIS sensor also has two spectral bands at250-m spatial resolution. In their early work, Hall et al. [4]suggested using these bands to produce more detailed maps
Manuscript received April 27, 2007; revised July 13, 2007. This work wasfunded by the School of Surveying, University of Otago.
P. Sirguey and R. Mathieu are with the Global Land Ice Monitoring fromSpace New Zealand Office, School of Surveying, University of Otago, Dunedin9015, New Zealand (e-mail: [email protected]).
Y. Arnaud is with the Laboratoire de Glaciologie et Géophysiquede l’Environnement, Institut de Recherche pour le Développement–Great Ice,38402 Saint Martin d’Hères, France (e-mail: [email protected]).
M. Khan and J. Chanussot are with the Laboratoire Grenoblois de l’Image, dela Parole, du Signal et de l’Automatique/Centre National de la Recherche Scien-tifique, Département Images et Signal/Ecole Nationale Superieure d’IngenieursElectriciens de Grenoble, Domaine Universitaire, 38402 Saint Martin d’Hères,France (e-mail: [email protected]; [email protected]).
Color versions of one or more of the figures in this paper are available onlineat http://ieeexplore.ieee.org.
Digital Object Identifier 10.1109/LGRS.2007.908884
Fig. 1. Spectral signature for various snow and ice targets. Ground re-flectances were measured during fieldwork on the Glenmary Glacier, SouthIsland, New Zealand, in March 2003. The range of MODIS spectral bands 1–7is indicated.
of snow cover. The objective of this study was to investigatewhether wavelet-based image fusion between MODIS spectralbands would enable the determination of snow at 250 m andbenefit snow cover mapping in mountainous terrain. Towardthis goal, the implementation of the ARSIS concept (fromits French name “Amélioration de la Résolution Spatiale parInjection de Structures”), as well as the custom-made algorithmused in this study to map snow cover, is first described. Tovalidate the efficiency of this technique, a rigorous estimationof the improvement is carried out by comparing our MODIS-derived snow maps, obtained “with” and “without” the fusionprocess, with references obtained from simultaneous imageryacquired with the Advanced Spaceborne Thermal Emission andReflection Radiometer (ASTER).
II. METHODOLOGY
A. Image Fusion
1) Principle and Methods: In Earth observations, the grow-ing number of sensors and the variety of spatial, spectral,and temporal resolutions make satellite images suitable forfusion techniques [5]. When dealing with imagery, fusionmethods usually aim to merge the rich spatial content of ahigh-resolution (HR) image with the rich spectral content of alow spatial resolution (LR) image (e.g., typically, the HR andthe LR are the panchromatic and multispectral canals, respec-tively, for sensors such as Landsat, Ikonos, or Quickbird).
1545-598X/$25.00 © 2007 IEEE

This article has been accepted for publication in a future issue of this journal, but has not been fully edited. Content may change prior to final publication.
SIRGUEY et al.: IMPROVING MODIS SPATIAL RESOLUTION FOR SNOW MAPPING 79
Fig. 2. ARSIS concept, as implemented in the case of MODIS using theundecimated WT (adapted from Ranchin and Wald [13]).
Several methods exist to merge multispectral (MS) bandsin remote sensing. The substitution methods are based onthe transformation of a three-band composite [red greenblue (RGB)] into another color space, such as hue-intensity-saturation or principal component analysis. In the new space,the intensity image I or the first principal component PC1 holdsthe spatial information. The HR band (e.g., panchromatic) isthen used as a substitute for I or PC1 before applying theinverse transformation. These methods are adequate when theHR band is highly correlated with I or PC1 [6]. Consequently,their application should be limited to sensors designed with apanchromatic canal that overlaps the whole spectral range ofall the MS bands used in the three-band composite. Digressionsin the spectral domain may otherwise result in significantradiometric distortions [7]. Therefore, color space substitutionmethods are irrelevant to MODIS, because the HR bands are notpanchromatic and do not overlap spectrally with the LR bands.
To tackle this problem, multiresolution methods have beendesigned to extract the spatial details contained in the HRband and, subsequently, fuse or “inject” these details into theLR image. This can be achieved through different methods ofanalysis, such as high-pass filtering [8], the Laplacian pyramid[9], or wavelet transform (WT) [10], [11]. Each band is decom-posed into a low-frequency approximation that describes thetrend (radiometry) and a series of zero-mean coefficients thataccounts for the high-frequency information (spatial details).Only the spatial details are incorporated into the LR imageusing the related reconstruction method. Merging zero-meanwavelet coefficients also avoids the bias in the radiometry ofthe original image, which occurs when using substitution tech-niques [12]. Multiresolution methods are suitable for dealingwith band-to-band fusion since they extract from the image onlythe spatial details that exist at different scales.2) ARSIS Concept and Implementation: Developed by
Ranchin and Wald [13], the multiresolution-based conceptARSIS was implemented. As shown in Fig. 2, the decompo-sition of the HR image produces the first set of detail coef-ficients. These coefficients can be corrected by an adequate
TABLE ISPECIFICATIONS OF THE MODIS SPECTRAL BANDS USED
IN THE FUSION PROCESS AND THE MAPPING OF SNOW
model before being injected in the LR image to improve thequality of the synthesized image. The modified coefficients areused along with the LR image for reconstruction, making thespatial resolution of the reconstructed image the same as thatof the HR image. We used the undecimated “à trous” WTalgorithm [14], combined with Daubechies D12 wavelets, as themultiresolution decomposition approach. To avoid the impactof a resampling operator, which aims to match the size of theLR and HR images, as required by the undecimated algorithm,we took advantage of the MODIS L1B Swath Product, whichmust be gridded onto a geographic coordinate system. All bandswere first projected at a pixel size of 250 m; the LR image usedin the fusion process was provided by the approximation froma preliminary wavelet decomposition of the band to be fused(gridded at 250 m). This step guarantees that the size of the im-ages will match and that the coregistration with the detail coef-ficients extracted from the HR image is preserved. The identitymodel M1 injects unchanged coefficients and is the simplestone. However, our experimentations showed that it did notachieve good quality fusion. Thus, we implemented the moresophisticated model M2, proposed by Mangolini et al. [15],to adjust the variance and mean of the wavelet coefficientsaccording to image-dependent factors, which are derived froma second level of decomposition as follows:
CZLR1−2
= aZCZHR1−2
+ bZ
aZ = σZ(LR)/σZ(HR)
bZ = mZ(LR) − aZmZ(HR), with Z = D,V, or H
(1)
where Z accounts for the type of coefficient: horizontal, verti-cal, or diagonal. mZ(LR) and σZ(LR) are the mean and stan-dard deviation of CLR
Z2−4, respectively. Since MODIS disposes
of two HR bands and five LR bands, which are spread overthe reflective part of the spectrum, we decided to use the HRband that is spectrally the closest to the LR band to be fused.This choice is subjective and disputable; no sensitivity analyseshave yet been carried out to assess its relevance. Consequently,the spatial details of B1 were merged into those of B3 and B4;the spatial details of B2 were merged into those of B5, B6, andB7 (Table I).
B. Postprocessing and Snow Detection
Postprocessing refers to the steps required to actually mapthe snow cover. These steps are only briefly outlined. The sameprocessing strategy was applied to both the nonfused 500-mMODIS images and the fused 250-m MODIS images to ensurethat the difference of snow mapping can only be attributed tothe fusion technique.1) Topographic and Atmospheric Correction: A rigorous
3-D topographic and atmospheric correction model has been
This article has been accepted for publication in a future issue of this journal, but has not been fully edited. Content may change prior to final publication.
80 IEEE GEOSCIENCE AND REMOTE SENSING LETTERS, VOL. 5, NO. 1, JANUARY 2008
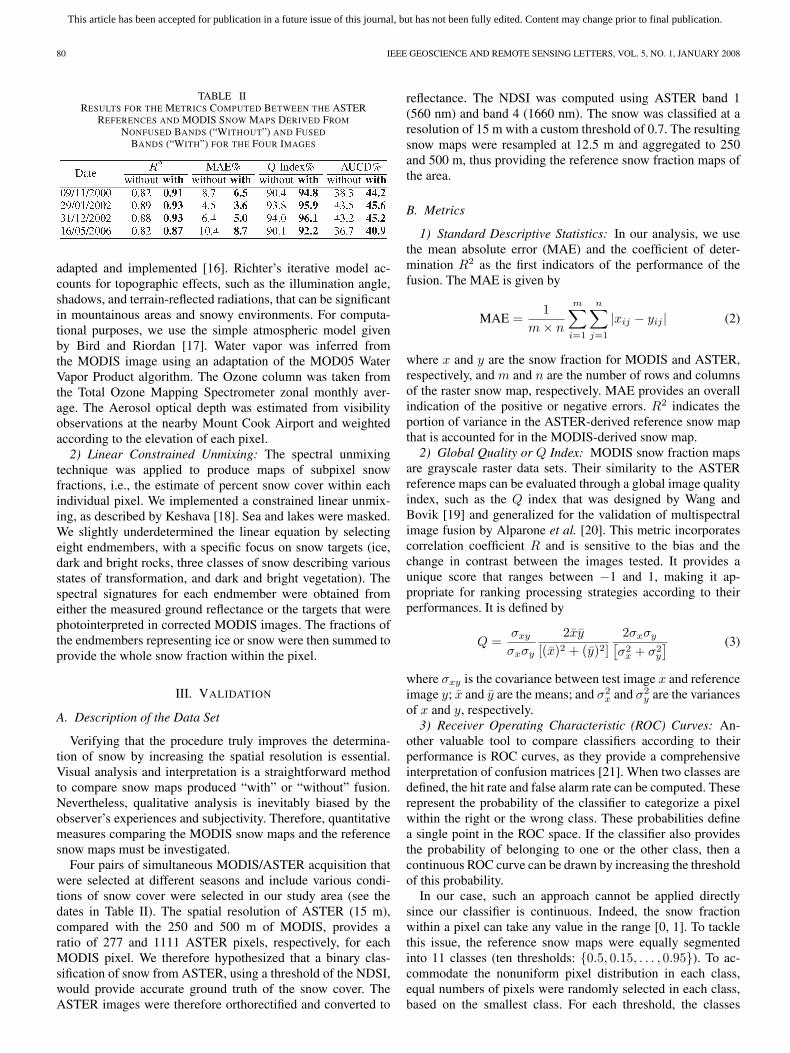
TABLE IIRESULTS FOR THE METRICS COMPUTED BETWEEN THE ASTER
REFERENCES AND MODIS SNOW MAPS DERIVED FROM
NONFUSED BANDS (“WITHOUT”) AND FUSED
BANDS (“WITH”) FOR THE FOUR IMAGES
adapted and implemented [16]. Richter’s iterative model ac-counts for topographic effects, such as the illumination angle,shadows, and terrain-reflected radiations, that can be significantin mountainous areas and snowy environments. For computa-tional purposes, we use the simple atmospheric model givenby Bird and Riordan [17]. Water vapor was inferred fromthe MODIS image using an adaptation of the MOD05 WaterVapor Product algorithm. The Ozone column was taken fromthe Total Ozone Mapping Spectrometer zonal monthly aver-age. The Aerosol optical depth was estimated from visibilityobservations at the nearby Mount Cook Airport and weightedaccording to the elevation of each pixel.2) Linear Constrained Unmixing: The spectral unmixing
technique was applied to produce maps of subpixel snowfractions, i.e., the estimate of percent snow cover within eachindividual pixel. We implemented a constrained linear unmix-ing, as described by Keshava [18]. Sea and lakes were masked.We slightly underdetermined the linear equation by selectingeight endmembers, with a specific focus on snow targets (ice,dark and bright rocks, three classes of snow describing variousstates of transformation, and dark and bright vegetation). Thespectral signatures for each endmember were obtained fromeither the measured ground reflectance or the targets that werephotointerpreted in corrected MODIS images. The fractions ofthe endmembers representing ice or snow were then summed toprovide the whole snow fraction within the pixel.
III. VALIDATION
A. Description of the Data Set
Verifying that the procedure truly improves the determina-tion of snow by increasing the spatial resolution is essential.Visual analysis and interpretation is a straightforward methodto compare snow maps produced “with” or “without” fusion.Nevertheless, qualitative analysis is inevitably biased by theobserver’s experiences and subjectivity. Therefore, quantitativemeasures comparing the MODIS snow maps and the referencesnow maps must be investigated.
Four pairs of simultaneous MODIS/ASTER acquisition thatwere selected at different seasons and include various condi-tions of snow cover were selected in our study area (see thedates in Table II). The spatial resolution of ASTER (15 m),compared with the 250 and 500 m of MODIS, provides aratio of 277 and 1111 ASTER pixels, respectively, for eachMODIS pixel. We therefore hypothesized that a binary clas-sification of snow from ASTER, using a threshold of the NDSI,would provide accurate ground truth of the snow cover. TheASTER images were therefore orthorectified and converted to
reflectance. The NDSI was computed using ASTER band 1(560 nm) and band 4 (1660 nm). The snow was classified at aresolution of 15 m with a custom threshold of 0.7. The resultingsnow maps were resampled at 12.5 m and aggregated to 250and 500 m, thus providing the reference snow fraction maps ofthe area.
B. Metrics
1) Standard Descriptive Statistics: In our analysis, we usethe mean absolute error (MAE) and the coefficient of deter-mination R2 as the first indicators of the performance of thefusion. The MAE is given by
MAE =1
m × n
m∑
i=1
n∑
j=1
|xij − yij | (2)
where x and y are the snow fraction for MODIS and ASTER,respectively, and m and n are the number of rows and columnsof the raster snow map, respectively. MAE provides an overallindication of the positive or negative errors. R2 indicates theportion of variance in the ASTER-derived reference snow mapthat is accounted for in the MODIS-derived snow map.2) Global Quality or Q Index: MODIS snow fraction maps
are grayscale raster data sets. Their similarity to the ASTERreference maps can be evaluated through a global image qualityindex, such as the Q index that was designed by Wang andBovik [19] and generalized for the validation of multispectralimage fusion by Alparone et al. [20]. This metric incorporatescorrelation coefficient R and is sensitive to the bias and thechange in contrast between the images tested. It provides aunique score that ranges between −1 and 1, making it ap-propriate for ranking processing strategies according to theirperformances. It is defined by
Q =σxy
σxσy
2xy
[(x)2 + (y)2]2σxσy[
σ2x + σ2
y
] (3)
where σxy is the covariance between test image x and referenceimage y; x and y are the means; and σ2
x and σ2y are the variances
of x and y, respectively.3) Receiver Operating Characteristic (ROC) Curves: An-
other valuable tool to compare classifiers according to theirperformance is ROC curves, as they provide a comprehensiveinterpretation of confusion matrices [21]. When two classes aredefined, the hit rate and false alarm rate can be computed. Theserepresent the probability of the classifier to categorize a pixelwithin the right or the wrong class. These probabilities definea single point in the ROC space. If the classifier also providesthe probability of belonging to one or the other class, then acontinuous ROC curve can be drawn by increasing the thresholdof this probability.
In our case, such an approach cannot be applied directlysince our classifier is continuous. Indeed, the snow fractionwithin a pixel can take any value in the range [0, 1]. To tacklethis issue, the reference snow maps were equally segmentedinto 11 classes (ten thresholds: {0.5, 0.15, . . . , 0.95}). To ac-commodate the nonuniform pixel distribution in each class,equal numbers of pixels were randomly selected in each class,based on the smallest class. For each threshold, the classes

This article has been accepted for publication in a future issue of this journal, but has not been fully edited. Content may change prior to final publication.
SIRGUEY et al.: IMPROVING MODIS SPATIAL RESOLUTION FOR SNOW MAPPING 81
Fig. 3. Visual performance in estimating the snow fraction (Mount CookArea, South Island, New Zealand; December 31, 2002 22:35 GMT). (a) Falsecolor RGB composite from MODIS bands 1, 2 (250 m), and 3 (fused to 250 m).(b) Reference from ASTER (15 m) aggregated at 250 m. (c) MODIS-derivedsnow map without fused bands at 500 m. (d) MODIS-derived snow map withfused bands at 250 m.
are gathered into two sets of pixels that are defined as beinglower or greater than the given threshold. A ROC curve canthen be drawn from the histograms of the MODIS-derived snowfraction for each of these two sets.
The visual interpretation of the curves for both products,“with” or “without” fusion, enables us to identify the processthat performs best. This 2-D representation can also be reducedto a single scalar value by computing the Area Under the Curveand the no-Discrimination (or “pure guessing”) line (AUCD).This metric is a statistical indicator of the ability of a classifierto correctly sort pixels into their respective classes.
IV. RESULT AND DISCUSSION
For one MODIS image, as shown in Fig. 3(a), and thecorresponding ASTER reference snow map [Fig. 3(b)], theMODIS-derived snow maps at 500 m [Fig. 3(c)] and 250 m[Fig. 3(d)] illustrate the resolution improvement obtained withthe fusion. The visual interpretation of the snow maps for eachgranule leads us to consider the fused product as “significantlybetter” than the nonfused one, because more details could beseen in the 250-m maps. This richer spatial information gener-ally matched well the features that are depicted in the 15-mASTER reference image. From a quantitative point of view,however, comparing images of different spatial resolutionsraises issues that are related to multiscale analysis. Not all met-rics are suitable in assessing the gain of information generatedby an increase in spatial resolution. For instance, if we imaginehaving only one pixel for the whole area to which we apply
Fig. 4. Linear regression. (a) Snow fraction from MODIS 500-m bands versusthe ASTER reference and (b) snow fraction from MODIS 250-m fused bandsaggregated at 500 m versus the ASTER reference.
the unmixing method, the fraction of snow is likely to be closeto the true value if the linear model is robust. In this case, theperformance, in terms of the estimation of the snow cover area(SCA), would be high. However, the quantity of informationin terms of spatial distribution would be dramatically reduced.On the other hand, when applying unmixing to smaller butmore abundant pixels, the uncertainties originating from eachpixel would be summed, and a slight bias in the unmixingprocess would be multiplied as the spatial resolution increases.This may result in a possible larger digression of the SCA;however, the determination of snow presence on a pixel basiswill be dramatically improved. In our investigation, two images(11/09/00 and 29/01/02) showed a 1.5% and 1% improvementin the estimation of their SCA. However, there was no, orvery small, deterioration observed for the two other images.Although the SCA, overall, dropped from 4.1% overestimationwithout fusion to 1.9% with fusion, integral metrics such asthe SCA are not appropriate for assessing the improvementof snow cover determination gained by the fusion process.Therefore, we used metrics that work at the “pixel scale” andaccount for pixel-to-pixel digression (e.g., R, MAE, and Q),because they are more sensitive to the performance in termsof spatial distribution of the snow fraction and thus are moreappropriate for assessing the accuracy of the mapping process.Nevertheless, in order to be compared, all metrics should beestablished based on maps having the same number of samples.The 250-m snow maps obtained for MODIS fused bands weretherefore aggregated to 500 m prior to computing the metrics.
The plots of the snow fractions from the MODIS-derivedsnow maps versus the true equivalent ASTER snow fractionsare given in Fig. 4. Fig. 4(a) represents the 500-m map obtainedfrom the nonfused bands, and Fig. 4(b) shows the 250-m mapobtained from the fused bands. The product obtained with thefusion method exhibits less point dispersion around the 1 : 1ratio line, meaning a better determination. The results for thevarious metrics and the four granules investigated are givenin Table II. For all granules, we observe a favorable evolutionof coefficient R2 when the fusion was processed. An averageincrease of 6.1% was obtained. Likewise, the MAE improvedsignificantly, dropping by about 20% on average. The evolutionof these two standard statistics illustrates the reduced dispersionshown in the estimation of the snow fraction (Fig. 4). The Q in-dex also increased by 3%. For all investigated thresholds (exam-ples of the ROC curves for two thresholds are given in Fig. 5),

This article has been accepted for publication in a future issue of this journal, but has not been fully edited. Content may change prior to final publication.
82 IEEE GEOSCIENCE AND REMOTE SENSING LETTERS, VOL. 5, NO. 1, JANUARY 2008
Fig. 5. ROC curves for two thresholds at 0.45 and 0.65 (Mount Cook Area,South Island, New Zealand; December 31, 2002).
the ROC curves of the fused bands also tended toward a betterdetermination of the snow classes. The scores reported inTable II for AUCD are the average values of all ROC curves,increasing by 9% on average. The differences observed in themagnitude of change for each metric illustrate the difficultyof finding a perfect indicator to assess the effectiveness ofthis approach. Nevertheless, using various metrics that show acoherent trend confirms the robustness of the method and ob-jectively validates a significant added value. However, althoughall metrics show that a better estimation of the snow fractionwithin the pixel can be achieved at the 500-m spatial resolution,by aggregating the 250-m spatial-resolution products to 500 m,none of them truly accounts for the fact that the snow fractionscan now be mapped at 250 m. At 250 m, the R2 betweenthe MODIS-derived snow maps “with” fusion and the ASTERreference reached 0.84, on average, proving that the methodis still competitive at this scale. In the future, however, ametric that would score the snow maps without the need to becomputed at the same spatial resolution would be interesting.An average distance between the snowlines extracted from theMODIS-derived snow map and the 15-m ASTER snow mapcould be investigated as a possible relevant metric to assessthe performance of snow cover definition. On the other hand,the multiplication of the processing step makes this algorithmtime consuming. The unmixing technique also has constraintswith regard to the number of endmembers, which limit its useto relatively small areas where a limited number of land covertypes are known. This method is therefore appropriate, at thistime, only for use at the local scale.
V. CONCLUSION
In this letter, we investigated the improvement that can beachieved by using wavelet fusion between MODIS spectralbands for mapping snow cover at a higher spatial resolu-tion. The ARSIS fusion concept, along with the M2 model,proved to be efficient. Qualitative analyses and rigorous metricshave been used to assess this result. The use of simultaneousASTER acquisition also enabled us to compare our productswith detailed reference maps without time lag. All validationtechniques showed a significant trend toward improvement anddemonstrate that the snow fraction can be more accuratelyestimated with the fused 250-m MODIS-derived snow map.The enhanced snow map is therefore of great benefit for en-vironmental and hydrological applications in steep terrain.
ACKNOWLEDGMENT
The authors would like to thank Prof. M. Fily, Head of theLaboratoire de Glaciologie et Géophysique de l’Environnement(Grenoble, France), for his support.
REFERENCES
[1] R. G. Crane and M. R. Anderson, “Satellite discrimination of snow/cloudsurfaces,” Int. J. Remote Sens., vol. 5, no. 1, pp. 213–223, 1984.
[2] J. Dozier, “Spectral signature of alpine snow cover from theLandsat thematic mapper,” Remote Sens. Environ., vol. 28, pp. 9–22,1989.
[3] D. K. Hall, G. Riggs, V. V. Salomonson, N. E. DiGirolamo, and K. J. Bayr,“MODIS snow-cover products,” Remote Sens. Environ., vol. 83, no. 1,pp. 181–194, Nov. 2002.
[4] D. K. Hall, G. A. Riggs, and V. V. Salomonson, “Development of methodsfor mapping global snow cover using moderate resolution imaging spec-troradiometer data,” Remote Sens. Environ., vol. 54, no. 2, pp. 127–140,Nov. 1995.
[5] L. Wald, Data Fusion: Definitions and Architectures (Fusion of Images ofDifferent Spatial Resolutions). Paris, France: Les Presses de l’Ecole desMines de Paris, 2002.
[6] M. González-Audicana, J. L. Saleta, R. G. Catalán, and R. García, “Fusionof multispectral and panchromatic images using improved IHS and PCAmergers based on wavelet decomposition,” IEEE Trans. Geosci. RemoteSens., vol. 42, no. 6, pp. 1291–1299, Jun. 2004.
[7] T.-M. Tu, P. S. Huang, C.-L. Hung, and C.-P. Chang, “A fast intensity-hue-saturation fusion technique with spectral adjustment for IKONOSimagery,” IEEE Geosci. Remote Sens. Lett., vol. 1, no. 4, pp. 309–312,Oct. 2004.
[8] P. S. J. Chavez, S. C. Sides, and J. A. Anderson, “Comparison of three dif-ferent methods to merge multiresolution and multispectral data: LandsatTM and SPOT panchromatic,” Photogramm. Eng. Remote Sens., vol. 57,no. 3, pp. 265–303, 1991.
[9] B. Aiazzi, L. Alparone, F. Argenti, and S. Baronti, “Wavelet andpyramid techniques for multisensor data fusion: A performance com-parison varying with scale ratios,” in Proc. SPIE—Image SignalProcess. For Remote Sensing V, S. B. Serpico, Ed., Dec. 1999, vol. 3871,pp. 251–262.
[10] T. Ranchin and L. Wald, “The wavelet transform for the analysis ofremotely sensed images,” Int. J. Remote Sens., vol. 14, no. 3, pp. 615–619, Feb. 1993.
[11] B. Garguet-Duport, J. Girel, J.-M. Chassery, and G. Pautou, “The useof multiresolution analysis and wavelet transform for merging SPOTpanchromatic and multispectral imagery data,” Photogramm. Eng. Re-mote Sens., vol. 62, no. 9, pp. 1057–1066, 1996.
[12] S. Li, J. T. Kwok, and Y. Wang, “Using the discrete wavelet frame trans-form to merge Landsat TM and SPOT panchromatic images,” Inf. Fusion,vol. 3, no. 1, pp. 17–23, Mar. 2002.
[13] T. Ranchin and L. Wald, “Fusion of high spatial and spectral resolutionimages: The ARSIS concept and its implementation,” Photogramm. Eng.Remote Sens., vol. 66, no. 1, pp. 49–61, 2000.
[14] M. J. Shensa, “The discrete wavelet transform: Wedding the a trousand Mallat algorithms,” IEEE Trans. Signal Process., vol. 40, no. 10,pp. 2464–2482, Oct. 1992.
[15] M. Mangolini, T. Ranchin, and L. Wald, “Procédé et dispositif pourl’amélioration de la résolution spatiale d’images à partir d’autresimages de meilleure résolution spatiale,” French Patent 92-13 961,Nov. 1992.
[16] R. Richter, “Correction of satellite imagery over mountainous terrain,”Appl. Opt., vol. 37, no. 18, pp. 4004–4015, Jun. 1998.
[17] R. E. Bird and C. Riordan, “Simple solar model for direct and dif-fuse irradiance on horizontal and tilted planes at the earth’s surface forcloudless atmosphere,” J. Clim. Appl. Meteorol., vol. 25, pp. 87–97,1986.
[18] N. Keshava, “A survey of spectral unmixing algorithms,” Lincoln Lab. J.,vol. 14, no. 1, pp. 55–78, 2003.
[19] Z. Wang and A. C. Bovik, “A universal image quality index,” IEEE SignalProcess. Lett., vol. 9, no. 3, pp. 81–84, Mar. 2002.
[20] L. Alparone, S. Baronti, A. Garzelli, and F. Nencini, “A global qualitymeasurement of pan-sharpened multispectral imagery,” IEEE Geosci. Re-mote Sens. Lett., vol. 1, no. 4, pp. 313–317, Oct. 2004.
[21] T. Fawcett, “ROC Graphs: Notes and Practical Considerations forResearchers,” HP Lab., Palo Alto, CA, Tech. Rep., 2004.
Related Documents