Improving metadata infrastructure for complex surveys: Insights from the Fragile Families Challenge Alexander T. Kindel 1* , Vineet Bansal 2 , Kristin D. Catena 3 , Thomas H. Hartshorne 3 , Kate Jaeger 3 , Dawn Koffman 3 , Sara McLanahan 1,3 , Maya Phillips 4 , Shiva Rouhani 3 , Ryan Vinh 5 , Matthew J. Salganik 1,2,3 1 Department of Sociology, Princeton University 2 Center for Statistics and Machine Learning, Princeton University 3 Office of Population Research, Princeton University 4 Department of Computer Science, Princeton University 5 Department of Philosophy, Princeton University WP18-10-FF

Welcome message from author
This document is posted to help you gain knowledge. Please leave a comment to let me know what you think about it! Share it to your friends and learn new things together.
Transcript
Improving metadata infrastructure for complex surveys: Insights from the Fragile Families Challenge
Alexander T. Kindel1*, Vineet Bansal2, Kristin D. Catena3, Thomas H. Hartshorne3, Kate Jaeger3, Dawn Koffman3, Sara McLanahan1,3, Maya Phillips4, Shiva Rouhani3, Ryan Vinh5,
Matthew J. Salganik1,2,3
1 Department of Sociology, Princeton University 2 Center for Statistics and Machine Learning, Princeton University
3 Office of Population Research, Princeton University 4 Department of Computer Science, Princeton University
5 Department of Philosophy, Princeton University
WP18-10-FF
Improving metadata infrastructure for complex surveys: Insights from the Fragile Families Challenge 1
Alexander T. Kindel1*, Vineet Bansal2, Kristin D. Catena3, Thomas H. Hartshorne3, Kate Jaeger3, Dawn Koffman3, Sara McLanahan1,3, Maya Phillips4,
Shiva Rouhani3, Ryan Vinh5, Matthew J. Salganik1,2,3
1 Department of Sociology, Princeton University 2 Center for Statistics and Machine Learning, Princeton University
3 Office of Population Research, Princeton University 4 Department of Computer Science, Princeton University
5 Department of Philosophy, Princeton University
* Corresponding author ([email protected])
Abstract Researchers rely on metadata systems to prepare data for analysis. As the complexity of datasets increases and the breadth of data analysis practices grow, existing metadata systems can limit the efficiency and quality of data preparation. This article describes the redesign of a metadata system supporting the Fragile Families and Child Wellbeing Study based on the experiences of participants in the Fragile Families Challenge. We demonstrate how treating metadata as data—that is, releasing comprehensive information about variables in a format amenable to both automated and manual processing—can make the task of data preparation less arduous and less error-prone for all types of data analysis. We hope that our work will facilitate new applications of machine learning methods to longitudinal surveys and inspire research on data preparation in the social sciences. We have open-sourced the tools we created so that others can use and improve them.
Keywords metadata, survey research, data sharing, quantitative methodology, computational social science
1 We thank all the participants in the Fragile Families Challenge who shared their data processing scripts and stories with us, particularly Greg Gundersen for creating the first version of machine-actionable Fragile Families metadata. We also thank Ian Lundberg who hosted several of the getting started workshops, supported participants throughout the Challenge, and shared his own experiences with survey metadata. Participants in the Princeton Sociology Proseminar provided valuable feedback on a draft of the article, and Brandon Stewart provided catalytic conversation. We thank Ian Fellows for his help with the R package, Greg Gundersen for his help with the Python package, and Cambria Naslund for her assistance with the question text data. Finally, we gratefully acknowledge grant support from the Russell Sage Foundation, NIH grant R24-HD047879 to the Office of Population Research, and an NSF Graduate Research Fellowship. Funding for the Fragile Families and Child Wellbeing Study was provided by the Eunice Kennedy Shriver National Institute of Child Health and Human Development through grants R01HD36916, R01HD39135, and R01HD40421 and by a consortium of private foundations, including the Robert Wood Johnson Foundation.
1. Introduction Social scientists working with public data rely on metadata systems to navigate, interpret, and prepare datasets for analysis. Metadata systems are critical research infrastructure: they provide researchers with an overview of the data, enable them to make informed choices about data preparation (recoding responses, dropping observations, etc.), and scaffold other crucial data processing steps that precede statistical modeling. Traditionally, metadata systems in the social sciences have been formatted as sets of questionnaires, codebooks, and other written documentation. Learning to use these materials proficiently is widely considered a “massive professional investment” (Abbott 2007; also see Freese 2007), particularly for researchers working in areas that draw heavily on data collected through complex, longitudinal survey designs. Recently, researchers across the social sciences have begun to analyze data in new ways by applying techniques from machine learning. Algorithmic approaches to specifying models and selecting variables have been used to enhance existing approaches in explanatory social research, and techniques designed for optimal predictive modeling and data exploration open social science to a complementary set of analytic goals (Watts 2014; McFarland, Lewis & Goldberg 2014; Mullainathan & Spiess 2017; Athey 2018). Yet machine learning methods also amplify the costs and challenges of data preparation. Existing metadata systems can support standard methodological approaches in survey research, where researchers typically construct models using a small number of variables. But these systems do not scale well to machine learning methods, a setting where researchers regularly work with hundreds or thousands of variables. As machine learning methods become more popular, researchers will need to design new metadata systems that can facilitate the use of these techniques. In this article, we explore one approach to designing metadata systems: treating metadata as data. As we describe in more detail below, this design principle emerged from observing the experiences of participants in the Fragile Families Challenge (hereafter “the Challenge”; for more on the Challenge, see the introduction to this special issue) as they attempted to navigate the metadata system for the Fragile Families and Child Wellbeing Study (FFCWS). As we observed Challenge participants, a unifying theme emerged: the task of preparing the data was a major obstacle, often preventing users from engaging more fully in the predictive modeling task at the heart of the Challenge. Participants reported substantial difficulty in extracting basic information about each variable, frequently requested machine-readable metadata that were not available at the time of the Challenge, and occasionally attempted to construct important metadata fields (e.g. variable types) independently. Our subsequent redesign of the FFCWS metadata system follows their lead: we transformed a human-readable set of PDF documents into a machine-actionable system organized around a single CSV file, containing comprehensive metadata on all variables collected since the start of the study. The redesigned system standardizes existing variables, provides an expanded set of metadata fields that reveal the data creators’ previously tacit knowledge about each variable, and makes the metadata available in a wide range of formats that support both manual and automated reading. This new metadata system streamlines the task of preparing FFCWS data for analysis, and we hope that it inspires future work to better scaffold new forms of data analysis in the social sciences.
2
Our particular contribution to the broader problem of metadata system design is twofold: we specify a few ways that the architecture of traditional metadata systems can make data preparation difficult, and we highlight data preparation as an essential yet relatively under-examined part of the research process. We hope that these insights are useful for working researchers, data creators, methodologists, funders, and anyone else interested in addressing obstacles to methodological progress in the social sciences. We view our work as complementary to works that advocate metadata standards (e.g. the Data Documentation Initiative or DDI; see Vardigan 2013); offer general tools for data preparation (e.g. Wickham 2014); and situate machine learning methods in the social sciences (e.g. Athey 2018; Evans & Aceves 2016). The rest of the paper proceeds as follows. We begin by reviewing how data pipelines are typically organized in social science research with longitudinal survey data. To illustrate concretely how the organization of metadata can hinder data users, we next discuss what happened when Challenge participants—a large, heterogeneously trained group of researchers—attempted to apply a broad range of machine learning techniques to FFCWS data in ways that were never envisioned by its creators. We then review our efforts to make these data more amenable to a wider range of modeling tools. We conclude by outlining future goals for research on metadata systems. 2. Data pipelines in survey research To understand some of the key obstacles to incorporating machine learning techniques into social science research, it is helpful to understand how data processing is typically organized in survey research, particularly research that makes use of large, public, longitudinal survey datasets. Figure 1 depicts an idealized data pipeline. In the first part of the pipeline, information is collected about the world and 2
organized into data. Next, researchers use these general-purpose data to prepare analytic datasets, which are customized for particular research questions and modeling techniques. Researchers conduct data analysis with these datasets in order to estimate quantities of interest. For the most part, research in this area involves estimating and interpreting regression coefficients ( — see Abbott 1988; Breiman 2001;β
︿
Raftery 2001). More recently, researchers have begun to explore the uses of prediction ( ) in socialy︿ science (Breiman 2001; Hofman et al. 2017; Mullainathan & Spiess 2017). Predictive modeling techniques from machine learning are promising in part because they offer automated methods for selecting variables and specifying models with high-dimensional data, or data with more variables than observations (for a review see Athey 2018). In principle, machine learning methods make it possible to use thousands of variables as easily and effectively as using tens of variables in a regression model.
2 The idea of a data pipeline was inspired by Eckel and Peng (2009). We note that this is a simplified representation, and we do not mean to reduce all research to data processing. Developing insights from data tends to be a more complex and iterative activity than we portray here, and involves many more varieties of intellectual work that inform but do not directly involve data processing (e.g. talking with colleagues or reading relevant published works).
3
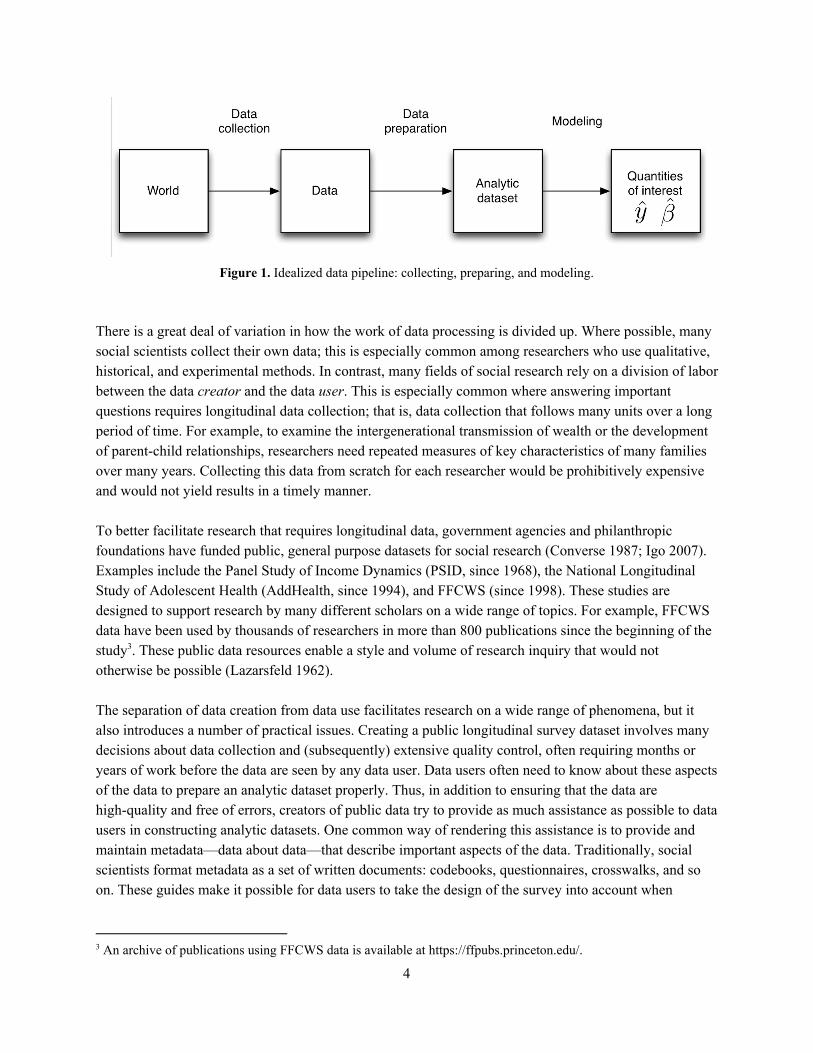
Figure 1. Idealized data pipeline: collecting, preparing, and modeling.
There is a great deal of variation in how the work of data processing is divided up. Where possible, many social scientists collect their own data; this is especially common among researchers who use qualitative, historical, and experimental methods. In contrast, many fields of social research rely on a division of labor between the data creator and the data user. This is especially common where answering important questions requires longitudinal data collection; that is, data collection that follows many units over a long period of time. For example, to examine the intergenerational transmission of wealth or the development of parent-child relationships, researchers need repeated measures of key characteristics of many families over many years. Collecting this data from scratch for each researcher would be prohibitively expensive and would not yield results in a timely manner. To better facilitate research that requires longitudinal data, government agencies and philanthropic foundations have funded public, general purpose datasets for social research (Converse 1987; Igo 2007). Examples include the Panel Study of Income Dynamics (PSID, since 1968), the National Longitudinal Study of Adolescent Health (AddHealth, since 1994), and FFCWS (since 1998). These studies are designed to support research by many different scholars on a wide range of topics. For example, FFCWS data have been used by thousands of researchers in more than 800 publications since the beginning of the study . These public data resources enable a style and volume of research inquiry that would not 3
otherwise be possible (Lazarsfeld 1962). The separation of data creation from data use facilitates research on a wide range of phenomena, but it also introduces a number of practical issues. Creating a public longitudinal survey dataset involves many decisions about data collection and (subsequently) extensive quality control, often requiring months or years of work before the data are seen by any data user. Data users often need to know about these aspects of the data to prepare an analytic dataset properly. Thus, in addition to ensuring that the data are high-quality and free of errors, creators of public data try to provide as much assistance as possible to data users in constructing analytic datasets. One common way of rendering this assistance is to provide and maintain metadata—data about data—that describe important aspects of the data. Traditionally, social scientists format metadata as a set of written documents: codebooks, questionnaires, crosswalks, and so on. These guides make it possible for data users to take the design of the survey into account when
3 An archive of publications using FFCWS data is available at https://ffpubs.princeton.edu/.
4
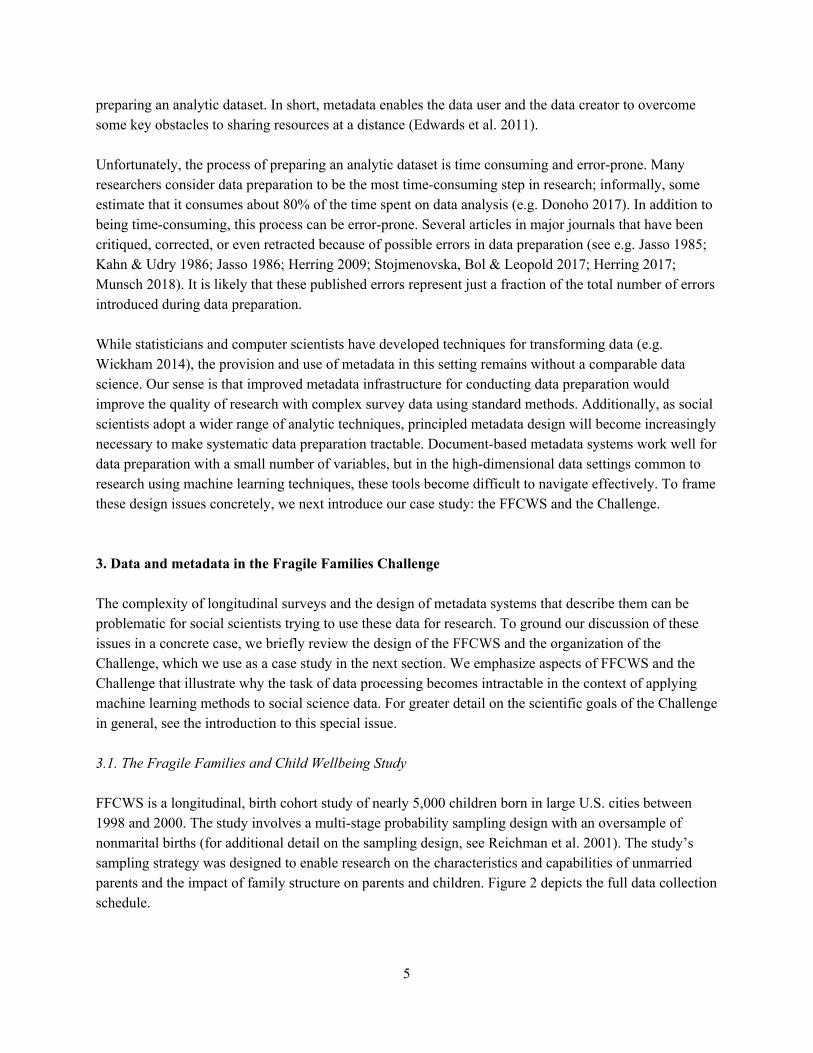
preparing an analytic dataset. In short, metadata enables the data user and the data creator to overcome some key obstacles to sharing resources at a distance (Edwards et al. 2011). Unfortunately, the process of preparing an analytic dataset is time consuming and error-prone. Many researchers consider data preparation to be the most time-consuming step in research; informally, some estimate that it consumes about 80% of the time spent on data analysis (e.g. Donoho 2017). In addition to being time-consuming, this process can be error-prone. Several articles in major journals that have been critiqued, corrected, or even retracted because of possible errors in data preparation (see e.g. Jasso 1985; Kahn & Udry 1986; Jasso 1986; Herring 2009; Stojmenovska, Bol & Leopold 2017; Herring 2017; Munsch 2018). It is likely that these published errors represent just a fraction of the total number of errors introduced during data preparation. While statisticians and computer scientists have developed techniques for transforming data (e.g. Wickham 2014), the provision and use of metadata in this setting remains without a comparable data science. Our sense is that improved metadata infrastructure for conducting data preparation would improve the quality of research with complex survey data using standard methods. Additionally, as social scientists adopt a wider range of analytic techniques, principled metadata design will become increasingly necessary to make systematic data preparation tractable. Document-based metadata systems work well for data preparation with a small number of variables, but in the high-dimensional data settings common to research using machine learning techniques, these tools become difficult to navigate effectively. To frame these design issues concretely, we next introduce our case study: the FFCWS and the Challenge. 3. Data and metadata in the Fragile Families Challenge The complexity of longitudinal surveys and the design of metadata systems that describe them can be problematic for social scientists trying to use these data for research. To ground our discussion of these issues in a concrete case, we briefly review the design of the FFCWS and the organization of the Challenge, which we use as a case study in the next section. We emphasize aspects of FFCWS and the Challenge that illustrate why the task of data processing becomes intractable in the context of applying machine learning methods to social science data. For greater detail on the scientific goals of the Challenge in general, see the introduction to this special issue. 3.1. The Fragile Families and Child Wellbeing Study FFCWS is a longitudinal, birth cohort study of nearly 5,000 children born in large U.S. cities between 1998 and 2000. The study involves a multi-stage probability sampling design with an oversample of nonmarital births (for additional detail on the sampling design, see Reichman et al. 2001). The study’s sampling strategy was designed to enable research on the characteristics and capabilities of unmarried parents and the impact of family structure on parents and children. Figure 2 depicts the full data collection schedule.
5
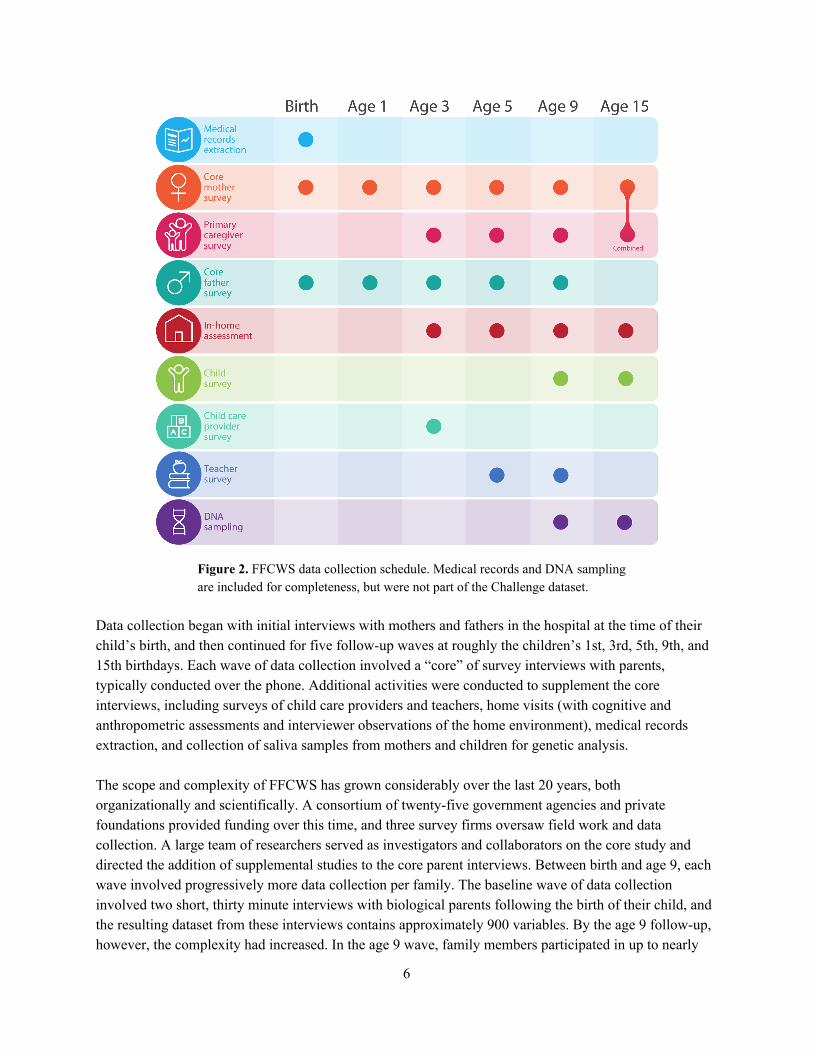
Figure 2. FFCWS data collection schedule. Medical records and DNA sampling are included for completeness, but were not part of the Challenge dataset.
Data collection began with initial interviews with mothers and fathers in the hospital at the time of their child’s birth, and then continued for five follow-up waves at roughly the children’s 1st, 3rd, 5th, 9th, and 15th birthdays. Each wave of data collection involved a “core” of survey interviews with parents, typically conducted over the phone. Additional activities were conducted to supplement the core interviews, including surveys of child care providers and teachers, home visits (with cognitive and anthropometric assessments and interviewer observations of the home environment), medical records extraction, and collection of saliva samples from mothers and children for genetic analysis. The scope and complexity of FFCWS has grown considerably over the last 20 years, both organizationally and scientifically. A consortium of twenty-five government agencies and private foundations provided funding over this time, and three survey firms oversaw field work and data collection. A large team of researchers served as investigators and collaborators on the core study and directed the addition of supplemental studies to the core parent interviews. Between birth and age 9, each wave involved progressively more data collection per family. The baseline wave of data collection involved two short, thirty minute interviews with biological parents following the birth of their child, and the resulting dataset from these interviews contains approximately 900 variables. By the age 9 follow-up, however, the complexity had increased. In the age 9 wave, family members participated in up to nearly
6
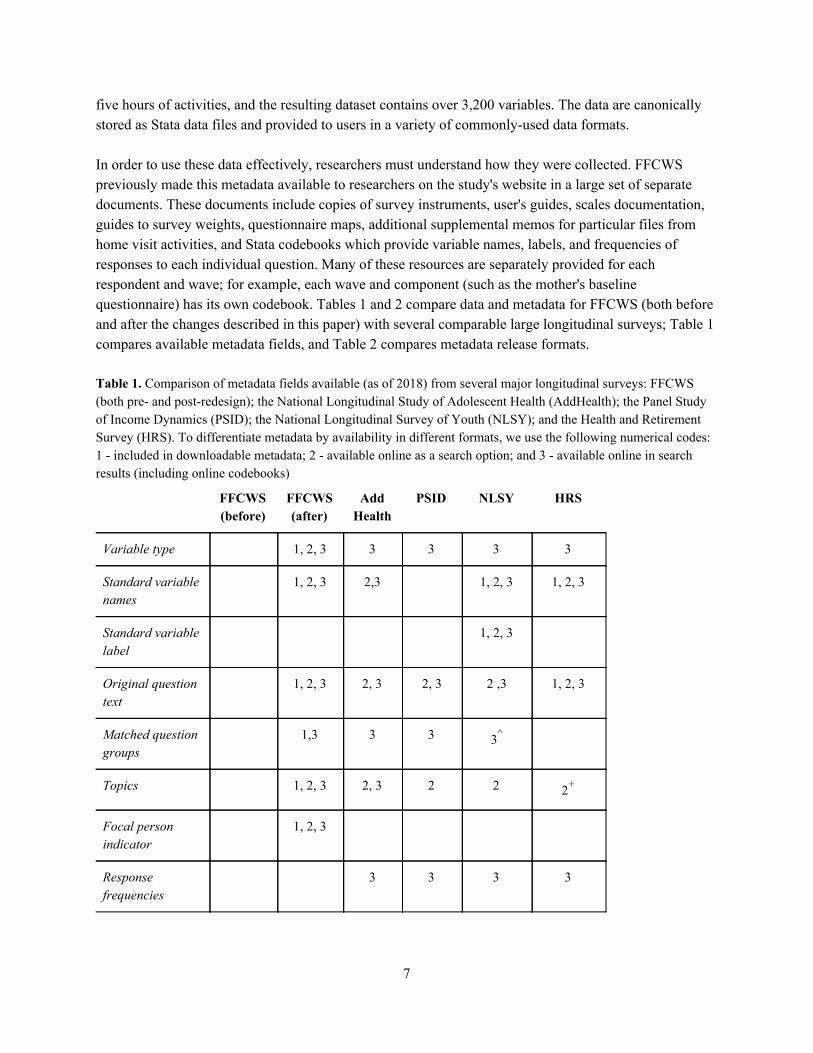
five hours of activities, and the resulting dataset contains over 3,200 variables. The data are canonically stored as Stata data files and provided to users in a variety of commonly-used data formats. In order to use these data effectively, researchers must understand how they were collected. FFCWS previously made this metadata available to researchers on the study's website in a large set of separate documents. These documents include copies of survey instruments, user's guides, scales documentation, guides to survey weights, questionnaire maps, additional supplemental memos for particular files from home visit activities, and Stata codebooks which provide variable names, labels, and frequencies of responses to each individual question. Many of these resources are separately provided for each respondent and wave; for example, each wave and component (such as the mother's baseline questionnaire) has its own codebook. Tables 1 and 2 compare data and metadata for FFCWS (both before and after the changes described in this paper) with several comparable large longitudinal surveys; Table 1 compares available metadata fields, and Table 2 compares metadata release formats. Table 1. Comparison of metadata fields available (as of 2018) from several major longitudinal surveys: FFCWS (both pre- and post-redesign); the National Longitudinal Study of Adolescent Health (AddHealth); the Panel Study of Income Dynamics (PSID); the National Longitudinal Survey of Youth (NLSY); and the Health and Retirement Survey (HRS). To differentiate metadata by availability in different formats, we use the following numerical codes: 1 - included in downloadable metadata; 2 - available online as a search option; and 3 - available online in search results (including online codebooks)
FFCWS (before)
FFCWS (after)
Add Health
PSID NLSY HRS
Variable type 1, 2, 3 3 3 3 3
Standard variable names
1, 2, 3 2,3 1, 2, 3 1, 2, 3
Standard variable label
1, 2, 3
Original question text
1, 2, 3 2, 3 2, 3 2 ,3 1, 2, 3
Matched question groups
1,3 3 3 3^
Topics 1, 2, 3 2, 3 2 2 2+
Focal person indicator
1, 2, 3
Response frequencies
3 3 3 3
7
Response skip patterns
3 3
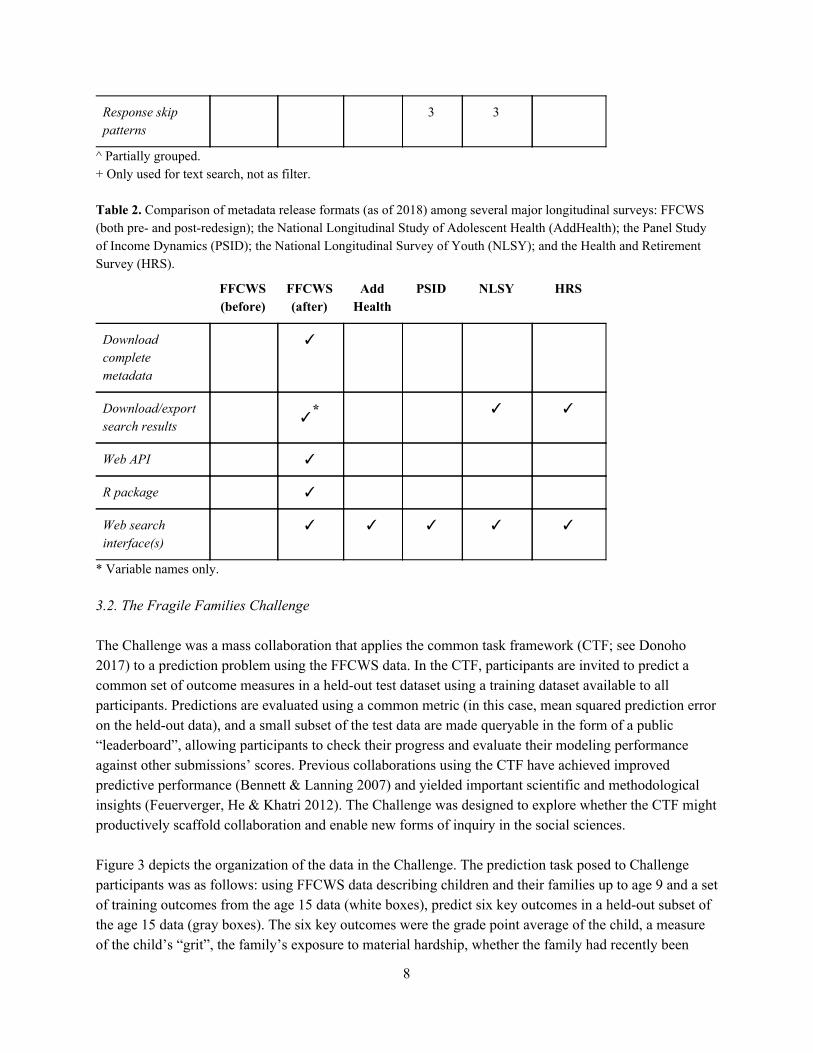
^ Partially grouped. + Only used for text search, not as filter. Table 2. Comparison of metadata release formats (as of 2018) among several major longitudinal surveys: FFCWS (both pre- and post-redesign); the National Longitudinal Study of Adolescent Health (AddHealth); the Panel Study of Income Dynamics (PSID); the National Longitudinal Survey of Youth (NLSY); and the Health and Retirement Survey (HRS).
FFCWS (before)
FFCWS (after)
Add Health
PSID NLSY HRS
Download complete metadata
✓
Download/export search results
✓
* ✓ ✓
Web API ✓
R package ✓
Web search interface(s)
✓ ✓ ✓ ✓ ✓
* Variable names only. 3.2. The Fragile Families Challenge The Challenge was a mass collaboration that applies the common task framework (CTF; see Donoho 2017) to a prediction problem using the FFCWS data. In the CTF, participants are invited to predict a common set of outcome measures in a held-out test dataset using a training dataset available to all participants. Predictions are evaluated using a common metric (in this case, mean squared prediction error on the held-out data), and a small subset of the test data are made queryable in the form of a public “leaderboard”, allowing participants to check their progress and evaluate their modeling performance against other submissions’ scores. Previous collaborations using the CTF have achieved improved predictive performance (Bennett & Lanning 2007) and yielded important scientific and methodological insights (Feuerverger, He & Khatri 2012). The Challenge was designed to explore whether the CTF might productively scaffold collaboration and enable new forms of inquiry in the social sciences. Figure 3 depicts the organization of the data in the Challenge. The prediction task posed to Challenge participants was as follows: using FFCWS data describing children and their families up to age 9 and a set of training outcomes from the age 15 data (white boxes), predict six key outcomes in a held-out subset of the age 15 data (gray boxes). The six key outcomes were the grade point average of the child, a measure of the child’s “grit”, the family’s exposure to material hardship, whether the family had recently been
8
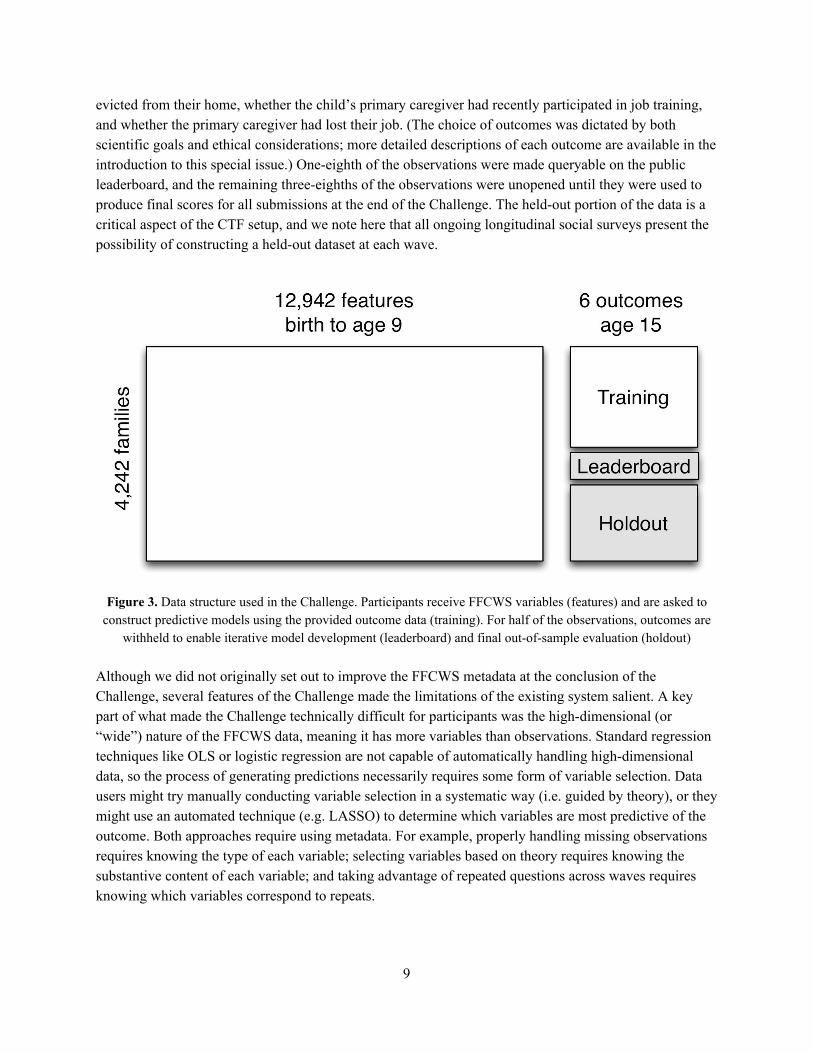
evicted from their home, whether the child’s primary caregiver had recently participated in job training, and whether the primary caregiver had lost their job. (The choice of outcomes was dictated by both scientific goals and ethical considerations; more detailed descriptions of each outcome are available in the introduction to this special issue.) One-eighth of the observations were made queryable on the public leaderboard, and the remaining three-eighths of the observations were unopened until they were used to produce final scores for all submissions at the end of the Challenge. The held-out portion of the data is a critical aspect of the CTF setup, and we note here that all ongoing longitudinal social surveys present the possibility of constructing a held-out dataset at each wave.
Figure 3. Data structure used in the Challenge. Participants receive FFCWS variables (features) and are asked to
construct predictive models using the provided outcome data (training). For half of the observations, outcomes are withheld to enable iterative model development (leaderboard) and final out-of-sample evaluation (holdout)
Although we did not originally set out to improve the FFCWS metadata at the conclusion of the Challenge, several features of the Challenge made the limitations of the existing system salient. A key part of what made the Challenge technically difficult for participants was the high-dimensional (or “wide”) nature of the FFCWS data, meaning it has more variables than observations. Standard regression techniques like OLS or logistic regression are not capable of automatically handling high-dimensional data, so the process of generating predictions necessarily requires some form of variable selection. Data users might try manually conducting variable selection in a systematic way (i.e. guided by theory), or they might use an automated technique (e.g. LASSO) to determine which variables are most predictive of the outcome. Both approaches require using metadata. For example, properly handling missing observations requires knowing the type of each variable; selecting variables based on theory requires knowing the substantive content of each variable; and taking advantage of repeated questions across waves requires knowing which variables correspond to repeats.
9
The size and heterogeneity of the Challenge’s participant group exposed the data to a wider range of analytic methods than those typically used in prior research. In the past, a typical researcher using the FFCWS data built regression models using tens of variables. During the Challenge, the typical participant tried to build models using thousands of variables. In the low-dimensional setting, matching questions across waves or identifying the variable types is a tractable task; in the high-dimensional setting, these tasks are practically impossible to complete manually. Data preparation, previously a doable (if time-consuming and error-prone) task, became an intractable barrier to high-quality statistical analysis. In the following section, we describe the most common data preparation problems participants faced when attempting to deploy machine learning methods, and then describe the metadata design solutions we developed to address them. Our redesign was informed by watching and learning from participants in the Challenge. We accomplished this in several ways. First, we ran six “Getting Started” workshops, which typically lasted three hours (one hour was devoted to instruction and two hours were devoted to helping participants as they began working with the data). Second, we provided assistance through weekly virtual office hours 4
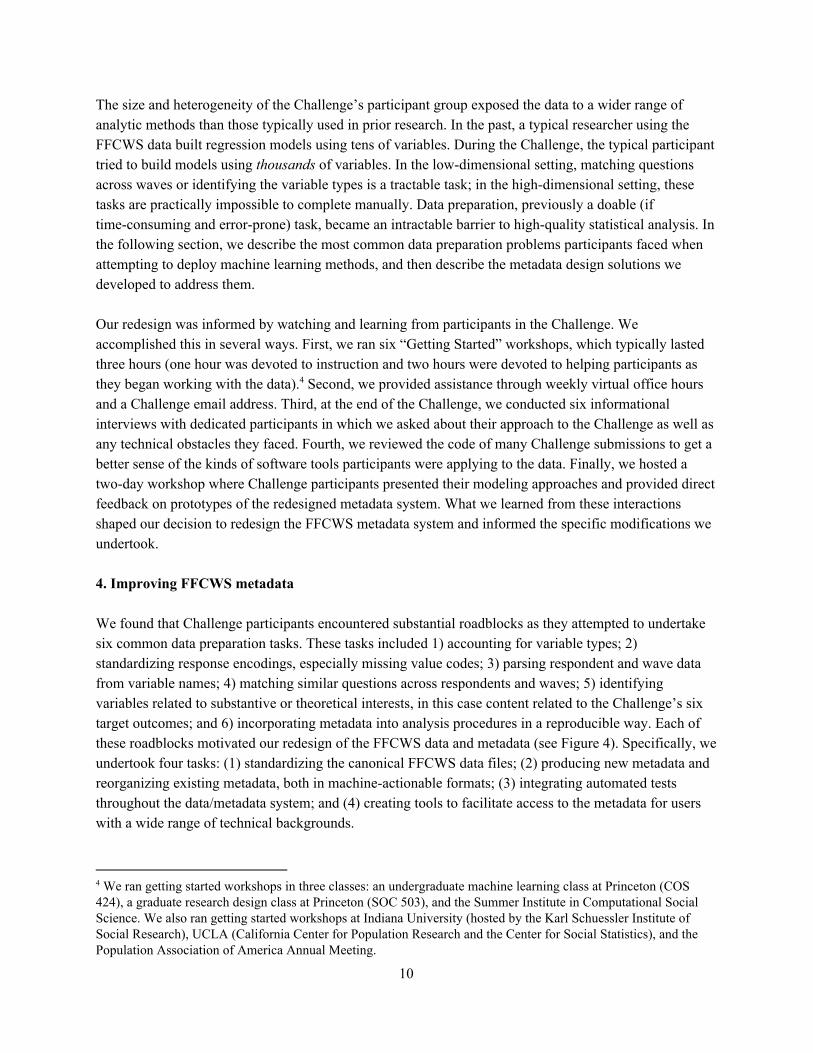
and a Challenge email address. Third, at the end of the Challenge, we conducted six informational interviews with dedicated participants in which we asked about their approach to the Challenge as well as any technical obstacles they faced. Fourth, we reviewed the code of many Challenge submissions to get a better sense of the kinds of software tools participants were applying to the data. Finally, we hosted a two-day workshop where Challenge participants presented their modeling approaches and provided direct feedback on prototypes of the redesigned metadata system. What we learned from these interactions shaped our decision to redesign the FFCWS metadata system and informed the specific modifications we undertook. 4. Improving FFCWS metadata We found that Challenge participants encountered substantial roadblocks as they attempted to undertake six common data preparation tasks. These tasks included 1) accounting for variable types; 2) standardizing response encodings, especially missing value codes; 3) parsing respondent and wave data from variable names; 4) matching similar questions across respondents and waves; 5) identifying variables related to substantive or theoretical interests, in this case content related to the Challenge’s six target outcomes; and 6) incorporating metadata into analysis procedures in a reproducible way. Each of these roadblocks motivated our redesign of the FFCWS data and metadata (see Figure 4). Specifically, we undertook four tasks: (1) standardizing the canonical FFCWS data files; (2) producing new metadata and reorganizing existing metadata, both in machine-actionable formats; (3) integrating automated tests throughout the data/metadata system; and (4) creating tools to facilitate access to the metadata for users with a wide range of technical backgrounds.
4 We ran getting started workshops in three classes: an undergraduate machine learning class at Princeton (COS 424), a graduate research design class at Princeton (SOC 503), and the Summer Institute in Computational Social Science. We also ran getting started workshops at Indiana University (hosted by the Karl Schuessler Institute of Social Research), UCLA (California Center for Population Research and the Center for Social Statistics), and the Population Association of America Annual Meeting.
10
Figure 4. Overview of FFCWS metadata system changes. Written documentation and implicit knowledge
have been rebuilt into a single CSV file, a series of automated tests, and multiple release formats. 4.1. Standardizing canonical data files As described above, FFCWS data were assembled incrementally over a long period of time and by a diffuse set of research teams. This data collection process resulted in a number of discontinuities in the format of important data fields across waves and respondents in the survey. In particular, different parts of the FFCWS data followed different standards for naming variables and encoding missing values. We found that these inconsistencies were a major obstacle to users as they attempted to use the data to generate predictions. However, because these data are already used in existing data pipelines, we could not recode them in a way that overwrote the old data. Doing so would risk introducing breaking changes to the data system. While breaking changes are not universally unacceptable, we hesitated in this context because making these changes might have caused silent errors in existing code. As a result, in addressing these data consistency issues we aimed to strike a balance between standardization and backwards compatibility. 4.1.1. Variable names. In data releases prior to the Challenge, FFCWS “core” variables were named according to a pattern that encoded metadata about the respondent, study wave, questionnaire section, and question number. This naming pattern is advantageous because it provides users with an index into the 5
documentation, which is split into separate documents according to respondent and wave and internally organized according to the number and section of each question. Unfortunately, this naming convention
5 For example, the variable name for the first question in the first section of the mother baseline survey would be m1a1.
11
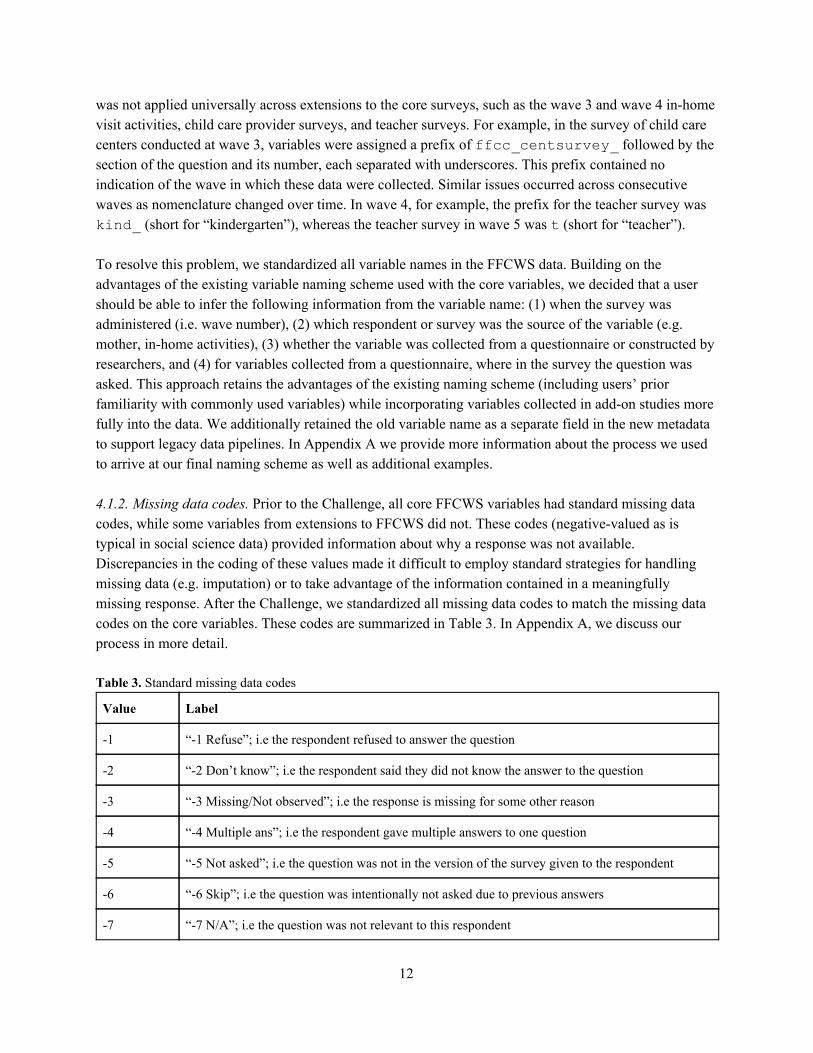
was not applied universally across extensions to the core surveys, such as the wave 3 and wave 4 in-home visit activities, child care provider surveys, and teacher surveys. For example, in the survey of child care centers conducted at wave 3, variables were assigned a prefix of ffcc_centsurvey_ followed by the section of the question and its number, each separated with underscores. This prefix contained no indication of the wave in which these data were collected. Similar issues occurred across consecutive waves as nomenclature changed over time. In wave 4, for example, the prefix for the teacher survey was kind_ (short for “kindergarten”), whereas the teacher survey in wave 5 was t (short for “teacher”). To resolve this problem, we standardized all variable names in the FFCWS data. Building on the advantages of the existing variable naming scheme used with the core variables, we decided that a user should be able to infer the following information from the variable name: (1) when the survey was administered (i.e. wave number), (2) which respondent or survey was the source of the variable (e.g. mother, in-home activities), (3) whether the variable was collected from a questionnaire or constructed by researchers, and (4) for variables collected from a questionnaire, where in the survey the question was asked. This approach retains the advantages of the existing naming scheme (including users’ prior familiarity with commonly used variables) while incorporating variables collected in add-on studies more fully into the data. We additionally retained the old variable name as a separate field in the new metadata to support legacy data pipelines. In Appendix A we provide more information about the process we used to arrive at our final naming scheme as well as additional examples. 4.1.2. Missing data codes. Prior to the Challenge, all core FFCWS variables had standard missing data codes, while some variables from extensions to FFCWS did not. These codes (negative-valued as is typical in social science data) provided information about why a response was not available. Discrepancies in the coding of these values made it difficult to employ standard strategies for handling missing data (e.g. imputation) or to take advantage of the information contained in a meaningfully missing response. After the Challenge, we standardized all missing data codes to match the missing data codes on the core variables. These codes are summarized in Table 3. In Appendix A, we discuss our process in more detail. Table 3. Standard missing data codes
Value Label
-1 “-1 Refuse”; i.e the respondent refused to answer the question
-2 “-2 Don’t know”; i.e the respondent said they did not know the answer to the question
-3 “-3 Missing/Not observed”; i.e the response is missing for some other reason
-4 “-4 Multiple ans”; i.e the respondent gave multiple answers to one question
-5 “-5 Not asked”; i.e the question was not in the version of the survey given to the respondent
-6 “-6 Skip”; i.e the question was intentionally not asked due to previous answers
-7 “-7 N/A”; i.e the question was not relevant to this respondent
12
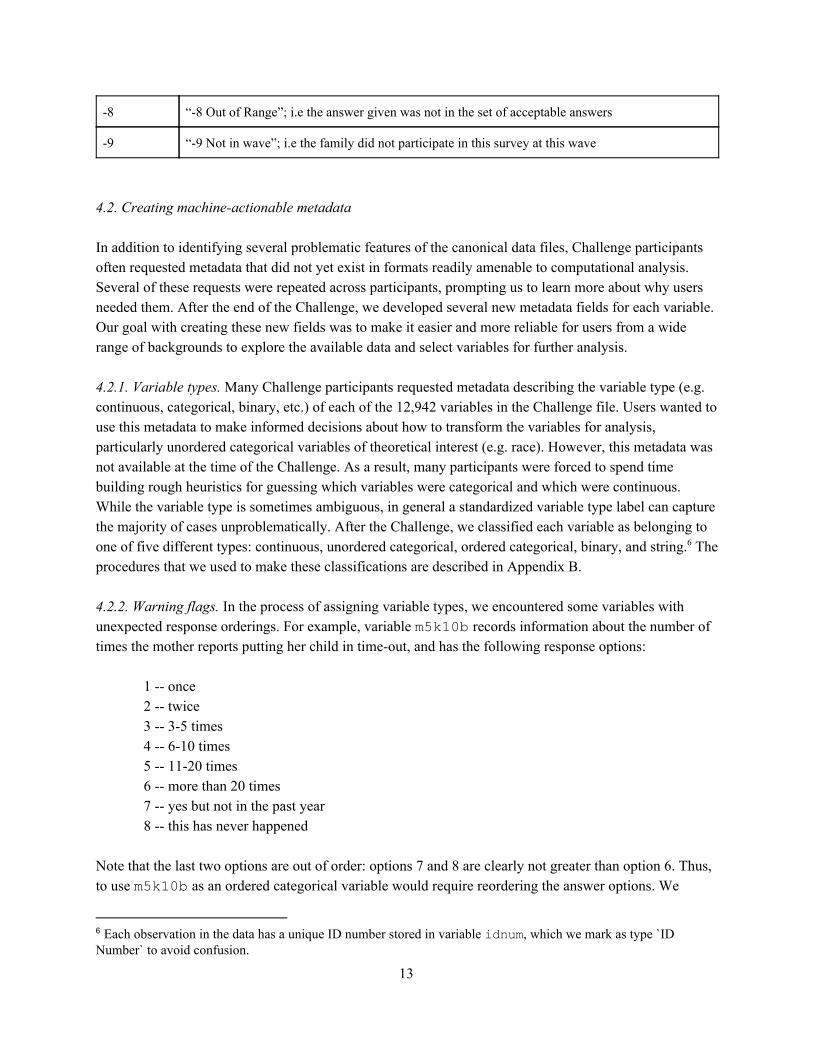
-8 “-8 Out of Range”; i.e the answer given was not in the set of acceptable answers
-9 “-9 Not in wave”; i.e the family did not participate in this survey at this wave
4.2. Creating machine-actionable metadata In addition to identifying several problematic features of the canonical data files, Challenge participants often requested metadata that did not yet exist in formats readily amenable to computational analysis. Several of these requests were repeated across participants, prompting us to learn more about why users needed them. After the end of the Challenge, we developed several new metadata fields for each variable. Our goal with creating these new fields was to make it easier and more reliable for users from a wide range of backgrounds to explore the available data and select variables for further analysis. 4.2.1. Variable types. Many Challenge participants requested metadata describing the variable type (e.g. continuous, categorical, binary, etc.) of each of the 12,942 variables in the Challenge file. Users wanted to use this metadata to make informed decisions about how to transform the variables for analysis, particularly unordered categorical variables of theoretical interest (e.g. race). However, this metadata was not available at the time of the Challenge. As a result, many participants were forced to spend time building rough heuristics for guessing which variables were categorical and which were continuous. While the variable type is sometimes ambiguous, in general a standardized variable type label can capture the majority of cases unproblematically. After the Challenge, we classified each variable as belonging to one of five different types: continuous, unordered categorical, ordered categorical, binary, and string. The 6
procedures that we used to make these classifications are described in Appendix B. 4.2.2. Warning flags. In the process of assigning variable types, we encountered some variables with unexpected response orderings. For example, variable m5k10b records information about the number of times the mother reports putting her child in time-out, and has the following response options:
1 -- once 2 -- twice 3 -- 3-5 times 4 -- 6-10 times 5 -- 11-20 times 6 -- more than 20 times 7 -- yes but not in the past year 8 -- this has never happened
Note that the last two options are out of order: options 7 and 8 are clearly not greater than option 6. Thus, to use m5k10b as an ordered categorical variable would require reordering the answer options. We
6 Each observation in the data has a unique ID number stored in variable idnum, which we mark as type `ID Number` to avoid confusion.
13
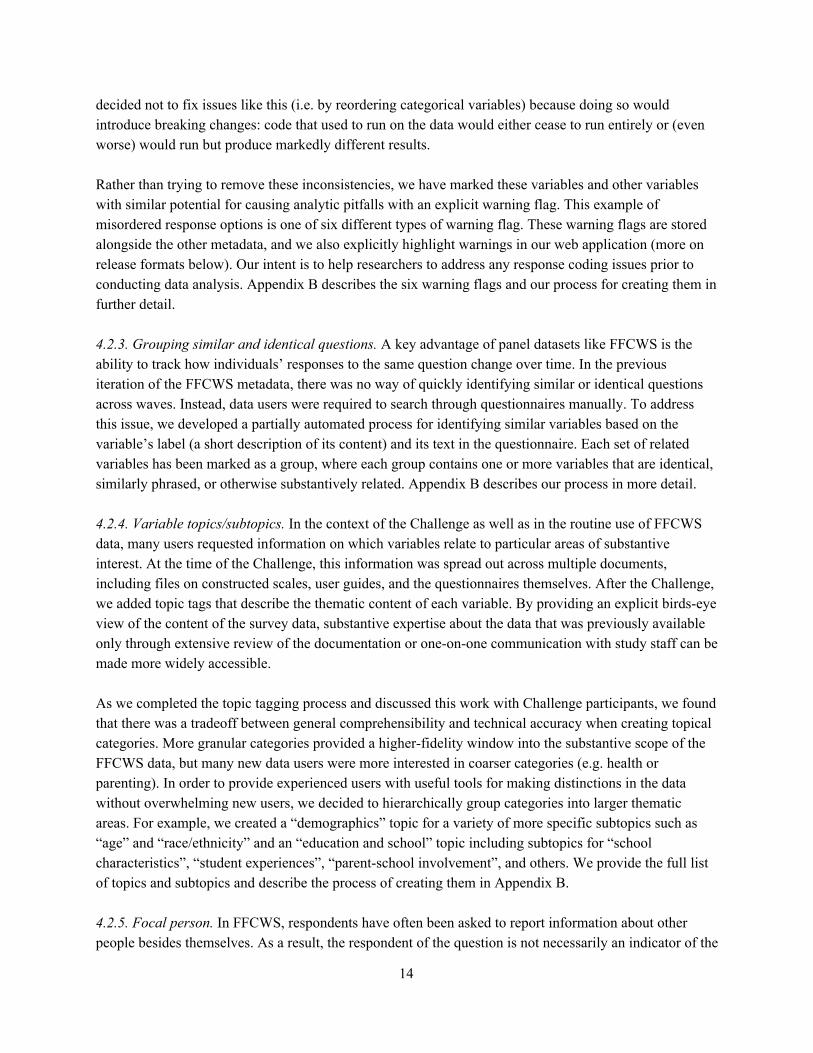
decided not to fix issues like this (i.e. by reordering categorical variables) because doing so would introduce breaking changes: code that used to run on the data would either cease to run entirely or (even worse) would run but produce markedly different results. Rather than trying to remove these inconsistencies, we have marked these variables and other variables with similar potential for causing analytic pitfalls with an explicit warning flag. This example of misordered response options is one of six different types of warning flag. These warning flags are stored alongside the other metadata, and we also explicitly highlight warnings in our web application (more on release formats below). Our intent is to help researchers to address any response coding issues prior to conducting data analysis. Appendix B describes the six warning flags and our process for creating them in further detail. 4.2.3. Grouping similar and identical questions. A key advantage of panel datasets like FFCWS is the ability to track how individuals’ responses to the same question change over time. In the previous iteration of the FFCWS metadata, there was no way of quickly identifying similar or identical questions across waves. Instead, data users were required to search through questionnaires manually. To address this issue, we developed a partially automated process for identifying similar variables based on the variable’s label (a short description of its content) and its text in the questionnaire. Each set of related variables has been marked as a group, where each group contains one or more variables that are identical, similarly phrased, or otherwise substantively related. Appendix B describes our process in more detail. 4.2.4. Variable topics/subtopics. In the context of the Challenge as well as in the routine use of FFCWS data, many users requested information on which variables relate to particular areas of substantive interest. At the time of the Challenge, this information was spread out across multiple documents, including files on constructed scales, user guides, and the questionnaires themselves. After the Challenge, we added topic tags that describe the thematic content of each variable. By providing an explicit birds-eye view of the content of the survey data, substantive expertise about the data that was previously available only through extensive review of the documentation or one-on-one communication with study staff can be made more widely accessible. As we completed the topic tagging process and discussed this work with Challenge participants, we found that there was a tradeoff between general comprehensibility and technical accuracy when creating topical categories. More granular categories provided a higher-fidelity window into the substantive scope of the FFCWS data, but many new data users were more interested in coarser categories (e.g. health or parenting). In order to provide experienced users with useful tools for making distinctions in the data without overwhelming new users, we decided to hierarchically group categories into larger thematic areas. For example, we created a “demographics” topic for a variety of more specific subtopics such as “age” and “race/ethnicity” and an “education and school” topic including subtopics for “school characteristics”, “student experiences”, “parent-school involvement”, and others. We provide the full list of topics and subtopics and describe the process of creating them in Appendix B. 4.2.5. Focal person. In FFCWS, respondents have often been asked to report information about other people besides themselves. As a result, the respondent of the question is not necessarily an indicator of the
14
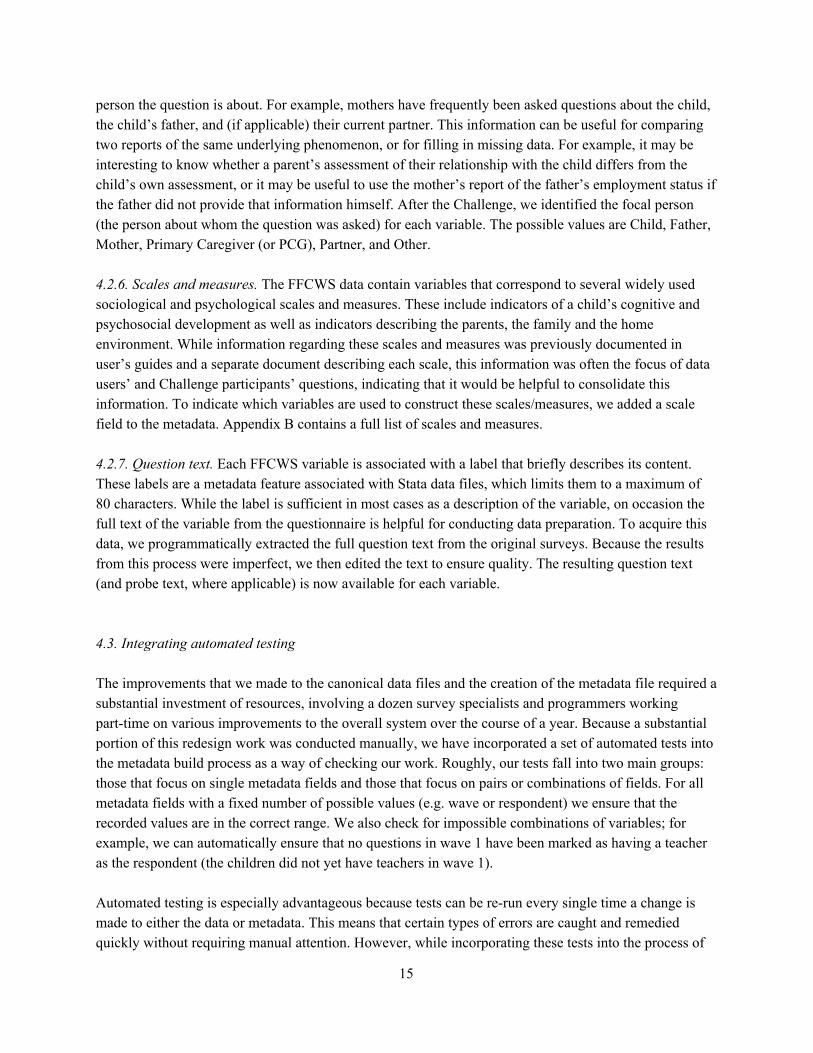
person the question is about. For example, mothers have frequently been asked questions about the child, the child’s father, and (if applicable) their current partner. This information can be useful for comparing two reports of the same underlying phenomenon, or for filling in missing data. For example, it may be interesting to know whether a parent’s assessment of their relationship with the child differs from the child’s own assessment, or it may be useful to use the mother’s report of the father’s employment status if the father did not provide that information himself. After the Challenge, we identified the focal person (the person about whom the question was asked) for each variable. The possible values are Child, Father, Mother, Primary Caregiver (or PCG), Partner, and Other. 4.2.6. Scales and measures. The FFCWS data contain variables that correspond to several widely used sociological and psychological scales and measures. These include indicators of a child’s cognitive and psychosocial development as well as indicators describing the parents, the family and the home environment. While information regarding these scales and measures was previously documented in user’s guides and a separate document describing each scale, this information was often the focus of data users’ and Challenge participants’ questions, indicating that it would be helpful to consolidate this information. To indicate which variables are used to construct these scales/measures, we added a scale field to the metadata. Appendix B contains a full list of scales and measures. 4.2.7. Question text. Each FFCWS variable is associated with a label that briefly describes its content. These labels are a metadata feature associated with Stata data files, which limits them to a maximum of 80 characters. While the label is sufficient in most cases as a description of the variable, on occasion the full text of the variable from the questionnaire is helpful for conducting data preparation. To acquire this data, we programmatically extracted the full question text from the original surveys. Because the results from this process were imperfect, we then edited the text to ensure quality. The resulting question text (and probe text, where applicable) is now available for each variable. 4.3. Integrating automated testing The improvements that we made to the canonical data files and the creation of the metadata file required a substantial investment of resources, involving a dozen survey specialists and programmers working part-time on various improvements to the overall system over the course of a year. Because a substantial portion of this redesign work was conducted manually, we have incorporated a set of automated tests into the metadata build process as a way of checking our work. Roughly, our tests fall into two main groups: those that focus on single metadata fields and those that focus on pairs or combinations of fields. For all metadata fields with a fixed number of possible values (e.g. wave or respondent) we ensure that the recorded values are in the correct range. We also check for impossible combinations of variables; for example, we can automatically ensure that no questions in wave 1 have been marked as having a teacher as the respondent (the children did not yet have teachers in wave 1). Automated testing is especially advantageous because tests can be re-run every single time a change is made to either the data or metadata. This means that certain types of errors are caught and remedied quickly without requiring manual attention. However, while incorporating these tests into the process of
15
building the metadata reduces the burden of data quality assurance on the part of the data creators, it does not entirely eliminate the need for manual checks. Automated tests are good at catching logical impossibilities and imposing standard formatting on metadata fields, but they cannot catch every possible error in the metadata. This highlights a core lesson learned from our metadata redesign effort: automated tools support, rather than replace, the expertise of data creators. 4.4. Providing multiple metadata formats After improving the metadata, we wanted to make it easily available to data users. To do this, we 7
developed a web Application Programming Interface (API) that provides direct access to the metadata and serves as a platform for other metadata tools. We also developed three different front-ends to the API: a web application, an R package, and a Python package. Our decision to provide multiple front-ends was motivated by the breadth of training we saw among FFCWS and Challenge users. We hope that these systems will enable researchers with a wide range of technical skills to use the data in sophisticated ways. Further, because we continue to provide direct access to the web API (and even the metadata CSV), we enable other users to develop new metadata formats that suit their own needs as the community accessing the data continues to grow and approaches to modeling continue to evolve. As Robinson and colleagues report in their assessment of government data provision practices, a key advantage of providing an API is that it leaves open the possibility of third parties providing additional release formats in the future (Robinson et al. 2009). Overall, our hope is that this hybrid system will “make easy things easy and hard things possible.” 8
4.4.1. Metadata CSV. Previously, the metadata was primarily stored in a series of PDF files. To make the metadata more easily machine-readable, we now store all of the metadata in a single CSV file. Our approach to storing the metadata diverges somewhat from the existing literature on relational database design and “tidy data” principles (Codd 1970; Wickham 2014). Our metadata system is organized in a denormalized format, meaning that each “cell” of the metadata does not necessarily describe a single piece of information. We chose this type of data organization deliberately to strike a balance between human and machine legibility. We suspect that some users will want to read the metadata CSV directly; however, we also want the metadata to be easily processed by data users and by downstream applications (see below). 4.4.2. Web API. An API provides users with a set of functions for retrieving and manipulating data. Our API provides read-only access to the metadata (i.e. users cannot add, update, or delete records). We provide two endpoints: one for retrieving metadata attributes for a single variable, and one for retrieving variables given a set of search filters over the metadata fields. Using the API yields three immediate benefits over using the metadata CSV directly. First, the API protects users from underlying implementation details that are irrelevant to the substance of the metadata. For example, if the metadata
7 Unlike the FFCWS data archive, the metadata file contains no private information, and releasing it publicly carries minimal risk to study participants. 8 To the best of our knowledge, this quote was first used to describe the Perl programming language in Wall, Schwartz & Christiansen (1996).
16

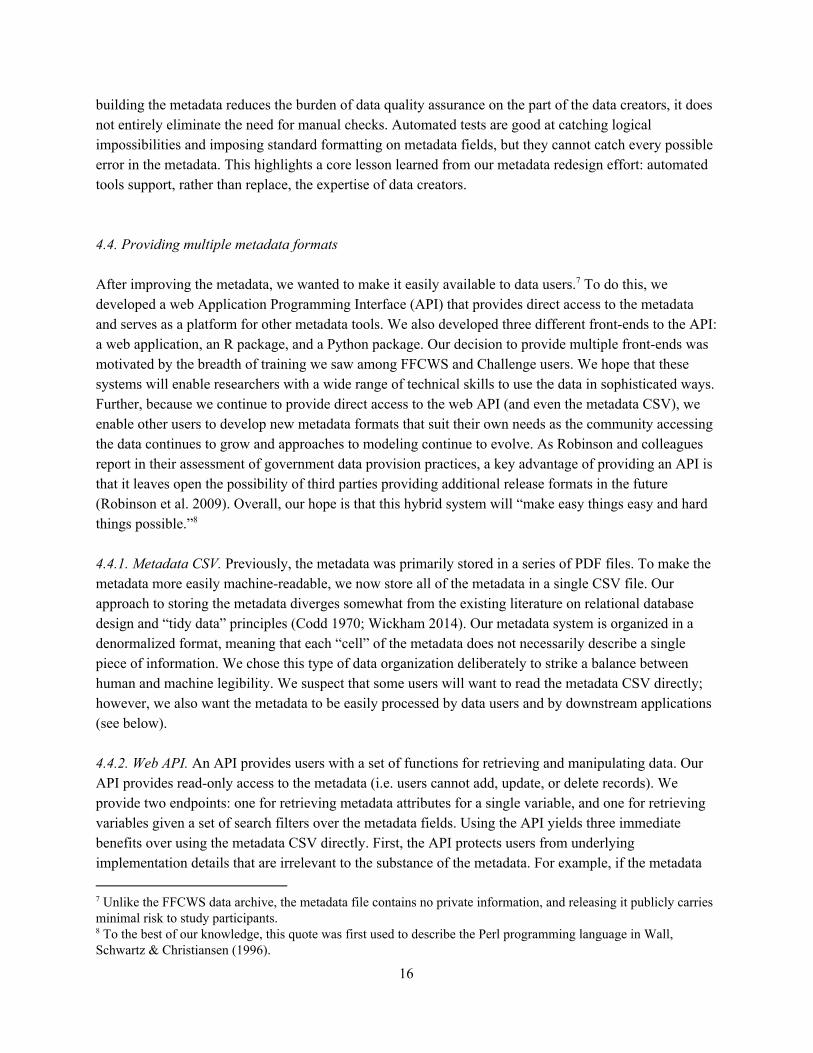
were stored in a different file format in the future, users and services accessing the metadata through the API would not need to modify their code in response. Relatedly, an API ensures that users are relying on the most up-to-date version of the metadata file, making it easy for the data creator to deploy new metadata fields or bugfixes to existing metadata if needed. Finally, because we are able to track the usage of the API over time, we can collect information about which variables and metadata fields are of greatest interest to our community of data users. We hope to use this information in the future to guide training for data users and to orient future data collection efforts. Appendix C provides additional technical details on the design of the web API. 4.4.3. R and Python packages. All participants in the Challenge open-sourced their code. We learned through exploring this corpus of code that the three most common languages used in the Challenge were Python, R, and Stata. One of our goals was to make it easier for R and Python users to interface with the data, because these environments provide widely used machine learning, data organization, and automated feature selection tools. To facilitate the programmatic use of metadata to perform these tasks, we created R and Python packages that query the web API and parse the returned information into a format that is easy to use for analysis. Using these packages, users can seamlessly integrate the metadata into their data analyses without having to rely on other tools, languages, or manual data modification steps. These packages are publicly available on GitHub. 4.4.4. Web application. Although the web API provides extremely flexible access to the metadata, and the R and Python packages make it easier to incorporate the metadata directly into code, these tools presume that users have a high level of programming skill. To facilitate metadata access among a wider range of potential users, we also created a web application that enables searching and browsing through a friendly user interface (see Figures 5-6). The design of our web application was influenced by the design of websites for other similar surveys, such as those summarized in Table 1. For more on the design of the web application, see Appendix C.
17
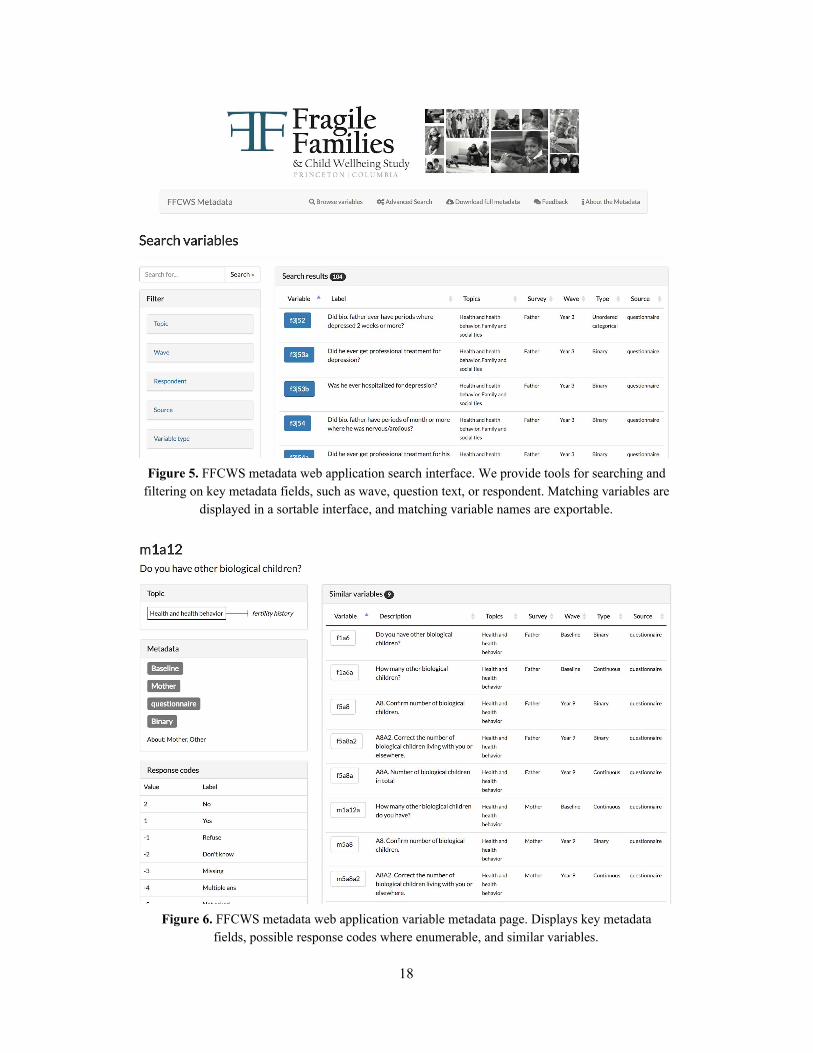
Figure 5. FFCWS metadata web application search interface. We provide tools for searching and
filtering on key metadata fields, such as wave, question text, or respondent. Matching variables are displayed in a sortable interface, and matching variable names are exportable.
Figure 6. FFCWS metadata web application variable metadata page. Displays key metadata
fields, possible response codes where enumerable, and similar variables.
18
4.5. Evaluation We conducted three informal evaluations of the redesigned metadata infrastructure. First, at the Challenge workshop, we presented pilot versions of our metadata infrastructure to Challenge participants. Participants viewed early versions of the redesigned metadata CSV, as well as wireframe prototypes of the web app and API, and provided feedback on fields they viewed as useful or in need of improvement. This early feedback allowed us to redesign several features of the metadata that workshop participants suggested were important. Second, as a way of comparing the redesigned metadata to the old system, Table 4 compares some specific tasks that require the FFCWS metadata. These tasks are drawn from actual requests that the FFCWS team received supporting traditional users, as well as requests received during the Challenge from participants. A number of tasks are substantially easier with the new metadata. Table 4. Comparison of key metadata-intensive tasks between old and new FFCWS metadata systems.
Old system New system
Find all the questions about self-reported health
Search text of up to 18 PDF files (depending on respondents of interest), 20 minutes
One query, 1 minute
Find all variables asked to the mother that are related to incarceration
Search text of 6 PDF files, 15 minutes
One query, 1 minute
Identify all potential respondents and waves for a specific question
Search text of 18 PDF files, 20 minutes
One query, 1 minute
List all the questions that the mother answers about the father
Search text of 6 PDF files, 30 minutes
One query, 1 minute
Finally, we ran the Challenge as an assignment in an undergraduate machine learning class at Princeton (COS 424) in Spring 2017 using the old data and metadata and then again in Spring 2018 with the new data and metadata. After the assignment was complete, we compared the predictive performance distributions of each class to evaluate whether there might be an effect of improved metadata on predictive performance. We found that average predictive performance was similar across years. However, upon informally debriefing the assignment with students, we received substantially fewer complaints with the new metadata infrastructure. While we did not formally survey the students to assess this quantitatively, these conversations suggested to us that students were able to accomplish a similar level of performance without struggling as much with understanding the data along the way. Although none of these forms of evaluation are definitive, in aggregate they give us confidence that the new
19
metadata system is an improvement for researchers. We plan to continuously evaluate and improve this system as new ways of using the data emerge. 5. The future of metadata systems Metadata systems are essential scientific infrastructure. A good metadata system reduces the burden of preparing data for analysis, makes it easier to catch potential errors early in the research process, and facilitates the use of a wide variety of data analysis approaches. In the social sciences, particularly those fields which rely on publicly-funded, large-scale, longitudinal survey data, these systems have generally been built with a particular type of user in mind: social researchers trained to use multivariate regression analysis to frame and answer theoretical questions (Abbott 1988; Raftery 2001). For researchers working in this tradition, existing metadata has provided a usable (if time-consuming and occasionally error-prone) set of tools for constructing certain types of models using survey data. However, the design of these metadata systems often makes it difficult for researchers to conduct the kinds of data preparation necessary to apply machine learning methods to these data. There is a strong synergy between new methods for modeling high-dimensional data and the complex structure of longitudinal survey data archives, but the limitations of many existing metadata systems mean that the full benefits of this pairing have yet to be realized. Although we believe that our modifications to the FFCWS metadata system represent substantial improvements over the prior architecture, we consider this to be a work in progress. Ultimately, we believe that future metadata improvements should be driven by the needs of data users. Paying attention to what tools users want to apply to the data makes it easier to know what kinds of metadata are needed to support the research process. As we learned through organizing the Challenge, mass collaboration is well-suited to the task of learning about the tools data users want to apply. The Challenge exposed the data to a wider range of users with a heterogeneous set of technical skills and assumptions about data, and it made these data-user interactions visible to the Challenge organizers and FFCWS data creators. While conducting a similar mass collaboration for the sole purpose of learning about data preparation may be excessive, any mass collaboration offers useful perspective on how data systems are used in practice, and thus how they might be improved. While user-oriented metadata design may simply require more investment, the earlier these systems can be developed, the better the quality and breadth of data analysis will be over the lifespan of the data. There is no silver bullet to metadata design, but early consideration of potential problems can significantly reduce the burden of revisiting them later on. From our experience organizing the Challenge and redesigning the FFCWS metadata system, we have two general recommendations for data creators that can make data preparation easier for data users, particularly among those trying to apply machine learning methods to longitudinal survey data. First, we suggest that providing a small set of standard, machine-actionable metadata fields (especially variable type and substantive topic) can make a substantial difference in the amount of time users spend on data preparation. Challenge participants spent a lot of time inferring these properties of the data heuristically when they are not made easily usable; this time could have been better spent on the research goals of the Challenge. Second, providing metadata in a machine-actionable data format like CSV (as opposed to a
20
document-based system) makes it easier for data users to use the data productively. Metadata systems cannot automate or “solve” data preparation once and for all, but a well-designed set of metadata tools can free data users to focus on important substantive and analytic decisions instead of rote data preparation tasks. In the same way that public data provision enabled entirely new kinds of social research in the 20th century, we expect that treating metadata as data will catalyze new kinds of social research in the 21st century. We believe that progress on designing metadata systems should be embedded within a broader research agenda on data preparation (Tukey 1962; Donoho 2017). Returning to the stylized data pipeline in Figure 1, we note that estimating quantities of interest requires three steps to be completed successfully: data collection, data preparation, and modeling. Data collection and modeling are already the subjects of huge bodies of research, but data preparation is relatively under-studied given that it is a critical step in almost every quantitative social research project. Some specific data preparation tasks with close affinities to statistical theory (especially missing data) have developed a substantial research literature, but the overall process of preparing data for analysis remains somewhat ad hoc and without a general methodological literature. Future empirical research might build on existing studies of researcher beliefs about data preparation (Leahey et al. 2003; Leahey 2008) by studying regularities in the process of data preparation and quantifying the impacts that data preparation decisions have on estimates. Complementary theoretical research might enrich the connections between stages in the data pipeline and show how data preparation choices can be as important as data collection and modeling choices. Given the range of topics involved, we expect that a vibrant science of data preparation will require perspectives from social science, statistics, and computer science. Despite the difficulties involved, we expect that a methodological focus on data preparation would enable social researchers to use a wider range of data analysis techniques, especially high-dimensional machine learning methods, and would help make quantitative social research more efficient and more reliable.
21
Bibliography Abbott, Andrew. 1988. “Transcending General Linear Reality.” Sociological Theory 6 (2): 169–86.
https://doi.org/10.2307/202114. Abbott, Andrew. 2007. “Notes on Replication.” Sociological Methods & Research 36 (2): 210–19.
https://doi.org/10.1177/0049124107306664. Athey, Susan. 2018. “The Impact of Machine Learning on Economics.” In The Economics of Artificial
Intelligence: An Agenda, forthcoming, University of Chicago Press. Bennett, James, and Stan Lanning. 2007. “The Netflix Prize.” Proceedings of the KDD Cup and
Workshop 2007. Breiman, Leo. 2001. “Statistical Modeling: The Two Cultures.” Statistical Science 16 (3): 199–231.
https://doi.org/10.1214/ss/1009213726. Codd, Edgar F. 1970. “A relational model of data for large shared data banks.” Communications of the
ACM 13(6): 377-387. Converse, Jean. 1987. Survey Research in the United States: Roots and Emergence, 1890-1960.
University of California Press. Donoho, David. 2017. “50 Years of Data Science.” Journal of Computational and Graphical Statistics 26
(4): 745–66. https://doi.org/10.1080/10618600.2017.1384734. Eckel, Sandrah P. and Roger D. Peng. 2009. “Interacting with local and remote data repositories using the
stashR package.” Computational Statistics 24(2): 247-254. https://link.springer.com/article/10.1007/s00180-008-0124-x
Edwards, Paul N., Matthew S. Mayernik, Archer L. Batcheller, Geoffrey C. Bowker, and Christine L. Borgman. 2011. “Science Friction: Data, Metadata, and Collaboration.” Social Studies of Science 41 (5): 667–90. https://doi.org/10.1177/0306312711413314.
Evans, James A., and Pedro Aceves. 2016. “Machine Translation: Mining Text for Social Theory.” Annual Review of Sociology 42 (1): 21–50. https://doi.org/10.1146/annurev-soc-081715-074206.
Feuerverger, Andrey, Yu He, and Shashi Khatri. 2012. “Statistical Significance of the Netflix Challenge.” Statistical Science 27 (2): 202–31.
Freese, Jeremy. 2007. “Replication Standards for Quantitative Social Science: Why Not Sociology?” Sociological Methods & Research 36 (2): 153–72. https://doi.org/10.1177/0049124107306659.
Herring, Cedric. 2009. “Does Diversity Pay? Race, Gender, and the Business Case for Diversity.” American Sociological Review 74(2): 208–224. https://doi.org/10.1177/000312240907400203
Herring, Cedric. 2017. “Is Diversity Still a Good Thing?” American Sociological Review 82(4): 868-877. https://doi.org/10.1177/0003122417716611
Hofman, Jake M., Amit Sharma, and Duncan J. Watts. 2017. "Prediction and explanation in social systems." Science 355(6324): 486-488.
Igo, Sarah. 2007. The Averaged American: Surveys, Citizens, and the Making of a Mass Public. Princeton, NJ: Princeton University Press.
Jasso, Guillermina. 1985. "Marital coital frequency and the passage of time: Estimating the separate effects of spouses' ages and marital duration, birth and marriage cohorts, and period influences." American Sociological Review 50(2): 224-241.
Jasso, Guillermina. 1986. “Is it outlier deletion or is it sample truncation? Notes on science and sexuality.” American Sociological Review 51(5): 738-742.
22
Kahn, Joan R. and J. Richard Udry. 1986. “Marital Coital Frequency: Unnoticed Outliers and Unspecified Interactions Lead to Erroneous Conclusions.” American Sociological Review 51(5): 734-737.
Lazarsfeld, Paul F. 1962. “The Sociology of Empirical Social Research.” American Sociological Review 27 (6): 757–67. https://doi.org/10.2307/2090403.
Leahey, Erin. 2008. “Overseeing Research Practice: The Case of Data Editing.” Science, Technology, & Human Values 33 (5): 605–30. https://doi.org/10.1177/0162243907306702.
Leahey, Erin, Barbara Entwisle, and Peter Einaudi. 2003. “Diversity in Everyday Research Practice: The Case of Data Editing.” Sociological Methods & Research 32 (1): 64–89. https://doi.org/10.1177/0049124103253461.
McFarland, Daniel A., Kevin Lewis, and Amir Goldberg. 2016. “Sociology in the Era of Big Data: The Ascent of Forensic Social Science.” The American Sociologist 47 (1): 12–35. https://doi.org/10.1007/s12108-015-9291-8.
Mullainathan, Sendhil, and Jann Spiess. 2017. "Machine learning: an applied econometric approach." Journal of Economic Perspectives 31(2): 87-106.
Munsch, Christin L. 2018. “Correction: ‘Her Support, His Support: Money, Masculinity, and Marital Infidelity’ American Sociological Review 80(3): 469–95.” Forthcoming, American Sociological Review.
Raftery, Adrian E. 2001. “Statistics in Sociology, 1950-2000: A Selective Review.” Sociological Methodology 31: 1–45.
Reichman, Nancy E., Julien O. Teitler, Irwin Garfinkel, and Sara S. McLanahan. 2001. "Fragile Families: Sample and design." Children and Youth Services Review 23(4-5): 303-326.
Robinson, David G., Harlan Yu, William P. Zeller, and Edward W. Felten. 2009. “Government Data and the Invisible Hand.” Yale Journal of Law & Technology 11(1): 160-175.
Stojmenovska, Dragana, Thijs Bol, and Thomas Leopold. 2017. “Does Diversity Pay? A Replication of Herring (2009).” American Sociological Review 82(4): 857-867. https://doi.org/10.1177/0003122417714422
Tukey, John W. 1962. “The Future of Data Analysis.” The Annals of Mathematical Statistics 33 (1): 1–67.
Vardigan, Mary. 2013. “The DDI Matures: 1997 to the Present.” IASSIST Quarterly 2013: 45-50. http://www.iassistdata.org/sites/default/files/iqvol371_4_vardigan.pdf
Wall, Larry, Randall Schwartz, and Tom Christiansen. 1996. Programming Perl. Watts, Duncan J. 2014. “Common Sense and Sociological Explanations.” American Journal of Sociology
120 (2): 313–51. https://doi.org/10.1086/678271. Wickham, Hadley. 2014. “Tidy Data.” Journal of Statistical Software 59(10): 1-23.
23
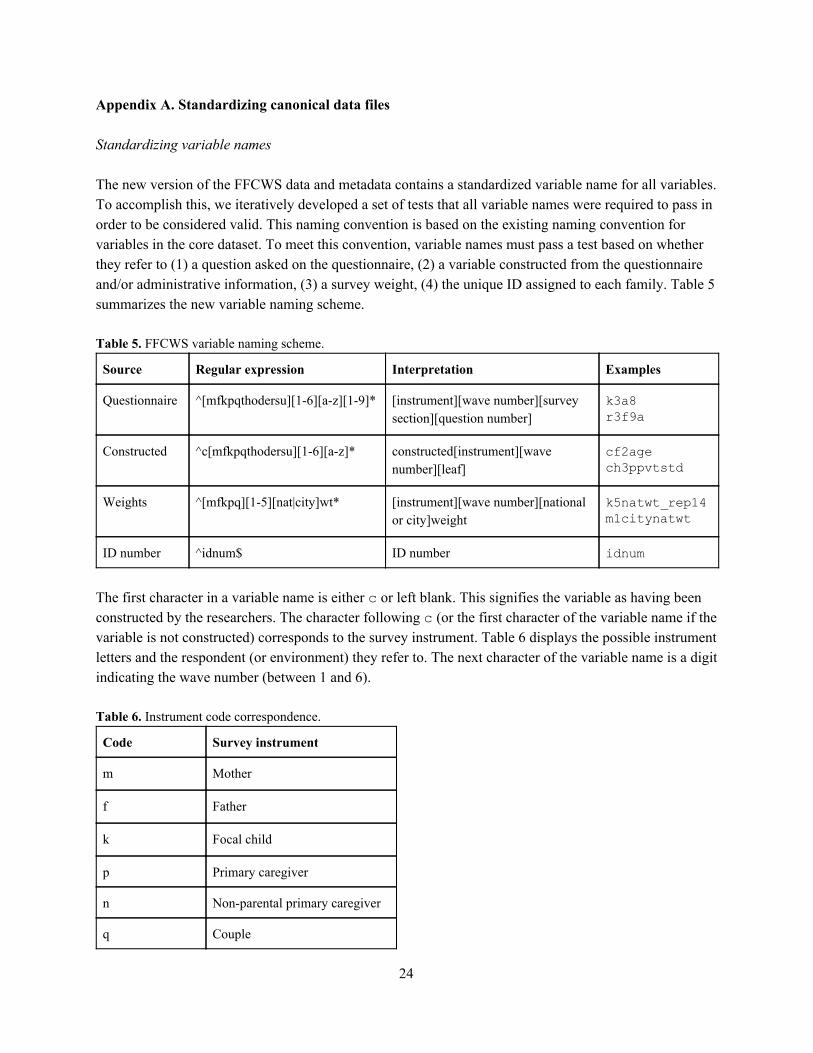
Appendix A. Standardizing canonical data files Standardizing variable names The new version of the FFCWS data and metadata contains a standardized variable name for all variables. To accomplish this, we iteratively developed a set of tests that all variable names were required to pass in order to be considered valid. This naming convention is based on the existing naming convention for variables in the core dataset. To meet this convention, variable names must pass a test based on whether they refer to (1) a question asked on the questionnaire, (2) a variable constructed from the questionnaire and/or administrative information, (3) a survey weight, (4) the unique ID assigned to each family. Table 5 summarizes the new variable naming scheme. Table 5. FFCWS variable naming scheme.
Source Regular expression Interpretation Examples
Questionnaire ^[mfkpqthodersu][1-6][a-z][1-9]* [instrument][wave number][survey section][question number]
k3a8
r3f9a
Constructed ^c[mfkpqthodersu][1-6][a-z]* constructed[instrument][wave number][leaf]
cf2age
ch3ppvtstd
Weights ^[mfkpq][1-5][nat|city]wt* [instrument][wave number][national or city]weight
k5natwt_rep14
m1citynatwt
ID number ^idnum$ ID number idnum
The first character in a variable name is either c or left blank. This signifies the variable as having been constructed by the researchers. The character following c (or the first character of the variable name if the variable is not constructed) corresponds to the survey instrument. Table 6 displays the possible instrument letters and the respondent (or environment) they refer to. The next character of the variable name is a digit indicating the wave number (between 1 and 6). Table 6. Instrument code correspondence.
Code Survey instrument
m Mother
f Father
k Focal child
p Primary caregiver
n Non-parental primary caregiver
q Couple
24
t Teacher
h In-home activities
o In-home observations
d Child care center
e Child care center observations
r Family care
s Family care observations
u Post family care observations
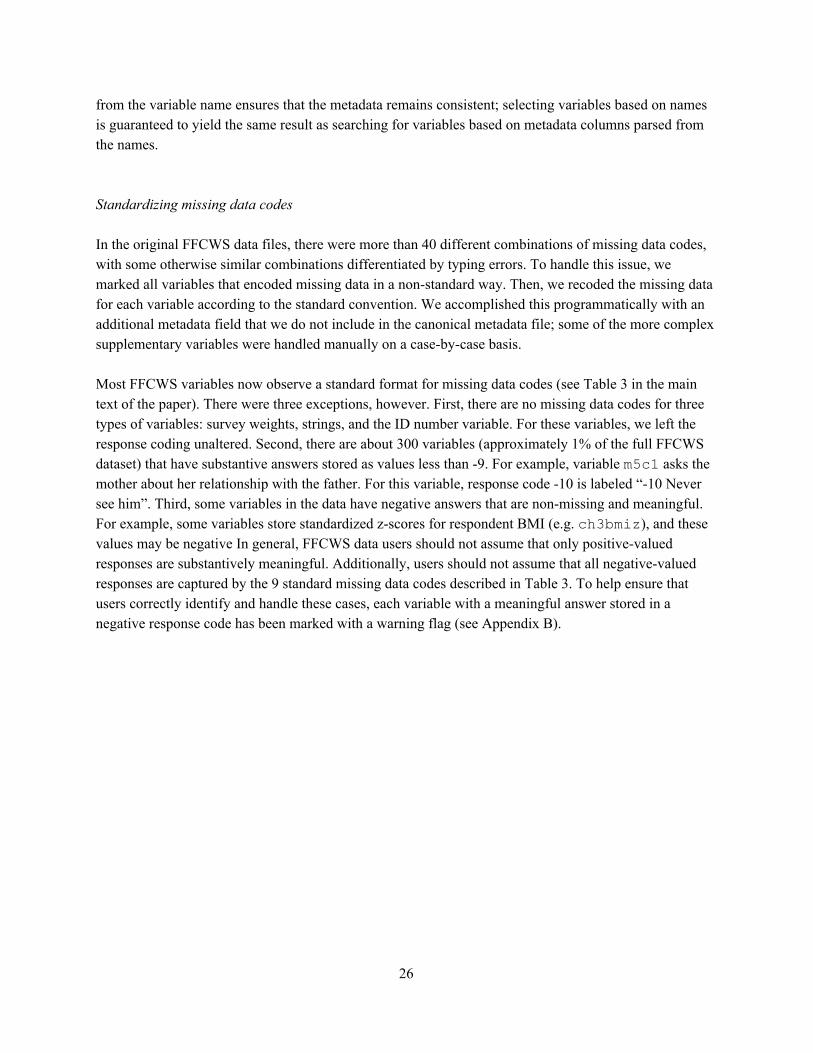
Subsequent characters describe the content of the variable. Variables that are responses to a question in a survey are named according to the survey section (a character between a and w) and the number within that section where that the question can be found. This enables users to easily retrieve the question asked to the respondent from the questionnaire or structure the data in the exact order the question was asked in the interview. For constructed variables, the end of the variable name consists of a brief string that describes what information is being constructed. For example, cm1ethrace is a constructed variable that provides the race/ethnicity of the mother at baseline. Survey weights follow a similar naming scheme, but with a small number of modifications. These weights record information about the sampling process and are needed to make generalizable estimates from the sample to the population from which it was drawn. FFCWS has two sets of weights: one to make the data nationally representative, and another to make the data representative of the cities sampled in the survey. This distinction is indicated by the variable name. For example, cm1natwt would provide the weight used to make data in the mother’s baseline survey nationally representative and cm1citywt would provide the weight used to make data in the mother’s baseline survey representative of the original twenty sample cities. assert regexm(new_name, "^[mfkpnqthodersu][1-6][a-z][1-9]*") | regexm(new_name, "^c[mfkpnqthodersu][1-6][a-z]*") | regexm(new_name, "^[mfkpq][1-5][nat|city]wt*") | regexm(new_name, "^idnum$") if new_name !=""
Figure 7. Test code (Stata) for ensuring data quality in variable names. After standardizing all the variable names, we wrote code to automatically test whether all the variable names followed these conventions. Figure 7 displays this test code. Additionally, once the standard variable names were constructed, we parsed the variable names into distinct columns to create easy-to-use metadata about all information contained in the variable names. Automatically generating these columns
25
from the variable name ensures that the metadata remains consistent; selecting variables based on names is guaranteed to yield the same result as searching for variables based on metadata columns parsed from the names. Standardizing missing data codes In the original FFCWS data files, there were more than 40 different combinations of missing data codes, with some otherwise similar combinations differentiated by typing errors. To handle this issue, we marked all variables that encoded missing data in a non-standard way. Then, we recoded the missing data for each variable according to the standard convention. We accomplished this programmatically with an additional metadata field that we do not include in the canonical metadata file; some of the more complex supplementary variables were handled manually on a case-by-case basis. Most FFCWS variables now observe a standard format for missing data codes (see Table 3 in the main text of the paper). There were three exceptions, however. First, there are no missing data codes for three types of variables: survey weights, strings, and the ID number variable. For these variables, we left the response coding unaltered. Second, there are about 300 variables (approximately 1% of the full FFCWS dataset) that have substantive answers stored as values less than -9. For example, variable m5c1 asks the mother about her relationship with the father. For this variable, response code -10 is labeled “-10 Never see him”. Third, some variables in the data have negative answers that are non-missing and meaningful. For example, some variables store standardized z-scores for respondent BMI (e.g. ch3bmiz ), and these values may be negative In general, FFCWS data users should not assume that only positive-valued responses are substantively meaningful. Additionally, users should not assume that all negative-valued responses are captured by the 9 standard missing data codes described in Table 3. To help ensure that users correctly identify and handle these cases, each variable with a meaningful answer stored in a negative response code has been marked with a warning flag (see Appendix B).
26
Appendix B. Creating machine-actionable metadata Variable types There are five types of variables in the FFCWS data: string, binary, ordered categorical, unordered categorical, and continuous. We define the type of each variable by analyzing the type and range of its response values (see Figure 8). Two of these categories are relatively straightforward to categorize: variables with manually entered text are always categorized as string variables, and variables with exactly two valid response values are always categorized as binary variables. We then mark variables with more than two possible response values as categorical, and additionally distinguish them as ordered or unordered based on whether the responses are unambiguously ordered. For example, variables with responses that indicate how often an activity happens (e.g. “often”, “sometimes”, “rarely”, “never”) are marked as ordered categorical variables, while variables with responses that refer to different types of something (e.g. ethnic identity) are marked as unordered categorical variables. Variables reported according to an interval metric and manually entered as a number (e.g. height, age, or weight) are typically categorized as continuous. However, where this quantity has an innate maximum number of responses less than 15 (for example, the number of days per week an activity happens), we mark it as ordered categorical. Date variables in FFCWS typically record a month and a year; to reduce the complexity of the variable type category, we split these variables into an unordered categorical variable for month and a continuous variable for year. Warning codes In addition to classifying each variable as one of five variable types, we mark variables that have the potential to cause issues in the analysis stage with a warning code (see Table 7 for codes and descriptions). We assign a warning code to a variable if a typical user of this data would say that the response coding for that variable would violate their expectations about a variable of that type. Response coding issues in FFCWS variables include misordered categorical variables (where outcomes with greater response code values do not refer to greater quantities); variables with response codes (possibly negative-valued) that override an otherwise continuous response; variables with unique outcomes coded with a negative response code; variables where missing data has been given a positive response code; and binary (yes/no) variables where the response code for “no” is 0 rather than 2. To evaluate the usability of this warning code scheme, we ran a reproducibility test on the above procedure with three coders. As a result of this procedure, we collapsed code 3 (formerly referring to misordered dates) into code 1, as it was found to be redundant. We reserve but do not assign code 3 in the current version of the metadata.
27
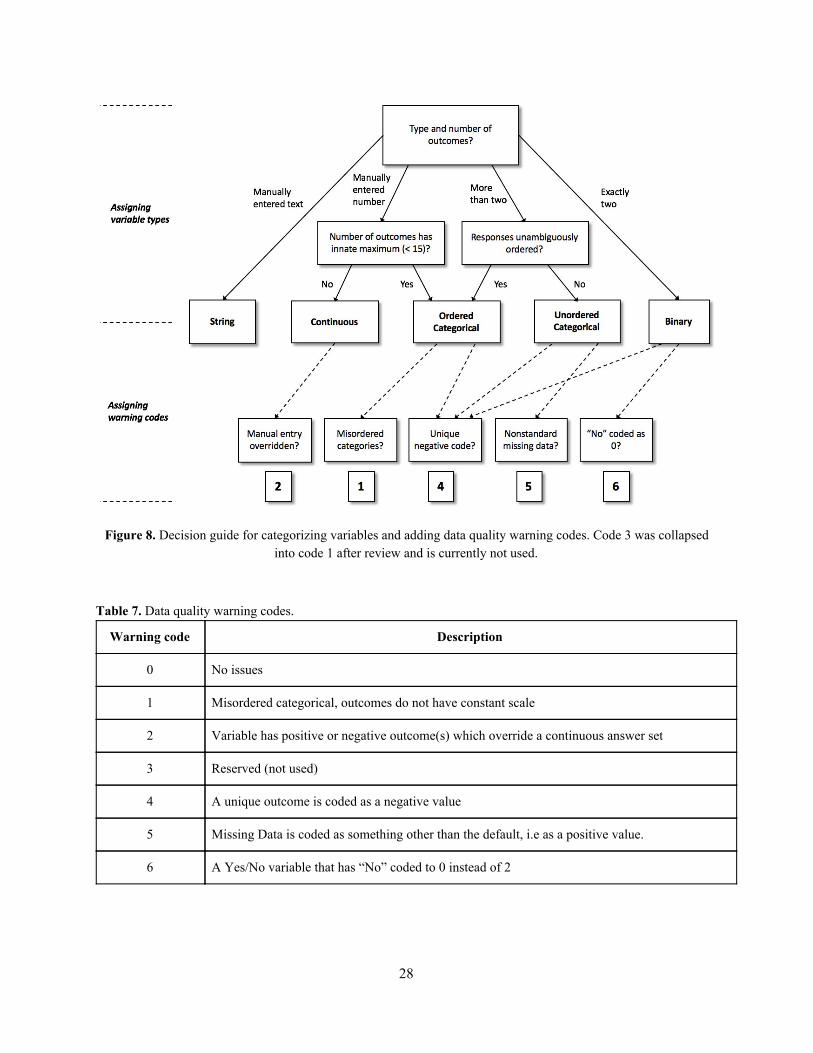
Figure 8. Decision guide for categorizing variables and adding data quality warning codes. Code 3 was collapsed
into code 1 after review and is currently not used. Table 7. Data quality warning codes.
Warning code Description
0 No issues
1 Misordered categorical, outcomes do not have constant scale
2 Variable has positive or negative outcome(s) which override a continuous answer set
3 Reserved (not used)
4 A unique outcome is coded as a negative value
5 Missing Data is coded as something other than the default, i.e as a positive value.
6 A Yes/No variable that has “No” coded to 0 instead of 2
28
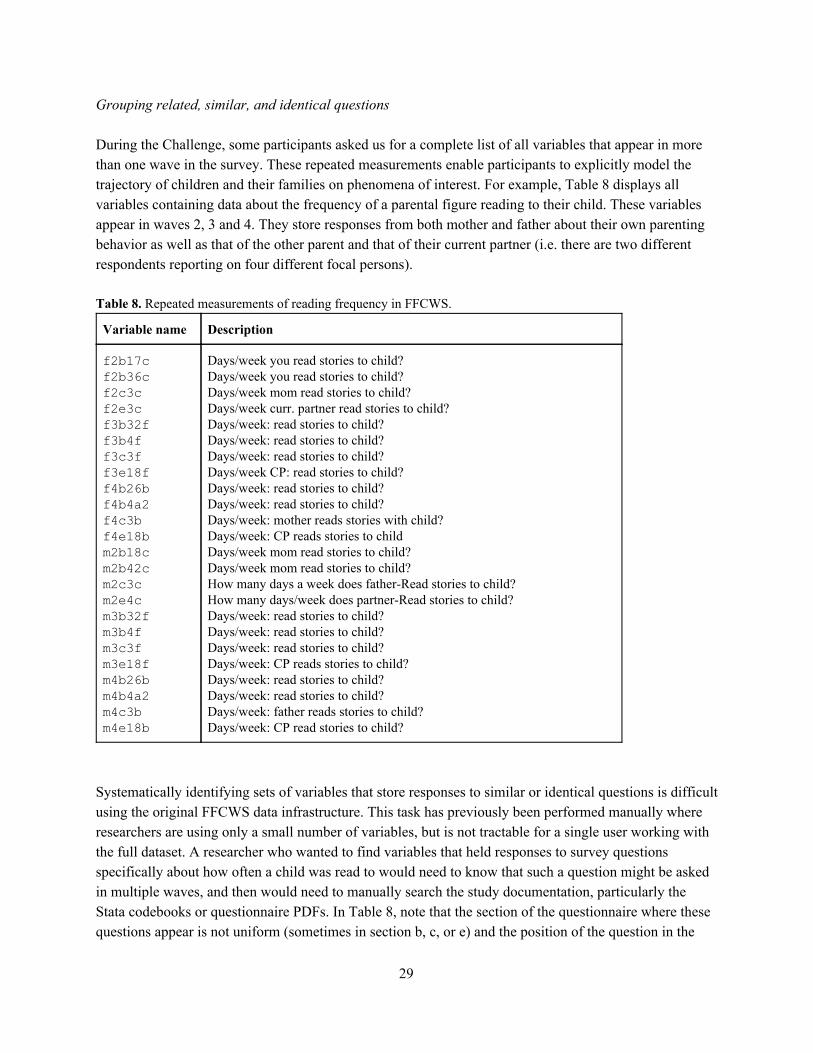
Grouping related, similar, and identical questions During the Challenge, some participants asked us for a complete list of all variables that appear in more than one wave in the survey. These repeated measurements enable participants to explicitly model the trajectory of children and their families on phenomena of interest. For example, Table 8 displays all variables containing data about the frequency of a parental figure reading to their child. These variables appear in waves 2, 3 and 4. They store responses from both mother and father about their own parenting behavior as well as that of the other parent and that of their current partner (i.e. there are two different respondents reporting on four different focal persons). Table 8. Repeated measurements of reading frequency in FFCWS.
Variable name Description
f2b17c
f2b36c
f2c3c
f2e3c
f3b32f
f3b4f
f3c3f
f3e18f
f4b26b
f4b4a2
f4c3b
f4e18b
m2b18c
m2b42c
m2c3c
m2e4c
m3b32f
m3b4f
m3c3f
m3e18f
m4b26b
m4b4a2
m4c3b
m4e18b
Days/week you read stories to child? Days/week you read stories to child? Days/week mom read stories to child? Days/week curr. partner read stories to child? Days/week: read stories to child? Days/week: read stories to child? Days/week: read stories to child? Days/week CP: read stories to child? Days/week: read stories to child? Days/week: read stories to child? Days/week: mother reads stories with child? Days/week: CP reads stories to child Days/week mom read stories to child? Days/week mom read stories to child? How many days a week does father-Read stories to child? How many days/week does partner-Read stories to child? Days/week: read stories to child? Days/week: read stories to child? Days/week: read stories to child? Days/week: CP reads stories to child? Days/week: read stories to child? Days/week: read stories to child? Days/week: father reads stories to child? Days/week: CP read stories to child?
Systematically identifying sets of variables that store responses to similar or identical questions is difficult using the original FFCWS data infrastructure. This task has previously been performed manually where researchers are using only a small number of variables, but is not tractable for a single user working with the full dataset. A researcher who wanted to find variables that held responses to survey questions specifically about how often a child was read to would need to know that such a question might be asked in multiple waves, and then would need to manually search the study documentation, particularly the Stata codebooks or questionnaire PDFs. In Table 8, note that the section of the questionnaire where these questions appear is not uniform (sometimes in section b, c, or e) and the position of the question in the
29

section is not predictable. This makes it impossible to match questions based solely on metadata extracted from the naming scheme described in the prior section. Additionally, because the original documentation was split by respondent and wave, this task is prone to errors of omission. Users may miss opportunities to add more data to their inquiry or to leverage multiple reports of the same behavior from different respondents. An additional difficulty stems from subtle differences in the content of similarly-phrased questions. For example, questions about reading are not exactly the same: some ask the mom how often she reads to the child, while others ask the mom how often the child’s father or her current partner reads to the child. Similarly, some questions ask the father how often he reads to the child, and others ask the father how often the child’s mom or his current partner reads to the child. A researcher interested in studying effects of being read to might be interested in responses to all of these questions, but it is difficult to detect these similar-but-not-identical questions because their exact wording and punctuation varies in the variable description. To provide a grouping of related questions, we began by implementing a lightweight text matching algorithm that identifies groups of questions that are exactly or “essentially” identical. After removing capitalization and punctuation, we discovered groups of similar questions by clustering questions that meet a threshold level of pairwise similarity. We measured similarity as the pairwise Levenshtein edit distance between two variable labels; this quantity is calculated as the number of single-character edits to one string needed to convert it into the other string. We computed this quantity between all variable labels in the data archive and normalized it by the length of the shorter string in the pair. After experimenting with various threshold values, we found that a threshold proportional edit distance of 0.25 generated a conservative set of matches that kept the level of false positive matches low. This process has two drawbacks. First, questions that match in question text may have different coding schemes for responses. This information is available, but it may be desirable to standardize these schemes to ensure that similar questions are more easily comparable. We plan to address this issue in future improvements to the FFCWS metadata. Second, as discussed above, questions may appear superficially similar that encode quite different kinds of information about substantive phenomena of interest. For example, our manual inspection process surfaced a group that combined questions about how often a caregiver told stories to the child with questions on often a caregiver read stories to the child. These questions are very similar in topical content relative to other questions in the survey, but capture two subtly distinct styles of parenting that may be of theoretical interest. To address this concern, we manually reviewed the groups produced by the matching algorithm and separated any groups that we felt should be considered different questions. Similarly, the matching algorithm sometimes marked questions that should be kept together into separate groups due to differences in variable labels across waves. As part of the review process, we also identified these cases and recombined the variables that should have been grouped together. In the final grouping, each variable is assigned a group number that links it with other variables in the same group.
30
Creating variable topics and subtopics Challenge participants often requested a set of thematic tags that would make it easier to manually search the FFCWS data for variables of interest. We explored several different approaches to determine the best method for assigning variables to topics. Initially, we approached this task by beginning with categories based on the thematically organized sections of the FFCWS core surveys. For each question, we applied topics corresponding to the survey section the question appeared in, and independently assigned topics to variables not already in a section (e.g. constructed variables). However, this approach limited the usefulness of the resulting category scheme. Users are often interested in more fine-grained levels of content than were originally available through the questionnaires. Additionally, the survey section categories were necessarily unable to capture some of the useful cross-wave, cross-survey, and cross-respondent themes that have emerged over the course of data collection. For example, FFCWS contains a considerable number of variables with information on parental incarceration, but does not contain a questionnaire section that specifically targets this phenomenon. Much of this information would be hidden from view if not intentionally grouped into a category of its own. In particular, some of the incarceration data is held in response options for questions on employment or housing. Tagging these variables simply by survey section would result in these variables being marked as about employment or housing and would omit their relevance to incarceration. Our second approach to tagging variables aimed at providing more of these fine-grained details with multiple topics per variable. We read through the surveys in more detail and then inductively constructed more detailed lists of categories based on a thorough exploration. This process was done with ongoing discussion among multiple readers, who shared the task of developing a master list of topics. This method was more comprehensive in its treatment of variable content, but much more time-consuming and difficult to standardize across readers. For example, we could not easily ensure that identical variables or variables with the same general content from different questionnaires ended up in the same category. There were also many different ways to describe different themes, which made this method more susceptible to subjective disagreement across readers. Our final approach to this task built directly off of our effort to group together similar questions by text, as previously described in this appendix. Rather than deciding on a tagging scheme ex ante or tagging individual questions, we assigned topics to each group of questions surfaced by our matching algorithm. This dramatically reduced the effort of ensuring standardization across variables, and allowed the content of the surveys to emerge without erroneously placing repeated questions into redundant, but differing, categories. The effort to tag groups also acted as a validation mechanism for the clusters themselves. Some groups that resisted tagging required splitting, and some groups were candidates for merging into larger groups. As we checked each cluster, we also combined similar or overlapping topics as needed. In this final method, we assigned at least one topic for every variable, and where appropriate assigned a second topic. To provide users with a more general set of topics describing the content of the data, we also grouped the topics into a set of larger categories. These categories capture broader substantive topics in the data, such as housing or parenting. We limited topics to two per variable at this time for manageability but may add
31
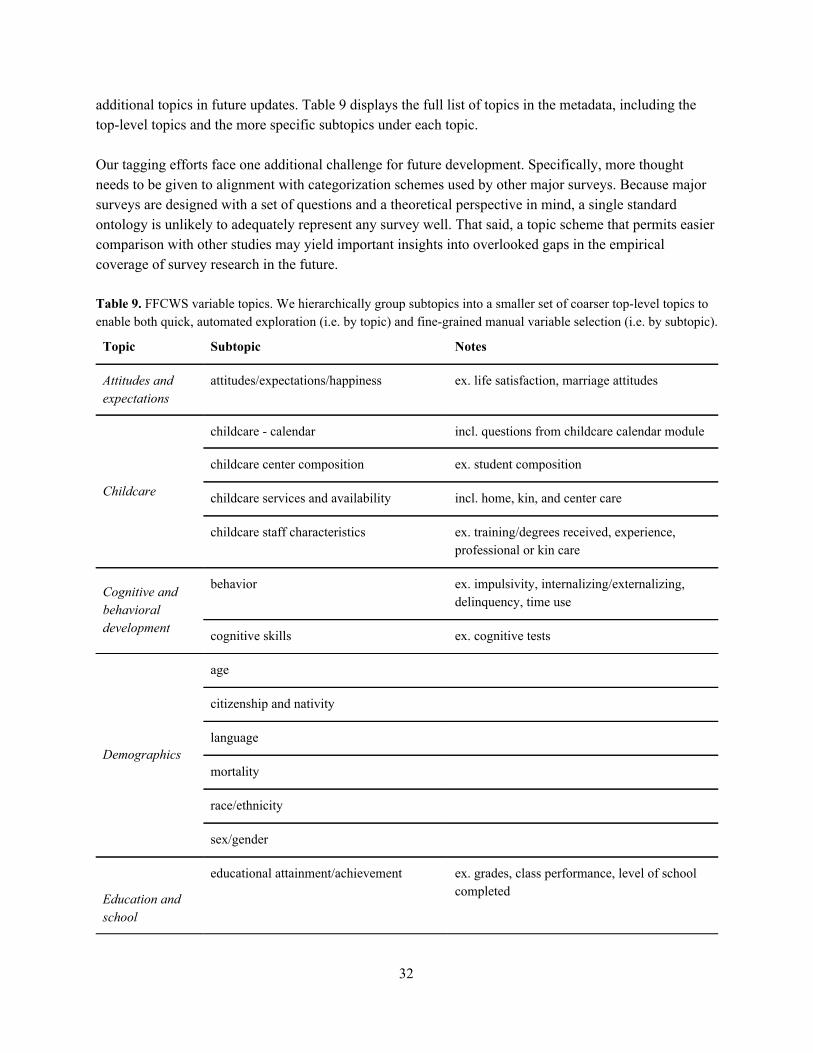
additional topics in future updates. Table 9 displays the full list of topics in the metadata, including the top-level topics and the more specific subtopics under each topic. Our tagging efforts face one additional challenge for future development. Specifically, more thought needs to be given to alignment with categorization schemes used by other major surveys. Because major surveys are designed with a set of questions and a theoretical perspective in mind, a single standard ontology is unlikely to adequately represent any survey well. That said, a topic scheme that permits easier comparison with other studies may yield important insights into overlooked gaps in the empirical coverage of survey research in the future. Table 9. FFCWS variable topics. We hierarchically group subtopics into a smaller set of coarser top-level topics to enable both quick, automated exploration (i.e. by topic) and fine-grained manual variable selection (i.e. by subtopic).
Topic Subtopic Notes
Attitudes and expectations
attitudes/expectations/happiness ex. life satisfaction, marriage attitudes
Childcare
childcare - calendar incl. questions from childcare calendar module
childcare center composition ex. student composition
childcare services and availability incl. home, kin, and center care
childcare staff characteristics ex. training/degrees received, experience, professional or kin care
Cognitive and behavioral development
behavior ex. impulsivity, internalizing/externalizing, delinquency, time use
cognitive skills ex. cognitive tests
Demographics
age
citizenship and nativity
language
mortality
race/ethnicity
sex/gender
Education and school
educational attainment/achievement ex. grades, class performance, level of school completed
32
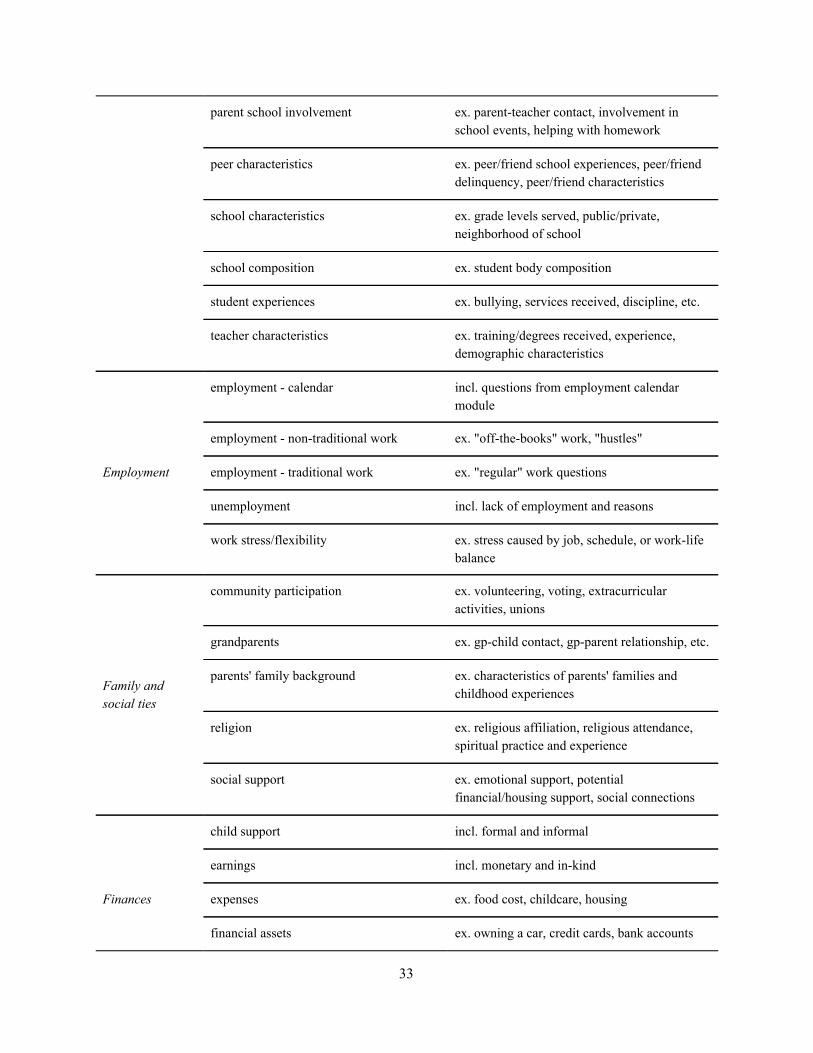
parent school involvement ex. parent-teacher contact, involvement in school events, helping with homework
peer characteristics ex. peer/friend school experiences, peer/friend delinquency, peer/friend characteristics
school characteristics ex. grade levels served, public/private, neighborhood of school
school composition ex. student body composition
student experiences ex. bullying, services received, discipline, etc.
teacher characteristics ex. training/degrees received, experience, demographic characteristics
Employment
employment - calendar incl. questions from employment calendar module
employment - non-traditional work ex. "off-the-books" work, "hustles"
employment - traditional work ex. "regular" work questions
unemployment incl. lack of employment and reasons
work stress/flexibility ex. stress caused by job, schedule, or work-life balance
Family and social ties
community participation ex. volunteering, voting, extracurricular activities, unions
grandparents ex. gp-child contact, gp-parent relationship, etc.
parents' family background ex. characteristics of parents' families and childhood experiences
religion ex. religious affiliation, religious attendance, spiritual practice and experience
social support ex. emotional support, potential financial/housing support, social connections
Finances
child support incl. formal and informal
earnings incl. monetary and in-kind
expenses ex. food cost, childcare, housing
financial assets ex. owning a car, credit cards, bank accounts
33
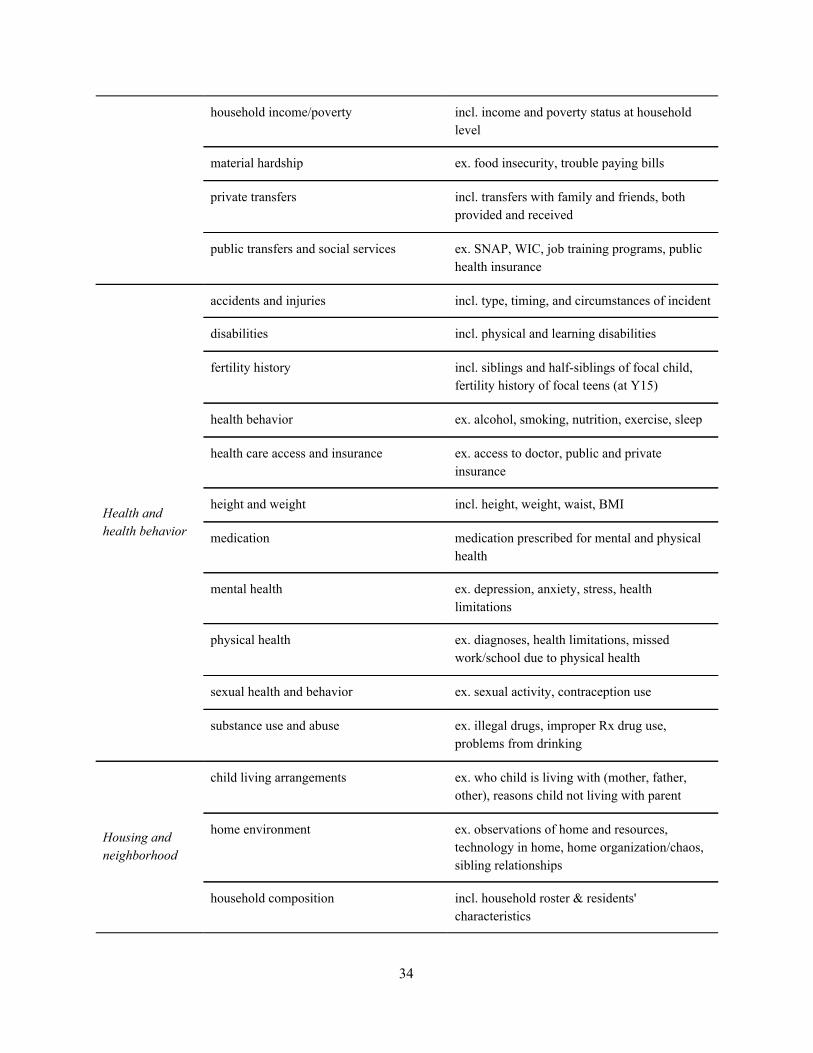
household income/poverty incl. income and poverty status at household level
material hardship ex. food insecurity, trouble paying bills
private transfers incl. transfers with family and friends, both provided and received
public transfers and social services ex. SNAP, WIC, job training programs, public health insurance
Health and health behavior
accidents and injuries incl. type, timing, and circumstances of incident
disabilities incl. physical and learning disabilities
fertility history incl. siblings and half-siblings of focal child, fertility history of focal teens (at Y15)
health behavior ex. alcohol, smoking, nutrition, exercise, sleep
health care access and insurance ex. access to doctor, public and private insurance
height and weight incl. height, weight, waist, BMI
medication medication prescribed for mental and physical health
mental health ex. depression, anxiety, stress, health limitations
physical health ex. diagnoses, health limitations, missed work/school due to physical health
sexual health and behavior ex. sexual activity, contraception use
substance use and abuse ex. illegal drugs, improper Rx drug use, problems from drinking
Housing and neighborhood
child living arrangements ex. who child is living with (mother, father, other), reasons child not living with parent
home environment ex. observations of home and resources, technology in home, home organization/chaos, sibling relationships
household composition incl. household roster & residents' characteristics
34
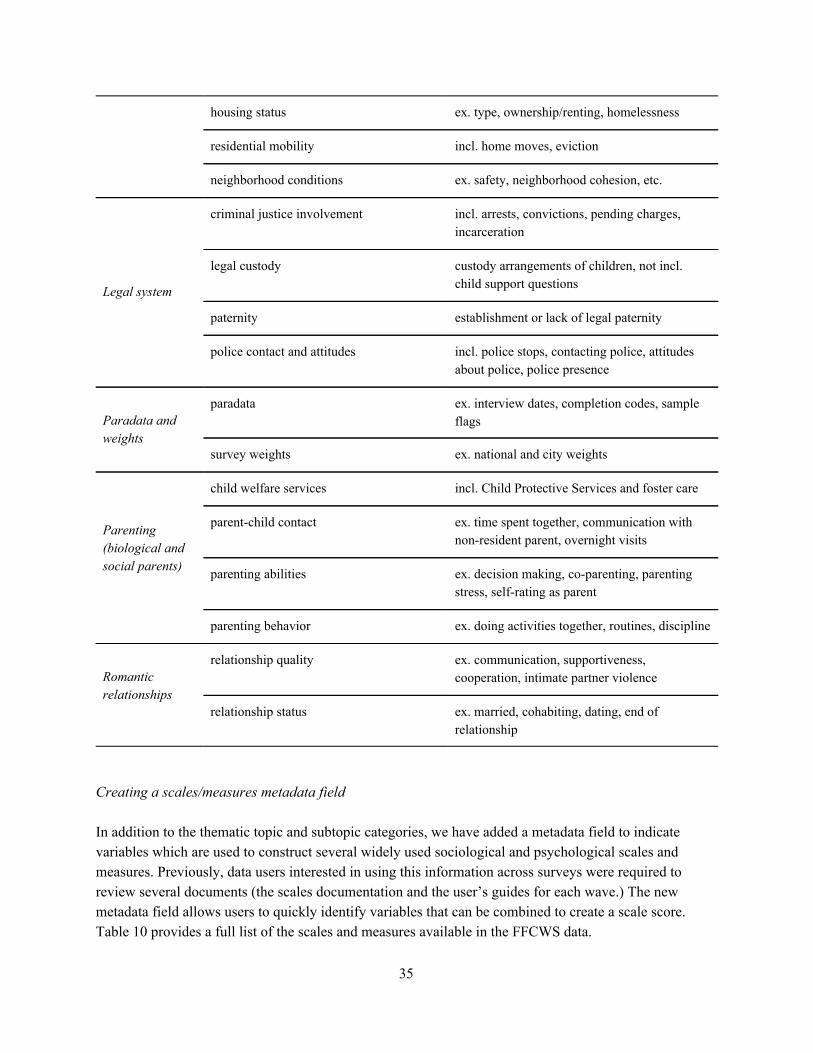
housing status ex. type, ownership/renting, homelessness
residential mobility incl. home moves, eviction
neighborhood conditions ex. safety, neighborhood cohesion, etc.
Legal system
criminal justice involvement incl. arrests, convictions, pending charges, incarceration
legal custody custody arrangements of children, not incl. child support questions
paternity establishment or lack of legal paternity
police contact and attitudes incl. police stops, contacting police, attitudes about police, police presence
Paradata and weights
paradata ex. interview dates, completion codes, sample flags
survey weights ex. national and city weights
Parenting (biological and social parents)
child welfare services incl. Child Protective Services and foster care
parent-child contact ex. time spent together, communication with non-resident parent, overnight visits
parenting abilities ex. decision making, co-parenting, parenting stress, self-rating as parent
parenting behavior ex. doing activities together, routines, discipline
Romantic relationships
relationship quality ex. communication, supportiveness, cooperation, intimate partner violence
relationship status ex. married, cohabiting, dating, end of relationship
Creating a scales/measures metadata field In addition to the thematic topic and subtopic categories, we have added a metadata field to indicate variables which are used to construct several widely used sociological and psychological scales and measures. Previously, data users interested in using this information across surveys were required to review several documents (the scales documentation and the user’s guides for each wave.) The new metadata field allows users to quickly identify variables that can be combined to create a scale score. Table 10 provides a full list of the scales and measures available in the FFCWS data.
35
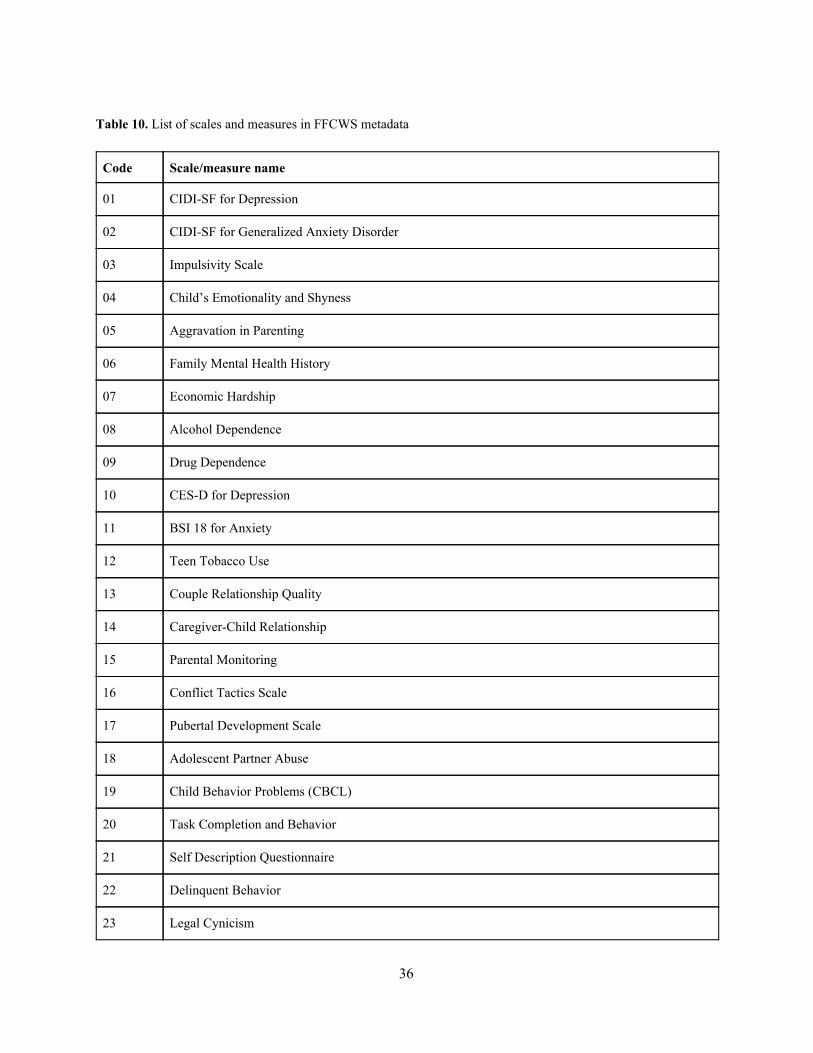
Table 10. List of scales and measures in FFCWS metadata
Code Scale/measure name
01 CIDI-SF for Depression
02 CIDI-SF for Generalized Anxiety Disorder
03 Impulsivity Scale
04 Child’s Emotionality and Shyness
05 Aggravation in Parenting
06 Family Mental Health History
07 Economic Hardship
08 Alcohol Dependence
09 Drug Dependence
10 CES-D for Depression
11 BSI 18 for Anxiety
12 Teen Tobacco Use
13 Couple Relationship Quality
14 Caregiver-Child Relationship
15 Parental Monitoring
16 Conflict Tactics Scale
17 Pubertal Development Scale
18 Adolescent Partner Abuse
19 Child Behavior Problems (CBCL)
20 Task Completion and Behavior
21 Self Description Questionnaire
22 Delinquent Behavior
23 Legal Cynicism
36
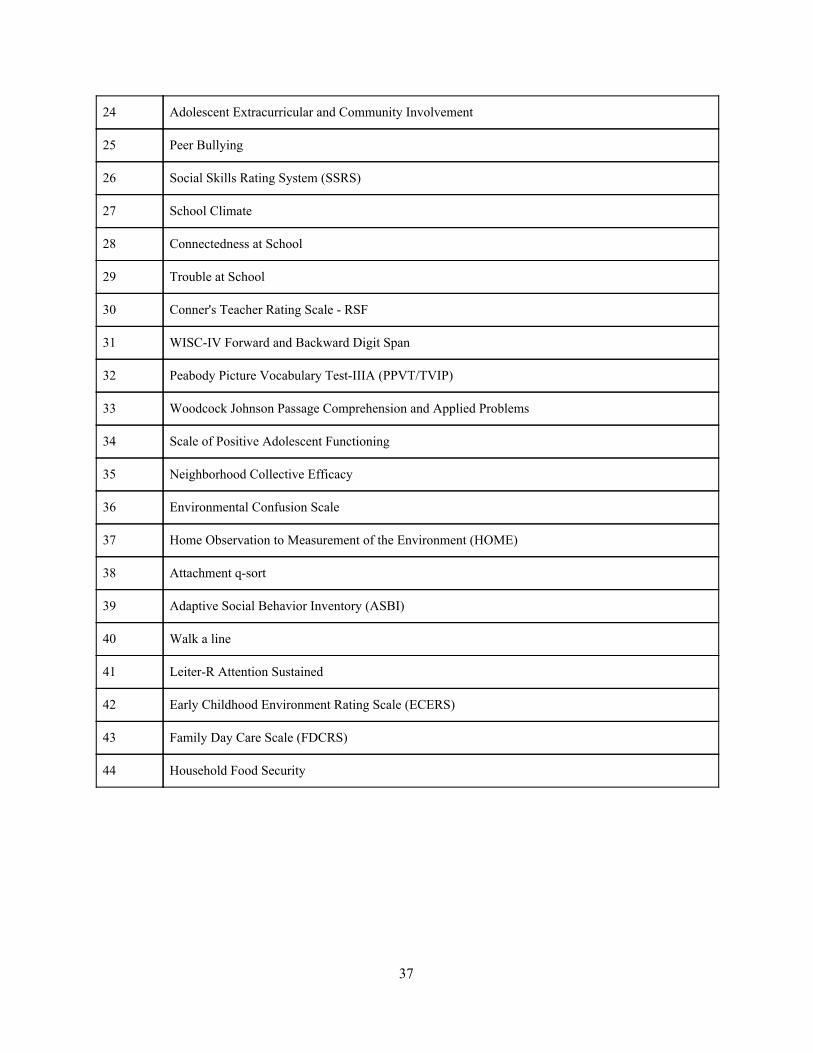
24 Adolescent Extracurricular and Community Involvement
25 Peer Bullying
26 Social Skills Rating System (SSRS)
27 School Climate
28 Connectedness at School
29 Trouble at School
30 Conner's Teacher Rating Scale - RSF
31 WISC-IV Forward and Backward Digit Span
32 Peabody Picture Vocabulary Test-IIIA (PPVT/TVIP)
33 Woodcock Johnson Passage Comprehension and Applied Problems
34 Scale of Positive Adolescent Functioning
35 Neighborhood Collective Efficacy
36 Environmental Confusion Scale
37 Home Observation to Measurement of the Environment (HOME)
38 Attachment q-sort
39 Adaptive Social Behavior Inventory (ASBI)
40 Walk a line
41 Leiter-R Attention Sustained
42 Early Childhood Environment Rating Scale (ECERS)
43 Family Day Care Scale (FDCRS)
44 Household Food Security
37
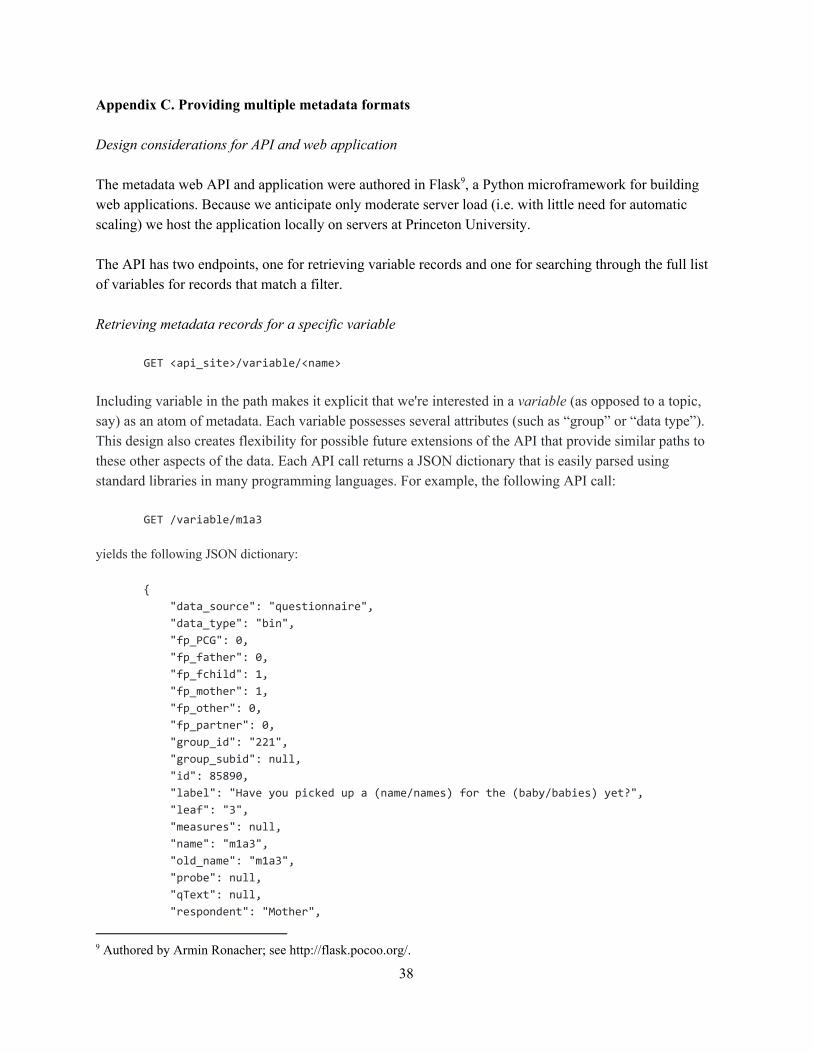
Appendix C. Providing multiple metadata formats Design considerations for API and web application The metadata web API and application were authored in Flask , a Python microframework for building 9
web applications. Because we anticipate only moderate server load (i.e. with little need for automatic scaling) we host the application locally on servers at Princeton University. The API has two endpoints, one for retrieving variable records and one for searching through the full list of variables for records that match a filter. Retrieving metadata records for a specific variable
GET <api_site>/variable/<name>
Including variable in the path makes it explicit that we're interested in a variable (as opposed to a topic, say) as an atom of metadata. Each variable possesses several attributes (such as “group” or “data type”). This design also creates flexibility for possible future extensions of the API that provide similar paths to these other aspects of the data. Each API call returns a JSON dictionary that is easily parsed using standard libraries in many programming languages. For example, the following API call:
GET /variable/m1a3
yields the following JSON dictionary:
{
"data_source": "questionnaire",
"data_type": "bin",
"fp_PCG": 0,
"fp_father": 0,
"fp_fchild": 1,
"fp_mother": 1,
"fp_other": 0,
"fp_partner": 0,
"group_id": "221",
"group_subid": null,
"id": 85890,
"label": "Have you picked up a (name/names) for the (baby/babies) yet?",
"leaf": "3",
"measures": null,
"name": "m1a3",
"old_name": "m1a3",
"probe": null,
"qText": null,
"respondent": "Mother",
9 Authored by Armin Ronacher; see http://flask.pocoo.org/.
38
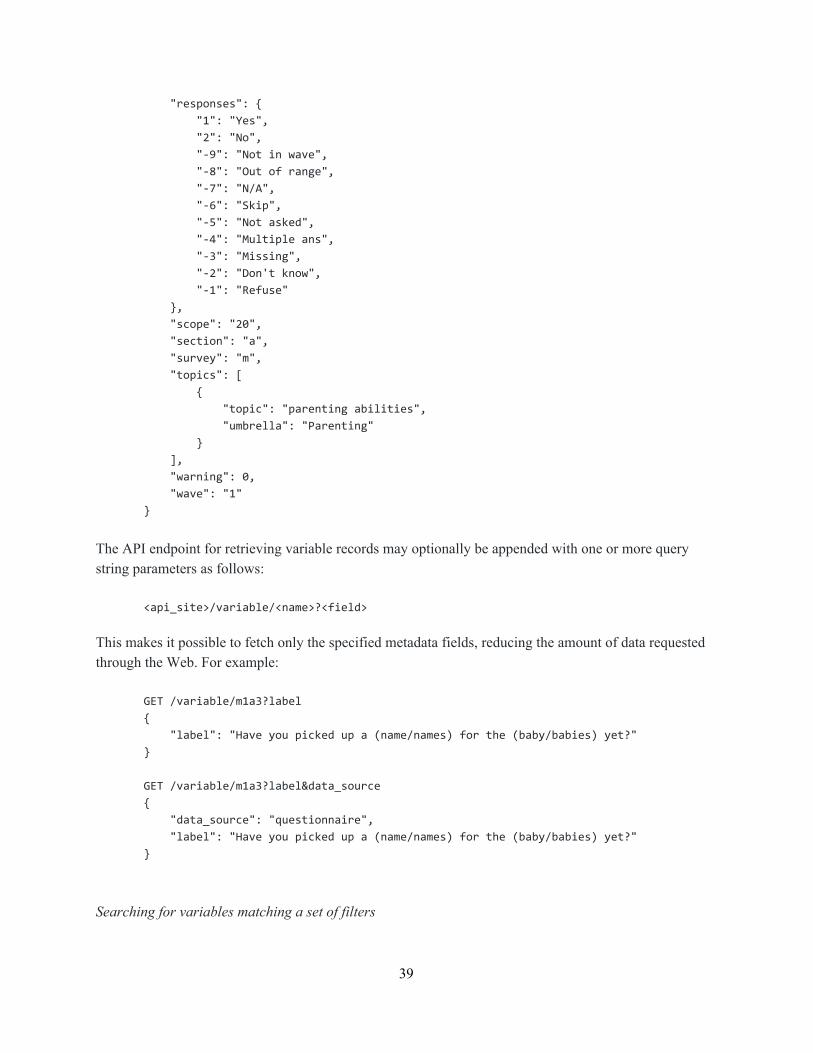
"responses": {
"1": "Yes",
"2": "No",
"-9": "Not in wave",
"-8": "Out of range",
"-7": "N/A",
"-6": "Skip",
"-5": "Not asked",
"-4": "Multiple ans",
"-3": "Missing",
"-2": "Don't know",
"-1": "Refuse"
},
"scope": "20",
"section": "a",
"survey": "m",
"topics": [
{
"topic": "parenting abilities",
"umbrella": "Parenting"
}
],
"warning": 0,
"wave": "1"
}
The API endpoint for retrieving variable records may optionally be appended with one or more query string parameters as follows:
<api_site>/variable/<name>?<field>
This makes it possible to fetch only the specified metadata fields, reducing the amount of data requested through the Web. For example:
GET /variable/m1a3?label
{
"label": "Have you picked up a (name/names) for the (baby/babies) yet?"
}
GET /variable/m1a3?label&data_source
{
"data_source": "questionnaire",
"label": "Have you picked up a (name/names) for the (baby/babies) yet?"
}
Searching for variables matching a set of filters
39
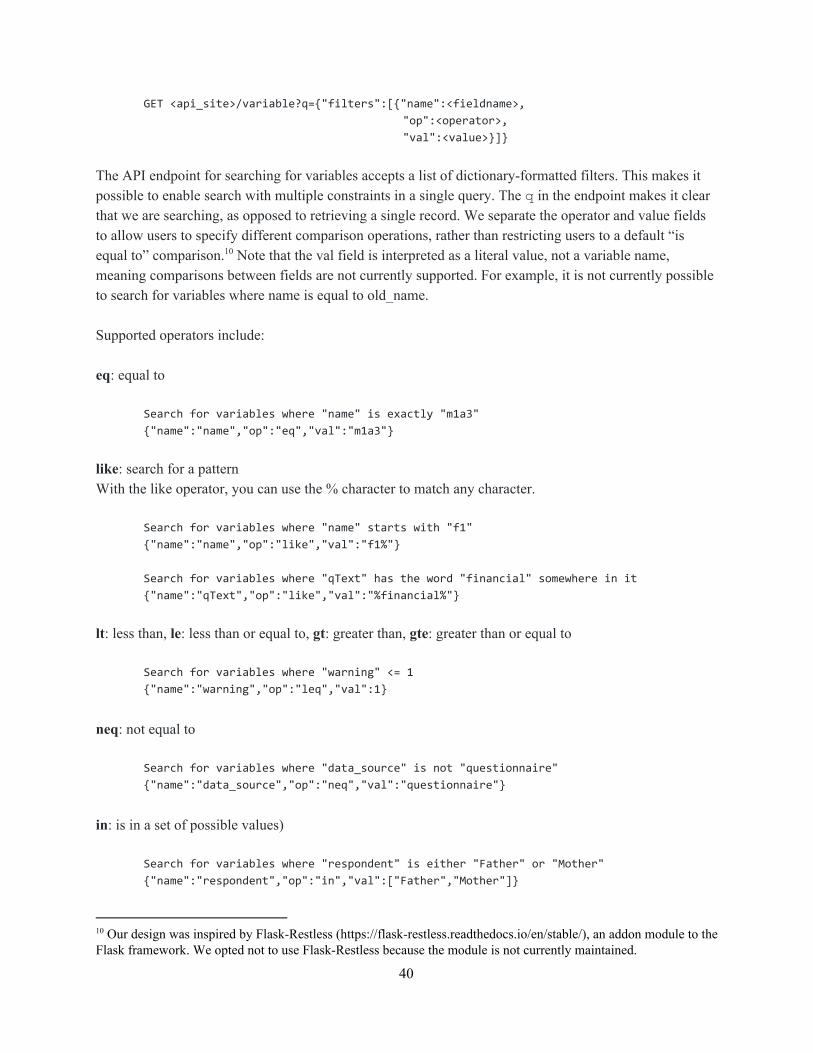
GET <api_site>/variable?q={"filters":[{"name":<fieldname>,
"op":<operator>,
"val":<value>}]}
The API endpoint for searching for variables accepts a list of dictionary-formatted filters. This makes it possible to enable search with multiple constraints in a single query. The q in the endpoint makes it clear that we are searching, as opposed to retrieving a single record. We separate the operator and value fields to allow users to specify different comparison operations, rather than restricting users to a default “is equal to” comparison. Note that the val field is interpreted as a literal value, not a variable name, 10
meaning comparisons between fields are not currently supported. For example, it is not currently possible to search for variables where name is equal to old_name. Supported operators include: eq: equal to
Search for variables where "name" is exactly "m1a3"
{"name":"name","op":"eq","val":"m1a3"}
like: search for a pattern With the like operator, you can use the % character to match any character.
Search for variables where "name" starts with "f1"
{"name":"name","op":"like","val":"f1%"}
Search for variables where "qText" has the word "financial" somewhere in it
{"name":"qText","op":"like","val":"%financial%"}
lt: less than, le: less than or equal to, gt: greater than, gte: greater than or equal to
Search for variables where "warning" <= 1
{"name":"warning","op":"leq","val":1}
neq: not equal to
Search for variables where "data_source" is not "questionnaire"
{"name":"data_source","op":"neq","val":"questionnaire"}
in: is in a set of possible values)
Search for variables where "respondent" is either "Father" or "Mother"
{"name":"respondent","op":"in","val":["Father","Mother"]}
10 Our design was inspired by Flask-Restless (https://flask-restless.readthedocs.io/en/stable/), an addon module to the Flask framework. We opted not to use Flask-Restless because the module is not currently maintained.
40
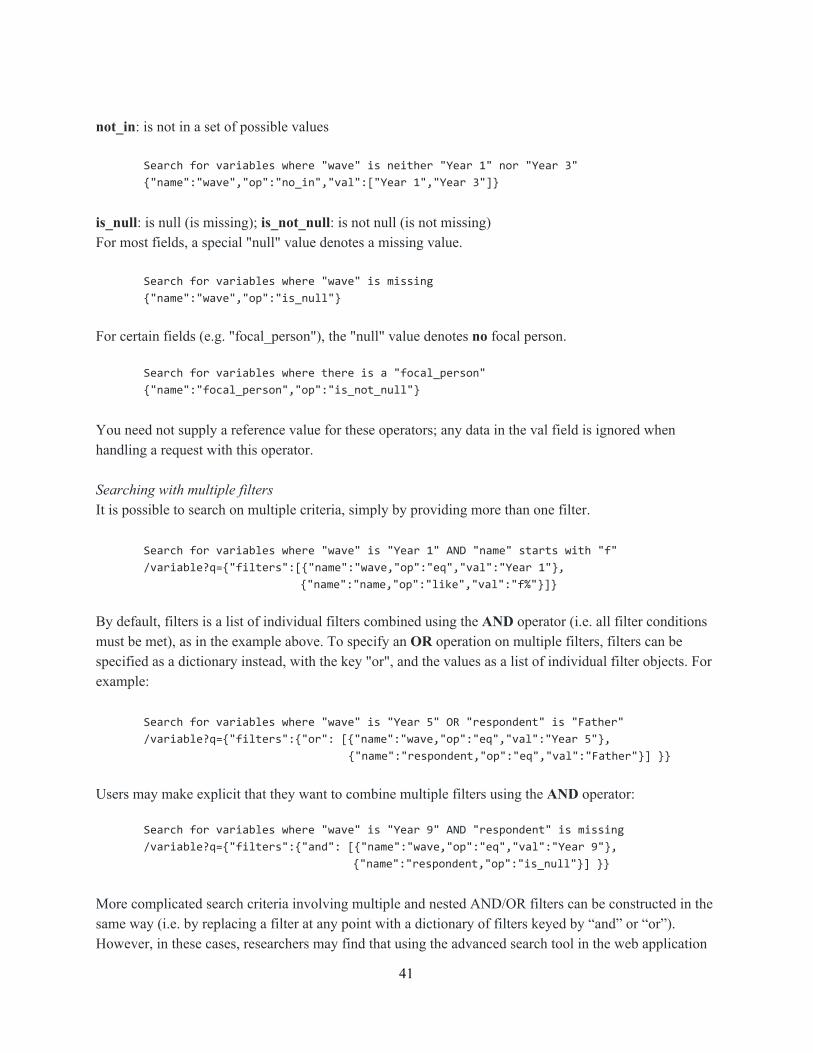
not_in: is not in a set of possible values
Search for variables where "wave" is neither "Year 1" nor "Year 3"
{"name":"wave","op":"no_in","val":["Year 1","Year 3"]}
is_null: is null (is missing); is_not_null: is not null (is not missing) For most fields, a special "null" value denotes a missing value.
Search for variables where "wave" is missing
{"name":"wave","op":"is_null"}
For certain fields (e.g. "focal_person"), the "null" value denotes no focal person.
Search for variables where there is a "focal_person"
{"name":"focal_person","op":"is_not_null"}
You need not supply a reference value for these operators; any data in the val field is ignored when handling a request with this operator. Searching with multiple filters It is possible to search on multiple criteria, simply by providing more than one filter.
Search for variables where "wave" is "Year 1" AND "name" starts with "f"
/variable?q={"filters":[{"name":"wave,"op":"eq","val":"Year 1"},
{"name":"name,"op":"like","val":"f%"}]}
By default, filters is a list of individual filters combined using the AND operator (i.e. all filter conditions must be met), as in the example above. To specify an OR operation on multiple filters, filters can be specified as a dictionary instead, with the key "or", and the values as a list of individual filter objects. For example:
Search for variables where "wave" is "Year 5" OR "respondent" is "Father"
/variable?q={"filters":{"or": [{"name":"wave,"op":"eq","val":"Year 5"},
{"name":"respondent,"op":"eq","val":"Father"}] }}
Users may make explicit that they want to combine multiple filters using the AND operator:
Search for variables where "wave" is "Year 9" AND "respondent" is missing
/variable?q={"filters":{"and": [{"name":"wave,"op":"eq","val":"Year 9"},
{"name":"respondent,"op":"is_null"}] }}
More complicated search criteria involving multiple and nested AND/OR filters can be constructed in the same way (i.e. by replacing a filter at any point with a dictionary of filters keyed by “and” or “or”). However, in these cases, researchers may find that using the advanced search tool in the web application
41
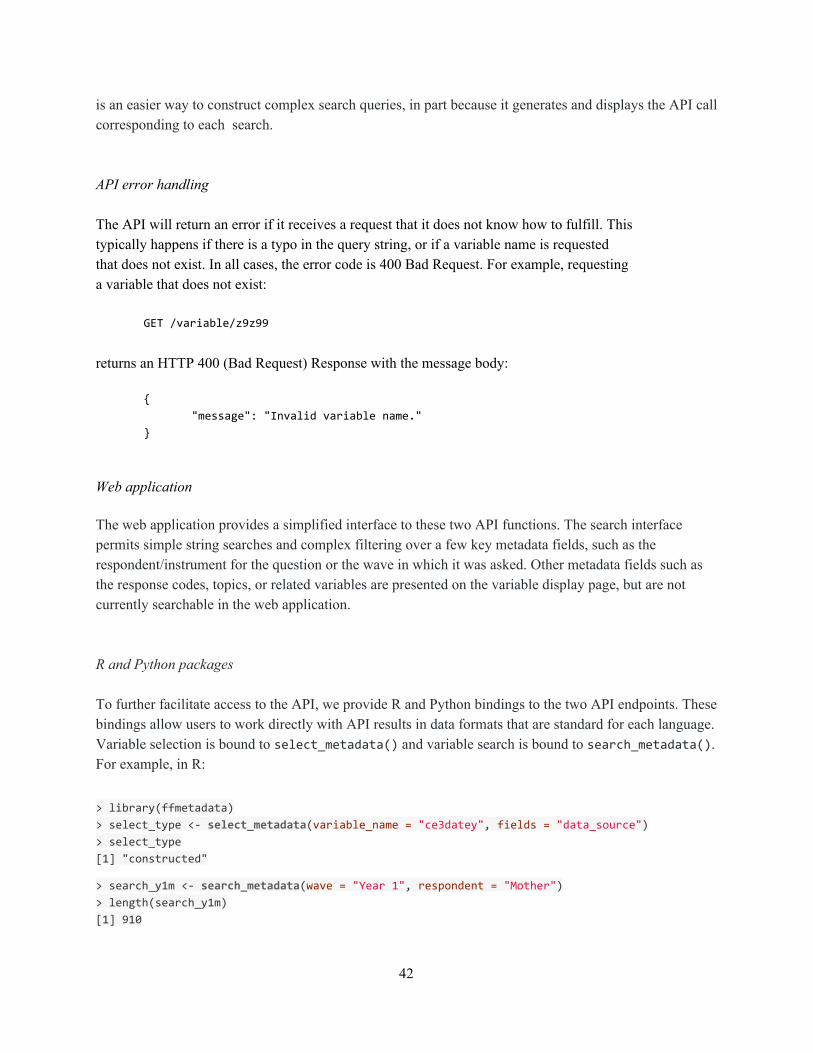
is an easier way to construct complex search queries, in part because it generates and displays the API call corresponding to each search. API error handling The API will return an error if it receives a request that it does not know how to fulfill. This typically happens if there is a typo in the query string, or if a variable name is requested that does not exist. In all cases, the error code is 400 Bad Request. For example, requesting a variable that does not exist:
GET /variable/z9z99 returns an HTTP 400 (Bad Request) Response with the message body:
{
"message": "Invalid variable name."
}
Web application The web application provides a simplified interface to these two API functions. The search interface permits simple string searches and complex filtering over a few key metadata fields, such as the respondent/instrument for the question or the wave in which it was asked. Other metadata fields such as the response codes, topics, or related variables are presented on the variable display page, but are not currently searchable in the web application. R and Python packages To further facilitate access to the API, we provide R and Python bindings to the two API endpoints. These bindings allow users to work directly with API results in data formats that are standard for each language. Variable selection is bound to select_metadata() and variable search is bound to search_metadata(). For example, in R: > library(ffmetadata)
> select_type <- select_metadata(variable_name = "ce3datey", fields = "data_source") > select_type [1] "constructed"
> search_y1m <- search_metadata(wave = "Year 1", respondent = "Mother") > length(search_y1m)
[1] 910
42
Related Documents