i Improving medication adherence in patients with chronic disease using a targeted and tailored approach Thi-My-Uyen Nguyen Bachelor of Pharmacy (Honours I) A thesis submitted for the degree of Doctor of Philosophy at The University of Queensland in 2015 School of Pharmacy

Welcome message from author
This document is posted to help you gain knowledge. Please leave a comment to let me know what you think about it! Share it to your friends and learn new things together.
Transcript

i
Improving medication adherence in patients with chronic disease
using a targeted and tailored approach
Thi-My-Uyen Nguyen
Bachelor of Pharmacy (Honours I)
A thesis submitted for the degree of Doctor of Philosophy at
The University of Queensland in 2015
School of Pharmacy
ii
Abstract
Improving adherence to medications is an opportunity that can yield great improvements in
health outcomes and reducing health costs. Supporting adherence to medicines requires
insight into a patient’s medication-taking behaviour and their reasons for non-adherence.
Adherence interventions that show most promise include multifaceted interventions, and
those targeted to non-adherent patients and/or tailored to patient-specific reasons for non-
adherence. To identify non-adherent patients and their reasons for non-adherence in the
practice setting, I argue that we require inexpensive measures that are easy to use and can
inform the discussion with patients about their adherence. Adherence scales are
inexpensive, easy-to-administer and have the potential to explore both medication-taking
behaviour and reasons for behaviour.
The overall aim of the thesis is to determine if a targeted and tailored intervention based on
a discussion informed by validated adherence scales, will improve adherence to a recently
initiated cardiovascular medication. I hypothesise that targeting and tailoring an intervention
to non-adherent participants based on a discussion informed by adherence scales, will
improve adherence at three months as measured by the four-item Medication Adherence
Questionnaire (MAQ). I will also test whether improvements in adherence at three months
are sustained at six months and explore the changes in adherence and reasons for non-
adherence over time.
The first part of the thesis involved identifying validated adherence scales suitable for use in
the intervention. A systematic review was conducted on adherence scales to explore their
use and validation. We found that adherence scales measured different aspects of
adherence: medication-taking behaviour, barriers to adherence and beliefs associated with
adherence. Adherence scales have been validated in different disease populations and
against different measures of adherence. We selected two adherence scales for our study:
the MAQ and Beliefs about Medicines Questionnaire-Specific (BMQ-S). The MAQ is one of
the most commonly used adherence scales that has been validated in many disease
populations and against different measures of adherence including electronic monitoring.
The BMQ-S has been extensively used to elicit medication beliefs associated with
medication adherence and validated in a number of diseases including cardiovascular
disease, asthma and depression.
A randomised controlled trial was conducted to determine if a targeted and tailored
intervention would improve medication adherence. Four hundred and eight patients were

iii
assessed for eligibility from two community pharmacies, from which 152 patients were
enrolled into the study. All enrolled participants completed the MAQ, BMQ-S and Brief Illness
Perceptions Questionnaire (BIPQ). There were 120 participants identified as non-adherent
using the MAQ, who were randomised into an intervention or control group. The remaining
32 participants were identified as adherent. In the intervention group, the results from the
MAQ, BMQ-S, and BIPQ were used by the researcher (TN) to identify reasons for non-
adherence and inform the implementation of a tailored strategy. There was no difference
between the mean MAQ scores at baseline: 1.58 ± 0.79 (intervention) and 1.60 ± 0.67
(control) (p=0.9008). At three months, the mean MAQ score in the intervention group was
significantly lower than the control group, reflecting an improvement in adherence (mean
MAQ 0.42 ± 0.59 v 1.58 ± 0.65; p<0.001). The significant improvement in the mean MAQ
score in the intervention group compared to control was sustained at six months (0.48 ±
0.68 vs 1.48 ± 0.83; p<0.001).
The intervention consisted of an interview and the implementation of a tailored strategy. The
participant’s reasons for non-adherence were explored using their responses to the MAQ,
BMQ-S and BIPQ. Where possible the researcher used responses to the adherence scales
to inform further discussion regarding the participant’s adherence and the factors that
supported or impeded them taking their medicine. The researcher and participant then
selected and implemented an evidence-based tailored strategy to support the participant’s
adherence based on the information discussed in the interview. Tailored strategies included
reminders, cognitive-educational strategies, both a reminder and cognitive-educational
strategy, behavioural-counselling and social support. For example, if the main barrier to
adherence is identified as forgetfulness, then the participant will receive a reminder strategy.
Changes in the responses to the questionnaires were explored in the adherent, intervention
and control groups, and also within the different types of strategies. In the intervention group,
patients who received a cognitive-educational strategy had improved perceived
understanding of their illness corresponding to improvements in their adherence score on
the MAQ. As expected, patients who received a reminder strategy on its own had no
significant changes in their beliefs about medicines and illness perceptions.
An intervention that targeted non-adherent participants and tailored to the participant-
specific reasons for non-adherence was successful at improving medication adherence.
Better understanding how a patient’s adherence and beliefs about their medicines change
over time, will inform improved interventions to support adherence. This intervention was

iv
quick and easy to administer and has the potential for clinical implementation if proven
successful in larger studies that assess clinical outcomes.

v
Declaration by author
This thesis is composed of my original work, and contains no material previously published
or written by another person except where due reference has been made in the text. I have
clearly stated the contribution by others to jointly-authored works that I have included in my
thesis.
I have clearly stated the contribution of others to my thesis as a whole, including statistical
assistance, survey design, data analysis, significant technical procedures, professional
editorial advice, and any other original research work used or reported in my thesis. The
content of my thesis is the result of work I have carried out since the commencement of my
research higher degree candidature and does not include a substantial part of work that has
been submitted to qualify for the award of any other degree or diploma in any university or
other tertiary institution. I have clearly stated which parts of my thesis, if any, have been
submitted to qualify for another award.
I acknowledge that an electronic copy of my thesis must be lodged with the University Library
and, subject to the policy and procedures of The University of Queensland, the thesis be
made available for research and study in accordance with the Copyright Act 1968 unless a
period of embargo has been approved by the Dean of the Graduate School.
I acknowledge that copyright of all material contained in my thesis resides with the copyright
holder(s) of that material. Where appropriate I have obtained copyright permission from the
copyright holder to reproduce material in this thesis.
vi
Publications during candidature
Peer-Reviewed Papers
Nguyen TMU, La Caze A, Cottrell WN. What are validated self-report adherence scales
really measuring?: a systematic review. British Journal of Clinical Pharmacology
2014;77(3):427-45.
Conference Abstracts Presented as an Oral Presentation
Nguyen TMU. Role of pharmacists in improving medication adherence in patients with
chronic diseases. In: Proceedings of the Australian College of Pharmacy Conference; 2013
July 8; Brisbane.
Nguyen TMU, La Caze A, Cottrell WN. Improving medication adherence in patients with
chronic disease using a targeted and tailored approach: a randomised controlled trial. In:
Proceedings of the National Medicines Symposium; 2014 May 21-23; Brisbane.
Nguyen U, La Caze A, Cottrell WN. A targeted and tailored intervention to improve and
sustain medication adherence: a randomised controlled trial. In: Proceedings of the Society
of Hospital Pharmacists of Australia Conference; 2014 Sep 11-14; Darwin.
Conference Abstracts Presented as a Poster Presentation
Nguyen TMU, La Caze A, Cottrell WN. What are validated self-report adherence scales
really measuring?: a systematic review. In: Proceedings of the Joint Australasian Society of
Clinical and Experimental Pharmacologists and Toxicologists – Australasian
Pharmaceutical Science Association Annual Conference; 2012 December 2-5; Sydney: 578.
Nguyen TMU, La Caze A, Cottrell WN. Developing a method to target and tailor interventions
to improve medication adherence in community pharmacy. In: Proceedings of the Joint
Australasian Society of Clinical and Experimental Pharmacologists and Toxicologists –
Australasian Pharmaceutical Science Association Annual Conference; 2012 December 2-5;
Sydney: 577.

vii
Publications included in this thesis
Nguyen TMU, La Caze A, Cottrell WN. What are validated self-report adherence scales
really measuring?: a systematic review. British Journal of Clinical Pharmacology
2014;77(3):427-45. – incorporated as Chapter Two
Contributor Statement of contribution
Thi-My-Uyen Nguyen Designed experiments (40%)
Data collection (100%)
Wrote and edited paper (40%)
Dr Adam La Caze Designed experiments (30%)
Wrote and edited paper (30%)
Associate Professor Neil Cottrell Designed experiments (30%)
Wrote and edited paper (30%)
Contributions by others to the thesis
My principal advisor, Associate Professor Neil Cottrell and associate advisor, Dr Adam La
Caze made significant contributions to the conception and design of the project. Both
advisors oversaw all aspects of the data collection and interpretation of the data.
Statements of parts of the thesis submitted to qualify for the award of another
degree
None

viii
Acknowledgments
Firstly, I would like to thank my academic advisors, Associate Professor Neil Cottrell and Dr
Adam La Caze, without whom this journey would not have been possible. Both Neil and
Adam have been immensely supportive throughout the past three years. I could not have
asked for better advisors. Their knowledge and experience has helped me grow and improve
on my research skills. The three years spent on my thesis has been extremely enjoyable,
especially because I was a part of such an incredible research team.
I would like to thank all academics and staff at the School of Pharmacy for their kindness,
encouragement and support throughout the past few years. They have made my journey
much more memorable. I would like to make a special mention to Associate Professor Marie-
Odile Parat, Associate Professor Alexandra Clavarino and Myrtle Sahabandu for their words
of wisdom.
I would like to acknowledge the financial support of my APA scholarship, without which this
journey would not have been possible.
I would also like to thank the participants in the study for their valuable time and support of
our research. Without whom we would not have learnt the great deal that we have during
my candidature.
Lastly, I would like to thank my family and friends for their undying support and
encouragement. In particular, my parents and husband, Rongzhen, for supporting me and
always believing in me.

ix
Keywords
medication adherence, non-adherence, chronic diseases, adherence interventions, targeted,
tailored interventions
Australian and New Zealand Standard Research Classifications (ANZSRC)
ANZSRC code: 111503, Clinical Pharmacy and Pharmacy Practice, 100%
Fields of Research (FoR) Classification
FoR code: 1115, Pharmacology and Pharmaceutical Sciences, 100%

x
Table of Contents
Abstract ............................................................................................................................ ii
Declaration by author ....................................................................................................... v
Publications during candidature ....................................................................................... vi
Publications included in this thesis ................................................................................. vii
Contributions by others to the thesis .............................................................................. vii
Statements of parts of the thesis submitted to qualify for the award of another degree . vii
Acknowledgments ......................................................................................................... viii
Keywords ..................................................................................................................... ix
Australian and New Zealand Standard Research Classifications (ANZSRC) .................. ix
Fields of Research (FoR) Classification .......................................................................... ix
List of Tables .................................................................................................................. xv
List of Figures ................................................................................................................ xvi
List of Abbreviations ..................................................................................................... xviii
CHAPTER ONE: LITERATURE REVIEW ............................................................................ 1
1.1 Introduction ................................................................................................................. 1
1.2 Terms and Concepts Used to Describe Adherence .................................................... 1
1.2.1 Primary and Secondary Non-Adherence .............................................................. 4
1.2.2 New Taxonomy .................................................................................................... 4
1.2.3 Dynamic Nature of Adherence ............................................................................. 5
1.2.4 Unintentional and Intentional Non-Adherence ...................................................... 7
1.3 Epidemiology of Medication Non-Adherence .............................................................. 7
1.3.1 Prevalence ........................................................................................................... 8
1.3.2 Clinical Outcomes ................................................................................................ 8
1.3.3 Increased Health Care Expenditure ................................................................... 10
1.4 Barriers to and Determinants of Medication Adherence ........................................... 10
1.5 Measuring Medication Adherence ............................................................................ 16
1.5.1 Objective Measures ............................................................................................ 16

xi
1.5.2 Subjective Measures .......................................................................................... 19
1.5.3 Self-Report Adherence Scales ........................................................................... 20
1.6 Interventions to Improve Adherence ......................................................................... 24
1.6.1 Introduction......................................................................................................... 24
1.6.2 Examples of Interventions Focusing on a Single Aspect of Adherence .............. 26
1.7 Summary .................................................................................................................. 30
CHAPTER TWO: SYSTEMATIC REVIEW OF VALIDATED SELF-REPORT MEDICATION
ADHERENCE SCALES (PUBLISHED).............................................................................. 33
2.1 Introduction ............................................................................................................... 33
2.2 Published Paper ....................................................................................................... 33
2.2.1 Abstract .............................................................................................................. 33
2.2.2 Introduction......................................................................................................... 34
2.2.3 Methods ............................................................................................................. 36
2.2.4 Results ............................................................................................................... 37
2.2.5 Discussion .......................................................................................................... 62
2.2.6 Conclusions ........................................................................................................ 65
2.3 Additional Notes ....................................................................................................... 66
2.4 Summary .................................................................................................................. 66
CHAPTER THREE: METHODS OF RANDOMISED CONTROLLED TRIAL TO IMPROVE
MEDICATION ADHERENCE ............................................................................................. 67
3.1 Introduction ............................................................................................................... 67
3.2 Aims and Hypotheses ............................................................................................... 68
3.3 Methods .................................................................................................................... 69
3.3.1 Setting ................................................................................................................ 69
3.3.2 Inclusion Criteria ................................................................................................. 70
3.3.3 Participant Interviews ......................................................................................... 70
3.3.4 Intervention......................................................................................................... 79
3.3.5 Outcome Measures ............................................................................................ 81

xii
3.3.6 Sample Size ....................................................................................................... 81
3.3.7 Statistical Analyses ............................................................................................ 82
3.4 Summary .................................................................................................................. 82
CHAPTER FOUR: RESULTS 1 - A RANDOMISED CONTROLLED TRIAL OF A
TARGETED AND TAILORED INTERVENTION TO IMPROVE MEDICATION
ADHERENCE .................................................................................................................... 83
4.1 Introduction ............................................................................................................... 83
4.2 Results...................................................................................................................... 83
4.2.1 Participant Baseline Demographics .................................................................... 86
4.2.2 Intervention......................................................................................................... 88
4.2.3 Adherence .......................................................................................................... 88
4.2.4 Changes in mean BMQ-S scores between the three groups over time .............. 91
4.2.5 Changes in mean BIPQ scores between the three groups over time ................. 92
4.3 Conclusions .............................................................................................................. 94
CHAPTER FIVE: RESULTS 2 - TAILORING OF THE INTERVENTIONS TO THE
PARTICIPANT-SPECIFIC REASONS FOR NON-ADHERENCE ...................................... 95
5.1 Introduction ............................................................................................................... 95
5.2 Participant Baseline Interview ................................................................................... 96
5.3 Intervention ............................................................................................................... 96
5.3.1 Overview of Strategies Implemented .................................................................. 96
5.3.2 Overview of Radar Charts of the Responses to the Scales for each Tailored
Strategy and Case Examples ...................................................................................... 97
5.3.3 Reminder System ............................................................................................... 99
5.3.4 Cognitive-Educational Strategy ........................................................................ 104
5.3.5 Reminder and Cognitive-Educational Strategy ................................................. 109
5.3.6 Behavioural-Counselling Strategy .................................................................... 113
5.3.7 Social Support Strategy .................................................................................... 117
5.4 Flow Diagram of Tailoring Adherence Intervention (Post-Implementation) ............. 119
5.5 Conclusions ............................................................................................................ 122

xiii
CHAPTER SIX: RESULTS 3 - CHANGES IN ADHERENCE OVER SIX MONTHS ........ 123
6.1 Introduction ............................................................................................................. 123
6.2 Differences between the Adherent, Intervention and Control Groups ..................... 123
6.2.1 Adherence over time ........................................................................................ 124
6.2.2 BMQ-S Necessity over time ............................................................................. 125
6.2.3 BMQ-S Concerns over time.............................................................................. 126
6.2.4 BIPQ Treatment Control over time ................................................................... 127
6.2.5 BIPQ Treatment Coherence over time ............................................................. 128
6.3 Changes in each of the Tailored Strategy Groups .................................................. 129
6.3.1 Reminder Strategy Group (n=27) ..................................................................... 129
6.3.2 Cognitive-Educational Strategy Group (n=9) .................................................... 133
6.3.3 Reminder and Cognitive-Educational Strategy Group (n=15) .......................... 137
6.3.4 Behavioural-Counselling Strategy Group (n=4) ................................................ 140
6.3.5 Social Support Strategy Group (n=5) ............................................................... 144
6.3.6 Overall View of the Changes in Adherence Scale Scores over time for each
Tailored Strategy ....................................................................................................... 147
6.4 Discussion .............................................................................................................. 150
6.5 Conclusions ............................................................................................................ 151
CHAPTER SEVEN: DISCUSSION .................................................................................. 153
7.1 Introduction ............................................................................................................. 153
7.2 Validated Adherence Scales................................................................................... 153
7.3 Targeted and Tailored Intervention ......................................................................... 154
7.4 Changes in Adherence, Beliefs about Medicines and Illness Perceptions over Time
..................................................................................................................................... 155
7.5 Limitations of the Study .......................................................................................... 156
7.6 Future Directions and Conclusion ........................................................................... 158
REFERENCES ................................................................................................................ 159
APPENDIX A: Ethics Approval Letter .............................................................................. 186

xiv
APPENDIX B: Participant Information Sheet ................................................................... 187
APPENDIX C: Participant Consent Form ......................................................................... 189
APPENDIX D: Participant Survey .................................................................................... 190
APPENDIX E: Mean MAQ Scores Over Time ................................................................. 193
APPENDIX F: Mean BMQ-S Necessity and Concerns Scores Over Time ...................... 194
APPENDIX G: Illness Perceptions Over Time ................................................................. 195

xv
List of Tables
Table 1.1 The studies which show significant association or no association between a
number of different factors and medication adherence ...................................................... 14
Table 1.2 Advantages and disadvantages of objective measures of adherence ............... 18
Table 1.3 Validated adherence scales ............................................................................... 21
Table 2.1 Excluded self-report adherence scales .............................................................. 39
Table 2.2 Comparing the self-report adherence scales ..................................................... 40
Table 2.3 Self-report adherence scales - administration, response and validation ............ 49
Table 3.1 The Medication Adherence Questionnaire (MAQ) ............................................. 74
Table 3.2 The Beliefs about Medicines Questionnaire - Specific (BMQ-S) ........................ 76
Table 3.3 The Brief Illness Perception Questionnaire ........................................................ 78
Table 4.1 Baseline participant demographics .................................................................... 87
Table 4.2 Types of tailored strategies implemented to improve medication adherence ..... 88
Table 4.3 Mean BMQ-S necessity scores and concerns score at baseline, three months and
six months between the groups ......................................................................................... 92
Table 4.4 Mean scores of BIPQ at baseline, three months and six months, between groups
........................................................................................................................................... 93
Table 5.1 Individual scores to validated scales at baseline (Participant 47) .................... 100
Table 5.2 Individual scores to validated scales at baseline (Participant 49) .................... 101
Table 5.3 Individual scores to validated scales at baseline (Participant 25) .................... 102
Table 5.4 Individual scores to validated scales at baseline (Participant 5) ...................... 105
Table 5.5 Individual scores to validated scales at baseline (Participant 16) .................... 106
Table 5.6 Individual scores to validated scales at baseline (Participant 31) .................... 110
Table 5.7 Individual scores to validated scales at baseline (Participant 41) .................... 111
Table 5.8 Individual scores to validated scales at baseline (Participant 7) ...................... 114
Table 5.9 Individual scores to validated scales at baseline (Participant 54) .................... 115
Table 5.10 Individual scores to validated scales at baseline (Participant 80) .................. 118
Table 6.1 Change in mean MAQ, BMQ-S, and BIPQ treatment and coherence scores over
time in the REMINDER strategy group ............................................................................ 130
Table 6.2 Change in mean MAQ, BMQ-S, and BIPQ treatment and coherence scores over
time in the COGNITIVE-EDUCATIONAL strategy group ................................................. 133
Table 6.3 Change in mean MAQ, BMQ-S, and BIPQ treatment and coherence scores over
time in the REMINDER & COGNITIVE-EDUCATIONAL strategy group .......................... 137

xvi
Table 6.4 Change in mean MAQ, BMQ-S, and BIPQ treatment and coherence scores over
time in the BEHAVIOURAL-COUNSELLING strategy group ........................................... 141
Table 6.5 Change in mean MAQ, BMQ-S, and BIPQ treatment and coherence scores over
time in the SOCIAL SUPPORT strategy group ................................................................ 144
List of Figures
Figure 1.1 The shared decision-making model .................................................................... 3
Figure 1.2 The six-phase dynamic adherence model: the continuum of adherence decisions
............................................................................................................................................. 6
Figure 1.3 Adherence scales originate from a number of different sources (Original source
unspecified: Barroso, Bell, Fodor, Grymonpre and VAS Scale) ......................................... 23
Figure 2.1 Flow chart of study selection process ............................................................... 38
Figure 2.2 Disease populations used to validate self-report adherence scales ................. 58
Figure 2.3 Comparison measures of medication-taking behaviour used to validate the self-
report adherence scales .................................................................................................... 60
Figure 3.1 Participant flow diagram: from identifying participants’ medication-taking
behaviour to final follow-up ................................................................................................ 72
Figure 4.1 Participant flow diagram ................................................................................... 85
Figure 4.2 Mean MAQ scores at baseline, 3-month and 6-month follow-ups, based on
intention to treat analysis ................................................................................................... 90
Figure 5.1 Radar Chart template ....................................................................................... 98
Figure 5.2 Radar chart of questionnaire responses of REMINDER group at baseline ....... 99
Figure 5.3 Radar chart of questionnaire responses of the COGNITIVE-EDUCATIONAL
strategy group at baseline ................................................................................................ 104
Figure 5.4 Radar chart of questionnaire responses of the REMINDER & COGNITIVE-
EDUCATIONAL strategy group at baseline ..................................................................... 109
Figure 5.5 Radar chart of questionnaire responses of the BEHAVIOURAL-COUNSELLING
strategy group at baseline ................................................................................................ 113
Figure 5.6 Radar chart of questionnaire responses of the SOCIAL SUPPORT strategy group
at baseline ....................................................................................................................... 117
Figure 5.7 Flow diagram of outcomes of the adherence scales used to inform the discussion
with the participant and implementation of the tailored strategy ...................................... 121

xvii
Figure 6.1 Changes in mean MAQ scores (± 95% confidence intervals) in the adherent,
intervention and control groups over time ........................................................................ 124
Figure 6.2 Changes in mean BMQ-S necessity scores (± 95% confidence intervals) in the
adherent, intervention and control groups over time ........................................................ 125
Figure 6.3 Changes in mean BMQ-S concerns scores (± 95% confidence intervals) in the
adherent, intervention and control groups over time ........................................................ 126
Figure 6.4 Changes in mean BIPQ treatment control scores (± 95% confidence intervals) in
the adherent, intervention and control groups over time .................................................. 127
Figure 6.5 Changes in mean BIPQ treatment coherence scores (± 95% confidence intervals)
in the adherent, intervention and control groups over time .............................................. 128
Figure 6.6 Radar charts at baseline, 3 months and 6 months for the REMINDER strategy
group................................................................................................................................ 132
Figure 6.7 Radar charts at baseline, 3 months and 6 months for the COGNITIVE-
EDUCATIONAL strategy group ....................................................................................... 136
Figure 6.8 Radar charts at baseline, 3 months and 6 months for the REMINDER AND
COGNITIVE-EDUCATIONAL strategy group ................................................................... 140
Figure 6.9 Radar charts at baseline, 3 months and 6 months for the BEHAVIOURAL-
COUNSELLING strategy group ....................................................................................... 143
Figure 6.10 Radar charts at baseline, 3 months and 6 months for the SOCIAL SUPPORT
strategy group .................................................................................................................. 146
Figure 6.11 Change in Questionnaire Scores at three months for each Strategy Type in the
Intervention Group ........................................................................................................... 148
Figure 6.12 Change in Questionnaire Scores at six months for each Strategy Type in the
Intervention Group ........................................................................................................... 149

xviii
List of Abbreviations
AAI Adherence Attitude Inventory
ACE-I Angiotensin Converting Enzyme Inhibitor
ARMS Adherence to Refills and Medications Scale
ASK-12 Adherence Starts with Knowledge-12
ASK-20 Adherence Starts with Knowledge-20
ASRQ Adherence Self-Report Questionnaire
BARS Brief Adherence Rating Scale
BBQ Beliefs and Behaviour Questionnaire
BEMIB Brief Evaluation of Medication Influences and Belief
BIPQ Brief Illness Perception Questionnaire
BJCP British Journal of Clinical Pharmacology
BMAS Brief Evaluation of Medication Influences and Belief
BMQ Beliefs about Medicines Questionnaire
BMQ-S Beliefs about Medicines Questionnaire - Specific
CASE Centre for Adherence Support Evaluation Adherence Index
CQR Compliance Questionnaire Rheumatology
DAI Drug Attitude Inventory
GP General Practitioner
HIV Human Immunodeficiency Virus
IPQ Illness Perception Questionnaire
ITAS Immunosuppressant Therapy Adherence Scale
MAAT Medication Adherence Assessment Tool
MAQ Medication Adherence Questionnaire
MARS Medication Adherence Rating Scale
MARS-5 Medication Adherence Rating Scale – 5
MASES Medication Adherence Self-Efficacy Scale
MASES-R Medication Adherence Self-Efficacy Scale – Revised
MEMS Medication Events Monitoring System
MGMM Measurement-Guided Medication Management
MMAS Morisky Medication Adherence Rating Scale
MPR Medication Possession Ratio
MR Modified-Release
MUAH Maastricht Utrecht Adherence in Hypertension Questionnaire

xix
OS-MMAS Osteoporosis-Specific Morisky Medication Adherence Scale
PBS Pharmaceutical Benefits Scheme
PIAQ Paediatric Inhaler Adherence Questionnaire
RAM Reported Adherence to Medication Scale
SEAMS Self-Efficacy for Appropriate Medication Use Scale
SEIFA Socio-Economic Index for Areas
SERAD Self-Reported Adherence Questionnaire
SMAQ Simplified Medication Adherence Questionnaire
SOCA Stages of Change for Adherence Measure
VAS Adherence Visual Analogue Scale
WHO World Health Organisation
1
CHAPTER ONE: LITERATURE REVIEW
1.1 Introduction
Medication non-adherence has been identified as one of the greatest areas of opportunity
to improve health outcomes and reduce health expenditure.1-3 Poor adherence to medicines
affects approximately 50% of patients taking chronic medicines,1,4-10 leading to adverse
health outcomes.11,12
Interventions have been employed to improve adherence to medications. These include:
reminder interventions (e.g. telephone reminders), educational interventions (e.g.
informational pamphlets), behavioural interventions (e.g. motivational interviewing) and
social support (e.g. peer support therapy).13-15 Adherence interventions have not always
been successful at improving medication adherence in clinical trials.13,15 This reflects the
complex nature of adherence.
Supporting a patient’s adherence to their medicines requires insight into their medication-
taking behaviour and the reasons for their behaviour. An intervention that targets non-
adherent patients and tailored to the patient-specific reasons for non-adherence that is
practical to translate into clinical practice is required. Adherence scales are easy to
administer, inexpensive and can explore both adherence and reasons for non-adherence.
This thesis explores an intervention that is targeted to non-adherent participants and tailored
to their specific reasons for non-adherence, informed by validated self-report adherence
scales.
This chapter outlines the issues associated with medication non-adherence, the measures
of adherence, the barriers to and determinants of adherence and the current interventions
implemented to improve adherence.
1.2 Terms and Concepts Used to Describe Adherence
The benefits of effective medicine use depend on a patient taking their medication.
Historically, this was referred to as “compliance.” Compliance is the degree to which the
patient follows the treatment instructions given by the health provider. This suggests that

2
the health provider knows what is best for the patient and would prescribe the ideal treatment.
It implies that patients play a passive role in their medical management and that deviating
from these instructions would put the blame on the patient.16-19 With healthcare adopting a
more patient-focussed approach, the terms to describe medication-taking behaviour have
evolved over time from “compliance” to “adherence." The shift from “compliance” to
“adherence” represents a desire to emphasise the patient’s active role in decision-
making.1,20
The World Health Organisation (WHO) defines adherence as:
“The extent to which a person’s behaviour – taking medication, following a diet, and/or
executing lifestyle changes, corresponds with agreed recommendations from a
health care provider.”1
The definition of “adherence” acknowledges the importance of the shared agreement
between the patient and the health care provider. Shared decision-making, which may be
implicit, involves the patient in the treatment decision process. It explores the ideas, fears
and expectations of the patient, with both the patient and health provider coming to a final
agreement on the treatment decision (Figure 1.1).21,22 By acknowledging shared decision-
making, the definition of adherence incorporates patient-provider collaboration focusing on
patient autonomy and patient-centred care. Therefore, the term “adherence” is preferred
over “compliance.”1,20 There are a few methods to explore whether shared decision-making
occurs, including tape recording medical consultations and computerised shared decision
support tools.22-24 Although shared decision-making is central to adherence, it is not how
adherence is typically operationalised.
Another term that is often used in adherence research is concordance. “Concordance” refers
to the agreement between the patient and physician about the therapeutic regimen. This
term implies active patient participation in the discussion and decisions about the treatment
plan.25
Given the difficulties of exploring shared decision-making, most research operationalises
adherence in terms of medication-taking behaviour. Medication-taking behaviour is
assessed by measuring the number of medicine doses taken, dose frequency and dose
administration according to the instructions on the dispensing label.20 Good medication-
taking behaviour in patients with high cardiovascular risk, such as in ischaemic heart disease,

3
has been shown to improve cardiovascular event-free survival.12,26,27 Furthermore, poor
medication-taking behaviour with antibiotics can lead to an increased likelihood of
developing bacterial resistance to antimicrobial agents.28-30 Measuring medication-taking
behaviour is important and hence why many studies on adherence have focused on this.
Figure 1.1 The shared decision-making model 31
Information
exchange
Deliberation about
preferences, beliefs,
and goals for care
Improved clinical outcomes
- Provider treatment
behaviour is adherent to
best practices of care
- Medical decisions are
concordant with patient-
physician shared plan of
treatment
- Appropriate patient self-
management
Patient-clinician
concordance
Shared treatment
plan

4
Medication adherence and non-adherence can be further described in a number of different
ways.18,19,32,33 Adherence to medications has been described in terms of primary and
secondary non-adherence, the dynamic nature of adherence and unintentional and
intentional non-adherence.
1.2.1 Primary and Secondary Non-Adherence
Patients who are non-adherent can exhibit primary or secondary non-adherence.18 Primary
non-adherence refers to when an initial prescription is not dispensed or when dispensed but
the medication never taken. Less research has been conducted on primary non-adherence;
however, there is an emerging interest in this area.34-36 Most adherence research has
studied secondary non-adherence: when prescriptions are filled, but the patient later
discontinues taking the medicine.37
These terms of describing medication non-adherence do not take into consideration the
complexity and dynamic nature of medication-taking behaviour. Section 1.2.2 and 1.2.3
introduces newer concepts in describing adherence.
1.2.2 New Taxonomy
Vrijens et al. developed a new taxonomy for medication adherence and defines adherence
in terms of medication-taking behaviour. This adherence taxonomy separates adherence
into three different phases: initiation, implementation and discontinuation. Initiation refers to
when the patient takes the first dose of a prescribed medication. Discontinuation occurs
when the prescribed medication is ceased. The extent that the patient’s actual dosing
regimen corresponds with the prescribed dose from initiation of treatment to the
discontinuation of treatment is termed implementation.38 A patient may be described as non-
adherent when they: do not initiate a prescription, delay initiating a prescription, implement
the regimen poorly or discontinue the prescription early.
This taxonomy is relatively new and is not yet well-established in the literature; however
presents as a significant opportunity for improving the consistency of describing medication-
taking behaviour. The taxonomy is relatively simple; however, identifies adherence solely
based on medication-taking behaviour. To strengthen the conceptualisation of adherence,

5
explicit recognition of the shared decision between the patient and healthcare professional
is required. Furthermore, methods to clearly identify initiation, implementation and
discontinuation of treatment would reinforce this taxonomy.
1.2.3 Dynamic Nature of Adherence
Most studies measuring adherence have been conducted using a cross-sectional study
design. Adherence has generally been dichotomously categorised: patients are adherent or
non-adherent at a single point in time. Though simple, describing adherence in this way has
a number of problems. Classifying patients as non-adherent does not distinguish between
different patient behaviours, such as not filling the prescription, reducing the dose, taking
medication sporadically or prematurely discontinuing the medication.39 Further,
dichotomously categorising adherence at a single time point implies that adherence is static,
when in fact it can change depending on a patient’s circumstances, information and
beliefs.40-44 Gearing et al. conceptualises adherence into six dynamic stages (Figure 1.2).19

6
Figure 1.2 The six-phase dynamic adherence model: the continuum of adherence decisions 19
The initial phase, treatment initiation, occurs when the patient is prescribed a medication
and either decides to accept or decline the treatment. If the patient is non-adherent in this
phase, it is known as primary non-adherence, as discussed in Section 1.2.1. In the second
phase, treatment trial, the patient has the prescription dispensed and takes the medicine;
however, the medication is discontinued before the next prescription refill. The partial
treatment acceptance phase refers to when patients fill the initial prescription, begins and
continues partial treatment (adjusted dosage or dose frequency) for an extended time period.
In the intermittent treatment adoption phase the patient accepts the full treatment as agreed
but discontinues after months of adherence and subsequently returns to partial or
intermittent adherence. The premature discontinuation following treatment adoption phase
refers to patients who are fully adherent and then prematurely discontinue treatment. The
last phase is when patients are fully adherent to treatment.19

7
Adherence is not static and is influenced by many different factors, which can change over
time. These six distinct phases represent decision points and incorporates patients’ varying
degrees of intent to take their medication as agreed. This dynamic system of adherence
also acknowledges the movement of patients between phases.19
1.2.4 Unintentional and Intentional Non-Adherence
Non-adherence can be described as unintentional or intentional or a mix of both.18,32,33,45-48
Unintentional non-adherence is characterised as poor medication-taking behaviour due to
circumstances beyond the patient’s control.32 Reasons why patients may be unintentionally
non-adherent include forgetfulness, carelessness, cognitive impairment and socioeconomic
issues.18,49,50 Intentional non-adherence arises when a patient makes a conscious decision
not to take the prescribed medication.48,50 It is important to distinguish between these types
of medication non-adherence to better implement appropriate interventions. For example,
patients identified as intentionally non-adherent are unlikely to benefit from the
implementation of dose administration aids, but may benefit from behavioural-counselling
interventions, such as motivational interviewing.32
1.3 Epidemiology of Medication Non-Adherence
Non-adherence to medications is highly prevalent, with approximately 50% of patients
consistently identified as non-adherent in studies focussing on chronic disease.4-8,51-58
Medication non-adherence can lead to adverse health outcomes, increased hospitalisations
and health care costs.3,12,18,55,59 The adverse impact of medication non-adherence grows as
the burden of chronic diseases increases.1
This section discusses the prevalence of non-adherence, and the clinical outcomes,
hospitalisations and health care expenditure associated with medication non-adherence.

8
1.3.1 Prevalence
The proportion of patients identified as non-adherent, commonly defined as taking less than
80% of their medicine, is similar across different disease states.5,53,60-63 This 80% cut-off has
been correlated with significantly improved clinical measures, such as blood pressure.18,64
Non-adherence rates to medicines are typically higher among patients with chronic
conditions in comparison with those suffering from acute illnesses.65,66 A study using a
prescription claims database showed that non-adherence to statins was present in 60% of
patients suffering from acute coronary syndromes, 64% with coronary artery disease and
75% for primary prevention of cardiovascular disease.65 Self-report adherence scales
identified 54% of patients with schizophrenia, 38% of patients with hypertension, 26% of
patients with diabetes, as non-adherent to their medication.5,53
There is a tendency for medication adherence in chronic illnesses to decline over time.7,8,56
Non-adherence to recently initiated statins increased between one-month and twelve
months in: hypertension (18% versus 47.9%), heart failure (16.3% versus 50%) and
coronary heart disease (28.2% versus 38.3%) populations.7 Alendronate non-adherence in
patients with osteoporosis increased, particularly during the first six to twelve months after
the initial prescription.8 Non-adherence to antiretroviral therapy in HIV increased from 48%
at one-month after initiating the therapy to 61% non-adherence at the six-month follow-up.60
This increasing trend in non-adherence suggests the need to measure adherence at
different time points. It has been suggested that important factors are involved during the
process of obtaining the initial prescription and treatment continuation.7 Patient
circumstances, information and beliefs may change over time.42 Therefore reasons for non-
adherence and interventions should be reassessed at different time points to maintain good
medication-taking behaviour. Changes in adherence over time support the dynamic model
of adherence, as described in Section 1.2.3.
1.3.2 Clinical Outcomes
Non-adherence to medications can lead to adverse health outcomes and an increase in
hospitalisation rates across various disease populations. Most of the literature has focused
on adverse outcomes associated with non-adherence in cardiovascular disease, diabetes,
schizophrenia and HIV.

9
Non-adherent patients with cardiovascular disease are more likely to have adverse health
outcomes in comparison with adherent patients.12,67,68 Medication non-adherence
contributes to poor blood pressure control, which can lead to further cardiovascular
complications including coronary heart disease and heart failure.69 Hospitalisation rates
were significantly higher in patients with poor medication adherence suffering from diabetes,
hypercholesterolaemia, hypertension and congestive heart failure.3,70 Gehi et al. determined
that medication non-adherence was associated with a greater than two-fold increase in the
rate of cardiovascular events in patients with stable coronary artery disease.12 Patients with
heart failure who were non-adherent to digoxin had a significant increase in the number and
duration of hospitalisations in comparison with adherent patients.70 Poor prescription refill
adherence (less than 40%) was significantly associated with a three-fold increase in the
incidence of hospitalisation due to heart failure compared with good prescription refill
adherence (at least 80%).71
Medication non-adherence in diabetes has been associated with poorer health outcomes
and an increase in hospitalisations.72,73 Non-adherence has been significantly associated
with a higher glycosylated haemoglobin level (HbA1c), reflecting poor management of
diabetes. A high HbA1c (greater than 7%) can increase the risk of developing cardiovascular
diseases, ocular problems and neurological complications.74,75
Non-adherence to antipsychotics can lead to symptom relapse, worse prognosis and
increased risk of hospitalisations.76-78 Patients with schizophrenia who did not fill their
antipsychotic prescription within the first week after hospital discharge had a higher risk of
early rehospitalisation.79,80 Poor adherence in schizophrenia has also been associated with
greater use of emergency psychiatric services, poorer mental functioning and violence. Non-
adherence has also been significantly associated with poorer life satisfaction, more alcohol-
related problems and more arrests.81
In order to suppress viral replication and reduce the risk of viral resistance in HIV, patients
should have good medication adherence.60,82,83 Non-adherence to HIV treatments has been
shown to cause treatment failure, clinical deterioration and development of viral resistance,
which leads to the increase risk of transmission of resistant virus.83,84

10
1.3.3 Increased Health Care Expenditure
Non-adherence to medications can lead to worsening of health outcomes and increased
hospitalisations, which results in an increase in health care costs. The costs of medication
non-adherence are largely derived from exacerbations of illnesses that require emergency
medical attention and hospitalisations.71 A reduction in medical costs offsets the cost of
medications and can thus lead to an overall reduction in health care costs.3 A government
report suggests that medication non-adherence costs the Australian health system
approximately $660 million annually, in terms of preventable hospital admissions.85 In the
United States, the annual burden of medication non-adherence has been estimated to be
$100 billion.20,86 More specifically, non-adherence to diabetes medication has been
estimated to cost the United States health system $5 billion per year. Medication non-
adherence plays a significant role in the financial burden upon health care systems.
Therefore, improving medication adherence should be a key goal for health care systems
and policy makers.1,73
1.4 Barriers to and Determinants of Medication Adherence
A number of factors can affect medication adherence. The WHO has divided the factors that
can affect medication adherence into five dimensions: social and economic, health system
and health care team, condition-related, therapy-related and patient-related factors.1
Although there has been extensive research into the barriers to and determinants of
medication adherence, more than half of the studied factors have not been consistently
associated with adherence (Table 1.1).18 Most of the studies below have defined adherence
as taking 80% of the medication; for example, in regards to dose counts, taking at least 80%
of your medicine would be defined as adherent. Some patients may have good reasons for
non-adherence. Determining the barriers to and determinants of medication adherence may
aid the implementation of tailored interventions to improve medication adherence.1,39
Sociodemographic and economic factors
Sociodemographic and economic factors such as age, sex, race, socioeconomic status and
education level have some association with medication adherence.4,8,54,57,87-91 Race has
been shown to have some impact on adherence, which can be explained by varying cultural,

11
health and medicinal beliefs.92 Studies showing a significant relationship between age and
adherence, have found that older patients were likely to be more adherent than younger
patients.8,50,57,87,93-95 However, the risk of cognitive and functional impairment increases with
age which can increase the likelihood of non-adherence in the elderly.96 Younger patients
may decide not to adhere to the treatment or may forget due to competing priorities in life.97
Health system and health care team factors
Less research has been conducted on the effects of health system and health care team
factors on medication adherence.1 Modifying cost at a health system level can improve
adherence to medications.98 Poor communication from health care professionals, shorter
patient-provider consultations and poorly developed health services can negatively impact
medication adherence.99-101 It has been shown that non-adherent patients were significantly
less likely to have established a close therapeutic alliance (the relationship between a
patient and health professionals) during hospitalisation, see Table 1.1.77
Health condition-related factors
Condition-related factors such as duration of the disease and co-morbidities can affect
medication adherence. In particular, severity of symptoms, cognitive impairment and
substance abuse have been shown to have a negative impact on medication
adherence.87,93,96,102-104 Many studies have found that patients with predominantly
asymptomatic conditions, such as hypertension are less adherent.105 Co-morbidities that
can impact adherence include depression and substance abuse.58,77,89,93,106
Therapy-related factors
Therapy-related factors, such as the complexity of the medication regimen, duration of
therapy, route of administration and side effects have been noted to affect
adherence.88,90,94,107-109 The greater the number of medications and higher dose frequencies
have been consistently associated with non-adherence.110,111 Patients with chronic
obstructive pulmonary disease (COPD) on once-daily dosing regimens had significantly
higher adherence than those on multiple daily dosing regimens.108 Another factor that can
impact adherence is the cost of the therapy. The greater the cost of the medication, the less
likely that patients will be adherent to the medication. The impact of cost is mitigated by the
patients beliefs towards how necessary their medicine is to them. If patients perceive their
medicine to be unnecessary, the cost of the medicine would theoretically not impact on their

12
decision to take their medicine. Patients will not pay for a medicine no matter how much it
costs if the patients believe the medicine is unnecessary.35,112,113
Patient-related factors
Patient-related factors include a patient’s tendency to forget to take their medications,
knowledge, attitude, beliefs and perceptions of their illness and medicines. Forgetting to take
medication is a common reason that has been consistently associated with non-
adherence.46,67,105,114-116
Patient medication beliefs and how these beliefs affect medication adherence have also
been extensively studied.4,41,42,44,88,89,117-122 One of the most commonly used adherence
scales, the Beliefs about Medicines Questionnaire-Specific (BMQ-S), elicits beliefs about
the necessity of medicines and concerns about medicines.4,49,87-89,118,123,124 These beliefs
have been shown to reflect a patient’s perceptions of illness and adherence.95,125,126
Generally, patients that believe their medicines are necessary and have minimal concerns
about their medicines have better medication adherence.95,120,126-131
Patient’s perceptions and understanding of their illness and treatment have been shown to
be associated with medication adherence.40,95,125-127,132-135 There are a number of different
scales used to assess health perceptions including the Health Perception Questionnaire
(HPQ), Illness Perception Questionnaire (IPQ), Illness Perception Questionnaire – Revised
(IPQ-R) and Brief Illness Perception Questionnaire (BIPQ).136-139 The IPQ was developed
based on the Self-Regulatory Theory to assess the cognitive representations of illness:
identity (symptoms perceived associated with illness), cause (patient ideas about aetiology),
timeline (perceived illness duration), consequences (expected effects and outcomes) and
cure control (how patient controls/recovers from illness).137 IPQ-R and BIPQ are shorter
forms of the IPQ and have been used extensively in the literature. Using the IPQ, it was
found that perceptions of poor personal ability to control illness, greater perceived effect of
illness on life and lower emotional response was significantly associated with better
medication adherence in patients with hypertension.95 In a chronic pain population,
perceptions of illness as chronic and uncontrollable, measured using the IPQ-R, were
associated with less concerns about their medicines and greater adherence. Patients in this
chronic pain population who perceived serious illness consequences had stronger beliefs
that medicines are necessary and were more adherent. Patients were less adherent to their
medication when they have a greater emotional response to their illness.125 Patients with
high blood pressure who were more likely to be adherent, had greater perceived personal

13
ability to control blood pressure, exhibited greater concerns about their illness and had less
emotional burden, based on the BIPQ.135
Past medication adherence has been shown to predict adherence.77,140 For example, the
best single predictor of future adherence in patients with schizophrenia was found to be non-
adherence in the prior six months.140 Furthermore, past prescription-refill behaviour was a
significant predictor of adherence to statins.141
Table 1.1 shows factors that have been studied in association with medication adherence.
There are factors which are consistently associated with non-adherence (e.g. forgetfulness,
beliefs about medicines) and factors where the association appear less clear (e.g.
socioeconomic status). Studies differ in the diseases included, methods used to measure
adherence, how adherence is defined and sample size.1,109 This may explain some of the
inconsistency in the association of factors with medication adherence.
Review articles exploring various barriers to and determinants of adherence, have
suggested the need to address a full range of influencing factors to improve adherence.68,142
Many studies have globally implemented interventions without identifying why the patient is
non-adherent. We need to better understand the patient-specific reasons for non-adherence
to better implement tailored interventions to improve adherence.68,143,144

14
Table 1.1 The studies which show significant association or no association between a number of different factors and medication adherence
Factor Significant Association No Association
Sociodemographic Factors
Socioeconomic status Akincigil57, Barclay87, Devold8,
Maqutu91
Gatti89, George100,
Khanderia103, Kleeberger90,
Laba94, Maqutu91
Employment status Ediger145 Fawzi88, Gatti89, Kim146
Education level Burra115, Ross95, Ruppar107s Devold8, Fawzi88, Gatti89,
Jacobs96, Khanderia103, Kim146,
Kleeberger90, Laba94, Mo147
Literacy - Gatti89
Age Atkins50, Barclay87,
Broekmans54, Cohn93, Devold8,
Ediger145, Gatti89, Jessop132,
Khanderia103, Krousel-Wood68,
Laba94, Mo147, Ross95
Bhattacharya148, Jacobs96,
Kim146, Kleeberger90, Raebel92,
Ruppar107, Shah
Sex Jessop132, Maqutu91, Ross95 Bhattacharya148, Fawzi88,
Gatti89, Jacobs96,
Khanderia103, Kim146, Krousel-
Wood68, Laba94, Mo147,
Raebel92, Shah35
Race Kleeberger90, Krousel-Wood68,
Raebel92
Gatti89, Khanderia103
Marital status Devold8, Sajatovic114 Fawzi88, Khanderia103, Kim146,
Mo147
Social support network Dean116, Fraser99, Frain149
Private health insurance Raebel92 Akincigil, Khanderia103,
Kleeberger90, Laba
Health literacy level - Gatti89
Number of people in household Gatti89 Khanderia103, Kim146, Laba
Healthcare Team and System
Factors
Patient-provider relationship Fraser99, George100 Frain149
Provider knowledge George100 -
Follow-ups - Akincigil57, Kim146, Raebel92
Condition-Related Factors
Severity of disease/symptoms Khanderia103, Phillips102 Frain149, Jacobs96, Mo147,
Level of disability - Fraser99, Mo147
Co-morbidities Raebel92 Akincigil57, Barclay87, Jacobs96,
Kim146, Shah35
Duration of condition Mo147 Jacobs96
Cognitive impairment Barclay87, George100 , Jacobs96 -
Psychiatric disorders Dean116, Gatti89, Manning106,
Sajatovic114
Akincigil57, Bartlett150,
Jacobs96, Raebel92,
Anxiety Sundbom104 Jacobs96
Substance abuse Akincigil57, Barclay87, Cohn93,
Mazer151, Raebel92, Sajatovic114
Cohn93, Kleeberger90

15
Factor (cont.) Significant Association
(cont.)
No Association (cont.)
Therapy-Related Factors
Complexity of medical regimen
(Number and Frequency)
Akincigil57, Dean116, Devold8,
Llor110, Kleeberger90,
Laliberte111, Raebel92,
Ruppar107, Toy108
Gatti89, Jacobs96, Kim146,
Phillips102, Ross95, Ruppar107
Duration of treatment Mo147 Bhattacharya148, Burra115,
Kim146, Kleeberger90
Previous treatment failures - Bhattacharya148
Use of CAMs Dean116 -
Dosage form Brnabic152 -
Cost Castaldi112, Shah35 Fawzi88, Frain149, Raebel92
History of medication-taking Laba94 -
Access to medications - Khanderia103
Side effects Fawzi88, Laba94 George100, Kim146
Patient-Related Factors
Knowledge, Attitudes, Expectations George100 George (Expectations)100,
Kim146
Forgetfulness Addison67, Burra115, Dean116,
Gadkari46, McHorney105,
Sajatovic114,
-
Concerns about medicines
(Beliefs)
Berglund128, Fawzi88, Gatti89,
Laba94, Mardby4
Aakre123, Frain149, Ruppar107
Necessity of medicines (Beliefs) Berglund128, Bhattacharya148,
Burra115, Clifford153, Fawzi88,
Gatti89, Laba94, Ross95,
Ruppar107,120
Aakre123
Poor attendance to follow-ups Kleeberger90 -
Lifestyle (Change in Routine etc.) Burra115 George100
Manual dexterity George100 -
Self-efficacy Barclay87, Gatti89, Kim146 Fraser99
Personality Ediger145, Williams154 -
Missed prenatal vitamins Cohn93 -
Sleep quality Phillips102 Burra115
NB: The surnames of the first author of the papers have been used in this table. These papers are written in collaboration
with other authors (et al.)

16
1.5 Measuring Medication Adherence
Accurate measurement of medication-taking behaviour is required to identify non-adherence
and help inform interventions to support adherence. Methods to measure medication-taking
behaviour can be categorised into two broad groups: objective and subjective
measures.18,155,156
1.5.1 Objective Measures
Objective measures include: direct observations of medication-taking, measurement of
clinical outcomes, dose counts, pharmacy records, electronic monitoring of medication
administration (e.g. the Medication Event Monitoring System, MEMS), ingestible sensor (e.g.
Raisin SystemTM) and blood or urine drug concentrations.157-163 Objective measures can be
either direct (e.g. blood drug concentrations) or indirect (e.g. dose counts and pharmacy
records). These types of adherence measures can provide detail on dose administration
over time. Measuring clinical outcomes include blood pressure for patients on hypertension
medications, blood glucose levels and HbA1c levels for diabetes and viral suppression in
HIV.64,72,83,157 Counting the number of medicine doses remaining in the container can be
conducted at home or in clinic and may be announced or unannounced. Unannounced dose
counts tend to be more accurate because it reduces the chances of dose dumping.164
Information about prescription refills can be obtained from pharmacy records to provide a
measure of medication-taking behaviour over long periods of time.20,158 Electronic
monitoring (e.g. MEMS) can record the time of dose-taking and can provide detailed
information on medication-taking behaviour.165-167 A newer form of electronic monitoring
known as the DoPill® has 28 compartments which can contain multiple tablets in each slot.
The DoPill® electronic dispenser beeps and flashes to remind patients to take their
medicines and consists of sensors which can send signals to health professionals alerting
a dose has been released.161 The Raisin SystemTM recently developed by Proteus
Biomedical is an ingestible micro-sensor that can be incorporated into each oral solid
dosage form. The sensor can obtain information on date and time of ingestion and
communicates this data with an externally-worn seven-day wear adhesive monitor that can
be routed to a software program.163

17
Objective measures (excluding those that utilise clinical outcomes) have been shown to
better predict clinical outcomes compared to subjective measures of adherence.83,168-172 For
example, Wu et al. found that adherence measured by MEMS, but not by a self-report
adherence scale, independently predicted event-free survival in patients with heart failure.168
Objective measures have some limitations (Table 1.2). First, objective measures are more
expensive and may not always be applicable, particularly in a setting with limited
resources.162,173 Second, although the ultimate aim of any intervention is to improve clinical
outcomes, using clinical outcomes as a proxy of adherence can be impacted by variability
in patient response to medicines, independent of medication-taking behaviour. This poses
challenges in using clinical outcomes to validate measures of adherence.175 A lack of
change in a clinical outcome may occur in an individual who is adherent to their medication
due to other factors impacting on their disease. Individual clinical response to a medicine
can be affected by diet, lifestyle, family history, genes and renal function.20,67,71,168,174,175 For
example, a patient on antihypertensive therapy may have uncontrolled blood pressure
despite being adherent to their medication. This could be due to an increase in their dietary
salt intake, or increases in body weight or alcohol consumption.71,174,175 Furthermore, a
patient may have genetic differences in their drug metabolising enzymes resulting in either
lack of activation of the drug (e.g. clopidogrel) or rapid metabolism of the drug (e.g.
warfarin).175 Third, objective measures, when used alone, are unable to identify the type of
non-adherence or the patient-specific barriers to adherence. These measures offer little
insight into why a patient may be non-adherent and thus implementing an appropriate
intervention would be difficult.

18
Table 1.2 Advantages and disadvantages of objective measures of adherence
Adherence Measure Advantages Disadvantages
Direct observation of
medication-taking 176
- Considered most
accurate measure of
medication-taking
behaviour
- Impractical, particularly
in an outpatient setting
- Patients may not swallow
medication
Pharmacy prescription
dispensing records 158,177
-
- Low burden and efficient
- Inexpensive
- Can provide estimates in
large populations over
extended periods of time
- Can be used to assess
primary adherence as
dispensed prescription is
first step to measure
adherence
- Does not capture
detailed medication-
taking behaviour
- Estimates medication
possession and not
consumption.
- Cannot be used for
short-term regimens
- Not practical in real-time
- Limited to specific
location, requires closed
pharmacy system
Pill counts 156,176 - Accurate
- Inexpensive
- Can provide data over
extended periods of time
- Easy to conduct
- Possible risk of dose
dumping
- Potential bias from not
having all pills at the time
- Time-consuming
- Labour intensive
Drug concentrations in
biological fluids (e.g. blood,
urine) 66,176
- Accurate
- Expensive
- Difficult in community
setting
- Invasive
- Labour intensive
- Affected by dose, dose
timing and
pharmacokinetics and
drug interactions
Medication Event
Monitoring System (MEMS)
caps 159,165
- Accurate
- Records data and time
of bottle opening
- Provides continuous
data and real-time
tracking
- Considered gold
standard
- Non-invasive
- Expensive
- One cap per drug
- Not all medicines can be
packaged in a bottle
- Risk of malfunctioning
- Can over- or under-
report
- Patient may not swallow
medication

19
Adherence Measure
(cont.)
Advantages (cont.) Disadvantages (cont.)
Intelligent Drug
Administration System
(IDAS)166
- Provides visual and
audible reminders
- Has to be customised to
accommodate specific
blister packs
- Not all medicines are
packed in blisters
Smart Blister167
- Can be used on
commercial blisters
- Can easily download
adherence data
- Provides visual and
audible reminders
- Technology not sensitive
enough to detect
individual tablet opening
- Not all medicines are
packed in blisters
Ingestible sensor (Raisin
SystemTM by Proteus
Biomedical Inc.)163
- Accurate
- Can obtain data on
dose, data and time of
ingestion
- Can also monitor heart
rate, body temperature
and blood pressure
- Expensive
- Limited research and
experience on its use
- Ethical issues due to
invasive nature of
measure
Clinical outcome (e.g. blood
pressure control, HIV viral
load)64,72,83,157
- Important - May be confounded by
factors such as lifestyle,
diet and family history
- Labour intensive
- Time consuming
1.5.2 Subjective Measures
Subjective measures of adherence rely on patient’s reporting their medication-taking
behaviour, barriers to adherence and/or their beliefs associated with adherence. Most
subjective measures are simple, inexpensive and relatively easy to administer.178 Subjective
measures include caregiver or physician adherence reports, patient interviews, self-reports
and adherence scales.4,18,179-181 Subjective measures, for example adherence scales can
identify medication-taking behaviour, categorise patients into types of non-adherence,
explore beliefs associated with adherence and explore patient-specific barriers to and
determinants of adherence.18,33,117,181

20
1.5.3 Self-Report Adherence Scales
Many self-report adherence scales are available and these have been briefly described in
two systematic reviews.178,182 Adherence scales are relatively easier to administer and can
provide an alternative to, or supplement objective measures of adherence. However, self-
report scales rely on respondents to recall information and provide truthful answers and
hence are prone to recall bias and social desirability bias.179,182 Adherence scales vary in
the number of items, measure different aspects of adherence and are validated against
different measures of adherence. Table 1.3 lists adherence scales that have been validated:
defined as scales that have been tested against a comparison measure of medication-taking
behaviour (objective or subjective).
21
Table 1.3 Validated adherence scales
Name of Adherence Scale Abbreviation
Adherence Attitude Inventory 183 AAI
Adherence Self-Report Questionnaire 184 ASRQ
Adherence Starts with Knowledge-12 185 ASK-12
Adherence Starts with Knowledge-20 186 ASK-20
Adherence to Refills and Medications Scale 187 ARMS
Adherence Visual Analogue Scale 164 VAS
Barroso et al. 30-day Adherence Question 60 -
Beliefs about Medicines Questionnaire 117 BMQ
Beliefs and Behaviour Questionnaire 188 BBQ
Bell et al. Adherence Question 189 -
Brief Adherence Rating Scale 181 BARS
Brief Evaluation of Medication Influences and Beliefs 79 BEMIB
Brief Medication Questionnaire 190 -
Brooks Medication Adherence Scale 191 BMAS
Centre for Adherence Support Evaluation Adherence Index 192 CASE
Choo et al. Questionnaire 156 -
Compliance Questionnaire Rheumatology 193 CQR
Drug Attitude Inventory 53 DAI
Fodor et al. Adherence Questionnaire 194 -
Gehi et al. Adherence Question 12 -
Godin et al. Self-Reported Adherence Questionnaire 195 -
Grymonpre et al. Adherence Question 196 -
Hill-Bone Compliance Scale 10 55 -
Hill-Bone Compliance Scale 14 197 -
Immunosuppressant Therapy Adherence Scale 198 ITAS
Kerr et al. Adherence Question 199 -
Maastricht Utrecht Adherence in Hypertension Questionnaire 200 MUAH
Medication Adherence Assessment Tool 201 MAAT
Medication Adherence Questionnaire 18 MAQ
Medication Adherence Reasons Scale 202 -
Medication Adherence Rating Scale 51 MARS
Medication Adherence Rating Scale - 5 127 MARS-5
Medication Adherence Self-Efficacy Scale 203 MASES
Medication Adherence Self-Efficacy Scale - Revised 204 MASES-R
Morisky Medication Adherence Rating Scale 205 MMAS
Osteoporosis-Specific Morisky Medication Adherence Scale 206 OS-MMAS
Patterns of Asthma Medication Use Questionnaire 207 -
Paediatric Inhaler Adherence Questionnaire 208 PIAQ
Reported Adherence to Medication Scale 117 RAM
Self-Efficacy for Appropriate Medication Use Scale 209 SEAMS
Self-Reported Adherence Questionnaire 210 SERAD
Simplified Medication Adherence Questionnaire 211 SMAQ

22
Stages of Change for Adherence Measure 212 SOCA
Validated self-report adherence scales have been developed using a number of different
approaches (Figure 1.3). Adherence scales have been developed from literature reviews,
expert panels, patient focus groups, other adherence scales, a number of health models
and for clinical trials. Many of the adherence scales were developed from literature reviews
and expert panels. Adherence scales developed using these techniques (literature reviews
and expert panels) differ in focus (e.g. different diseases, identifying barriers as opposed to
identifying medication-taking behaviour) as these studies were conducted on the basis of
different study aims.190,197,207 Other scales based their survey questions on themes that
surface from patient focus groups.192,193,200 Some adherence scales (AAI, BBQ, BMQ and
BEMIB) were based on a number of different health models.79,117,183,188 Adherence scales,
such as MMAS, MARS, ARMS and ASRQ have derived from previously developed
adherence scales. The majority of the scales that came from previous adherence scales
have been developed based on the 4-item Morisky Medication Adherence Questionnaire
(MAQ).18,51,187,191,198,205,211 Some of the adherence scales utilise a combination of strategies;
for example, the SEAMS was based on a literature review, patient focus groups and an
expert panel.209

23
Figure 1.3 Adherence scales originate from a number of different sources (Original source unspecified: Barroso, Bell, Fodor, Grymonpre and VAS Scale)

24
Different self-report adherence scales measure different aspects of adherence: medication-
taking behaviour, barriers to adherence, beliefs associated with adherence or a combination
of these aspects.213 Adherence scales have been correlated with a number of different
comparison measures of medication-taking behaviour including electronic monitoring, pill
counts, healthcare outcomes and pharmacy refill records. Chapter Two presents a
systematic review of validated adherence scales and discusses the validation of adherence
scales and what aspects of adherence each explores.
There are numerous methods to measure adherence, but no single method performs well
on all criteria (e.g. ease of administration, inexpensive, accurate, quick to complete, well-
validated in many diseases).20,176 An accurate measure of medication adherence would be
able to identify patients who are non-adherent to their medication, and inform an intervention
to support adherence. The following section discusses the interventions that have been
implemented to improve adherence.
1.6 Interventions to Improve Adherence
1.6.1 Introduction
Many interventions have been implemented to improve medication adherence in patients
with chronic diseases. However, most interventions have not significantly improved
medication adherence or clinical outcomes.13-15,214-221 Interventions that show promise in
improving medication adherence were multifaceted interventions.217,222,223 These
interventions employ a number of different strategies to improve adherence. Multifaceted
interventions address a greater number of potential barriers to adherence and thus tend to
be more successful than single interventions.223 However, multifaceted interventions are
intensive and have only produced modest improvements in adherence and clinical
outcomes.13,15,217,223

25
Adherence interventions have largely been implemented on a non-targeted population, that
is most of these studies did not identify patient’s adherence to their medication prior to
inclusion in the study. Interventions are thus implemented on a population without knowing
if the patient is adherent or non-adherent to their medications.215,224-227 This means that
interventions are implemented on patients who may be adherent at the time the intervention
was employed; therefore, would observe no improvement in adherence. This may explain
why some studies of plausible adherence interventions have not demonstrated an
improvement in adherence. By identifying patients at greater risk of medication non-
adherence, interventions can be targeted to those who would most benefit.228 An example
of a targeted intervention is Measurement-Guided Medication Management (MGMM), which
uses MEMS data on the patient’s adherence as feedback to guide the discussion on
adherence and implementation of an intervention.214
As discussed in Section 1.4, patients are non-adherent due to many different reasons, and
may be subjected to different types of non-adherence concurrently (Section
1.2.4).1,18,87,89,90,93,96,100,114,115,145,147 Both are important to consider when selecting an
appropriate intervention to address non-adherence.33 Identifying the reasons for non-
adherence facilitates a strategy to address these reasons, which can be described as a
tailored intervention. In the literature, tailored interventions are described in a number of
different ways. Some interventions were “tailored” to a specific disease population.229 Others
have selected a specific type of intervention and “tailored” that intervention to the
patient.130,153,230-233 For example, Insel et al. individualised memory strategies to improve
adherence in older patients.230 Greater focus is required on identifying the primary cause for
the patient’s non-adherence and tailoring interventions to these specific reasons for non-
adherence.68,130,228,234 For example, forgetfulness is one of the most common reasons for
non-adherence; however, implementing a reminder intervention would not improve
adherence if the patient is non-adherent due to negative beliefs about the medicine.224,235
To improve the outcomes of adherence interventions, interventions should be targeted to
patients identified as non-adherent and tailored to the patient-specific reasons for non-
adherence.
26
1.6.2 Examples of Interventions Focusing on a Single Aspect of Adherence
Current adherence interventions can be classified into five main categories: reminder
systems, behavioural-counselling, social support, cognitive-educational and measurement-
guided interventions, according to Demonceau et al.214 Examples include dose
administration aids, telephone reminders, education about illness and motivational
interviewing.13,215 Below are some examples and outcomes of the adherence interventions
to date:
Reminder interventions
Reminder interventions may benefit those that forget to take their medications by reminding
them. There are many reminder interventions that have been implemented, including
reminder phone calls, texts, pagers, interactive voice response systems and treatment
simplification interventions.130,220,236-243 Reminder packaging (dose administration aids,
dosette boxes and dose sachets) assembles medicine doses into days and/or times when
the medication has to be taken. This has been shown to increase the proportion of doses
taken, leading to a significantly reduced diastolic blood pressure and also HbA1c levels.244
A study using MEMS which consisted of electronic medication reminder caps with
medication-taking recording cards significantly improved adherence by 17% and reduced
systolic and diastolic blood pressure by 4.8 and 8.6 mmHg, respectively.245 Postal reminders,
dose administration aids and both used in combination all significantly improved medication
adherence, measured using pharmacy refill records, in patients with hypertension.246 Short
text message reminders was shown to reduce the rate of missed doses and delayed doses,
according to self-report in the general population.238Telephone and early postal reminders
implemented on patients taking pravastatin did not significantly improve self-reported
adherence.235
Cue-dose training involves advising patients to use cues as reminders to take their
medicines; for example, meal times, alarms (incorporated in MEMS) and locating medicines
in more noticeable areas. Cue-dose training in patients with type 2 diabetes significantly
improved adherence to metformin, but did not improve diabetes control.247
Simplification of drug and dose regimen has consistently improved medication adherence.
14,15,240-243 A systematic review on interventions implemented to improve adherence in

27
patients with hypertension found that simplifying dosing regimens increased adherence in
seven out of nine studies, with a relative increase of 8 to 19.6%.15 Patients on once-daily
trandolapril had significantly better adherence compared to patients on twice-daily captopril
treatment for hypertension, as measured using MEMS.240 Self-report adherence was
significantly higher in patients taking sustained-release nicardipine twice daily than
conventional nicardipine three times daily.241 Patients treated with a single combination
tablet regimen for hypertension had significantly less cardiovascular events compared to
those taking the components individually. This retrospective cohort study identified patients
on a number of different combination therapies for hypertension found that single
combination tablet regimens compared to the individual component treatment led to a
reduction in hospital costs, as measured using pharmacy prescription refill data.234
Behavioural-counselling interventions
Behavioural-counselling adherence interventions aim to change medication-taking
behaviour by modifying beliefs and motivating patients to make positive changes. Many
adherence interventions have used behavioural-counselling strategies to improve
adherence.15,130,248,249 A systematic review showed that 10 out of 24 interventions led to
small improvements in medication adherence.15
Health coaching aims to promote positive health behaviour changes, by establishing the
patient’s goals and beliefs about treatments and helping the patient to attain these goals.
Person-to-person health coaching every three months and telephone health coaching every
month over 12 months in patients with hypertension significantly improved adherence, as
measured by dose counts.250 Health coaching patients with hypertension from health
professional students significantly improved adherence, as measured by the Brief
Medication Questionnaire.226
Motivational interviewing involves counselling patients to recognise the discrepancy
between the patient’s behaviour and goals in the hope of eliciting positive behavioural
changes.251 Motivational interviewing and cognitive approaches in a convenience sample of
patients with schizophrenia or major depression showed no significant improvement in
adherence, measured with an adherence scale (DAI).252 Using MEMS to measure
adherence, pharmacist-led motivational counselling in patients on a diuretic for heart failure

28
showed a significant improvement in adherence.221 The number of medicine doses taken
according to MEMS was significantly increased in patients with hypertension using
motivational interviewing.219
Personalised nurse-counselling on modifiable and unmodifiable cardiovascular risk factors
was shown to significantly improve self-reported adherence to statins and lower low-density
lipoprotein cholesterol.253
“Adherence Therapy” is a patient-centred approach that explores patient attitudes and
beliefs about medicines in a manner similar to motivational interviewing. Once negative
beliefs about medicines are identified, patients generate evidence to support these beliefs
and the therapist modifies these beliefs to improve adherence. Adherence Therapy has
mainly been tested in psychiatric illnesses, in particular schizophrenia. There is no standard
approach to Adherence Therapy; varying in length ranging from four to eight sessions lasting
20 minutes to three-and-a-half hours.129,254-258 The most promising study using Adherence
Therapy to improve medication adherence was targeted to patients who were non-adherent,
resulting in significantly improved blood pressure and adherence measured using dose
counts.129
Social support interventions
Social support interventions include family support and peer support groups.259-261 A study
demonstrated that a supportive family environment was associated with better adherence
to diabetes medications.261 A six-month American study found that peer counselling for
adolescents did not have an effect on self-reported treatment completion rates.262 Peer
support group therapy for adolescents with HIV showed no change in adherence, according
to physician reports.263 A five-month clinic-wide social marketing campaign was conducted
to improve adherence to antiretroviral therapy. The campaign did not demonstrate an
improvement in medication adherence according to self-reported adherence.264 An online
social support intervention involving an interface that allows participants on antiretroviral
therapy to interact, self-report their adherence and watch videos about living with HIV,
significantly improved self-reported adherence. By targeting the online social support
intervention to patients reporting “imperfect” adherence, this may have improved the
outcomes of the intervention.259
29
Cognitive-educational interventions
Poor knowledge has been associated with medication non-adherence. Cognitive-
educational interventions involves providing information to improve a patient’s knowledge
on their medications and illnesses to better inform their medication-taking behaviour. Some
cognitive-educational interventions have been shown to improve medication adherence,
however, results have been inconsistent.215,218,225,226 Patient education alone has been
largely unsuccessful in improving medication adherence.15,231,265-268 A trial involving nurse
counselling via telephone increased the proportion of children with latent tuberculosis
completing treatment from 65% to 94%.269 Nurse-delivered home visits providing information
on HIV and the importance of medication adherence was associated with an increased
likelihood of patients reporting 100% adherence.215 A study on asthma patients showed that
repeated instructions on inhalation techniques significantly improved adherence measured
using the BMAS.225 Pharmacy-based education and counselling on adherence did not
improve medication adherence, measured using pill counts.270 Educating patients on
adherence and their medication by a pharmacist via weekly telephone calls for 12 weeks
did not significantly improve adherence to lipid-lowering medications in the short-term (6
weeks and 12 weeks). However, long-term (12 months and 24 months) adherence was
improved according to dose counts.229 Educational videotapes containing information on the
prescribed medicine and the respective medical condition did not improve medication
adherence, according to pharmacy records, in patients with chronic disease.267 Enhanced
in-hospital counselling on medications and adherence barriers by pharmacists coupled with
communication of discharge medications to community pharmacists and physicians did not
significantly improve adherence to aspirin and statins, as measured using pharmacy
records.231 In comparison, patients who received counselling sessions with a community
pharmacist at the start of statin treatment demonstrated greater adherence according to
pharmacy records.271 A mailed newsletter discussing the importance of adherence and
lifestyle modifications showed no improvement in adherence, as measured using physician
reports.266 Automated telephone patient monitoring and counselling on adherence and blood
pressure control led to an increase in self-reported adherence and a significant decrease in
diastolic blood pressure.220 Meducation®, calendars listing information about cardiovascular
medications, such as medication name, dose, dose frequency and clinical indication, did not
significantly improve adherence as measured using prescription refill data and self-report.
The Meducation® intervention did not significantly improve blood pressure control or
cholesterol levels.272

30
Electronic Adherence Monitoring Feedback Interventions
Measurement-Guided Medication Management (MGMM) is an approach to using drug
dosing history data as feedback to patients on their medication-taking behaviour to improve
adherence.273 This information facilitates a focused discussion between a health
professional and their patient about their medication-taking behaviour, reinforcing other
adherence interventions. Electronic monitoring feedback interventions showed improvement
in adherence.214 MGMM interventions have relatively consistent outcomes in improving
adherence. Electronically compiled drug dosing histories provide detailed information on a
patient’s medication-taking behaviour that can assist health professionals in identifying and
addressing the reasons for poor medication-taking behaviour. Participants provided with
weekly feedback on their medication-taking behaviour obtained from MEMS and repeated
instructions on improving adherence to bupropion had a significant improvement in
adherence.274 A pharmaceutical care program involved reviewing compiled drug history
using MEMS by both the patient and pharmacist, significantly improved medication
adherence.275 Interventions that were based on discussion informed by adherence feedback
using electronically compiled medication-taking history have consistently improved
adherence to medications. These interventions involve some degree of tailoring
interventions to non-adherent patients.
1.7 Summary
This literature review has raised a number of key issues surrounding medication adherence
scales and interventions to improve adherence.
There are a large number of adherence scales available. Deciding which adherence scale
to use is a difficult task. An important factor to consider when selecting an adherence scale
is validity; however there is no single measure of validity for an adherence scale. Further,
how the scales measure adherence differs. To address some of the issues surrounding the
use of adherence scales, we conducted a systematic review of self-reported adherence
scales which have been validated against a comparison measure of adherence (Chapter
Two).

31
Interventions to improve medication adherence have not universally improved adherence.
As discussed in Section 1.6, interventions that have shown some improvement in adherence
were complex and improvements in adherence were only modest. We believe that part of
the reason for these inconsistent results is that interventions have not been sufficiently
targeted to patients who are non-adherent nor tailored to the patient-specific reasons for
non-adherence. Self-report adherence scales provide the opportunity to identify some of the
reasons for non-adherence and may be used in a similar manner to MEMS in a MGMM
approach. These scales can either directly assess the patient’s medication-taking behaviour
and/or attempt to identify barriers to good medication-taking behaviour, as discussed in
Chapter Two. This provides information on how best to target and tailor interventions to
improve adherence.
A quick and simple intervention that is tailored to non-adherent patients would be good to
improve adherence in practice. An intervention applicable to the clinical setting is practical,
easily incorporated into clinical practice and used in more than one disease population.
Current interventional studies on medication adherence tend to focus on one disease state
as this would minimise the variability of adherence and improve understanding of adherence
in that disease state.219,226,227,269,276-279
The literature review and systematic review of validated adherence scales will allow the
selection of adherence scales that will be able to identify non-adherent patients with chronic
cardiovascular disease and explore the patient-specific reasons for non-adherence.
Responses to the validated adherence scales will facilitate further discussion between the
patient and researcher, which will guide the implementation of a tailored strategy to improve
adherence. Patients diagnosed with hypertension, type II diabetes, dyslipidaemia or
cardiovascular disease will be included in the study. These medical conditions are common
and contribute extensively to the burden of chronic diseases.280
The aim of the thesis is to determine if a targeted and tailored intervention based on a
discussion informed by validated scales, would improve adherence to a recently initiated
cardiovascular medication.

32
It is hypothesised that:
H1 Targeting and tailoring an intervention based on a discussion informed by adherence
scales in participants identified as non-adherent using the MAQ, will improve adherence at
three months.
H2 Improvements in adherence at three months, identified by the MAQ, will be sustained at
six months.
H3 Adherence, and reasons for non-adherence, will change over time in all groups studied.

33
CHAPTER TWO: SYSTEMATIC REVIEW
OF VALIDATED SELF-REPORT
MEDICATION ADHERENCE SCALES
(PUBLISHED)
2.1 Introduction
Many self-report adherence scales are available. Adherence scales are relatively simple,
easy to administer and inexpensive. Adherence scales may provide information on a
patient’s medication-taking behaviour and may also provide the opportunity to identify some
of the barriers to adherence. The available adherence scales have been briefly described in
two reviews.178,182 Although these reviews identified and briefly described some of the
available adherence scales, these reviews did not provide detailed information on what
adherence scales measured and how they were validated. A systematic review of validated
self-report adherence scales was conducted to determine what adherence scales really
measured and how these scales have been validated. The following paper has been
published in the British Journal of Clinical Pharmacology.213
2.2 Published Paper
Nguyen TMU, La Caze A, Cottrell WN. What are validated self-report adherence scales
really measuring?: a systematic review. Br J Clin Pharmacol 2014;77(3):427-45.
2.2.1 Abstract
Background Medication non-adherence is a significant health problem. There are numerous
methods for measuring adherence, but no single method performs well on all criteria.
Objectives The purpose of this systematic review is to (i) identify self-report medication
adherence scales that have been correlated with comparison measures of medication-
taking behaviour, (ii) assess how these scales measure adherence and (iii) explore how
these adherence scales have been validated.

34
Method Cinahl and PubMed databases were used to search articles written in English on
the development or validation of medication adherence scales dating to August 2012. The
search terms used were medication adherence, medication non-adherence, medication
compliance and names of each scale. Data such as barriers identified and validation
comparison measures were extracted and compared.
Results Sixty articles were included in the review, which consisted of 43 adherence scales.
Adherence scales include items that either elicit information regarding the patient’s
medication-taking behaviour, and/or attempts to identify barriers to good medication-taking
behaviour or beliefs associated with adherence. The validation strategies employed
depended on whether the focus of the scale was to measure medication-taking behaviour
or identify barriers or beliefs.
Conclusions Supporting patients to be adherent requires information on their medication-
taking behaviour, barriers to adherence and beliefs about medicines. Adherence scales
have the potential to explore these aspects of adherence, but currently there has been a
greater focus on measuring medication-taking behaviour. Selecting the “right” adherence
scale(s) requires consideration of what needs to be measured and how (and in whom) the
scale has been validated.
2.2.2 Introduction
There are many effective medicines available to treat illness, but the benefits of these
medicines will only accrue to the patients that take them. The World Health Organisation 1
defines adherence as:
The extent to which a person’s behaviour – taking medication, following a diet, and/or
executing lifestyle changes, corresponds with agreed recommendations from a
health care provider.
Medication non-adherence is common, with studies in a range of settings identifying up to
50% of patients as non-adherent to a medicine.4,5,53,54,88 Poor medication adherence results
in adverse health outcomes3,12,55 and increased healthcare costs.3
Patients may be non-adherent due to different beliefs, barriers and a range of other factors.
Patients may intentionally decide not to take their medicines based on well-informed or

35
mistaken beliefs about the benefits and risks of their medicines.49,117 Patients can
unintentionally non-adhere to medicines due to forgetfulness, carelessness, health literacy
and socioeconomic factors. Non-adherence can also occur at different stages of the
medication-taking process. A patient may exhibit non-adherence at the initiation of treatment,
during treatment (where the patient may exhibit sub-optimal implementation of the treatment
regimen), or the patient may discontinue the treatment early.38 Strong evidence for any
single approach to improve medication adherence is lacking, but interventions that are
tailored to a patient’s specific reasons and stage of non-adherence can be expected to better
support good medication-taking behaviour.13-15,216,236
Adherence to medicines is measured for different purposes. Common reasons to measure
adherence include better informing the assessment of an intervention (as unrecognised non-
adherence may lead to an underestimation of possible treatment effects); determining
influences on adherence to medicines in people with specific disease states (such as
hypertension or HIV); and identifying patients requiring education or support to improve
medication use. Ideally, clinicians and researchers wanting a comprehensive assessment
of adherence need measures that are inexpensive, relatively easy to administer, accurately
identify the patient’s current medication-taking behaviour, and any barriers or beliefs that
influence the patient’s use of medicines.
There are a number of ways of measuring adherence. Objective measures, including
measurement of clinical outcomes, dose counts, pharmacy records, electronic monitoring of
medication administration (e.g. the Medication Event Monitoring System, MEMS) and drug
concentrations,157-160 seemingly provide the best measure of a patient’s medication-taking
behaviour in many contexts.83,168-172 It is important to recognise that, while objective, most
of these measures have drawbacks. MEMS, arguably the best objective measure of
medication-taking behaviour, records package opening or device actuation, rather than
actual medication-taking; the possibility of intentional dose dumping remains. MEMS, or
MEMS-like devices, are also expensive and not readily available for some dose forms 159,165-
167. While clinical outcomes are the ultimate aim of any intervention to improve adherence,
the use of clinical outcomes as a proxy of adherence can be confounded by disease-specific
factors independent of medication-taking behaviour.
Subjective measures of adherence include physician or family reports, patient interviews
and self-report adherence scales.117,179-181,205 These measures have the potential to identify
the specific reasons for a patient’s non-adherence. Subjective measures can be relatively
simple to use and are less expensive; however, are prone to recall bias and the prospect

36
that respondents provide answers that conform to their perceived expectations of their
interviewer.281,282 There are a large number of adherence scales that are suitable for use in
research or clinical settings. A number of well-validated adherence scales have been
strongly correlated with objective measures of adherence in several different populations of
patients.
There is a need for scales that are easy to administer and correctly identify medication-
taking behaviour, key barriers to adherence and beliefs associated with medication use that
influence adherence. There have been few systematic attempts to describe the available
self-report adherence scales and their benefits and limitations with respect to both
medication-taking behaviour and the identification of barriers and beliefs associated with
adherence.178,182 The aim of this review is to (i) identify self-report medication adherence
scales that have been correlated with a comparison measure of medication-taking behaviour,
(ii) assess how these scales measure adherence and (iii) explore how these adherence
scales have been validated.
2.2.3 Methods
A literature search for adherence scales was conducted using Cinahl and PubMed electronic
databases. The initial search terms used to identify the articles were: medication adherence,
medication non-adherence, medication compliance and medication non-compliance. This
broad database search identified the names of the adherence scales, which were then
searched individually. This search was limited to English-language studies published
between 1981 and 2012. The date of the last search was on the 1st August, 2012. The
reference lists of the relevant studies were searched to identify additional articles.
Inclusion and exclusion criteria
Adherence scales were included if they had been correlated against a comparison measure
(objective or subjective) of medication-taking behaviour. To be included there needed to be
a full-text article, written in the English-language on the development and/or validation of the
adherence scale. Studies that used the self-report adherence scale without correlating the
adherence scale against a comparison measure of medication-taking behaviour were
excluded. The list of scales was reviewed for completeness with two adherence researchers.

37
Data extraction and analysis
The data extracted from the studies included: the number of items in the adherence scale,
study setting, criteria for identifying non-adherence, response rate and time to complete the
adherence scale. Each validated self-report adherence scale was categorised according to
whether it contained items that elicited information on (i) specific medication-taking
behaviours: dose taken, dose frequency, dose administration and prescription refills; (ii)
barriers to adherence: e.g. forgetfulness, treatment complexity and side effects; and/or (iii)
beliefs associated with adherence: e.g. perceived necessity of medicines and concerns
about medicines. Adherence scales were also assessed on whether or not the scale
identified the initiation, implementation or discontinuation of treatment as per the taxonomy
proposed by Vrijens et al.38
To assess the quality of the correlation study, the following criteria were extracted: how the
adherence scale was administered, sample size, the adherence comparison measures,
internal consistency, and where reported, the sensitivity and specificity of the scale against
a standard of adherence. Information on criterion, content and construct validity was also
extracted to assess the validation of the adherence scale. The results of the studies were
reviewed and compared.
2.2.4 Results
Search Strategy
The study selection process is illustrated in Figure 2.1. Twenty-one articles were retrieved
using the Cinahl search engine and the remaining were identified using the same strategy
in the PubMed database and from reference lists. Some adherence scales were excluded,
as shown in Table 2.1.

38
Figure 2.1 Flow chart of study selection process

39
Table 2.1 Excluded self-report adherence scales
Excluded Adherence Scale Reason for Exclusion
Adult AIDS Clinical Trials Group
(AACTG) Adherence Scale 283
No validation studies were found in the
literature search
Basel Assessment of Adherence Scale
(BAAS) 284
No validation studies were found in
literature search.
Medication Adherence Evaluation Scale
(MASS) 285
No full-text article available
Medication Adherence Measure (MAM)
interview 180
Semi-structured interview and thus was
not consistent between patients
Multicentre Aids Cohort Study (MACS)
adherence form 90
No adherence comparison measure
The literature search retrieved 60 articles that met the inclusion criteria (Figure 2.1,
Table 2.2). The sample size of the studies ranged from 40 to 1367 (Table 2.3).190,211
The median sample size of the studies was 228. Twenty-two of the studies reported
the response rate, ranging from 29 to 98%. The average response rate was 72% (Table
2.3). Forty-three self-report adherence scales were identified from the included studies.

40
Table 2.2 Comparing the self-report adherence scales
Self-Report Adherence Scale Based On Number of
Questions
Time to Complete
Barriers Identified
Stage of Medication-
Taking Identified
Number of Development and
Correlation Studies
GROUP 1: Medication-Taking Behaviour
Adherence Self-Report Questionnaire (ASRQ) 184
CQR 1 Not reported
- Nil Implementation 2
Adherence Visual Analogue Scale (VAS) Computerised 164
Literature review
1 Not reported
- Nil Implementation 1
Brief Adherence Rating Scale (BARS) 181 CATIE trial 4 Not reported
- Nil Implementation 1
Barroso et al. 30-day Adherence Question 60 Did not specify 1 Not reported
- Nil Implementation 1
Bell et al. Adherence Question 189 Did not specify 1 Not reported
- Nil Implementation 1
Centre for Adherence Support Evaluation (CASE) Adherence Index 192
Literature review
3 Not reported
- Nil Implementation 1
Gehi et al. Adherence Question 12 Expertise 1 Not reported
- Nil Implementation 1
Grymonpre et al. Adherence Question 196 Did not specify 1 Not reported
- Nil Implementation 1
Kerr et al. Adherence Question 199 Expertise 1 Not reported
- Nil Implementation 1
Medication Adherence Report Scale – 5 (MARS-5) 127,286
MARS-10 5 Not reported
- Nil Implementation Discontinuation
3

41
Stages of Change for Adherence (SOCA) 212 Stages of Change model
2 Not reported
- Stages of change
Initiation Implementation
1
GROUP 2: Medication-Taking Behaviour AND Barriers
Adherence to Refills and Medications Scale (ARMS) 187
Literature review, MAQ and Hill-Bone Compliance Scale
12 Not reported
- Correct administration
- Forgetfulness - Prescription
refill ability
Implementation Discontinuation
1
Adherence Starts with Knowledge-12 (ASK-12) 185
ASK-20 12 Not reported
- Patient-perceived barriers
- Inconvenience
- Forgetfulness - Medication
beliefs
Implementation Discontinuation
1
Adherence Starts with Knowledge-20 (ASK-20) 186
Literature review, patient focus groups and expert panel input
20 Not reported
- Medication-taking behaviour
- Patient-perceived barriers
Implementation Discontinuation
2
Brief Medication Questionnaire 190 Literature review and patient feedback
9 Not reported
- Evaluates regimen
- Medication-taking problems
Implementation 1
Brooks Medication Adherence Scale (BMAS) 191
MAQ 4 Less than 5 minutes
- Forgetfulness - Carelessness
Implementation Discontinuation
2

42
- Adverse effects and efficacy
Choo et. al. 5-item Questionnaire 156 Brief Medication Questionnaire
5 Not reported
- Unintentional and intentional non-adherence
Implementation 1
Fodor et al. Adherence Questionnaire 194 Did not specify 9 Not reported
- Blood pressure awareness
Implementation Discontinuation
1
Godin et al. Self-Reported Adherence Questionnaire 195
Expertise 6 5 minutes - Barriers to adherence
Implementation 1
Hill-Bone Compliance Scale – 10 55 The Hill-Bone Compliance Scale - 14
10 Not reported
- Adherence - Appointment-
making - Sodium intake
Implementation 1
Hill-Bone Compliance Scale – 14 197 Literature review and Clinical expertise
14 5 minutes - Adherence - Appointment-
making - Sodium intake
Implementation 1
Immunosuppressant Therapy Adherence Scale (ITAS) 198
MAQ 4 Less than 5 minutes
- Forgetfulness - Carelessness - Adverse
effects
Implementation Discontinuation
1
Medication Adherence Assessment Tool (MAAT) 201
Literature review and Expert clinicians
12 Not reported
- Previous history
- Adverse effects
- Access to medications
Implementation 1

43
Morisky Medication Adherence Scale (MMAS) 205
MAQ 8 Not reported
- Forgetfulness - Medication-
taking behaviour
- Adverse effects and problems
Implementation Discontinuation
3
Osteoporosis-Specific Morisky Medication Adherence Scale (OS-MMAS) 206
MMAS 8 Not reported
- Forgetfulness - Medication-
taking behaviour
- Adverse effects and problems
Implementation Discontinuation
1
Pediatric Inhaler Adherence Questionnaire (PIAQ) 208
Literature review, expertise and focus groups,
6 1 to 3 minutes
- Missed and additional doses
- Barriers to adherence
Implementation 1
Reported Adherence to Medicine (RAM) Scale 117
Literature review
4 Not reported
- Forgetfulness - Dose
adjustments
Implementation 2
Self-Reported Adherence (SERAD) Questionnaire 210
SERAD study 13 Not reported
- Dose frequency adherence
- Barriers to adherence
Implementation 1
Simplified Medication Adherence Questionnaire (SMAQ) 211
MAQ 6 Not reported
- Forgetfulness - Adverse
effects
Implementation Discontinuation
1

44
The Patterns of Asthma Medication Use Questionnaire 207
Literature review, Expertise
5 Not reported
- Forgetfulness - Medication-
taking strategy
Implementation 1
GROUP 3: Barriers to Adherence
Adherence Attitude Inventory (AAI) 183
Health Belief Model, Health Promotion Model, Reasoned Action
28
Not reported
- Cognitive functioning
- Patient-Provider
- Self-efficacy - Commitment
Implementation 1
Medication Adherence Questionnaire (MAQ) 18
5-item survey by Green et al.
4 Not reported
- Forgetfulness and Carelessness
- Adverse effects and Efficacy
Implementation Discontinuation
8
Medication Adherence Self-Efficacy Scale (MASES) 203
Patient interviews
26 Not reported
- Self-efficacy - Access to
medications - Adverse
effects - Lifestyle
barriers
Implementation 1
Medication Adherence Self-Efficacy Scale Revised (MASES-R) 204
MASES 13 Not reported
- Self-efficacy - Lifestyle
barriers - Adverse
effects
Implementation 1

45
Medication Adherence Reasons Scale 202 Literature review
15 Not reported
- Managing issues
- Beliefs - Multiple
medication issues
- Availability issues
- Forgetfulness
Implementation Discontinuation
1
The Self-Efficacy for Appropriate Medication Use Scale (SEAMS) 209
Literature, expertise and patient interviews
13 Not reported
- Specific problem areas
- Self-efficacy
Nil
1
GROUP 4: Beliefs associated with Adherence
Beliefs about Medicines Questionnaire 117 Health Belief Model and Patient Beliefs
18 Not reported
- Medication necessity beliefs
- Medication concerns
Nil 4
Drug Attitude Inventory (DAI) 53 Literature review and patient reports
30 Not reported
- Attitudes towards medications
- Beliefs on medications
Discontinuation 1
GROUP 5: Barriers AND Beliefs
Beliefs and Behaviour Questionnaire (BBQ) 188
Interviews of COPD patients
30 Not reported
- Beliefs - Experiences
Nil 1
Brief Evaluation of Medication Influences and Beliefs (BEMIB) 79
Health Belief Model and Patient/
8 Less than 5 minutes
- Forgetfulness - Access to
medications
Implementation 1

46
Investigator feedback
- Support network
- Benefits of medication
Compliance Questionnaire Rheumatology (CQR) 287
Patient interviews
19 ~ 12 minutes
- Forgetfulness - Value of
doctor instructions
Implementation 2
Maastricht Utrecht Adherence in Hypertension (MUAH) Questionnaire 200
Patient interviews
25 Average 25 minutes
- Medication attitude
- Discipline and aversions
- Coping with health problems
Implementation 1
Medication Adherence Report Scale (MARS) 51
MAQ and DAI 10 Not reported
- Forgetfulness - Adverse
effects - Value of
medication - Behaviour
and attitudes
Implementation Discontinuation
2

47
Content of the scales
The adherence scales can be categorised into five groups based on the information they
seek to elicit (the number of scales is given in parentheses, full details in Table 2.2): Group
1 scales seek information only on medication-taking behaviour (11), Group 2 scales seek
information on medication-taking behaviour and barriers to adherence (19), Group 3 scales
seek information only on barriers to adherence (6), Group 4 scales seek information only
on beliefs associated with adherence (2) and Group 5 scales seek information on barriers
and beliefs associated with adherence (5).
Thirty of 43 scales contained items that asked specific questions about medication-taking
behaviour (Group 1 and 2). Most of these adherence scales measure the number of doses
taken12,42,181,184-186,189,195,196,199,206,208 and contain items such as “how many days over the
past month did you take less than prescribed?181” and “did you miss a tablet yesterday? 189”
Other adherence scales measuring medication-taking behaviour do so through exploring the
frequency of patients not refilling their prescription on time.185-187,190
Twenty adherence scales measuring medication-taking behaviour specified a timeframe for
the questions. The timeframe specified ranged from one day to 12
months.12,60,156,164,181,184,190-192,195,198,212 189,199,205-208,210,211
Thirty scales contained items that elicited information on barriers to, and determinants of
adherence (Group 2, 3 and 5). Some of these adherence scales are disease-specific and
thus explore common barriers that may influence adherence in these disease
populations.191,193,206-208 For example, the Pediatric Inhaler Adherence Questionnaire (PIAQ)
explores adherence in patients with asthma and assesses the patient’s difficulty in using
asthma inhalers and the cost of inhalers.208 Most of these adherence scales explore
forgetfulness as a barrier to adherence and identify some of the situations where
forgetfulness may be more common, such as when working or travelling.55,183,197,203,209 Some
adherence scales also explore physical barriers to adherence, such as vision problems,
dexterity issues and dysphagia.190,202,208
Seven scales elicited information on the patient’s beliefs about their medicines that may
relate to adherence (Group 4 and 5). These scales included items identifying beliefs that
medicines are necessary, harmful and unnatural.51,53,79,117,188,193,200 For example, the Beliefs
about Medicines Questionnaire explores whether the patient holds beliefs that their
medicines are necessary as well as whether they have any concerns about their medicines.

48
Forty of the 43 scales contained items that sought to identify aspects of adherence that are
consistent with the taxonomy provided by Vrijens et al.38 Most scales contain items that seek
to assess the extent of implementation of a dosing regimen (39/43) (Table 2.2). Thirteen of
the scales also contain items that seek to identify the discontinuation of treatment.18,185-
187,191,194,198,202,205,206,211,286,288 The DAI contained items that sought information on
discontinuation (alone),53 and the SOCA scale identified the initiation of treatment.212 Three
adherence scales do not contain any items that seek to identify the initiation, implementation
or discontinuation of treatment.117,188,209
Administration of the scales
The adherence scales have been administered in different ways. Indeed, for the scales with
more than one validation or correlation study, the additional studies often administered the
scale in a slightly different way. Details of who completed the scale (i.e. patient, clinician or
researcher) and where the scale was administered are provided in Table 2.3. There was a
roughly even split between studies that requested the patient to complete the scale and
those that had the researcher or clinician complete the scale in consultation with the patient.
The location of administration (clinic, home, via telephone or internet) varied between the
scales (as reported in Table 2.3). The time to complete the scale was reported in eight of
the 43 adherence scales. Reported times varied from less than five minutes79,191,198,208 to
approximately 25 minutes (Table 2.2).200 The scales taking less than five minutes to
complete consisted of 4 to 14 items. Twelve minutes was required to complete a 19-item
scale and 25 minutes to complete a 25-item scale.200,287

49
Table 2.3 Self-report adherence scales - administration, response and validation
Self-Report
Adherence Scale
Reference
Number
How Scale was
Administered
Response
Rate
Internal
Consistency
Sensitivity Specificity Correlation
(Criterion
Validity)
Comparison
Measure of
Adherence
Sample
Size
GROUP 1: Medication-Taking Behaviour
Adherence Self-
Report
Questionnaire
(ASRQ)
184
289
Clinician-administered
(Other HCP)
Clinician-administered
(Primary physician)
Not
reported
53%
Not reported
Not reported
Not reported
Not reported
Not reported
Not reported
Significant
Not
significant
Electronic
monitoring
(MEMS)
MEMS and Other
scale (VAS)
245
78
Adherence Visual
Analogue Scale
(VAS)
Computerised
164 Self-administered
(Home, Internet)
Not
reported
Not reported Not reported Not reported Significant Dose counts and
Clinical outcome
(Viral load)
290
Brief Adherence
Rating Scale
(BARS)
181 Researcher-
administered (Clinic)
Not
reported
α = 0.92 0.73 0.74 Significant MEMS 61
Barroso et al. 30-
day Adherence
Question
60 Researcher-
administered (Clinic)
Not
reported
Not reported Not reported Not reported Significant Clinical outcome
(Viral load)
93
Bell et al.
Adherence
Question
189 Self-administered
(Clinic, Absent)
80% Not reported Not reported Not reported Not
significant
MEMS and Dose
count
80

50
Centre for
Adherence
Support
Evaluation
(CASE)
Adherence Index
192 Clinician-administered
(Primary physician)
Not
reported
Not reported 0.70 0.71 Significant Clinical outcome
(Viral load) and
Self-report
524
Gehi et al.
Adherence
Question
12 Researcher-
administered (Clinic)
Not
reported
Not reported Not reported Not reported Significant Clinical outcome
(Cardiovascular
events)
1015
Grymonpre et al.
Adherence
Question
196 Researcher-
administered (Home)
Not
reported
Not reported Not reported Not reported Significant Pharmacy records
and Dose counts
135
Kerr et al.
Question
199 Researcher-
administered (Clinic)
Not
reported
Not reported Not reported Not reported Not
significant
Pharmacy records 88
Medication
Adherence
Report Scale – 5
(MARS-5) 127
5
286
Clinician-administered
(Primary physician)
Self-administered
(Clinic, Present)
Not
reported
Not
reported
Not reported
α = 0.78
0.085
Not reported
0.97
Not reported
Not
significant
Significant
Pharmacy records
Drug levels and
Self-report
128
255
Stages of
Change for
Adherence
(SOCA)
212 Self-administered
(Clinic, Absent)
Not
reported
Not reported Not reported Not reported Significant MEMS and Other
scale (BMAS)
731
GROUP 2: Medication-Taking Behaviour AND Barriers
Adherence to
Refills and
Medications
Scale (ARMS)
187 Researcher-
administered (Clinic)
89% α = 0.81 Not reported Not reported Significant Clinical outcome
(BP control),
Pharmacy records
and Scale (MAQ)
435

51
Adherence Starts
with Knowledge-
12 (ASK-12)
185 Self-administered
(Clinic, Absent)
Not
reported
α = 0.75 Not reported Not reported Significant Pharmacy record
and Other scale
(MAQ)
112
Adherence Starts
with Knowledge-
20 (ASK-20)
186
290
Self-administered
(Home, Internet)
Self-administered
(Clinic, Present)
Not
reported
Not
reported
α = 0.85
α = 0.76
Not reported
Not reported
Not reported
Not reported
Significant
Significant
(Scale only)
Self-report
Pharmacy records
and Scale (MAQ)
605
112
Brief Medication
Questionnaire
190 Researcher-
administered (Clinic)
92% Not reported 0.80 1.00 Significant MEMS 43
Brooks
Medication
Adherence Scale
(BMAS)
191
291
Self-administered
(Unclear)
Self-administered
(Home)
86%
63%
α = 0.69
α = 0.86
Not reported
Not reported
Not reported
Not reported
-
Significant
Nil
Pharmacy records
and Self-report
294
98
Choo et. al. 5-
item
Questionnaire
156 Researcher-
administered
(Telephone)
Not
reported
Not reported Not reported Not reported Significant MEMS 286
Fodor et al.
Adherence
Questionnaire
194 Researcher-
administered (Clinic)
Not
reported
Not reported Not reported Not reported Significant Clinical outcome
(BP control)
359
Godin et al. Self-
Reported
Adherence
Questionnaire
195 Self-administered
(Clinic, Absent)
Not
reported
Not reported 0.71 0.72 Not
significant
Clinical outcome
(Viral
suppression)
256
Hill-Bone
Compliance
Scale – 10
55 Researcher- and self-
administered (Clinic)
Not
reported
α = 0.79 Not reported Not reported Significant Clinical outcome
(BP control)
98

52
Hill-Bone
Compliance
Scale – 14
197 Researcher- and self-
administered (Clinic)
Not
reported
α = 0.84 Not reported Not reported Significant Clinical outcome
(BP control)
718
Immunosuppress
ant Therapy
Adherence Scale
(ITAS)
198 Self-administered
(Home)
91% α = 0.81 Not reported Not reported Significant
(all)
Pharmacy
records, Drug
levels and Clinical
outcome
(Rejection)
222
Medication
Adherence
Assessment Tool
(MAAT)
201 Self-administered
(Clinic)
29% α = 0.80 Not reported Not reported Significant Pharmacy records 289
Morisky
Medication
Adherence Scale
(MMAS)
205
158
292
Researcher-
administered (Clinic)
Self-administered
(Unclear)
Researcher-
administered (Clinic)
98%
66%
82%
α = 0.83
Not reported
α = 0.56
0.93
Not reported
0.73
0.53
Not reported
0.36
Significant
Significant
Significant
Clinical outcome
(BP control)
Pharmacy records
Pharmacy records
1367
87
151
Osteoporosis-
Specific Morisky
Medication
Adherence Scale
(OS-MMAS)
206 Self-administered
(Home)
39% α = 0.82 Not reported Not reported Significant
Other scale
(Beliefs about
Medicines
Questionnaire)
197
Pediatric Inhaler
Adherence
Questionnaire
(PIAQ)
208 Self-administered
(Clinic, Absent)
Not
reported
Not reported 0.63 0.91
Significant Dose counts 64

53
Reported
Adherence to
Medicine (RAM)
Scale
117
42
Self-administered
(Clinic, Absent)
Self-administered
(Home)
Not
reported
Not
reported
α = 0.72
Not reported
Not reported
Not reported
Not reported
Not reported
-
Significant
Nil
Other scale
(Beliefs about
Medicines
Questionnaire)
524
271
Self-Reported
Adherence
(SERAD)
Questionnaire
210 Researcher-
administered (Clinic)
Not
reported
Not reported Not reported Not reported Significant
(all)
MEMS, Dose
counts and Drug
levels
530
Simplified
Medication
Adherence
Questionnaire
(SMAQ)
211 Clinician-administered
(Primary physician)
Not
reported
α = 0.75 0.72 0.91 Significant
(all)
Electronic
monitoring
(MEMS) and
Clinical outcome
(Viral load)
40
The Patterns of
Asthma
Medication Use
Questionnaire
207 Self-administered
(Home)
70% Not reported Not reported Not reported Significant
(all)
Pharmacy records
and Clinical
outcome
(Asthma)
176
GROUP 3: Barriers to
Adherence
Adherence
Attitude Inventory
(AAI)
183 Self-administered
(Clinic, Absent)
Not
reported
α = 0.90 Not reported Not reported Not
significant
Self-report 165

54
Medication
Adherence
Questionnaire
(MAQ)
18
293
5
294
72
295
37
296
Researcher-
administered (Clinic)
Researcher-
administered (Clinic)
Clinician-administered
(Primary physician)
Researcher-
administered (Clinic)
Researcher-
administered (Clinic)
Researcher-
administered (Home)
Researcher-
administered (Clinic)
Researcher-
administered (Clinic)
73%
Not
reported
Not
reported
Not
reported
32%
88%
Not
reported
81%
α = 0.61
α = 0.32
Not reported
Not reported
Not reported
α = 0.42
Not reported
α = 0.62
0.81
Not reported
0.32
Not reported
Not reported
Not reported
Not reported
Not reported
0.44
Not reported
0.73
Not reported
Not reported
Not reported
Not reported
Not reported
Significant
Significant
Not
significant
Significant
Significant
Not
significant
Significant
Significant
Clinical outcome
(BP control)
Pharmacy records
Pharmacy records
MEMS, Dose
counts and Drug
levels
Clinical outcome
(Diabetes control)
Dose counts
Dose counts
Clinical outcome
(Diabetes control)
290
377
128
385
186
319
413
294
Medication
Adherence Self-
Efficacy Scale
(MASES)
203 Self-administered
(Unclear)
Not
reported
α = 0.95 Not reported Not reported Not
significant
Clinical outcome
(BP control)
72

55
Medication
Adherence Self-
Efficacy Scale
Revised
(MASES-R)
204 Self-administered
(Clinic, Present)
Not
reported
α = 0.91 Not reported Not reported Significant MEMS and Other
scale (MAQ)
168
Medication
Adherence
Reasons Scale
202 Self-administered
(Home, Internet)
Not
reported
α = 0.65 Not reported Not reported Significant Other scale
(MAQ)
840
Self-Efficacy for
Appropriate
Medication Use
Scale (SEAMS)
209 Self-administered
(Clinic)
Not
reported
α = 0.89 Not reported Not reported Significant Other scale
(MAQ)
436
Beliefs about
Medicines
Questionnaire
117
4
124
89
Self-administered
(Clinic, Absent)
Self-administered
(Clinic, Absent)
Self-administered
(Clinic)
Self-administered
(Clinic, Present)
Not
reported
57%
Not
reported
93%
α = 0.70
Not reported
α = 0.73
Not reported
Not reported
Not reported
Not reported
Not reported
Not reported
Not reported
Not reported
Not reported
Significant
Significant
Significant
Significant
Other scale
(RAM)
Other scale
(MARS-5)
Other scale
(MAQ)
Other scale
(MMAS)
524
324
192
275
Drug Attitude
Inventory (DAI)
53 Self-administered
(Home)
Not
reported
α = 0.93 0.72 0.63 Significant Therapist report 150

56
Legend: Home – completed adherence scale at home; Clinic – completed adherence scale in clinic, researcher or clinician may be present or absent while patient fills out form; Telephone – patients completed
adherence scale over the telephone; Primary physician = Patient’s usual physician; Other HCP = Other health care professionals looking after patient; α = Cronbach’s alpha of reliability; BP = Blood
pressure
GROUP 5: Barriers AND
Beliefs
Beliefs and
Behaviour
Questionnaire
(BBQ)
188 Self-administered
(Home, Post)
53% α = 0.65 Not reported Not reported Significant Other scale
(MARS)
276
Brief Evaluation
of Medication
Influences and
Beliefs (BEMIB)
79 Self-administered
(Clinic, Absent)
Not
reported
α = 0.63 0.83 0.71 Not
significant
Pharmacy records
and Other scale
(DAI)
63
Compliance
Questionnaire
Rheumatology
(CQR)
193
287
Researcher-
administered (Home)
Self-administered
(Home)
Not
reported
82%
α = 0.71
Not reported
0.98
0.62
0.67
0.95
Significant
Significant
Self-report
MEMS
127
127
Maastricht
Utrecht
Adherence in
Hypertension
(MUAH)
200 Researcher-
administered (Clinic)
90% α = 0.74 Not reported Not reported Significant
(all)
MEMS, Pharmacy
records and Other
scale (Brief
Medication
Questionnaire)
255
Medication
Adherence
Report Scale
(MARS)
51
297
Self-administered
(Clinic, Absent)
Self-administered
(Clinic, Absent)
Not
reported
Not
reported
α = 0.75
α = 0.62
Not reported
Not reported
Not reported
Not reported
Significant
(Drug
levels only)
Significant
Drug levels or
Caregiver report
Caregiver report
66
277

57
Figure 2.2 illustrates the conditions in which the scales have been validated. Most of the
adherence scales have been validated in a single disease population (Figure
2.2).12,53,55,60,156,187,189-192,194,195,197-199,208,210 The Medicines Adherence Questionnaire (MAQ),
which is a simple 4-item questionnaire, has been validated in a broad range of diseases,
including hypertension, dyslipidaemia, heart failure and Parkinson’s disease.18,37,293,294

58
Figure 2.2 Disease populations used to validate self-report adherence scales

59
Approaches to assessing self-report adherence scales
Assessing the validity of self-report adherence scales differed among the 60 included
studies. Details of the studies, assessment of internal consistency, comparison measures
and whether the scale was significantly correlated to the comparison measure is provided
in Table 2.3. Similar approaches to validation were seen from scales with similar content.
Medication-taking behaviour
The primary method for assessing Group 1 and Group 2 scales was to determine the
correlation between the scale and an objective measure of adherence. Twenty-eight of the
30 scales included in Group 1 and 2 assessed how well the scale correlated with an objective
measure of adherence, eight of these scales have been assessed against MEMS and 12
against clinical outcomes (Figure 2.3).

60
Figure 2.3 Comparison measures of medication-taking behaviour used to validate the self-report adherence scales

61
Barriers and beliefs
Scales in Groups 3–5 were more likely to rely on alternative approaches to validation.
Content validity was typically assessed via a panel of subject matter experts. A range of
approaches were utilised for construct validity, including item analysis against tools validated
to elicit specific types of health beliefs and factor analyses of responses to other scales or
semi-structured interviews.
Three of the six Group 3 scales (scales that contain items that elicit information on barriers
to adherence only) have been assessed against an objective measure of adherence (one
using MEMS, one using clinical outcomes and one using MEMS and clinical outcomes). All
six of these scales have been tested for content validity18,183,202-204,209 and four have also
been tested for construct validity.18,183,202,203
Adherence scales that solely focus on eliciting information regarding a patient’s beliefs about
their medicines (Group 4) have not been assessed against objective measures of adherence.
The Beliefs about Medicines Questionnaire and DAI have been significantly correlated with
other adherence scales (Table 2.3). Both scales have been tested for content validity, in
addition the Beliefs about Medicines Questionnaire has also been tested for construct
validity.53,117
Two out of the five Group 5 scales (beliefs and barriers) have assessed the correlation
between the scale and an objective measure of adherence (both against MEMS). All five of
the adherence scales have been correlated with subjective measures: other scale (n=3),
self-report (n=1) and caregiver reports (n=1). Four of these adherence scales have also
been correlated with objective measures of adherence (Figure 2.3). All of these adherence
scales have been tested for content validity and three (BBQ, BEMIB and MARS-10) have
been tested for construct validity.51,79,188
Identifying Non-Adherence
Many self-report adherence scales have recommended cut-offs for identifying non-adherent
patients. Twenty-eight scales categorised medication adherence by determining the overall
score and separating the population into two groups: adherent and non-
adherent.12,42,53,60,79,156,181,183,185-187,189,191-199,201,204,207-211 Where reported, the cut-off point to
identify non-adherence is most commonly the score that corresponds to patients that took
80% of their medicines as ascertained by an objective measure of adherence such as
62
MEMS. Some scales, such as the Beliefs and Behaviour Questionnaire (BBQ),188 suggest
a cut-off point that corresponds to the score of another self-report adherence scale which
has been seen to correspond to patients that took 80% of their medicines according to an
objective measure. Other adherence scales, such as the DAI, AAI and MASES-R first split
the population into adherent and non-adherent based upon responses to questions about
whether medicines were taken or not, and then compared the mean scores of the adherence
scales to determine the cut-off.53,183,204 The SERAD and Gehi et al. Adherence Question
contain direct medication-taking behaviour questions and answers to these questions are
utilised to determine the percentage of adherence and thus dichotomise adherence.12,210
A small number of adherence scales have taken a different approach at assigning the
adherence cut-off. The MAQ, MMAS, Brief Medication Questionnaire, ASRQ and VAS
divided non-adherence into more than two groups, ranging from three to
seven.18,164,184,190,205 This categorisation further differentiated between different levels of
patient’s adherence to their medicines. The MAQ and MMAS categorised the population into
high, medium and low levels of adherence.18,205 The MMAS cut-off points were selected
based on the correlation with blood pressure control. The Brief Medication Questionnaire
grouped the study population into repeat, sporadic and no non-adherence.190 The ASRQ
and VAS classified non-adherence into six and seven levels, respectively based on the
researchers’ expertise.164,184
A small number of scales (12) have assessed the sensitivity and specificity of their cut-off
against an objective measure of adherence. The results of these studies are reported in
Table 2.3.
2.2.5 Discussion
We identified 43 adherence scales that have been correlated with a comparison measure of
adherence. The identified adherence scales elicit information regarding different facets of
adherence including medication-taking behaviour, barriers to and determinants of
adherence and beliefs associated with adherence. This information, where accurate, can be
put to different uses. Self-report adherence scales can (i) measure medication-taking
behaviour, where use of the scale either complements objective measures, or is used as an
alternative to objective measures and/or (ii) identify reasons for a patient’s non-adherence,
by identifying patient-specific barriers or beliefs that impede adherence. The data obtained

63
in this systematic review provides information on how well specific adherence scales can be
expected to perform these tasks.
Most of the scales identified as Group 1–3 focus on measuring medication-taking behaviour
by asking direct questions about medication-taking behaviour or eliciting barriers to good
medication-taking behaviour. Group 3 scales focus on barriers to adherence and have the
potential to both measure medication-taking behaviour and identify barriers to adherence.
The purpose of some Group 3 scales is to measure medication-taking behaviour by eliciting
information on barriers, as opposed to providing a comprehensive assessment of patient
barriers to adherence. The Medication Adherence Questionnaire (MAQ), for example, is a
short four-item Group 3 scale that has been well validated against objective measures of
adherence. The demonstration of a significant correlation between the adherence scale and
a suitable objective measure in patients with the same disease seems a reasonable minimal
requirement on the use of a scale as an alternative to an objective measure. Of the 36 Group
1–3 adherence scales, 20 have been significantly correlated with either MEMS or clinical
outcomes. Nine of the 36 adherence scales exploring medication-taking behaviour
significantly correlated with the MEMS. The MEMS can record the time of dose actuation
and can provide detailed information on medication-taking behaviour over time.165-167 Fifteen
Group 1–3 adherence scales have been correlated with clinical outcomes. Few scales have
been shown to be correlated with MEMS or clinical outcomes in multiple disease states,
making the choice of a scale more difficult in patient groups other than those included in the
validation studies.
A link between specific levels of adherence and clinical outcomes has been demonstrated
in some disease states (e.g. HIV60,82,83 and cardiovascular disease12,67,68). For the vast
majority of disease states, however, no such link has been made. Most scales provide
suggested cut-offs for identifying “non-adherent” patients. Cut-offs permit the identification
of patients who may be non-adherent and benefit from education or support. However, the
arbitrary nature of the cut-offs provided for most self-report adherence scales needs to be
kept in mind. Dichotomising adherence does not differentiate between types of non-
adherence, repeat versus sporadic adherence or patients at different stages of the
medication-taking process. Recent taxonomies of adherence recognise the dynamic nature
of patient medication-taking behaviour. Vrijens et al. acknowledges that the process of
medication-taking starts when the patient takes the first dose of medicine (initiation)
continues with the implementation of the regimen and ends when the patient discontinues
the medicine.38 Gearing et al. proposes a six-phase dynamic model of adherence: treatment

64
initiation, treatment trial, partial treatment acceptance, intermittent treatment adoption,
premature discontinuation and adherent.19 An important area for future research is the use
of self-report adherence scales to identify the different types of non-adherence suggested
by Vrijens et al. 38 and Gearing et al.19
A substantial number of scales have been validated against clinical outcomes, but no direct
measure of medication-taking behaviour such as MEMS; examples include the Barroso 30-
day Adherence Question and the Hill-Bone Compliance Scales. A demonstrated correlation
between a self-report adherence scale and clinical outcomes in a specific patient population
has relatively clear benefits for use of the scale in similar populations of patients. Knowing
when this evidence is transferrable into new populations of patients, however, is challenging.
For most disease states there are influences on clinical outcomes in addition to medication-
taking behaviour. Factors that influence clinical outcomes play a part in addition to the many
factors that may separate measures of adherence by self-report adherence scales from
actual medication-taking behaviour. No doubt some of these scales have focused on clinical
outcomes due to the availability of clinical data and the relative cost or availability of MEMS.
However, validation of a scale against both clinical outcomes and direct measures of
medication-taking behaviour is beneficial.
Scales included in Group 2 to 5 include items that elicit reasons a patient may be non-
adherent. These scales may identify barriers the patient is experiencing to good medication-
taking behaviour, and any patient-specific beliefs about their medicines that may influence
adherence. While some Group 3 scales focus more on measuring medication-taking
behaviour (e.g. the Medication Adherence Questionnaire (MAQ)), others seek more detailed
information on barriers that an individual may be experiencing (e.g. the Pediatric Inhaler
Adherence Questionnaire). Scales included in Group 4 and 5 seek to identify patient beliefs
about medicines that may influence adherence. Of these scales, the most extensively
assessed is the Beliefs about Medicines Questionnaire (BMQ). The BMQ-Specific identifies
whether patients hold the belief that their medicine is necessary as well as whether the
patient has concerns about their medicine.
Scales that focus on identifying reasons for non-adherence appropriately employ validation
strategies focused on content and construct validity. The BMQ is a good example of a self-
report adherence scale focused on measuring an aspect of adherence other than
medication-taking behaviour. The items of the BMQ have been validated through
confirmatory principle components analysis and the criterion and divergent validity assessed
against similar items in the Illness Perceptions Questionnaire and the Sensitive Soma

65
Scale.117 The BMQ-Specific has been shown to correlate well with medication-taking
behaviour measured by self-report adherence scales. Patients who believe their medicine
to be necessary and have fewer concerns have consistently been shown to be more
adherent in a range of diseases.95,127-130
Scales such as the BMQ are not stand-alone comprehensive adherence scales. But, like
scales that focus on identifying barriers to adherence, they provide the opportunity for a
more comprehensive assessment of a patient’s adherence—and the drivers behind that
adherence—than subjective or objective measures that focus on measuring medication-
taking behaviour. The information provided by self-report adherence scales that seek to
identify barriers and beliefs that are influencing adherence may prove useful in addition to
accurate information on the patient’s medication-taking behaviour. Specifically, these scales
may help inform tailored interventions to improve medication adherence, but their use for
this purpose is yet to be assessed.
Limitations
This systematic review only included studies of self-report adherence scales that included a
comparison measure of medication-taking behaviour. This was deemed appropriate given
the importance of measuring medication-taking behaviour in assessing adherence. A
consequence of this criterion is that this study does not provide a comprehensive analysis
of the validation of self-report adherence scales.
2.2.6 Conclusions
Self-report adherence scales have the potential to measure both medication-taking
behaviour, and identify barriers and beliefs associated with adherence. Selecting an
adherence scale requires consideration of what the adherence scale measures and how
well it has been validated. Research on validating and using the existing adherence scales
as a measure for medication-taking behaviour is relatively strong. There has been less focus
on assessing how information gained from scales that identify patient-specific barriers and
beliefs associated with adherence may be used to support wise medicine use. This presents
an important and exciting avenue for further research.

66
2.3 Additional Notes
Since publishing the systematic review on validated medication adherence scales in the
British Journal of Clinical Pharmacology (BJCP), a number of new adherence scales have
been developed. The Reasoning and Regulating Medication Adherence Instrument is
currently in the initial stages of development testing. This 16-item adherence scale is
designed to identify barriers to adherent behaviour in patients with coronary artery
disease.298 Krousel-Wood et al. recently developed a four-item adherence scale and
validated the scale in patients with uncontrolled hypertension against the MMAS and Hill-
Bone Compliance Scale. This adherence scale measures both medication-taking behaviour
and barriers to adherence.299 A new adherence scale was developed to assess a number
of structural barriers to adherence in patients prescribed antiretroviral therapy. The barriers
to adherence identified using this adherence scale included stigmatism from others,
forgetfulness, preference to use complementary medicines and cost barriers.300 The
Adherence Barriers Questionnaire was recently developed to identify barriers to adherence
and has been validated in participants with atrial fibrillation.301 Kleepe et al. developed the
Probabilistic Medication Adherence Scale and validated in elderly patients taking chronic
medications.302 A number of the adherence scales in the systematic review, such as the
MARS and OS-MMAS have been further validated.303,304
2.4 Summary
Self-report adherence scales have the potential to measure medication-taking behaviour,
and/or identify some of the barriers and beliefs that may be associated with adherence.
Selecting an adherence scale requires consideration of what the adherence scale measures
and how well it has been validated. Research on validating and using the existing self-report
adherence scales as a measure of medication-taking behaviour is relatively strong. There
has been less focus on assessing how information gained from scales that identify patient-
specific barriers and beliefs associated with adherence may be used to support wise
medicine use. This presents an important and exciting avenue for further research. Chapter
Three presents the methods of the randomised controlled trial of a targeted and tailored
intervention to improve adherence and how the MAQ and BMQ-S are integrated within this
intervention.

67
CHAPTER THREE: METHODS OF RANDOMISED CONTROLLED TRIAL TO IMPROVE MEDICATION ADHERENCE
3.1 Introduction
Improving adherence to medications can reduce the risk of adverse health outcomes and
health care expenditure (Section 1.3). Insight into the patient’s medication-taking behaviour
and reasons for behaviour may aid the implementation of tailored strategies to support
patients to adhere to their medications. There are many objective and subjective measures
of adherence that can provide information in relation to a patient’s medication-taking
behaviour.15,231,245,256,268 Objective measures of adherence, include electronic monitoring of
medication administration (e.g. Medication Event Monitoring System, MEMS), prescription
records and dose counts. These measures are often good at measuring medication-taking
behaviour, but can be expensive, labour-intensive and do not provide information on
reasons for behaviour. Subjective measures of adherence include physician reports, self-
report and adherence scales. Subjective measures are prone to recall and social desirability
bias, but they are often easy to administer and provide the opportunity to explore why the
patient may be non-adherent.
Many interventions have been implemented to improve adherence to medications, including:
reminder systems (text reminders, dose administration aids); behavioural-counselling
(motivational interviewing); social support (peer support therapy); cognitive-educational
(verbal information) and measurement-guided management (Section 1.6).214,305 Many
adherence interventions have failed to improve adherence to medications and clinical
outcomes when tested in clinical trials.13-15,217 A systematic review by Haynes et al., found
36 out of 83 interventions improved adherence to a chronic medication and only 25 of the
interventions were shown to improve a clinical outcome.306 One of the challenges in this
area is that few studies of adherence interventions are sufficiently powered to show benefit
in important clinical outcomes. These studies may be reported as a negative result despite
an improvement in measures of adherence.306
Further reasons for the lack of success seen when assessing adherence interventions in
clinical studies are that many have not been targeted to participants who are non-

68
adherent215,221,225,227,229 or tailored to the participant-specific reasons for non-
adherence.13,15,217,223 Although a targeted and tailored approach to improve medication
adherence has been suggested in the literature,1,126,187,203 few studies to date have adopted
this approach.216,247 Measurement-Guided Medication Management (MGMM), which uses
electronic data on the patients’ medication-taking behaviour from MEMS to inform
discussion between the patient and their health professional about potential barriers to
adherence, is a good example of a targeted and tailored approach that has been observed
to improve medication adherence.214 We conducted a systematic review on validated
adherence scales (Chapter Two), and found that adherence scales were relatively easy to
administer and may elicit information in addition to medication-taking behaviour, such as
barriers to adherence and beliefs associated with adherence.213 A number of adherence
scales may be selected to identify key aspects of adherence required for the study. We
believe that validated adherence scales can be used to inform a measurement-guided
medication management approach to adherence in a way that is very similar to how MEMS
has been used.
This chapter will describe the methods of a randomised controlled trial of a targeted and
tailored intervention to improve adherence to cardiovascular medications. We chose
cardiovascular medications for this study because cardiovascular disease is a great burden
on society, particularly in developed countries.1 Over 50% of patients on cardiovascular
medications are non-adherent,7,65 resulting in increased hospital admissions and
cardiovascular events (See Section 1.3.2). Other risk factors for cardiovascular disease
include dyslipidaemia, hypertension and hyperglycaemia. Diabetes is considered a strong
independent risk factor for cardiovascular disease and as described in section 1.3.2, non-
adherence to diabetic medications resulting in hyperglycaemia increases the likelihood of
people developing cardiovascular disease.1,72,73 Therefore due to the close link between
medication non-adherence in these diseases and poor clinical outcomes, it was decided that
our target population should include both cardiovascular and diabetes medications.
3.2 Aims and Hypotheses
The primary aim of the study was to determine if a targeted and tailored intervention based
on a discussion informed by validated adherence scales, would improve adherence to a
recently initiated cardiovascular medication.
69
The secondary aims of the study were exploratory. We hoped to learn about changes in
adherence over time, in the groups studied.
It was hypothesised that:
H1 Targeting and tailoring an intervention based on a discussion informed by adherence
scales in participants identified as non-adherent using the MAQ, will improve adherence at
three months.
H2 Improvements in adherence at three months, identified by the MAQ, will be sustained at
six months.
H3 Adherence, and reasons for non-adherence, will change over time in all groups studied.
3.3 Methods
This was a randomised controlled trial recruiting participants who recently initiated a
medicine for chronic cardiovascular disease (hypertension, dyslipidaemia, type II diabetes
and other cardiovascular diseases). The recruitment of participants occurred between the
25th of March, 2013 and 24th July, 2013 at one of two community pharmacies in Brisbane.
Participants were followed for six months from recruitment, the last participant contact
occurring on the 10th February, 2014. This trial is registered on the Australian New Zealand
Clinical Trials Registry, which can be accessed at http://www.anzctr.org.au/ using trial ID
ACTRN12613000162718. Ethical approval was obtained from the School of Pharmacy
Ethics Committee, University of Queensland (approval number 92013/5) (Appendix A).
3.3.1 Setting
Participants were recruited from two community pharmacies in Brisbane, Australia. The two
pharmacies were selected based on convenience as the researcher has an established
relationship with these pharmacies. The pharmacies selected for participation in the study
serviced a broad range of patients with chronic diseases. These pharmacies were
approached by the researcher and were provided with information on the study. Once the
pharmacies agreed to the study taking place, the dates for participant recruitment were
organised.

70
Individuals waiting in the pharmacy for their prescription(s) to be dispensed were recruited
by the researcher. The researcher asked the individual if they were willing to take part in a
study and if they agreed to participate, the individual was provided with verbal and written
information about the study. If the individual still wished to participate in the study after reading
the provided information (Appendix B), written informed consent (Appendix C) was obtained.
Participants were interviewed in the semi-private counselling area of the pharmacies.
3.3.2 Inclusion Criteria
The inclusion of an individual in the study depended on the individual’s attendance at one
of the selected pharmacies on the days that the researcher was present at the pharmacy.
Individuals who were over 18 years of age, who were recently prescribed a medication for
hypertension, type 2 diabetes, dyslipidaemia or other cardiovascular diseases (myocardial
infarction, heart failure, arrhythmias, and stroke) within the last four to 12 weeks were
included in the study. If multiple medications were prescribed within the last four to 12 weeks,
then the most recently initiated medication was selected. This standardises the sample as
all participants would be at a similar phase of taking their medicine. All participants would
have had the opportunity to take their recently initiated medicine for at least four weeks and
thus have some experience with their medicine. Individuals were approached if they had
recently initiated an ACE inhibitor, angiotensin II receptor antagonist, calcium channel
blocker, lipid-lowering agent or an oral hypoglycaemic drug. Clinical practice guidelines were
taken into account and participants recently initiated on a diuretic for hypertension were not
included in the study. Individuals who were unable to complete the survey tool were
excluded from the study.
3.3.3 Participant Interviews
The Medication Adherence Questionnaire (MAQ) was used to identify medication-taking
behaviour based on the MAQ score. Participants with a MAQ score of zero were classified
as adherent and were enrolled and followed for six months. Participants with a MAQ score
of 1 to 4 were classified as non-adherent. Non-adherent participants were then randomised

71
into either the intervention or control group, using block randomisation and followed for six
months (Figure 3.1). The random allocation sequence was generated by an internet-based
randomisation software (Research Randomiser). The block size was ten, providing an
allocation ratio of 1:1 (e.g. ABBABABAAB). The intervention group received a tailored
intervention at baseline to improve medication adherence. Due to the nature of the
intervention, neither the researcher, nor the participants were blinded to the allocation at the
baseline interview. No data analysis occurred prior to completion of the study.

72
Figure 3.1 Participant flow diagram: from identifying participants’ medication-taking behaviour to final follow-up
Screened for eligibility
Enrolment of patients
ADHERENT Non-Adherent
Randomised
INTERVENTION CONTROL
Follow-Up
at 3 months
Follow-Up
at 3 months
Follow-Up
at 3 months
Final Follow-Up
at 6 months
Final Follow-Up
at 6 months
Final Follow-Up
at 6 months

73
All interviews were conducted by the principal researcher (TN), who is a registered
pharmacist. The researcher (TN) conducted the initial interview and follow-up telephone
calls at three and six months. The survey instruments used in the interview included the:
MAQ, Beliefs about Medicines Questionnaire – Specific (BMQ-S) and Brief Illness
Perception Questionnaire (BIPQ). Field notes were taken during the interviews.
Baseline demographic characteristics of the participants were also collected (Appendix D).
All participants were followed for six months with telephone interviews at three- and six-
month time points to complete the same three validated scales: the MAQ, BMQ-S and BIPQ.
Medication Adherence Questionnaire (MAQ)
The four-item MAQ was selected because it has been well-validated to identify adherence
in a number of chronic cardiovascular disease populations and scores have been shown to
correlate well with a range of objective adherence measures, as described in Chapter
Two.18,72,293,296 The MAQ has also been used to explore reasons for non-adherent
behaviour.18 Specifically, the MAQ has been used to identify unintentional non-adherence,
intentional non-adherence or a mix of both.49
Participants answering no to all items of the MAQ (MAQ score = 0) were identified as
adherent to their medicine (Table 3.1).72,95,204,307 These participants were followed for six
months in the “adherent” group. Participants answering yes to at least one of the MAQ items
(MAQ score = 1 to 4) were identified as “non-adherent” and were randomised to either the
intervention or control group. This cut-off was chosen for the study because it has been used
in the literature in previous studies,72,95,204,307 and the cut-off at this value provides a highly
sensitive tool for identifying medication non-adherence. It should be noted that the MAQ was
used as a measure of adherence, and does not differentiate between frequently missed
doses and occasional missed doses.
Participant responses to the MAQ were also used to identify the participant’s reasons for
non-adherence, for instance: unintentional non-adherence due to being forgetful or careless,
or intentional non-adherence by ceasing their medicines when they felt better or worse and,
a mix of both types (Table 3.1).
Unintentional non-adherence: participant answers yes to items 1 or 2 and no to both items
3 and 4

74
Intentional non-adherence: participant answers no to both items 1 and 2 and yes to items 3
or 4
Both types (mixed): participant answers yes to items 1 or 2 and also yes for items 3 or 4
Table 3.1 The Medication Adherence Questionnaire (MAQ)
Item Question YES NO Score
1 Do you ever forget to take your medicine?
2 Are you careless at times about taking your medicine?
3 When you feel better, do you sometimes stop taking your
medicine?
4 Sometimes, if you feel worse when you take the
medicine, do you stop taking it?
Morisky DE, Green LW, Levine DM. Concurrent and predictive validity of a self-reported measure of medication
adherence. Med Care 1986;24(1):67-74.
Beliefs about Medicines Questionnaire – Specific (BMQ-S)
The BMQ-S has been validated in many disease populations, including hypertension,
coronary heart disease, asthma and depression, as shown in Chapter Two (Table 3.2).117,124
The BMQ-S elicits an individual’s beliefs about their medicines in the domains of necessity
of medicines and concerns about medicines. In general, individuals who have strong
concerns about their medicines or believe their medicines are not necessary tend to be less
adherent.4,117,126,131,153
All participants were interviewed using the BMQ-S to measure perceived necessity of and
concerns about medicines.117 The BMQ-S consists of ten statements about medicines: five
of the statements are related to beliefs about the necessity of medicines and the remaining
five statements are related to concerns that individuals may have about their medicines.
Statements 1, 3, 4, 7 and 10 refer to beliefs that medicines are necessary and statements
2, 5, 6, 8 and 9 refer to concerns about medicines (Table 3.2). The participants rated each

75
of the statements on a five-point Likert scale: strongly agree, agree, uncertain, disagree and
strongly disagree. The responses for each statement were scored as follows: strongly agree
= 5, agree = 4, uncertain = 3, disagree = 2 and strongly disagree= 1. Therefore, the scores
for the necessity or concerns domains range from 5 to 25. The information obtained from
the BMQ-S further informed the discussion to help tailor the adherence support strategy to
the participant based on their necessity and/or concerns score and therefore their beliefs
towards their medicines.

76
Table 3.2 The Beliefs about Medicines Questionnaire - Specific (BMQ-S)
Item Statement Strongly
Agree
Agree Uncertain Disagree Strongly
Disagree
1 My health at present,
depends on my medicines
2 Having to take medicines
worries me
3 My life would be impossible
without my medicines
4 Without my medicines I
would be very ill
5 I sometimes worry about
long-term effects of my
medicines
6 My medicines are a mystery
to me
7 My health in the future will
depend on my medicines
8 My medicines disrupt my life
9 I sometimes worry about
becoming too dependent on
my medicines
10 My medicines protect me
from becoming worse
Horne R, Weinman J, Hankins M. The Beliefs about Medicines Questionnaire: the development and evaluation
of a new method for assessing the cognitive representation of medication. Psychol Health 1999;14(1):1-24.

77
Brief Illness Perception Questionnaire (BIPQ)
Illness representations identified in the BIPQ has been associated with adherence to
medications.135,139 For example, patients with hypertension were more likely to be adherent
if they felt they had good control over their illness, better understanding of their illness and
were not emotionally affected by their illness. The BIPQ consists of nine items that assess
the cognitive and emotional representations of illness.139 The first eight items were rated on
a scale of 0 to 10 (Table 3.3). This questionnaire provided insight into a participant’s
perceptions and understanding of their illness and treatment. The participant’s perceptions
and understanding of their illness and treatment was elicited to explore why the participant
may be non-adherent to their medication.

78
Table 3.3 The Brief Illness Perception Questionnaire
How much does your illness affect your life? 0 1 2 3 4 5 6 7 8 9 10 no affect severely affects at all life
How long do you think your illness will continue? 0 1 2 3 4 5 6 7 8 9 10 a very forever short time
How much control do you feel you have over your illness? 0 1 2 3 4 5 6 7 8 9 10 absolutely extreme no control amount of control
How much do you think your treatment can help your illness? 0 1 2 3 4 5 6 7 8 9 10 not at all extremely helpful
How much do you experience symptoms from your illness? 0 1 2 3 4 5 6 7 8 9 10 no symptoms many severe at all symptoms
How concerned are you about your illness? 0 1 2 3 4 5 6 7 8 9 10 not at all extremely concerned concerned
How well do you feel you understand your illness? 0 1 2 3 4 5 6 7 8 9 10 don’t understand understand at all very clearly
How much does your illness affect you emotionally? (e.g. does it make you angry, scared, upset or depressed? 0 1 2 3 4 5 6 7 8 9 10 not at all extremely affected emotionally affected emotionally
Please list in rank-order the three most important factors that you believe caused your illness. The most important causes for me: 1. ________________ 2. _________________ 3. __________________
Broadbent E, Petrie KJ, Main J, Weinman J. The brief illness perception questionnaire. J Psychosom Res
2006;60(6):631-7.
79
3.3.4 Intervention
This study employed a form of measurement-guided medication management to improve
adherence (Section 1.6.2). The intervention consisted of the following. Non-adherent
participants were identified using the MAQ. The participant’s type and reasons for non-
adherence were explored using their responses to the MAQ, BMQ-S and BIPQ. Where
possible the researcher used responses to the adherence scales to prompt further
discussion regarding the participant’s adherence and the factors that supported or impeded
them to take their medicine. Any issues with the participant’s other medications that were
brought up during the interview were discussed and formed part of the individualised
conversation with the participant. Any issues that could not be resolved were referred to the
pharmacist on duty in each pharmacy (See case examples in Chapter Five for more details).
From the information discussed in the interview, the researcher and participant then selected
and implemented a strategy from an evidence-based toolkit (based on literature review,
Section 1.6) to support the participant’s adherence. The evidence-based toolkit consisted of
strategies shown to improve adherence in specific situations. For example, some
participants who stated they forget to take their medicine on the MAQ may be asked: How
often they forget? Where they store their medicines? Or why they think they forget to take
their medicine? This information helped determine whether the participant would benefit
from a reminder and the specific type of reminder. Participants who indicated that they
intentionally ceased their medicine on the MAQ and indicated that they had a poor perceived
understanding of their illness on the BIPQ, were asked what they knew about their illness
and/or medicine to help tailor education or information provided to them on their illness or
medicines (cognitive-educational intervention). Notes from the discussion were transcribed
immediately after the interview.
Strategies employed to support the participant’s adherence included13,14,214,305:
reminder systems (dose administration aids, dosette boxes, alarm clock reminders,
text reminders, treatment simplification);
cognitive-educational interventions (pharmacist verbal information, written
information);
reminder systems coupled with cognitive-educational interventions;
behavioural-counselling interventions (reinforcing behaviour, empowering individuals
to actively participate in their healthcare and problem-solving) and
social support interventions (family member support).

80
Case Example
Below is an example of how interventions were tailored based on the survey responses and
discussion with the participant. For in-depth discussion on how the interventions were
tailored, see Chapter Five.
A married and retired 66 year old female participant with tertiary qualifications currently takes
four prescription medications for the treatment of hypertension, dyslipidaemia and
hypothyroidism. The participant has recently started ezetimibe 10mg once daily to lower
blood cholesterol levels.
Intervention
MAQ: The participant had a MAQ score of 1 and identified as unintentionally non-adherent
due to forgetfulness.
BMQ-S: The participant’s perceived necessity beliefs outweighed her concerns about the
medicine
BIPQ: The BIPQ suggests that she perceives her medicine as highly valuable and has a
good understanding of her illness.
Discussion: To better understand her medication-taking behaviour, the participant was
asked to elaborate where she stored her medicines and circumstances when she would
forget to take her medicines. The researcher learnt that the participant stored the medicines
in many different places (e.g. a medicine in her handbag when leaving home, in the kitchen
and some in the bathroom). She often forgets to take her medicines when she is out, when
she is busy with a task and often when travelling.
Adherence Strategy: The researcher recommended keeping all her medicines together at
one convenient location. The researcher also suggested using an alarm clock to help remind
her to take medicines on time and using a dosette box, especially when travelling.

81
Summary of Intervention
The MAQ was used to identify participants who were non-adherent to their medication and
to determine whether participants were exhibiting unintentional, intentional or both types of
non-adherence. The BMQ-S elicited beliefs about medicines in regards to whether the
participant believed their medication was necessary and whether they had any concerns
towards their medication. The BIPQ was used to explore illness perceptions, such as the
effect of the illness on their lives, whether they believed their medication was helpful in
treating their illness and their understanding of their illness. The responses to the MAQ,
BMQ-S and BIPQ informed the discussion with the participant, which guided the
implementation of a tailored strategy to improve their adherence.
3.3.5 Outcome Measures
The primary outcome was the difference in the mean MAQ score between the intervention
and control group at three months. The difference in mean MAQ score between the
intervention and control group was also tested at six months. A post hoc analysis was
conducted to assess whether changes in survey responses were consistent with the specific
adherence strategy employed.
3.3.6 Sample Size
A power calculation was conducted based on the effect size observed in a hypertension
adherence study by Morisky et al.260 Morisky et al. implemented an educational intervention
to improve adherence in people with hypertension and observed a difference in mean MAQ
scores between intervention and control of 0.683, which was associated with a clinically
significant improvement in blood pressure control. For our study, a one-sided t-test was
conducted to calculate the target sample size. Forty-one participants per group (intervention
and control) provided 80% power to detect a statistically significant change in adherence at
a level of 0.05. Taking into account participants dropping out of the study, our sample size
target would be 60 per group (intervention and control).

82
3.3.7 Statistical Analyses
Baseline demographics of the intervention and control groups were compared using t-tests
for continuous data and Pearson’s Chi-squared test and Fisher’s exact tests for categorical
data.
An independent-samples t-test was conducted to compare the mean MAQ score of the
intervention and control group, based on an intention-to-treat and per protocol population
using R (version 3.0.2) statistical software, at three months and six months.
Changes in the questionnaires scores at three months and six were compared for each of
the adherent, intervention and control groups using dependent-samples t-tests.
Changes in the questionnaires scores at three and six months were also observed in the
different strategy types in the intervention group.
3.4 Summary
This chapter describes the method of the randomised controlled trial of a targeted and
tailored interventions to improve adherence in participants identified as non-adherent.
Information obtained from the MAQ, BMQ-S, BIPQ and discussion with the participant was
used to help tailor an intervention to improve adherence. Chapter Four addresses the results
of the randomised controlled trial of a targeted and tailored intervention to improve
adherence to medications in participants with chronic diseases.
83
CHAPTER FOUR: RESULTS 1 - A RANDOMISED CONTROLLED TRIAL OF A TARGETED AND TAILORED INTERVENTION TO IMPROVE MEDICATION ADHERENCE
4.1 Introduction
Chapter Three described the method of a randomised controlled trial of a targeted and
tailored intervention in participants recently initiated on a medicine for the treatment or
prevention of cardiovascular disease. The tailored strategy to improve adherence in non-
adherent participants was informed by a discussion with the participant, which was guided
by the participant’s responses to the Medication Adherence Questionnaire (MAQ), Beliefs
about Medicines Questionnaire-Specific (BMQ-S) and Brief Illness Perception
Questionnaire (BIPQ).
This chapter presents the main results of the randomised controlled trial of targeted and
tailored interventions to improve medication adherence.
Chapter Four addresses the following hypotheses:
- Hypothesis 1: Targeting and tailoring an intervention based on a discussion informed
by adherence scales in participants identified as non-adherent using the MAQ, will
improve adherence at three months.
- Hypothesis 2: Improvements in medication adherence, as measured by the MAQ, at
three months will be sustained at six months.
This chapter will report the beliefs and illness perceptions between the adherent,
intervention and control groups.
4.2 Results
A total of four hundred and eight individuals, visiting the two community pharmacies, were
assessed for eligibility, of which 152 participants were enrolled into the study (Figure 4.1).
The results from the MAQ classified 32 participants as adherent and 120 participants were

84
classified as non-adherent. Participants classified as non-adherent were randomised 1:1 to
intervention or control. At six months, there were 55 participants remaining in the
intervention group and 45 participants in the control group. The movement of participants
throughout the study is shown in Figure 4.1.
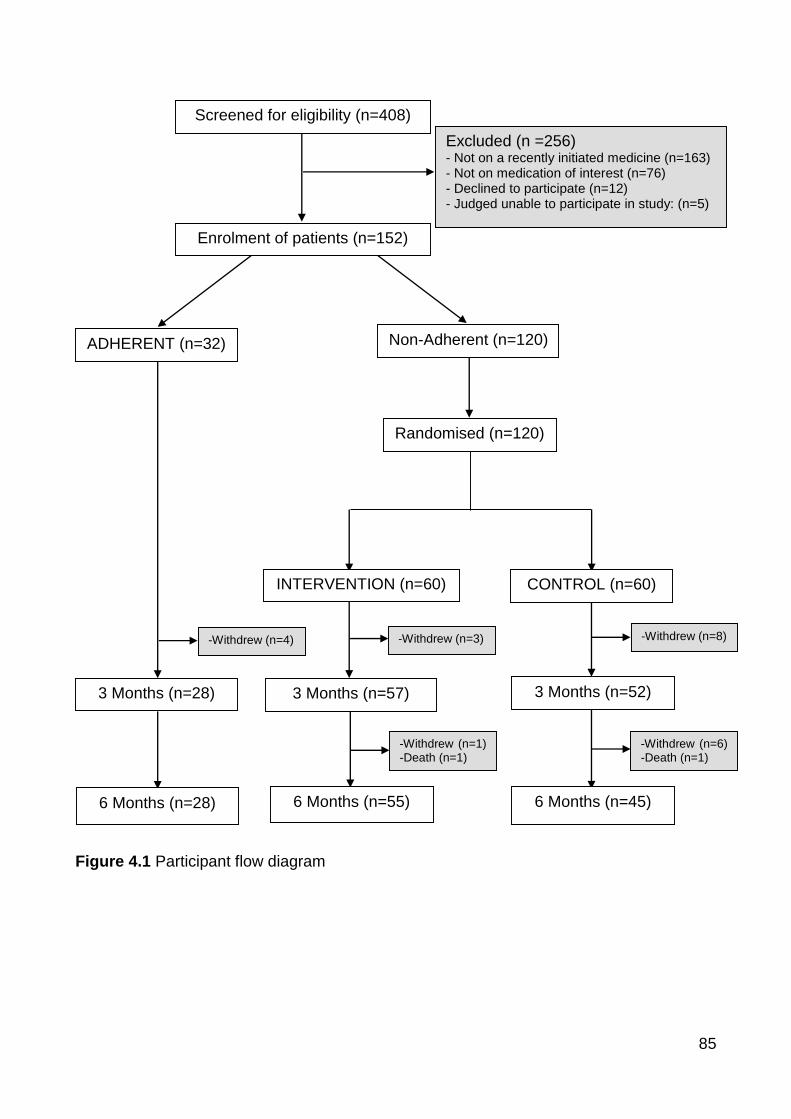
85
Figure 4.1 Participant flow diagram
Screened for eligibility (n=408)
Excluded (n =256)
- Not on a recently initiated medicine (n=163) - Not on medication of interest (n=76) - Declined to participate (n=12) - Judged unable to participate in study: (n=5)
Enrolment of patients (n=152)
ADHERENT (n=32) Non-Adherent (n=120)
Randomised (n=120)
INTERVENTION (n=60) CONTROL (n=60)
3 Months (n=57) 3 Months (n=28)
3 Months (n=52)
6 Months (n=55)
6 Months (n=45)
6 Months (n=28)
-Withdrew (n=8) -Withdrew (n=3) -Withdrew (n=4)
-Withdrew (n=1) -Death (n=1)
-Withdrew (n=6) -Death (n=1)

86
4.2.1 Participant Baseline Demographics
Participants in the adherent group had a mean age of 64.6 years and 59.4% were female.
The participants classified as non-adherent (intervention and control) using the MAQ had a
mean age of 63.5 years. Of these participants, 66 (55%) were female and 98 (81.7%) had
attained secondary school qualifications or higher. Most of these participants were married
(60.8%), retired (52.5%) and had an annual salary of less than $30000 (46.7%). There were
no significant differences in the demographics between the intervention and control groups
at baseline. There were also no significant differences in the baseline demographics
between the adherent and non-adherent (intervention and control) groups (Table 4.1).
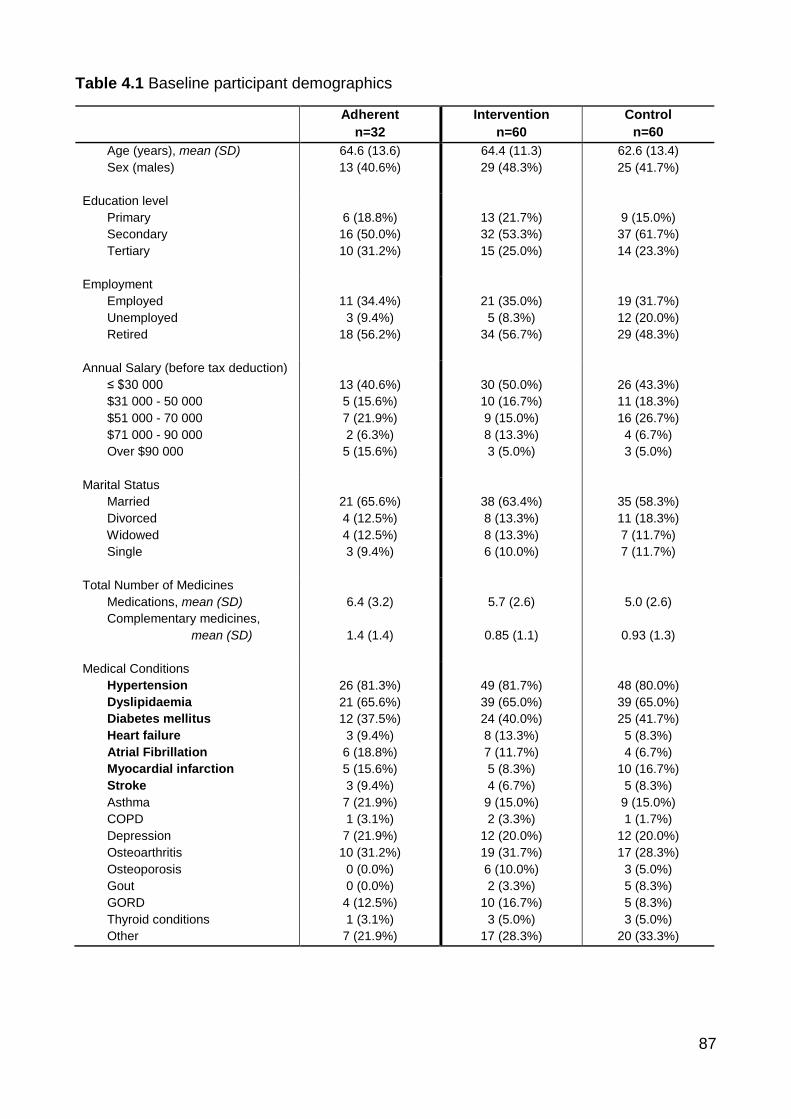
87
Table 4.1 Baseline participant demographics
Adherent
n=32
Intervention
n=60
Control
n=60
Age (years), mean (SD) 64.6 (13.6) 64.4 (11.3) 62.6 (13.4)
Sex (males)
13 (40.6%) 29 (48.3%) 25 (41.7%)
Education level
Primary
Secondary
Tertiary
6 (18.8%)
16 (50.0%)
10 (31.2%)
13 (21.7%)
32 (53.3%)
15 (25.0%)
9 (15.0%)
37 (61.7%)
14 (23.3%)
Employment
Employed
Unemployed
Retired
11 (34.4%)
3 (9.4%)
18 (56.2%)
21 (35.0%)
5 (8.3%)
34 (56.7%)
19 (31.7%)
12 (20.0%)
29 (48.3%)
Annual Salary (before tax deduction)
≤ $30 000
$31 000 - 50 000
$51 000 - 70 000
$71 000 - 90 000
Over $90 000
13 (40.6%)
5 (15.6%)
7 (21.9%)
2 (6.3%)
5 (15.6%)
30 (50.0%)
10 (16.7%)
9 (15.0%)
8 (13.3%)
3 (5.0%)
26 (43.3%)
11 (18.3%)
16 (26.7%)
4 (6.7%)
3 (5.0%)
Marital Status
Married
Divorced
Widowed
Single
21 (65.6%)
4 (12.5%)
4 (12.5%)
3 (9.4%)
38 (63.4%)
8 (13.3%)
8 (13.3%)
6 (10.0%)
35 (58.3%)
11 (18.3%)
7 (11.7%)
7 (11.7%)
Total Number of Medicines
Medications, mean (SD)
6.4 (3.2)
5.7 (2.6)
5.0 (2.6)
Complementary medicines,
mean (SD)
1.4 (1.4)
0.85 (1.1)
0.93 (1.3)
Medical Conditions
Hypertension
Dyslipidaemia
Diabetes mellitus
Heart failure
Atrial Fibrillation
Myocardial infarction
Stroke
Asthma
COPD
Depression
Osteoarthritis
Osteoporosis
Gout
GORD
Thyroid conditions
Other
26 (81.3%)
21 (65.6%)
12 (37.5%)
3 (9.4%)
6 (18.8%)
5 (15.6%)
3 (9.4%)
7 (21.9%)
1 (3.1%)
7 (21.9%)
10 (31.2%)
0 (0.0%)
0 (0.0%)
4 (12.5%)
1 (3.1%)
7 (21.9%)
49 (81.7%)
39 (65.0%)
24 (40.0%)
8 (13.3%)
7 (11.7%)
5 (8.3%)
4 (6.7%)
9 (15.0%)
2 (3.3%)
12 (20.0%)
19 (31.7%)
6 (10.0%)
2 (3.3%)
10 (16.7%)
3 (5.0%)
17 (28.3%)
48 (80.0%)
39 (65.0%)
25 (41.7%)
5 (8.3%)
4 (6.7%)
10 (16.7%)
5 (8.3%)
9 (15.0%)
1 (1.7%)
12 (20.0%)
17 (28.3%)
3 (5.0%)
5 (8.3%)
5 (8.3%)
3 (5.0%)
20 (33.3%)

88
4.2.2 Intervention
The mean length of the baseline interview for the adherent group was 10.2 ± 1.6 minutes,
intervention group (including implementation of tailored strategy) was 13.5 ± 2.9 minutes
and control group was 11.8 ± 2.8 minutes.
The tailored strategies implemented by the principal researcher, are shown in Table 4.2.
Reminder systems accounted for 45% of the strategies that were implemented.
Table 4.2 Types of tailored strategies implemented to improve medication adherence
4.2.3 Adherence
The mean MAQ score at baseline in the intervention, 1.58: 95% CI [1.38, 1.78], and control,
1.60: 95% CI [1.43, 1.77], groups were not statistically different. At three months, based on
intention-to-treat, the mean MAQ score in the intervention group was significantly lower than
the control group, reflecting an improvement in adherence (mean MAQ score 0.42: 95% CI
[0.27, 0.57] vs 1.58: 95% CI [1.42, 1.75]; p<0.001). The significant improvement in MAQ
score in the intervention group compared to control was sustained at six months (0.48: 95%
Strategy Intervention
Group
n = 60
Examples of the Strategy
Reminder systems 27 (45.0%) - Dose administration aids
- Alarm reminders
- Simplifying treatment regimens
Reminder systems and
Cognitive-educational
15 (25.0%) - Dosette box and verbal or written
information
Cognitive-educational 9 (15.0%) - Disease-specific and medication
counselling
- Written information
Social support
5 (8.3%) - Support from a family member
Behavioural-counselling 4 (6.7%) - Health coaching

89
CI [0.31, 0.65] vs 1.48: 95% CI [1.27, 1.69]; p<0.001). This represents a statistically
significant improvement in the primary endpoint at three and also at six months (p<0.001)
(Figure 4.2). Similar results were observed on the per protocol analysis; mean MAQ score
intervention vs control at 3 months and 6 months was 0.33 vs 1.54, p<0.001 and 0.42 vs
1.44, p<0.001, respectively. From now on, only the results from the intention-to-treat
analysis are presented.
The mean MAQ score in the adherent group increased significantly from zero at baseline to
0.22: 95% CI [0.05, 0.39] at three months (p < 0.05). The significant increase in mean MAQ
score in the adherent group was not sustained at six months.
On a more individual level, we observed that at three months, 53 of the 60 (88.3%)
participants in the intervention group showed a reduction in their MAQ score, reflecting an
improvement in adherence. In the control group, seven of the 60 (11.7%) participants
showed an improvement in their MAQ score. The greatest individual improvement was a
MAQ score of four to zero.

90
Figure 4.2 Mean MAQ scores (± 95% CI) at baseline, 3-month and 6-month follow-ups, based on intention to treat analysis
(*** p <0.001 – Mean MAQ score in intervention group was significantly lower than control at both three and six months) Note: decreasing MAQ score reflects improvement in medication adherence
0
0.2
0.4
0.6
0.8
1
1.2
1.4
1.6
1.8
Baseline 3 Months 6 Months
Mea
n M
AQ
sco
re
Time
Adherent
Intervention
Control
*** ***

91
4.2.4 Changes in mean BMQ-S scores between the three groups over time
The changes in the BMQ-S necessity and concerns scores at three and six months are
shown in Table 4.3. At baseline there were no statistically significant differences in the mean
BMQ-S necessity and concerns scores between the adherent and non-adherent
(intervention and control) groups. At three and six months, the mean BMQ-S concerns
scores were significantly lower in the adherent group compared to the control group,
reflecting less concerns about their medicine in the adherent group. At six months, the mean
BMQ-S necessity score was significantly higher in the adherent group than the control
group, indicating that the adherent group had stronger beliefs that their medicine was
necessary (Table 4.3).
There were no statistically significant differences in the mean BMQ-S necessity score and
concerns score at baseline, between the intervention and control (Table 4.3). At three
months, the BMQ-S necessity score was significantly higher in the intervention group
compared to control (p<0.05). This result was sustained at six months (p<0.001). The mean
BMQ-S concerns score were not significantly different between the intervention and control
at both three and six months.
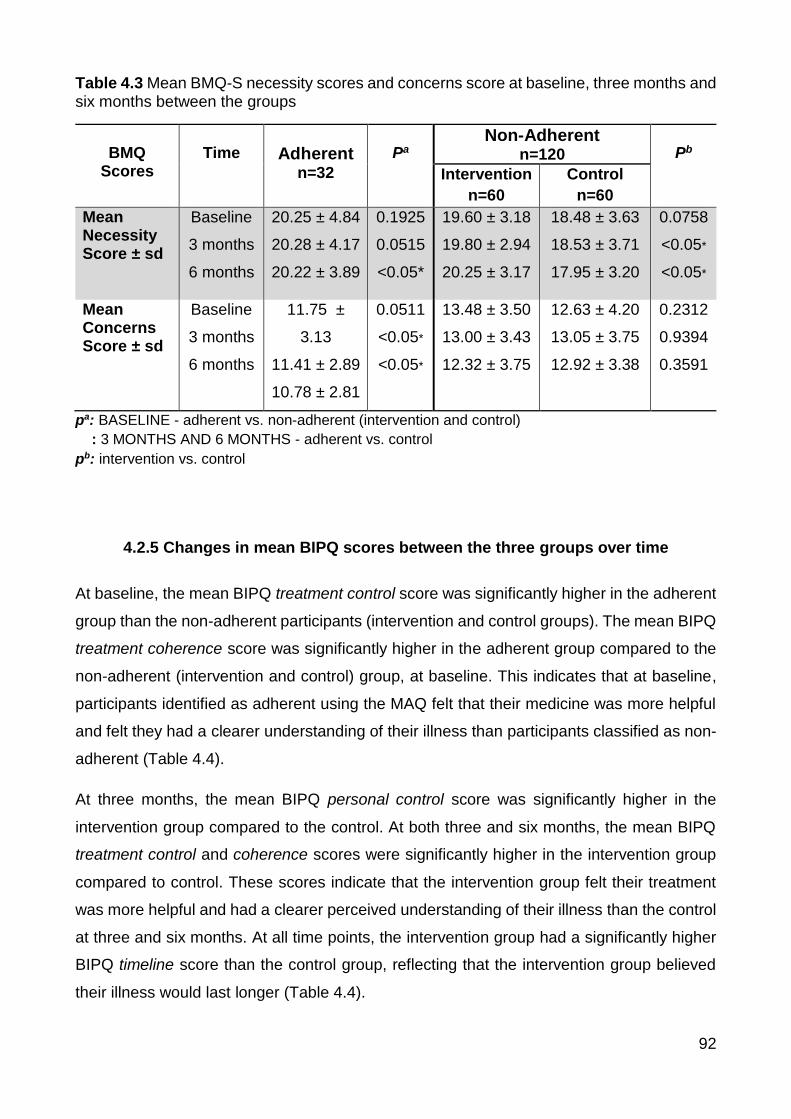
92
Table 4.3 Mean BMQ-S necessity scores and concerns score at baseline, three months and six months between the groups
BMQ
Scores
Time
Adherent n=32
Pa
Non-Adherent n=120
Pb
Intervention
n=60
Control
n=60
Mean Necessity Score ± sd
Baseline
3 months
6 months
20.25 ± 4.84
20.28 ± 4.17
20.22 ± 3.89
0.1925
0.0515
<0.05*
19.60 ± 3.18
19.80 ± 2.94
20.25 ± 3.17
18.48 ± 3.63
18.53 ± 3.71
17.95 ± 3.20
0.0758
<0.05*
<0.05*
Mean Concerns Score ± sd
Baseline
3 months
6 months
11.75 ±
3.13
11.41 ± 2.89
10.78 ± 2.81
0.0511
<0.05*
<0.05*
13.48 ± 3.50
13.00 ± 3.43
12.32 ± 3.75
12.63 ± 4.20
13.05 ± 3.75
12.92 ± 3.38
0.2312
0.9394
0.3591
pa: BASELINE - adherent vs. non-adherent (intervention and control)
: 3 MONTHS AND 6 MONTHS - adherent vs. control
pb: intervention vs. control
4.2.5 Changes in mean BIPQ scores between the three groups over time
At baseline, the mean BIPQ treatment control score was significantly higher in the adherent
group than the non-adherent participants (intervention and control groups). The mean BIPQ
treatment coherence score was significantly higher in the adherent group compared to the
non-adherent (intervention and control) group, at baseline. This indicates that at baseline,
participants identified as adherent using the MAQ felt that their medicine was more helpful
and felt they had a clearer understanding of their illness than participants classified as non-
adherent (Table 4.4).
At three months, the mean BIPQ personal control score was significantly higher in the
intervention group compared to the control. At both three and six months, the mean BIPQ
treatment control and coherence scores were significantly higher in the intervention group
compared to control. These scores indicate that the intervention group felt their treatment
was more helpful and had a clearer perceived understanding of their illness than the control
at three and six months. At all time points, the intervention group had a significantly higher
BIPQ timeline score than the control group, reflecting that the intervention group believed
their illness would last longer (Table 4.4).

93
Table 4.4 Mean scores of BIPQ at baseline, three months and six months, between groups
Mean BIPQ Scores ± sd
Time
Adherent
(n=32)
pa
Non-Adherent Pb Interventio
n (n=60)
Control
(n=60)
Consequences How much does your
illness affect your life?
(0 = no affect at all – 10 =
severely affects my life)
Baseline
3 months
6 months
5.13 ± 2.87
5.03 ± 3.17
4.06 ± 2.94
0.7411
0.9976
<0.05*
5.10 ± 3.02
4.98 ± 3.07
4.90 ± 2.86
4.77 ± 3.01
5.03 ± 3.09
5.45 ± 2.92
0.5459
0.9292
0.2995
Timeline How long do you think
your illness will continue?
(0 = very short time – 10 =
forever)
Baseline
3 months
6 months
8.72 ± 2.64
8.94 ± 2.35
9.09 ± 2.16
0.3298
0.9671
0.9597
9.57 ± 1.14
9.90 ± 0.66
9.83 ± 0.62
8.85 ± 2.28
8.92 ± 2.19
9.12 ± 1.87
<0.05*
<0.05*
<0.05*
Personal Control How much control do you
feel you have over your
illness?
(0 = absolutely no control –
10 = extreme amount)
Baseline
3 months
6 months
6.53 ± 2.73
7.22 ± 1.91
7.47 ± 1.90
0.2497
<0.05*
<0.05*
5.70 ± 2.82
6.50 ± 2.57
5.90 ± 2.93
6.08 ± 2.89
5.53 ± 2.61
4.98 ± 2.59
0.4639
<0.05*
0.0723
Treatment
Control How much do you think
your treatment can help
your illness?
(0 = not at all – 10 =
extremely helpful)
Baseline
3 months
6 months
9.00 ± 1.44
9.28 ± 1.39
9.16 ± 1.42
<0.05*
<0.05*
<0.05*
8.20 ± 1.94
8.55 ± 1.79
8.58 ± 1.70
8.00 ± 1.97
7.63 ± 2.15
7.22 ± 2.44
0.5757
<0.05*
<0.05*
Identity How much do you
experience symptoms
from your illness? (0 = no symptoms – 10 =
many severe symptoms)
Baseline
3 months
6 months
3.63 ± 3.12
4.16 ± 3.05
3.56 ± 2.71
0.2859
0.7510
<0.05*
4.32 ± 2.83
4.52 ± 3.06
4.18 ± 2.78
4.25 ± 2.90
4.37 ± 2.95
4.98 ± 2.69
0.8988
0.7850
0.1121
Concern How concerned are you
about your illness?
(0 = not at all concerned –
10 = extremely concerned)
Baseline
3 months
6 months
5.53 ± 3.16
5.34 ± 3.57
4.47 ± 3.32
0.8319
0.5539
<0.05*
5.97 ± 3.46
5.65 ± 3.21
5.53 ± 3.32
5.37 ± 3.11
5.78 ± 2.96
6.12 ± 2.92
0.3204
0.8135
0.3093
Coherence How well do you feel you
understand your illness? (0 = don’t understand – 10 =
understand very clearly)
Baseline
3 months
6 months
8.53 ± 1.92
8.66 ± 1.82
8.84 ± 1.74
<0.05*
<0.05*
<0.05*
7.28 ± 2.64
8.37 ± 2.09
8.37 ± 2.11
7.35 ± 2.36
7.12 ± 2.54
6.63 ± 2.71
0.8845
<0.05*
<0.05*
Emotional How much does your
illness affect you
emotionally?
(0 = not at all affected
emotionally – 10 = extremely
affected emotionally)
Baseline
3 months
6 months
3.56 ± 3.22
4.16 ± 3.07
3.38 ± 2.70
0.3845
0.7356
<0.05*
4.18 ± 3.41
4.27 ± 3.15
3.92 ± 3.02
4.07 ± 3.05
4.38 ± 3.04
4.97 ± 2.91
0.8436
0.8366
0.0547
pa: BASELINE - adherent vs. non-adherent (intervention and control)
: 3 MONTHS AND 6 MONTHS - adherent vs. control
pb: intervention vs. control

94
4.3 Conclusions
A targeted and tailored intervention guided by feedback from validated adherence scales
and discussion with the participant improved adherence to a recently initiated medication at
three months and this effect was sustained at 6 months. Use of validated adherence scales
to prompt a structured discussion, provided insight into the participant’s medication-taking
behaviour, beliefs towards their medicines and their illness perceptions. This is a variant of
an approach that used MEMS data and has been successful at improving adherence to
medications (MGMM).214 This intervention was easy to administer and quick enough that it
could be incorporated into day-to-day practice, if proven successful in larger studies
assessing clinical outcomes.
Chapter Five provides details on how the intervention was tailored to participants. The
changes in adherence, beliefs about medicines and illness perceptions in the adherent,
intervention and control groups and for each of adherence strategies are explored in Chapter
Six. Refer to Chapter Seven for discussion and the study limitations.

95
CHAPTER FIVE: RESULTS 2 - TAILORING OF THE INTERVENTIONS TO THE PARTICIPANT-SPECIFIC REASONS FOR NON-ADHERENCE
5.1 Introduction
In Chapter Two and Three we reported how adherence scales could be used to identify non-
adherence and the reasons for non-adherence. In Chapter Three we described the methods
of a randomised controlled trial to test the use of validated scales in an MGMM approach to
improve medication adherence. The intervention involved validated adherence scales,
discussion with the participant and the implementation of a tailored strategy to improve
adherence. Validated adherence scales were used to provide feedback on the participant’s
adherence. The participant’s responses to the scales informed the discussion with the
participants about their illnesses, medicines and/or reasons for their non-adherence to
provide context. The discussion guided the implementation of a tailored strategy to improve
adherence to a chronic cardiovascular disease. Chapter Four presented the results of the
randomised controlled trial of a targeted and tailored intervention to improve adherence.
This adherence intervention led to a significant improvement in adherence at three months
and this improvement in adherence was sustained at six months (Chapter Four).
It is important to explain how these interventions were tailored to the participant-specific
reasons for non-adherence to explore how the intervention may have improved adherence.
The purpose of Chapter Five is to describe how the information obtained from the validated
tools and discussion with the participant informed the implementation of the tailored
strategies. The tailored strategies included: reminder systems, cognitive-educational,
behavioural-counselling and social support interventions.

96
5.2 Participant Baseline Interview
The interview consisted of the: Medication Adherence Questionnaire (MAQ), Beliefs about
Medicines Questionnaire - Specific (BMQ-S), Brief Illness Perceptions Questionnaire (BIPQ)
and tailored strategy. The MAQ, BMQ-S and BIPQ were utilised to gather information about
the participants’ adherence and reasons for non-adherence.
The MAQ was used for two purposes: (i) identify participant’s adherence, and (ii)
identify the participant’s type of non-adherence (unintentional, intentional or a mix of
both types), as described in Section 3.3.3.18
The BMQ-S elicited commonly-held beliefs about medicines, as described in Section
3.3.3.117 The BMQ-S provided insight to whether the participant believed their
medicines were necessary and whether participants had any concerns about their
medicines.
The BIPQ was used to explore illness perceptions that may influence adherence to
medications.135,139 Items 4 and 7 in particular were used to identify if participants held
negative perceptions towards their medicines and whether or not they perceived that
they understood their illness, respectively (Section 3.3.3).
The participant’s responses to the validated tools informed further discussion regarding the
participant’s adherence and barriers to adherence. A tailored strategy to support the
participant’s adherence was selected and implemented based on the information discussed
in the interview.
5.3 Intervention
5.3.1 Overview of Strategies Implemented
Guided by the adherence scales, the researcher and participant selected and implemented
a strategy from an “evidence-based toolkit” to support the participant’s adherence to their
medicine (Chapter Four: Table 4.2). The commons strategies employed to improve
adherence were: reminder systems (45%), reminder system and a cognitive-educational

97
strategy (25%), a cognitive-educational strategy (15%), social support (8.3%) and a
behavioural-counselling strategy (6.7%).
5.3.2 Overview of Radar Charts of the Responses to the Scales for each
Tailored Strategy and Case Examples
For each of the tailored strategies, a radar chart has been used to provide a pictorial
representation of how the responses to the scales guided the selection of the strategy.
Figure 5.1 is a template of the radar chart. From the top of the radar chart, moving clockwise,
the first four axis lines represents the proportion of participants (%) who responded positively
to each of the MAQ items, indicating whether they were forgetful at taking their medicine,
careless at taking their medicine, ceased their medicine when they felt better or when they
felt worse. The next two axis lines represent the mean BMQ-S necessity and concerns
scores (expressed as a percentage). The higher the BMQ-S necessity and concerns scores,
the stronger the belief that their medicine was necessary and the greater the concerns were
about their medicine, respectively. The remaining two lines on the left of the radar chart are
the mean BIPQ treatment control and treatment coherence score, which are also expressed
as a percentage. A high BIPQ treatment control score reflects strong beliefs that their
medicine is helpful and a high BIPQ treatment coherence score indicates a clear perceived
understanding of their treatment (Figure 5.1). The radar charts (Figure 5.2 – 5.6) visually
depict key similarities and differences in responses to the survey tools at baseline between
patients who received the different tailored strategies. Since the type of strategy
implemented was informed by the participant’s responses to the MAQ, BMQ-S, BIPQ and
discussion with the participant, these groups are not randomised.
Individual examples are also provided below the individual radar charts, to explain and
illustrate in more detail how the interview was used to inform the selection of the tailored
strategy in specific participants.

98
Figure 5.1 Radar Chart template
0
10
20
30
40
50
60
70
80
90
100
% MAQ Q1 Forgetful
% MAQ Q2 Careless
% MAQ Q3 Ceased whenwell
% MAQ Q4 Ceased whenworse
Mean BMQ-S NecessityScore
Mean BMQ-S ConcernsScore
Mean BIPQ TreatmentControl Score
Mean BIPQ TreatmentCoherence Score

99
5.3.3 Reminder System
Reminder System Radar Chart
Reading the radar chart (Figure 5.2) clockwise from the top, we can see that all participants
who received a reminder to improve their medication adherence were identified as
unintentionally non-adherent (either forgetful or careless with their medicines). The mean
BMQ-S necessity score was high, indicating these participants had strong beliefs their
medicine was necessary. The mean BMQ-S concerns score was low, reflecting minimal
concerns about their medicine. The mean BIPQ treatment control and treatment coherence
scores were high, reflecting that these participants believed their medicine was helpful and
had a good perceived understanding of their illness (Figure 5.2). From these responses,
unintentional non-adherence due to forgetfulness and carelessness were identified as the
barrier to adherence and informed the discussion about adherence with these participants.
Figure 5.2 Radar chart of questionnaire responses of REMINDER group at baseline
0
10
20
30
40
50
60
70
80
90
100% MAQ Q1 Forgetful
% MAQ Q2 Careless
% MAQ Q3 Ceased whenwell
% MAQ Q4 Ceased whenworse
Mean BMQ-S NecessityScore
Mean BMQ-S ConcernsScore
Mean BIPQ TreatmentControl Score
Mean BIPQ TreatmentCoherence Score

100
Case Examples of Individuals who received a Reminder System
Below are three case examples of participants who were provided with a reminder strategy
to improve their adherence (dose administration aid, self-managed dosette box and
treatment simplification).
Case 1: Participant 47 (Table 5.1)
Participant 47 is 73 years of age and takes a total of eight prescription medicines and two
vitamin supplements. She has been taking gliclazide modified-release (MR) tablets 60mg
once daily for the previous 12 weeks for type 2 diabetes.
Table 5.1 Individual scores to validated scales at baseline (Participant 47)
MAQ BMQ-S BIPQ
Score Type Necessity Concern
s
Treatment
Control
Treatment
Coherence
1 0 22 9 8 8
MAQ Score: 1 (low non-adherence) to 4 (high non-adherence). Type: 0 = Unintentional non-adherence, 1 = Intentional
non adherence, 2 = Mix of both types.
BMQ-S: Necessity: 5 (low BMQ-S necessity score) to 25 (high BMQ-S necessity score), Concerns: 5 (low BMQ-S
concerns score) to 25 (high BMQ-S concerns score).
BIPQ: Treatment Control: 1 (treatment not helpful at all) to 10 (extremely helpful), Treatment Coherence: 1 (do not
understand at all) to 10 (understand very clearly).
Intervention
MAQ: Score of 1, unintentionally non-adherent.
BMQ-S: High necessity score and low concerns score – believes medicine is necessary and
does not appear to be concerned about their medicine.
BIPQ: The participant felt she had a decent amount of control over her illness and perceived
her medicines to be very helpful. Participant 47 had a clear understanding of her illness and
was not emotionally affected by her illness.

101
Discussion: It was ascertained that all her medicines were taken either once daily or twice
daily. The discussion also determined that Participant 47 was usually careless and often
forgets to take the evening dose of her medicine. Furthermore, the participant mentioned
that she tended to forget to refill her repeat prescriptions on time.
Adherence Strategy: Agreed in discussion with participant that a fortnightly dose
administration aid would be helpful. This was initiated by her community pharmacy. A dose
administration aid is commonly made up by the pharmacy to help patients who may find it
difficult to organise and remember to take their medications, particularly if they are taking a
great number of medications. It is a plastic tray that compartmentalises medicines into the
appropriate days of the week and times of the day at which the medications should be taken.
The dose administration aid may help to remind her to take the evening doses of her
medicines and also shifts the responsibility of dispensing her repeat prescriptions to the
pharmacy.
Case 2: Participant 49 (Table 5.2)
Participant 49 takes four prescription medicines and one complementary medicine. He has
been taking perindopril 5mg, once daily for the past four weeks for hypertension.
Table 5.2 Individual scores to validated scales at baseline (Participant 49)
MAQ BMQ-S BIPQ
Score Type Necessity Concerns Treatment
Control
Treatment
Coherence
1 0 25 10 9 8
MAQ Score: 1 (low non-adherence) to 4 (high non-adherence). Type: 0 = Unintentional non-adherence, 1 = Intentional
non adherence, 2 = Mix of both types.
BMQ-S: Necessity: 5 (low BMQ-S necessity score) to 25 (high BMQ-S necessity score), Concerns: 5 (low BMQ-S
concerns score) to 25 (high BMQ-S concerns score).
BIPQ: Treatment Control: 1 (treatment not helpful at all) to 10 (extremely helpful), Treatment Coherence: 1 (do not
understand at all) to 10 (understand very clearly).

102
Intervention
MAQ: Score of 1, unintentionally non-adherent.
BMQ-S: High necessity score and low concerns score – believes medicine is necessary and
has minimal concerns about his medicine.
BIPQ: The participant seems to have a good understanding of his illness and perceives his
medicine as very helpful.
Discussion: Through discussion with the participant it was discovered that he was using a
once daily self-managed dosette box. Since he was also taking other medicines with a twice-
daily dosing regimen, he sometimes had difficulty distinguishing between the morning and
evening doses when the tablets were in one compartment in the dosette box.
Adherence Strategy: The researcher suggested a dose administration aid; however the
participant felt that they would be losing control over his medication-taking behaviour.
Therefore, the researcher and participant made a shared decision to use a twice-daily
dosette box (compartments for morning and evening doses for each day of the week).
Case 3: Participant 25 (Table 5.3)
Participant 25 is 52 years old and has been taking metformin 500mg three times daily for
the treatment of type 2 diabetes for the past twelve weeks.
Table 5.3 Individual scores to validated scales at baseline (Participant 25)
MAQ BMQ-S BIPQ
Score Type Necessity Concerns Treatment
Control
Treatment
Coherence
2 0 20 12 10 7
MAQ Score: 1 (low non-adherence) to 4 (high non-adherence). Type: 0 = Unintentional non-adherence, 1 = Intentional
non adherence, 2 = Mix of both types.
BMQ-S: Necessity: 5 (low BMQ-S necessity score) to 25 (high BMQ-S necessity score), Concerns: 5 (low BMQ-S
concerns score) to 25 (high BMQ-S concerns score).
BIPQ: Treatment Control: 1 (treatment not helpful at all) to 10 (extremely helpful), Treatment Coherence: 1 (do not
understand at all) to 10 (understand very clearly).

103
Intervention
MAQ: Score of 2, unintentionally non-adherent.
BMQ-S: Participant’s perceived necessity beliefs outweighed his concerns about the
medicine
BIPQ: The BIPQ identified that the participant perceived that their medicines were extremely
beneficial, had minimal concerns about their illnesses and had good understanding of their
illnesses.
Discussion: The participant was prescribed metformin three times daily. The participant
advised that he tended to forget to take his noon dose while he was at work. The participant
was forgetful at taking his medication as prescribed due to the complexity of the treatment
regimen.
Adherence Strategy: The researcher advised that if the GP agrees, changing metformin
conventional dosage form to the extended release dosage form can reduce the dose
frequency from three times daily to once daily. The researcher liaised with the GP and the
GP agreed to replace the conventional metformin 500mg three times daily to extended-
release metformin 500mg three tablets once daily.
Summary of Reminder Strategies
A reminder strategy was implemented in participants identified with unintentional non-
adherence using the MAQ, with no other barriers identified using the BMQ-S, BIPQ and
during the discussion. These strategies included dose administration aids, dosette boxes,
alarm clock reminders and treatment regimen simplification. A shared decision was made
on which strategy would be the most appropriate for each participant. Most reminder
strategies involved employing a dose administration aid, which were organised by the
pharmacy. In our study, some participants did not like the idea of a third party “controlling”
their medicines (Case 2). For these participants, a dosette box was more ideal, as this allows
the participant to organise their medicines. The reminder strategies implemented in this
study are similar to those in the literature (Section 1.6.2).224,234,240,244,246

104
5.3.4 Cognitive-Educational Strategy
Most participants who were provided with education to improve adherence were identified
as intentionally non-adherent, with the majority scoring positively on questions 3 and/or 4 of
the MAQ. Similar to the reminder group, the mean BMQ-S necessity score was high and
BMQ-S concerns score was low. However, the mean BIPQ Treatment Coherence score was
low, indicating that these participants may benefit from information on their illness and
medicine to improve their adherence (Figure 5.3). In comparison to the participants who
received a reminder system these participants were less likely to be unintentionally non-
adherent and have a low mean BIPQ treatment coherence score (Figure 5.2).
Figure 5.3 Radar chart of questionnaire responses of the COGNITIVE-EDUCATIONAL strategy group at baseline
0102030405060708090
100% MAQ Q1 Forgetful
% MAQ Q2 Careless
% MAQ Q3 Ceased whenwell
% MAQ Q4 Ceased whenworse
Mean BMQ-S NecessityScore
Mean BMQ-S ConcernsScore
Mean BIPQ TreatmentControl Score
Mean BIPQ TreatmentCoherence Score

105
Case Examples of Individuals who received a Cognitive-Educational Strategy
Case 4: Participant 5 (Table 5.4)
Participant 5 is 62 years old and is currently on eight prescription medicines. He was recently
prescribed rosuvastatin 5mg once daily for dyslipidaemia and for the secondary prevention
of ischaemic stroke. The rosuvastatin was prescribed 12 weeks ago; however, he has taken
rosuvastatin for a total of four weeks.
Table 5.4 Individual scores to validated scales at baseline (Participant 5)
MAQ BMQ-S BIPQ
Score Type Necessity Concerns Treatment
Control
Treatment
Coherence
3 2 25 14 8 2
MAQ Score: 1 (low non-adherence) to 4 (high non-adherence). Type: 0 = Unintentional non-adherence, 1 = Intentional
non adherence, 2 = Mix of both types.
BMQ-S: Necessity: 5 (low BMQ-S necessity score) to 25 (high BMQ-S necessity score), Concerns: 5 (low BMQ-S
concerns score) to 25 (high BMQ-S concerns score).
BIPQ: Treatment Control: 1 (treatment not helpful at all) to 10 (extremely helpful), Treatment Coherence: 1 (do not
understand at all) to 10 (understand very clearly).
Intervention
MAQ: Score of 3, both unintentionally non-adherent and intentionally non-adherent.
BMQ-S: The BMQ-S showed that the participant strongly believed his medicines were
necessary and had relatively minimal concerns.
BIPQ: Indicated a poor of understanding of his conditions
Discussion: The BIPQ indicated that the participant had a poor understanding of his illness.
This information together with the responses to the MAQ was used to guide the discussion
about his medication-taking behaviour and his current knowledge of his medication and
illnesses. It was discovered that he had not been taking the rosuvastatin because he did not
understand the purpose and importance of taking this medication. The participant self-
reported that he takes his other seven medicines “religiously” and also believed that the

106
rosuvastatin is causing his gout attacks. The participant also reported that his general
practitioner (GP) was unaware that he had ceased the rosuvastatin.
Adherence Strategy: The participant was educated on the purpose and benefits of the
rosuvastatin. The participant was advised that the rosuvastatin was not only to help reduce
cholesterol levels, but also to prevent another stroke incident along with his other medicines
taken for stroke prevention. The importance of taking his medicines was emphasised
throughout the interview. Since the participant believed that the rosuvastatin was causing
his gout, education was also provided on the causes of gout and the management of gout.
The researcher also provided information on his medications for gout (allopurinol for gout
prevention and indomethacin for controlling gout attacks) and the participant was advised
that it was unlikely that the rosuvastatin is the causing the gout.
Case 5: Participant 16 (Table 5.5)
Participant 16 was initiated on irbesartan 300mg once daily, five weeks ago for the treatment
of hypertension.
Table 5.5 Individual scores to validated scales at baseline (Participant 16)
MAQ BMQ-S BIPQ
Score Type Necessity Concerns Treatment
Control
Treatment
Coherence
1 1 12 21 10 2
MAQ Score: 1 (low non-adherence) to 4 (high non-adherence). Type: 0 = Unintentional non-adherence, 1 = Intentional
non adherence, 2 = Mix of both types.
BMQ-S: Necessity: 5 (low BMQ-S necessity score) to 25 (high BMQ-S necessity score), Concerns: 5 (low BMQ-S
concerns score) to 25 (high BMQ-S concerns score).
BIPQ: Treatment Control: 1 (treatment not helpful at all) to 10 (extremely helpful), Treatment Coherence: 1 (do not
understand at all) to 10 (understand very clearly).
Intervention
MAQ: Score of 1, intentionally non-adherent (ceased medicine when feeling unwell).

107
BMQ-S: The participant’s concerns about her medicine outweighed beliefs that her medicine
were necessary.
BIPQ: The BIPQ showed that the participant believed the medicine was very helpful, but
had a poor understanding of her treatment and condition.
Discussion: The responses to the BMQ-S showed that the participant had concerns about
their medication. Therefore, the interview with the participant involved discussing what her
concerns were and why she had those concerns. The participant advised the researcher
that she was experiencing palpitations ever since she started taking the irbesartan, which
gave her concerns about the medication. Therefore, the participant ceased her irbesartan
when she experienced palpitations. The BIPQ indicated that the participant did not have a
good understanding of her illness and treatment. This was also picked up during the
discussion with the participant about her medication-taking behaviour. Therefore, the
participant was asked about what she felt she knew about her medication and illness and
what she felt she did not know very well.
Adherence Strategy: The participant was educated on hypertension and on how irbesartan
will help with her hypertension. Information on the silent nature of hypertension, the causes
of hypertension and risks of hypertension was provided. Counselling on the benefits and
common adverse effects of irbesartan was provided, including how to manage the side
effects. The participant was advised that because irbesartan reduces blood pressure, it can
sometimes lead to an increase in heart rate and may explain her recent heart palpitations.
The researcher also measured the participant’s blood pressure and provided the participant
with a blood pressure monitoring diary, which included information on managing blood
pressure. The participant was also referred to the GP to discuss her heart palpitations.
Summary of Cognitive-Educational Strategies
Educating individuals on their health can influence a change in adherence through changes
in knowledge, attitudes and beliefs.144 A cognitive-educational strategy to support their
adherence was implemented in participants identified as having poor knowledge on their
medicines and medical conditions without other potential barriers to adherence (Figure 5.3).
Information that was provided to the participants included the benefits of their medicine, the

108
adverse effects and how to manage the adverse effects (Case 4). Depending on the
discussion with the participant, information on their medical condition and what to expect
was also provided (Case 5). Some participants were also provided with pharmacy pamphlets
on medical conditions when appropriate (Case 5). The cognitive-educational strategies
utilised in this study were similar to those implemented in the literature as described in
Chapter One, Section 1.6.2.
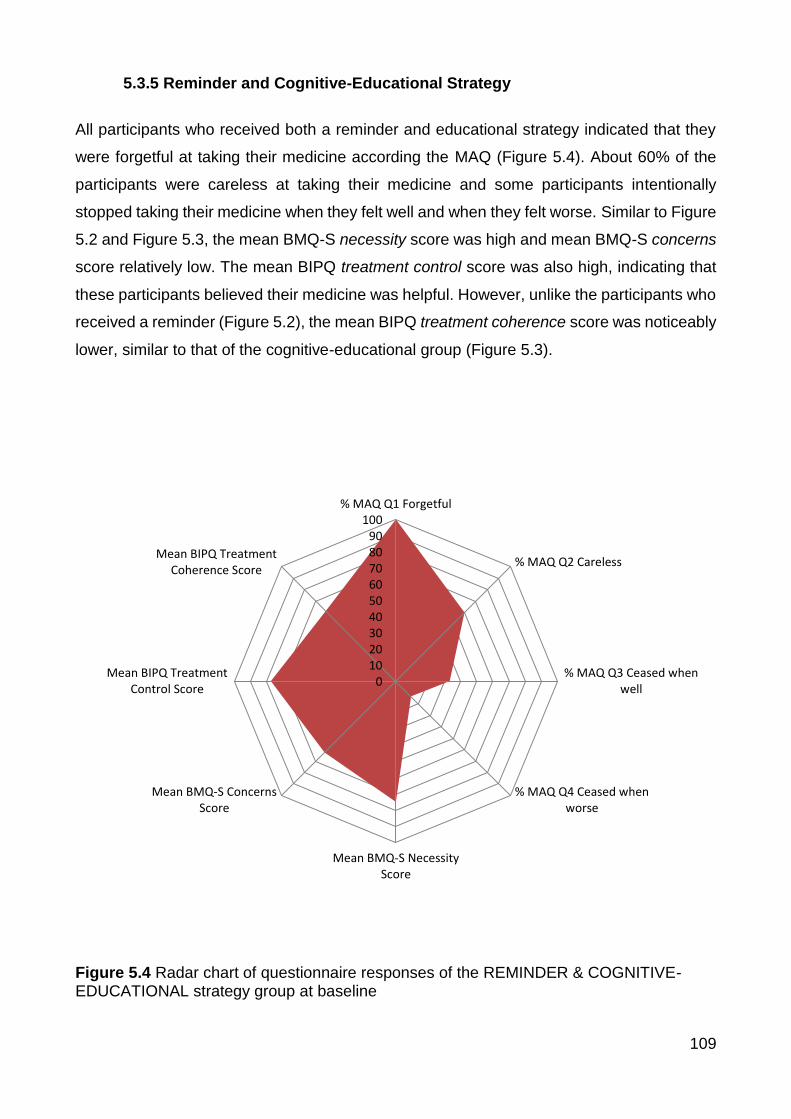
109
5.3.5 Reminder and Cognitive-Educational Strategy
All participants who received both a reminder and educational strategy indicated that they
were forgetful at taking their medicine according the MAQ (Figure 5.4). About 60% of the
participants were careless at taking their medicine and some participants intentionally
stopped taking their medicine when they felt well and when they felt worse. Similar to Figure
5.2 and Figure 5.3, the mean BMQ-S necessity score was high and mean BMQ-S concerns
score relatively low. The mean BIPQ treatment control score was also high, indicating that
these participants believed their medicine was helpful. However, unlike the participants who
received a reminder (Figure 5.2), the mean BIPQ treatment coherence score was noticeably
lower, similar to that of the cognitive-educational group (Figure 5.3).
Figure 5.4 Radar chart of questionnaire responses of the REMINDER & COGNITIVE-EDUCATIONAL strategy group at baseline
0102030405060708090
100% MAQ Q1 Forgetful
% MAQ Q2 Careless
% MAQ Q3 Ceased whenwell
% MAQ Q4 Ceased whenworse
Mean BMQ-S NecessityScore
Mean BMQ-S ConcernsScore
Mean BIPQ TreatmentControl Score
Mean BIPQ TreatmentCoherence Score

110
Case Examples of Individuals who received a Reminder and Cognitive-Educational
Strategy
Case 6: Participant 31 (Table 5.6)
Participant 31, is 75 years old and has been taking metformin extended-release 500mg once
daily for the last 12 weeks for the treatment of type 2 diabetes. She takes five prescription
medications for the treatment of diabetes, depression, osteoarthritis and hypothyroidism.
Table 5.6 Individual scores to validated scales at baseline (Participant 31)
MAQ BMQ-S BIPQ
Score Type Necessity Concerns Treatment
Control
Treatment
Coherence
3 2 24 12 10 2
MAQ Score: 1 (low non-adherence) to 4 (high non-adherence). Type: 0 = Unintentional non-adherence, 1 = Intentional
non adherence, 2 = Mix of both types.
BMQ-S: Necessity: 5 (low BMQ-S necessity score) to 25 (high BMQ-S necessity score), Concerns: 5 (low BMQ-S
concerns score) to 25 (high BMQ-S concerns score).
BIPQ: Treatment Control: 1 (treatment not helpful at all) to 10 (extremely helpful), Treatment Coherence: 1 (do not
understand at all) to 10 (understand very clearly).
Intervention
MAQ: Score of 3, both unintentionally and intentionally non-adherent.
BMQ-S: The BMQ-S indicates that her beliefs that her medicines are necessary are strong
and concerns about her medicine are relatively weak.
BIPQ: From the BIPQ, the participant seems to have a poor understanding of her medical
condition.
Discussion: It was evident from the discussion that the participant lacked knowledge on
her medical conditions but also on the purpose and benefits of all her medicines. Through
further discussion, it was determined that the participant stopped taking the metformin when
she was feeling “better” and thus forgot to take the medicine. The participant was also
111
uncertain as to why it was important to continue to take the medicine when she felt better.
She did not understand why people have illnesses and how tablets “know where to go.”
Adherence Strategy: The participant was educated on her medical conditions and on her
medicines. Information provided on her illnesses, particularly type 2 diabetes, included the
characteristics of diabetes, symptoms and risks associated with uncontrolled blood glucose
levels. The participant was educated on how the metformin works, the benefits of taking
metformin and the common side effects. The importance of adhering to her medications was
emphasised throughout the discussion. Since she was quite forgetful and had difficulty
managing her medicines, a dose administration aid was initiated by the pharmacy.
Case 7: Participant 41 (Table 5.7)
Participant 41 is 57 years old and currently taking three prescription medicines and was
prescribed rosuvastatin 10mg once daily, four weeks ago for the treatment of dyslipidaemia.
Table 5.7 Individual scores to validated scales at baseline (Participant 41)
MAQ BMQ-S BIPQ
Score Type Necessity Concerns Treatment
Control
Treatment
Coherence
4 2 24 24 8 10
MAQ Score: 1 (low non-adherence) to 4 (high non-adherence). Type: 0 = Unintentional non-adherence, 1 = Intentional
non adherence, 2 = Mix of both types.
BMQ-S: Necessity: 5 (low BMQ-S necessity score) to 25 (high BMQ-S necessity score), Concerns: 5 (low BMQ-S
concerns score) to 25 (high BMQ-S concerns score).
BIPQ: Treatment Control: 1 (treatment not helpful at all) to 10 (extremely helpful), Treatment Coherence: 1 (do not
understand at all) to 10 (understand very clearly).
Intervention
MAQ: Score of 4, both unintentionally and intentionally non-adherent.
BMQ-S: His beliefs that medicines are necessary are strong; however these beliefs are
balanced by his strong concerns about his medicines.

112
BIPQ: The BIPQ indicated that his illnesses significantly affected his life and he had strong
concerns about his illnesses. The BIPQ also suggested that he had a good understanding
of his illnesses, but discussion with the participant led the researcher to believe the contrary.
Discussion: The participant reported he was “terrible at taking medicines.” He is careless
at times when taking his medicine and forgets to take his medicine at least once a week.
Participant 41 often stops his medicines when he is feeling better and when experiencing
side effects, such as dizziness.
Adherence Strategy: The researcher supplied and showed the participant how to use a
dosette box to assist him with managing his medicines. Education was also provided on all
of his medicines, medical conditions and importance of adherence. The participant was
advised on the benefits of the medicines (e.g. rosuvastatin lowers cholesterol levels, which
minimises the risk of cardiovascular events), how taking each of the medications would
improve his medical conditions and hence the importance of taking his medications as
prescribed. Information about the common side effects was provided, including how to
manage the side effects, in particular, the dizziness he was experiencing. After discussion
with the participant’s GP, the participant was advised to take the rosuvastatin at night before
bed instead of in the morning to see whether that helps minimise the dizziness.
Summary of Reminder and Cognitive-Educational Strategy
These participants indicated that they were non-adherent due to forgetfulness or
carelessness and had poor knowledge about their illness and treatment. A combination of a
reminder and cognitive-educational strategy were implemented to support their adherence.
Indications for this type of strategy to be implemented included both unintentional non-
adherence identified using the MAQ and poor understanding on medicine and illness
identified using the BIPQ or through discussion. This was evident on the group radar chart
(Figure 5.4) and on an individual level.

113
5.3.6 Behavioural-Counselling Strategy
All participants in the behavioural-counselling group were identified by the MAQ as either
intentionally non-adherent or a mix of both types of non-adherence (Figure 5.5). There was
a low mean BMQ-S necessity score in this group when compared to the reminder (Figure
5.2) and cognitive-educational group (Figure 5.3). The mean BIPQ treatment control score
was high. Unlike the cognitive-educational group, the behavioural-counselling group had a
high mean BIPQ treatment coherence score, indicating that these participants had a clear
perceived understanding of their illness and treatment (Figure 5.5).
Figure 5.5 Radar chart of questionnaire responses of the BEHAVIOURAL-COUNSELLING strategy group at baseline
0
10
20
30
40
50
60
70
80
90
100% MAQ Q1 Forgetful
% MAQ Q2 Careless
% MAQ Q3 Ceased whenwell
% MAQ Q4 Ceased whenworse
Mean BMQ-S NecessityScore
Mean BMQ-S ConcernsScore
Mean BIPQ TreatmentControl Score
Mean BIPQ TreatmentCoherence Score

114
Case Examples of Individuals who received a Behavioural-Counselling Strategy
Case 8: Participant 7 (Table 5.8)
Participant 7 is 35 years old and has been taking ramipril 10mg for the last four weeks.
Table 5.8 Individual scores to validated scales at baseline (Participant 7)
MAQ BMQ-S BIPQ
Score Type Necessity Concerns Treatment
Control
Treatment
Coherence
3 2 15 18 5 10
MAQ Score: 1 (low non-adherence) to 4 (high non-adherence). Type: 0 = Unintentional non-adherence, 1 = Intentional
non adherence, 2 = Mix of both types.
BMQ-S: Necessity: 5 (low BMQ-S necessity score) to 25 (high BMQ-S necessity score), Concerns: 5 (low BMQ-S
concerns score) to 25 (high BMQ-S concerns score).
BIPQ: Treatment Control: 1 (treatment not helpful at all) to 10 (extremely helpful), Treatment Coherence: 1 (do not
understand at all) to 10 (understand very clearly).
Intervention
MAQ: Score of 3, both unintentionally and intentionally non-adherent.
BMQ-S: The BMQ-S indicated that her concerns about her medicine outweighed her
perceived necessity of the medicine.
BIPQ: The participant perceived that she had little control over her illness, that her treatment
was only moderately helpful and that she understood her condition very clearly.
Discussion: It was discovered that the participant has tried many other medicines to lower
blood pressure. The participant believes that it is highly unlikely that the new
antihypertensive medicine will improve her blood pressure. Pessimism about the new
medication to treat her hypertension was picked up during the discussion with the participant.
Adherence Strategy: The researcher provided health coaching by exploring the
participant’s views of treatment and helped the participant to establish goals of treatment;
for example, blood pressure target. Once goals of treatment were established, strategies to

115
attain these goals were discussed, including adhering to her medication and maintaining
daily physical exercise. The researcher measured the participant’s blood pressure and
provided her with a blood pressure monitoring diary. The participant was advised to check
her blood pressure at the pharmacy on a regular basis to help her observe the efficacy of
her medication.
Case 9: Participant 54 (Table 5.9)
Participant 54 initiated valsartan 40mg once daily 12 weeks ago for the treatment of
hypertension. The participant is 72 year old and is currently taking five prescription
medicines and one complementary medicine.
Table 5.9 Individual scores to validated scales at baseline (Participant 54)
MAQ BMQ-S BIPQ
Score Type Necessity Concerns Treatment
Control
Treatment
Coherence
1 1 20 17 8 5
MAQ Score: 1 (low non-adherence) to 4 (high non-adherence). Type: 0 = Unintentional non-adherence, 1 = Intentional
non adherence, 2 = Mix of both types.
BMQ-S: Necessity: 5 (low BMQ-S necessity score) to 25 (high BMQ-S necessity score), Concerns: 5 (low BMQ-S
concerns score) to 25 (high BMQ-S concerns score).
BIPQ: Treatment Control: 1 (treatment not helpful at all) to 10 (extremely helpful), Treatment Coherence: 1 (do not
understand at all) to 10 (understand very clearly).
Intervention
MAQ: Score of 1, intentionally non-adherent (ceased medicines when feeling better).
BMQ-S: The participant perceives their medicine is necessary; however, also holds strong
concerns about his medicine.
BIPQ: The responses to the BIPQ indicated that the participant has a moderate
understanding of his illness.
Discussion: The researcher further explored the participant’s beliefs and perceptions of his
medicines. The participant believes that “taking medicines for a long time would reduce the

116
effectiveness of the medicine.” The participant also believed that taking the same medication
for a long time “must not be good for the body.” Therefore, he had made an appointment
with a new GP to prescribe him a new medicine for hypertension (valsartan).
Adherence Strategy: The researcher also explored the participant’s treatment goals,
educated the participant on the silent nature of hypertension and the importance of
medication adherence. Education on his medications was provided in the hope of changing
his beliefs, including how medicines work and how some medicines may be effective for one
person and not another and hence sometimes medicines are prescribed based on a trial
and error approach. During the baseline interview, the researcher conducted a blood
pressure measurement and advised him to regular check his blood pressure to monitor the
effectiveness of the medication.
Summary of Behavioural-Counselling Strategies
Behavioural-counselling strategies implemented included health coaching and exploring
beliefs about medicines and illness perceptions in more depth. Health coaching is used as
an adherence intervention by facilitating the establishment of treatment goals to support
adherence to medications (Case 8). The health coaching provided in this study was
considerably more abbreviated compared to the health coaching described to improve
adherence in the literature.226,250 Health coaching with evidence in the literature usually
involves multiple sessions over a long period of time and conducted by a trained
personnel.250 Our goal was to provide a relatively quick intervention to improve medication
adherence that may have the potential to be readily translated into clinical practice.

117
5.3.7 Social Support Strategy
The discussion with the participant and caregiver was the driving force in the decision to
implement a social support strategy to improve adherence. Most participants were identified
as unintentionally non-adherent due to forgetfulness and carelessness using the MAQ
(Figure 5.6). The mean BMQ-S necessity score was high and BMQ-S concerns score was
low, compared to participants who received a behavioural-counselling strategy (Figure 5.5).
The mean BMQ-S scores appear similar to those that received a reminder strategy (Figure
5.2). Both the mean BIPQ treatment control score and mean BIPQ treatment coherence
score were high, showing that these participants believed the medicine was helpful and
believed that they had a clear understanding of their illness (Figure 5.6). From the discussion
with these participants, it was evident that they may need some support with managing their
medications. See individual cases for further details (Table 5.10 and Table 5.11).
Figure 5.6 Radar chart of questionnaire responses of the SOCIAL SUPPORT strategy group at baseline
0102030405060708090
100% MAQ Q1 Forgetful
% MAQ Q2 Careless
% MAQ Q3 Ceased whenwell
% MAQ Q4 Ceased whenworse
Mean BMQ-S NecessityScore
Mean BMQ-S ConcernsScore
Mean BIPQ TreatmentControl Score
Mean BIPQ TreatmentCoherence Score

118
Case Examples of Individuals who received a Social Support Strategy
Case 10: Participant 80 (Table 5.10)
Participant 80 is 65 years old and was prescribed amlodipine 10mg once daily, four weeks
ago to lower his blood pressure.
Table 5.10 Individual scores to validated scales at baseline (Participant 80)
MAQ BMQ-S BIPQ
Score Type Necessity Concerns Treatment
Control
Treatment
Coherence
2 0 24 9 10 8
MAQ Score: 1 (low non-adherence) to 4 (high non-adherence). Type: 0 = Unintentional non-adherence, 1 = Intentional
non adherence, 2 = Mix of both types.
BMQ-S: Necessity: 5 (low BMQ-S necessity score) to 25 (high BMQ-S necessity score), Concerns: 5 (low BMQ-S
concerns score) to 25 (high BMQ-S concerns score).
BIPQ: Treatment Control: 1 (treatment not helpful at all) to 10 (extremely helpful), Treatment Coherence: 1 (do not
understand at all) to 10 (understand very clearly).
Intervention
MAQ: Score of 2, unintentionally non-adherent.
BMQ: Responses to the BMQ-S indicate that the participant believed their medicine was
necessary and had relatively minimal concerns about his medicine.
BIPQ: Participant 80 felt that he had moderate control over his illness, perceived that the
medicines were extremely helpful and had a good perceived understanding of his illness.
Discussion: From the discussion with the participant, the participant had great difficulty in
remembering to take his medicines due to early onset dementia. His daughter who was
there at the baseline interview told the researcher that she takes care of him at home;
however, did not look after his medicines.

119
Adherence Strategy: Therefore, the researcher advised the daughter to support the
participant with his medications. Since the participant was currently taking 12 medicines, a
dose administration aid was also initiated by the pharmacy to assist the daughter in
supporting the participant with his medications.
Summary of Social Support Strategy
Social support strategies were indicated in participant’s identified as requiring support with
managing their medications. Decision to implement this type of strategy relied on the
discussion with the participant and carer, more so than the responses to the adherence
scales. Discussion with these participants identified a need of support from a family member
with their medication-taking behaviour. In the literature, social support strategies to improve
medication adherence typically involved peer support group therapy. Overall these peer
support groups have not been very successful at improving adherence (Section 1.6.2). Our
study on the other hand, involved a close family member to support the participant with their
medication-taking behaviour or supporting their decision by discussing with their GP.
5.4 Flow Diagram of Tailoring Adherence Intervention (Post-Implementation)
After data collection was complete, we explored the common responses to the scales and
discussion with the participants in each of the types of tailored strategies. The MAQ was
used to identify medication-taking behaviour and whether the participant’s non-adherence
was unintentional, intentional or a mix of both. The BMQ-S provided information on the
participant’s beliefs that medicines were necessary and their concerns regarding their
medicines. The BIPQ explored the participant’s illness perceptions that have been
associated with adherence. This information guided the discussion about what may be
influencing the participant’s non-adherence. This helped inform the implementation of a
tailored strategy to improve their medication adherence. From this data, I was able to
generate a flow diagram that may help explain my thought process when deciding which
strategy to implement (Figure 5.7). Approximately 63% of the participants fit in this model.
The responses to the validated scales helped to inform the discussion with the participant
to identify or confirm the reason for non-adherence. The selection of the tailored strategy
120
relied on this discussion with the participant, which may explain why 37% of participants did
not fit into this model, as shown in Figure 5.7. It was quite easy to select an appropriate
tailored strategy to improve adherence for each individual based on the responses to the
MAQ, BMQ-S, BIPQ and discussion. However, to describe how each of these groups were
treated was much more difficult due to the many different variables identified in the
discussion. The groups were indistinct and there was some overlap, particularly between
the cognitive-educational and behavioural-counselling strategy groups.
We hope that with a larger study, a potential “toolkit”/flow diagram could be designed to
assist health professionals to implement a tailored intervention to improve medication
adherence based on their responses to the MAQ, BMQ-S and BIPQ. This flow diagram
would help health professionals to select the most appropriate intervention to improve the
patient’s adherence to the medication.

121
Figure 5.7 Flow diagram of outcomes of the adherence scales used to inform the discussion with the participant and implementation of the tailored strategy
122
5.5 Conclusions
Chapter Five described the targeted and tailored intervention which was informed by
responses to validated scales (MAQ, BMQ-S and BIPQ) and discussion with the participant.
The responses to the scales provided insight into the participant’s reasons for non-
adherence, which guided the discussion and implementation of a tailored strategy to
improve adherence. As illustrated in the case examples, this intervention is simple and easy
to administer, hence would have the potential for implementation in clinical practice.
The radar charts were presented in Chapter Five to provide a graphical representation of
the similarities and differences in responses to the scales between participants who received
different tailored strategies. From these radar charts, we can visually observe that these
participants had different barriers to adherence, beliefs and illness perceptions that may
explain their non-adherence. These responses to the adherence scales or patterns of the
radar charts may help in the implementation of a tailored intervention in practice.
Chapter Six will explore how adherence, beliefs about the medicine and illness perceptions
changed over time in the study sample

123
CHAPTER SIX: RESULTS 3 - CHANGES IN ADHERENCE OVER SIX MONTHS
6.1 Introduction
The intervention targeted to non-adherent participants and tailored to the participant-specific
reasons for non-adherence significantly improved adherence at three months, as presented
in Chapter Four. This significant improvement in adherence was sustained at six months.
Chapter Five provided detail on the intervention that included how the responses to the
adherence scales and discussion with the participant informed the tailored strategy.
This chapter addresses the following hypothesis:
- Hypothesis 3: Adherence, and reasons for non-adherence (beliefs about medicines
and illness perceptions), will change over time in all groups studied.
Chapter Six explores the differences between the intervention, control and adherent groups
in relation to adherence to the medication (MAQ), beliefs about the medicine (BMQ-S) and
illness perceptions (BIPQ) over the six months and changes over time. We were interested
in exploring the changes in the groups to see if there were patterns emerging in relation to
adherence. Changes in adherence, beliefs and illness perceptions were also explored for
each of the different types of adherence strategies implemented to determine if there were
any patterns to explain how the intervention improved medication adherence.
6.2 Differences between the Adherent, Intervention and Control Groups
At baseline, there were differences in medication adherence, beliefs about medicines and
illness perceptions between the adherent and non-adherent (intervention and control)
groups. Over time, adherence, beliefs about the medication and illness perceptions changed
differently in each of the groups.
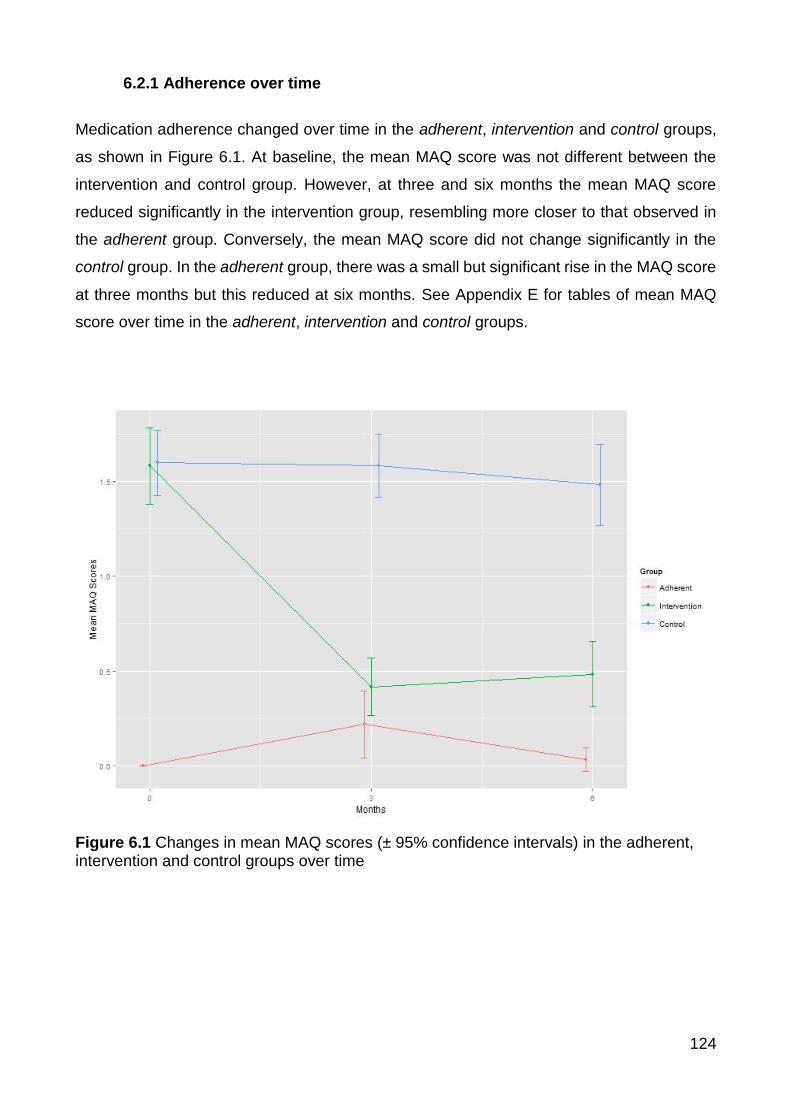
124
6.2.1 Adherence over time
Medication adherence changed over time in the adherent, intervention and control groups,
as shown in Figure 6.1. At baseline, the mean MAQ score was not different between the
intervention and control group. However, at three and six months the mean MAQ score
reduced significantly in the intervention group, resembling more closer to that observed in
the adherent group. Conversely, the mean MAQ score did not change significantly in the
control group. In the adherent group, there was a small but significant rise in the MAQ score
at three months but this reduced at six months. See Appendix E for tables of mean MAQ
score over time in the adherent, intervention and control groups.
Figure 6.1 Changes in mean MAQ scores (± 95% confidence intervals) in the adherent, intervention and control groups over time

125
6.2.2 BMQ-S Necessity over time
Figure 6.2 presents the mean BMQ-S necessity scores at baseline, three and six months in
the adherent, intervention and control groups. At baseline there were no significant
differences in the BMQ-S necessity scores between the three groups. However, over the
study period, the BMQ-S necessity scores increased in the intervention group and
decreased in the control group. The BMQ-S necessity scores in the control group were
significantly lower than both the adherent and intervention groups at six months. This
suggests that the beliefs held by the participants in the adherent and intervention groups
towards the necessity of their medicines were similar and stronger than those held by
participants in the control group at the end of the study.
Figure 6.2 Changes in mean BMQ-S necessity scores (± 95% confidence intervals) in the adherent, intervention and control groups over time

126
6.2.3 BMQ-S Concerns over time
The changes in the mean BMQ-S concern scores in the adherent, intervention and control
groups over time are shown in Figure 6.3. At baseline there was no significant difference
between the three groups, although the BMQ-S concerns score was lower in the adherent
group compared with the non-adherent (intervention and control) group. Over the study
period the BMQ-S concerns score decreased for both the adherent group and the
intervention group and increased for the control group. This suggests that the strength of
concerns beliefs towards medicines reduced in those participants in the adherent and
intervention groups and increased in those participants in the control group. Appendix F
provides the mean BMQ-S necessity and concerns scores over time in the adherent,
intervention and control groups.
Figure 6.3 Changes in mean BMQ-S concerns scores (± 95% confidence intervals) in the adherent, intervention and control groups over time

127
6.2.4 BIPQ Treatment Control over time
Although not statistically significant, Figure 6.4 shows that the intervention and control group
had a lower mean BIPQ treatment control score at baseline than the adherent group,
reflecting that the non-adherent (intervention and control) group may have felt that their
medication was less helpful in treating their illness. As time progressed, this changed with
the BIPQ treatment control score increasing in the intervention group suggesting that they
perceived their medication was more helpful in treating their illness. In contrast the score
decreased in the control group suggesting that they perceived their medication was less
helpful in treating their illness. In other words, the intervention group moved in a direction
closer to that of the adherent group in regards to how helpful they perceived their medication
and the control group moved further away from the adherent group.
Figure 6.4 Changes in mean BIPQ treatment control scores (± 95% confidence intervals) in the adherent, intervention and control groups over time

128
6.2.5 BIPQ Treatment Coherence over time
Figure 6.5 presents the mean BIPQ treatment coherence scores in the three groups over
time. Participants in the adherent group at baseline had a better understanding of their
illness and treatment than the non-adherent (intervention and control) group at baseline. As
time progressed, the mean BIPQ treatment coherence scores increased in the intervention
group suggesting that their understanding of their illness and treatment improved. In the
control group the mean BIPQ treatment coherence scores decreased suggesting that their
understanding of their illness and treatment was not as clear over time. From Figure 6.5, we
can see that over time, the three groups had different changes in their understanding of their
illness and treatment. For more details on changes in illness perceptions over time in the
adherent, intervention and control group, see Appendix G.
Figure 6.5 Changes in mean BIPQ treatment coherence scores (± 95% confidence intervals) in the adherent, intervention and control groups over time

129
The targeted and tailored intervention changed beliefs about medicines and illness
perceptions over time, which was mirrored by a significant improvement in medication
adherence. The changes in beliefs about medicines and illness perceptions in the
intervention group moved towards a pattern similar to that of the adherent group. The control
group seemed to have more negative beliefs about the medicines and poorer illness
perceptions over time. To better understand how the intervention improved adherence, the
changes in beliefs about the medication and illness perceptions were explored within each
of the tailored strategies.
6.3 Changes in each of the Tailored Strategy Groups
6.3.1 Reminder Strategy Group (n=27)
Participants identified with forgetfulness or carelessness as a barrier to their adherence were
provided with a reminder strategy to support their adherence. The reminder strategy group
had a higher mean BMQ-S necessity score, a lower mean BMQ-S concerns score and a
higher mean BIPQ coherence score than the intervention group at baseline.
The mean MAQ score in the reminder strategy group reduced significantly at three and six
months (p<0.001). The mean BMQ-S concerns score was significantly lower at six months
compared to baseline and three months (Table 6.1). The mean BIPQ coherence score was
significantly higher at 3 months and 6 months, compared to baseline (Table 6.1).

130
Table 6.1 Change in mean MAQ, BMQ-S, and BIPQ treatment and coherence scores over time in the REMINDER strategy group
Reminder Time
p-value
Baseline 3 months 6 months 0 to 3 months
0 to 6 months
3 to 6 months
Mean MAQ score
1.30±0.47
0.33±0.55 0.30±0.54 <0.05* <0.05* 0.7457
Mean BMQ-S Necessity score
20.07±2.81 20.00±2.73 20.19±2.84 0.8591 0.8274 0.6959
Mean BMQ-S Concerns score
12.19±2.99 11.44±2.67 10.59±3.13 0.1546 <0.05* <0.05*
Mean BIPQ Treatment Control score
8.59±1.50 8.81±1.33 8.63±1.62 0.5229 0.9188 0.5971
Mean BIPQ Coherence score
8.26±1.53 8.81±1.39 9.15±0.95 <0.05* <0.05* 0.2403
At baseline, all participants who received a reminder strategy to improve adherence were
identified as unintentionally non-adherent due to forgetfulness or carelessness, based on
the MAQ (Figure 6.6). The radar charts in Figure 6.6 are a visual representation of how
adherence, beliefs about medicines and illness perceptions changed over time in the
reminder strategy group. It can be seen quite clearly in the three- and six-month radar charts
that most of these participants were no longer unintentionally non-adherent to their medicine.
As we progress through the radar charts, baseline to three months to six months, it can be
seen that adherence improves, concerns about medicines declines and treatment
coherence score improves (Figure 6.6).

131
0102030405060708090
100% MAQ Q1 Forgetful
% MAQ Q2 Careless
% MAQ Q3 Ceased whenwell
% MAQ Q4 Ceased whenworse
Mean BMQ-S NecessityScore
Mean BMQ-S ConcernsScore
Mean BIPQ TreatmentControl Score
Mean BIPQ TreatmentCoherence Score
Baseline
0
10
20
30
40
50
60
70
80
90
100
% MAQ Q1
% MAQ Q2
% MAQ Q3
% MAQ Q4
Mean BMQ-S NecessityScore
Mean BMQ-S ConcernsScore
Mean BIPQ TreatmentControl Score
Mean BIPQ TreatmentCoherence Score
3 months

132
Figure 6.6 Radar charts at baseline, 3 months and 6 months for the REMINDER strategy group
0102030405060708090
100
% MAQ Q1
% MAQ Q2
% MAQ Q3
% MAQ Q4
Mean BMQ-S NecessityScore
Mean BMQ-S ConcernsScore
Mean BIPQ TreatmentControl Score
Mean BIPQ TreatmentCoherence Score
6 months
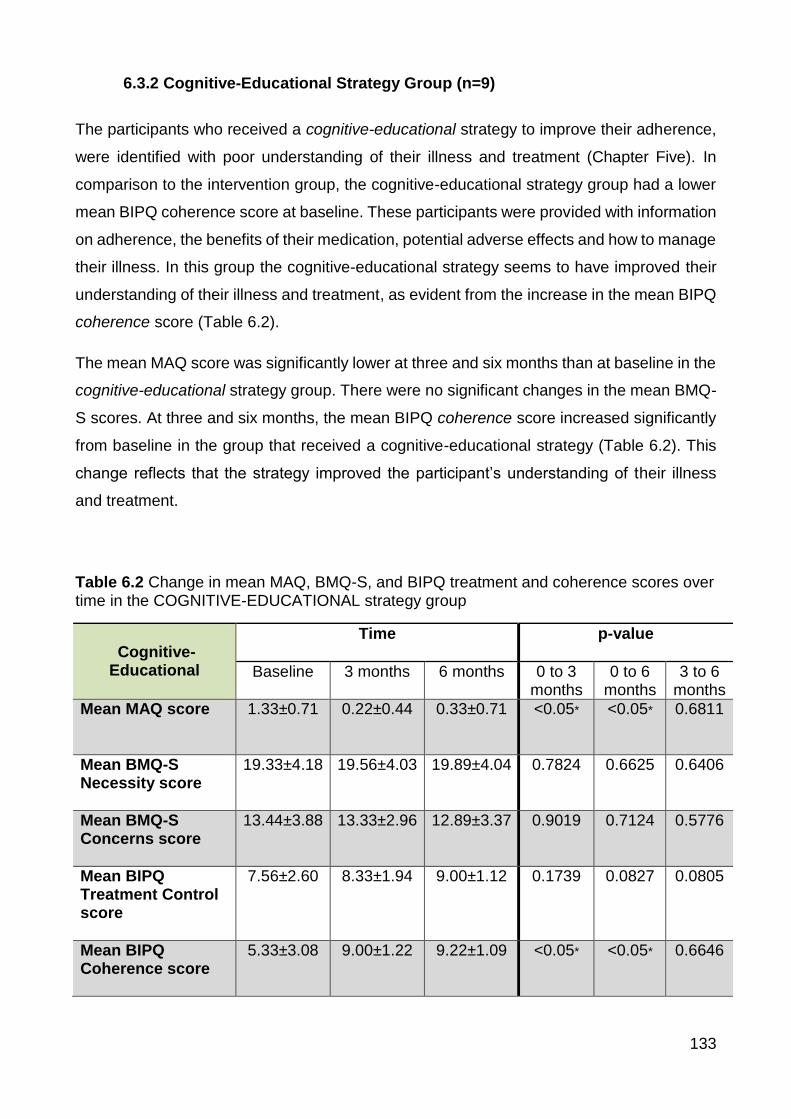
133
6.3.2 Cognitive-Educational Strategy Group (n=9)
The participants who received a cognitive-educational strategy to improve their adherence,
were identified with poor understanding of their illness and treatment (Chapter Five). In
comparison to the intervention group, the cognitive-educational strategy group had a lower
mean BIPQ coherence score at baseline. These participants were provided with information
on adherence, the benefits of their medication, potential adverse effects and how to manage
their illness. In this group the cognitive-educational strategy seems to have improved their
understanding of their illness and treatment, as evident from the increase in the mean BIPQ
coherence score (Table 6.2).
The mean MAQ score was significantly lower at three and six months than at baseline in the
cognitive-educational strategy group. There were no significant changes in the mean BMQ-
S scores. At three and six months, the mean BIPQ coherence score increased significantly
from baseline in the group that received a cognitive-educational strategy (Table 6.2). This
change reflects that the strategy improved the participant’s understanding of their illness
and treatment.
Table 6.2 Change in mean MAQ, BMQ-S, and BIPQ treatment and coherence scores over time in the COGNITIVE-EDUCATIONAL strategy group
Cognitive-Educational
Time
p-value
Baseline 3 months 6 months 0 to 3 months
0 to 6 months
3 to 6 months
Mean MAQ score
1.33±0.71 0.22±0.44 0.33±0.71 <0.05* <0.05* 0.6811
Mean BMQ-S Necessity score
19.33±4.18 19.56±4.03 19.89±4.04 0.7824 0.6625 0.6406
Mean BMQ-S Concerns score
13.44±3.88 13.33±2.96 12.89±3.37 0.9019 0.7124 0.5776
Mean BIPQ Treatment Control score
7.56±2.60 8.33±1.94 9.00±1.12 0.1739 0.0827 0.0805
Mean BIPQ Coherence score
5.33±3.08 9.00±1.22 9.22±1.09 <0.05* <0.05* 0.6646

134
Changes in adherence, beliefs about medicines and illness perceptions over time in the
cognitive-educational strategy group can be observed in the radar charts in Figure 6.7. At
baseline, the mean BIPQ treatment coherence score was low, indicating poor understanding
of illness. As we move to the three- and six-month radar chart, we can see an increase in
this score, reflecting an improvement in understanding. Most participants in the cognitive-
educational strategy group were identified as being intentionally non-adherent. From the
radar charts, we can see that most of these participants were no longer intentionally non-
adherent (Figure 6.7).

135
0102030405060708090
100% MAQ Q1 Forgetful
% MAQ Q2 Careless
% MAQ Q3 Ceased whenwell
% MAQ Q4 Ceased whenworse
Mean BMQ-S NecessityScore
Mean BMQ-S Concerns Score
Mean BIPQ TreatmentControl Score
Mean BIPQ TreatmentCoherence Score
Baseline
0
10
20
30
40
50
60
70
80
90
100
% MAQ Q1
% MAQ Q2
% MAQ Q3
% MAQ Q4
Mean BMQ-S NecessityScore
Mean BMQ-S ConcernsScore
Mean BIPQ TreatmentControl Score
Mean BIPQ TreatmentCoherence Score
3 months
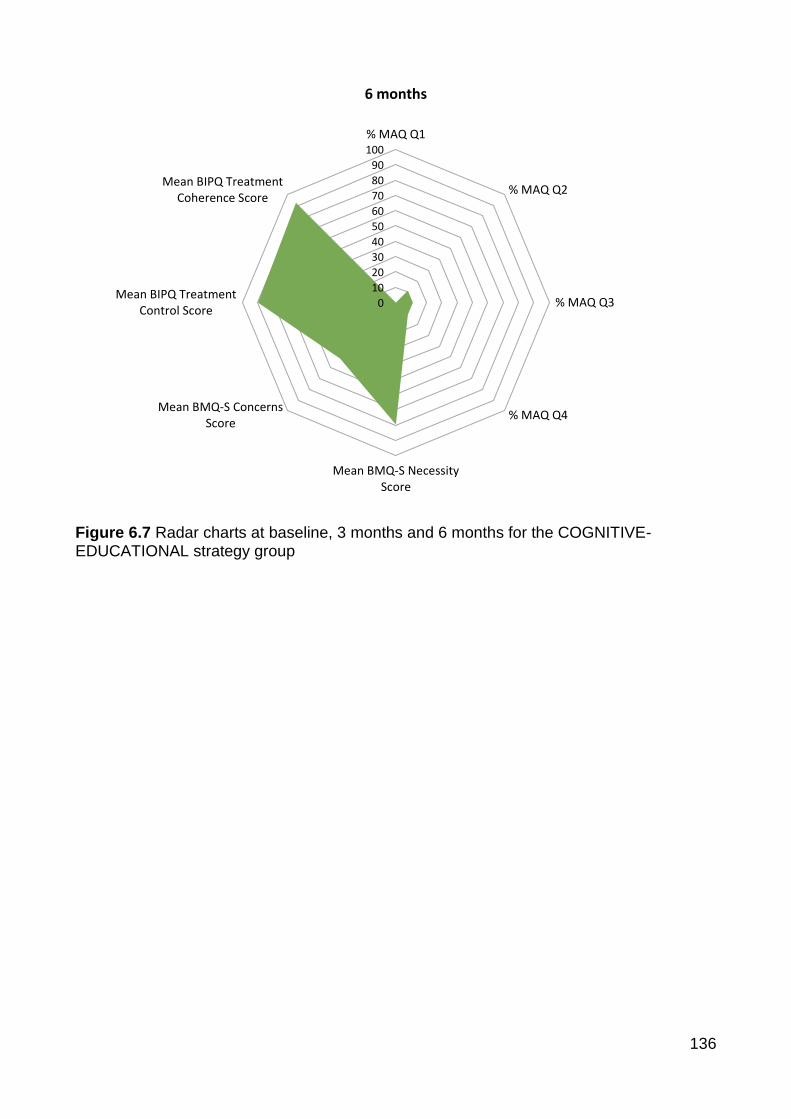
136
Figure 6.7 Radar charts at baseline, 3 months and 6 months for the COGNITIVE-EDUCATIONAL strategy group
0
10
20
30
40
50
60
70
80
90
100
% MAQ Q1
% MAQ Q2
% MAQ Q3
% MAQ Q4
Mean BMQ-S NecessityScore
Mean BMQ-S ConcernsScore
Mean BIPQ TreatmentControl Score
Mean BIPQ TreatmentCoherence Score
6 months
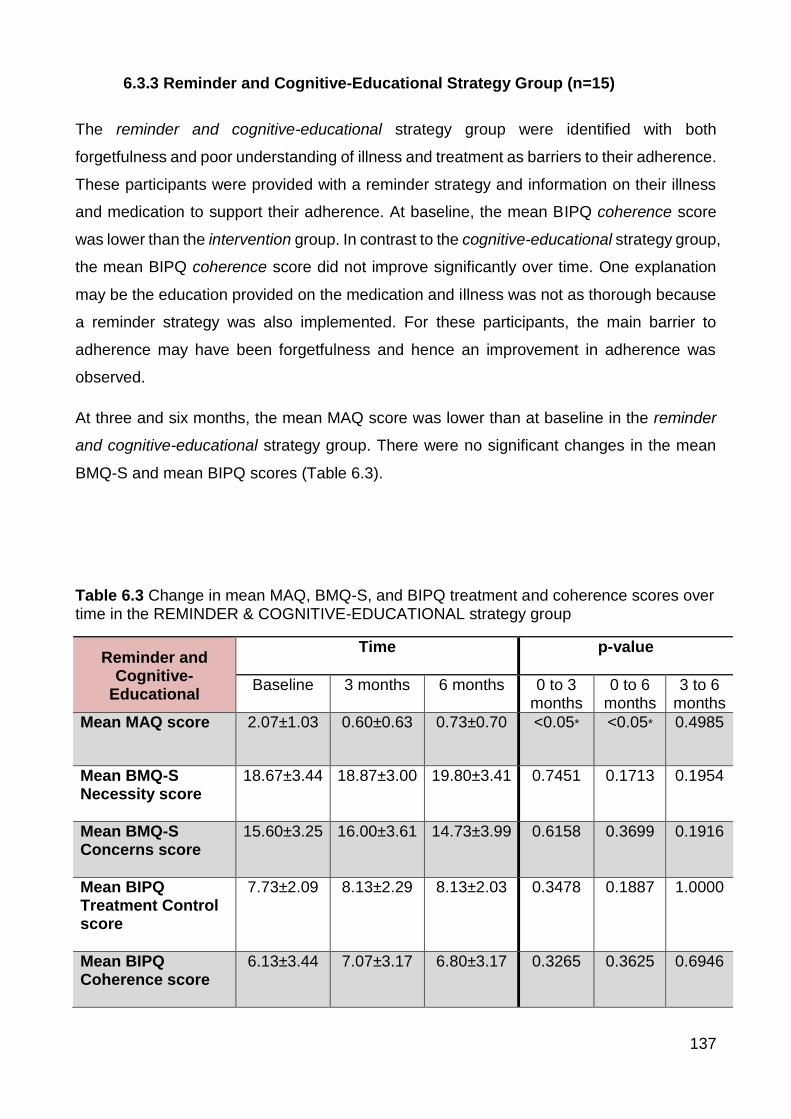
137
6.3.3 Reminder and Cognitive-Educational Strategy Group (n=15)
The reminder and cognitive-educational strategy group were identified with both
forgetfulness and poor understanding of illness and treatment as barriers to their adherence.
These participants were provided with a reminder strategy and information on their illness
and medication to support their adherence. At baseline, the mean BIPQ coherence score
was lower than the intervention group. In contrast to the cognitive-educational strategy group,
the mean BIPQ coherence score did not improve significantly over time. One explanation
may be the education provided on the medication and illness was not as thorough because
a reminder strategy was also implemented. For these participants, the main barrier to
adherence may have been forgetfulness and hence an improvement in adherence was
observed.
At three and six months, the mean MAQ score was lower than at baseline in the reminder
and cognitive-educational strategy group. There were no significant changes in the mean
BMQ-S and mean BIPQ scores (Table 6.3).
Table 6.3 Change in mean MAQ, BMQ-S, and BIPQ treatment and coherence scores over time in the REMINDER & COGNITIVE-EDUCATIONAL strategy group
Reminder and Cognitive-
Educational
Time
p-value
Baseline 3 months 6 months 0 to 3 months
0 to 6 months
3 to 6 months
Mean MAQ score
2.07±1.03 0.60±0.63 0.73±0.70 <0.05* <0.05* 0.4985
Mean BMQ-S Necessity score
18.67±3.44 18.87±3.00 19.80±3.41 0.7451 0.1713 0.1954
Mean BMQ-S Concerns score
15.60±3.25 16.00±3.61 14.73±3.99 0.6158 0.3699 0.1916
Mean BIPQ Treatment Control score
7.73±2.09 8.13±2.29 8.13±2.03 0.3478 0.1887 1.0000
Mean BIPQ Coherence score
6.13±3.44 7.07±3.17 6.80±3.17 0.3265 0.3625 0.6946

138
The radar charts presented in Figure 6.8 show the changes in adherence, beliefs about
medicines and illness perceptions from baseline to six months in the reminder and cognitive-
educational strategy group. From the baseline radar chart, we can see that all participants
were unintentionally non-adherent to their medication due forgetfulness or carelessness,
and had a relatively poor understanding of their illness. Moving on to the three and six month
radar charts, it shows that most participants are no longer non-adherent and perceived
coherence has slightly improved (Figure 6.8).

139
0102030405060708090
100% MAQ Q1 Forgetful
% MAQ Q2 Careless
% MAQ Q3 Ceased whenwell
% MAQ Q4 Ceased whenworse
Mean BMQ-S NecessityScore
Mean BMQ-S ConcernsScore
Mean BIPQ TreatmentControl Score
Mean BIPQ TreatmentCoherence Score
Baseline
0
10
20
30
40
50
60
70
80
90
100
% MAQ Q1
% MAQ Q2
% MAQ Q3
% MAQ Q4
Mean BMQ-S Necessity Score
Mean BMQ-S Concerns Score
Mean BIPQ TreatmentControl Score
Mean BIPQ TreatmentCoherence Score
3 months

140
Figure 6.8 Radar charts at baseline, 3 months and 6 months for the REMINDER AND COGNITIVE-EDUCATIONAL strategy group
6.3.4 Behavioural-Counselling Strategy Group (n=4)
A behavioural-counselling strategy was implemented in participants with negative beliefs
about their medicines and/or lacking optimism or motivation with their medication. In this
strategy group, the mean BMQ-S necessity score was lower and the mean BMQ-S concerns
score was relatively higher than the intervention group at baseline. The mean BIPQ
coherence score was higher than the intervention group, indicating that this group had a
better understanding of their illness. The mean BIPQ treatment control score in the
behavioural-counselling strategy group was relatively lower than the intervention group at
baseline. At six months, the mean BIPQ treatment control score increased to ten, indicating
the participants in this group perceived their medicine was more helpful.
0
10
20
30
40
50
60
70
80
90
100
% MAQ Q1
% MAQ Q2
% MAQ Q3
% MAQ Q4
Mean BMQ-S NecessityScore
Mean BMQ-S ConcernsScore
Mean BIPQ TreatmentControl Score
Mean BIPQ TreatmentCoherence Score
6 months

141
Mean MAQ decreased significantly at three months in the behavioural-counselling strategy
group, but this was not sustained at six months. The mean BMQ-S necessity score
increased over time and the mean BMQ-S concerns score decreased over time. The mean
BIPQ treatment control score increased over time, reflecting that the medicine was
perceived as more helpful in treating their illness (Table 6.4). The changes in the mean
BMQ-S and BIPQ scores were not significant, which may be explained by the small sample
size in this group (n=4).
Table 6.4 Change in mean MAQ, BMQ-S, and BIPQ treatment and coherence scores over time in the BEHAVIOURAL-COUNSELLING strategy group
Behavioural-Counselling
Time
p-value
Baseline 3 months 6 months 0 to 3 months
0 to 6 months
3 to 6 months
Mean MAQ score
2.00±1.15 0.25±0.50 0.50±1.00 <0.05* 0.0577 0.7177
Mean BMQ-S Necessity score
18.50±2.65 20.50±2.08 21.75±2.87 0.4437 0.2444 0.2783
Mean BMQ-S Concerns score
14.50±3.70 13.50±3.32 12.25±4.03 0.5137 0.2289 0.1411
Mean BIPQ Treatment Control score
7.75±2.06 8.25±2.06 10.00±0.00 0.6376 0.1170 0.1881
Mean BIPQ Coherence score
8.25±2.36 8.50±1.73 8.00±2.16 0.6376 0.3910 0.1817
Figure 6.9 is a pictorial representation of the changes in adherence, beliefs about medicines
and illness perceptions in the behavioural-counselling strategy group. As observed on the
baseline radar chart, all participants in this group were identified with intentional non-
adherence due to ceasing the medicine when feeling well. As we progress through the radar
charts from baseline to three months and six months, the mean BMQ-S necessity score
increases and the mean BMQ-S concerns score decreases in the behavioural-counselling
strategy group (Figure 6.9).

142
0102030405060708090
100% MAQ Q1 Forgetful
% MAQ Q2 Careless
% MAQ Q3 Ceased whenwell
% MAQ Q4 Ceased whenworse
Mean BMQ-S NecessityScore
Mean BMQ-S ConcernsScore
Mean BIPQ TreatmentControl Score
Mean BIPQ TreatmentCoherence Score
Baseline
0
10
20
30
40
50
60
70
80
90
100
% MAQ Q1
% MAQ Q2
% MAQ Q3
% MAQ Q4
Mean BMQ-S NecessityScore
Mean BMQ-S ConcernsScore
Mean BIPQ TreatmentControl Score
Mean BIPQ TreatmentCoherence Score
3 months

143
Figure 6.9 Radar charts at baseline, 3 months and 6 months for the BEHAVIOURAL-COUNSELLING strategy group
0
10
20
30
40
50
60
70
80
90
100
% MAQ Q1
% MAQ Q2
% MAQ Q3
% MAQ Q4
Mean BMQ-S NecessityScore
Mean BMQ-S ConcernsScore
Mean BIPQ TreatmentControl Score
Mean BIPQ TreatmentCoherence Score
6 months
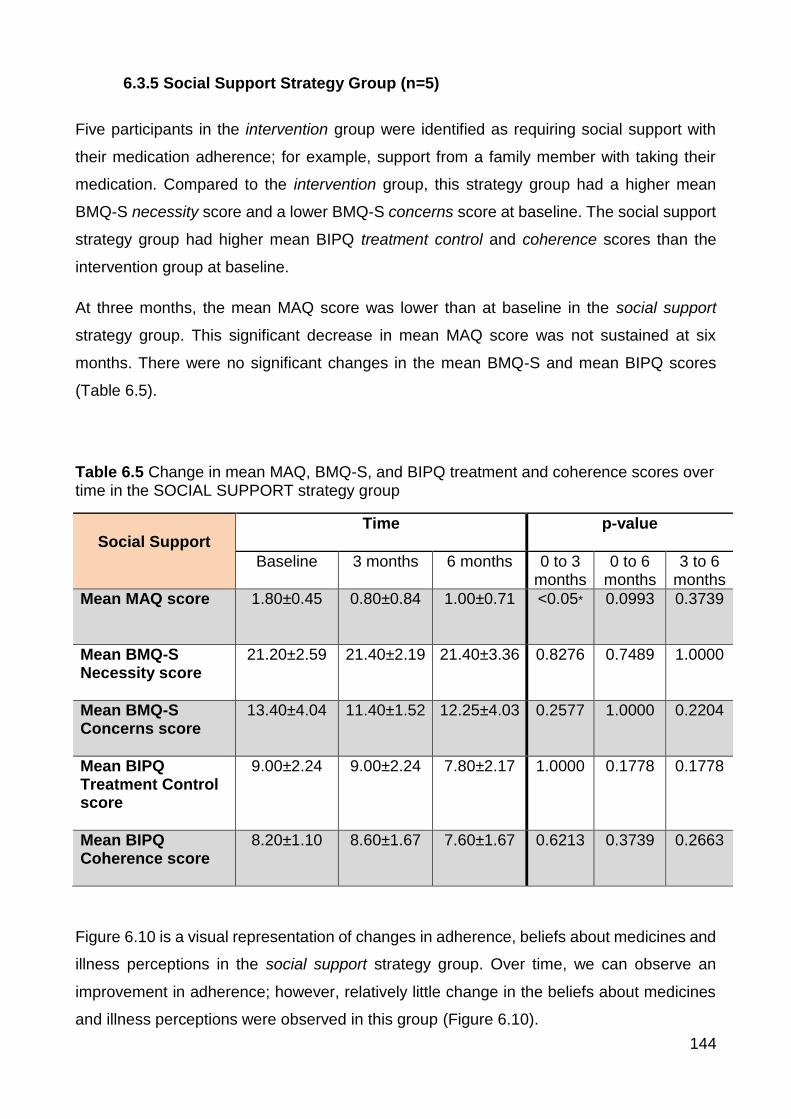
144
6.3.5 Social Support Strategy Group (n=5)
Five participants in the intervention group were identified as requiring social support with
their medication adherence; for example, support from a family member with taking their
medication. Compared to the intervention group, this strategy group had a higher mean
BMQ-S necessity score and a lower BMQ-S concerns score at baseline. The social support
strategy group had higher mean BIPQ treatment control and coherence scores than the
intervention group at baseline.
At three months, the mean MAQ score was lower than at baseline in the social support
strategy group. This significant decrease in mean MAQ score was not sustained at six
months. There were no significant changes in the mean BMQ-S and mean BIPQ scores
(Table 6.5).
Table 6.5 Change in mean MAQ, BMQ-S, and BIPQ treatment and coherence scores over time in the SOCIAL SUPPORT strategy group
Social Support Time
p-value
Baseline 3 months 6 months 0 to 3 months
0 to 6 months
3 to 6 months
Mean MAQ score
1.80±0.45 0.80±0.84 1.00±0.71 <0.05* 0.0993 0.3739
Mean BMQ-S Necessity score
21.20±2.59 21.40±2.19 21.40±3.36 0.8276 0.7489 1.0000
Mean BMQ-S Concerns score
13.40±4.04 11.40±1.52 12.25±4.03 0.2577 1.0000 0.2204
Mean BIPQ Treatment Control score
9.00±2.24 9.00±2.24 7.80±2.17 1.0000 0.1778 0.1778
Mean BIPQ Coherence score
8.20±1.10 8.60±1.67 7.60±1.67 0.6213 0.3739 0.2663
Figure 6.10 is a visual representation of changes in adherence, beliefs about medicines and
illness perceptions in the social support strategy group. Over time, we can observe an
improvement in adherence; however, relatively little change in the beliefs about medicines
and illness perceptions were observed in this group (Figure 6.10).

145
0102030405060708090
100% MAQ Q1 Forgetful
% MAQ Q2 Careless
% MAQ Q3 Ceased whenwell
% MAQ Q4 Ceased whenworse
Mean BMQ-S NecessityScore
Mean BMQ-S ConcernsScore
Mean BIPQ TreatmentControl Score
Mean BIPQ TreatmentCoherence Score
Baseline
0
10
20
30
40
50
60
70
80
90
100
% MAQ Q1
% MAQ Q2
% MAQ Q3
% MAQ Q4
Mean BMQ-S NecessityScore
Mean BMQ-S ConcernsScore
Mean BIPQ TreatmentControl Score
Mean BIPQ TreatmentCoherence Score
3 months

146
Figure 6.10 Radar charts at baseline, 3 months and 6 months for the SOCIAL SUPPORT strategy group
0
10
20
30
40
50
60
70
80
90
100
% MAQ Q1
% MAQ Q2
% MAQ Q3
% MAQ Q4
Mean BMQ-S NecessityScore
Mean BMQ-S ConcernsScore
Mean BIPQ TreatmentControl Score
Mean BIPQ TreatmentCoherence Score
6 months

147
6.3.6 Overall View of the Changes in Adherence Scale Scores over time for each
Tailored Strategy
Figure 6.11 and 6.12 are an overall summary of the changes in the mean scores of the MAQ,
BMQ-S and two items of the BIPQ (treatment control and coherence) in each of the tailored
strategy groups at three and six months, respectively. At three months, little change was
visually observed in the mean BMQ-S necessity score in all of the strategy groups, with the
exception of the behavioural-counselling strategy group. Concerns about medicine reduced
in the reminder, behavioural-counselling and social support strategy groups. All five groups
had little change in the mean BIPQ treatment control scores. At three months, the cognitive-
educational group had a significant improvement in the BIPQ treatment coherence score,
reflecting a better perceived understanding of their illness. These changes were sustained
at six months (Figure 6.12).

148
Figure 6.11 Change in Questionnaire Scores at three months for each Strategy Type in the Intervention Group
-3
-2
-1
0
1
2
3
4
Mean MAQ Score Mean BMQ-SNecessity Score
Mean BMQ-SConcerns Score
Mean BIPQ TreatmentControl Score
Mean BIPQ TreatmentCoherence Score
Ch
ange
in Q
ue
stio
nn
aire
Sco
res
Reminder systems
Cognitive-educational
Reminder and Cognitive-educational
Behavioural-counselling
Social support

149
Figure 6.12 Change in Questionnaire Scores at six months for each Strategy Type in the Intervention Group
-3
-2
-1
0
1
2
3
4
5
Mean MAQ Score Mean BMQ-SNecessity Score
Mean BMQ-SConcerns Score
Mean BIPQ TreatmentControl Score
Mean BIPQ TreatmentCoherence Score
Ch
ange
in Q
ues
tio
nn
aire
Sco
re
Reminder systems
Cognitive-educational
Reminder and Cognitive-educational
Behavioural-counselling
Social support

150
6.4 Discussion
Improved adherence during the study period reflected reduced concerns towards medicines
and improved perceived understanding of illness and treatment. A close relationship
between good adherence and strong beliefs that the medicine is necessary and fewer
concerns about the medicine has been well-documented in the literature.88,131 In the
intervention group, there was an improvement in perceived understanding of their illness
and treatment over the study period, which may help to explain the sustained improvement
in adherence.
When we consider the individual adherence strategies employed, the results from the
adherence questionnaires explain how the intervention impacted on an individual’s
knowledge, understanding and beliefs and how this translated into improved adherence. In
participants where forgetfulness or carelessness was a barrier to adherence and they
received a reminder intervention their changes in beliefs towards their medicines or their
illness as measured by the BMQ-S and BIPQ were minimal. This is to be expected as the
adherence strategy was purely to support their forgetfulness. In contrast, participants who
received a cognitive-educational intervention (information on their treatment and illness) had
significant changes in their knowledge and understanding of their illness. For these
individuals this change reflected an improvement in their adherence. Studies providing
education to improve participant’s knowledge on their treatment and illness have shown to
improve understanding of illness and treatment, similar to that observed in this study.
However, these studies did not show an improvement in adherence, which may be because
the intervention was not targeted to non-adherent participants.268,308 Those participants with
negative beliefs about their medicine, discussing their concerns and motivation and/or
establishing health goals resulted in changes in their beliefs towards their medicines,
particularly a reduction in concerns towards medicines. Reduced concerns in regards to
medicines has been significantly associated with better adherence.44,131 These changes in
beliefs and illness perceptions may explain the significant improvement in adherence
observed in the behavioural-counselling strategy group.
There were differences in the beliefs towards medicines and illness perceptions between
the control (non-adherent) group and the adherent group over time. The adherent group felt
that over time their illness had a reduced impact on their lives, they had a greater control
over their illness and they had less concerns about their illness. Other studies have found
that participants with good adherence to their medication, felt that they had greater control

151
over their illness and were less emotionally affected by their illness.125,135 The adherent
group held strong beliefs that their medicine was necessary, which remained steady over
the six month study period. The adherent group also had fewer concerns in regards to their
medicine and this declined over time. These changes may be a reflection of participants
who are established on their medication and their medical condition may now be well-
controlled, reinforcing beliefs in the necessity of their medicines to achieve this control.
In contrast, the control group felt their illness was affecting their lives more, felt that their
medicine was less helpful, experienced more severe symptoms and were more emotionally
affected by their illness at six months. Since these participants were non-adherent to their
medication, these participants may not have received the full benefits of their medication,
leading to the negative view observed in this control group. It cannot be confirmed whether
the negative changes in the beliefs about medicines and illness perceptions over time are a
cause of non-adherence or an effect of non-adherence. For example, did non-adherence to
their medication lead to poor control of illness, which led to more severe symptoms of illness
and greater concerns, or did poor control of illness, severe symptoms and greater concerns
lead to non-adherence? Studies have found a relationship between the effect of the illness,
emotional response towards the illness and adherence.40,95,125,134 Nicklas et al. found that
participants non-adherent to their chronic pain medication were more emotionally affected
by their illness.125 Beliefs that their medicine was necessary was relatively weaker in the
control group than the adherent group. A declining trend in the beliefs that the medicine was
necessary was observed over time. This was also observed in a study which implemented
a text message program designed to modify beliefs to improve adherence to asthma
medications. At 18 weeks, the control group had a decline in the BMQ-S necessity score.130
Massey et al. measured self-reported adherence, beliefs about medicines (BMQ-S) and
illness perceptions (BIPQ) in participants six weeks and six months after kidney
transplantation. Medication non-adherence significantly increased from 17% at six weeks to
27% at six months port-transplantation. This study found the mean BMQ-S necessity score
in the population was significantly lower at six months. The mean BMQ-S concerns score
did not significantly change over time.41
6.5 Conclusions
Improvements in adherence in the intervention group were supported by the positive
changes in the beliefs about medicines and illness perceptions. The targeted and tailored

152
intervention changed beliefs about medicines and illness perceptions in a direction that
mirrors the beliefs observed in an adherent population. The intervention group had less
concerns about their medicines, better control over their illness and a clearer understanding
of their illness and treatment over time. Changes in adherence, beliefs about medicines and
illness perceptions in the intervention group at three and six months reflect patterns seen in
the adherent group. These pattern changes in adherence, beliefs about medicines and
illness perceptions are different to that observed in the control group. Improvement in beliefs
about medicines and illness perceptions may help to explain how the intervention improved
adherence.
153
CHAPTER SEVEN: DISCUSSION
7.1 Introduction
Medications remains one of the most frequently used treatments for managing chronic
diseases.309 However, many patients do not adhere to their medications due to an
unconscientious and uninformed decision, leading to adverse health outcomes.11,27,73 As
discussed in Chapter One, medication non-adherence affects approximately 50% of patients
prescribed chronic medications. Patients are non-adherent to their medication due to many
different reasons, including forgetfulness, concerns about medicines and poor
understanding of their treatment. Previous studies have aimed to improve medication
adherence through interventions, such as reminders, education and motivational
interviewing.219,236,266 Current interventions to improve adherence have had mixed
results.13,15 Adherence interventions to date have often been implemented in a population
without first identifying whether the patient was currently adherent or non-adherent and
hence may provide an intervention to an individual who was already adherent to their
medication. Interventions that have been tailored, were often tailored to a specific disease
population or tailored a particular type of intervention, rather than tailored to the participant-
specific reasons for non-adherence. Promising interventions include multifaceted
interventions, tailored interventions and targeted interventions, such as the Measurement-
Guided Medication Management (MGMM).214,216 To target and tailor an adherence
intervention we require a measure that can identify medication-taking behaviour and explore
the reasons for non-adherence in a practical way. The overall aim of this thesis was to
improve medication adherence using a targeted and tailored intervention informed by
validated adherence scales.
7.2 Validated Adherence Scales
Chapter Two presented the systematic review on validated adherence scales. The
systematic review identified 43 adherence scales that have been correlated with a
comparison measure of adherence. The adherence scales elicit different facets of
adherence: medication-taking behaviour, barriers to adherence and beliefs associated with
adherence.

154
Measurement-Guided Medication Management uses a measure of adherence to guide the
intervention. In the literature, MEMS is used to identify medication-taking behaviour and this
information is used to guide the feedback.214 Eliciting barriers to adherence and beliefs
associated with adherence can be used to identify patient-specific reasons for non-
adherence. Adherence scales can be used in a similar manner to MEMS in the MGMM
intervention to inform the discussion with the participant about reasons for non-adherence
and guide the implementation of a tailored strategy to improve adherence.
From the systematic review, the MAQ and BMQ-S were selected for use in a targeted and
tailored intervention.213 The MAQ was used to identify medication-taking behaviour and the
type of non-adherence the participant was exhibiting. The MAQ is one of the most commonly
used scales and has been validated against a range of objective measures including MEMS
and clinical outcomes.18,72,293,296 The BMQ-S has been extensively used in many different
disease populations to elicit patient’s beliefs that the medicine is necessary and concerns
about their medicine.4,89,117,124 The relationship between illness perceptions and medication
adherence has also been well-established in the literature.136-139 The BIPQ was also
included in the intervention to shed more light on the complex nature of adherence.139
7.3 Targeted and Tailored Intervention
In Chapter Three and Five of the thesis, the use of validated scales in a similar manner to
an MGMM approach was described. The intervention involved the use of questionnaires
(MAQ, BMQ-S and BIPQ), discussion with the participant about their adherence and the
implementation of a tailored strategy to improve adherence (Chapter Five). The MAQ was
used to identify non-adherence and to distinguish whether non-adherence to the medication
was unintentional, intentional or a mix of both. The BMQ-S elicited beliefs about medicines
and the BIPQ was used to explore the participant’s illness representations. The responses
to these tools informed the discussion with the participant about reasons for their non-
adherence. This guided the implementation of an evidence-based tailored strategy to
support adherence. This intervention was simple and quick to administer. The improvement
in adherence observed in our study, reported in Chapter Four, is consistent with other
studies that targeted an intervention to a non-adherent sample,247,310 and tailored an
adherence strategy to the participant-specific reasons for non-adherence.130,153,219,229,230
The changes that were observed in the participant’s beliefs and illness perceptions in the
intervention group compared to the control group may help explain how the intervention

155
improved adherence (Chapter Four). The intervention group had a significantly higher
necessity score on the BMQ-S than the control group, reflecting an increase in the strength
of the participant’s belief in the necessity of medicines due to the intervention. The
association between beliefs that medicines are necessary and medication adherence has
been well-established in the literature.4,95,126,127,130,131 However, few studies have used the
BMQ-S, as we did in our study, to explain how an intervention may have impacted
adherence. The BIPQ was used to explore the participant’s illness perceptions, in particular,
the participant’s understanding of their illness and whether they perceived their medicines
as helpful. This information helped to identify participants who may benefit from information
on their medicine and illness. The intervention group had a significantly higher BIPQ
treatment coherence score than the control at three and six months, which indicates a
clearer perceived understanding of their illness. Similarly, the intervention group believed
their medicine was more helpful than the control group at three and six months.
Improvement in adherence observed in the intervention group at three months was
sustained at six months. The sustained improvement in adherence was mirrored by
sustained improvements in beliefs about medicines and illness perceptions. Improvement in
adherence, beliefs about medicines and illness perceptions is likely due to the impact of the
targeted and tailored nature of the intervention.
7.4 Changes in Adherence, Beliefs about Medicines and Illness Perceptions
over Time
At the start of the study, the adherent group and non-adherent (intervention and control)
group were distinctly different in terms of not only their adherence but their beliefs towards
the medicine and illness perceptions. Over time these differences changed. In the
intervention group, there was a significant improvement in adherence, which was mirrored
by a strengthening in their beliefs about medicines and an improvement in their illness
perceptions, in particular, in their understanding of their treatment and illness. These
changes reflected the beliefs towards medicines and illness perceptions in the adherent
group, suggesting that the intervention had improved adherence and impacted on beliefs
and illness perceptions in a way that facilitated adherent behaviour. The changes in
adherence, beliefs about medicines and illness perceptions were also explored in the
different tailored strategy groups. Exploring the changes in each of the tailored strategy
groups demonstrates how the intervention impacted the beliefs about medicines, illness

156
perceptions and how this translated into an improvement in adherence (Chapter Six).
Changes in the BIPQ treatment coherence and treatment control scores were driven by
participants who received a cognitive-educational intervention (see Chapter Six, Figure 6.11
and 6.12). Improved BIPQ treatment coherence and treatment control scores has been
associated with improved adherence.40
Participants in the control group had negative changes in their illness perceptions over time.
These participants had poorer understanding of their illness, perceived their medicine as
less helpful and were more emotionally affected by their illness over time. Similar
observations can be seen in other studies. For example, a study found that perceived
necessity of immunosuppressant after kidney transplantation significantly declined over time,
which was associated with a worsening of medication adherence six months after
transplantation.41 Shiyanbola et al. examined whether concerns about medicines changed
over time and the characteristics of the patients in whom beliefs changed over two years. In
this study, good medication adherence was associated with less concerns about their
medicines, which may be due to better health or a reduction in symptoms.44
7.5 Limitations of the Study
Our study had a number of limitations. One of the limitations of this study was the use of a
subjective measure of adherence. A systematic review on validated adherence scales was
conducted, from which we selected the most appropriate measure of adherence, the MAQ.
There are limitations to using self-report methods to identify medication adherence. Self-
report measures are prone to overestimating adherence due to social desirability bias. This
is unlikely to be a problem in this study given our use of a highly sensitive indicator of
possible non-adherence: an MAQ score > 0. This cut-off has been used in previous
studies.72,95,204,307 Indeed, with approximately 80% of the enrolled population being identified
as non-adherent, a more likely problem is that participants identified as non-adherent
according to the MAQ may have been classified as adherent using a different measure (such
as MEMS or a medication possession ratio based on dispensing history). In any case, the
overall effect of the MAQ incorrectly identifying non-adherence would be expected to reduce
rather than increase the effects of the intervention. Assessing Pharmaceutical Benefits
Scheme (PBS) data was also attempted; however, the high cost of receiving this information
made this option not possible. This data would have provided us with information on the
date of prescribing, date of dispensing of the medicines. Pharmacy prescription refill data

157
was another option that was attempted; however, we were only able to obtain consent to
assess this data from fourteen participants and hence were not able to model these results.
Some studies have shown that improving adherence to medications, improves clinical
outcomes, such as blood pressure control, blood glucose levels, and lower lipid levels.311-
313 Our study was not powered to measure clinical outcomes (but was powered on the basis
of a change in MAQ that has been demonstrated to influence clinical outcomes). Given the
success of the intervention, we hope to conduct a study powered to show the effect of the
intervention on clinical outcomes.
The process of following up participants at three months and six months may have
influenced adherence to medications independently of the intervention. Whether or not this
effect occurred is hard to judge, but any effect would be small and affect both the control
and intervention group. MAQ scores in the control group did not change to a statistically
significantly degree during the follow up.
Recruiting participants from a convenience sample of only two community pharmacies would
have led to selection bias, and may have led to over- and/or under-representation of
participant demographics. The two selected pharmacies service a broad range of patients
and were located in different socioeconomic areas. Based on the Socio-Economic Index for
Areas (SEIFA) that ranges from 1 (low) to 10 (high), one pharmacy had an index of 2 and
the other 9. SEIFA is an index that ranks Australian suburbs based on socioeconomic factors,
such as income and level of education, which was developed by the Australian Bureau of
Statistics.314 Furthermore, participants were recruited from two community pharmacies that
were known to the researcher. Some participants were known to the researcher prior to the
study, which may have influenced the results. However, this effect, if any, would have been
observed in both the intervention and control group. Conducting the study in pharmacies
known to the researcher improved the ease of data collection. The research may be more
difficult in pharmacies that do not have an established relationship with the researchers.
This study could be further strengthened with an exit survey to explore the participant’s
opinions and thoughts about the intervention. This information could be used to better tailor
interventions. An exit survey will be considered for further studies.

158
7.6 Future Directions and Conclusion
A targeted and tailored intervention, based on discussion informed using validated
adherence scales improved medication adherence. This intervention was easy to administer
and quick enough that it could be incorporated into day-to-day practice. In our study we
utilised the validated adherence questionnaires to assess patients on newly initiated therapy.
The questionnaires have been utilised previously in patients prescribed chronic medication
to assess their adherence to these. We believe that there should be no reason why the study
method would not also have utility in supporting adherence in patients on chronic medication.
If this targeted and tailored intervention proves successful in larger studies that assess
clinical outcomes, it has the potential for widespread implementation for improving
adherence to both recently initiated medications and existing therapy.

159
REFERENCES
1. World Health Organisation (WHO). Adherence to Long-Term therapies: Evidence for
Action. Geneva: 2003.
2. IMS Institute for Healthcare Informatics. Ways to Improve: Applying Six Critical
Levers to Improve Medicine Use Worldwide. Parsippany: 2013.
3. Sokol MC, McGuigan KA, Verbrugge RR, Epstein RS. Impact of medication
adherence on hospitalization risk and healthcare cost. Med Care 2005;43(6):521-30.
4. Mardby AC, Akerlind I, Jorgensen T. Beliefs about medicines and self-reported
adherence among pharmacy clients. Patient Educ Couns 2007;69(1-3):158-64.
5. van de Steeg N, Sielk M, Pentzek M, Bakx C, Altiner A. Drug-adherence
questionnaires not valid for patients taking blood-pressure-lowering drugs in a
primary health care setting. J Eval Clin Pract 2009;15(3):468-72.
6. Bowry AD, Shrank WH, Lee JL, Stedman M, Choudhry NK. A systematic review of
adherence to cardiovascular medications in resource-limited settings. J Gen Intern
Med 2011;26(12):1479-91.
7. Lemstra M, Blackburn D. Nonadherence to statin therapy: discontinuation after a
single fill. Can J Cardiol 2012;28(5):567-73.
8. Devold HM, Furu K, Skurtveit S, Tverdal A, Falch JA, Sogaard AJ. Influence of
socioeconomic factors on the adherence of alendronate treatment in incident users
in Norway. Pharmacoepidemiol Drug Saf 2012;21(3):297-304.
9. Lee VW, Pang KK, Hui KC, Kwok JC, Leung SL, Yu DS, et al. Medication adherence:
Is it a hidden drug-related problem in hidden elderly? Geriatr Gerontol Int
2013;13(4):978-85.
10. Dhippayom T, Krass I. Medication-taking behaviour in New South Wales patients with
type 2 diabetes: an observational study. Aust J Prim Health 2014.
11. Lau DT, Nau DP. Oral antihyperglycemic medication nonadherence and subsequent
hospitalization among individuals with type 2 diabetes. Diabetes Care
2004;27(9):2149-53.
12. Gehi AK, Ali S, Na B, Whooley MA. Self-reported medication adherence and
cardiovascular events in patients with stable coronary heart disease: the heart and
soul study. Arch Intern Med 2007;167(16):1798-803.
13. Nieuwlaat R, Wilczynski N, Navarro T, Hobson N, Jeffery R, Keepanasseril A, et al.
Interventions for enhancing medication adherence. Cochrane Database Syst Rev
2014;11:CD000011.

160
14. Schedlbauer A, Schroeder K, Peters TJ, Fahey T. Interventions to improve
adherence to lipid lowering medication. Cochrane Database Syst Rev
2004;4:CD004371.
15. Schroeder K, Fahey T, Ebrahim S. Interventions for improving adherence to
treatment in patients with high blood pressure in ambulatory settings. Cochrane
Database Syst Rev 2004;2:CD004804.
16. Hulka BS, Cassel JC, Kupper LL, Burdette JA. Communication, compliance, and
concordance between physicians and patients with prescribed medications. Am J
Public Health 1976;66(9):847-53.
17. Gould E, Mitty E. Medication adherence is a partnership, medication compliance is
not. Geriatr Nurs 2010;31(4):290-8.
18. Morisky DE, Green LW, Levine DM. Concurrent and predictive validity of a self-
reported measure of medication adherence. Med Care 1986;24(1):67-74.
19. Gearing RE, Townsend L, MacKenzie M, Charach A. Reconceptualizing medication
adherence: six phases of dynamic adherence. Harv Rev Psychiatry 2011;19(4):177-
89.
20. Osterberg L, Blaschke T. Adherence to medication. New Engl J Med
2005;353(18):1973-4.
21. Charles C, Gafni A, Whelan T. Shared decision-making in the medical encounter:
what does it mean? (or it takes at least two to tango). Soc Sci Med 1997;44(5):681-
92.
22. Elwyn G, Edwards A, Mowle S, Wensing M, Wilkinson C, Kinnersley P, et al.
Measuring the involvement of patients in shared decision-making: a systematic
review of instruments. Patient Educ Couns 2001;43(1):5-22.
23. Elwyn G, Edwards A, Wensing M, Hibbs R, Wilkinson C, Grol R. Shared decision
making observed in clinical practice: visual displays of communication sequence and
patterns. J Eval Clin Pract 2001;7(2):211-21.
24. Stein BD, Kogan JN, Mihalyo MJ, Schuster J, Deegan PE, Sorbero MJ, et al. Use of
a Computerized Medication Shared Decision Making Tool in Community Mental
Health Settings: Impact on Psychotropic Medication Adherence. Community Ment
Health J 2012;49(2):185-92.
25. Foster P, Hudson S. From compliance to concordance: a challenge for contraceptive
prescribers. Health Care Anal 1998;6(2):123-30.
26. Spertus JA, Kettelkamp R, Vance C, Decker C, Jones PG, Rumsfeld JS, et al.
Prevalence, predictors, and outcomes of premature discontinuation of thienopyridine

161
therapy after drug-eluting stent placement: results from the PREMIER registry.
Circulation 2006;113(24):2803-9.
27. Ho PM, Bryson CL, Rumsfeld JS. Medication adherence: its importance in
cardiovascular outcomes. Circulation 2009;119(23):3028-35.
28. Silveira CD, Ferreira CS, Correa RD. Adherence to guidelines and its impact on
outcomes in patients hospitalized with community-acquired pneumonia at a university
hospital. J Bras Pneumol 2012;38(2):148-57.
29. Frei CR, Attridge RT, Mortensen EM, Restrepo MI, Yu Y, Oramasionwu CU, et al.
Guideline-concordant antibiotic use and survival among patients with community-
acquired pneumonia admitted to the intensive care unit. Clin Ther 2010;32(2):293-9.
30. Mitchison DA. How drug resistance emerges as a result of poor compliance during
short course chemotherapy for tuberculosis. Int J Tuberc Lung Dis 1998;2(1):10-5.
31. Abraham NS, Naik AD, Street RL, Jr. Shared decision making in GI clinic to improve
patient adherence. Clin Gastroenterol Hepatol 2012;10(8):825-7.
32. Wroe AL. Intentional and unintentional nonadherence: a study of decision making. J
Behav Med 2002;25(4):355-72.
33. Kjeldsen LJ, Bjerrum L, Herborg H, Knudsen P, Rossing C, Sondergaard B.
Development of new concepts of non-adherence measurements among users of
antihypertensives medicines. Int J Clin Pharm 2011;33(3):565-72.
34. Karter AJ, Parker MM, Moffet HH, Ahmed AT, Schmittdiel JA, Selby JV. New
prescription medication gaps: a comprehensive measure of adherence to new
prescriptions. Health Serv Res 2009;44(5):1640-61.
35. Shah NR, Hirsch AG, Zacker C, Taylor S, Wood GC, Stewart WF. Factors associated
with first-fill adherence rates for diabetic medications: a cohort study. J Gen Intern
Med 2009;24(2):233-7.
36. Gadkari AS, McHorney CA. Medication nonfulfillment rates and reasons: narrative
systematic review. Curr Med Res Opin 2010;26(3):683-705.
37. Elm JJ, Kamp C, Tilley BC, Guimaraes P, Fraser D, Deppen P, et al. Self-reported
adherence versus pill count in Parkinson's disease: the NET-PD experience. Mov
Disord 2007;22(6):822-7.
38. Vrijens B, De Geest S, Hughes DA, Przemyslaw K, Demonceau J, Ruppar T, et al. A
new taxonomy for describing and defining adherence to medications. Br J Clin
Pharmacol 2012;73(5):691-705.
39. Steiner JF, Earnest MA. The language of medication-taking. Ann Intern Med
2000;132(11):926-30.

162
40. Fennessy MM, Devon HA, Ryan C, Lopez JJ, Zerwic JJ. Changing Illness
Perceptions and Adherence to Dual Antiplatelet Therapy in Patients With Stable
Coronary Disease. J Cardiovasc Nurs 2012;28(6):573-83.
41. Massey EK, Tielen M, Laging M, Beck DK, Khemai R, van Gelder T, et al. The role
of goal cognitions, illness perceptions and treatment beliefs in self-reported
adherence after kidney transplantation: A cohort study. J Psychosom Res
2013;75(3):229-34.
42. Schuz B, Wurm S, Ziegelmann JP, Warner LM, Tesch-Romer C, Schwarzer R.
Changes in functional health, changes in medication beliefs, and medication
adherence. Health Psychol 2011;30(1):31-9.
43. French T, Tesoriero J, Agins B. Changes in stress, substance use and medication
beliefs are associated with changes in adherence to HIV antiretroviral therapy. AIDS
Behav 2011;15(7):1416-28.
44. Shiyanbola OO, Farris KB, Chrischilles E. Concern beliefs in medications: Changes
over time and medication use factors related to a change in beliefs. Res Social Adm
Pharm 2013;9(4):446-57.
45. Rees G, Leong O, Crowston JG, Lamoureux EL. Intentional and unintentional
nonadherence to ocular hypotensive treatment in patients with glaucoma.
Ophthalmol 2010;117(5):903-8.
46. Gadkari AS, McHorney CA. Unintentional non-adherence to chronic prescription
medications: how unintentional is it really? BMC Health Serv Res 2012;12:98.
47. Eliasson L, Clifford S, Barber N, Marin D. Exploring chronic myeloid leukemia
patients' reasons for not adhering to the oral anticancer drug imatinib as prescribed.
Leuk Res 2011;35(5):626-30.
48. Mukhtar O, Weinman J, Jackson SH. Intentional non-adherence to medications by
older adults. Drugs Aging 2014;31(3):149-57.
49. Unni EJ, Farris KB. Unintentional non-adherence and belief in medicines in older
adults. Patient Educ Couns 2011;83(2):265-8.
50. Atkins L, Fallowfield L. Intentional and non-intentional non-adherence to medication
amongst breast cancer patients. Eur J Cancer Care 2006;42(14):2271-6.
51. Thompson K, Kulkarni J, Sergejew AA. Reliability and validity of a new Medication
Adherence Rating Scale (MARS) for the psychoses. Schizophr Res 2000;42(3):241-
7.

163
52. George CF, Peveler RC, Heiliger S, Thompson C. Compliance with tricyclic
antidepressants: the value of four different methods of assessment. Br J Clin
Pharmacol 2000;50(2):166-71.
53. Hogan TP, Awad AG, Eastwood R. A self-report scale predictive of drug compliance
in schizophrenics - reliability and discriminative validity. Psychol Med 1983;13(1):177-
83.
54. Broekmans S, Dobbels F, Milisen K, Morlion B, Vanderschueren S. Pharmacologic
pain treatment in a multidisciplinary pain center: do patients adhere to the prescription
of the physician? Clin J Pain 2010;26(2):81-6.
55. Lambert EV, Steyn K, Stender S, Everage N, Fourie JM, Hill M. Cross-cultural
validation of the hill-bone compliance to high blood pressure therapy scale in a South
African, primary healthcare setting. Ethn Dis 2006;16(1):286-91.
56. Evans CD, Eurich DT, Remillard AJ, Shevchuk YM, Blackburn D. First-fill medication
discontinuations and nonadherence to antihypertensive therapy: an observational
study. Am J Hypertens 2012;25(2):195-203.
57. Akincigil A, Bowblis JR, Levin C, Walkup JT, Jan S, Crystal S. Adherence to
antidepressant treatment among privately insured patients diagnosed with
depression. Med Care 2007;45(4):363-9.
58. Lewis LM, Schoenthaler AM, Ogedegbe G. Patient factors, but not provider and
health care system factors, predict medication adherence in hypertensive black men.
J Clin Hypertens (Greenwich) 2012;14(4):250-5.
59. Khandelwal N, Duncan I, Ahmed T, Rubinstein E, Pegus C. Oral chemotherapy
program improves adherence and reduces medication wastage and hospital
admissions. J Natl Compr Canc Netw 2012;10(5):618-25.
60. Barroso PF, Schechter M, Gupta P, Bressan C, Bomfim A, Harrison LH. Adherence
to antiretroviral therapy and persistence of HIV RNA in semen. J Acquir Immune Defic
Syndr 2003;32(4):435-40.
61. Lin EH, Von Korff M, Ciechanowski P, Peterson D, Ludman EJ, Rutter CM, et al.
Treatment adjustment and medication adherence for complex patients with diabetes,
heart disease, and depression: a randomized controlled trial. Ann Fam Med
2012;10(1):6-14.
62. Krigsman K, Nilsson JL, Ring L. Adherence to multiple drug therapies: refill
adherence to concomitant use of diabetes and asthma/COPD medication.
Pharmacoepidemiol Drug Saf 2007;16(10):1120-8.

164
63. Unni EJ, Farris KB. Determinants of different types of medication non-adherence in
cholesterol lowering and asthma maintenance medications: a theoretical approach.
Patient Educ Couns 2011;83(3):382-90.
64. Sackett DL, Haynes RB, Gibson ES, Taylor DW, Roberts RS, Johnson AL. Patient
compliance with antihypertensive regimens. Patient Couns Health Educ
1978;1(1):18-21.
65. Jackevicius CA, Mamdani M, Tu JV. Adherence with statin therapy in elderly patients
with and without acute coronary syndromes. JAMA 2002;288(4):462-7.
66. Haynes RB, McDonald HP, Garg AX. Helping patients follow prescribed treatment:
clinical applications. JAMA 2002;288(22):2880-3.
67. Addison CC, Jenkins BW, Sarpong D, Wilson G, Champion C, Sims J, et al.
Relationship between medication use and cardiovascular disease health outcomes
in the Jackson Heart Study. Int J Environ Res Public Health 2011;8(6):2505-15.
68. Krousel-Wood MA, Muntner P, Islam T, Morisky DE, Webber LS. Barriers to and
determinants of medication adherence in hypertension management: perspective of
the cohort study of medication adherence among older adults. Med Clin North Am
2009;93(3):753-69.
69. Sackett DL, Haynes RB, Gibson ES, Hackett BC, Taylor DW, Roberts RS, et al.
Randomised clinical trial of strategies for improving medication compliance in primary
hypertension. Lancet 1975;1(7918):1205-7.
70. Miura T, Kojima R, Mizutani M, Shiga Y, Takatsu F, Suzuki Y. Effect of digoxin
noncompliance on hospitalization and mortality in patients with heart failure in long-
term therapy: a prospective cohort study. Eur J Clin Pharmacol 2001;57(1):77-83.
71. Murray MD, Tu W, Wu J, Morrow D, Smith F, Brater DC. Factors associated with
exacerbation of heart failure include treatment adherence and health literacy skills.
Clin Pharmacol Ther 2009;85(6):651-8.
72. Hill-Briggs F, Gary TL, Bone LR, Hill MN, Levine DM, Brancati FL. Medication
adherence and diabetes control in urban African Americans with type 2 diabetes.
Health Psychol 2005;24(4):349-57.
73. Jha AK, Aubert RE, Yao J, Teagarden JR, Epstein RS. Greater adherence to
diabetes drugs is linked to less hospital use and could save nearly $5 billion annually.
Health Aff 2012;31(8):1836-46.
74. Stamler J, Vaccaro O, Neaton JD, Wentworth D. Diabetes, other risk factors, and 12-
yr cardiovascular mortality for men screened in the Multiple Risk Factor Intervention
Trial. Diabetes Care 1993;16(2):434-44.

165
75. Kassaian SE, Goodarzynejad H, Boroumand MA, Salarifar M, Masoudkabir F,
Mohajeri-Tehrani MR, et al. Glycosylated hemoglobin (HbA1c) levels and clinical
outcomes in diabetic patients following coronary artery stenting. Cardiovasc Diabetol
2012;11:82.
76. Byerly MJ, Nakonezny PA, Lescouflair E. Antipsychotic medication adherence in
schizophrenia. Psychiatr Clin North Am 2007;30(3):437-52.
77. Olfson M, Mechanic D, Hansell S, Boyer CA, Walkup J, Weiden PJ. Predicting
medication noncompliance after hospital discharge among patients with
schizophrenia. Psychiatr Serv 2000;51(2):216-22.
78. Shao WC, Chen H, Chang YF, Lin WC, Lin EC. The relationship between medication
adherence and rehospitalization: a prospective study of schizophrenia patients
discharged from psychiatric acute wards. Hu Li Za Zhi 2013;60(5):31-40.
79. Dolder CR, Lacro JP, Warren KA, Golshan S, Perkins DO, Jeste DV. Brief evaluation
of medication influences and beliefs: development and testing of a brief scale for
medication adherence. J Clin Psychopharmacol 2004;24(4):404-9.
80. Boden R, Brandt L, Kieler H, Andersen M, Reutfors J. Early non-adherence to
medication and other risk factors for rehospitalization in schizophrenia and
schizoaffective disorder. Schizophr Res 2011;133(1-3):36-41.
81. Ascher-Svanum H, Faries DE, Zhu B, Ernst FR, Swartz MS, Swanson JW.
Medication adherence and long-term functional outcomes in the treatment of
schizophrenia in usual care. J Clin Psychiatry 2006;67(3):453-60.
82. Gardner EM, Hullsiek KH, Telzak EE, Sharma S, Peng G, Burman WJ, et al.
Antiretroviral medication adherence and class- specific resistance in a large
prospective clinical trial. AIDS 2010;24(3):395-403.
83. Bangsberg DR, Hecht FM, Charlebois ED, Zolopa AR, Holodniy M, Sheiner L, et al.
Adherence to protease inhibitors, HIV-1 viral load, and development of drug
resistance in an indigent population. AIDS 2000;14(4):357-66.
84. Deschamps AE, De Geest S, Vandamme AM, Bobbaers H, Peetermans WE, Van
Wijngaerden E. Diagnostic value of different adherence measures using electronic
monitoring and virologic failure as reference standards. AIDS Patient Care STDS
2008;22(9):735-43.
85. Roxon N. Evaluation of the DAA/PMP programs. Aust Depart Health Ageing 2010:1-
153.
86. McDonnell PJ, Jacobs MR. Hospital admissions resulting from preventable adverse
drug reactions. Ann Pharmacother 2002;36(9):1331-6.
166
87. Barclay TR, Hinkin CH, Castellon SA, Mason KI, Reinhard MJ, Marion SD, et al. Age-
associated predictors of medication adherence in HIV-positive adults: health beliefs,
self-efficacy, and neurocognitive status. Health Psychol 2007;26(1):40-9.
88. Fawzi W, Abdel Mohsen MY, Hashem AH, Moussa S, Coker E, Wilson KC. Beliefs
about medications predict adherence to antidepressants in older adults. Int
Psychogeriatr 2012;24(1):159-69.
89. Gatti ME, Jacobson KL, Gazmararian JA, Schmotzer B, Kripalani S. Relationships
between beliefs about medications and adherence. Am J Health Sys Pharm
2009;66(7):657-64.
90. Kleeberger CA, Phair JP, Strathdee SA, Detels R, Kingsley L, Jacobson LP.
Determinants of heterogeneous adherence to HIV-antiretroviral therapies in the
Multicenter AIDS Cohort Study. J Acquir Immune Defic Syndr 2001;26(1):82-92.
91. Maqutu D, Zewotir T, North D, Naidoo K, Grobler A. Factors affecting first-month
adherence to antiretroviral therapy among HIV-positive adults in South Africa. J AIDS
Res 2010;9(2):117-24.
92. Raebel MA, Ellis JL, Carroll NM, Bayliss EA, McGinnis B, Schroeder EB, et al.
Characteristics of patients with primary non-adherence to medications for
hypertension, diabetes, and lipid disorders. J Gen Intern Med 2012;27(1):57-64.
93. Cohn SE, Umbleja T, Mrus J, Bardeguez AD, Andersen JW, Chesney MA. Prior illicit
drug use and missed prenatal vitamins predict nonadherence to antiretroviral therapy
in pregnancy: adherence analysis A5084. AIDS Patient Care STDS 2008;22(1):29-
40.
94. Laba TL, Brien JA, Jan S. Understanding rational non-adherence to medications. A
discrete choice experiment in a community sample in Australia. BMC Fam Pract
2012;13(1):61.
95. Ross S, Walker A, MacLeod MJ. Patient compliance in hypertension: role of illness
perceptions and treatment beliefs. J Hum Hypertens 2004;18(9):607-13.
96. Jacobs U, De Castro MS, Fuchs FD, Ferreira MB. The influence of cognition, anxiety
and psychiatric disorders over treatment adherence in uncontrolled hypertensive
patients. PLoS One 2011;6(8):e22925.
97. Nichols SL, Montepiedra G, Farley JJ, Sirois PA, Malee K, Kammerer B, et al.
Cognitive, academic, and behavioral correlates of medication adherence in children
and adolescents with perinatally acquired HIV infection. J Dev Behav Pediatr
2012;33(4):298-308.

167
98. Viswanathan M, Golin CE, Jones CD, Ashok M, Blalock SJ, Wines RC, et al.
Interventions to Improve Adherence to Self-administered Medications for Chronic
Diseases in the United States: A Systematic Review. Ann Int Med 2012;157(11):785-
95.
99. Fraser C, Hadjimichael O, Vollmer T. Predictors of adherence to glatiramer acetate
therapy in individuals with self-reported progressive forms of multiple sclerosis. J
Neurosci Nurs 2003;35(3):163-70.
100. George J, Kong DC, Thoman R, Stewart K. Factors associated with medication
nonadherence in patients with COPD. Chest 2005;128(5):3198-204.
101. Dassa D, Boyer L, Benoit M, Bourcet S, Raymondet P, Bottai T. Factors associated
with medication non-adherence in patients suffering from schizophrenia: a cross-
sectional study in a universal coverage health-care system. Aust N Z J Psychiatry
2010;44(10):921-8.
102. Phillips KD, Moneyham L, Murdaugh C, Boyd MR, Tavakoli A, Jackson K, et al. Sleep
disturbance and depression as barriers to adherence. Clin Nurs Res 2005;14(3):273-
93.
103. Khanderia U, Townsend KA, Erickson SR, Vlasnik J, Prager RL, Eagle KA.
Medication adherence following coronary artery bypass graft surgery: assessment of
beliefs and attitudes. Ann Pharmacother 2008;42(2):192-9.
104. Sundbom LT, Bingefors K. The influence of symptoms of anxiety and depression on
medication nonadherence and its causes: a population based survey of prescription
drug users in Sweden. Patient Prefer Adherence 2013;7:805-11.
105. McHorney CA, Spain CV. Frequency of and reasons for medication non-fulfillment
and non-persistence among American adults with chronic disease in 2008. Health
Expect 2011;14(3):307-20.
106. Manning M, Bettencourt BA. Depression and medication adherence among breast
cancer survivors: bridging the gap with the theory of planned behaviour. Psychol
Health 2011;26(9):1173-87.
107. Ruppar TM, Dobbels F, De Geest S. Medication beliefs and antihypertensive
adherence among older adults: a pilot study. Geriatr Nurs 2012;33(2):89-95.
108. Toy EL, Beaulieu NU, McHale JM, Welland TR, Plauschinat CA, Swensen A, et al.
Treatment of COPD: relationships between daily dosing frequency, adherence,
resource use, and costs. Respir Med 2011;105(3):435-41.

168
109. Gellad WF, Grenard JL, Marcum ZA. A systematic review of barriers to medication
adherence in the elderly: looking beyond cost and regimen complexity. Am J Geriatr
Pharmacother 2011;9(1):11-23.
110. Llor C, Bayona C, Hernandez S, Moragas A, Miravitlles M. Comparison of adherence
between twice- and thrice-daily regimens of oral amoxicillin/clavulanic acid.
Respirology 2012;17(4):687-92.
111. Laliberte F, Nelson WW, Lefebvre P, Schein JR, Rondeau-Leclaire J, Duh MS.
Impact of daily dosing frequency on adherence to chronic medications among
nonvalvular atrial fibrillation patients. Adv Ther 2012;29(8):675-90.
112. Castaldi PJ, Rogers WH, Safran DG, Wilson IB. Inhaler costs and medication
nonadherence among seniors with chronic pulmonary disease. Chest
2010;138(3):614-20.
113. Williams J, Steers WN, Ettner SL, Mangione CM, Duru OK. Cost-related
Nonadherence by Medication Type Among Medicare Part D Beneficiaries With
Diabetes. Med Care 2012;51(2):193-8.
114. Sajatovic M, Levin J, Fuentes-Casiano E, Cassidy KA, Tatsuoka C, Jenkins JH.
Illness experience and reasons for nonadherence among individuals with bipolar
disorder who are poorly adherent with medication. Compr Psychiatry 2011;52(3):280-
7.
115. Burra TA, Chen E, McIntyre RS, Grace SL, Blackmore ER, Stewart DE. Predictors of
self-reported antidepressant adherence. Behav Med 2007;32(4):127-34.
116. Dean AJ, Wragg J, Draper J, McDermott BM. Predictors of medication adherence in
children receiving psychotropic medication. J Pediatr Child Health 2011;47(6):350-5.
117. Horne R, Weinman J, Hankins M. The Beliefs about Medicines Questionnaire: the
development and evaluation of a new method for assessing the cognitive
representation of medication. Psychol Health 1999;14(1):1-24.
118. Saks EK, Wiebe DJ, Cory LA, Sammel MD, Arya LA. Beliefs about medications as a
predictor of treatment adherence in women with urinary incontinence. J Womens
Health 2012;21(4):440-6.
119. French DP, Wade AN, Farmer AJ. Predicting self-care behaviours of patients with
type 2 diabetes: the importance of beliefs about behaviour, not just beliefs about
illness. J Psychosom Res 2013;74(4):327-33.
120. Sjolander M, Eriksson M, Glader EL. The association between patients' beliefs about
medicines and adherence to drug treatment after stroke: a cross-sectional
questionnaire survey. BMJ Open 2013;3(9):1-8.

169
121. Menckeberg TT, Bouvy ML, Bracke M, Kaptein AA, Leufkens HG, Raaijmakers JA,
et al. Beliefs about medicines predict refill adherence to inhaled corticosteroids. J
Psychosom Res 2008;64(1):47-54.
122. Sofianou A, Martynenko M, Wolf MS, Wisnivesky JP, Krauskopf K, Wilson EA, et al.
Asthma beliefs are associated with medication adherence in older asthmatics. J Gen
Intern Med 2013;28(1):67-73.
123. Aakre JM, Medoff DR, Dixon LB, Kreyenbuhl JA. Beliefs about antipsychotic versus
hypoglycemic medications among individuals with serious mental illness and type 2
diabetes. Patient Prefer Adherence 2012;6:389-94.
124. Brown C, Battista DR, Bruehlman R, Sereika SS, Thase ME, Dunbar-Jacob J. Beliefs
about antidepressant medications in primary care patients: relationship to self-
reported adherence. Med Care 2005;43(12):1203-7.
125. Nicklas LB, Dunbar M, Wild M. Adherence to pharmacological treatment of non-
malignant chronic pain: the role of illness perceptions and medication beliefs. Psychol
Health 2010;25(5):601-15.
126. Rajpura JR, Nayak R. Role of illness perceptions and medication beliefs on
medication compliance of elderly hypertensive cohorts. J Pharm Pract 2014;27(1):19-
24.
127. Horne R, Weinman J. Self-regulation and self-management in asthma: exploring the
role of illness perceptions and treatment beliefs in explaining non-adherence to
preventer medication. Psychol Health 2002;17(1):17-32.
128. Berglund E, Lytsy P, Westerling R. Adherence to and beliefs in lipid-lowering medical
treatments: A structural equation modeling approach including the necessity-concern
framework. Patient Educ Couns 2013;91(1):105-12.
129. Alhalaiqa F, Deane KH, Nawafleh AH, Clark A, Gray R. Adherence therapy for
medication non-compliant patients with hypertension: a randomised controlled trial. J
Hum Hypertens 2012;26(2):117-26.
130. Petrie KJ, Perry K, Broadbent E, Weinman J. A text message programme designed
to modify patients' illness and treatment beliefs improves self-reported adherence to
asthma preventer medication. Br J Health Psychol 2012;17(1):74-84.
131. Horne R, Chapman SC, Parham R, Freemantle N, Forbes A, Cooper V.
Understanding patients' adherence-related beliefs about medicines prescribed for
long-term conditions: a meta-analytic review of the Necessity-Concerns Framework.
PLoS One 2013;8(12):1-24.

170
132. Jessop DC, Rutter DR. Adherence to asthma medication: the role of illness
representations. Psychol Health 2003;18(5):595-612.
133. Chen SL, Tsai JC, Chou KR. Illness perceptions and adherence to therapeutic
regimens among patients with hypertension: a structural modeling approach. Int J
Nurs Stud 2011;48(2):235-45.
134. Molloy GJ, Gao C, Johnston DW, Johnston M, Witham MD, Struthers AD, et al.
Adherence to angiotensin-converting-enzyme inhibitors and illness beliefs in older
heart failure patients. Eur J Heart Fail 2009;11(7):715-20.
135. Zugelj U, Zupancic M, Komidar L, Kenda R, Varda NM, Gregoric A. Self-reported
adherence behavior in adolescent hypertensive patients: the role of illness
representations and personality. J Pediatr Psychol 2010;35(9):1049-60.
136. Ware JE, Jr. Scales for measuring general health perceptions. Health Serv Res
1976;11(4):396-415.
137. Weinman J, Petrie KJ, MossMorris R, Horne R. The illness perception questionnaire:
A new method for assessing the cognitive representation of illness. Psychol Health
1996;11(3):431-45.
138. Moss-Morris R, Weinman J, Petrie KJ, Horne R, Cameron LD, Buick D. The revised
Illness Perception Questionnaire (IPQ-R). Psychol Health 2002;17(1):1-16.
139. Broadbent E, Petrie KJ, Main J, Weinman J. The brief illness perception
questionnaire. J Psychosom Res 2006;60(6):631-7.
140. Ascher-Svanum H, Zhu B, Faries D, Lacro JP, Dolder CR. A prospective study of risk
factors for nonadherence with antipsychotic medication in the treatment of
schizophrenia. J Clin Psychiatry 2006;67(7):1114-23.
141. Molfenter TD, Bhattacharya A, Gustafson DH. The roles of past behavior and health
beliefs in predicting medication adherence to a statin regimen. Patient Pref
Adherence 2012;6:643-51.
142. Crowe M, Wilson L, Inder M. Patients’ reports of the factors influencing medication
adherence in bipolar disorder – An integrative review of the literature. Int J Nurs Stud
2011;48(7):894-903.
143. Walsh JC, Horne R, Dalton M, Burgess AP, Gazzard BG. Reasons for non-adherence
to antiretroviral therapy: patients' perspectives provide evidence of multiple causes.
AIDS Care 2001;13(6):709-20.
144. Zullig LL, Peterson ED, Bosworth HB. Ingredients of Successful Interventions to
Improve Medication Adherence. JAMA 2013.

171
145. Ediger JP, Walker JR, Graff L, Lix L, Clara I, Rawsthorne P, et al. Predictors of
medication adherence in inflammatory bowel disease. Am J Gastroenterol
2007;102(7):1417-26.
146. Kim JH, Kim GS, Kim EJ, Park S, Chung N, Chu SH. Factors affecting medication
adherence and anticoagulation control in Korean patients taking warfarin. J
Cardiovasc Nurs 2011;26(6):466-74.
147. Mo PK, Mak WW. Intentionality of medication non-adherence among individuals living
with HIV/AIDS in Hong Kong. AIDS Care 2009;21(6):785-95.
148. Bhattacharya D, Easthall C, Willoughby KA, Small M, Watson S. Capecitabine non-
adherence: Exploration of magnitude, nature and contributing factors. J Oncol Pharm
Pract 2012;18(3):333-42.
149. Frain MP, Bishop M, Tschopp MK, Ferrin MJ, Frain J. Adherence to medical
regimens: understanding the effects of cognitive appraisal, quality of life, and
perceived family resiliency. Rehabil Couns Bull 2009;52(4):237-50.
150. Bartlett SJ, Krishnan JA, Riekert KA, Butz AM, Malveaux FJ, Rand CS. Maternal
depressive symptoms and adherence to therapy in inner-city children with asthma.
Pediatrics 2004;113(2):229-37.
151. Mazer M, Bisgaier J, Dailey E, Srivastava K, McDermoth M, Datner E, et al. Risk for
Cost-related Medication Nonadherence Among Emergency Department Patients.
Acad Emerg Med 2011;18(3):267-72.
152. Brnabic AJ, Kelin K, Ascher-Svanum H, Montgomery W, Kadziola Z, Karagianis J.
Medication discontinuation with depot and oral antipsychotics in outpatients with
schizophrenia: comparison of matched cohorts from a 12-month observational study.
Int J Clin Pract 2011;65(9):945-53.
153. Clifford S, Barber N, Elliott R, Hartley E, Horne R. Patient-centred advice is effective
in improving adherence to medicines. Pharm World Sci 2006;28(3):165-70.
154. Williams L, O'Connor RC, Grubb N, O'Carroll R. Type D personality predicts poor
medication adherence in myocardial infarction patients. Psychol Health
2011;26(6):703-12.
155. Brown MT, Bussell JK. Medication adherence: WHO cares? Mayo Clin Proc
2011;86(4):304-14.
156. Choo PW, Rand CS, Inui TS, Lee ML, Cain E, Cordeiro-Breault M, et al. Validation
of patient reports, automated pharmacy records, and pill counts with electronic
monitoring of adherence to antihypertensive therapy. Med Care 1999;37(9):846-57.

172
157. Saberi P, Caswell N, Amodio-Groton M, Alpert P. Pharmacy-refill measure of
adherence to efavirenz can predict maintenance of HIV viral suppression. AIDS Care
2008;20(6):741-5.
158. Krousel-Wood M, Islam T, Webber LS, Re RN, Morisky DE, Muntner P. New
medication adherence scale versus pharmacy fill rates in seniors with hypertension.
Am J Manag Care 2009;15(1):59-66.
159. van den Boogaard J, Lyimo RA, Boeree MJ, Kibiki GS, Aarnoutse RE. Electronic
monitoring of treatment adherence and validation of alternative adherence measures
in tuberculosis patients: a pilot study. Bull World Health Organ 2011;89(9):632-39.
160. Eidlitz-Markus T, Zeharia A, Baum G, Mimouni M, Amir J. Use of the urine color test
to monitor compliance with isoniazid treatment of latent tuberculosis infection. Chest
2003;123(3):736-9.
161. Stip E, Vincent PD, Sablier J, Guevremont C, Zhornitsky S, Tranulis C. A randomized
controlled trial with a Canadian electronic pill dispenser used to measure and improve
medication adherence in patients with schizophrenia. Front Pharmacol 2013;4:100.
162. Lehmann A, Aslani P, Ahmed R, Celio J, Gauchet A, Bedouch P, et al. Assessing
medication adherence: options to consider. Int J Clin Pharm 2013;36(1):55-69.
163. DiCarlo LA. Role for direct electronic verification of pharmaceutical ingestion in
pharmaceutical development. Contemp Clin Trials 2012;33(4):593-600.
164. Kalichman SC, Amaral CM, Swetzes C, Jones M, Macy R, Kalichman MO, et al. A
simple single-item rating scale to measure medication adherence: further evidence
for convergent validity. J Int Assoc Physicians AIDS Care 2009;8(6):367-74.
165. Remington G, Kwon J, Collins A, Laporte D, Mann S, Christensen B. The use of
electronic monitoring (MEMS) to evaluate antipsychotic compliance in outpatients
with schizophrenia. Schizophr Res 2007;90(1-3):229-37.
166. Santschi V, Wuerzner G, Schneider MP, Bugnon O, Burnier M. Clinical evaluation of
IDAS II, a new electronic device enabling drug adherence monitoring. Eur J Clin
Pharmacol 2007;63(12):1179-84.
167. van Onzenoort HA, Neef C, Verberk WW, van Iperen HP, de Leeuw PW, van der Kuy
PH. Determining the feasibility of objective adherence measurement with blister
packaging smart technology. Am J Health Syst Pharm 2012;69(10):872-9.
168. Wu JR, Moser DK, Chung ML, Lennie TA. Objectively measured, but not self-
reported, medication adherence independently predicts event-free survival in patients
with heart failure. J Card Fail 2008;14(3):203-10.

173
169. Velligan DI, Wang M, Diamond P, Glahn DC, Castillo D, Bendle S, et al. Relationships
among subjective and objective measures of adherence to oral antipsychotic
medications. Psychiatr Serv 2007;58(9):1187-92.
170. Pai ALH, Drotar D, Kodish E. Correspondence between objective and subjective
reports of adherence among adolescents with acute lymphoblastic leukemia. Child
Health Care 2008;37(3):225-35.
171. Mason BJ, Matsuyama JR, Jue SG. Assessment of sulfonylurea adherence and
metabolic control. Diabetes Educ 1995;21(1):52-7.
172. Schectman JM, Nadkarni MM, Voss JD. The association between diabetes metabolic
control and drug adherence in an indigent population. Diabetes Care
2002;25(6):1015-21.
173. Nakonezny PA, Byerly MJ, Rush AJ. Electronic monitoring of antipsychotic
medication adherence in outpatients with schizophrenia or schizoaffective disorder:
an empirical evaluation of its reliability and predictive validity. Psychiatry Res
2008;157(1-3):259-63.
174. Feldman R, Bacher M, Campbell N, Drover A, Chockalingam A. Adherence to
pharmacologic management of hypertension. Can J Public Health 1998;89(5):I16-8.
175. Vermeire E, Hearnshaw H, Van Royen P, Denekens J. Patient adherence to
treatment: three decades of research. A comprehensive review. J Clin Pharm Ther
2001;26(5):331-42.
176. Farmer KC. Methods for measuring and monitoring medication regimen adherence
in clinical trials and clinical practice. Clin Ther 1999;21(6):1074-90.
177. Chisholm-Burns MA, Spivey CA. Pharmacoadherence: a new term for a significant
problem. Am J Health Syst Pharm 2008;65(7):661-7.
178. Lavsa SM, Holzworth A, Ansani NT. Selection of a validated scale for measuring
medication adherence. J Am Pharm Assoc 2011;51(1):90-4.
179. Daniels T, Goodacre L, Sutton C, Pollard K, Conway S, Peckham D. Accurate
Assessment of Adherence: Self-Report and Clinician Report vs Electronic Monitoring
of Nebulizers. Chest 2011;140(2):425-32.
180. Zelikovsky N, Schast AP. Eliciting accurate reports of adherence in a clinical
interview: development of the Medical Adherence Measure. Pediatr Nurs
2008;34(2):141-6.
181. Byerly MJ, Nakonezny PA, Rush AJ. The Brief Adherence Rating Scale (BARS)
validated against electronic monitoring in assessing the antipsychotic medication

174
adherence of outpatients with schizophrenia and schizoaffective disorder. Schizophr
Res 2008;100(1-3):60-9.
182. Garfield S, Clifford S, Eliasson L, Barber N, Willson A. Suitability of measures of self-
reported medication adherence for routine clinical use: a systematic review. BMC
Med Res Methodol 2011;11:149.
183. Lewis SJ, Abell N. Development and evaluation of the Adherence Attitude Inventory.
Res Soc Work Prac 2002;12(1):107-23.
184. Schroeder K, Fahey T, Hay AD, Montgomery A, Peters TJ. Adherence to
antihypertensive medication assessed by self-report was associated with electronic
monitoring compliance. J Clin Epidemiol 2006;59(6):650-1.
185. Matza LS, Park J, Coyne KS, Skinner EP, Malley KG, Wolever RQ. Derivation and
Validation of the ASK-12 Adherence Barrier Survey. Ann Pharmacother
2009;43(10):1621-30.
186. Hahn SR, Park J, Skinner EP, Yu-Isenberg KS, Weaver MB, Crawford B, et al.
Development of the ASK-20 adherence barrier survey. Curr Med Res Opin
2008;24(7):2127-38.
187. Kripalani S, Risser J, Gatti ME, Jacobson TA. Development and evaluation of the
Adherence to Refills and Medications Scale (ARMS) among low-literacy patients with
chronic disease. Value Health 2009;12(1):118-23.
188. George J, Mackinnon A, Kong DC, Stewart K. Development and validation of the
Beliefs and Behaviour Questionnaire (BBQ). Patient Educ Couns 2006;64(1-3):50-
60.
189. Bell DJ, Kapitao Y, Sikwese R, van OJJ, Lalloo DG. Adherence to antiretroviral
therapy in patients receiving free treatment from a government hospital in Blantyre,
Malawi. J Acquir Immune Defic Syndr 2007;45(5):560-3.
190. Svarstad BL, Chewning BA, Sleath BL, Claesson C. The Brief Medication
Questionnaire: a tool for screening patient adherence and barriers to adherence.
Patient Educ Couns 1999;37(2):113-24.
191. Brooks CM, Richards JM, Kohler CL, Soong SJ, Martin B, Windsor RA, et al.
Assessing adherence to asthma medication and inhaler regimens: a psychometric
analysis of adult self-report scales. Med Care 1994;32(3):298-307.
192. Mannheimer SB, Mukherjee R, Hirschhorn LR, Dougherty J, Celano SA, Ciccarone
D, et al. The CASE adherence index: A novel method for measuring adherence to
antiretroviral therapy. AIDS Care 2006;18(7):853-61.

175
193. de Klerk E, van der Heijde D, van der Tempel H, van der Linden S. Development of
a questionnaire to investigate patient compliance with antirheumatic drug therapy. J
Rheumatol 1999;26(12):2635-41.
194. Fodor GJ, Kotrec M, Bacskai K, Dorner T, Lietava J, Sonkodi S, et al. Is interview a
reliable method to verify the compliance with antihypertensive therapy? An
international central-European study. J Hypertens 2005;23(6):1261-6.
195. Godin G, Gagné C, Naccache H. Validation of a self-reported questionnaire
assessing adherence to antiretroviral medication. AIDS Patient Care STDs
2003;17(7):325-32.
196. Grymonpre RE, Didur CD, Montgomery PR, Sitar DS. Pill count, self-report, and
pharmacy claims data to measure medication adherence in the elderly. Ann
Pharmacother 1998;32(7-8):749-54.
197. Kim MT, Hill MN, Bone LR. Development and testing of the hill-bone compliance
scale to HBP treatment. Circulation 1999;100(18):323.
198. Chisholm MA, Lance CE, Williamson GM, Mulloy LL. Development and validation of
an immunosuppressant therapy adherence barrier instrument. Patient Educ Couns
2005;20(1):181-8.
199. Kerr T, Hogg RS, Yip B, Tyndall MW, Montaner J, Wood E. Validity of self-reported
adherence among injection drug users. J Int Assoc Physicians AIDS Care
2008;7(4):157-9.
200. Wetzels G, Nelemans P, van Wijk B, Broers N, Schouten J, Prins M. Determinants of
poor adherence in hypertensive patients: development and validation of the
"Maastricht Utrecht Adherence in Hypertension (MUAH)-questionnaire". Patient Educ
Counsel 2006;64(1-3):151-8.
201. Clayton CD, Veach J, Macfadden W, Haskins J, Docherty JP, Lindenmayer JP.
Assessment of clinician awareness of nonadherence using a new structured rating
scale. J Psychiatr Pract 2010;16(3):164-9.
202. Unni EJ, Farris KB. Development of a new scale to measure self-reported medication
nonadherence. Res Social Adm Pharm 2009.
203. Ogedegbe G, Mancuso CA, Allegrante JP, Charlson ME. Development and
evaluation of a medication adherence self-efficacy scale in hypertensive African-
American patients. J Clin Epidemiol 2003;56(6):520-9.
204. Fernandez S, Chaplin W, Schoenthaler AM, Ogedegbe G. Revision and validation of
the medication adherence self-efficacy scale (MASES) in hypertensive African
Americans. J Behav Med 2008;31(6):453-62.

176
205. Morisky DE, Ang A, Krousel-Wood M, Ward HJ. Predictive validity of a medication
adherence measure in an outpatient setting. J Clin Hypertens 2008;10(5):348-54.
206. Reynolds K, Viswanathan HN, O'Malley CD, Muntner P, Harrison TN, Cheetham TC,
et al. Psychometric properties of the Osteoporosis-specific Morisky Medication
Adherence Scale in postmenopausal women with osteoporosis newly treated with
bisphosphonates. Ann Pharmacother 2012;46(5):659-70.
207. Greaves CJ, Hyland ME, Halpin DM, Blake S, Seamark D. Patterns of corticosteroid
medication use: non-adherence can be effective in milder asthma. Prim Care Respir
J 2005;14(2):99-105.
208. Rodriguez Martinez CE, Sossa MP, Rand CS. Validation of a questionnaire for
assessing adherence to metered-dose inhaler use in asthmatic children. Pediatr
Allergy Immunol Pulmonol 2007;20(4):243-53.
209. Risser J, Jacobson TA, Kripalani S. Development and psychometric evaluation of the
self-efficacy for appropriate medication use scale (seams) in low-literacy patients with
chronic disease. J Nurs Measure 2007;15(3):203-19.
210. Munoz-Moreno JA, Fumaz CR, Ferrer MJ, Tuldra A, Rovira T, Viladrich C, et al.
Assessing self-reported adherence to HIV therapy by questionnaire: the SERAD
(Self-Reported Adherence) Study. AIDS Res Hum Retroviruses 2007;23(10):1166-
75.
211. Knobel H, Alonso J, Casado JL, Collazos J, Gonzalez J, Ruiz I, et al. Validation of a
simplified medication adherence questionnaire in a large cohort of HIV-infected
patients: the GEEMA Study. AIDS 2002;16(4):605-13.
212. Willey C, Redding C, Stafford J, Garfield F, Geletko S, Flanigan T, et al. Stages of
change for adherence with medication regimens for chronic disease: development
and validation of a measure. Clin Ther 2000;22(7):858-71.
213. Nguyen T, La Caze A, Cottrell N. What are validated self-report adherence scales
really measuring?: a systematic review. Br J Clin Pharmacol 2014;77(3):427-45.
214. Demonceau J, Ruppar T, Kristanto P, Hughes DA, Fargher E, Kardas P, et al.
Identification and Assessment of Adherence-Enhancing Interventions in Studies
Assessing Medication Adherence Through Electronically Compiled Drug Dosing
Histories: A Systematic Literature Review and Meta-Analysis. Drugs 2013;73(6):545-
62.
215. Wang H, Zhou J, Huang L, Li X, Fennie KP, Williams AB. Effects of nurse-delivered
home visits combined with telephone calls on medication adherence and quality of
life in HIV-infected heroin users in Hunan of China. J Clin Nurs 2010;19(3-4):380-8.

177
216. Cutrona SL, Choudhry NK, Fischer MA, Servi AD, Stedman M, Liberman JN, et al.
Targeting cardiovascular medication adherence interventions. J Am Pharm Assoc
2012;52(3):381-97.
217. McDonald HP, Garg AX, Haynes RB. Interventions to enhance patient adherence to
medication prescriptions: scientific review. JAMA 2002;288(22):2868-79.
218. M'Imunya J M, Kredo T, Volmink J. Patient education and counselling for promoting
adherence to treatment for tuberculosis. Cochrane Database Syst Rev
2012;5:CD006591.
219. Ogedegbe G, Chaplin W, Schoenthaler A, Statman D, Berger D, Richardson T, et al.
A practice-based trial of motivational interviewing and adherence in hypertensive
African Americans. Am J Hypertens 2008;21(10):1137-43.
220. Friedman RH, Kazis LE, Jette A, Smith MB, Stollerman J, Torgerson J, et al. A
telecommunications system for monitoring and counseling patients with
hypertension. Impact on medication adherence and blood pressure control. Am J
Hypertens 1996;9(4):285-92.
221. Bouvy ML, Heerdink ER, Urquhart J, Grobbee DE, Hoes AW, Leufkens HG. Effect of
a pharmacist-led intervention on diuretic compliance in heart failure patients: a
randomized controlled study. J Card Fail 2003;9(5):404-11.
222. Ho PM, Lambert-Kerzner A, Carey EP, Fahdi IE, Bryson CL, Melnyk SD, et al.
Multifaceted Intervention to Improve Medication Adherence and Secondary
Prevention Measures After Acute Coronary Syndrome Hospital Discharge: A
Randomized Clinical Trial. JAMA Intern Med 2013;174(2):186-93.
223. Kripalani S, Yao X, Haynes RB. Interventions to enhance medication adherence in
chronic medical conditions: a systematic review. Arch Intern Med 2007;167(6):540-
50.
224. Macintosh PW, Pond GR, Pond BJ, Leung V, Siu LL. A comparison of patient
adherence and preference of packaging method for oral anticancer agents using
conventional pill bottles versus daily pill boxes. Eur J Cancer Care 2007;16(4):380-6.
225. Takemura M, Kobayashi M, Kimura K, Mitsui K, Masui H, Koyama M, et al. Repeated
instruction on inhalation technique improves adherence to the therapeutic regimen in
asthma. J Asthma 2010;47(2):202-8.
226. Leung LB, Busch AM, Nottage SL, Arellano N, Glieberman E, Busch NJ, et al.
Approach to Antihypertensive Adherence: A Feasibility Study on the Use of Student
Health Coaches for Uninsured Hypertensive Adults. Behav Med 2012;38(1):19-27.

178
227. Murray MD, Young J, Hoke S, Tu W, Weiner M, Morrow D, et al. Pharmacist
intervention to improve medication adherence in heart failure: a randomized trial. Ann
Int Med 2007;146(10):714-25.
228. Bender B, Milgrom H, Apter A. Adherence intervention research: what have we
learned and what do we do next? J Allergy Clin Immunol 2003;112(3):489-94.
229. Faulkner MA, Wadibia EC, Lucas BD, Hilleman DE. Impact of pharmacy counseling
on compliance and effectiveness of combination lipid-lowering therapy in patients
undergoing coronary artery revascularization: a randomized, controlled trial.
Pharmacotherapy 2000;20(4):410-6.
230. Insel KC, Cole L. Individualizing memory strategies to improve medication
adherence. Appl Nurs Res 2005;18(4):199-204.
231. Calvert SB, Kramer JM, Anstrom KJ, Kaltenbach LA, Stafford JA, Allen LaPointe NM.
Patient-focused intervention to improve long-term adherence to evidence-based
medications: a randomized trial. Am Heart J 2012;163(4):657-65.
232. Hibbard JH, Greene J, Tusler M. Improving the outcomes of disease management by
tailoring care to the patient's level of activation. Am J Manag Care 2009;15(6):353-
60.
233. Moshkovska T, Stone MA, Smith RM, Bankart J, Baker R, Mayberry JF. Impact of a
tailored patient preference intervention in adherence to 5-aminosalicylic acid
medication in ulcerative colitis: results from an exploratory randomized controlled
trial. Inflamm Bowel Dis 2011;17(9):1874-81.
234. Belsey JD. Optimizing adherence in hypertension: a comparison of outcomes and
costs using single tablet regimens vs individual component regimens. J Med Econ
2012;15(5):897-905.
235. Guthrie RM. The effects of postal and telephone reminders on compliance with
pravastatin therapy in a national registry: results of the first myocardial infarction risk
reduction program. Clin Ther 2001;23(6):970-80.
236. Fenerty SD, West C, Davis SA, Kaplan SG, Feldman SR. The effect of reminder
systems on patients' adherence to treatment. Patient Prefer Adherence 2012;6:127-
35.
237. Gabriel M, Gagnon JP, Bryan CK. Improved patients compliance through use of a
daily drug reminder chart. Am J Public Health 1977;67(10):968-9.
238. Huang HL, Li YC, Chou YC, Hsieh YW, Kuo F, Tsai WC, et al. Effects of and
satisfaction with short message service reminders for patient medication adherence:
a randomized controlled study. BMC Med Inform Decis Mak 2013;13(1):127.

179
239. Wald DS, Bestwick JP, Raiman L, Brendell R, Wald NJ. Randomised trial of text
messaging on adherence to cardiovascular preventive treatment (INTERACT trial).
PLoS One 2014;9(12):1-9.
240. Andrejak M, Genes N, Vaur L, Poncelet P, Clerson P, Carre A. Electronic pill-boxes
in the evaluation of antihypertensive treatment compliance: comparison of once daily
versus twice daily regimen. Am J Hypertens 2000;13(2):184-90.
241. Boissel JP, Meillard O, Perrin-Fayolle E, Ducruet T, Alamercery Y, Sassano P, et al.
Comparison between a bid and a tid regimen: improved compliance with no improved
antihypertensive effect. The EOL Research Group. Eur J Clin Pharmacol 1996;50(1-
2):63-7.
242. Baird MG, Bentley-Taylor MM, Carruthers SG, Dawson KG, Laplante LE, Larochelle
P, et al. A study of efficacy, tolerance and compliance of once-daily versus twice-
daily metoprolol (Betaloc) in hypertension. Betaloc Compliance Canadian
Cooperative Study Group. Clin Invest Med 1984;7(2):95-102.
243. Detry JM, Block P, De Backer G, Degaute JP. Patient compliance and therapeutic
coverage: comparison of amlodipine and slow release nifedipine in the treatment of
hypertension. The Belgian Collaborative Study Group. Eur J Clin Pharmacol
1995;47(6):477-81.
244. Mahtani KR, Heneghan CJ, Glasziou PP, Perera R. Reminder packaging for
improving adherence to self-administered long-term medications. Cochrane
Database Syst Rev 2011;9:CD005025.
245. McKenney JM, Munroe WP, Wright JT, Jr. Impact of an electronic medication
compliance aid on long-term blood pressure control. J Clin Pharmacol
1992;32(3):277-83.
246. Skaer TL, Sclar DA, Markowski DJ, Won JK. Effect of value-added utilities on
prescription refill compliance and health care expenditures for hypertension. J Hum
Hypertens 1993;7(5):515-8.
247. Rosen MI, Rigsby MO, Salahi JT, Ryan CE, Cramer JA. Electronic monitoring and
counseling to improve medication adherence. Behav Res Ther 2004;42(4):409-22.
248. van DJ, Krass I, Aslani P. Interventions promoting adherence to cardiovascular
medicines. Int J Clin Pharm 2012;34(2):295-311.
249. Moitra E, Herbert JD, Forman EM. Acceptance-based behavior therapy to promote
HIV medication adherence. AIDS Care 2011;23(12):1660-7.
250. Thom DH, Willard-Grace R, Hessler D, DeVore D, Prado C, Bodenheimer T, et al.
The Impact of Health Coaching on Medication Adherence in Patients With Poorly

180
Controlled Diabetes, Hypertension, and/or Hyperlipidemia: A Randomized Controlled
Trial. J Am Board Fam Med 2015;28(1):38-45.
251. Miller WR, Rollnick S. Motivational interviewing: helping people change. New York:
Guilford Press; 2002.
252. Tay SC. Compliance therapy: an intervention to improve inpatients' attitudes toward
treatment. J Psycholsoc Nurs Ment Health Serv 2007;45(6):29-37.
253. Nieuwkerk PT, Nierman MC, Vissers MN, Locadia M, Greggers-Peusch P, Knape
LP, et al. Intervention to Improve Adherence to Lipid-Lowering Medication and Lipid-
Levels in Patients With an Increased Cardiovascular Risk. Am J Cardiol
2012;110(5):666-72.
254. Kemp R, Kirov G, Everitt B, Hayward P, David A. Randomised controlled trial of
compliance therapy. 18-month follow-up. Br J Psychiatry 1998;172:413-9.
255. Staring AB, Van der Gaag M, Koopmans GT, Selten JP, Van Beveren JM, Hengeveld
MW, et al. Treatment adherence therapy in people with psychotic disorders:
randomised controlled trial. Br J Psychiatry 2010;197(6):448-55.
256. Anderson KH, Ford S, Robson D, Cassis J, Rodrigues C, Gray R. An exploratory,
randomized controlled trial of adherence therapy for people with schizophrenia. Int J
Ment Health Nurs 2010;19(5):340-9.
257. Gray R, Leese M, Bindman J, Becker T, Burti L, David A, et al. Adherence therapy
for people with schizophrenia. European multicentre randomised controlled trial. Br J
Psychiatry 2006;189:508-14.
258. Schulz M, Gray R, Spiekermann A, Abderhalden C, Behrens J, Driessen M.
Adherence therapy following an acute episode of schizophrenia: A multi-centre
randomised controlled trial. Schizophr Res 2013;146(1-3):59-63.
259. Horvath KJ, Oakes JM, Rosser BR, Danilenko G, Vezina H, Amico KR, et al.
Feasibility, acceptability and preliminary efficacy of an online peer-to-peer social
support ART adherence intervention. AIDS Behav 2013;17(6):2031-44.
260. Morisky DE, DeMuth NM, Field-Fass M, Green LW, Levine DM. Evaluation of family
health education to build social support for long-term control of high blood pressure.
Health Educ Q 1985;12(1):35-50.
261. Mayberry LS, Osborn CY. Family support, medication adherence, and glycemic
control among adults with type 2 diabetes. Diabetes Care 2012;35(6):1239-45.
262. Morisky DE, Malotte CK, Ebin V, Davidson P, Cabrera D, Trout PT, et al. Behavioral
interventions for the control of tuberculosis among adolescents. Public Health Rep
2001;116(6):568-74.

181
263. Funck-Brentano I, Dalban C, Veber F, Quartier P, Hefez S, Costagliola D, et al.
Evaluation of a peer support group therapy for HIV-infected adolescents. AIDS
2005;19(14):1501-8.
264. Giordano TP, Rodriguez S, Zhang H, Kallen MA, Jibaja-Weiss M, Buscher AL, et al.
Effect of a clinic-wide social marketing campaign to improve adherence to
antiretroviral therapy for HIV infection. AIDS Behav 2013;17(1):104-12.
265. Thomas PD, Miceli R. Evaluation of the "Know Your Health" program for type 2
diabetes mellitus and hypertension in a large employer group. Am J Manag Care
2006;12:33-9.
266. Saito I, Saruta T. Effect of education through a periodic newsletter on persistence
with antihypertensive therapy. Hypertens Res 2003;26(2):159-62.
267. Powell KM, Edgren B. Failure of educational videotapes to improve medication
compliance in a health maintenance organization. Am J Health Syst Pharm
1995;52(20):2196-9.
268. Stromberg A, Dahlstrom U, Fridlund B. Computer-based education for patients with
chronic heart failure. A randomised, controlled, multicentre trial of the effects on
knowledge, compliance and quality of life. Patient Educ Couns 2006;64(1-3):128-35.
269. Salleras Sanmarti L, Alcaide Megias J, Altet Gomez MN, Canela Soler J, Navas
Alcala E, Sune Puigbo MR, et al. Evaluation of the efficacy of health education on the
compliance with antituberculosis chemoprophylaxis in school children. A randomized
clinical trial. Tuber Lung Dis 1993;74(1):28-31.
270. Park JJ, Kelly P, Carter BL, Burgess PP. Comprehensive pharmaceutical care in the
chain setting. J Am Pharm Assoc 1996;36(7):443-51.
271. Taitel M, Jiang J, Rudkin K, Ewing S, Duncan I. The impact of pharmacist face-to-
face counseling to improve medication adherence among patients initiating statin
therapy. Patient Prefer Adherence 2012;6:323-9.
272. Zullig LL, McCant F, Melnyk SD, Danus S, Bosworth HB. A health literacy pilot
intervention to improve medication adherence using Meducation((R)) technology.
Patient Educ Couns 2014;95(2):288-91.
273. Hughes D. When drugs don't work: economic assessment of enhancing compliance
with interventions supported by electronic monitoring devices. Pharmacoeconomics
2007;25(8):621-35.
274. Schmitz JM, Sayre SL, Stotts AL, Rothfleisch J, Mooney ME. Medication compliance
during a smoking cessation clinical trial: a brief intervention using MEMS feedback. J
Behav Med 2005;28(2):139-47.

182
275. Vrijens B, Belmans A, Matthys K, de Klerk E, Lesaffre E. Effect of intervention through
a pharmaceutical care program on patient adherence with prescribed once-daily
atorvastatin. Pharmacoepidemiol Drug Saf 2006;15(2):115-21.
276. Birtwhistle RV, Godwin MS, Delva MD, Casson RI, Lam M, MacDonald SE, et al.
Randomised equivalence trial comparing three month and six month follow up of
patients with hypertension by family practitioners. BMJ 2004;328(7433):204.
277. Bain-Brickley D, Butler LM, Kennedy GE, Rutherford GW. Interventions to improve
adherence to antiretroviral therapy in children with HIV infection. Cochrane Database
Syst Rev 2011;12:CD009513.
278. Zwikker H, van den Bemt B, van den Ende C, van Lankveld W, Broeder AD, van den
Hoogen F, et al. Development and content of a group-based intervention to improve
medication adherence in non-adherent patients with rheumatoid arthritis. Patient
Educ Couns 2012;89(1):143-51.
279. Al-Jumah KA, Qureshi NA. Impact of pharmacist interventions on patients' adherence
to antidepressants and patient-reported outcomes: a systematic review. Patient
Prefer Adherence 2012;6:87-100.
280. National Health Priority Action Council (NHPAC). National Chronic Disease Strategy.
Canberra: 2006.
281. Wagner GJ, Rabkin JG. Measuring medication adherence: are missed doses
reported more accurately then perfect adherence? AIDS Care 2000;12(4):405-8.
282. Barfod TS, Sorensen HT, Nielsen H, Rodkjaer L, Obel N. 'Simply forgot' is the most
frequently stated reason for missed doses of HAART irrespective of degree of
adherence. HIV Med 2006;7(5):285-90.
283. Chesney MA, Ickovics JR, Chambers DB, Gifford AL, Neidig J, Zwickl B, et al. Self-
reported adherence to antiretroviral medications among participants in HIV clinical
trials: the AACTG adherence instruments. Patient Care Committee & Adherence
Working Group of the Outcomes Committee of the Adult AIDS Clinical Trials Group
(AACTG). AIDS Care 2000;12(3):255-66.
284. Dobbels F, Berben L, De Geest S, Drent G, Lennerling A, Whittaker C, et al. The
psychometric properties and practicability of self-report instruments to identify
medication nonadherence in adult transplant patients: a systematic review.
Transplantation 2010;90(2):205-19.
285. Lapshin O. Assessing medication adherence in clinical practice. Bridg East West
Psychiatry 2006;4:42-5.

183
286. Jonsdottir H, Opjordsmoen S, Birkenaes AB, Engh JA, Ringen PA, Vaskinn A, et al.
Medication adherence in outpatients with severe mental disorders: relation between
self-reports and serum level. J Clin Psychopharmacol 2010;30(2):169-75.
287. de KE, van dHD, Landewe R, van dTH, van dLS. The compliance-questionnaire-
rheumatology compared with electronic medication event monitoring: a validation
study. J Rheumatol 2003;30(11):2469-75.
288. Thompson IR, Bidgood P, Petroczi A, Denholm-Price JC, Fielder MD, EuResist
Network Study G. An alternative methodology for the prediction of adherence to anti
HIV treatment. AIDS Res Ther 2009;6:9.
289. Zeller A, Ramseier E, Teagtmeyer A, Battegay E. Patients' self-reported adherence
to cardiovascular medication using electronic monitors as comparators. Hypertens
Res 2008;31(11):2037-43.
290. Matza LS, Yu-Isenberg KS, Coyne KS, Park J, Wakefield J, Skinner EP, et al. Further
testing of the reliability and validity of the ASK-20 adherence barrier questionnaire in
a medical center outpatient population. Curr Med Res Opin 2008;24(11):3197-206.
291. Erickson SR, Coombs JH, Kirking DM, Azimi AR. Compliance from self-reported
versus pharmacy claims data with metered-dose inhalers. Ann Pharmacother
2001;35(9):997-1003.
292. Wang Y, Kong MC, Ko Y. Psychometric properties of the 8-item Morisky Medication
Adherence Scale in patients taking warfarin. Thromb Haemost 2012;108(4):1-7.
293. Shalansky SJ, Levy AR, Ignaszewski AP. Self-reported Morisky score for identifying
nonadherence with cardiovascular medications. Ann Pharmacother
2004;38(9):1363-8.
294. Toll BA, McKee SA, Martin DJ, Jatlow P, O'Malley SS. Factor structure and validity
of the Medication Adherence Questionnaire (MAQ) with cigarette smokers trying to
quit. Nicotine Tob Res 2007;9(5):597-605.
295. Vik SA, Maxwell CJ, Hogan DB, Patten SB, Johnson JA, Romonko-Slack L.
Assessing medication adherence among older persons in community settings. Can J
Clin Pharmacol 2005;12(1):152-64.
296. Wang Y, Lee J, Tang WE, Toh MP, Ko Y. Validity and reliability of a self-reported
measure of medication adherence in patients with Type 2 diabetes mellitus in
Singapore. Diabet Med 2012;29(9):338-44.
297. Fialko L, Garety PA, Kuipers E, Dunn G, Bebbington PE, Fowler D, et al. A large-
scale validation study of the Medication Adherence Rating Scale (MARS). Schizophr
Res 2008;100(1-3):53-9.

184
298. Lehane E, McCarthy G, Collender V, Deasy A, O'Sullivan K. The Reasoning and
Regulating Medication Adherence Instrument for patients with coronary artery
disease: development and psychometric evaluation. J Nurs Meas 2013;21(1):64-79.
299. Krousel-Wood M, Joyce C, Holt EW, Levitan EB, Dornelles A, Webber LS, et al.
Development and evaluation of a self-report tool to predict low pharmacy refill
adherence in elderly patients with uncontrolled hypertension. Pharmacotherapy
2013;33(8):798-811.
300. Coetzee B, Kagee A. The development of an inventory to assess the structural
barriers to clinic attendance and pill-taking amongst users of antiretroviral therapy.
AIDS Behav 2013;17(1):319-28.
301. Muller S, Kohlmann T, Wilke T. Validation of the Adherence Barriers Questionnaire -
an instrument for identifying potential risk factors associated with medication-related
non-adherence. BMC Health Serv Res 2015;15(1):1-25.
302. Kleppe M, Lacroix J, Ham J, Midden C. The development of the ProMAS: a
Probabilistic Medication Adherence Scale. Patient Prefer Adherence 2015;9:355-67.
303. Gonzalez JS, Schneider HE, Wexler DJ, Psaros C, Delahanty LM, Cagliero E, et al.
Validity of medication adherence self-reports in adults with type 2 diabetes. Diabetes
Care 2013;36(4):831-7.
304. Reynolds K, Viswanathan HN, Muntner P, Harrison TN, Cheetham TC, Hsu JW, et
al. Validation of the Osteoporosis-Specific Morisky Medication Adherence Scale in
long-term users of bisphosphonates. Qual Life Res 2014;23(7):2109-20.
305. Matthes J, Albus C. Improving adherence with medication: a selective literature
review based on the example of hypertension treatment. Dtsch Arztebl Int
2014;111(4):41-7.
306. Haynes RB, Ackloo E, Sahota N, McDonald HP, Yao X. Interventions for enhancing
medication adherence. Cochrane Database Syst Rev 2008;2:CD000011.
307. Nelson MR, Reid CM, Ryan P, Willson K, Yelland L. Self-reported adherence with
medication and cardiovascular disease outcomes in the Second Australian National
Blood Pressure Study (ANBP2). Med J Aust 2006;185(9):487-9.
308. Magadza C, Radloff SE, Srinivas SC. The effect of an educational intervention on
patients' knowledge about hypertension, beliefs about medicines, and adherence.
Res Social Adm Pharm 2009;5(4):363-75.
309. Advancing the responsible use of medicines: applying levers for change. New Jersey:
2012.
185
310. Haynes RB, Sackett DL, Gibson ES, Taylor DW, Hackett BC, Roberts RS, et al.
Improvement of medication compliance in uncontrolled hypertension. Lancet
1976;1(7972):1265-8.
311. Bramley TJ, Gerbino PP, Nightengale BS, Frech-Tamas F. Relationship of blood
pressure control to adherence with antihypertensive monotherapy in 13 managed
care organizations. J Manag Care Pharm 2006;12(3):239-45.
312. Ho PM, Rumsfeld JS, Masoudi FA, McClure DL, Plomondon ME, Steiner JF, et al.
Effect of medication nonadherence on hospitalization and mortality among patients
with diabetes mellitus. Arch Intern Med 2006;166(17):1836-41.
313. Brogaard HV, Kohn MG, Berget OS, Hansen HS, Gerke O, Mickley H, et al.
Significant improvement in statin adherence and cholesterol levels after acute
myocardial infarction. Dan Med J 2012;59(9):1-5.
314. ABS. Socio-Economic Indexes for Areas (SEIFA), Data Cube Only. Australia:
Australian Bureau of Statistics, 2013.
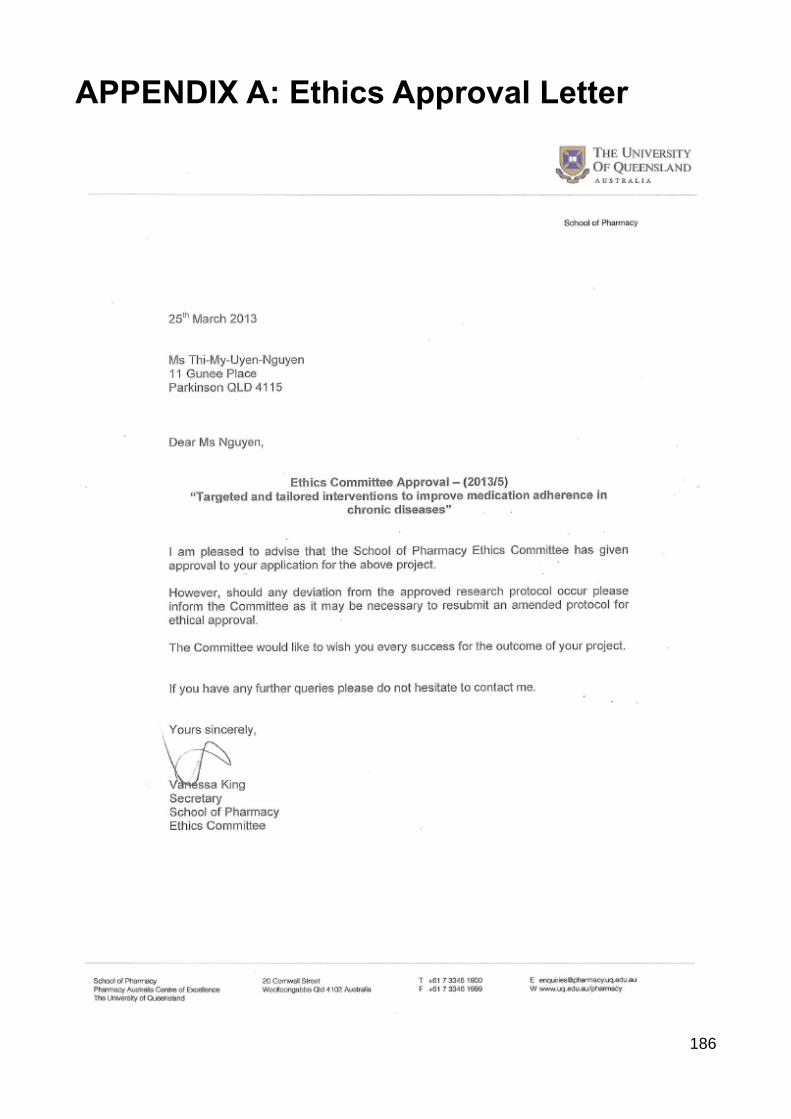
186
APPENDIX A: Ethics Approval Letter

187
APPENDIX B: Participant Information Sheet
Full Project Title Targeted and tailored interventions to improve medication adherence in chronic diseases
Principal investigator: Ms Uyen Nguyen, BPharm (Hons), PhD Candidate
Associate investigators: Dr Neil Cottrell, BSc (Hons) MSc PhD, Senior Lecturer Dr Adam La Caze, BPharm (Hons) BA (Hons) PhD, Lecturer
All investigators are affiliated with the School of Pharmacy, The University of Queensland.
Your Consent
You are invited to participate in this research project because you are presenting a medication started in the last 4 to 12 weeks for one of the following medical conditions: high blood pressure, diabetes, high cholesterol or other heart conditions. This Participant Information contains detailed information about the research project. Its purpose is to explain to you as openly and clearly as possible all the procedures involved in this project before you decide whether or not to take part in it. Please read this Participant Information carefully. Feel free to ask questions about any information in the document. If you wish, feel free to discuss the project with a relative or friend or your local health worker. Once you understand what the project is about and if you agree to take part in it, you will be asked to sign the Consent Form. By signing the Consent Form, you indicate that you understand the information and that you give your consent to participate in the research project. This information and consent form is 3 pages long and you will be given a copy to keep as a record.
Purpose and Background
The purpose of this project is to assess whether people who forget or choose not to take their medicines benefit from personalised support. A total of approximately 200 people will participate in this project.
People with chronic medical conditions often have to take a number of medicines for a long period of time. People in this situation often do not take their medicines as agreed due to many different reasons. Identifying why this occurs and how best to support people in their medication taking may help manage their medical conditions.
Procedures
Participation in this project will involve completing a questionnaire in an interview on three occasions. The first interview will be today and the two other interviews will take place over the telephone at 3 months and 6 months after today. The questionnaire will take about ten minutes to complete. The first section consists of 4 Yes or No questions on the way you take your medicines. The next section will consist of 10 statements about your view and opinion of your medicines. In this section you will be asked to state your level of agreement or disagreement with each statement. The last section will consist of 8 questions on your view of illness. You will be asked to rate your answers on a scale of 0 to 10. You will be also asked to provide some information about yourself, such as your age and marital status. About a third of the participants in this study will have a longer interview with the researcher to discuss ways to help support the participants taking their medicines.

188
You will be contacted by telephone 3 months after the interview and then again at 6 months after this interview. The telephone calls will last for about 10 minutes. These telephone calls will involve the same questionnaire that you answered at the interview. There are no right or wrong answers to any of the questions in the interview; it is your view and opinion that is important.
Possible Benefits
Possible benefits include better understanding of medication and ways that may help you to improve medication-taking behaviour.
Possible Risks
This study involves completing a questionnaire through one interview and two telephone calls. There is no foreseeable added risk to you above the risks of everyday living.
Privacy, Confidentiality and Disclosure of Information
In all reports from this research, information will be provided in such a way that you cannot be identified. The results will be such that the individual issue could not be linked to that participant. The information collected will be stored in a locked filing cabinet in a locked office, with access only to the three researchers stated above. The information will be stored for a period of 5 years and then destroyed. Results of the Project You may request the study results when it is completed by providing an address that the report can be sent to or at a later date by contacting Uyen Nguyen (contact details below).
Participation is Voluntary
Participation in any research project is voluntary. If you do not wish to take part, you are not obliged to. If you decide to take part and later change your mind, you are free to withdraw from the project at any stage. Your decision whether to take part or not to take part, or to take part and then withdraw, will not affect your routine treatment or your relationship with the pharmacy staff. Before you make your decision, a member of the research team will be available to answer any questions you have about the research project. Sign the Consent Form only after you have had a chance to ask your questions and have received satisfactory answers. If you decide to withdraw from this project, please notify a member of the research team before you withdraw.
Reimbursements
No payment will be provided for participation in this study. If you have any queries or any problems concerning this project, please contact Uyen Nguyen: phone 07 3346 1996 or email [email protected].
This study has been cleared by one of the human ethics committees of the University of Queensland in accordance with the National Health and Medical Research Council's guidelines. You are of course, free to discuss your participation in this study with project staff (contactable on 3346 1996 or email [email protected]). If you would like to speak to an officer of the University not involved in the study, you may contact the Ethics Officer on 3365 3924.

189
APPENDIX C: Participant Consent Form
Full Project Title
Targeted and tailored interventions to improve medication adherence in chronic diseases
Principal investigator: Ms Uyen Nguyen, BPharm (Hons), PhD Candidate Associate investigators: Dr Neil Cottrell, BSc (Hons) MSc PhD, Senior Lecturer Dr Adam La Caze, BPharm (Hons) BA (Hons) PhD, Lecturer
All investigators are affiliated with the School of Pharmacy, The University of Queensland.
I acknowledge that:
(a) my participation is voluntary and that I am free to withdraw from the project at any time without explanation;
(b) I will be given a copy of the participant information sheet to which this consent form relates to and the consent form to keep;
(c) this project is for the purpose of research and not for profit;
(d) any identifiable information about me which is gathered in the course of and as the result of my participating in this project will be (i) collected and retained for the purpose of this project and (ii) accessed and analysed by the researcher(s) for the purpose of conducting this project;
(e) my anonymity is preserved and I will not be identified in publications or otherwise without my express written consent.
(f) I may not directly benefit from participation in this project.
By signing this document I agree to participate in this project.
Full Name of Participant (printed):………………….……………….…………………………….……….…………………….
Signature of Participant: ……………………………………….………..…. Date: ……………/……………/………………
Full Name of Witness to Signature of Participant (printed):…………………………………………………….…....
Signature of Witness: ……………………………………...…….………..…. Date: ……………/……………/……………..
Full Name of Researcher (printed): ………………………………………………………………………………………………
Signature of Researcher: …………………………………………………….. Date: …………../…………../………………

190
APPENDIX D: Participant Survey
Below are questions about how you take your recently prescribed medicine. There
are no right or wrong answers. Please answer YES or NO.
Item Question YES NO
1 Do you ever forget to take your medicine? 1 0
2 Are you careless at times about taking your medicine? 1 0
3 When you feel better, do you sometimes stop taking your
medicine?
1 0
4 Sometimes, if you feel worse when you take the medicine,
do you stop taking it?
1 0
Below are statements other people have made about their medicines. We are
interested in your personal views. There are no right or wrong answers. Please
indicate the extent to which you agree or disagree with them.
Item Statement Strongly
Agree
Agree Uncertain Disagree Strongly
Disagree
1 My health at present,
depends on my medicines
5 4 3 2 1
2 Having to take medicines
worries me
5 4 3 2 1
3 My life would be impossible
without my medicines
5 4 3 2 1
4 Without my medicines I
would be very ill
5 4 3 2 1
5 I sometimes worry about
long-term effects of my
medicines
5 4 3 2 1
6 My medicines are a mystery
to me
5 4 3 2 1
7 My health in the future will
depend on my medicines
5 4 3 2 1
8 My medicines disrupt my life
5 4 3 2 1
9 I sometimes worry about
becoming too dependent on
my medicines
5 4 3 2 1
10 My medicines protect me
from becoming worse
5 4 3 2 1

191
These questions are about your views on your illness. For the following questions, please circle the number that best corresponds to your views: How much does your illness affect your life?
0 1 2 3 4 5 6 7 8 9 10
no affect severely affects
at all my life
How long do you think your illness will continue?
0 1 2 3 4 5 6 7 8 9 10
a very forever
short time
How much control do you feel you have over your illness?
0 1 2 3 4 5 6 7 8 9 10
absolutely extreme amount
no control of control
How much do you think your treatment can help your illness?
0 1 2 3 4 5 6 7 8 9 10
not extremely
at all helpful
How much do you experience symptoms from your illness?
0 1 2 3 4 5 6 7 8 9 10
no symptoms many severe
at all symptoms
How concerned are you about your illness?
0 1 2 3 4 5 6 7 8 9 10
not at all extremely
concerned concerned
How well do you feel you understand your illness?
0 1 2 3 4 5 6 7 8 9 10
don’t understand understand
at all very clearly
How much does your illness affect you emotionally? (e.g. does it make you angry, scared,
upset or depressed?
0 1 2 3 4 5 6 7 8 9 10
no at all extremely
affected emotionally affected emotionally
Please list in rank-order the three most important factors that you believe caused your
illness. The most important causes for me:
1. _____________________ 2. _____________________ 3. __ ________________

192
Below are questions about your background. Please tick one box for each question.
1. Gender: Male Female
2. Age: ______________________
3. Highest Education Level:
Primary Secondary Tertiary
4. Employment Status
Employed Unemployed Retired
From the list below please select the number closest to YOUR FAMILY’s annual income (before tax).
≤ $30 000 $51 000 to $70 000 $91 000 to $110 000 $131 000 - $150 000
$31 000 to $50 000 $71 000 to $90 000 $111 000 to $130 000 Over $150 000
5. Marital Status (select the one that best describes you)
Married Divorced Widowed Single
6. Number of Medications Currently Taken _____________
7. Number of Vitamin/Herbal/Mineral supplements taken (if applicable)_______________
8. Medical Conditions: select all that apply to you from the following list
High blood pressure Asthma Diabetes Heart failure
High cholesterol levels Depression Osteoarthritis Stroke
Other(s) __________________________________________________________________
Thank you for your time

193
APPENDIX E: Mean MAQ Scores Over Time
Mean MAQ scores at baseline, 3 months and 6 months (Adherent Group)
Time p-value
Baseline 3 months 6 months 0 to 3
months
0 to 6
months
3 to 6
months
Mean MAQ
Score ± sd
0.00 0.22 ± 0.49 0.03 ± 0.18 <0.05* 0.3251 0.0564
Mean MAQ scores at baseline, 3 months and 6 months (Intervention Group)
Time p-value
Baseline 3 months 6 months 0 to 3
months
0 to 6
months
3 to 6
months
Mean MAQ
Score ± sd
1.58 ± 0.79 0.42 ± 0.59 0.48 ± 0.68 <0.05* <0.05* 0.4543
Mean MAQ scores at baseline, 3 months and 6 months (Control Group)
Time p-value
Baseline 3 months 6 months 0 to 3
months
0 to 6
months
3 to 6
months
Mean MAQ
Score ± sd
1.60 ± 0.67 1.58 ± 0.65 1.48 ± 0.83 0.7987 0.1961 0.2034

194
APPENDIX F: Mean BMQ-S Necessity and Concerns Scores Over Time
Mean BMQ-S Necessity and Concerns scores at baseline, 3 months and 6 months (Adherent Group)
Mean BMQ-S Scores
± sd
Time p-value
Baseline 3 months 6 months 0 to 3 months
0 to 6 months
3 to 6 months
Mean Necessity Score
20.25 ± 4.84 20.28 ± 4.17 20.22 ± 3.89 0.9545 0.9608 0.8523
Mean Concerns Score
11.75 ± 3.13 11.41 ± 2.89 10.78 ± 2.81 0.4855 0.0594 <0.05*
Mean BMQ-S Necessity and Concerns scores at baseline, 3 months and 6 months (Intervention Group)
Mean BMQ-S Scores
± sd
Time p-value
Baseline 3 months 6 months 0 to 3 months
0 to 6 months
3 to 6 months
Mean Necessity Score
19.60 ± 3.18 19.80 ± 2.94 20.25 ± 3.17 0.5160 0.0963 0.1475
Mean Concerns Score
13.48 ± 3.50 13.00 ± 3.43 12.32 ± 3.75 0.1837 <0.05* 0.0511
Mean BMQ-S Necessity and Concerns scores at baseline, 3 months and 6 months (Control Group)
Mean BMQ-S Scores
± sd
Time p-value
Baseline 3 months 6 months 0 to 3 months
0 to 6 months
3 to 6 months
Mean Necessity Score
18.48 ± 3.63 18.53 ± 3.71 17.95 ± 3.20 0.8699 0.1854 0.0874
Mean Concerns Score
12.63 ± 4.20 13.05 ± 3.75 12.92 ± 3.38 0.1456 0.4558 0.6663

195
APPENDIX G: Illness Perceptions Over Time
Mean BIPQ scores at baseline, 3 months and 6 months (Adherent Group)
Mean BIPQ Scores
± sd
Time p-value
Baseline 3 months 6 months 0 to 3
months
0 to 6
months
3 to 6
months
Consequences How much does your
illness affect your life? (0 = no affect at all – 10 =
severely affects my life)
5.13 ± 2.87
5.03 ± 3.17
4.06 ± 2.94 0.7932 <0.05* <0.05*
Timeline How long do you think
your illness will
continue? (0 = very short time – 10 =
forever)
8.72 ± 2.64
8.94 ± 2.35
9.09 ± 2.16 0.4148 0.1359 0.3776
Personal Control How much control do
you feel you have over
your illness? (0 = absolutely no control – 10
= extreme amount of control)
6.53 ± 2.73
7.22 ± 1.91
7.47 ± 1.90 0.1367 <0.05* 0.2833
Treatment Control How much do you think
your treatment can help
your illness? (0 = not at all – 10 = extremely
helpful)
9.00 ± 1.44
9.28 ± 1.39
9.16 ± 1.42 0.1525 0.4926 0.5014
Identity How much do you
experience symptoms
from your illness? (0 = no symptoms at all – 10 =
many severe symptoms)
3.63 ± 3.12 4.16 ± 3.05
3.56 ± 2.71 0.1142 0.8523 0.1054
Concern How concerned are you
about your illness? (0 = not at all concerned – 10 =
extremely concerned)
5.53 ± 3.16
5.34 ± 3.57
4.47 ± 3.32 0.7251 <0.05* <0.05*
Coherence How well do you feel you
understand your illness? (0 = don’t understand at all –
10 = understand very clearly)
8.53 ± 1.92
8.66 ± 1.82
8.84 ± 1.74 0.6767 0.2991 0.1606
Emotional
Response How much does your
illness affect you
emotionally? (0 = not at all affected
emotionally – 10 = extremely
affected emotionally)
3.56 ± 3.22
4.16 ± 3.07
3.38 ± 2.70 0.2082 0.6720 <0.05*

196
Mean BIPQ scores at baseline, 3 months and 6 months (Intervention Group)
Mean BIPQ
Scores
± sd
Time p-value
Baseline 3 months 6 months 0 to 3 months
0 to 6 months
3 to 6 months
Consequences How much does your illness affect your life? (0 = no affect at all – 10 = severely affects my life)
5.10 ± 3.02
4.98 ± 3.07
4.90 ± 2.86 0.7188 0.5654 0.7744
Timeline How long do you think your illness will continue? (0 = very short time – 10 = forever)
9.57 ± 1.14
9.90 ± 0.66
9.83 ± 0.62 <0.05* 0.0808 0.2086
Personal Control How much control do you feel you have over your illness? (0 = absolutely no control – 10 = extreme amount of control)
5.70 ± 2.82
6.50 ± 2.57
5.90 ± 2.93 <0.05* 0.5578 0.0832
Treatment Control How much do you think your treatment can help your illness? (0 = not at all – 10 = extremely helpful)
8.20 ± 1.94
8.55 ± 1.79
8.58 ± 1.70 0.0961 0.1210 0.8836
Identity How much do you experience symptoms from your illness? (0 = no symptoms at all – 10 = many severe symptoms)
4.32 ± 2.83
4.52 ± 3.06 4.18 ± 2.78 0.5912 0.7171 0.3140
Concern How concerned are you about your illness? (0 = not at all concerned – 10 = extremely concerned)
5.97 ± 3.46
5.65 ± 3.21
5.53 ± 3.32 0.2739 0.2604 0.6598
Coherence How well do you feel you understand your illness? (0 = don’t understand at all – 10 = understand very clearly)
7.28 ± 2.64
8.37 ± 2.09
8.37 ± 2.11 <0.05* <0.05* 1.0000
Emotional Response How much does your illness affect you emotionally? (0 = not at all affected emotionally – 10 = extremely affected emotionally)
4.18 ± 3.41
4.27 ± 3.15
3.92 ± 3.02 0.8211 0.5745 0.2740
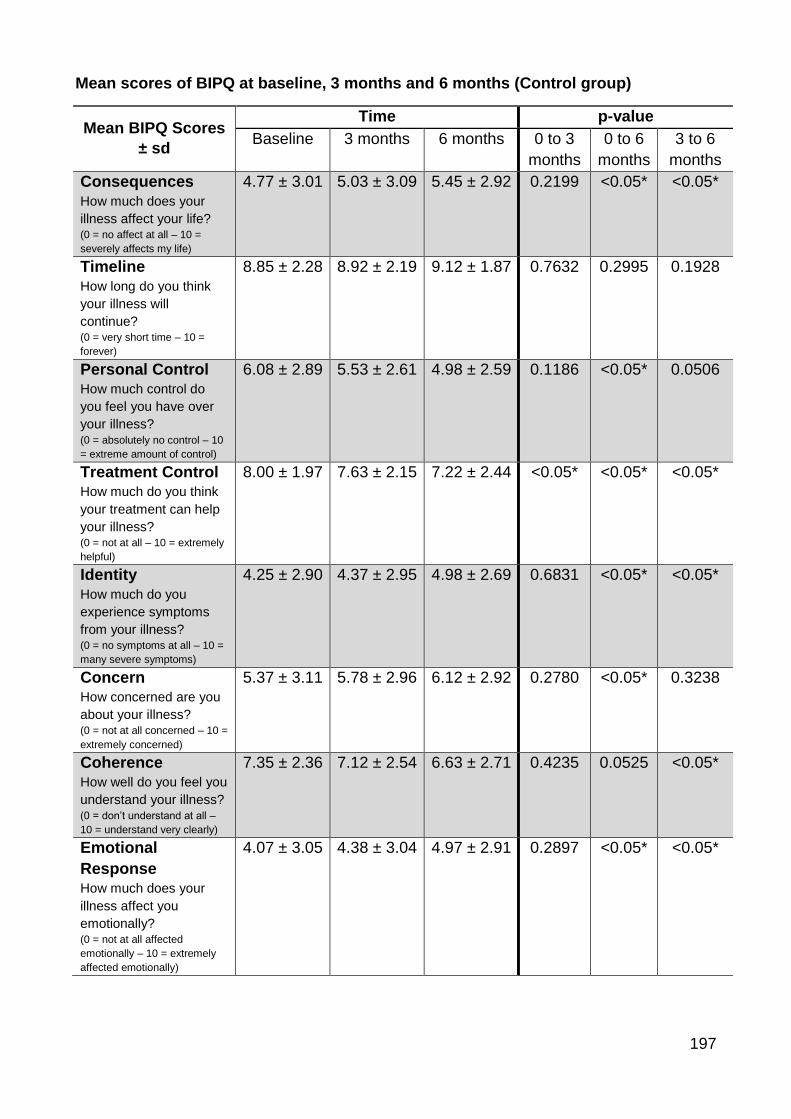
197
Mean scores of BIPQ at baseline, 3 months and 6 months (Control group)
Mean BIPQ Scores
± sd
Time p-value
Baseline 3 months 6 months 0 to 3
months
0 to 6
months
3 to 6
months
Consequences
How much does your
illness affect your life? (0 = no affect at all – 10 =
severely affects my life)
4.77 ± 3.01
5.03 ± 3.09
5.45 ± 2.92 0.2199 <0.05* <0.05*
Timeline
How long do you think
your illness will
continue? (0 = very short time – 10 =
forever)
8.85 ± 2.28
8.92 ± 2.19
9.12 ± 1.87 0.7632 0.2995 0.1928
Personal Control How much control do
you feel you have over
your illness? (0 = absolutely no control – 10
= extreme amount of control)
6.08 ± 2.89
5.53 ± 2.61
4.98 ± 2.59 0.1186 <0.05* 0.0506
Treatment Control How much do you think
your treatment can help
your illness? (0 = not at all – 10 = extremely
helpful)
8.00 ± 1.97
7.63 ± 2.15
7.22 ± 2.44 <0.05* <0.05* <0.05*
Identity
How much do you
experience symptoms
from your illness? (0 = no symptoms at all – 10 =
many severe symptoms)
4.25 ± 2.90
4.37 ± 2.95
4.98 ± 2.69 0.6831 <0.05* <0.05*
Concern How concerned are you
about your illness? (0 = not at all concerned – 10 =
extremely concerned)
5.37 ± 3.11
5.78 ± 2.96
6.12 ± 2.92 0.2780 <0.05* 0.3238
Coherence How well do you feel you
understand your illness? (0 = don’t understand at all –
10 = understand very clearly)
7.35 ± 2.36
7.12 ± 2.54
6.63 ± 2.71 0.4235 0.0525 <0.05*
Emotional
Response How much does your
illness affect you
emotionally? (0 = not at all affected
emotionally – 10 = extremely
affected emotionally)
4.07 ± 3.05
4.38 ± 3.04
4.97 ± 2.91 0.2897 <0.05* <0.05*
Related Documents